Lafayette, VA Map & Demographics
Lafayette Map
Lafayette Overview
$18,204
PER CAPITA INCOME
$31,250
AVG FAMILY INCOME
$32,412
AVG HOUSEHOLD INCOME
0.37
INEQUALITY / GINI INDEX
582
TOTAL POPULATION
338
MALE POPULATION
244
FEMALE POPULATION
138.52
MALES / 100 FEMALES
72.19
FEMALES / 100 MALES
42.8
MEDIAN AGE
2.7
AVG FAMILY SIZE
2.3
AVG HOUSEHOLD SIZE
300
LABOR FORCE [ PEOPLE ]
57.6%
PERCENT IN LABOR FORCE
61.1%
UNEMPLOYMENT RATE
Lafayette Area Codes
Income in Lafayette
Income Overview in Lafayette
Per Capita Income in Lafayette is $18,204, while median incomes of families and households are $31,250 and $32,412 respectively.
| Characteristic | Number | Measure |
| Per Capita Income | 582 | $18,204 |
| Median Family Income | 159 | $31,250 |
| Mean Family Income | 159 | $38,089 |
| Median Household Income | 249 | $32,412 |
| Mean Household Income | 249 | $36,890 |
| Income Deficit | 159 | $0 |
| Wage / Income Gap (%) | 582 | 0.00% |
| Wage / Income Gap ($) | 582 | 100.00¢ per $1 |
| Gini / Inequality Index | 582 | 0.37 |
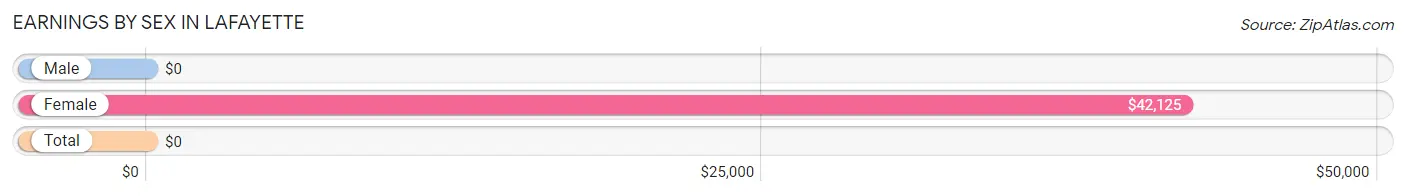
Earnings by Sex in Lafayette
| Sex | Number | Average Earnings |
| Male | 212 (82.5%) | $0 |
| Female | 45 (17.5%) | $42,125 |
| Total | 257 (100.0%) | $0 |
Earnings by Sex by Income Bracket in Lafayette
The most common earnings brackets in Lafayette are $10,000 to $12,499 for men (136 | 64.1%) and $40,000 to $44,999 for women (31 | 68.9%).
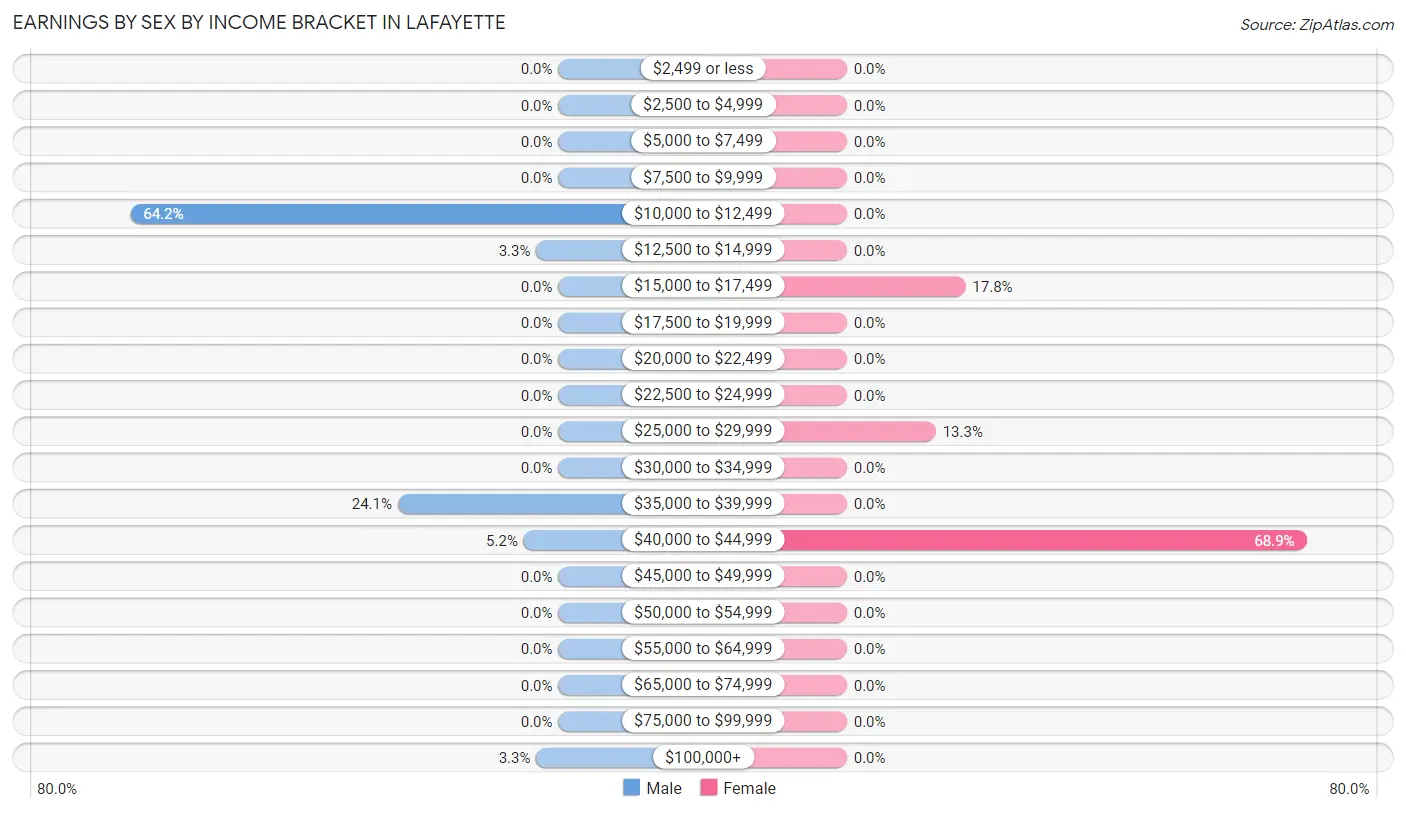
| Income | Male | Female |
| $2,499 or less | 0 (0.0%) | 0 (0.0%) |
| $2,500 to $4,999 | 0 (0.0%) | 0 (0.0%) |
| $5,000 to $7,499 | 0 (0.0%) | 0 (0.0%) |
| $7,500 to $9,999 | 0 (0.0%) | 0 (0.0%) |
| $10,000 to $12,499 | 136 (64.1%) | 0 (0.0%) |
| $12,500 to $14,999 | 7 (3.3%) | 0 (0.0%) |
| $15,000 to $17,499 | 0 (0.0%) | 8 (17.8%) |
| $17,500 to $19,999 | 0 (0.0%) | 0 (0.0%) |
| $20,000 to $22,499 | 0 (0.0%) | 0 (0.0%) |
| $22,500 to $24,999 | 0 (0.0%) | 0 (0.0%) |
| $25,000 to $29,999 | 0 (0.0%) | 6 (13.3%) |
| $30,000 to $34,999 | 0 (0.0%) | 0 (0.0%) |
| $35,000 to $39,999 | 51 (24.1%) | 0 (0.0%) |
| $40,000 to $44,999 | 11 (5.2%) | 31 (68.9%) |
| $45,000 to $49,999 | 0 (0.0%) | 0 (0.0%) |
| $50,000 to $54,999 | 0 (0.0%) | 0 (0.0%) |
| $55,000 to $64,999 | 0 (0.0%) | 0 (0.0%) |
| $65,000 to $74,999 | 0 (0.0%) | 0 (0.0%) |
| $75,000 to $99,999 | 0 (0.0%) | 0 (0.0%) |
| $100,000+ | 7 (3.3%) | 0 (0.0%) |
| Total | 212 (100.0%) | 45 (100.0%) |
Earnings by Sex by Educational Attainment in Lafayette
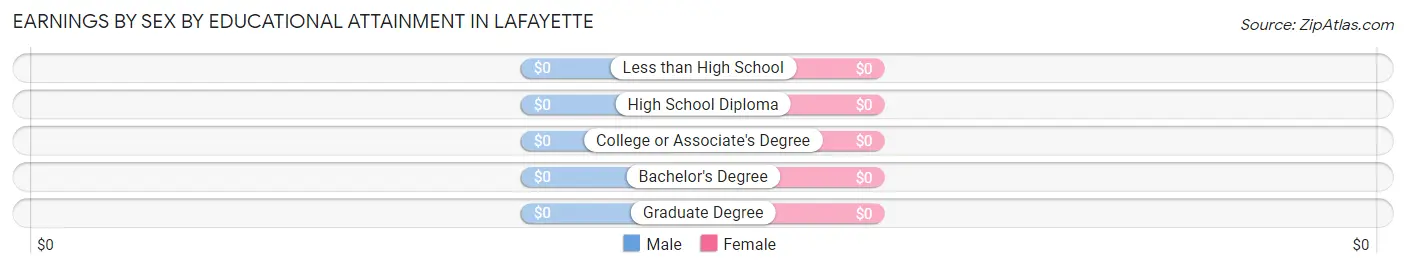
| Educational Attainment | Male Income | Female Income |
| Less than High School | - | - |
| High School Diploma | - | - |
| College or Associate's Degree | - | - |
| Bachelor's Degree | - | - |
| Graduate Degree | - | - |
| Total | $39,191 | $0 |
Family Income in Lafayette
Family Income Brackets in Lafayette
According to the Lafayette family income data, there are 84 families falling into the $25,000 to $34,999 income range, which is the most common income bracket and makes up 52.8% of all families.
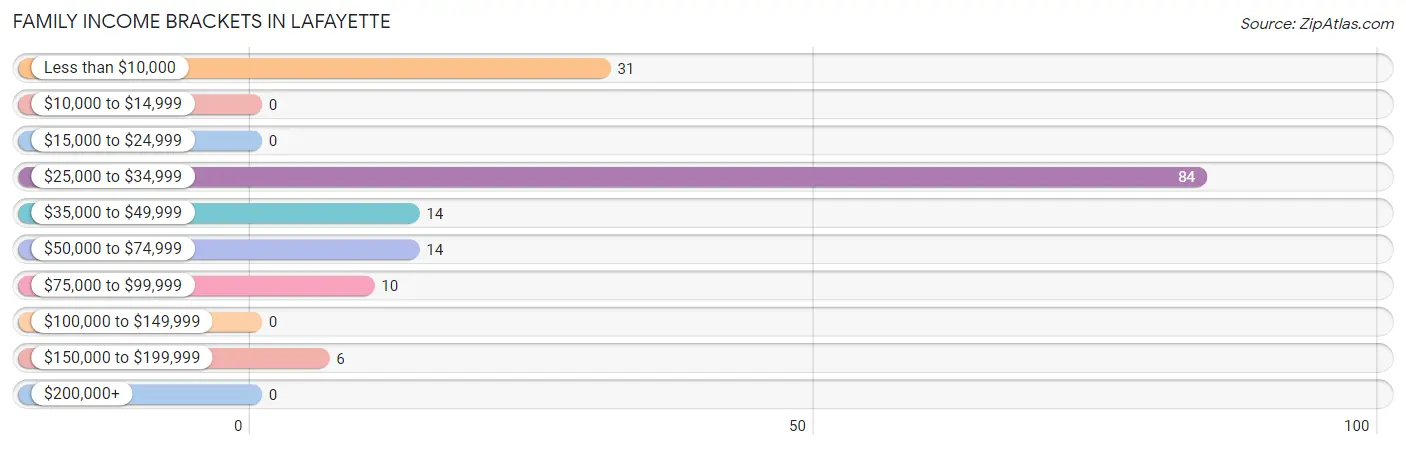
| Income Bracket | # Families | % Families |
| Less than $10,000 | 31 | 19.5% |
| $10,000 to $14,999 | 0 | 0.0% |
| $15,000 to $24,999 | 0 | 0.0% |
| $25,000 to $34,999 | 84 | 52.8% |
| $35,000 to $49,999 | 14 | 8.8% |
| $50,000 to $74,999 | 14 | 8.8% |
| $75,000 to $99,999 | 10 | 6.3% |
| $100,000 to $149,999 | 0 | 0.0% |
| $150,000 to $199,999 | 6 | 3.8% |
| $200,000+ | 0 | 0.0% |
Family Income by Famaliy Size in Lafayette
2-person families (122 | 76.7%) account for the highest median family income in Lafayette with $31,690 per family, while 2-person families (122 | 76.7%) have the highest median income of $15,845 per family member.
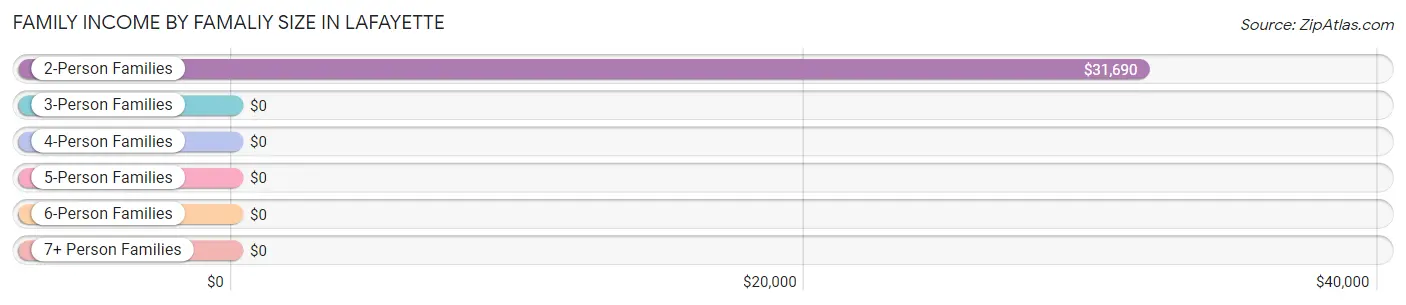
| Income Bracket | # Families | Median Income |
| 2-Person Families | 122 (76.7%) | $31,690 |
| 3-Person Families | 37 (23.3%) | $0 |
| 4-Person Families | 0 (0.0%) | $0 |
| 5-Person Families | 0 (0.0%) | $0 |
| 6-Person Families | 0 (0.0%) | $0 |
| 7+ Person Families | 0 (0.0%) | $0 |
| Total | 159 (100.0%) | $31,250 |
Family Income by Number of Earners in Lafayette
| Number of Earners | # Families | Median Income |
| No Earners | 72 (45.3%) | $0 |
| 1 Earner | 71 (44.7%) | $0 |
| 2 Earners | 10 (6.3%) | $0 |
| 3+ Earners | 6 (3.8%) | $0 |
| Total | 159 (100.0%) | $31,250 |
Household Income in Lafayette
Household Income Brackets in Lafayette
With 92 households falling in the category, the $35,000 to $49,999 income range is the most frequent in Lafayette, accounting for 36.9% of all households.
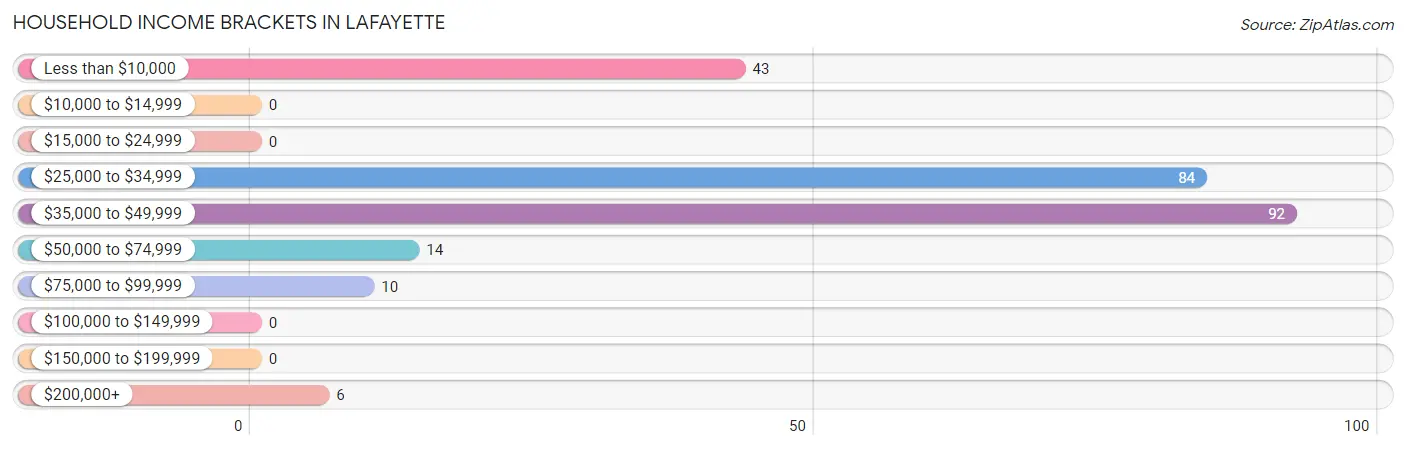
| Income Bracket | # Households | % Households |
| Less than $10,000 | 43 | 17.3% |
| $10,000 to $14,999 | 0 | 0.0% |
| $15,000 to $24,999 | 0 | 0.0% |
| $25,000 to $34,999 | 84 | 33.7% |
| $35,000 to $49,999 | 92 | 36.9% |
| $50,000 to $74,999 | 14 | 5.6% |
| $75,000 to $99,999 | 10 | 4.0% |
| $100,000 to $149,999 | 0 | 0.0% |
| $150,000 to $199,999 | 0 | 0.0% |
| $200,000+ | 6 | 2.4% |
Household Income by Householder Age in Lafayette
The median household income in Lafayette is $32,412, with the highest median household income of $31,408 found in the 65+ years age bracket for the primary householder. A total of 106 households (42.6%) fall into this category. Meanwhile, the 15 to 24 years age bracket for the primary householder has the lowest median household income of $0, with 21 households (8.4%) in this group.
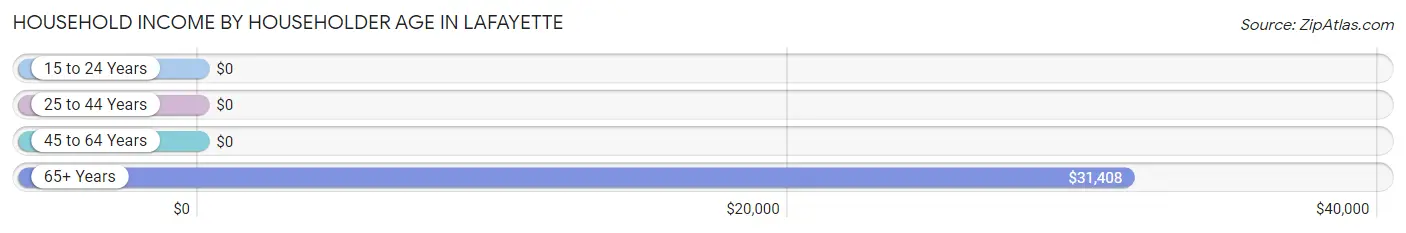
| Income Bracket | # Households | Median Income |
| 15 to 24 Years | 21 (8.4%) | $0 |
| 25 to 44 Years | 31 (12.4%) | $0 |
| 45 to 64 Years | 91 (36.5%) | $0 |
| 65+ Years | 106 (42.6%) | $31,408 |
| Total | 249 (100.0%) | $32,412 |
Poverty in Lafayette
Income Below Poverty by Sex and Age in Lafayette
With 29.0% poverty level for males and 25.0% for females among the residents of Lafayette, 6 to 11 year old males and under 5 year old females are the most vulnerable to poverty, with 31 males (100.0%) and 30 females (100.0%) in their respective age groups living below the poverty level.
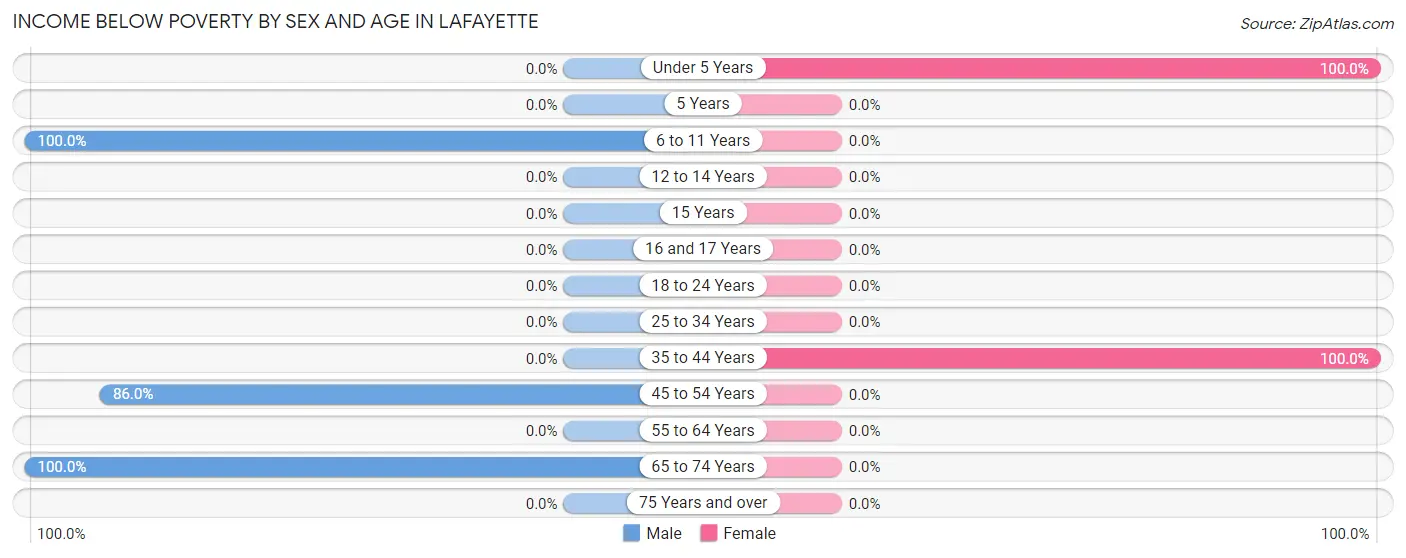
| Age Bracket | Male | Female |
| Under 5 Years | 0 (0.0%) | 30 (100.0%) |
| 5 Years | 0 (0.0%) | 0 (0.0%) |
| 6 to 11 Years | 31 (100.0%) | 0 (0.0%) |
| 12 to 14 Years | 0 (0.0%) | 0 (0.0%) |
| 15 Years | 0 (0.0%) | 0 (0.0%) |
| 16 and 17 Years | 0 (0.0%) | 0 (0.0%) |
| 18 to 24 Years | 0 (0.0%) | 0 (0.0%) |
| 25 to 34 Years | 0 (0.0%) | 0 (0.0%) |
| 35 to 44 Years | 0 (0.0%) | 31 (100.0%) |
| 45 to 54 Years | 43 (86.0%) | 0 (0.0%) |
| 55 to 64 Years | 0 (0.0%) | 0 (0.0%) |
| 65 to 74 Years | 24 (100.0%) | 0 (0.0%) |
| 75 Years and over | 0 (0.0%) | 0 (0.0%) |
| Total | 98 (29.0%) | 61 (25.0%) |
Income Above Poverty by Sex and Age in Lafayette
According to the poverty statistics in Lafayette, males aged 18 to 24 years and females aged 18 to 24 years are the age groups that are most secure financially, with 100.0% of males and 100.0% of females in these age groups living above the poverty line.
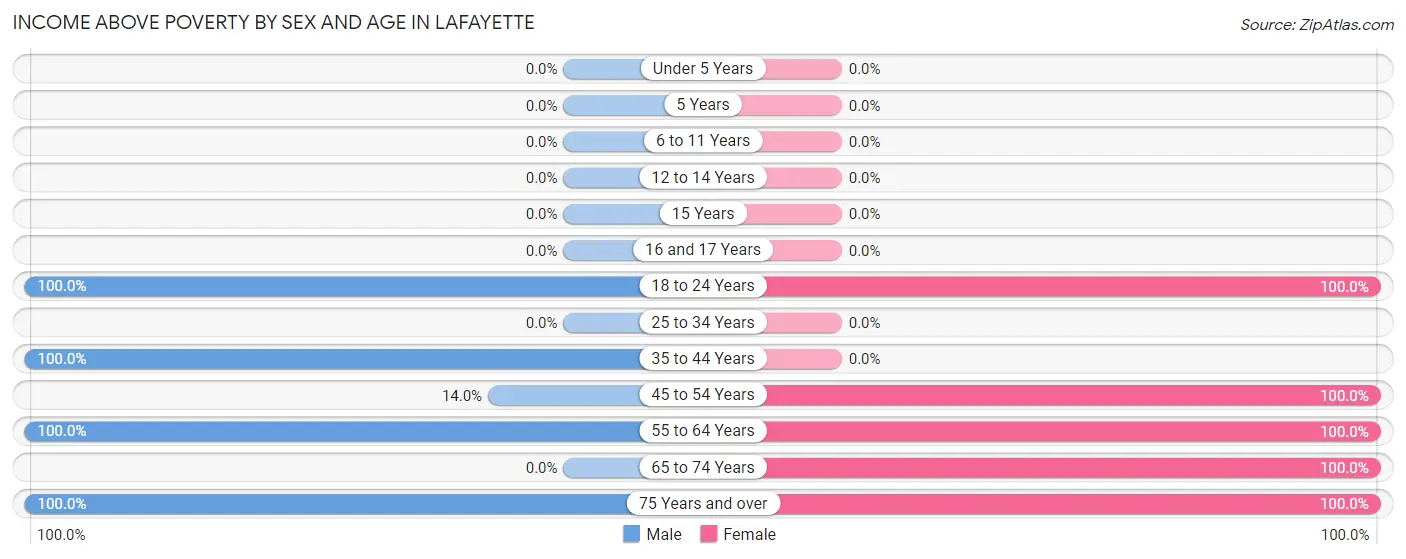
| Age Bracket | Male | Female |
| Under 5 Years | 0 (0.0%) | 0 (0.0%) |
| 5 Years | 0 (0.0%) | 0 (0.0%) |
| 6 to 11 Years | 0 (0.0%) | 0 (0.0%) |
| 12 to 14 Years | 0 (0.0%) | 0 (0.0%) |
| 15 Years | 0 (0.0%) | 0 (0.0%) |
| 16 and 17 Years | 0 (0.0%) | 0 (0.0%) |
| 18 to 24 Years | 143 (100.0%) | 29 (100.0%) |
| 25 to 34 Years | 0 (0.0%) | 0 (0.0%) |
| 35 to 44 Years | 33 (100.0%) | 0 (0.0%) |
| 45 to 54 Years | 7 (14.0%) | 6 (100.0%) |
| 55 to 64 Years | 43 (100.0%) | 24 (100.0%) |
| 65 to 74 Years | 0 (0.0%) | 25 (100.0%) |
| 75 Years and over | 14 (100.0%) | 99 (100.0%) |
| Total | 240 (71.0%) | 183 (75.0%) |
Income Below Poverty Among Married-Couple Families in Lafayette
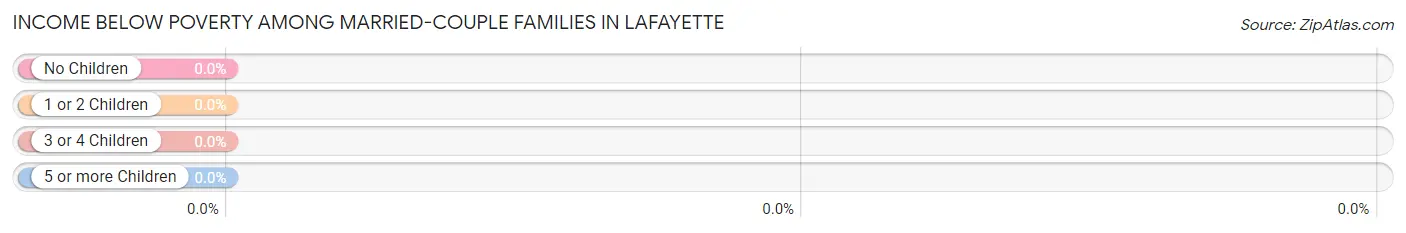
| Children | Above Poverty | Below Poverty |
| No Children | 44 (100.0%) | 0 (0.0%) |
| 1 or 2 Children | 0 (0.0%) | 0 (0.0%) |
| 3 or 4 Children | 0 (0.0%) | 0 (0.0%) |
| 5 or more Children | 0 (0.0%) | 0 (0.0%) |
| Total | 44 (100.0%) | 0 (0.0%) |
Income Below Poverty Among Single-Parent Households in Lafayette
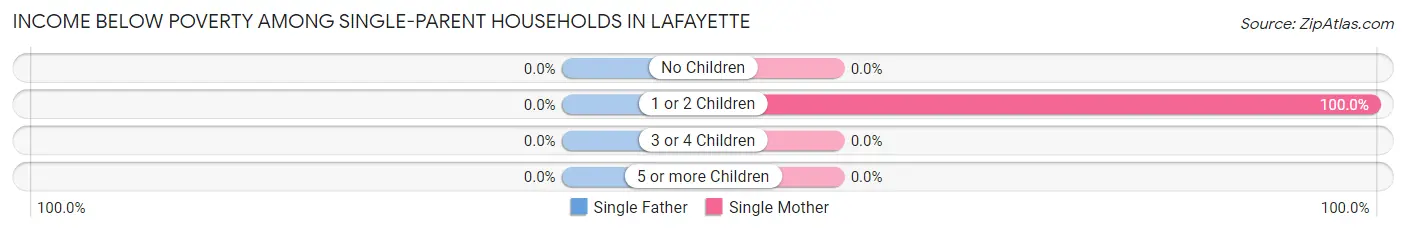
| Children | Single Father | Single Mother |
| No Children | 0 (0.0%) | 0 (0.0%) |
| 1 or 2 Children | 0 (0.0%) | 31 (100.0%) |
| 3 or 4 Children | 0 (0.0%) | 0 (0.0%) |
| 5 or more Children | 0 (0.0%) | 0 (0.0%) |
| Total | 0 (0.0%) | 31 (27.0%) |
Income Below Poverty Among Married-Couple vs Single-Parent Households in Lafayette
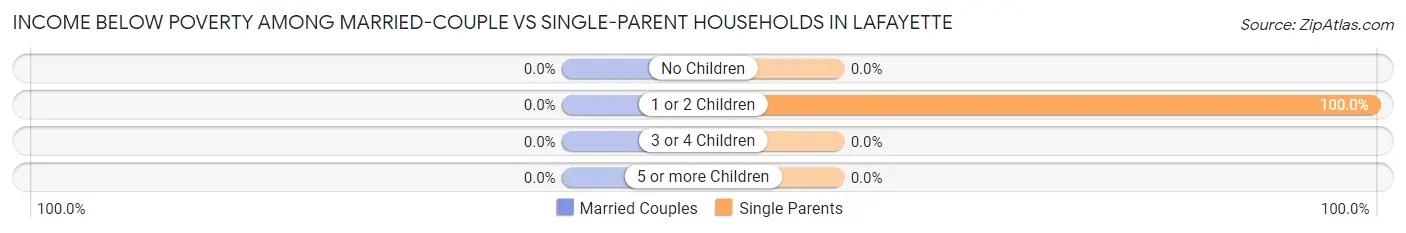
| Children | Married-Couple Families | Single-Parent Households |
| No Children | 0 (0.0%) | 0 (0.0%) |
| 1 or 2 Children | 0 (0.0%) | 31 (100.0%) |
| 3 or 4 Children | 0 (0.0%) | 0 (0.0%) |
| 5 or more Children | 0 (0.0%) | 0 (0.0%) |
| Total | 0 (0.0%) | 31 (27.0%) |
Race in Lafayette
The most populous races in Lafayette are White / Caucasian (518 | 89.0%), Hispanic or Latino (64 | 11.0%), and Two or more Races (43 | 7.4%).
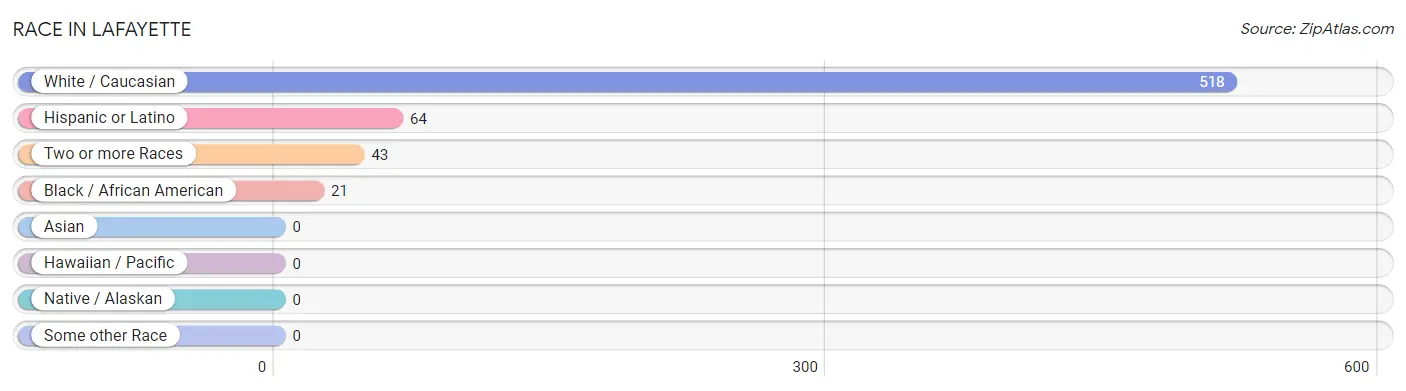
| Race | # Population | % Population |
| Asian | 0 | 0.0% |
| Black / African American | 21 | 3.6% |
| Hawaiian / Pacific | 0 | 0.0% |
| Hispanic or Latino | 64 | 11.0% |
| Native / Alaskan | 0 | 0.0% |
| White / Caucasian | 518 | 89.0% |
| Two or more Races | 43 | 7.4% |
| Some other Race | 0 | 0.0% |
| Total | 582 | 100.0% |
Ancestry in Lafayette
The most populous ancestries reported in Lafayette are Irish (125 | 21.5%), Mexican (64 | 11.0%), American (50 | 8.6%), English (44 | 7.6%), and Scotch-Irish (24 | 4.1%), together accounting for 52.7% of all Lafayette residents.
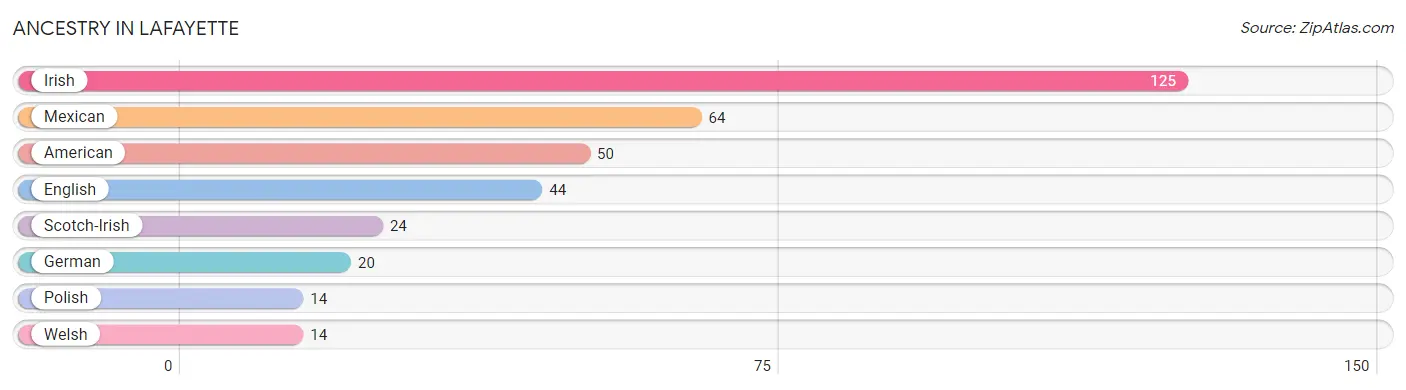
| Ancestry | # Population | % Population |
| American | 50 | 8.6% |
| English | 44 | 7.6% |
| German | 20 | 3.4% |
| Irish | 125 | 21.5% |
| Mexican | 64 | 11.0% |
| Polish | 14 | 2.4% |
| Scotch-Irish | 24 | 4.1% |
| Welsh | 14 | 2.4% | View All 8 Rows |
Immigrants in Lafayette
The most numerous immigrant groups reported in Lafayette came from Central America (43 | 7.4%), Latin America (43 | 7.4%), and Mexico (43 | 7.4%), together accounting for 22.2% of all Lafayette residents.
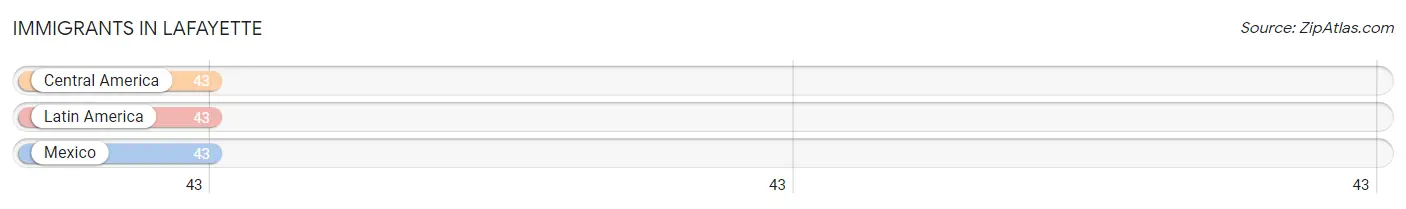
| Immigration Origin | # Population | % Population |
| Central America | 43 | 7.4% |
| Latin America | 43 | 7.4% |
| Mexico | 43 | 7.4% | View All 3 Rows |
Sex and Age in Lafayette
Sex and Age in Lafayette
The most populous age groups in Lafayette are 20 to 24 Years (143 | 42.3%) for men and 75 to 79 Years (86 | 35.2%) for women.
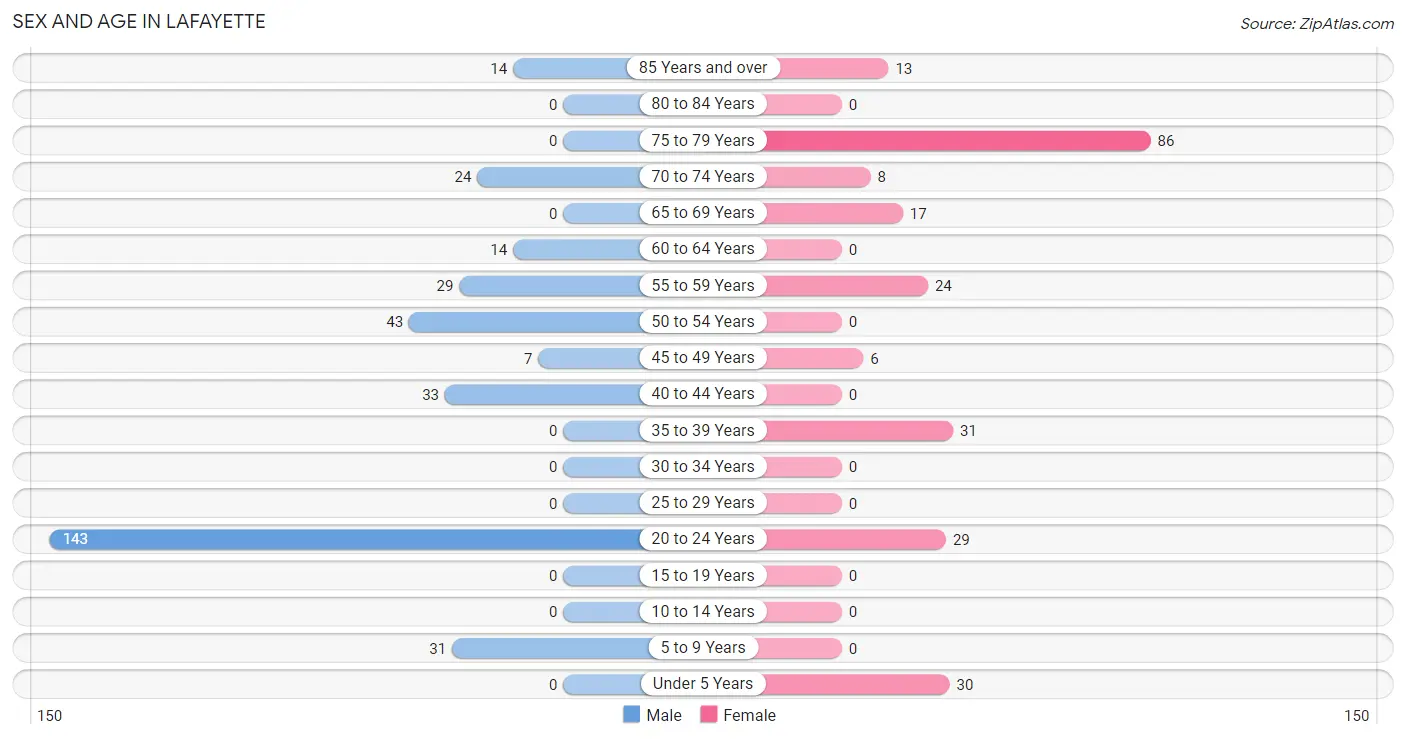
| Age Bracket | Male | Female |
| Under 5 Years | 0 (0.0%) | 30 (12.3%) |
| 5 to 9 Years | 31 (9.2%) | 0 (0.0%) |
| 10 to 14 Years | 0 (0.0%) | 0 (0.0%) |
| 15 to 19 Years | 0 (0.0%) | 0 (0.0%) |
| 20 to 24 Years | 143 (42.3%) | 29 (11.9%) |
| 25 to 29 Years | 0 (0.0%) | 0 (0.0%) |
| 30 to 34 Years | 0 (0.0%) | 0 (0.0%) |
| 35 to 39 Years | 0 (0.0%) | 31 (12.7%) |
| 40 to 44 Years | 33 (9.8%) | 0 (0.0%) |
| 45 to 49 Years | 7 (2.1%) | 6 (2.5%) |
| 50 to 54 Years | 43 (12.7%) | 0 (0.0%) |
| 55 to 59 Years | 29 (8.6%) | 24 (9.8%) |
| 60 to 64 Years | 14 (4.1%) | 0 (0.0%) |
| 65 to 69 Years | 0 (0.0%) | 17 (7.0%) |
| 70 to 74 Years | 24 (7.1%) | 8 (3.3%) |
| 75 to 79 Years | 0 (0.0%) | 86 (35.2%) |
| 80 to 84 Years | 0 (0.0%) | 0 (0.0%) |
| 85 Years and over | 14 (4.1%) | 13 (5.3%) |
| Total | 338 (100.0%) | 244 (100.0%) |
Families and Households in Lafayette
Median Family Size in Lafayette
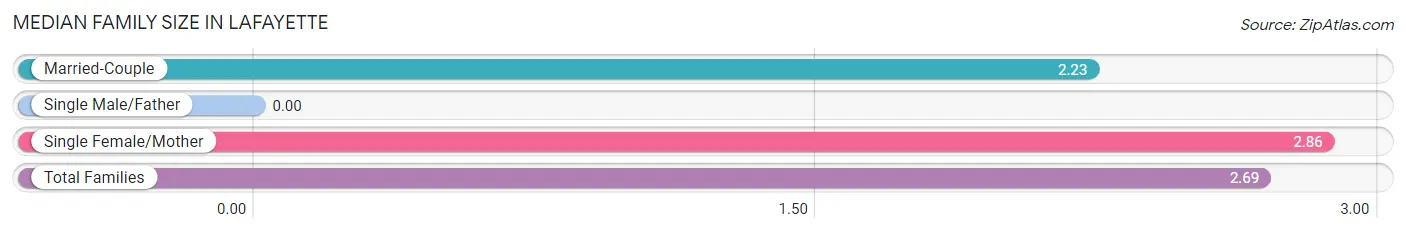
| Family Type | # Families | Family Size |
| Married-Couple | 44 (27.7%) | 2.23 |
| Single Male/Father | 0 (0.0%) | - |
| Single Female/Mother | 115 (72.3%) | 2.86 |
| Total Families | 159 (100.0%) | 2.69 |
Median Household Size in Lafayette
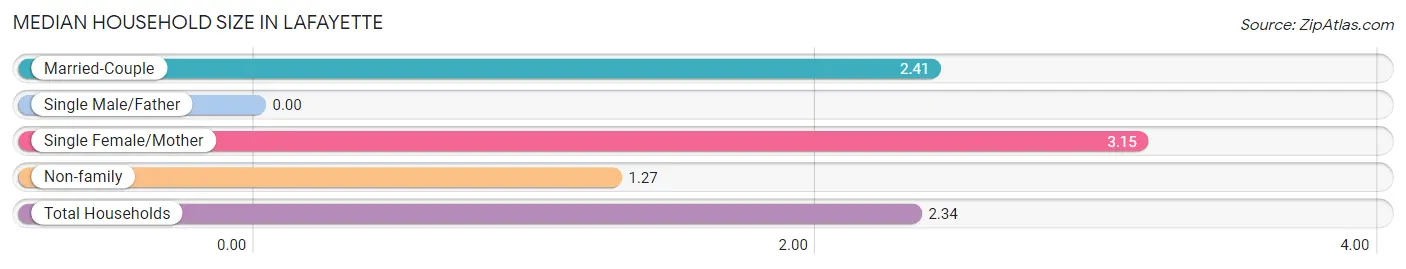
| Household Type | # Households | Household Size |
| Married-Couple | 44 (17.7%) | 2.41 |
| Single Male/Father | 0 (0.0%) | - |
| Single Female/Mother | 115 (46.2%) | 3.15 |
| Non-family | 90 (36.1%) | 1.27 |
| Total Households | 249 (100.0%) | 2.34 |
Household Size by Marriage Status in Lafayette
Out of a total of 249 households in Lafayette, 159 (63.9%) are family households, while 90 (36.1%) are nonfamily households. The most numerous type of family households are 2-person households, comprising 122, and the most common type of nonfamily households are 1-person households, comprising 82.
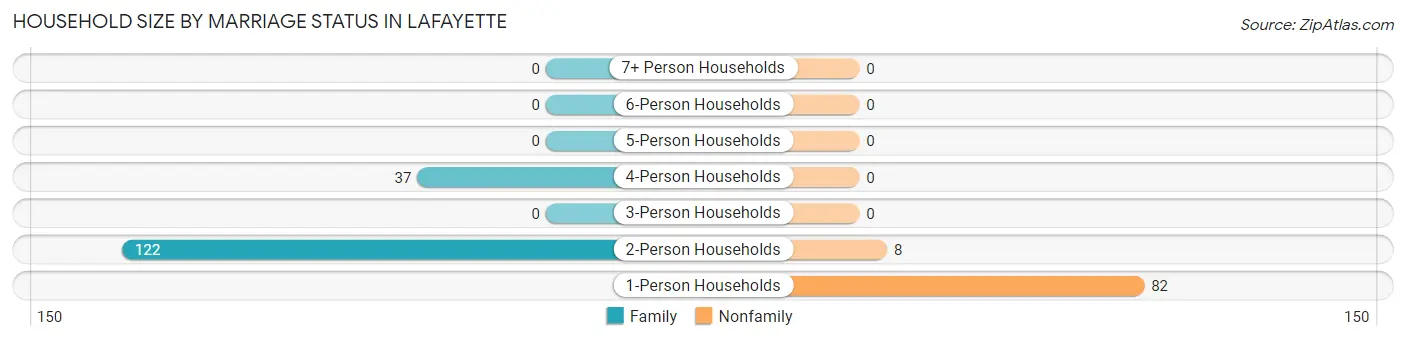
| Household Size | Family Households | Nonfamily Households |
| 1-Person Households | - | 82 (32.9%) |
| 2-Person Households | 122 (49.0%) | 8 (3.2%) |
| 3-Person Households | 0 (0.0%) | 0 (0.0%) |
| 4-Person Households | 37 (14.9%) | 0 (0.0%) |
| 5-Person Households | 0 (0.0%) | 0 (0.0%) |
| 6-Person Households | 0 (0.0%) | 0 (0.0%) |
| 7+ Person Households | 0 (0.0%) | 0 (0.0%) |
| Total | 159 (63.9%) | 90 (36.1%) |
Female Fertility in Lafayette
Fertility by Age in Lafayette
| Age Bracket | Women with Births | Births / 1,000 Women |
| 15 to 19 years | 0 (0.0%) | 0.0 |
| 20 to 34 years | 0 (0.0%) | 0.0 |
| 35 to 50 years | 0 (0.0%) | 0.0 |
| Total | 0 (0.0%) | 0.0 |
Fertility by Age by Marriage Status in Lafayette
| Age Bracket | Married | Unmarried |
| 15 to 19 years | 0 (0.0%) | 0 (0.0%) |
| 20 to 34 years | 0 (0.0%) | 0 (0.0%) |
| 35 to 50 years | 0 (0.0%) | 0 (0.0%) |
| Total | 0 (0.0%) | 0 (0.0%) |
Fertility by Education in Lafayette
| Educational Attainment | Women with Births | Births / 1,000 Women |
| Less than High School | 0 (0.0%) | 0.0 |
| High School Diploma | 0 (0.0%) | 0.0 |
| College or Associate's Degree | 0 (0.0%) | 0.0 |
| Bachelor's Degree | 0 (0.0%) | 0.0 |
| Graduate Degree | 0 (0.0%) | 0.0 |
| Total | 0 (0.0%) | 0.0 |
Fertility by Education by Marriage Status in Lafayette
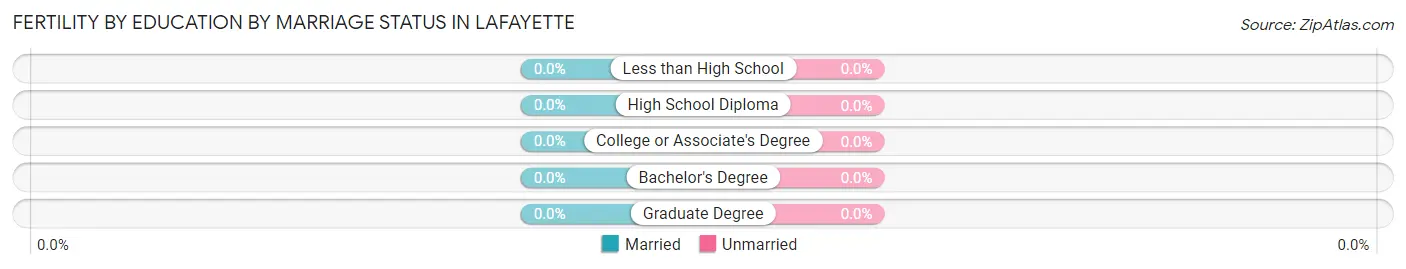
| Educational Attainment | Married | Unmarried |
| Less than High School | 0 (0.0%) | 0 (0.0%) |
| High School Diploma | 0 (0.0%) | 0 (0.0%) |
| College or Associate's Degree | 0 (0.0%) | 0 (0.0%) |
| Bachelor's Degree | 0 (0.0%) | 0 (0.0%) |
| Graduate Degree | 0 (0.0%) | 0 (0.0%) |
| Total | 0 (0.0%) | 0 (0.0%) |
Employment Characteristics in Lafayette
Employment by Class of Employer in Lafayette
Among the 121 employed individuals in Lafayette, private company employees (93 | 76.9%), self-employed (incorporated) (11 | 9.1%), and not-for-profit organizations (10 | 8.3%) make up the most common classes of employment.
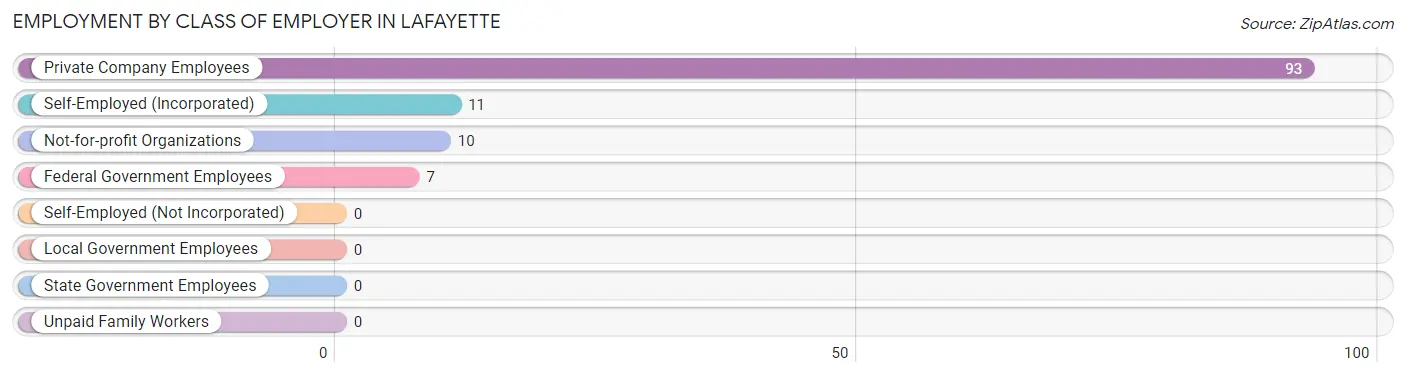
| Employer Class | # Employees | % Employees |
| Private Company Employees | 93 | 76.9% |
| Self-Employed (Incorporated) | 11 | 9.1% |
| Self-Employed (Not Incorporated) | 0 | 0.0% |
| Not-for-profit Organizations | 10 | 8.3% |
| Local Government Employees | 0 | 0.0% |
| State Government Employees | 0 | 0.0% |
| Federal Government Employees | 7 | 5.8% |
| Unpaid Family Workers | 0 | 0.0% |
| Total | 121 | 100.0% |
Employment Status by Age in Lafayette
According to the labor force statistics for Lafayette, out of the total population over 16 years of age (521), 57.6% or 300 individuals are in the labor force, with 61.1% or 183 of them unemployed. The age group with the highest labor force participation rate is 20 to 24 years, with 100.0% or 172 individuals in the labor force. Within the labor force, the 45 to 54 years age range has the highest percentage of unemployed individuals, with 87.8% or 49 of them being unemployed.
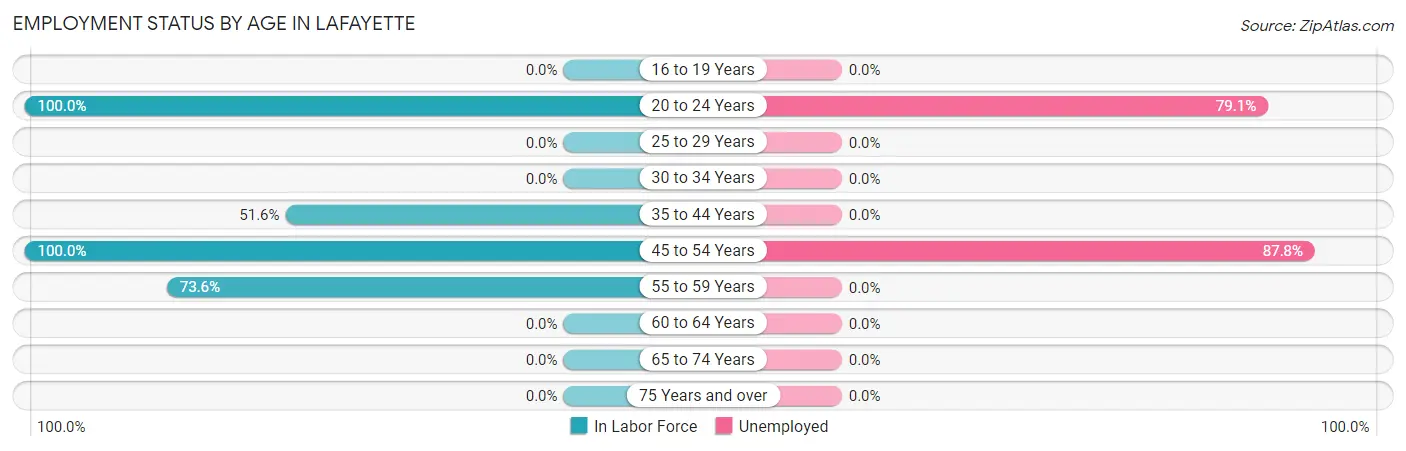
| Age Bracket | In Labor Force | Unemployed |
| 16 to 19 Years | 0 (0.0%) | 0 (0.0%) |
| 20 to 24 Years | 172 (100.0%) | 136 (79.1%) |
| 25 to 29 Years | 0 (0.0%) | 0 (0.0%) |
| 30 to 34 Years | 0 (0.0%) | 0 (0.0%) |
| 35 to 44 Years | 33 (51.6%) | 0 (0.0%) |
| 45 to 54 Years | 56 (100.0%) | 49 (87.8%) |
| 55 to 59 Years | 39 (73.6%) | 0 (0.0%) |
| 60 to 64 Years | 0 (0.0%) | 0 (0.0%) |
| 65 to 74 Years | 0 (0.0%) | 0 (0.0%) |
| 75 Years and over | 0 (0.0%) | 0 (0.0%) |
| Total | 300 (57.6%) | 183 (61.1%) |
Employment Status by Educational Attainment in Lafayette
According to labor force statistics for Lafayette, 68.4% of individuals (128) out of the total population between 25 and 64 years of age (187) are in the labor force, with 35.5% or 45 of them being unemployed. The group with the highest labor force participation rate are those with the educational attainment of less than high school, with 100.0% or 43 individuals in the labor force. Within the labor force, individuals with less than high school education have the highest percentage of unemployment, with 100.0% or 43 of them being unemployed.
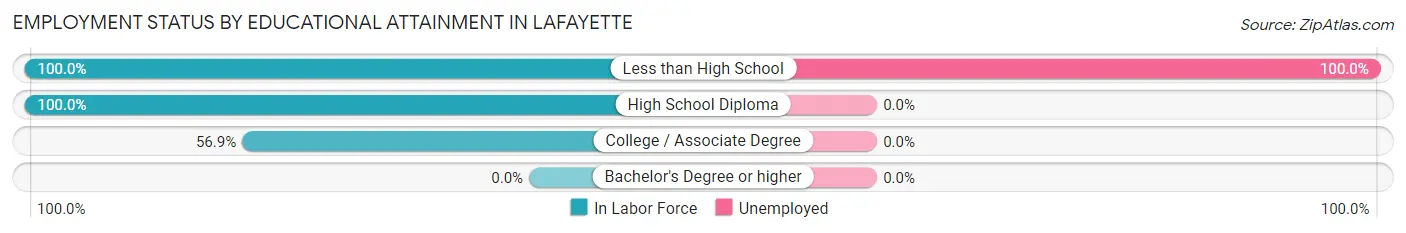
| Educational Attainment | In Labor Force | Unemployed |
| Less than High School | 43 (100.0%) | 43 (100.0%) |
| High School Diploma | 44 (100.0%) | 0 (0.0%) |
| College / Associate Degree | 41 (56.9%) | 0 (0.0%) |
| Bachelor's Degree or higher | 0 (0.0%) | 0 (0.0%) |
| Total | 128 (68.4%) | 66 (35.5%) |
Employment Occupations by Sex in Lafayette
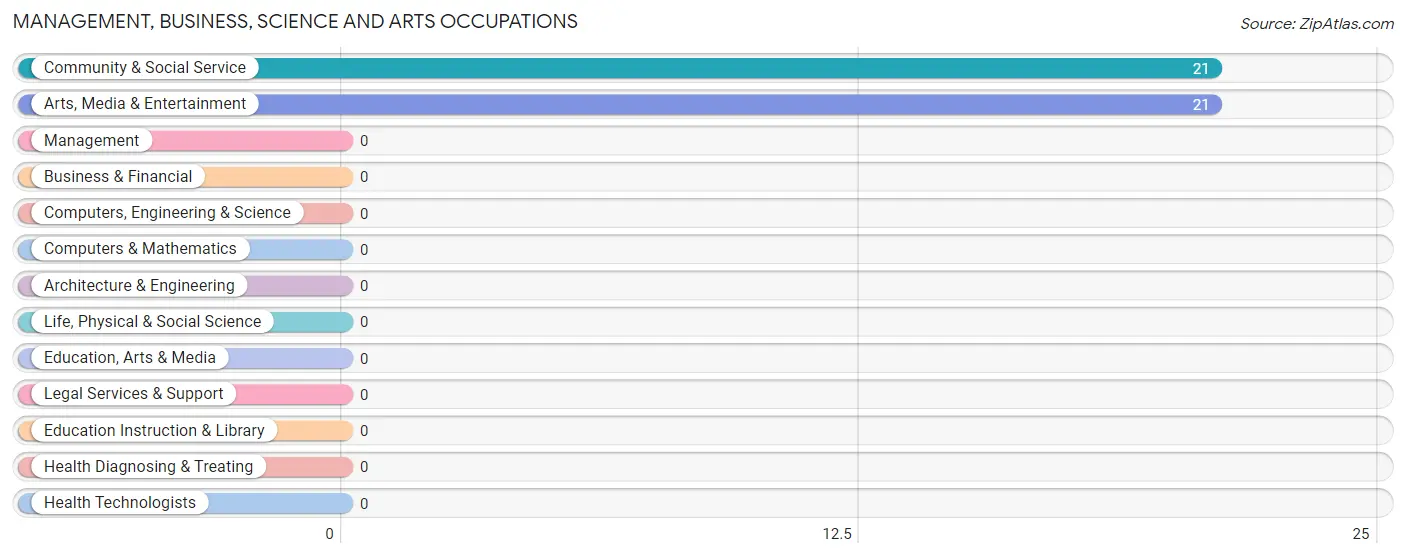
Management, Business, Science and Arts Occupations
The most common Management, Business, Science and Arts occupations in Lafayette are Community & Social Service (21 | 18.4%), and Arts, Media & Entertainment (21 | 18.4%).
Management, Business, Science and Arts Occupations by Sex
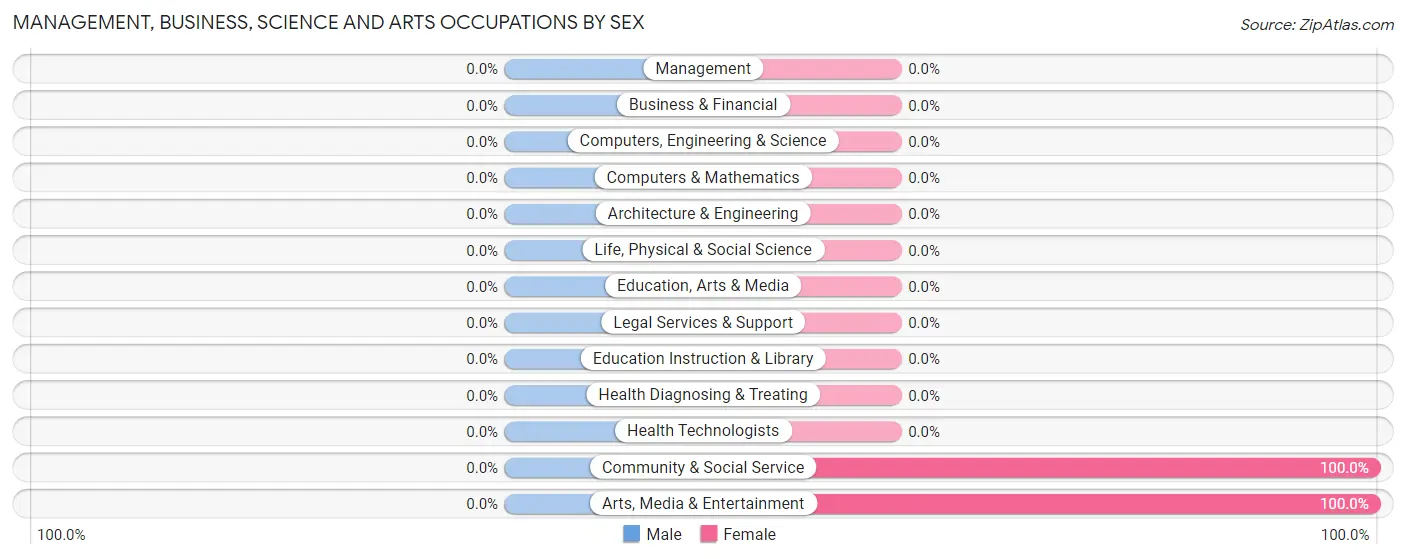
| Occupation | Male | Female |
| Management | 0 (0.0%) | 0 (0.0%) |
| Business & Financial | 0 (0.0%) | 0 (0.0%) |
| Computers, Engineering & Science | 0 (0.0%) | 0 (0.0%) |
| Computers & Mathematics | 0 (0.0%) | 0 (0.0%) |
| Architecture & Engineering | 0 (0.0%) | 0 (0.0%) |
| Life, Physical & Social Science | 0 (0.0%) | 0 (0.0%) |
| Community & Social Service | 0 (0.0%) | 21 (100.0%) |
| Education, Arts & Media | 0 (0.0%) | 0 (0.0%) |
| Legal Services & Support | 0 (0.0%) | 0 (0.0%) |
| Education Instruction & Library | 0 (0.0%) | 0 (0.0%) |
| Arts, Media & Entertainment | 0 (0.0%) | 21 (100.0%) |
| Health Diagnosing & Treating | 0 (0.0%) | 0 (0.0%) |
| Health Technologists | 0 (0.0%) | 0 (0.0%) |
| Total (Category) | 0 (0.0%) | 21 (100.0%) |
| Total (Overall) | 69 (60.5%) | 45 (39.5%) |
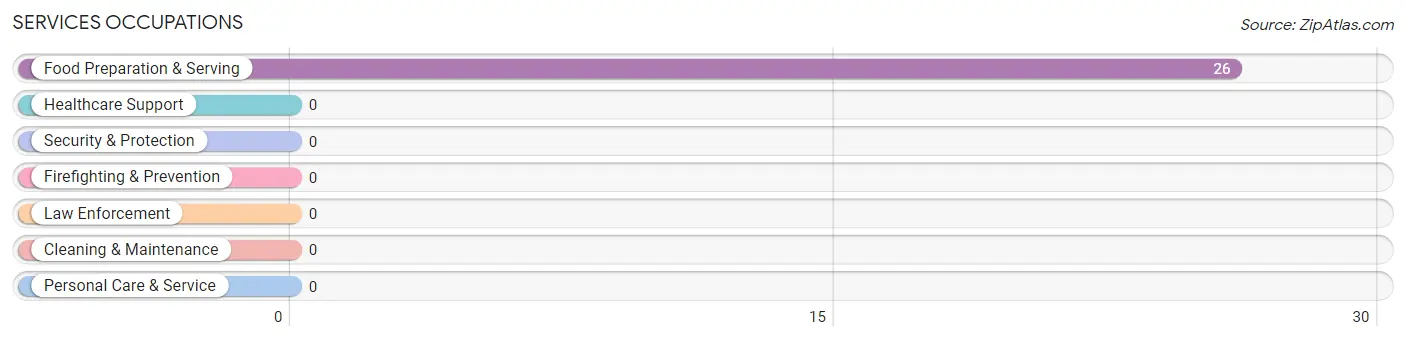
Services Occupations
The most common Services occupations in Lafayette are , and Food Preparation & Serving (26 | 22.8%).
Services Occupations by Sex
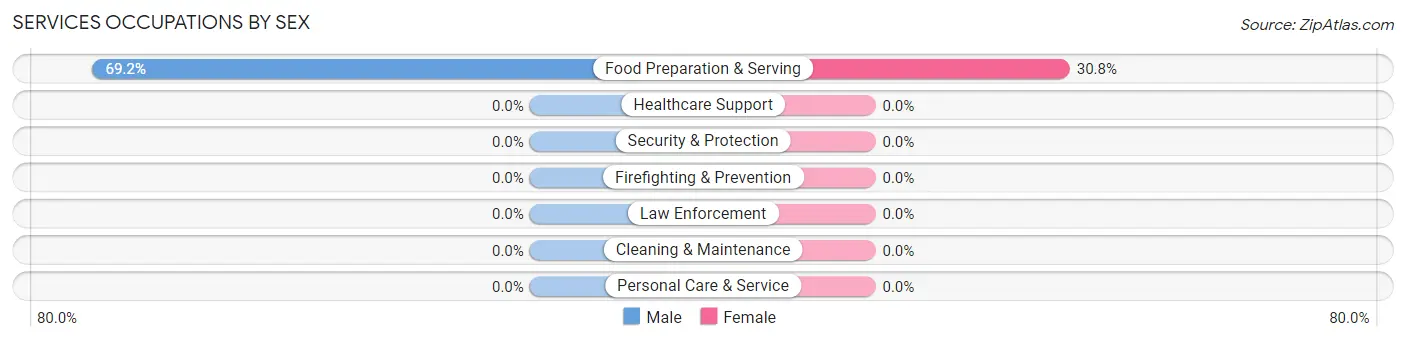
| Occupation | Male | Female |
| Healthcare Support | 0 (0.0%) | 0 (0.0%) |
| Security & Protection | 0 (0.0%) | 0 (0.0%) |
| Firefighting & Prevention | 0 (0.0%) | 0 (0.0%) |
| Law Enforcement | 0 (0.0%) | 0 (0.0%) |
| Food Preparation & Serving | 18 (69.2%) | 8 (30.8%) |
| Cleaning & Maintenance | 0 (0.0%) | 0 (0.0%) |
| Personal Care & Service | 0 (0.0%) | 0 (0.0%) |
| Total (Category) | 18 (69.2%) | 8 (30.8%) |
| Total (Overall) | 69 (60.5%) | 45 (39.5%) |
Sales and Office Occupations
The most common Sales and Office occupations in Lafayette are Office & Administration (16 | 14.0%), and Sales & Related (7 | 6.1%).

Sales and Office Occupations by Sex

| Occupation | Male | Female |
| Sales & Related | 7 (100.0%) | 0 (0.0%) |
| Office & Administration | 0 (0.0%) | 16 (100.0%) |
| Total (Category) | 7 (30.4%) | 16 (69.6%) |
| Total (Overall) | 69 (60.5%) | 45 (39.5%) |
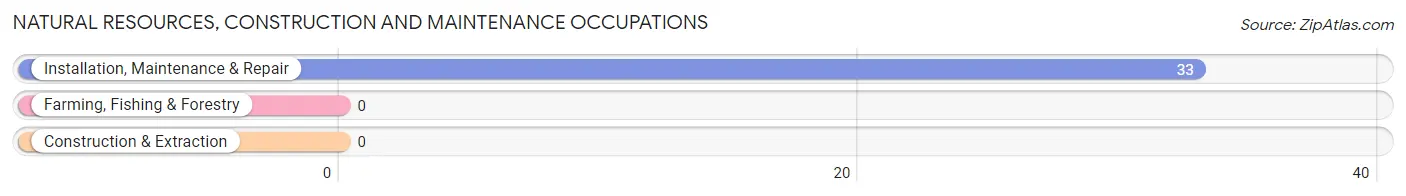
Natural Resources, Construction and Maintenance Occupations
The most common Natural Resources, Construction and Maintenance occupations in Lafayette are , and Installation, Maintenance & Repair (33 | 28.9%).
Natural Resources, Construction and Maintenance Occupations by Sex
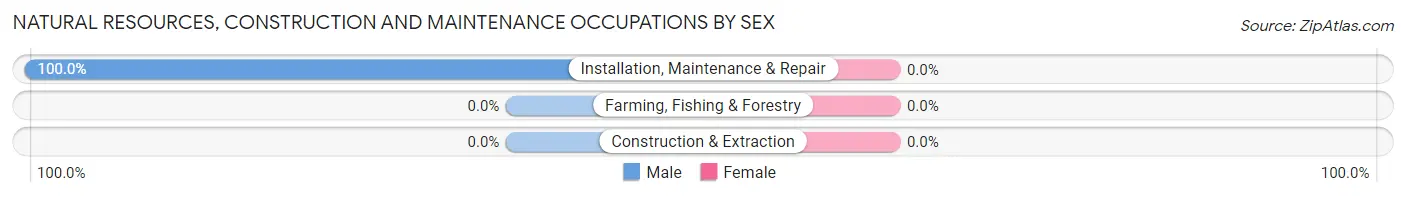
| Occupation | Male | Female |
| Farming, Fishing & Forestry | 0 (0.0%) | 0 (0.0%) |
| Construction & Extraction | 0 (0.0%) | 0 (0.0%) |
| Installation, Maintenance & Repair | 33 (100.0%) | 0 (0.0%) |
| Total (Category) | 33 (100.0%) | 0 (0.0%) |
| Total (Overall) | 69 (60.5%) | 45 (39.5%) |
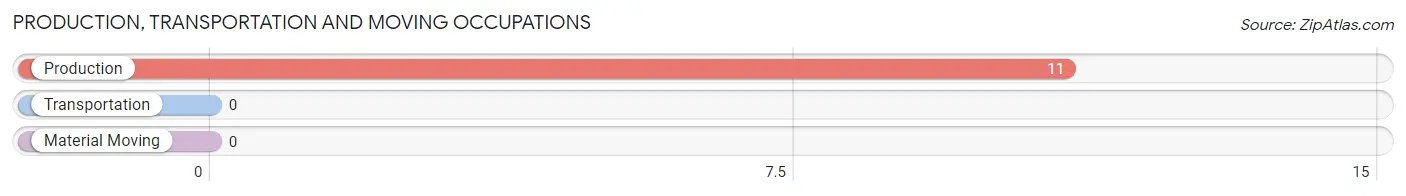
Production, Transportation and Moving Occupations
The most common Production, Transportation and Moving occupations in Lafayette are , and Production (11 | 9.7%).
Production, Transportation and Moving Occupations by Sex
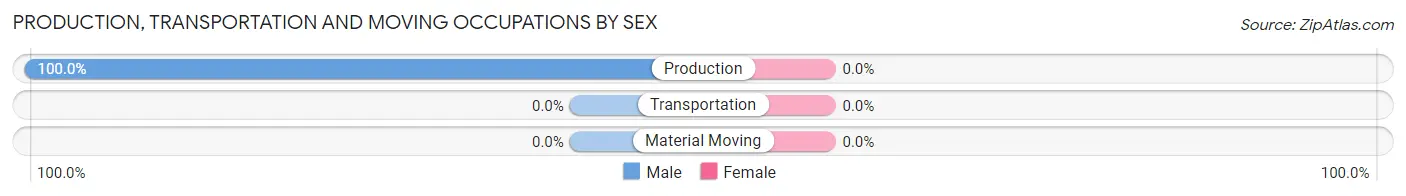
| Occupation | Male | Female |
| Production | 11 (100.0%) | 0 (0.0%) |
| Transportation | 0 (0.0%) | 0 (0.0%) |
| Material Moving | 0 (0.0%) | 0 (0.0%) |
| Total (Category) | 11 (100.0%) | 0 (0.0%) |
| Total (Overall) | 69 (60.5%) | 45 (39.5%) |
Employment Industries by Sex in Lafayette
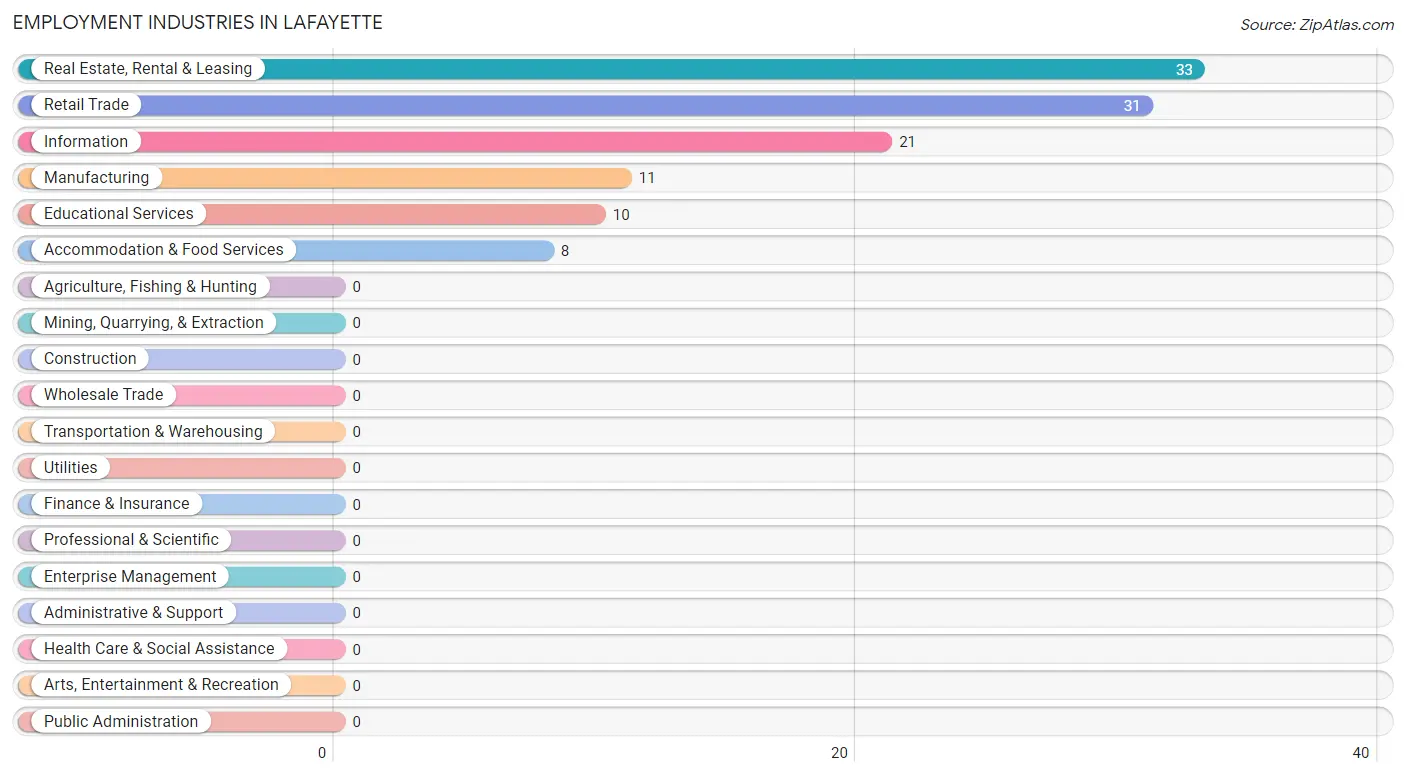
Employment Industries in Lafayette
The major employment industries in Lafayette include Real Estate, Rental & Leasing (33 | 28.9%), Retail Trade (31 | 27.2%), Information (21 | 18.4%), Manufacturing (11 | 9.7%), and Educational Services (10 | 8.8%).
Employment Industries by Sex in Lafayette
The Lafayette industries that see more men than women are Manufacturing (100.0%), Real Estate, Rental & Leasing (100.0%), and Retail Trade (80.6%), whereas the industries that tend to have a higher number of women are Information (100.0%), Educational Services (100.0%), and Accommodation & Food Services (100.0%).
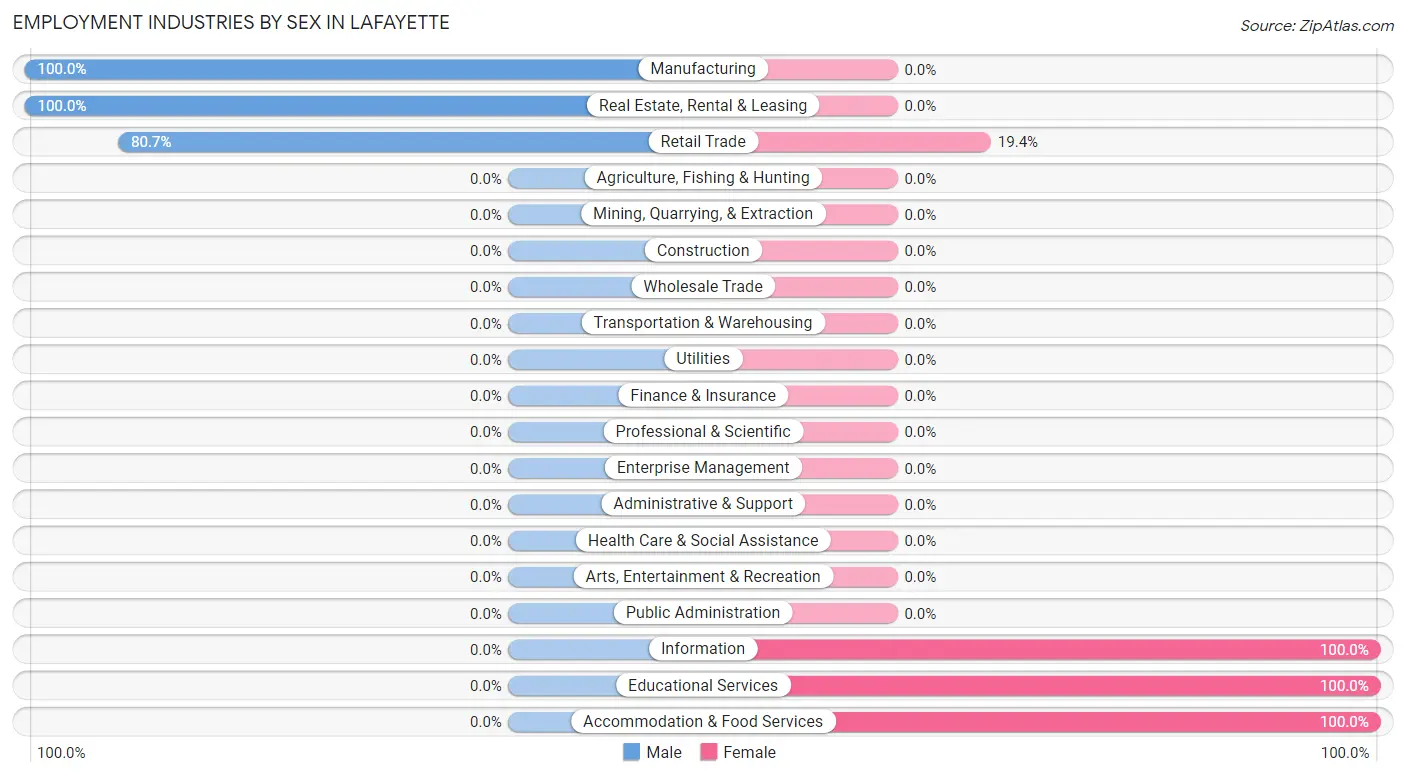
| Industry | Male | Female |
| Agriculture, Fishing & Hunting | 0 (0.0%) | 0 (0.0%) |
| Mining, Quarrying, & Extraction | 0 (0.0%) | 0 (0.0%) |
| Construction | 0 (0.0%) | 0 (0.0%) |
| Manufacturing | 11 (100.0%) | 0 (0.0%) |
| Wholesale Trade | 0 (0.0%) | 0 (0.0%) |
| Retail Trade | 25 (80.6%) | 6 (19.4%) |
| Transportation & Warehousing | 0 (0.0%) | 0 (0.0%) |
| Utilities | 0 (0.0%) | 0 (0.0%) |
| Information | 0 (0.0%) | 21 (100.0%) |
| Finance & Insurance | 0 (0.0%) | 0 (0.0%) |
| Real Estate, Rental & Leasing | 33 (100.0%) | 0 (0.0%) |
| Professional & Scientific | 0 (0.0%) | 0 (0.0%) |
| Enterprise Management | 0 (0.0%) | 0 (0.0%) |
| Administrative & Support | 0 (0.0%) | 0 (0.0%) |
| Educational Services | 0 (0.0%) | 10 (100.0%) |
| Health Care & Social Assistance | 0 (0.0%) | 0 (0.0%) |
| Arts, Entertainment & Recreation | 0 (0.0%) | 0 (0.0%) |
| Accommodation & Food Services | 0 (0.0%) | 8 (100.0%) |
| Public Administration | 0 (0.0%) | 0 (0.0%) |
| Total | 69 (60.5%) | 45 (39.5%) |
Education in Lafayette
School Enrollment in Lafayette
The most common levels of schooling among the 46 students in Lafayette are elementary school (31 | 67.4%), and college / undergraduate (15 | 32.6%).
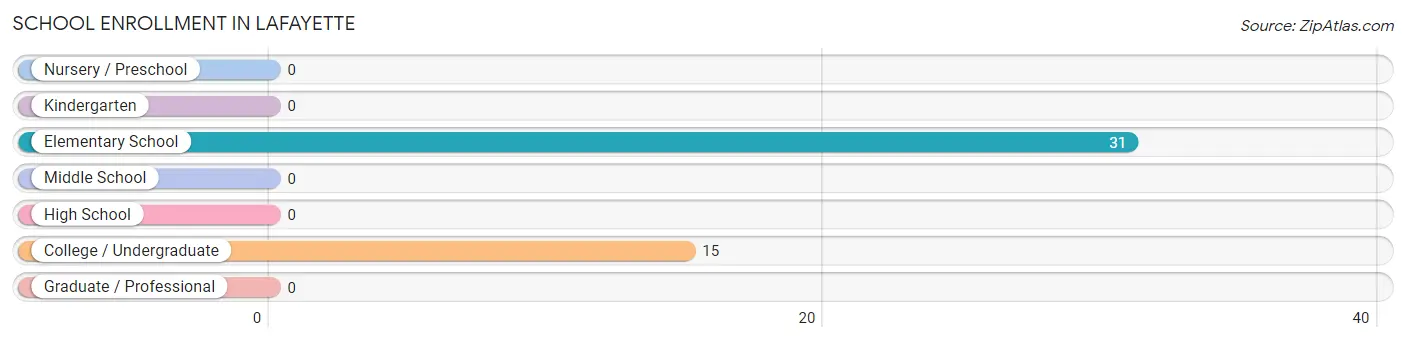
| School Level | # Students | % Students |
| Nursery / Preschool | 0 | 0.0% |
| Kindergarten | 0 | 0.0% |
| Elementary School | 31 | 67.4% |
| Middle School | 0 | 0.0% |
| High School | 0 | 0.0% |
| College / Undergraduate | 15 | 32.6% |
| Graduate / Professional | 0 | 0.0% |
| Total | 46 | 100.0% |
School Enrollment by Age by Funding Source in Lafayette
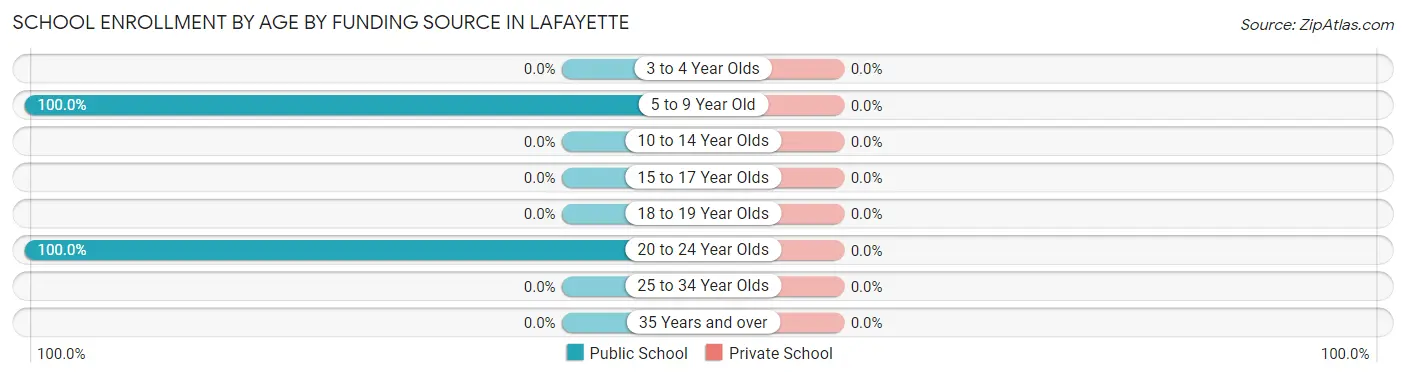
| Age Bracket | Public School | Private School |
| 3 to 4 Year Olds | 0 (0.0%) | 0 (0.0%) |
| 5 to 9 Year Old | 31 (100.0%) | 0 (0.0%) |
| 10 to 14 Year Olds | 0 (0.0%) | 0 (0.0%) |
| 15 to 17 Year Olds | 0 (0.0%) | 0 (0.0%) |
| 18 to 19 Year Olds | 0 (0.0%) | 0 (0.0%) |
| 20 to 24 Year Olds | 15 (100.0%) | 0 (0.0%) |
| 25 to 34 Year Olds | 0 (0.0%) | 0 (0.0%) |
| 35 Years and over | 0 (0.0%) | 0 (0.0%) |
| Total | 46 (100.0%) | 0 (0.0%) |
Educational Attainment by Field of Study in Lafayette
Business (45 | 76.3%), and literature & languages (14 | 23.7%) are the most common fields of study among 59 individuals in Lafayette who have obtained a bachelor's degree or higher.
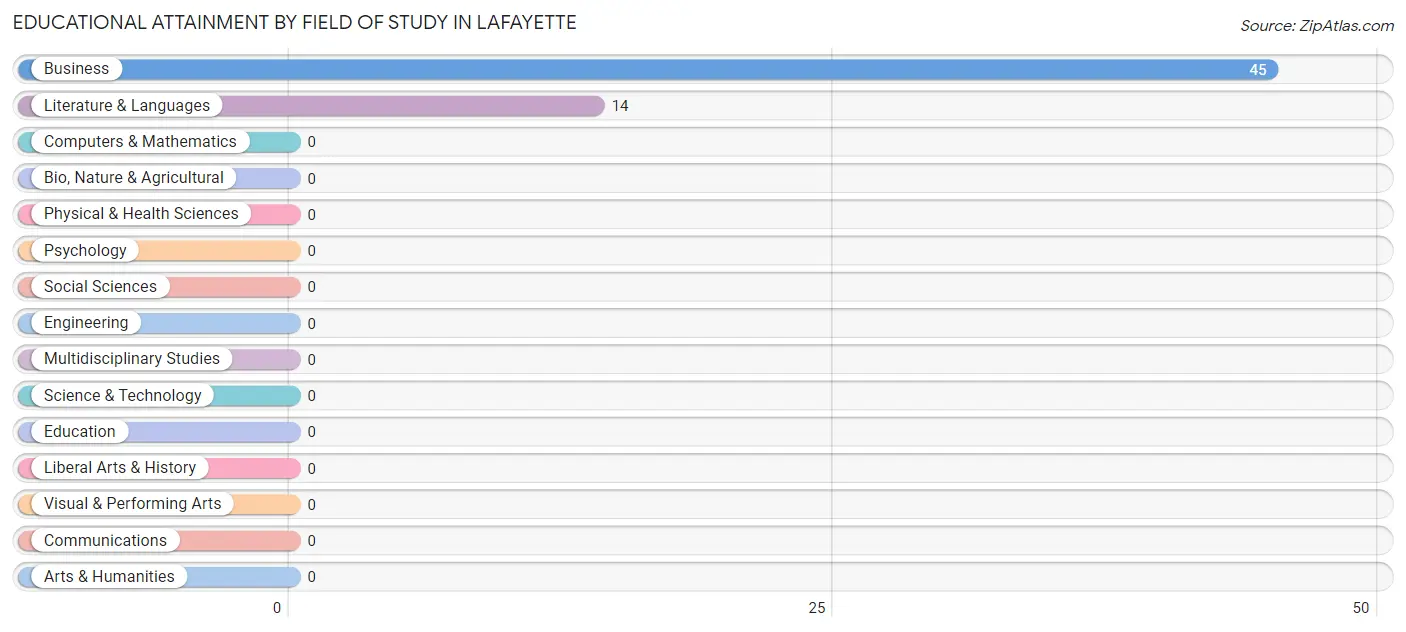
| Field of Study | # Graduates | % Graduates |
| Computers & Mathematics | 0 | 0.0% |
| Bio, Nature & Agricultural | 0 | 0.0% |
| Physical & Health Sciences | 0 | 0.0% |
| Psychology | 0 | 0.0% |
| Social Sciences | 0 | 0.0% |
| Engineering | 0 | 0.0% |
| Multidisciplinary Studies | 0 | 0.0% |
| Science & Technology | 0 | 0.0% |
| Business | 45 | 76.3% |
| Education | 0 | 0.0% |
| Literature & Languages | 14 | 23.7% |
| Liberal Arts & History | 0 | 0.0% |
| Visual & Performing Arts | 0 | 0.0% |
| Communications | 0 | 0.0% |
| Arts & Humanities | 0 | 0.0% |
| Total | 59 | 100.0% |
Transportation & Commute in Lafayette
Vehicle Availability by Sex in Lafayette
The most prevalent vehicle ownership categories in Lafayette are males with 3 vehicles (43, accounting for 56.6%) and females with 3 vehicles (24, making up 95.6%).
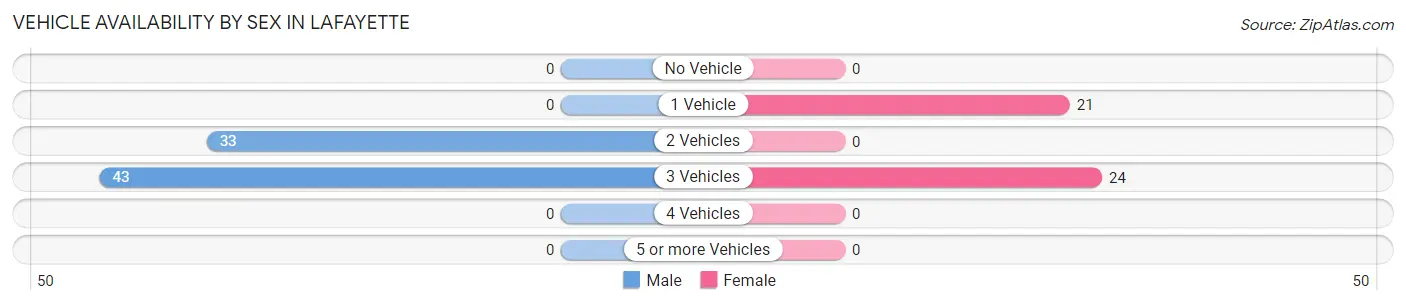
| Vehicles Available | Male | Female |
| No Vehicle | 0 (0.0%) | 0 (0.0%) |
| 1 Vehicle | 0 (0.0%) | 21 (46.7%) |
| 2 Vehicles | 33 (43.4%) | 0 (0.0%) |
| 3 Vehicles | 43 (56.6%) | 24 (53.3%) |
| 4 Vehicles | 0 (0.0%) | 0 (0.0%) |
| 5 or more Vehicles | 0 (0.0%) | 0 (0.0%) |
| Total | 76 (100.0%) | 45 (100.0%) |
Commute Time in Lafayette
The most frequently occuring commute durations in Lafayette are 20 to 24 minutes (33 commuters, 30.6%), 60 to 89 minutes (21 commuters, 19.4%), and 15 to 19 minutes (19 commuters, 17.6%).
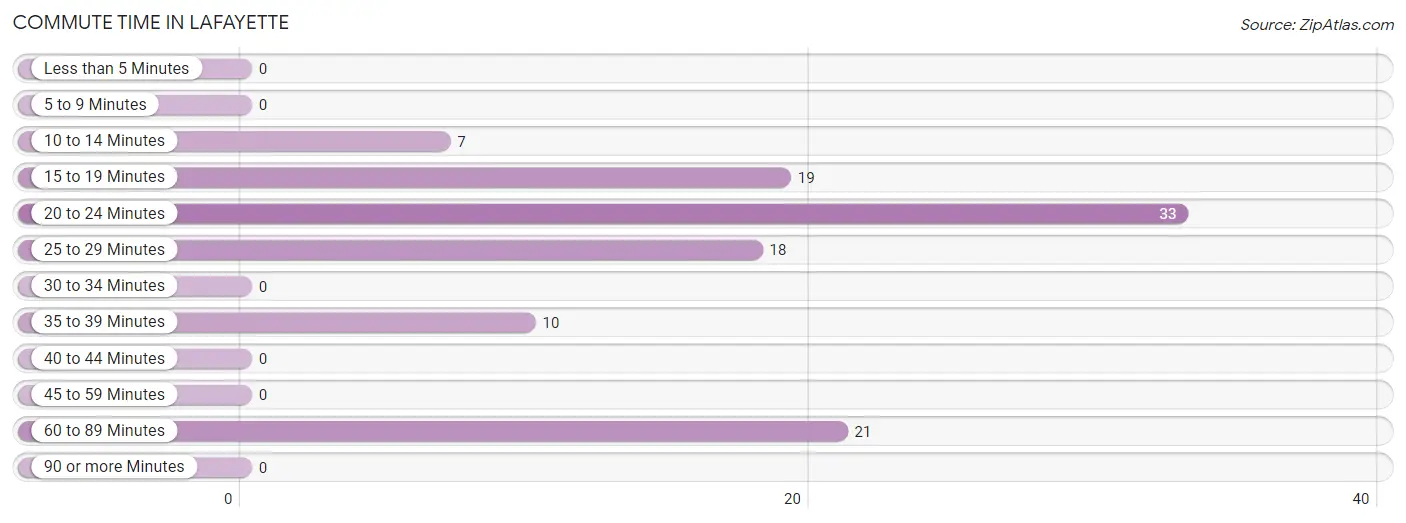
| Commute Time | # Commuters | % Commuters |
| Less than 5 Minutes | 0 | 0.0% |
| 5 to 9 Minutes | 0 | 0.0% |
| 10 to 14 Minutes | 7 | 6.5% |
| 15 to 19 Minutes | 19 | 17.6% |
| 20 to 24 Minutes | 33 | 30.6% |
| 25 to 29 Minutes | 18 | 16.7% |
| 30 to 34 Minutes | 0 | 0.0% |
| 35 to 39 Minutes | 10 | 9.3% |
| 40 to 44 Minutes | 0 | 0.0% |
| 45 to 59 Minutes | 0 | 0.0% |
| 60 to 89 Minutes | 21 | 19.4% |
| 90 or more Minutes | 0 | 0.0% |
Commute Time by Sex in Lafayette
The most common commute times in Lafayette are 20 to 24 minutes (33 commuters, 47.8%) for males and 60 to 89 minutes (21 commuters, 53.8%) for females.
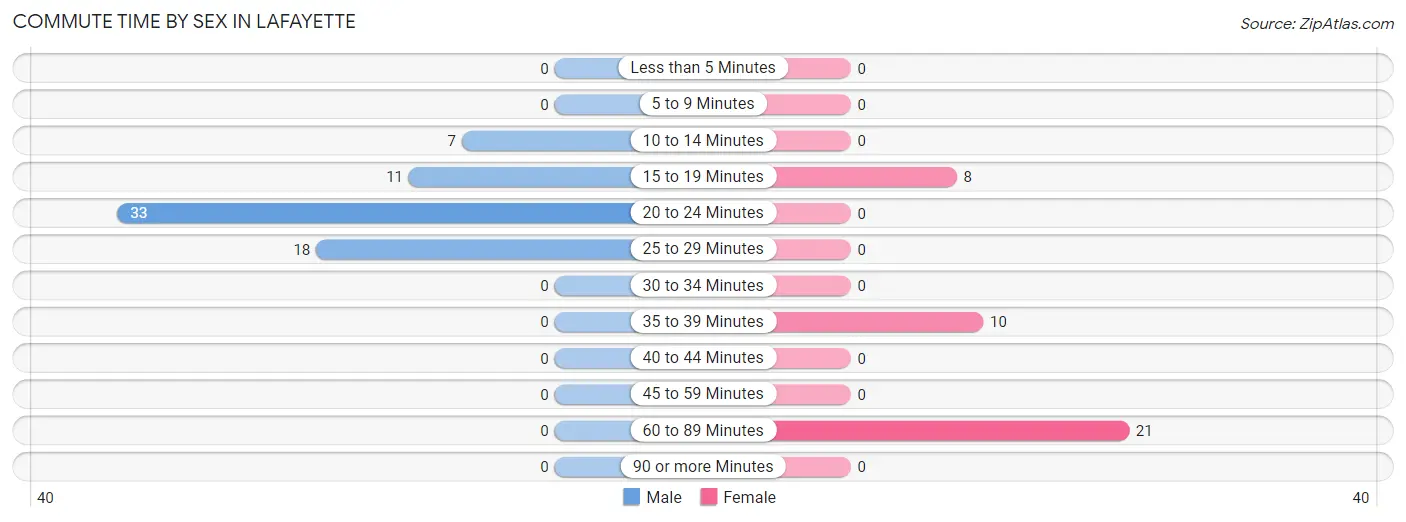
| Commute Time | Male | Female |
| Less than 5 Minutes | 0 (0.0%) | 0 (0.0%) |
| 5 to 9 Minutes | 0 (0.0%) | 0 (0.0%) |
| 10 to 14 Minutes | 7 (10.1%) | 0 (0.0%) |
| 15 to 19 Minutes | 11 (15.9%) | 8 (20.5%) |
| 20 to 24 Minutes | 33 (47.8%) | 0 (0.0%) |
| 25 to 29 Minutes | 18 (26.1%) | 0 (0.0%) |
| 30 to 34 Minutes | 0 (0.0%) | 0 (0.0%) |
| 35 to 39 Minutes | 0 (0.0%) | 10 (25.6%) |
| 40 to 44 Minutes | 0 (0.0%) | 0 (0.0%) |
| 45 to 59 Minutes | 0 (0.0%) | 0 (0.0%) |
| 60 to 89 Minutes | 0 (0.0%) | 21 (53.8%) |
| 90 or more Minutes | 0 (0.0%) | 0 (0.0%) |
Time of Departure to Work by Sex in Lafayette
The most frequent times of departure to work in Lafayette are 7:30 AM to 7:59 AM (33, 47.8%) for males and 5:30 AM to 5:59 AM (21, 53.8%) for females.
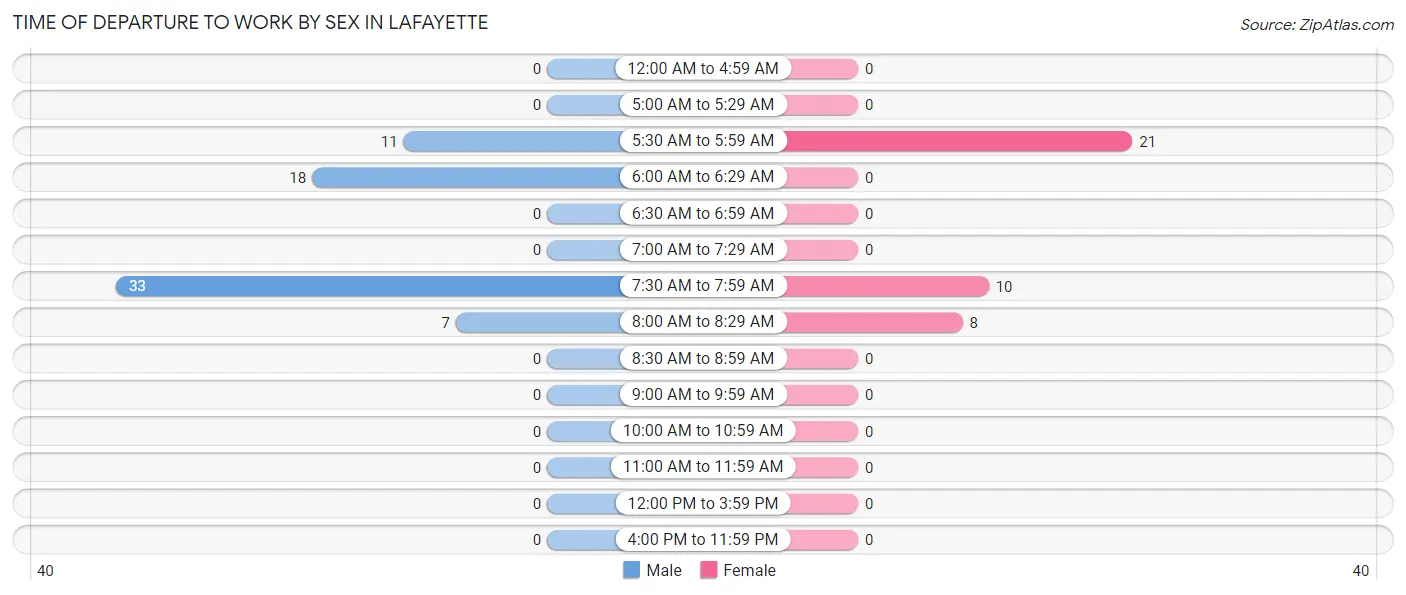
| Time of Departure | Male | Female |
| 12:00 AM to 4:59 AM | 0 (0.0%) | 0 (0.0%) |
| 5:00 AM to 5:29 AM | 0 (0.0%) | 0 (0.0%) |
| 5:30 AM to 5:59 AM | 11 (15.9%) | 21 (53.8%) |
| 6:00 AM to 6:29 AM | 18 (26.1%) | 0 (0.0%) |
| 6:30 AM to 6:59 AM | 0 (0.0%) | 0 (0.0%) |
| 7:00 AM to 7:29 AM | 0 (0.0%) | 0 (0.0%) |
| 7:30 AM to 7:59 AM | 33 (47.8%) | 10 (25.6%) |
| 8:00 AM to 8:29 AM | 7 (10.1%) | 8 (20.5%) |
| 8:30 AM to 8:59 AM | 0 (0.0%) | 0 (0.0%) |
| 9:00 AM to 9:59 AM | 0 (0.0%) | 0 (0.0%) |
| 10:00 AM to 10:59 AM | 0 (0.0%) | 0 (0.0%) |
| 11:00 AM to 11:59 AM | 0 (0.0%) | 0 (0.0%) |
| 12:00 PM to 3:59 PM | 0 (0.0%) | 0 (0.0%) |
| 4:00 PM to 11:59 PM | 0 (0.0%) | 0 (0.0%) |
| Total | 69 (100.0%) | 39 (100.0%) |
Housing Occupancy in Lafayette
Occupancy by Ownership in Lafayette
Of the total 249 dwellings in Lafayette, owner-occupied units account for 228 (91.6%), while renter-occupied units make up 21 (8.4%).
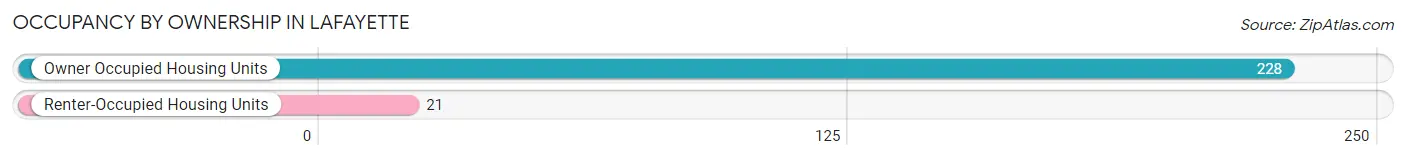
| Occupancy | # Housing Units | % Housing Units |
| Owner Occupied Housing Units | 228 | 91.6% |
| Renter-Occupied Housing Units | 21 | 8.4% |
| Total Occupied Housing Units | 249 | 100.0% |
Occupancy by Household Size in Lafayette
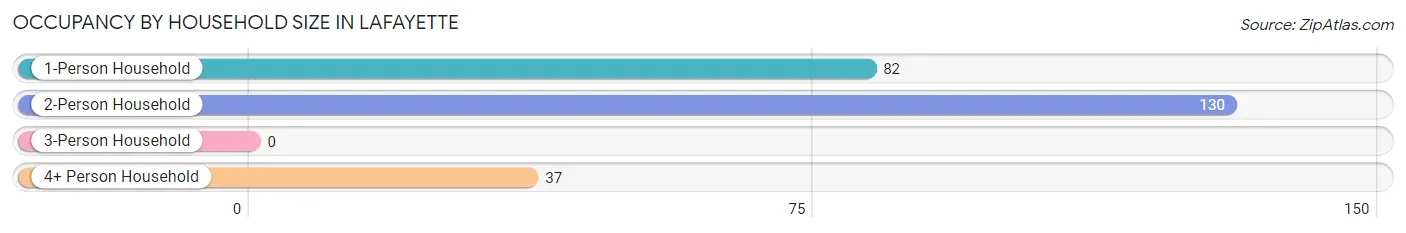
| Household Size | # Housing Units | % Housing Units |
| 1-Person Household | 82 | 32.9% |
| 2-Person Household | 130 | 52.2% |
| 3-Person Household | 0 | 0.0% |
| 4+ Person Household | 37 | 14.9% |
| Total Housing Units | 249 | 100.0% |
Occupancy by Ownership by Household Size in Lafayette
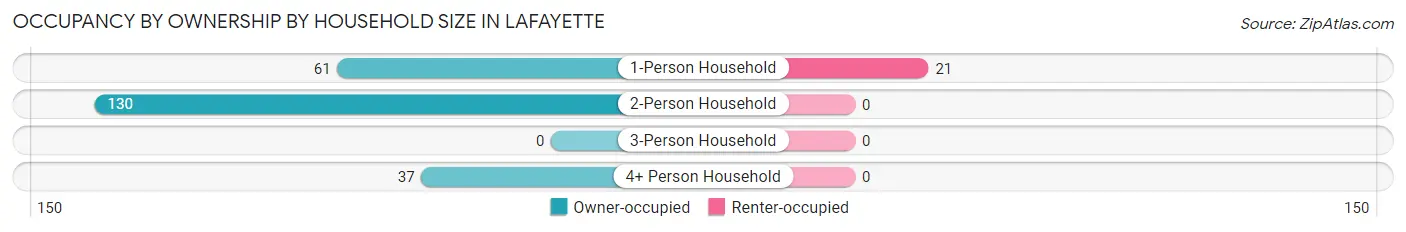
| Household Size | Owner-occupied | Renter-occupied |
| 1-Person Household | 61 (74.4%) | 21 (25.6%) |
| 2-Person Household | 130 (100.0%) | 0 (0.0%) |
| 3-Person Household | 0 (0.0%) | 0 (0.0%) |
| 4+ Person Household | 37 (100.0%) | 0 (0.0%) |
| Total Housing Units | 228 (91.6%) | 21 (8.4%) |
Occupancy by Educational Attainment in Lafayette
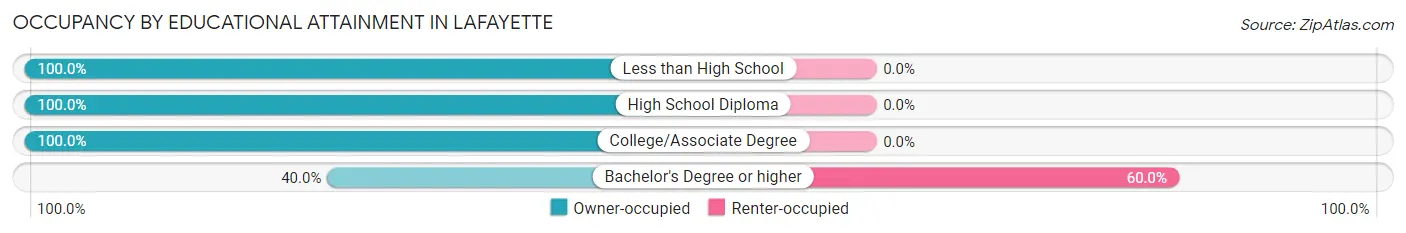
| Household Size | Owner-occupied | Renter-occupied |
| Less than High School | 65 (100.0%) | 0 (0.0%) |
| High School Diploma | 84 (100.0%) | 0 (0.0%) |
| College/Associate Degree | 65 (100.0%) | 0 (0.0%) |
| Bachelor's Degree or higher | 14 (40.0%) | 21 (60.0%) |
Occupancy by Age of Householder in Lafayette
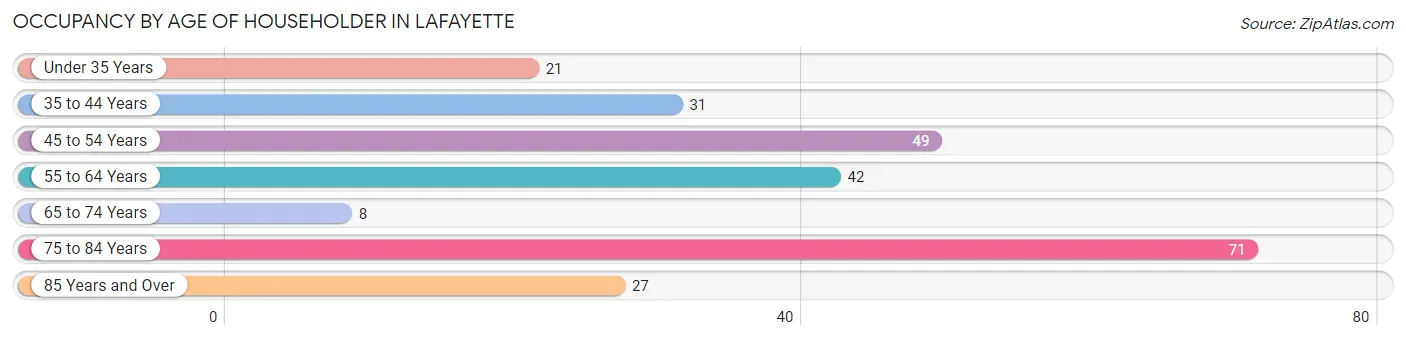
| Age Bracket | # Households | % Households |
| Under 35 Years | 21 | 8.4% |
| 35 to 44 Years | 31 | 12.4% |
| 45 to 54 Years | 49 | 19.7% |
| 55 to 64 Years | 42 | 16.9% |
| 65 to 74 Years | 8 | 3.2% |
| 75 to 84 Years | 71 | 28.5% |
| 85 Years and Over | 27 | 10.8% |
| Total | 249 | 100.0% |
Housing Finances in Lafayette
Median Income by Occupancy in Lafayette
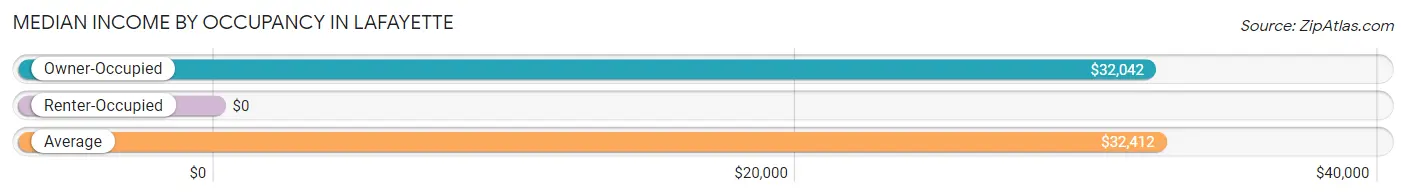
| Occupancy Type | # Households | Median Income |
| Owner-Occupied | 228 (91.6%) | $32,042 |
| Renter-Occupied | 21 (8.4%) | $0 |
| Average | 249 (100.0%) | $32,412 |
Occupancy by Householder Income Bracket in Lafayette
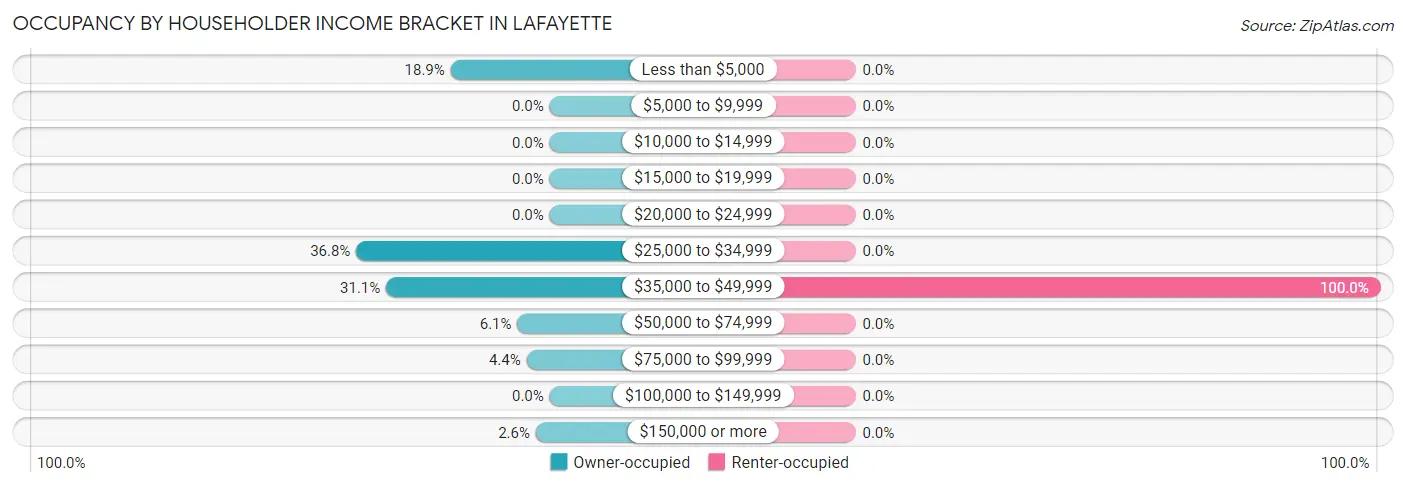
| Income Bracket | Owner-occupied | Renter-occupied |
| Less than $5,000 | 43 (18.9%) | 0 (0.0%) |
| $5,000 to $9,999 | 0 (0.0%) | 0 (0.0%) |
| $10,000 to $14,999 | 0 (0.0%) | 0 (0.0%) |
| $15,000 to $19,999 | 0 (0.0%) | 0 (0.0%) |
| $20,000 to $24,999 | 0 (0.0%) | 0 (0.0%) |
| $25,000 to $34,999 | 84 (36.8%) | 0 (0.0%) |
| $35,000 to $49,999 | 71 (31.1%) | 21 (100.0%) |
| $50,000 to $74,999 | 14 (6.1%) | 0 (0.0%) |
| $75,000 to $99,999 | 10 (4.4%) | 0 (0.0%) |
| $100,000 to $149,999 | 0 (0.0%) | 0 (0.0%) |
| $150,000 or more | 6 (2.6%) | 0 (0.0%) |
| Total | 228 (100.0%) | 21 (100.0%) |
Monthly Housing Cost Tiers in Lafayette
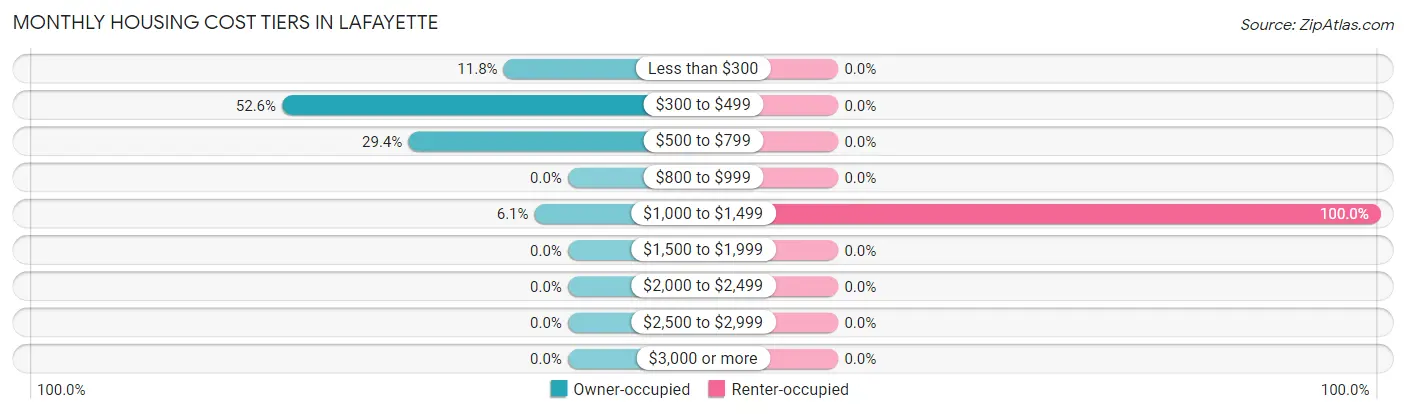
| Monthly Cost | Owner-occupied | Renter-occupied |
| Less than $300 | 27 (11.8%) | 0 (0.0%) |
| $300 to $499 | 120 (52.6%) | 0 (0.0%) |
| $500 to $799 | 67 (29.4%) | 0 (0.0%) |
| $800 to $999 | 0 (0.0%) | 0 (0.0%) |
| $1,000 to $1,499 | 14 (6.1%) | 21 (100.0%) |
| $1,500 to $1,999 | 0 (0.0%) | 0 (0.0%) |
| $2,000 to $2,499 | 0 (0.0%) | 0 (0.0%) |
| $2,500 to $2,999 | 0 (0.0%) | 0 (0.0%) |
| $3,000 or more | 0 (0.0%) | 0 (0.0%) |
| Total | 228 (100.0%) | 21 (100.0%) |
Physical Housing Characteristics in Lafayette
Housing Structures in Lafayette
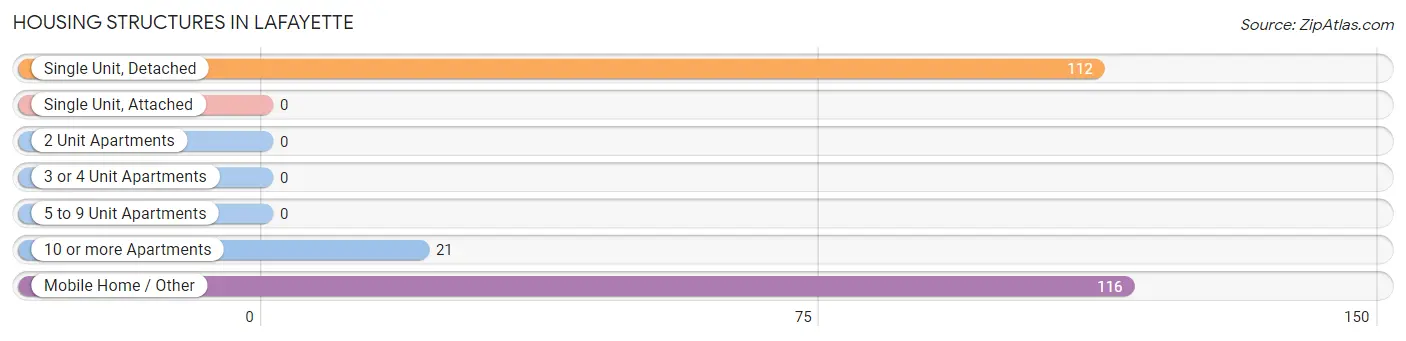
| Structure Type | # Housing Units | % Housing Units |
| Single Unit, Detached | 112 | 45.0% |
| Single Unit, Attached | 0 | 0.0% |
| 2 Unit Apartments | 0 | 0.0% |
| 3 or 4 Unit Apartments | 0 | 0.0% |
| 5 to 9 Unit Apartments | 0 | 0.0% |
| 10 or more Apartments | 21 | 8.4% |
| Mobile Home / Other | 116 | 46.6% |
| Total | 249 | 100.0% |
Housing Structures by Occupancy in Lafayette
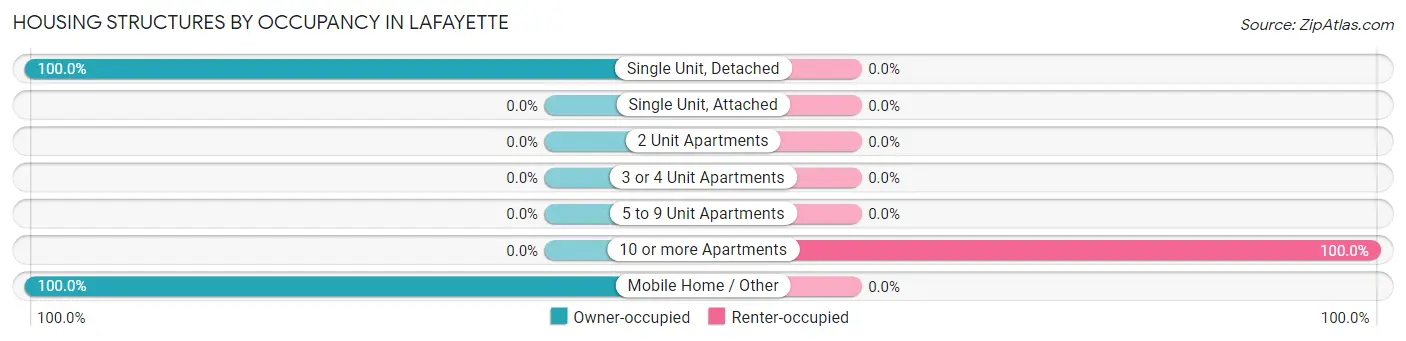
| Structure Type | Owner-occupied | Renter-occupied |
| Single Unit, Detached | 112 (100.0%) | 0 (0.0%) |
| Single Unit, Attached | 0 (0.0%) | 0 (0.0%) |
| 2 Unit Apartments | 0 (0.0%) | 0 (0.0%) |
| 3 or 4 Unit Apartments | 0 (0.0%) | 0 (0.0%) |
| 5 to 9 Unit Apartments | 0 (0.0%) | 0 (0.0%) |
| 10 or more Apartments | 0 (0.0%) | 21 (100.0%) |
| Mobile Home / Other | 116 (100.0%) | 0 (0.0%) |
| Total | 228 (91.6%) | 21 (8.4%) |
Housing Structures by Number of Rooms in Lafayette
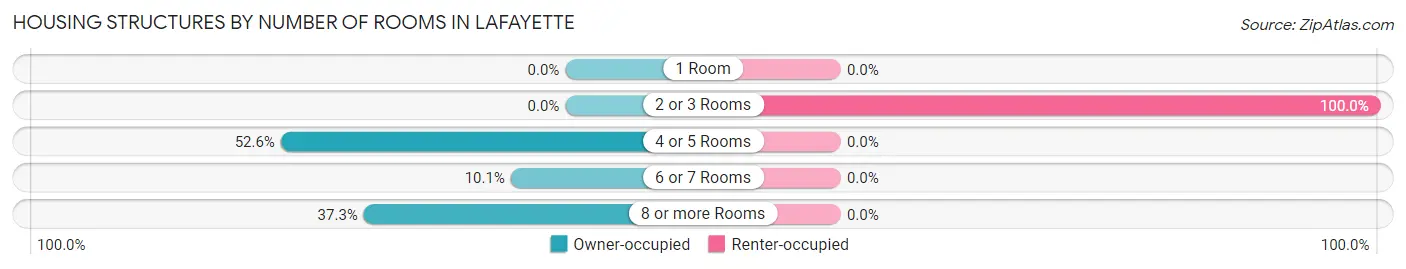
| Number of Rooms | Owner-occupied | Renter-occupied |
| 1 Room | 0 (0.0%) | 0 (0.0%) |
| 2 or 3 Rooms | 0 (0.0%) | 21 (100.0%) |
| 4 or 5 Rooms | 120 (52.6%) | 0 (0.0%) |
| 6 or 7 Rooms | 23 (10.1%) | 0 (0.0%) |
| 8 or more Rooms | 85 (37.3%) | 0 (0.0%) |
| Total | 228 (100.0%) | 21 (100.0%) |
Housing Structure by Heating Type in Lafayette
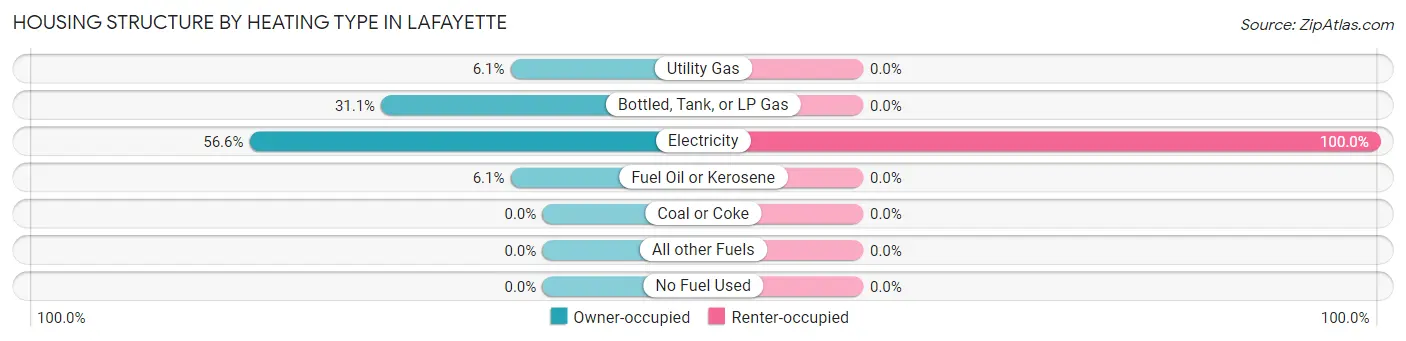
| Heating Type | Owner-occupied | Renter-occupied |
| Utility Gas | 14 (6.1%) | 0 (0.0%) |
| Bottled, Tank, or LP Gas | 71 (31.1%) | 0 (0.0%) |
| Electricity | 129 (56.6%) | 21 (100.0%) |
| Fuel Oil or Kerosene | 14 (6.1%) | 0 (0.0%) |
| Coal or Coke | 0 (0.0%) | 0 (0.0%) |
| All other Fuels | 0 (0.0%) | 0 (0.0%) |
| No Fuel Used | 0 (0.0%) | 0 (0.0%) |
| Total | 228 (100.0%) | 21 (100.0%) |
Household Vehicle Usage in Lafayette
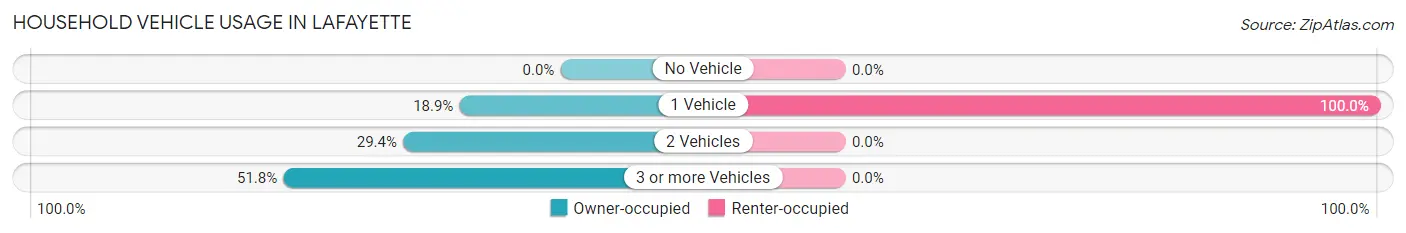
| Vehicles per Household | Owner-occupied | Renter-occupied |
| No Vehicle | 0 (0.0%) | 0 (0.0%) |
| 1 Vehicle | 43 (18.9%) | 21 (100.0%) |
| 2 Vehicles | 67 (29.4%) | 0 (0.0%) |
| 3 or more Vehicles | 118 (51.7%) | 0 (0.0%) |
| Total | 228 (100.0%) | 21 (100.0%) |
Real Estate & Mortgages in Lafayette
Real Estate and Mortgage Overview in Lafayette
| Characteristic | Without Mortgage | With Mortgage |
| Housing Units | 218 | 10 |
| Median Property Value | - | - |
| Median Household Income | $31,866 | $0 |
| Monthly Housing Costs | $386 | $0 |
| Real Estate Taxes | - | - |
Property Value by Mortgage Status in Lafayette
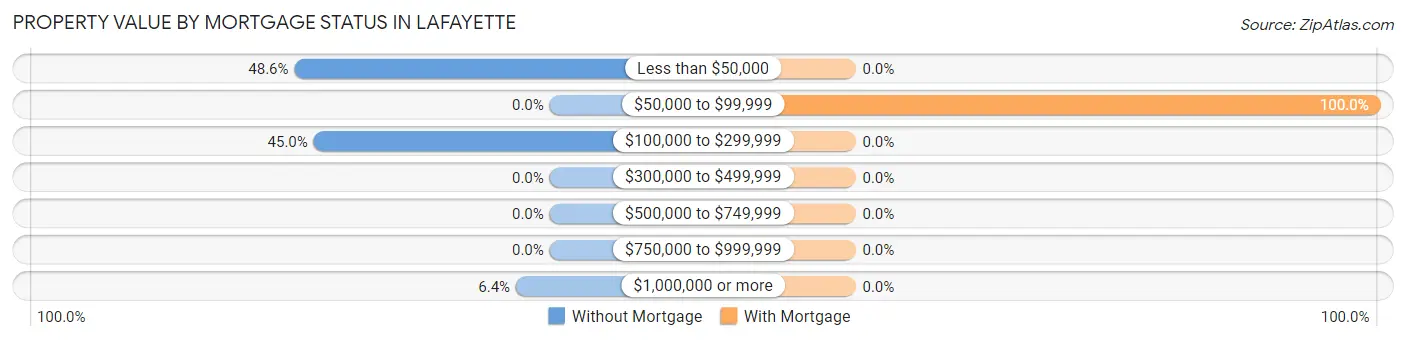
| Property Value | Without Mortgage | With Mortgage |
| Less than $50,000 | 106 (48.6%) | 0 (0.0%) |
| $50,000 to $99,999 | 0 (0.0%) | 10 (100.0%) |
| $100,000 to $299,999 | 98 (45.0%) | 0 (0.0%) |
| $300,000 to $499,999 | 0 (0.0%) | 0 (0.0%) |
| $500,000 to $749,999 | 0 (0.0%) | 0 (0.0%) |
| $750,000 to $999,999 | 0 (0.0%) | 0 (0.0%) |
| $1,000,000 or more | 14 (6.4%) | 0 (0.0%) |
| Total | 218 (100.0%) | 10 (100.0%) |
Household Income by Mortgage Status in Lafayette
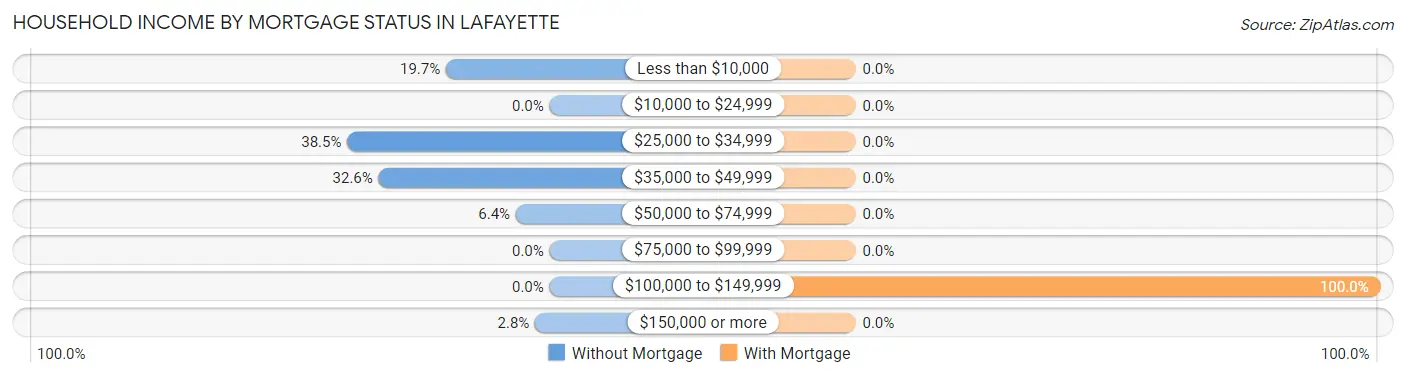
| Household Income | Without Mortgage | With Mortgage |
| Less than $10,000 | 43 (19.7%) | 0 (0.0%) |
| $10,000 to $24,999 | 0 (0.0%) | 0 (0.0%) |
| $25,000 to $34,999 | 84 (38.5%) | 0 (0.0%) |
| $35,000 to $49,999 | 71 (32.6%) | 0 (0.0%) |
| $50,000 to $74,999 | 14 (6.4%) | 0 (0.0%) |
| $75,000 to $99,999 | 0 (0.0%) | 0 (0.0%) |
| $100,000 to $149,999 | 0 (0.0%) | 10 (100.0%) |
| $150,000 or more | 6 (2.8%) | 0 (0.0%) |
| Total | 218 (100.0%) | 10 (100.0%) |
Property Value to Household Income Ratio in Lafayette
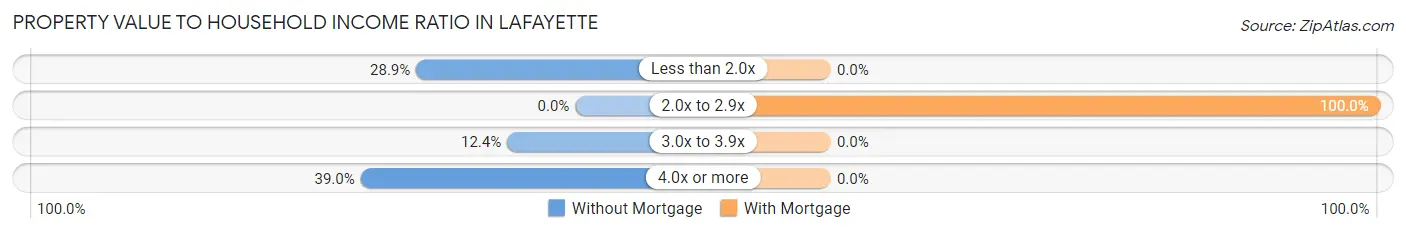
| Value-to-Income Ratio | Without Mortgage | With Mortgage |
| Less than 2.0x | 63 (28.9%) | 0 (0.0%) |
| 2.0x to 2.9x | 0 (0.0%) | 10 (100.0%) |
| 3.0x to 3.9x | 27 (12.4%) | 0 (0.0%) |
| 4.0x or more | 85 (39.0%) | 0 (0.0%) |
| Total | 218 (100.0%) | 10 (100.0%) |
Real Estate Taxes by Mortgage Status in Lafayette
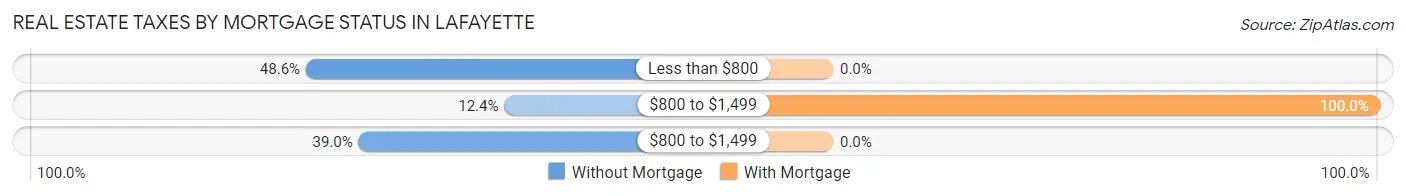
| Property Taxes | Without Mortgage | With Mortgage |
| Less than $800 | 106 (48.6%) | 0 (0.0%) |
| $800 to $1,499 | 27 (12.4%) | 10 (100.0%) |
| $800 to $1,499 | 85 (39.0%) | 0 (0.0%) |
| Total | 218 (100.0%) | 10 (100.0%) |
Health & Disability in Lafayette
Health Insurance Coverage by Age in Lafayette
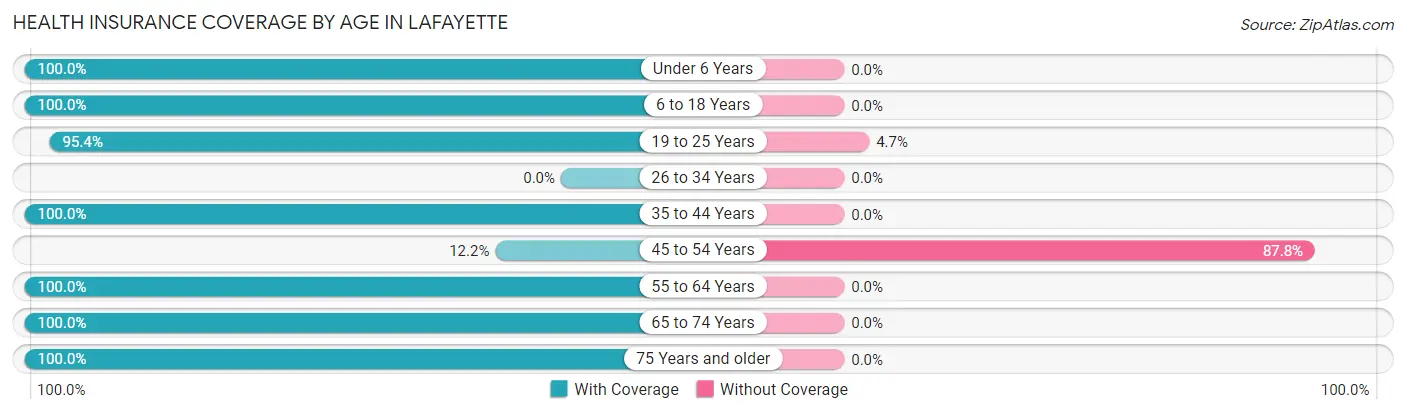
| Age Bracket | With Coverage | Without Coverage |
| Under 6 Years | 30 (100.0%) | 0 (0.0%) |
| 6 to 18 Years | 31 (100.0%) | 0 (0.0%) |
| 19 to 25 Years | 164 (95.4%) | 8 (4.6%) |
| 26 to 34 Years | 0 (0.0%) | 0 (0.0%) |
| 35 to 44 Years | 64 (100.0%) | 0 (0.0%) |
| 45 to 54 Years | 6 (12.2%) | 43 (87.8%) |
| 55 to 64 Years | 67 (100.0%) | 0 (0.0%) |
| 65 to 74 Years | 49 (100.0%) | 0 (0.0%) |
| 75 Years and older | 113 (100.0%) | 0 (0.0%) |
| Total | 524 (91.1%) | 51 (8.9%) |
Health Insurance Coverage by Citizenship Status in Lafayette
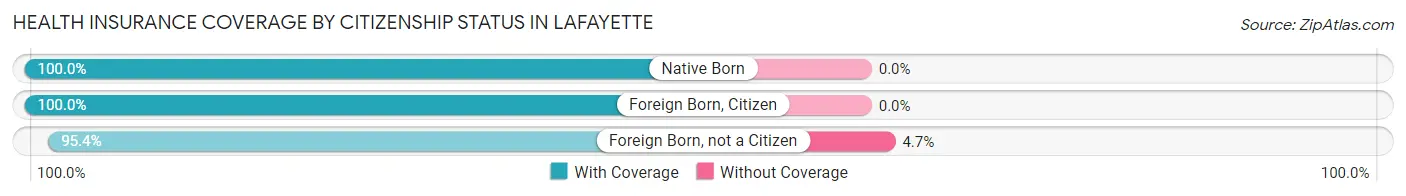
| Citizenship Status | With Coverage | Without Coverage |
| Native Born | 30 (100.0%) | 0 (0.0%) |
| Foreign Born, Citizen | 31 (100.0%) | 0 (0.0%) |
| Foreign Born, not a Citizen | 164 (95.4%) | 8 (4.6%) |
Health Insurance Coverage by Household Income in Lafayette
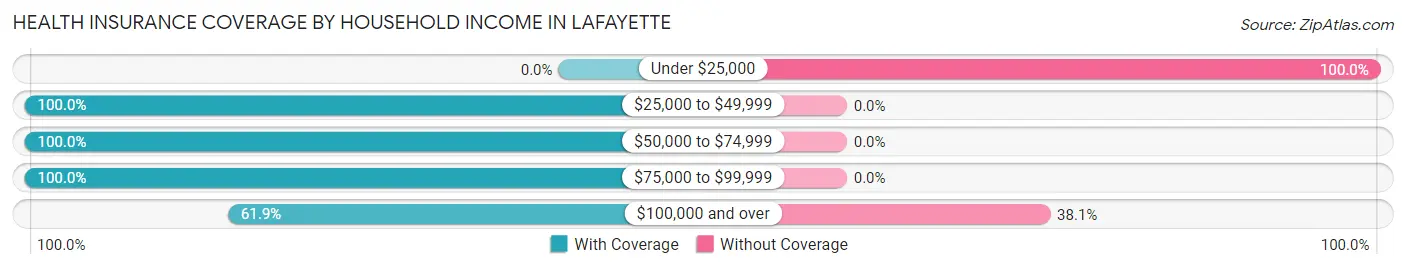
| Household Income | With Coverage | Without Coverage |
| Under $25,000 | 0 (0.0%) | 43 (100.0%) |
| $25,000 to $49,999 | 461 (100.0%) | 0 (0.0%) |
| $50,000 to $74,999 | 29 (100.0%) | 0 (0.0%) |
| $75,000 to $99,999 | 21 (100.0%) | 0 (0.0%) |
| $100,000 and over | 13 (61.9%) | 8 (38.1%) |
Public vs Private Health Insurance Coverage by Age in Lafayette
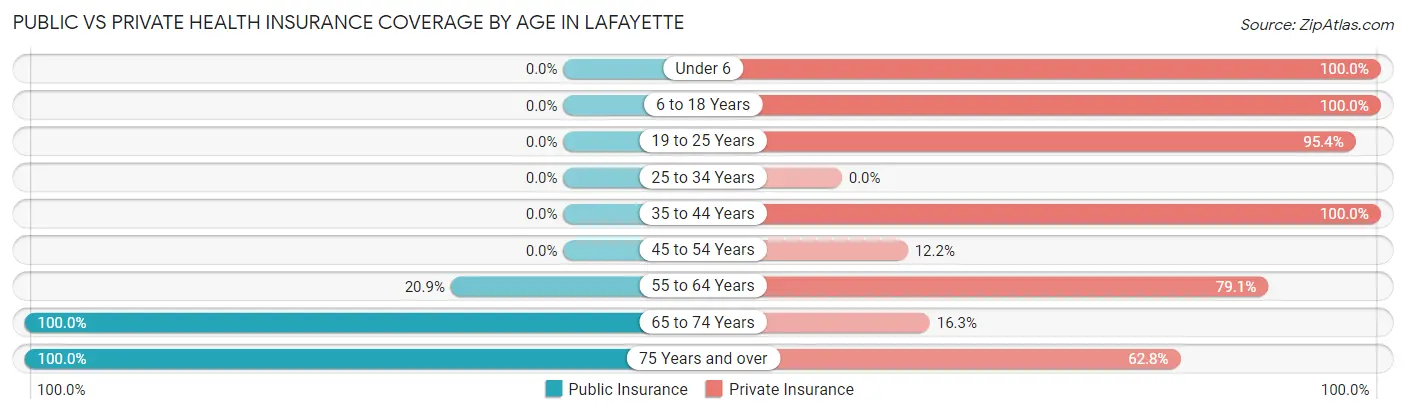
| Age Bracket | Public Insurance | Private Insurance |
| Under 6 | 0 (0.0%) | 30 (100.0%) |
| 6 to 18 Years | 0 (0.0%) | 31 (100.0%) |
| 19 to 25 Years | 0 (0.0%) | 164 (95.4%) |
| 25 to 34 Years | 0 (0.0%) | 0 (0.0%) |
| 35 to 44 Years | 0 (0.0%) | 64 (100.0%) |
| 45 to 54 Years | 0 (0.0%) | 6 (12.2%) |
| 55 to 64 Years | 14 (20.9%) | 53 (79.1%) |
| 65 to 74 Years | 49 (100.0%) | 8 (16.3%) |
| 75 Years and over | 113 (100.0%) | 71 (62.8%) |
| Total | 176 (30.6%) | 427 (74.3%) |
Disability Status by Sex by Age in Lafayette
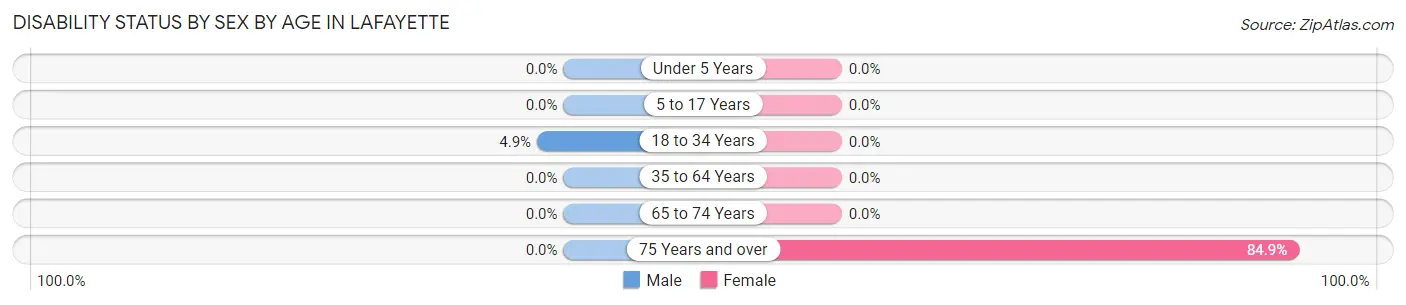
| Age Bracket | Male | Female |
| Under 5 Years | 0 (0.0%) | 0 (0.0%) |
| 5 to 17 Years | 0 (0.0%) | 0 (0.0%) |
| 18 to 34 Years | 7 (4.9%) | 0 (0.0%) |
| 35 to 64 Years | 0 (0.0%) | 0 (0.0%) |
| 65 to 74 Years | 0 (0.0%) | 0 (0.0%) |
| 75 Years and over | 0 (0.0%) | 84 (84.9%) |
Disability Class by Sex by Age in Lafayette
Disability Class: Hearing Difficulty
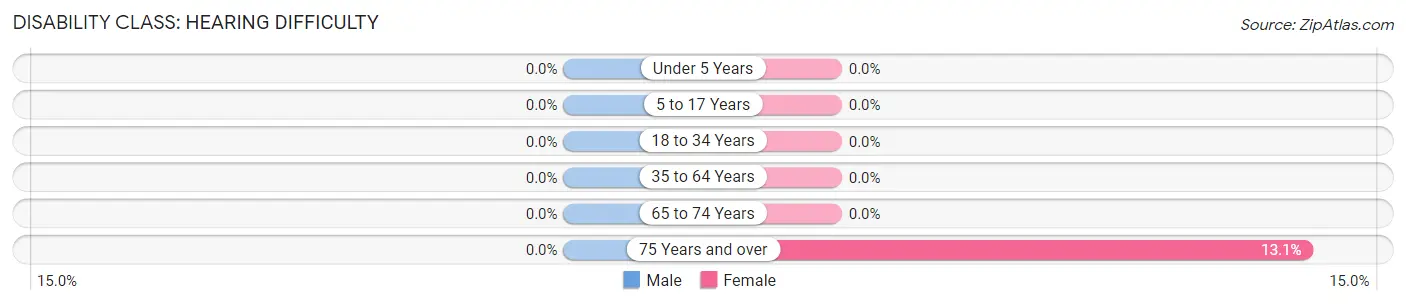
| Age Bracket | Male | Female |
| Under 5 Years | 0 (0.0%) | 0 (0.0%) |
| 5 to 17 Years | 0 (0.0%) | 0 (0.0%) |
| 18 to 34 Years | 0 (0.0%) | 0 (0.0%) |
| 35 to 64 Years | 0 (0.0%) | 0 (0.0%) |
| 65 to 74 Years | 0 (0.0%) | 0 (0.0%) |
| 75 Years and over | 0 (0.0%) | 13 (13.1%) |
Disability Class: Vision Difficulty
| Age Bracket | Male | Female |
| Under 5 Years | 0 (0.0%) | 0 (0.0%) |
| 5 to 17 Years | 0 (0.0%) | 0 (0.0%) |
| 18 to 34 Years | 0 (0.0%) | 0 (0.0%) |
| 35 to 64 Years | 0 (0.0%) | 0 (0.0%) |
| 65 to 74 Years | 0 (0.0%) | 0 (0.0%) |
| 75 Years and over | 0 (0.0%) | 0 (0.0%) |
Disability Class: Cognitive Difficulty
| Age Bracket | Male | Female |
| 5 to 17 Years | 0 (0.0%) | 0 (0.0%) |
| 18 to 34 Years | 7 (4.9%) | 0 (0.0%) |
| 35 to 64 Years | 0 (0.0%) | 0 (0.0%) |
| 65 to 74 Years | 0 (0.0%) | 0 (0.0%) |
| 75 Years and over | 0 (0.0%) | 0 (0.0%) |
Disability Class: Ambulatory Difficulty
| Age Bracket | Male | Female |
| 5 to 17 Years | 0 (0.0%) | 0 (0.0%) |
| 18 to 34 Years | 0 (0.0%) | 0 (0.0%) |
| 35 to 64 Years | 0 (0.0%) | 0 (0.0%) |
| 65 to 74 Years | 0 (0.0%) | 0 (0.0%) |
| 75 Years and over | 0 (0.0%) | 0 (0.0%) |
Disability Class: Self-Care Difficulty
| Age Bracket | Male | Female |
| 5 to 17 Years | 0 (0.0%) | 0 (0.0%) |
| 18 to 34 Years | 0 (0.0%) | 0 (0.0%) |
| 35 to 64 Years | 0 (0.0%) | 0 (0.0%) |
| 65 to 74 Years | 0 (0.0%) | 0 (0.0%) |
| 75 Years and over | 0 (0.0%) | 0 (0.0%) |
Technology Access in Lafayette
Computing Device Access in Lafayette
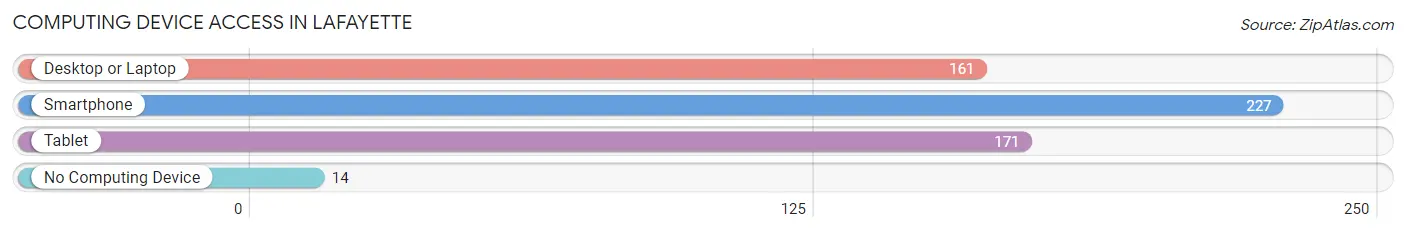
| Device Type | # Households | % Households |
| Desktop or Laptop | 161 | 64.7% |
| Smartphone | 227 | 91.2% |
| Tablet | 171 | 68.7% |
| No Computing Device | 14 | 5.6% |
| Total | 249 | 100.0% |
Internet Access in Lafayette
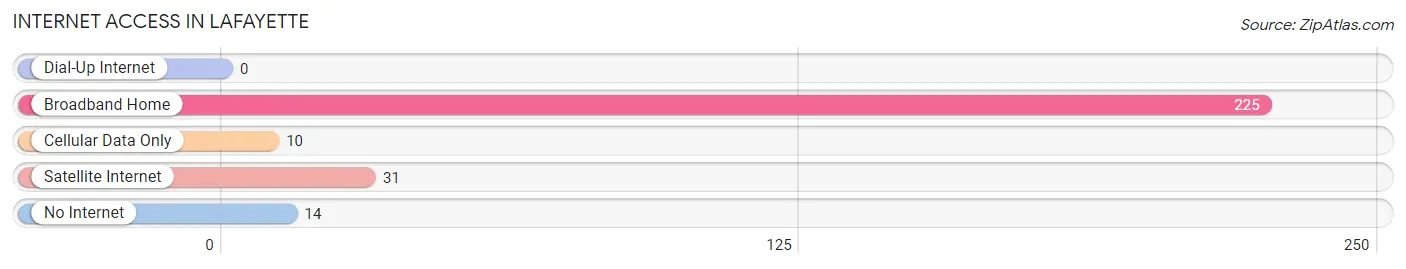
| Internet Type | # Households | % Households |
| Dial-Up Internet | 0 | 0.0% |
| Broadband Home | 225 | 90.4% |
| Cellular Data Only | 10 | 4.0% |
| Satellite Internet | 31 | 12.4% |
| No Internet | 14 | 5.6% |
| Total | 249 | 100.0% |
Lafayette Summary
Lafayette is a small town located in the state of Virginia, United States. It is situated in the northern part of the state, in the foothills of the Blue Ridge Mountains. The town is located in the county of Loudoun, and is part of the Washington Metropolitan Area. The population of Lafayette was estimated to be 1,845 in the year 2020.
History
Lafayette was first settled in the late 1700s by a group of German immigrants. The town was named after the Marquis de Lafayette, a French military officer who fought in the American Revolutionary War. The town was officially incorporated in 1883.
In the early 1900s, Lafayette was a small farming community. The town was home to several small businesses, including a general store, a blacksmith shop, and a post office. The town also had a school, a church, and a few other small businesses.
In the 1950s, the town began to experience rapid growth due to the expansion of the Washington Metropolitan Area. The population of Lafayette increased from 1,000 in 1950 to over 5,000 in 1970. The town was also home to several large businesses, including a lumber mill, a furniture factory, and a dairy farm.
Geography
Lafayette is located in the northern part of the state of Virginia, in the foothills of the Blue Ridge Mountains. The town is situated in the county of Loudoun, and is part of the Washington Metropolitan Area. The town is located approximately 30 miles west of Washington, D.C.
The terrain of Lafayette is mostly hilly, with some flat areas. The town is located at an elevation of 1,000 feet above sea level. The climate of Lafayette is humid subtropical, with hot summers and mild winters.
Economy
The economy of Lafayette is largely based on the service industry. The town is home to several small businesses, including restaurants, retail stores, and professional services. The town is also home to several large businesses, including a lumber mill, a furniture factory, and a dairy farm.
The town is also home to several government agencies, including the Loudoun County Sheriff’s Office, the Loudoun County Fire and Rescue Department, and the Loudoun County Public Schools.
Demographics
The population of Lafayette was estimated to be 1,845 in the year 2020. The town has a diverse population, with people of various racial and ethnic backgrounds. The majority of the population is white (77.3%), followed by African American (14.2%), Asian (4.2%), and Hispanic or Latino (2.3%).
The median household income in Lafayette is $90,845, and the median home value is $521,000. The town has a low unemployment rate of 3.2%. The town also has a high rate of homeownership, with over 80% of the population owning their own homes.
Conclusion
Lafayette is a small town located in the state of Virginia, United States. It is situated in the northern part of the state, in the foothills of the Blue Ridge Mountains. The town is located in the county of Loudoun, and is part of the Washington Metropolitan Area. The population of Lafayette was estimated to be 1,845 in the year 2020. The town has a diverse population, with people of various racial and ethnic backgrounds. The economy of Lafayette is largely based on the service industry, with several small businesses and large businesses located in the town. The median household income in Lafayette is $90,845, and the median home value is $521,000. The town has a low unemployment rate of 3.2%.
Common Questions
What is Per Capita Income in Lafayette?
Per Capita income in Lafayette is $18,204.
What is the Median Family Income in Lafayette?
Median Family Income in Lafayette is $31,250.
What is the Median Household income in Lafayette?
Median Household Income in Lafayette is $32,412.
What is Inequality or Gini Index in Lafayette?
Inequality or Gini Index in Lafayette is 0.37.
What is the Total Population of Lafayette?
Total Population of Lafayette is 582.
What is the Total Male Population of Lafayette?
Total Male Population of Lafayette is 338.
What is the Total Female Population of Lafayette?
Total Female Population of Lafayette is 244.
What is the Ratio of Males per 100 Females in Lafayette?
There are 138.52 Males per 100 Females in Lafayette.
What is the Ratio of Females per 100 Males in Lafayette?
There are 72.19 Females per 100 Males in Lafayette.
What is the Median Population Age in Lafayette?
Median Population Age in Lafayette is 42.8 Years.
What is the Average Family Size in Lafayette
Average Family Size in Lafayette is 2.7 People.
What is the Average Household Size in Lafayette
Average Household Size in Lafayette is 2.3 People.
How Large is the Labor Force in Lafayette?
There are 300 People in the Labor Forcein in Lafayette.
What is the Percentage of People in the Labor Force in Lafayette?
57.6% of People are in the Labor Force in Lafayette.
What is the Unemployment Rate in Lafayette?
Unemployment Rate in Lafayette is 61.1%.