Apple Mountain Lake, VA Map & Demographics
Apple Mountain Lake Map
Apple Mountain Lake Overview
$36,616
PER CAPITA INCOME
$107,708
AVG FAMILY INCOME
$120,539
AVG HOUSEHOLD INCOME
36.4%
WAGE / INCOME GAP [ % ]
63.6¢/ $1
WAGE / INCOME GAP [ $ ]
0.27
INEQUALITY / GINI INDEX
1,584
TOTAL POPULATION
933
MALE POPULATION
651
FEMALE POPULATION
143.32
MALES / 100 FEMALES
69.77
FEMALES / 100 MALES
35.9
MEDIAN AGE
3.2
AVG FAMILY SIZE
3.2
AVG HOUSEHOLD SIZE
893
LABOR FORCE [ PEOPLE ]
66.7%
PERCENT IN LABOR FORCE
1.9%
UNEMPLOYMENT RATE
Income in Apple Mountain Lake
Income Overview in Apple Mountain Lake
Per Capita Income in Apple Mountain Lake is $36,616, while median incomes of families and households are $107,708 and $120,539 respectively.
| Characteristic | Number | Measure |
| Per Capita Income | 1,584 | $36,616 |
| Median Family Income | 445 | $107,708 |
| Mean Family Income | 445 | $114,937 |
| Median Household Income | 492 | $120,539 |
| Mean Household Income | 492 | $117,533 |
| Income Deficit | 445 | $0 |
| Wage / Income Gap (%) | 1,584 | 36.44% |
| Wage / Income Gap ($) | 1,584 | 63.56¢ per $1 |
| Gini / Inequality Index | 1,584 | 0.27 |
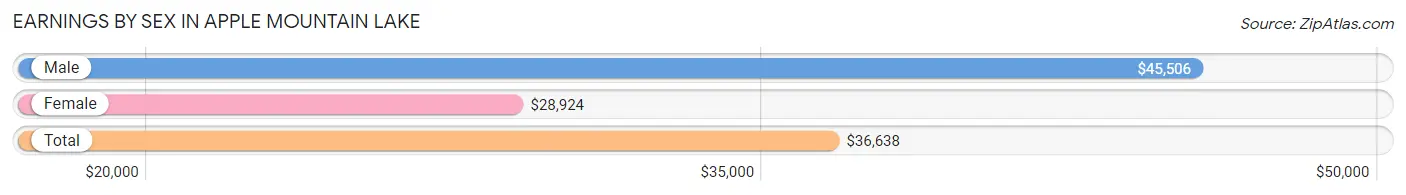
Earnings by Sex in Apple Mountain Lake
Average Earnings in Apple Mountain Lake are $36,638, $45,506 for men and $28,924 for women, a difference of 36.4%.
| Sex | Number | Average Earnings |
| Male | 585 (63.4%) | $45,506 |
| Female | 337 (36.5%) | $28,924 |
| Total | 922 (100.0%) | $36,638 |
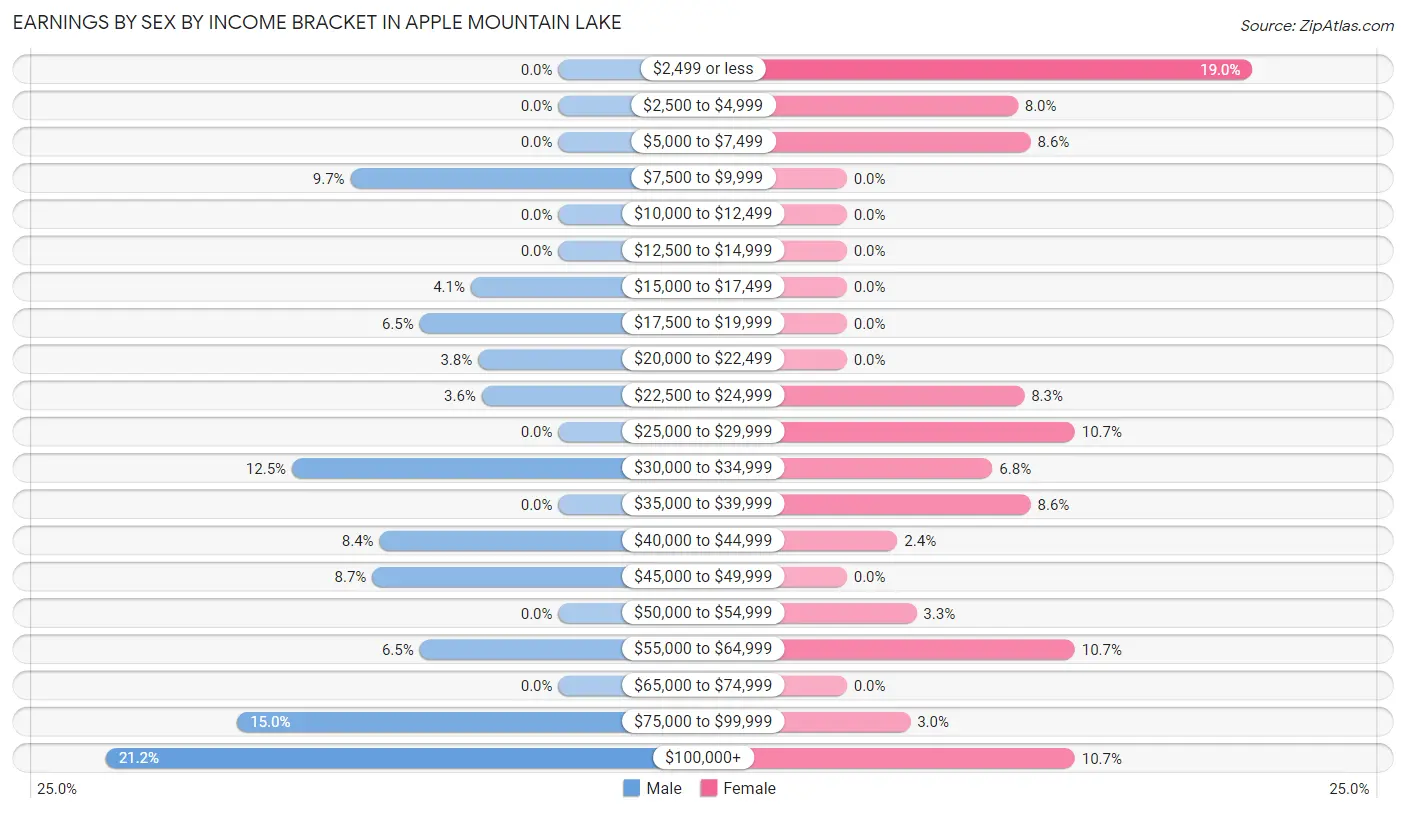
Earnings by Sex by Income Bracket in Apple Mountain Lake
The most common earnings brackets in Apple Mountain Lake are $100,000+ for men (124 | 21.2%) and $2,499 or less for women (64 | 19.0%).
| Income | Male | Female |
| $2,499 or less | 0 (0.0%) | 64 (19.0%) |
| $2,500 to $4,999 | 0 (0.0%) | 27 (8.0%) |
| $5,000 to $7,499 | 0 (0.0%) | 29 (8.6%) |
| $7,500 to $9,999 | 57 (9.7%) | 0 (0.0%) |
| $10,000 to $12,499 | 0 (0.0%) | 0 (0.0%) |
| $12,500 to $14,999 | 0 (0.0%) | 0 (0.0%) |
| $15,000 to $17,499 | 24 (4.1%) | 0 (0.0%) |
| $17,500 to $19,999 | 38 (6.5%) | 0 (0.0%) |
| $20,000 to $22,499 | 22 (3.8%) | 0 (0.0%) |
| $22,500 to $24,999 | 21 (3.6%) | 28 (8.3%) |
| $25,000 to $29,999 | 0 (0.0%) | 36 (10.7%) |
| $30,000 to $34,999 | 73 (12.5%) | 23 (6.8%) |
| $35,000 to $39,999 | 0 (0.0%) | 29 (8.6%) |
| $40,000 to $44,999 | 49 (8.4%) | 8 (2.4%) |
| $45,000 to $49,999 | 51 (8.7%) | 0 (0.0%) |
| $50,000 to $54,999 | 0 (0.0%) | 11 (3.3%) |
| $55,000 to $64,999 | 38 (6.5%) | 36 (10.7%) |
| $65,000 to $74,999 | 0 (0.0%) | 0 (0.0%) |
| $75,000 to $99,999 | 88 (15.0%) | 10 (3.0%) |
| $100,000+ | 124 (21.2%) | 36 (10.7%) |
| Total | 585 (100.0%) | 337 (100.0%) |
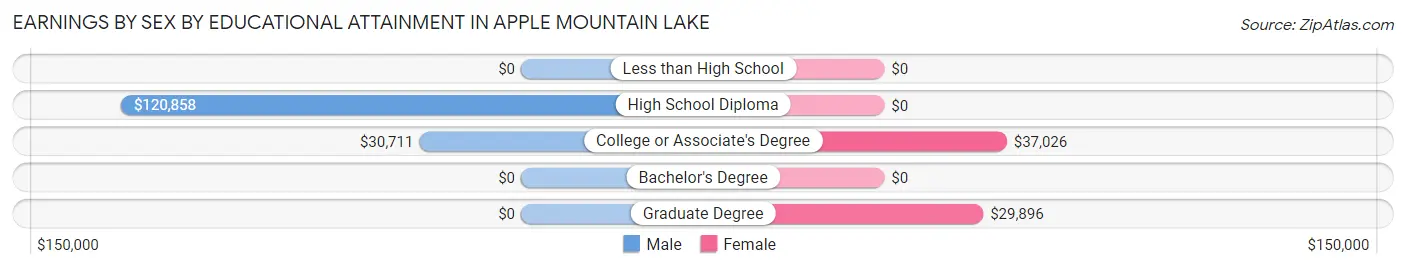
Earnings by Sex by Educational Attainment in Apple Mountain Lake
Average earnings in Apple Mountain Lake are $62,829 for men and $34,022 for women, a difference of 45.9%. Men with an educational attainment of high school diploma enjoy the highest average annual earnings of $120,858, while those with college or associate's degree education earn the least with $30,711. Women with an educational attainment of college or associate's degree earn the most with the average annual earnings of $37,026, while those with graduate degree education have the smallest earnings of $29,896.
| Educational Attainment | Male Income | Female Income |
| Less than High School | - | - |
| High School Diploma | $120,858 | $0 |
| College or Associate's Degree | $30,711 | $37,026 |
| Bachelor's Degree | - | - |
| Graduate Degree | - | - |
| Total | $62,829 | $34,022 |
Family Income in Apple Mountain Lake
Family Income Brackets in Apple Mountain Lake
According to the Apple Mountain Lake family income data, there are 136 families falling into the $150,000 to $199,999 income range, which is the most common income bracket and makes up 30.6% of all families.
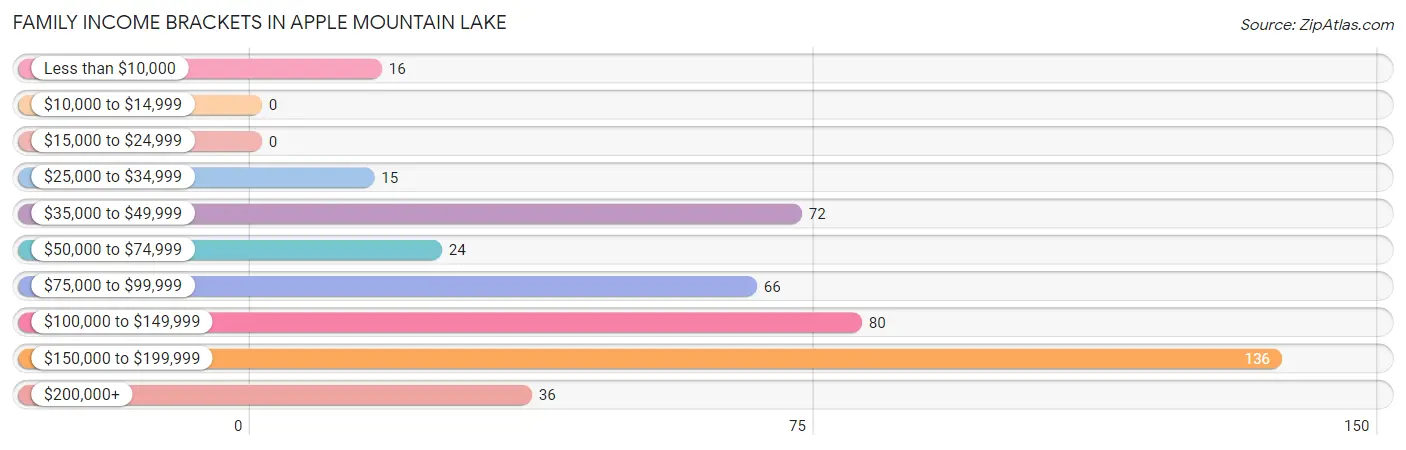
| Income Bracket | # Families | % Families |
| Less than $10,000 | 16 | 3.6% |
| $10,000 to $14,999 | 0 | 0.0% |
| $15,000 to $24,999 | 0 | 0.0% |
| $25,000 to $34,999 | 15 | 3.4% |
| $35,000 to $49,999 | 72 | 16.2% |
| $50,000 to $74,999 | 24 | 5.4% |
| $75,000 to $99,999 | 66 | 14.8% |
| $100,000 to $149,999 | 80 | 18.0% |
| $150,000 to $199,999 | 136 | 30.6% |
| $200,000+ | 36 | 8.1% |
Family Income by Famaliy Size in Apple Mountain Lake
4-person families (169 | 38.0%) account for the highest median family income in Apple Mountain Lake with $165,625 per family, while 4-person families (169 | 38.0%) have the highest median income of $41,406 per family member.
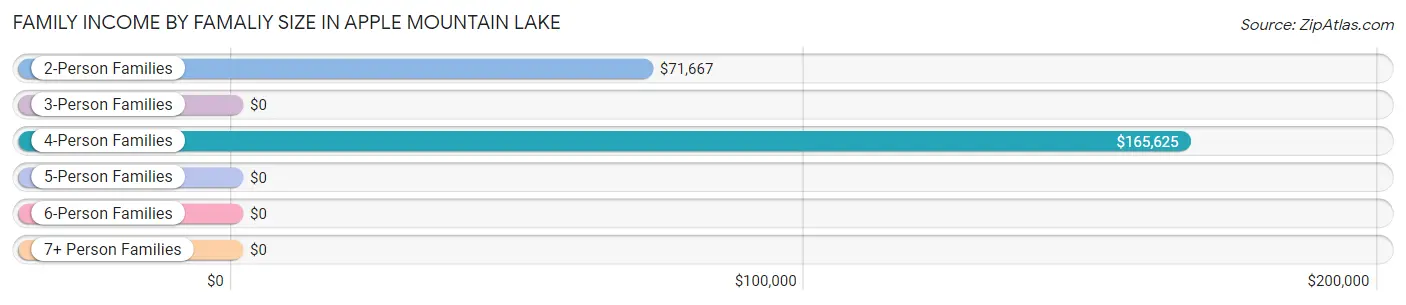
| Income Bracket | # Families | Median Income |
| 2-Person Families | 194 (43.6%) | $71,667 |
| 3-Person Families | 22 (4.9%) | $0 |
| 4-Person Families | 169 (38.0%) | $165,625 |
| 5-Person Families | 60 (13.5%) | $0 |
| 6-Person Families | 0 (0.0%) | $0 |
| 7+ Person Families | 0 (0.0%) | $0 |
| Total | 445 (100.0%) | $107,708 |
Family Income by Number of Earners in Apple Mountain Lake
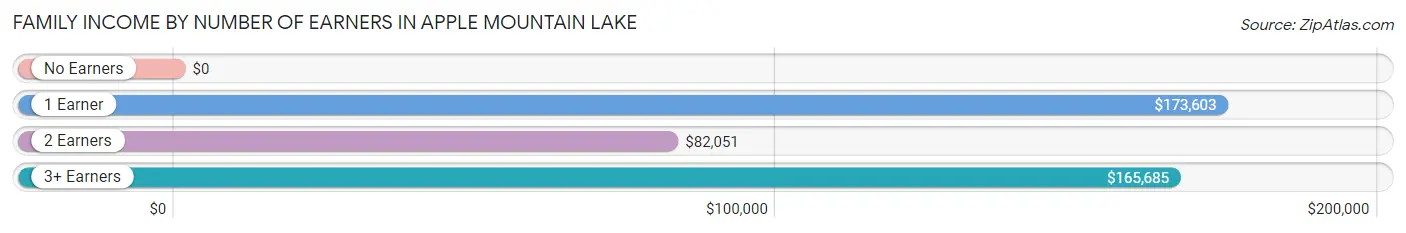
| Number of Earners | # Families | Median Income |
| No Earners | 55 (12.4%) | $0 |
| 1 Earner | 91 (20.4%) | $173,603 |
| 2 Earners | 166 (37.3%) | $82,051 |
| 3+ Earners | 133 (29.9%) | $165,685 |
| Total | 445 (100.0%) | $107,708 |
Household Income in Apple Mountain Lake
Household Income Brackets in Apple Mountain Lake
With 136 households falling in the category, the $150,000 to $199,999 income range is the most frequent in Apple Mountain Lake, accounting for 27.6% of all households.
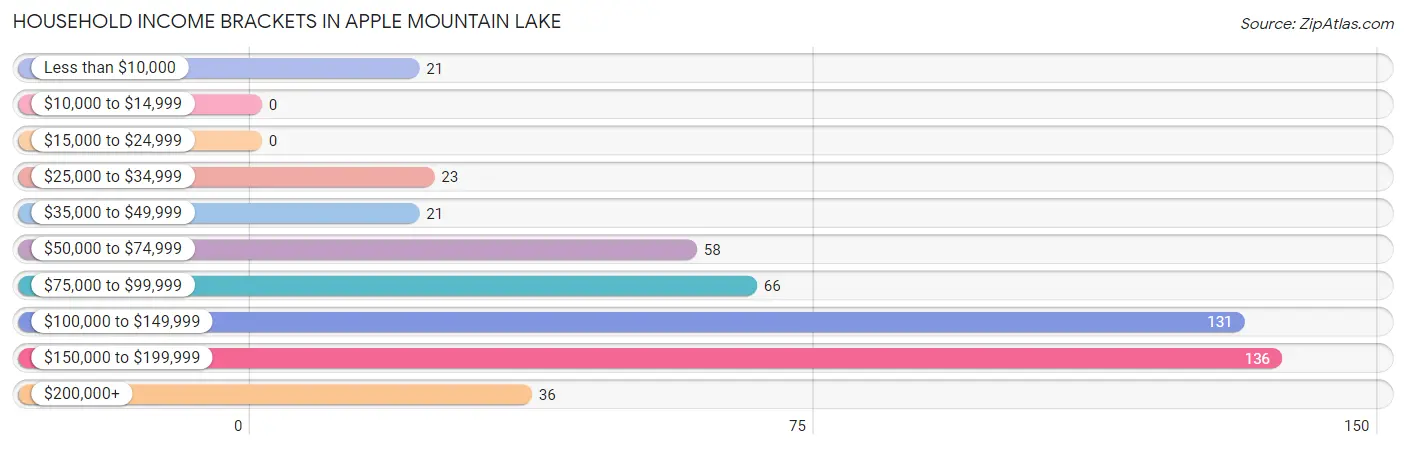
| Income Bracket | # Households | % Households |
| Less than $10,000 | 21 | 4.3% |
| $10,000 to $14,999 | 0 | 0.0% |
| $15,000 to $24,999 | 0 | 0.0% |
| $25,000 to $34,999 | 23 | 4.7% |
| $35,000 to $49,999 | 21 | 4.3% |
| $50,000 to $74,999 | 58 | 11.8% |
| $75,000 to $99,999 | 66 | 13.4% |
| $100,000 to $149,999 | 131 | 26.6% |
| $150,000 to $199,999 | 136 | 27.6% |
| $200,000+ | 36 | 7.3% |
Household Income by Householder Age in Apple Mountain Lake
The median household income in Apple Mountain Lake is $120,539, with the highest median household income of $138,750 found in the 45 to 64 years age bracket for the primary householder. A total of 177 households (36.0%) fall into this category.
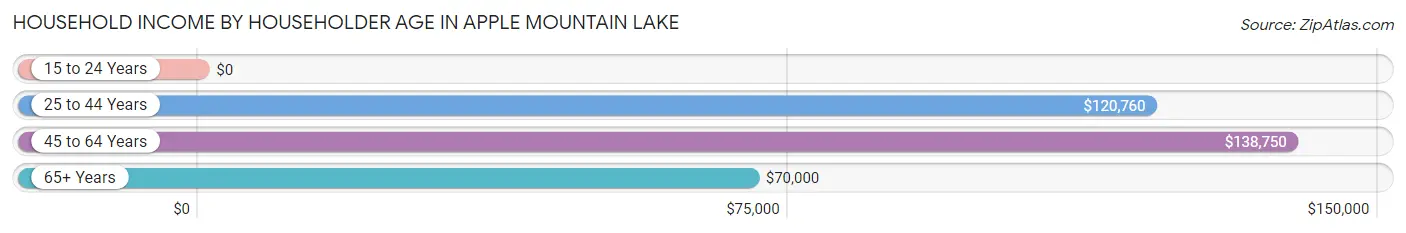
| Income Bracket | # Households | Median Income |
| 15 to 24 Years | 0 (0.0%) | $0 |
| 25 to 44 Years | 183 (37.2%) | $120,760 |
| 45 to 64 Years | 177 (36.0%) | $138,750 |
| 65+ Years | 132 (26.8%) | $70,000 |
| Total | 492 (100.0%) | $120,539 |
Poverty in Apple Mountain Lake
Income Below Poverty by Sex and Age in Apple Mountain Lake
With 11.5% poverty level for males and 7.7% for females among the residents of Apple Mountain Lake, 45 to 54 year old males and 16 and 17 year old females are the most vulnerable to poverty, with 54 males (39.7%) and 14 females (26.9%) in their respective age groups living below the poverty level.
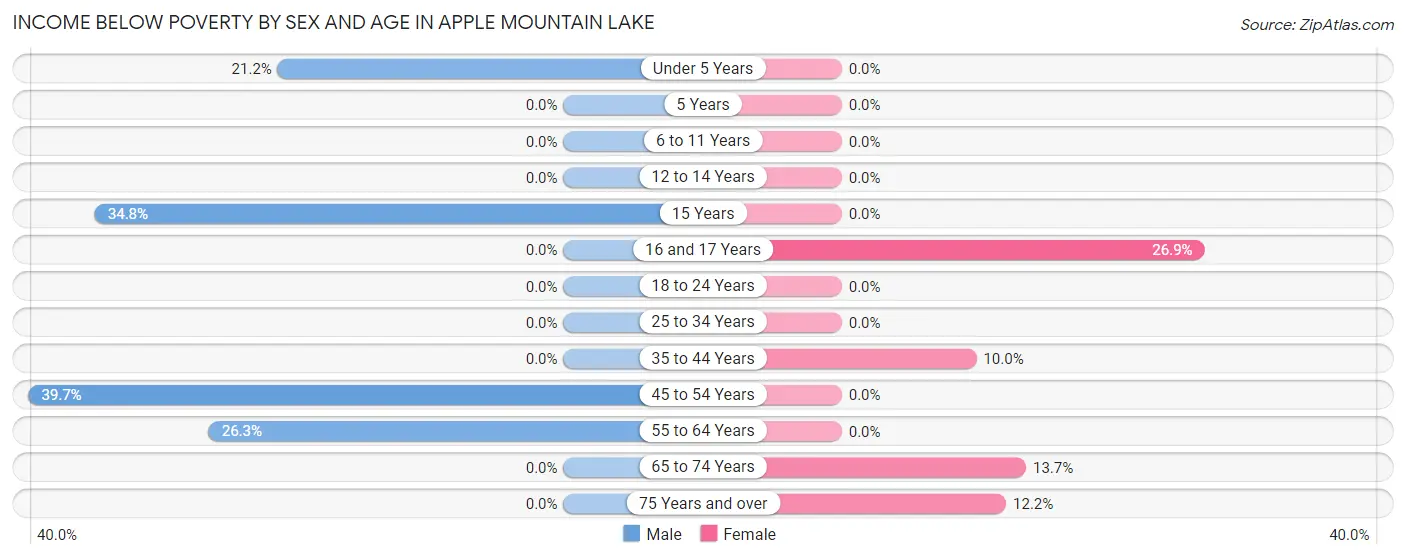
| Age Bracket | Male | Female |
| Under 5 Years | 14 (21.2%) | 0 (0.0%) |
| 5 Years | 0 (0.0%) | 0 (0.0%) |
| 6 to 11 Years | 0 (0.0%) | 0 (0.0%) |
| 12 to 14 Years | 0 (0.0%) | 0 (0.0%) |
| 15 Years | 24 (34.8%) | 0 (0.0%) |
| 16 and 17 Years | 0 (0.0%) | 14 (26.9%) |
| 18 to 24 Years | 0 (0.0%) | 0 (0.0%) |
| 25 to 34 Years | 0 (0.0%) | 0 (0.0%) |
| 35 to 44 Years | 0 (0.0%) | 15 (10.0%) |
| 45 to 54 Years | 54 (39.7%) | 0 (0.0%) |
| 55 to 64 Years | 15 (26.3%) | 0 (0.0%) |
| 65 to 74 Years | 0 (0.0%) | 16 (13.7%) |
| 75 Years and over | 0 (0.0%) | 5 (12.2%) |
| Total | 107 (11.5%) | 50 (7.7%) |
Income Above Poverty by Sex and Age in Apple Mountain Lake
According to the poverty statistics in Apple Mountain Lake, males aged 6 to 11 years and females aged under 5 years are the age groups that are most secure financially, with 100.0% of males and 100.0% of females in these age groups living above the poverty line.
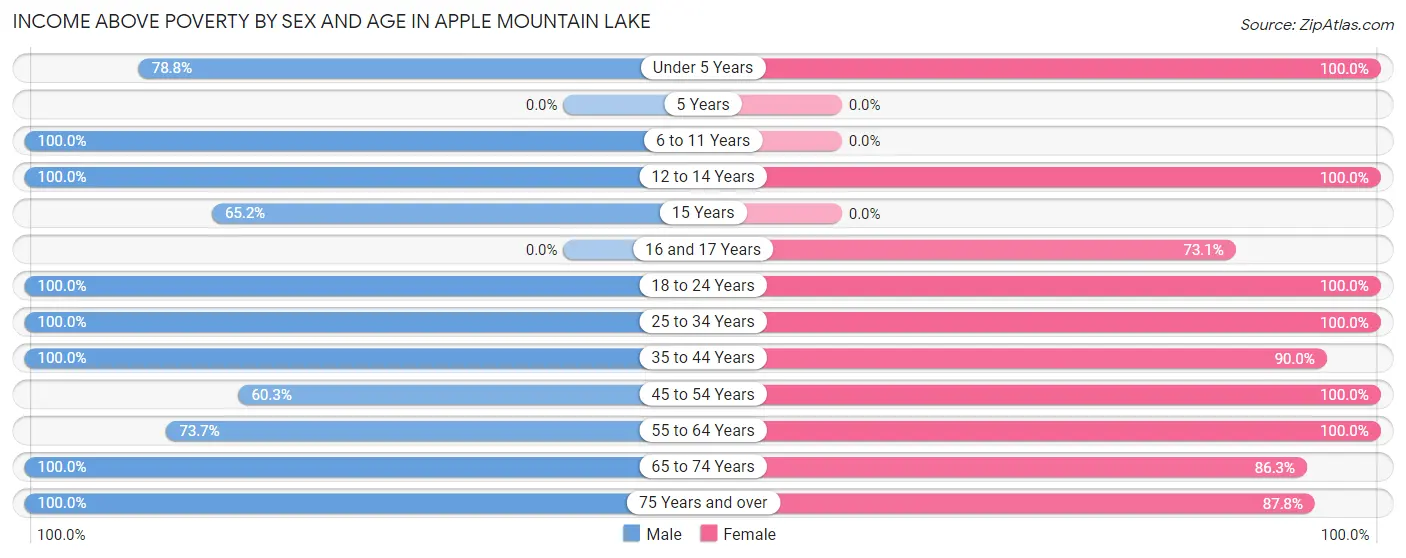
| Age Bracket | Male | Female |
| Under 5 Years | 52 (78.8%) | 9 (100.0%) |
| 5 Years | 0 (0.0%) | 0 (0.0%) |
| 6 to 11 Years | 53 (100.0%) | 0 (0.0%) |
| 12 to 14 Years | 41 (100.0%) | 7 (100.0%) |
| 15 Years | 45 (65.2%) | 0 (0.0%) |
| 16 and 17 Years | 0 (0.0%) | 38 (73.1%) |
| 18 to 24 Years | 150 (100.0%) | 39 (100.0%) |
| 25 to 34 Years | 153 (100.0%) | 90 (100.0%) |
| 35 to 44 Years | 119 (100.0%) | 135 (90.0%) |
| 45 to 54 Years | 82 (60.3%) | 90 (100.0%) |
| 55 to 64 Years | 42 (73.7%) | 56 (100.0%) |
| 65 to 74 Years | 83 (100.0%) | 101 (86.3%) |
| 75 Years and over | 6 (100.0%) | 36 (87.8%) |
| Total | 826 (88.5%) | 601 (92.3%) |
Income Below Poverty Among Married-Couple Families in Apple Mountain Lake
The poverty statistics for married-couple families in Apple Mountain Lake show that 4.6% or 15 of the total 323 families live below the poverty line. Families with 3 or 4 children have the highest poverty rate of 36.6%, comprising of 15 families. On the other hand, families with no children have the lowest poverty rate of 0.0%, which includes 0 families.
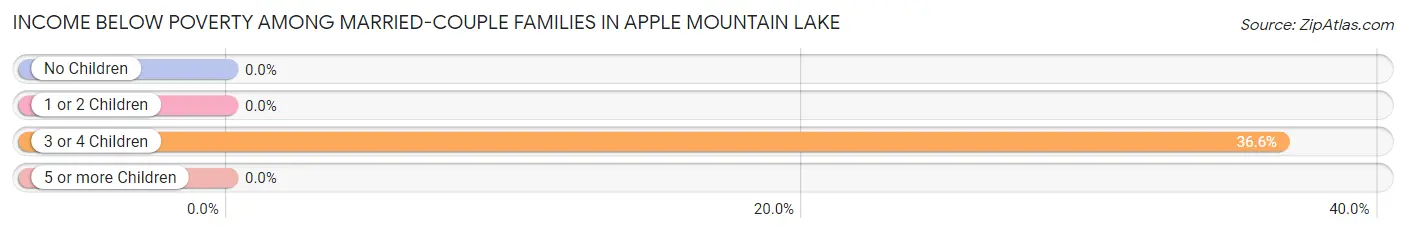
| Children | Above Poverty | Below Poverty |
| No Children | 169 (100.0%) | 0 (0.0%) |
| 1 or 2 Children | 113 (100.0%) | 0 (0.0%) |
| 3 or 4 Children | 26 (63.4%) | 15 (36.6%) |
| 5 or more Children | 0 (0.0%) | 0 (0.0%) |
| Total | 308 (95.4%) | 15 (4.6%) |
Income Below Poverty Among Single-Parent Households in Apple Mountain Lake
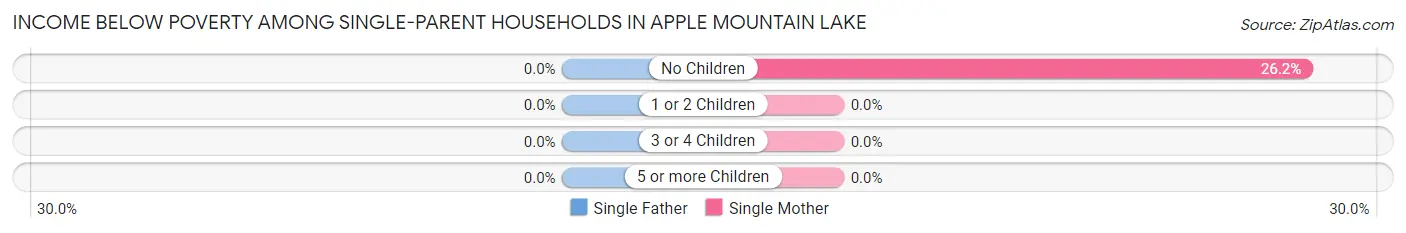
| Children | Single Father | Single Mother |
| No Children | 0 (0.0%) | 16 (26.2%) |
| 1 or 2 Children | 0 (0.0%) | 0 (0.0%) |
| 3 or 4 Children | 0 (0.0%) | 0 (0.0%) |
| 5 or more Children | 0 (0.0%) | 0 (0.0%) |
| Total | 0 (0.0%) | 16 (22.5%) |
Income Below Poverty Among Married-Couple vs Single-Parent Households in Apple Mountain Lake
The poverty data for Apple Mountain Lake shows that 15 of the married-couple family households (4.6%) and 16 of the single-parent households (13.1%) are living below the poverty level. Within the married-couple family households, those with 3 or 4 children have the highest poverty rate, with 15 households (36.6%) falling below the poverty line. Among the single-parent households, those with no children have the highest poverty rate, with 16 household (14.3%) living below poverty.
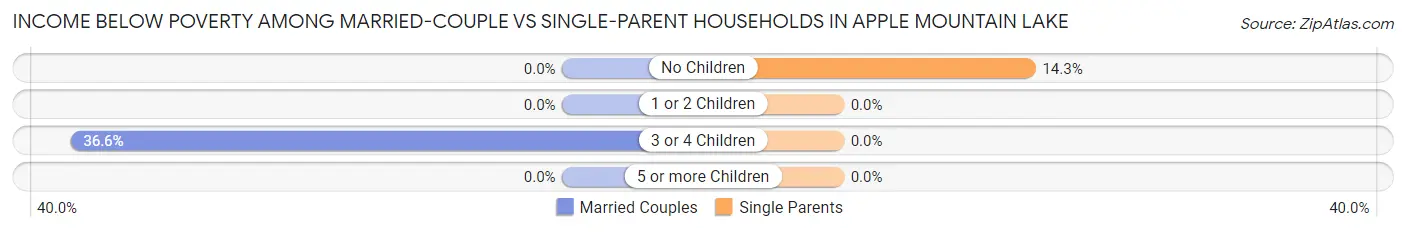
| Children | Married-Couple Families | Single-Parent Households |
| No Children | 0 (0.0%) | 16 (14.3%) |
| 1 or 2 Children | 0 (0.0%) | 0 (0.0%) |
| 3 or 4 Children | 15 (36.6%) | 0 (0.0%) |
| 5 or more Children | 0 (0.0%) | 0 (0.0%) |
| Total | 15 (4.6%) | 16 (13.1%) |
Race in Apple Mountain Lake
The most populous races in Apple Mountain Lake are White / Caucasian (1,148 | 72.5%), Hispanic or Latino (249 | 15.7%), and Two or more Races (162 | 10.2%).
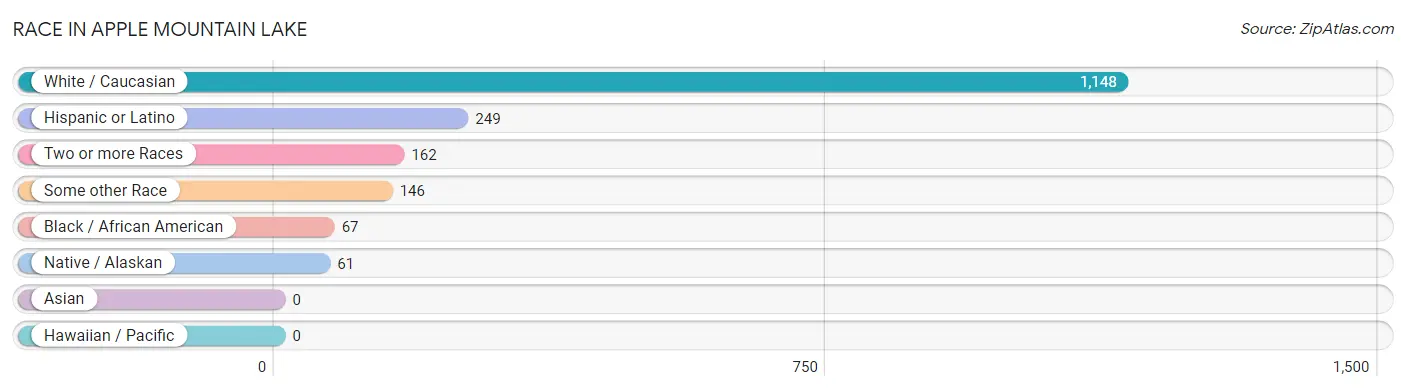
| Race | # Population | % Population |
| Asian | 0 | 0.0% |
| Black / African American | 67 | 4.2% |
| Hawaiian / Pacific | 0 | 0.0% |
| Hispanic or Latino | 249 | 15.7% |
| Native / Alaskan | 61 | 3.8% |
| White / Caucasian | 1,148 | 72.5% |
| Two or more Races | 162 | 10.2% |
| Some other Race | 146 | 9.2% |
| Total | 1,584 | 100.0% |
Ancestry in Apple Mountain Lake
The most populous ancestries reported in Apple Mountain Lake are Irish (371 | 23.4%), German (198 | 12.5%), Mexican (85 | 5.4%), Apache (61 | 3.8%), and English (49 | 3.1%), together accounting for 48.2% of all Apple Mountain Lake residents.
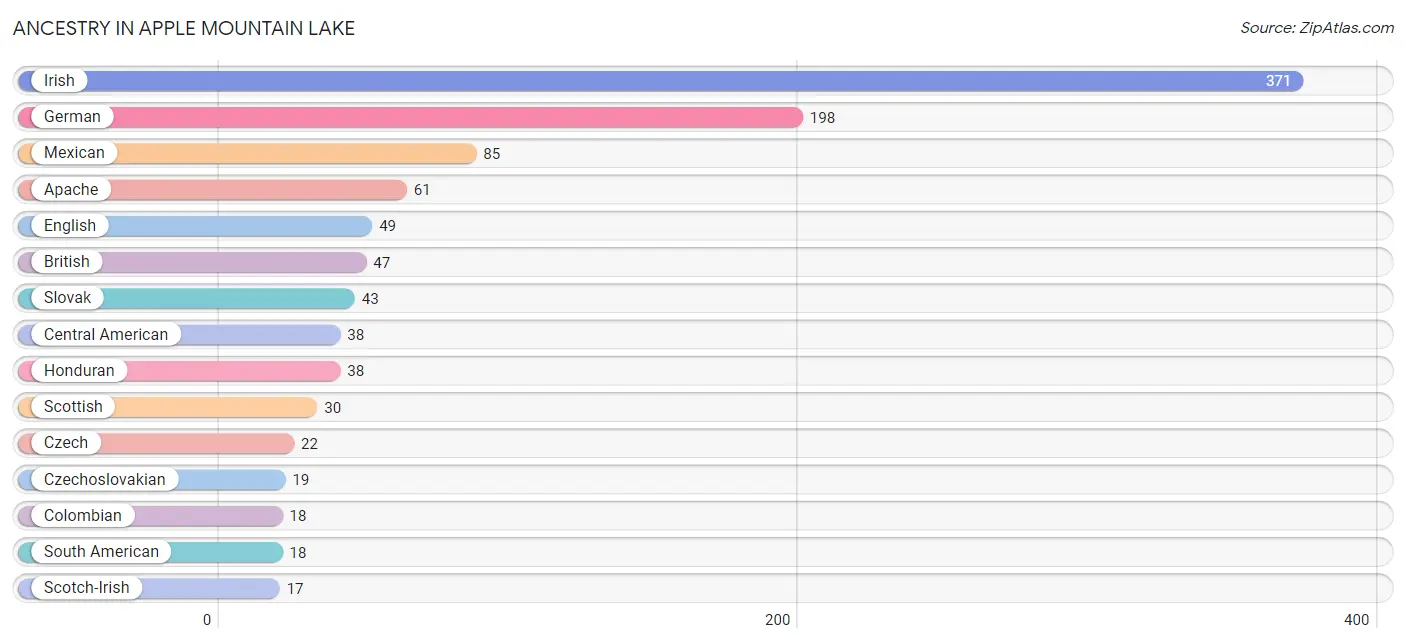
| Ancestry | # Population | % Population |
| American | 14 | 0.9% |
| Apache | 61 | 3.8% |
| British | 47 | 3.0% |
| Central American | 38 | 2.4% |
| Cherokee | 3 | 0.2% |
| Colombian | 18 | 1.1% |
| Czech | 22 | 1.4% |
| Czechoslovakian | 19 | 1.2% |
| Dutch | 8 | 0.5% |
| English | 49 | 3.1% |
| German | 198 | 12.5% |
| Honduran | 38 | 2.4% |
| Irish | 371 | 23.4% |
| Italian | 10 | 0.6% |
| Mexican | 85 | 5.4% |
| Scotch-Irish | 17 | 1.1% |
| Scottish | 30 | 1.9% |
| Slovak | 43 | 2.7% |
| South American | 18 | 1.1% |
| Welsh | 5 | 0.3% | View All 20 Rows |
Immigrants in Apple Mountain Lake
The most numerous immigrant groups reported in Apple Mountain Lake came from Latin America (146 | 9.2%), Bolivia (108 | 6.8%), South America (108 | 6.8%), Central America (38 | 2.4%), and Honduras (38 | 2.4%), together accounting for 27.7% of all Apple Mountain Lake residents.
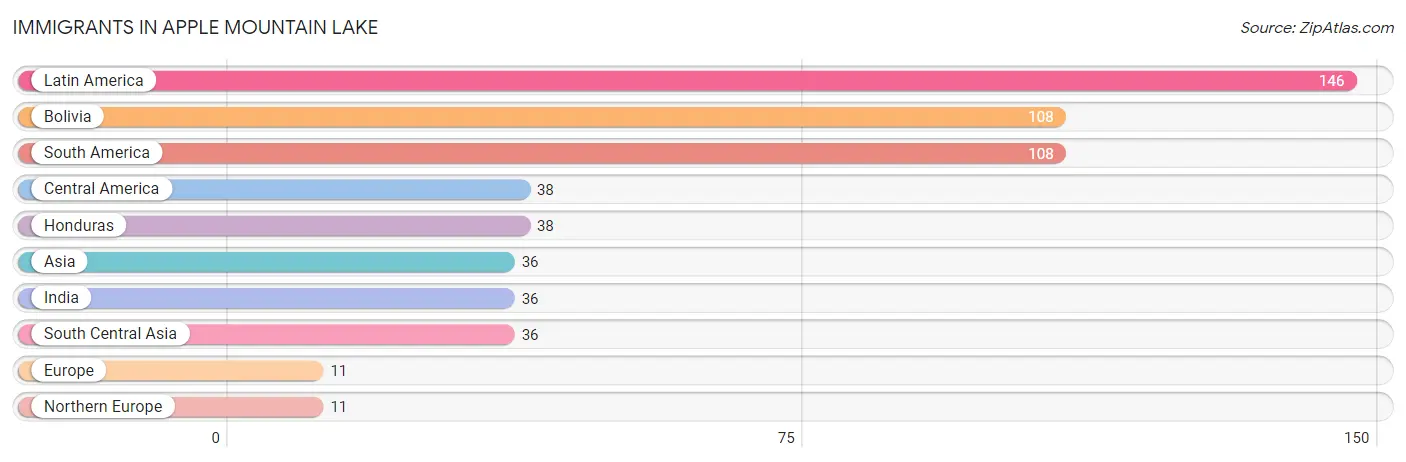
| Immigration Origin | # Population | % Population |
| Asia | 36 | 2.3% |
| Bolivia | 108 | 6.8% |
| Central America | 38 | 2.4% |
| Europe | 11 | 0.7% |
| Honduras | 38 | 2.4% |
| India | 36 | 2.3% |
| Latin America | 146 | 9.2% |
| Northern Europe | 11 | 0.7% |
| South America | 108 | 6.8% |
| South Central Asia | 36 | 2.3% | View All 10 Rows |
Sex and Age in Apple Mountain Lake
Sex and Age in Apple Mountain Lake
The most populous age groups in Apple Mountain Lake are 20 to 24 Years (128 | 13.7%) for men and 65 to 69 Years (117 | 18.0%) for women.
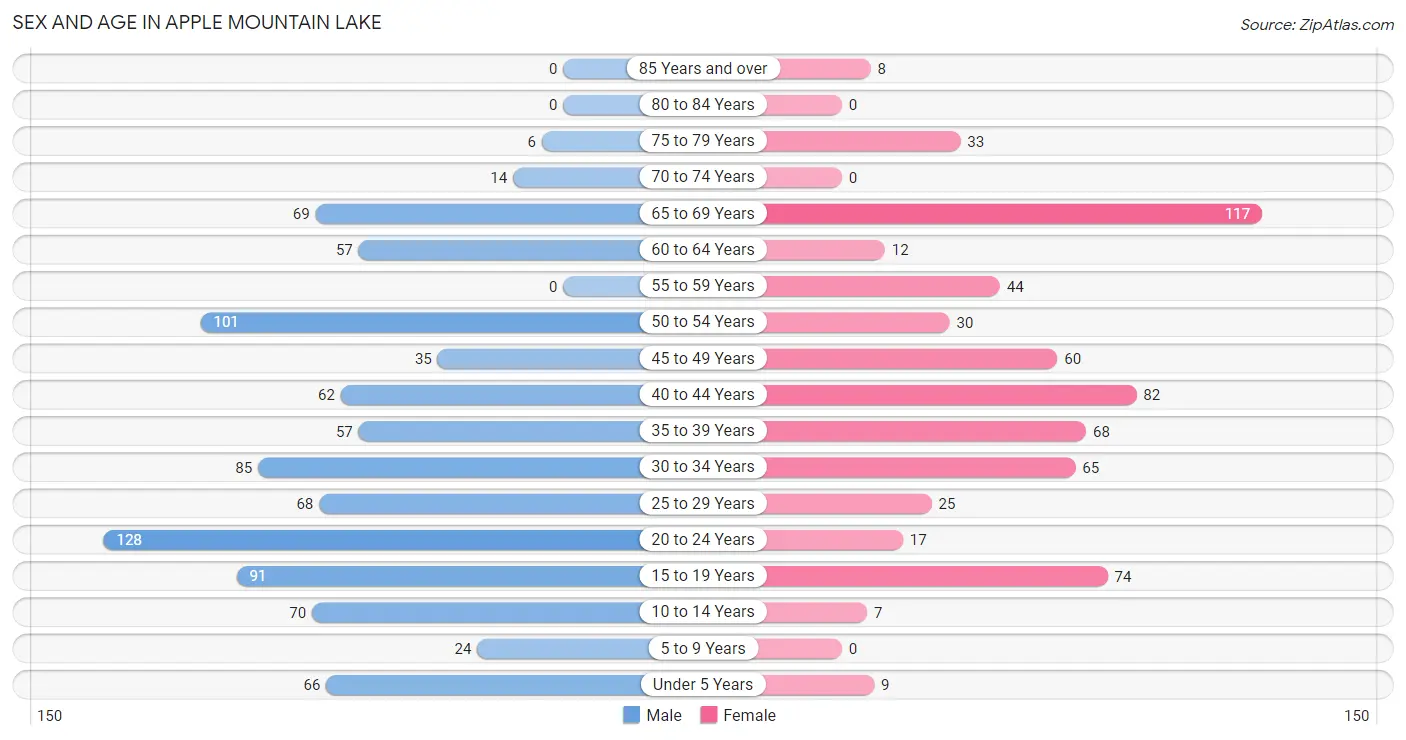
| Age Bracket | Male | Female |
| Under 5 Years | 66 (7.1%) | 9 (1.4%) |
| 5 to 9 Years | 24 (2.6%) | 0 (0.0%) |
| 10 to 14 Years | 70 (7.5%) | 7 (1.1%) |
| 15 to 19 Years | 91 (9.8%) | 74 (11.4%) |
| 20 to 24 Years | 128 (13.7%) | 17 (2.6%) |
| 25 to 29 Years | 68 (7.3%) | 25 (3.8%) |
| 30 to 34 Years | 85 (9.1%) | 65 (10.0%) |
| 35 to 39 Years | 57 (6.1%) | 68 (10.4%) |
| 40 to 44 Years | 62 (6.7%) | 82 (12.6%) |
| 45 to 49 Years | 35 (3.7%) | 60 (9.2%) |
| 50 to 54 Years | 101 (10.8%) | 30 (4.6%) |
| 55 to 59 Years | 0 (0.0%) | 44 (6.8%) |
| 60 to 64 Years | 57 (6.1%) | 12 (1.8%) |
| 65 to 69 Years | 69 (7.4%) | 117 (18.0%) |
| 70 to 74 Years | 14 (1.5%) | 0 (0.0%) |
| 75 to 79 Years | 6 (0.6%) | 33 (5.1%) |
| 80 to 84 Years | 0 (0.0%) | 0 (0.0%) |
| 85 Years and over | 0 (0.0%) | 8 (1.2%) |
| Total | 933 (100.0%) | 651 (100.0%) |
Families and Households in Apple Mountain Lake
Median Family Size in Apple Mountain Lake
The median family size in Apple Mountain Lake is 3.23 persons per family, with married-couple families (323 | 72.6%) accounting for the largest median family size of 3.42 persons per family. On the other hand, single male/father families (51 | 11.5%) represent the smallest median family size with 2.12 persons per family.
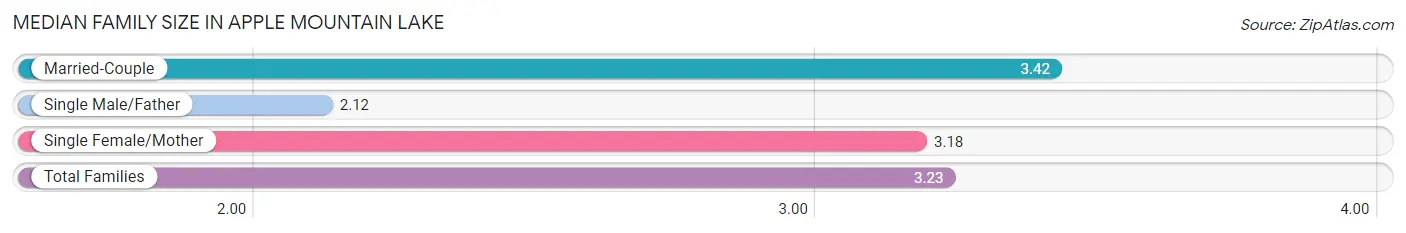
| Family Type | # Families | Family Size |
| Married-Couple | 323 (72.6%) | 3.42 |
| Single Male/Father | 51 (11.5%) | 2.12 |
| Single Female/Mother | 71 (16.0%) | 3.18 |
| Total Families | 445 (100.0%) | 3.23 |
Median Household Size in Apple Mountain Lake
The median household size in Apple Mountain Lake is 3.22 persons per household, with married-couple households (323 | 65.6%) accounting for the largest median household size of 3.42 persons per household. non-family households (47 | 9.6%) represent the smallest median household size with 1.81 persons per household.
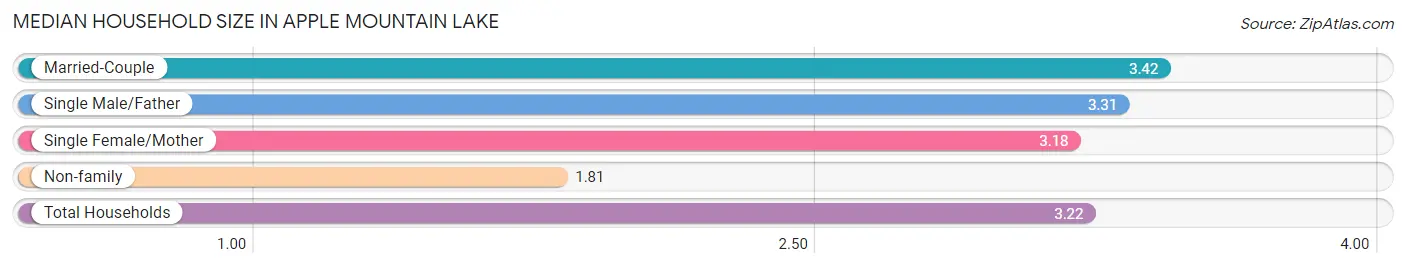
| Household Type | # Households | Household Size |
| Married-Couple | 323 (65.6%) | 3.42 |
| Single Male/Father | 51 (10.4%) | 3.31 |
| Single Female/Mother | 71 (14.4%) | 3.18 |
| Non-family | 47 (9.6%) | 1.81 |
| Total Households | 492 (100.0%) | 3.22 |
Household Size by Marriage Status in Apple Mountain Lake
Out of a total of 492 households in Apple Mountain Lake, 445 (90.4%) are family households, while 47 (9.6%) are nonfamily households. The most numerous type of family households are 4-person households, comprising 169, and the most common type of nonfamily households are 2-person households, comprising 28.
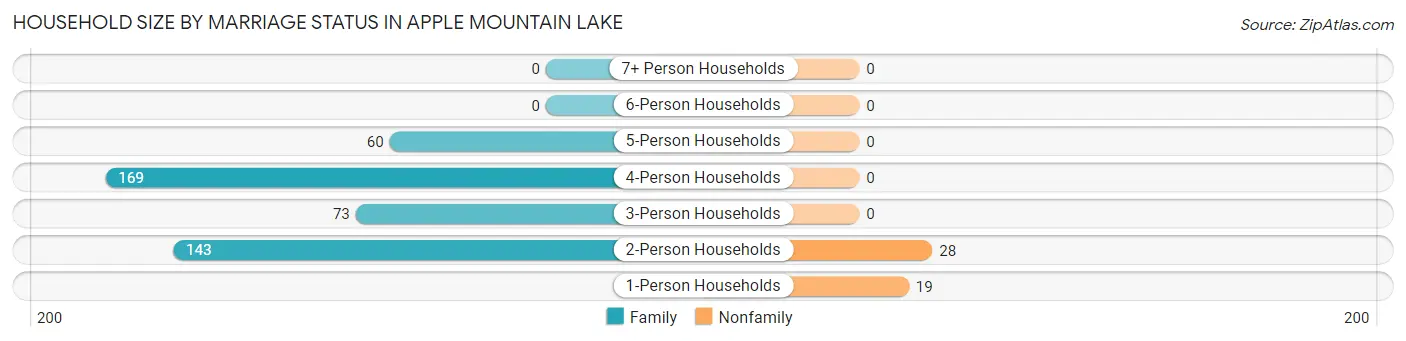
| Household Size | Family Households | Nonfamily Households |
| 1-Person Households | - | 19 (3.9%) |
| 2-Person Households | 143 (29.1%) | 28 (5.7%) |
| 3-Person Households | 73 (14.8%) | 0 (0.0%) |
| 4-Person Households | 169 (34.4%) | 0 (0.0%) |
| 5-Person Households | 60 (12.2%) | 0 (0.0%) |
| 6-Person Households | 0 (0.0%) | 0 (0.0%) |
| 7+ Person Households | 0 (0.0%) | 0 (0.0%) |
| Total | 445 (90.4%) | 47 (9.6%) |
Female Fertility in Apple Mountain Lake
Fertility by Age in Apple Mountain Lake
Average fertility rate in Apple Mountain Lake is 28.0 births per 1,000 women. Women in the age bracket of 20 to 34 years have the highest fertility rate with 103.0 births per 1,000 women. Women in the age bracket of 20 to 34 years acount for 100.0% of all women with births.
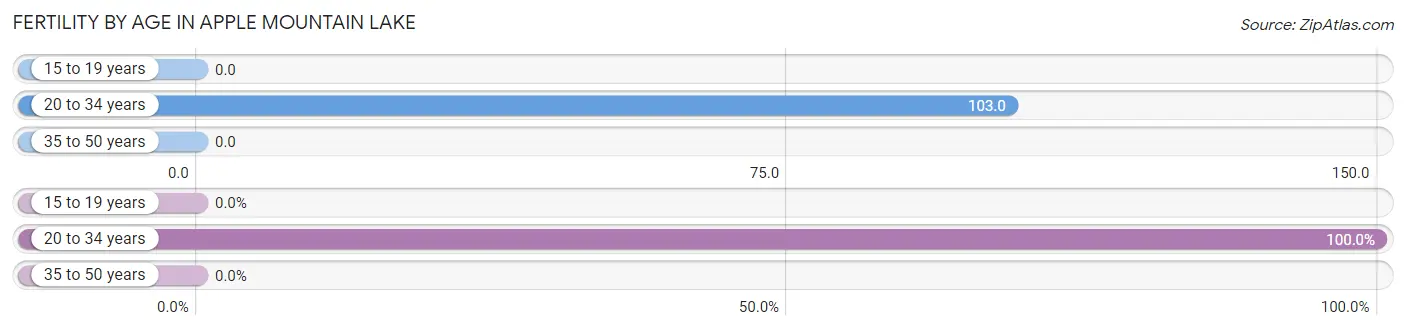
| Age Bracket | Women with Births | Births / 1,000 Women |
| 15 to 19 years | 0 (0.0%) | 0.0 |
| 20 to 34 years | 11 (100.0%) | 103.0 |
| 35 to 50 years | 0 (0.0%) | 0.0 |
| Total | 11 (100.0%) | 28.0 |
Fertility by Age by Marriage Status in Apple Mountain Lake
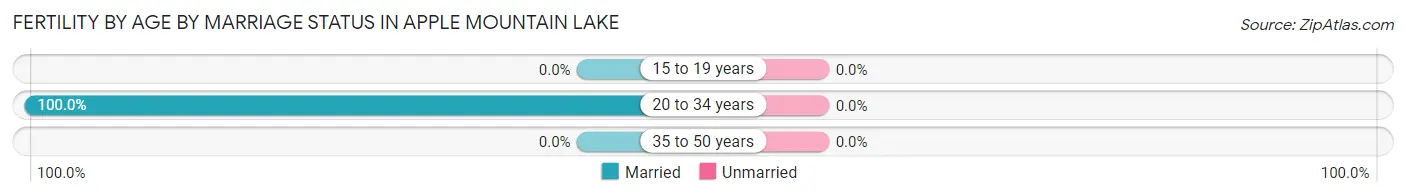
| Age Bracket | Married | Unmarried |
| 15 to 19 years | 0 (0.0%) | 0 (0.0%) |
| 20 to 34 years | 11 (100.0%) | 0 (0.0%) |
| 35 to 50 years | 0 (0.0%) | 0 (0.0%) |
| Total | 11 (100.0%) | 0 (0.0%) |
Fertility by Education in Apple Mountain Lake
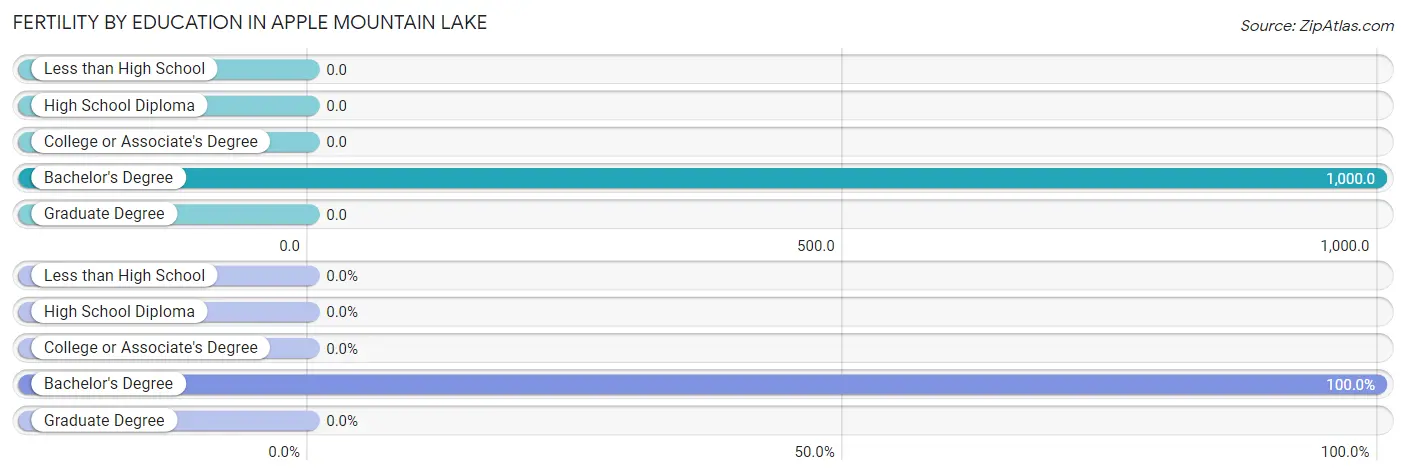
| Educational Attainment | Women with Births | Births / 1,000 Women |
| Less than High School | 0 (0.0%) | 0.0 |
| High School Diploma | 0 (0.0%) | 0.0 |
| College or Associate's Degree | 0 (0.0%) | 0.0 |
| Bachelor's Degree | 11 (100.0%) | 1,000.0 |
| Graduate Degree | 0 (0.0%) | 0.0 |
| Total | 11 (100.0%) | 28.0 |
Fertility by Education by Marriage Status in Apple Mountain Lake
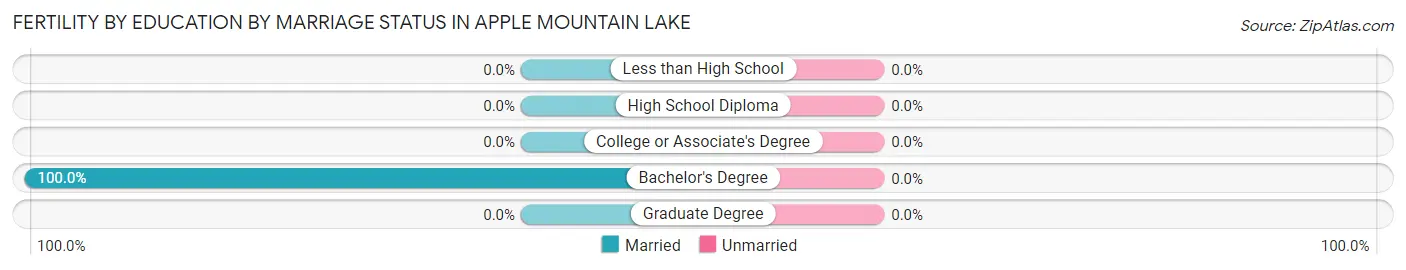
| Educational Attainment | Married | Unmarried |
| Less than High School | 0 (0.0%) | 0 (0.0%) |
| High School Diploma | 0 (0.0%) | 0 (0.0%) |
| College or Associate's Degree | 0 (0.0%) | 0 (0.0%) |
| Bachelor's Degree | 11 (100.0%) | 0 (0.0%) |
| Graduate Degree | 0 (0.0%) | 0 (0.0%) |
| Total | 11 (100.0%) | 0 (0.0%) |
Employment Characteristics in Apple Mountain Lake
Employment by Class of Employer in Apple Mountain Lake
Among the 854 employed individuals in Apple Mountain Lake, private company employees (645 | 75.5%), federal government employees (102 | 11.9%), and self-employed (not incorporated) (82 | 9.6%) make up the most common classes of employment.
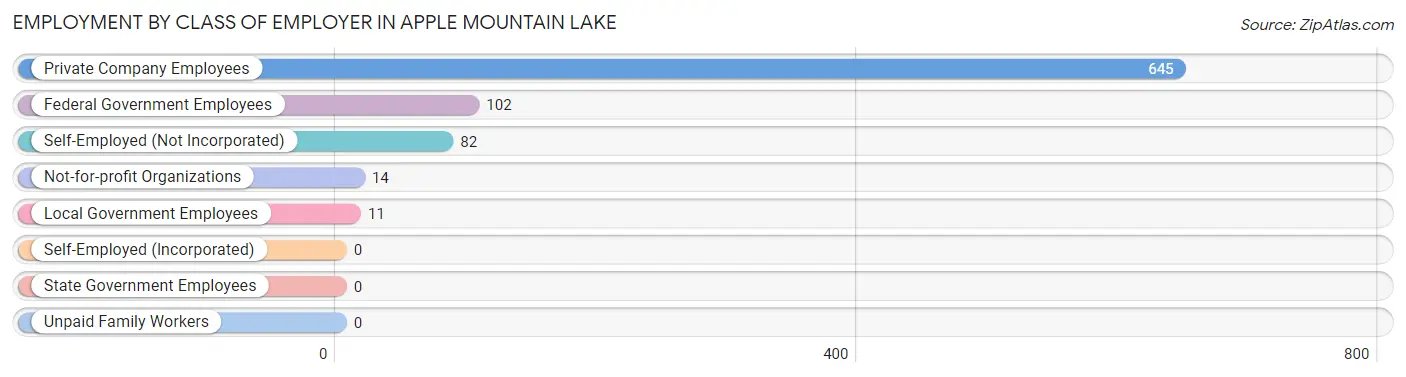
| Employer Class | # Employees | % Employees |
| Private Company Employees | 645 | 75.5% |
| Self-Employed (Incorporated) | 0 | 0.0% |
| Self-Employed (Not Incorporated) | 82 | 9.6% |
| Not-for-profit Organizations | 14 | 1.6% |
| Local Government Employees | 11 | 1.3% |
| State Government Employees | 0 | 0.0% |
| Federal Government Employees | 102 | 11.9% |
| Unpaid Family Workers | 0 | 0.0% |
| Total | 854 | 100.0% |
Employment Status by Age in Apple Mountain Lake
According to the labor force statistics for Apple Mountain Lake, out of the total population over 16 years of age (1,339), 66.7% or 893 individuals are in the labor force, with 1.9% or 17 of them unemployed. The age group with the highest labor force participation rate is 20 to 24 years, with 100.0% or 145 individuals in the labor force. Within the labor force, the 20 to 24 years age range has the highest percentage of unemployed individuals, with 11.7% or 17 of them being unemployed.
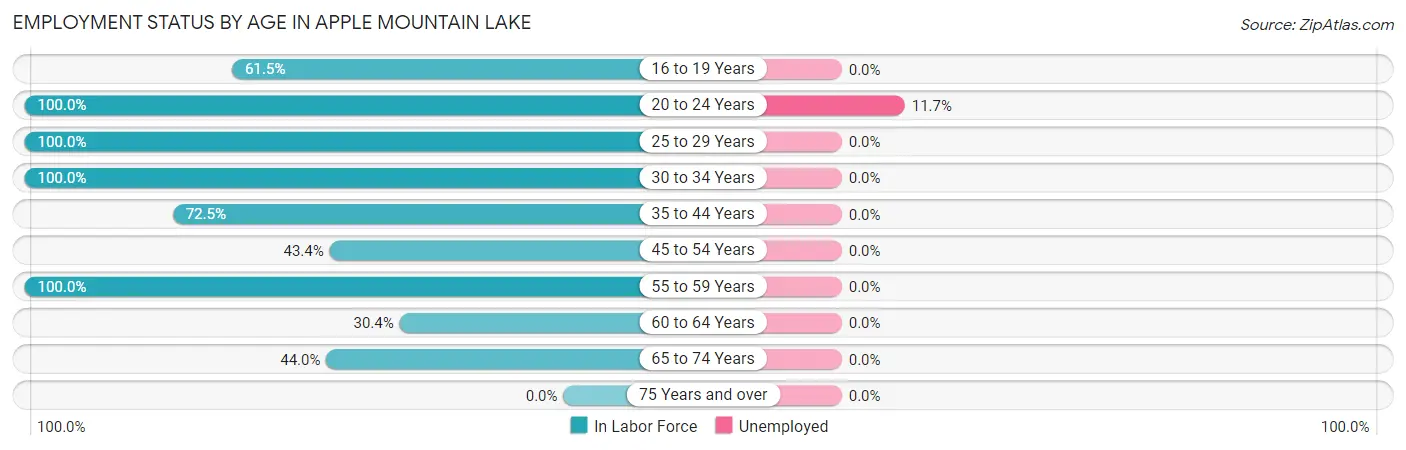
| Age Bracket | In Labor Force | Unemployed |
| 16 to 19 Years | 59 (61.5%) | 0 (0.0%) |
| 20 to 24 Years | 145 (100.0%) | 17 (11.7%) |
| 25 to 29 Years | 93 (100.0%) | 0 (0.0%) |
| 30 to 34 Years | 150 (100.0%) | 0 (0.0%) |
| 35 to 44 Years | 195 (72.5%) | 0 (0.0%) |
| 45 to 54 Years | 98 (43.4%) | 0 (0.0%) |
| 55 to 59 Years | 44 (100.0%) | 0 (0.0%) |
| 60 to 64 Years | 21 (30.4%) | 0 (0.0%) |
| 65 to 74 Years | 88 (44.0%) | 0 (0.0%) |
| 75 Years and over | 0 (0.0%) | 0 (0.0%) |
| Total | 893 (66.7%) | 17 (1.9%) |
Employment Status by Educational Attainment in Apple Mountain Lake
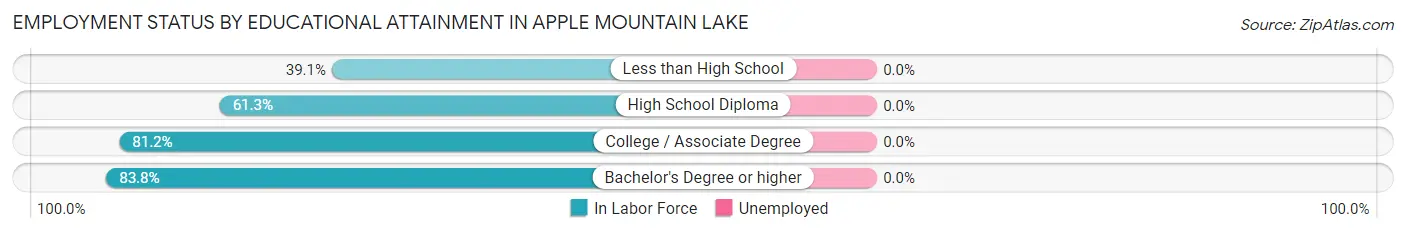
| Educational Attainment | In Labor Force | Unemployed |
| Less than High School | 59 (39.1%) | 0 (0.0%) |
| High School Diploma | 100 (61.3%) | 0 (0.0%) |
| College / Associate Degree | 246 (81.2%) | 0 (0.0%) |
| Bachelor's Degree or higher | 196 (83.8%) | 0 (0.0%) |
| Total | 601 (70.6%) | 0 (0.0%) |
Employment Occupations by Sex in Apple Mountain Lake
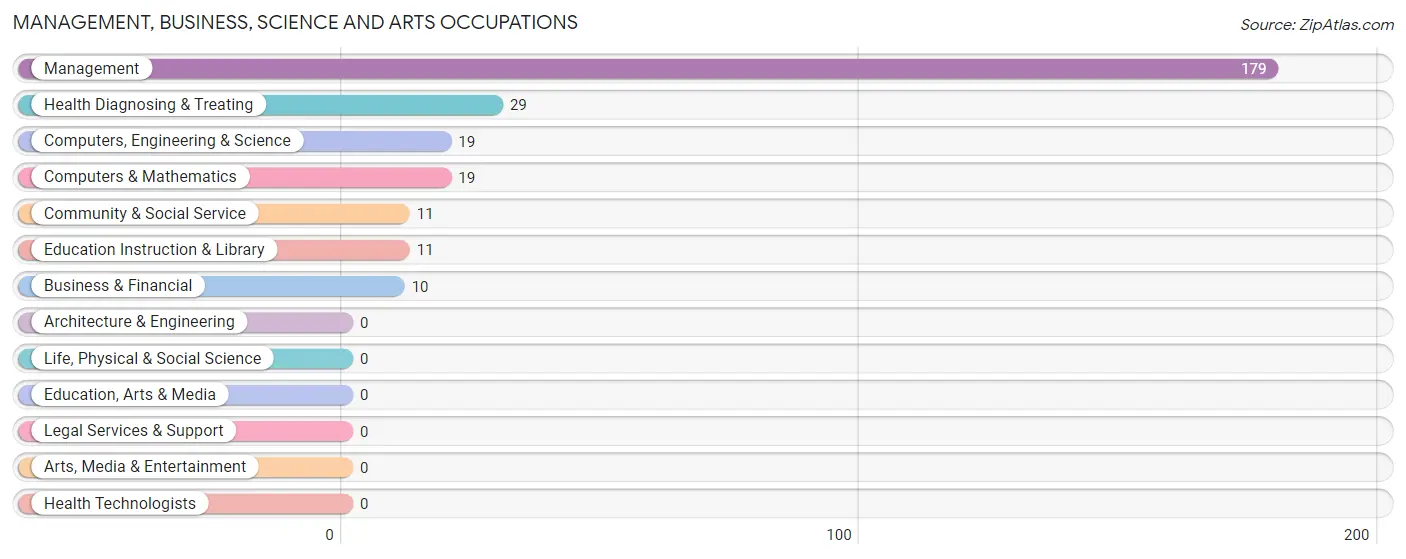
Management, Business, Science and Arts Occupations
The most common Management, Business, Science and Arts occupations in Apple Mountain Lake are Management (179 | 20.4%), Health Diagnosing & Treating (29 | 3.3%), Computers, Engineering & Science (19 | 2.2%), Computers & Mathematics (19 | 2.2%), and Community & Social Service (11 | 1.3%).
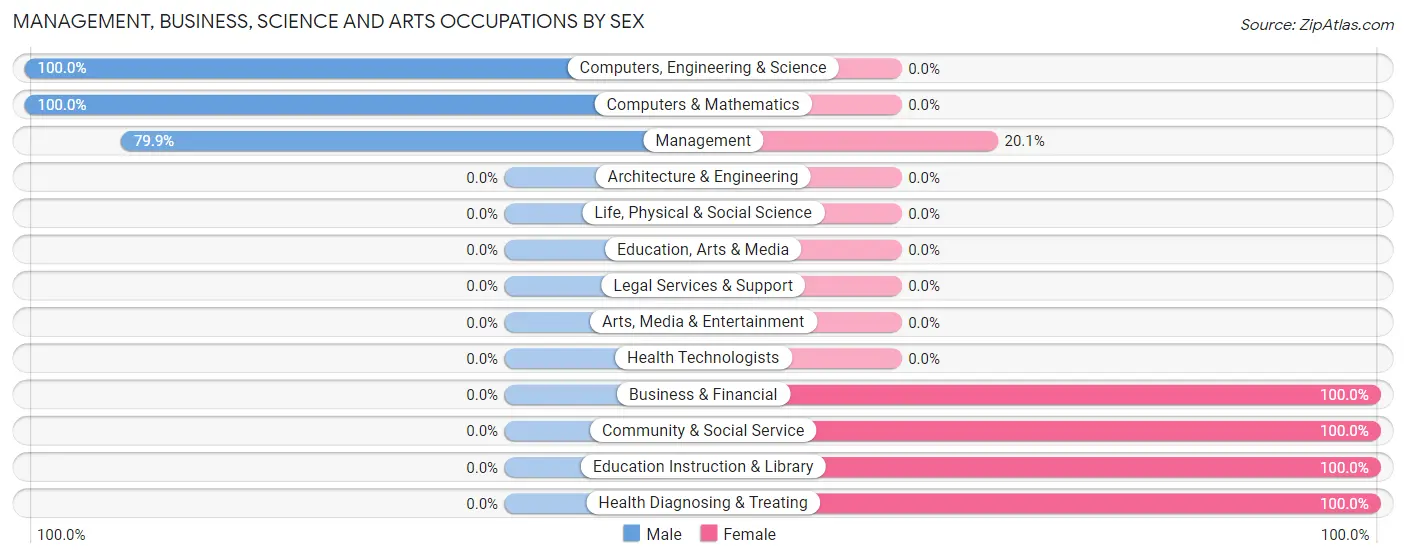
Management, Business, Science and Arts Occupations by Sex
Within the Management, Business, Science and Arts occupations in Apple Mountain Lake, the most male-oriented occupations are Computers, Engineering & Science (100.0%), Computers & Mathematics (100.0%), and Management (79.9%), while the most female-oriented occupations are Business & Financial (100.0%), Community & Social Service (100.0%), and Education Instruction & Library (100.0%).
| Occupation | Male | Female |
| Management | 143 (79.9%) | 36 (20.1%) |
| Business & Financial | 0 (0.0%) | 10 (100.0%) |
| Computers, Engineering & Science | 19 (100.0%) | 0 (0.0%) |
| Computers & Mathematics | 19 (100.0%) | 0 (0.0%) |
| Architecture & Engineering | 0 (0.0%) | 0 (0.0%) |
| Life, Physical & Social Science | 0 (0.0%) | 0 (0.0%) |
| Community & Social Service | 0 (0.0%) | 11 (100.0%) |
| Education, Arts & Media | 0 (0.0%) | 0 (0.0%) |
| Legal Services & Support | 0 (0.0%) | 0 (0.0%) |
| Education Instruction & Library | 0 (0.0%) | 11 (100.0%) |
| Arts, Media & Entertainment | 0 (0.0%) | 0 (0.0%) |
| Health Diagnosing & Treating | 0 (0.0%) | 29 (100.0%) |
| Health Technologists | 0 (0.0%) | 0 (0.0%) |
| Total (Category) | 162 (65.3%) | 86 (34.7%) |
| Total (Overall) | 585 (66.8%) | 291 (33.2%) |
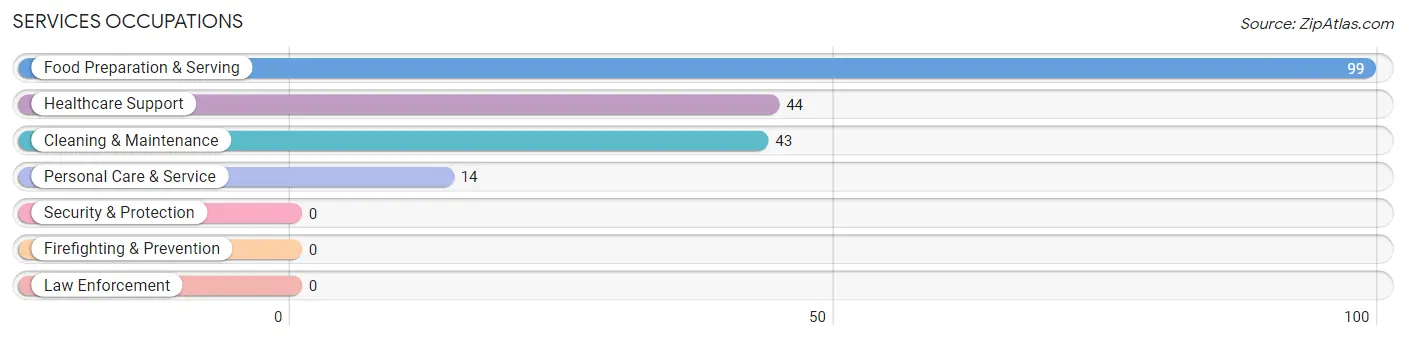
Services Occupations
The most common Services occupations in Apple Mountain Lake are Food Preparation & Serving (99 | 11.3%), Healthcare Support (44 | 5.0%), Cleaning & Maintenance (43 | 4.9%), and Personal Care & Service (14 | 1.6%).
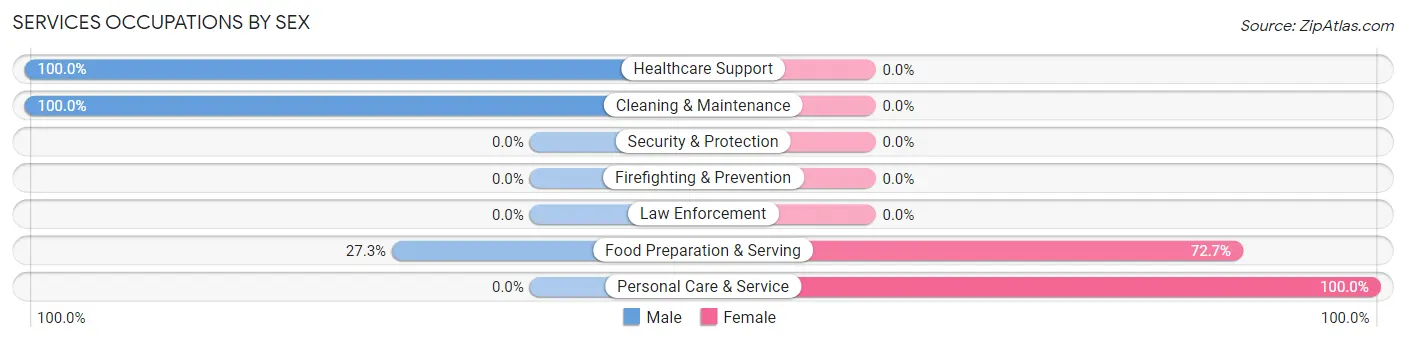
Services Occupations by Sex
Within the Services occupations in Apple Mountain Lake, the most male-oriented occupations are Healthcare Support (100.0%), Cleaning & Maintenance (100.0%), and Food Preparation & Serving (27.3%), while the most female-oriented occupations are Personal Care & Service (100.0%), and Food Preparation & Serving (72.7%).
| Occupation | Male | Female |
| Healthcare Support | 44 (100.0%) | 0 (0.0%) |
| Security & Protection | 0 (0.0%) | 0 (0.0%) |
| Firefighting & Prevention | 0 (0.0%) | 0 (0.0%) |
| Law Enforcement | 0 (0.0%) | 0 (0.0%) |
| Food Preparation & Serving | 27 (27.3%) | 72 (72.7%) |
| Cleaning & Maintenance | 43 (100.0%) | 0 (0.0%) |
| Personal Care & Service | 0 (0.0%) | 14 (100.0%) |
| Total (Category) | 114 (57.0%) | 86 (43.0%) |
| Total (Overall) | 585 (66.8%) | 291 (33.2%) |
Sales and Office Occupations
The most common Sales and Office occupations in Apple Mountain Lake are Office & Administration (117 | 13.4%), and Sales & Related (46 | 5.2%).
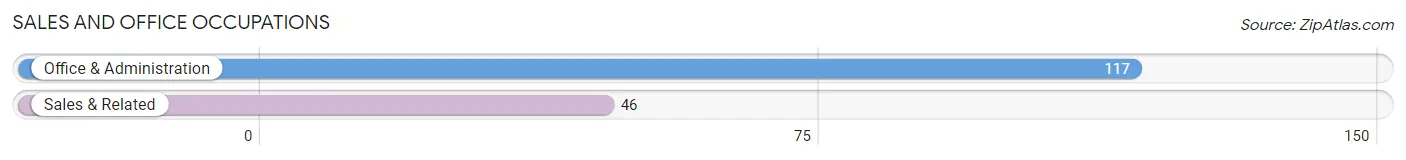
Sales and Office Occupations by Sex
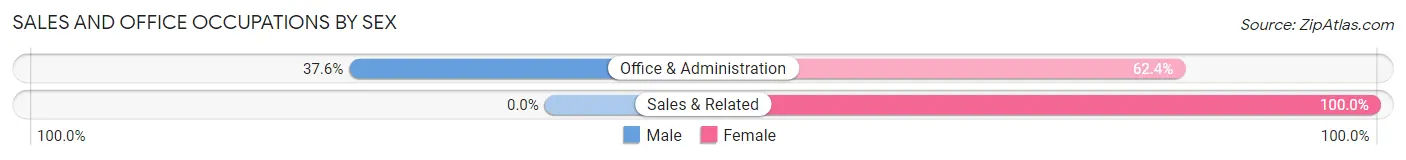
| Occupation | Male | Female |
| Sales & Related | 0 (0.0%) | 46 (100.0%) |
| Office & Administration | 44 (37.6%) | 73 (62.4%) |
| Total (Category) | 44 (27.0%) | 119 (73.0%) |
| Total (Overall) | 585 (66.8%) | 291 (33.2%) |
Natural Resources, Construction and Maintenance Occupations
The most common Natural Resources, Construction and Maintenance occupations in Apple Mountain Lake are Construction & Extraction (162 | 18.5%), and Installation, Maintenance & Repair (11 | 1.3%).
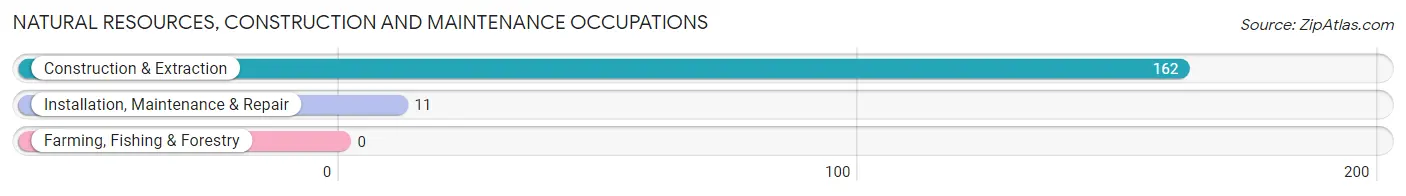
Natural Resources, Construction and Maintenance Occupations by Sex
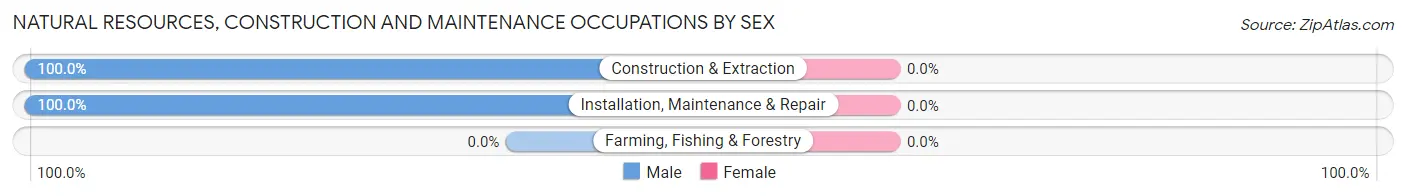
| Occupation | Male | Female |
| Farming, Fishing & Forestry | 0 (0.0%) | 0 (0.0%) |
| Construction & Extraction | 162 (100.0%) | 0 (0.0%) |
| Installation, Maintenance & Repair | 11 (100.0%) | 0 (0.0%) |
| Total (Category) | 173 (100.0%) | 0 (0.0%) |
| Total (Overall) | 585 (66.8%) | 291 (33.2%) |
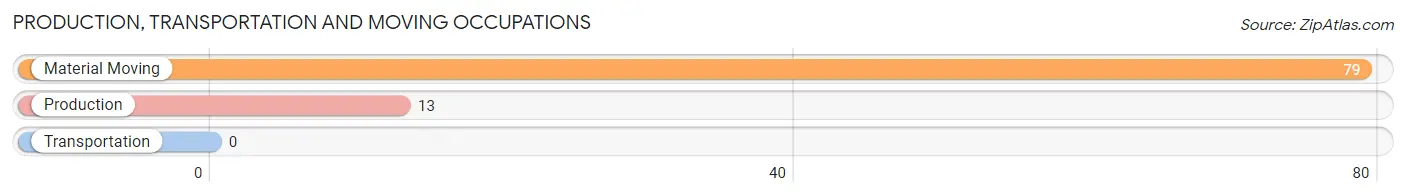
Production, Transportation and Moving Occupations
The most common Production, Transportation and Moving occupations in Apple Mountain Lake are Material Moving (79 | 9.0%), and Production (13 | 1.5%).
Production, Transportation and Moving Occupations by Sex
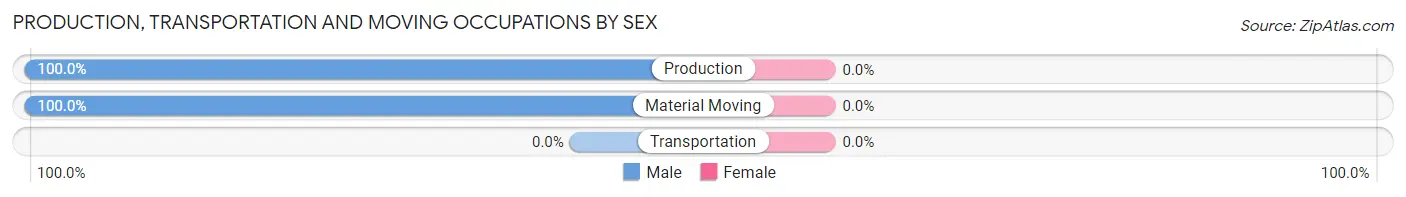
| Occupation | Male | Female |
| Production | 13 (100.0%) | 0 (0.0%) |
| Transportation | 0 (0.0%) | 0 (0.0%) |
| Material Moving | 79 (100.0%) | 0 (0.0%) |
| Total (Category) | 92 (100.0%) | 0 (0.0%) |
| Total (Overall) | 585 (66.8%) | 291 (33.2%) |
Employment Industries by Sex in Apple Mountain Lake
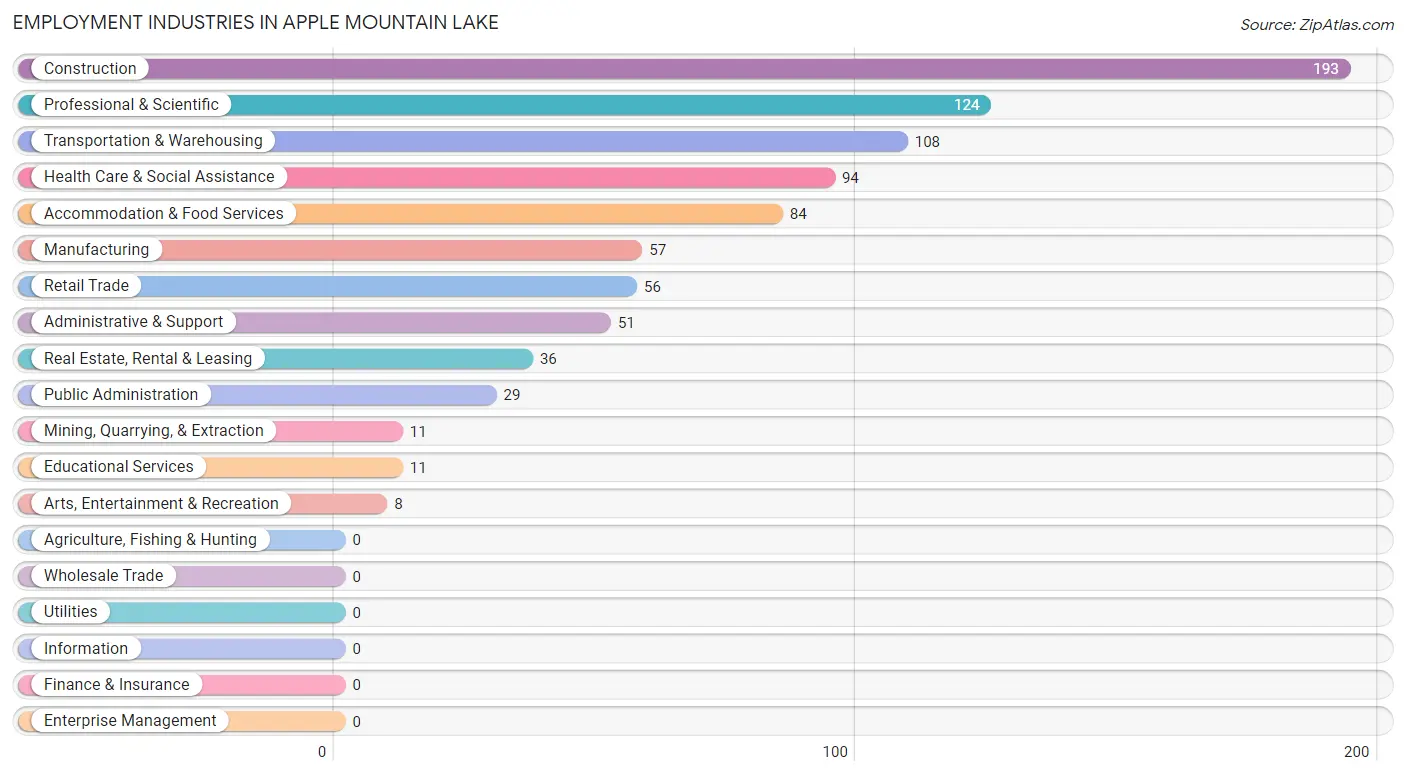
Employment Industries in Apple Mountain Lake
The major employment industries in Apple Mountain Lake include Construction (193 | 22.0%), Professional & Scientific (124 | 14.2%), Transportation & Warehousing (108 | 12.3%), Health Care & Social Assistance (94 | 10.7%), and Accommodation & Food Services (84 | 9.6%).
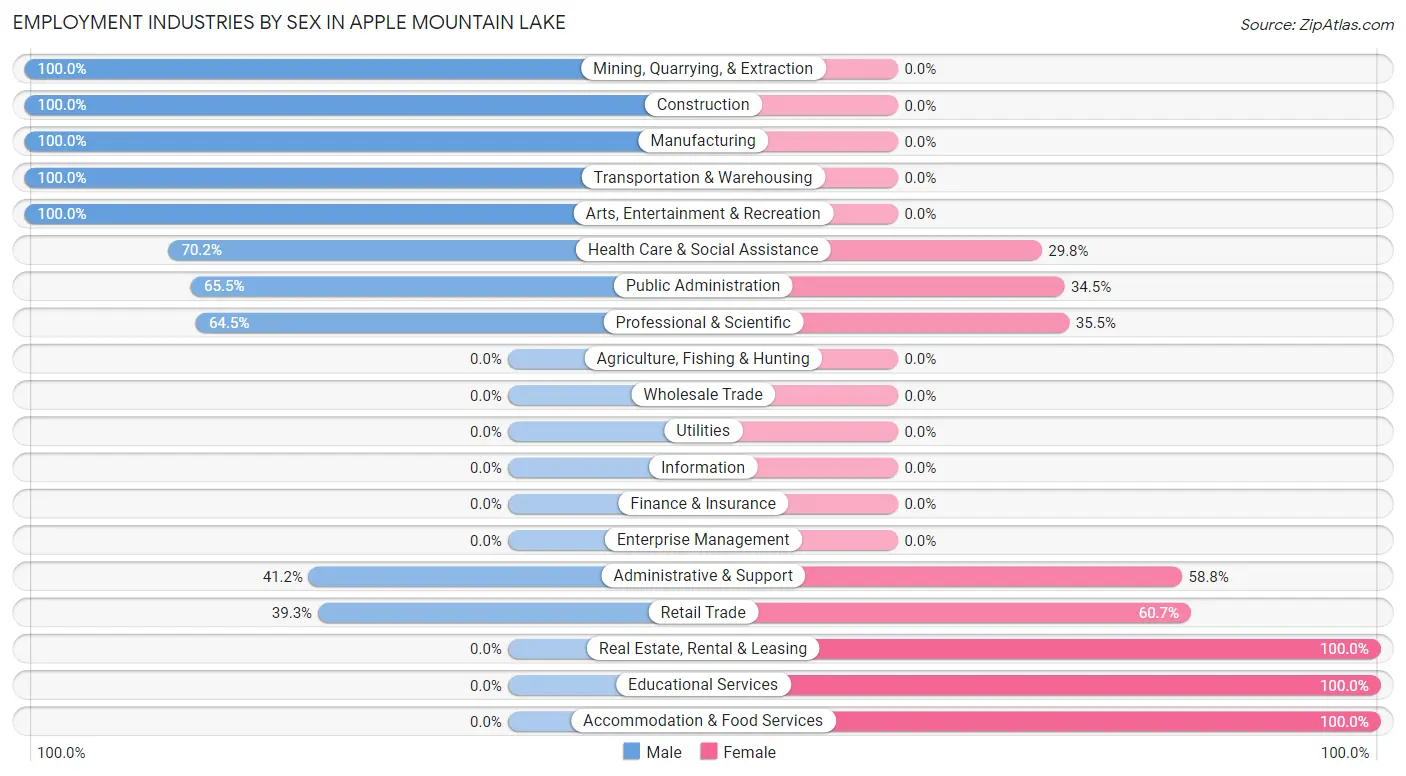
Employment Industries by Sex in Apple Mountain Lake
The Apple Mountain Lake industries that see more men than women are Mining, Quarrying, & Extraction (100.0%), Construction (100.0%), and Manufacturing (100.0%), whereas the industries that tend to have a higher number of women are Real Estate, Rental & Leasing (100.0%), Educational Services (100.0%), and Accommodation & Food Services (100.0%).
| Industry | Male | Female |
| Agriculture, Fishing & Hunting | 0 (0.0%) | 0 (0.0%) |
| Mining, Quarrying, & Extraction | 11 (100.0%) | 0 (0.0%) |
| Construction | 193 (100.0%) | 0 (0.0%) |
| Manufacturing | 57 (100.0%) | 0 (0.0%) |
| Wholesale Trade | 0 (0.0%) | 0 (0.0%) |
| Retail Trade | 22 (39.3%) | 34 (60.7%) |
| Transportation & Warehousing | 108 (100.0%) | 0 (0.0%) |
| Utilities | 0 (0.0%) | 0 (0.0%) |
| Information | 0 (0.0%) | 0 (0.0%) |
| Finance & Insurance | 0 (0.0%) | 0 (0.0%) |
| Real Estate, Rental & Leasing | 0 (0.0%) | 36 (100.0%) |
| Professional & Scientific | 80 (64.5%) | 44 (35.5%) |
| Enterprise Management | 0 (0.0%) | 0 (0.0%) |
| Administrative & Support | 21 (41.2%) | 30 (58.8%) |
| Educational Services | 0 (0.0%) | 11 (100.0%) |
| Health Care & Social Assistance | 66 (70.2%) | 28 (29.8%) |
| Arts, Entertainment & Recreation | 8 (100.0%) | 0 (0.0%) |
| Accommodation & Food Services | 0 (0.0%) | 84 (100.0%) |
| Public Administration | 19 (65.5%) | 10 (34.5%) |
| Total | 585 (66.8%) | 291 (33.2%) |
Education in Apple Mountain Lake
School Enrollment in Apple Mountain Lake
The most common levels of schooling among the 350 students in Apple Mountain Lake are high school (143 | 40.9%), nursery / preschool (55 | 15.7%), and middle school (41 | 11.7%).
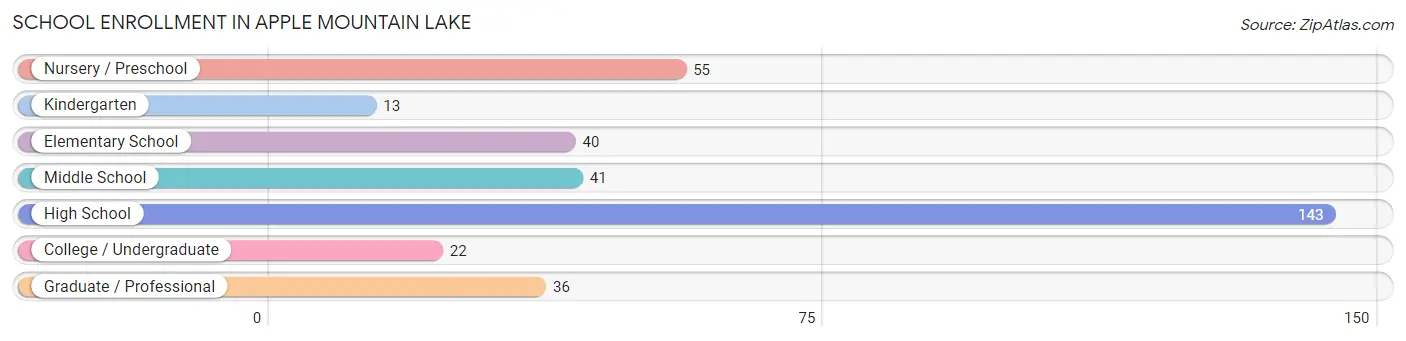
| School Level | # Students | % Students |
| Nursery / Preschool | 55 | 15.7% |
| Kindergarten | 13 | 3.7% |
| Elementary School | 40 | 11.4% |
| Middle School | 41 | 11.7% |
| High School | 143 | 40.9% |
| College / Undergraduate | 22 | 6.3% |
| Graduate / Professional | 36 | 10.3% |
| Total | 350 | 100.0% |
School Enrollment by Age by Funding Source in Apple Mountain Lake
Out of a total of 350 students who are enrolled in schools in Apple Mountain Lake, 48 (13.7%) attend a private institution, while the remaining 302 (86.3%) are enrolled in public schools. The age group of 5 to 9 year old has the highest likelihood of being enrolled in private schools, with 13 (54.2% in the age bracket) enrolled. Conversely, the age group of 10 to 14 year olds has the lowest likelihood of being enrolled in a private school, with 70 (100.0% in the age bracket) attending a public institution.
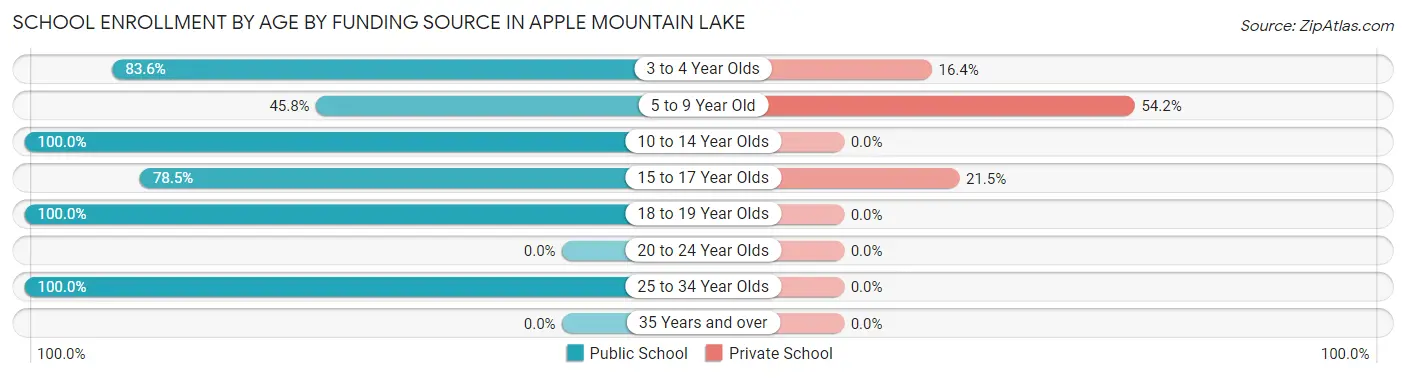
| Age Bracket | Public School | Private School |
| 3 to 4 Year Olds | 46 (83.6%) | 9 (16.4%) |
| 5 to 9 Year Old | 11 (45.8%) | 13 (54.2%) |
| 10 to 14 Year Olds | 70 (100.0%) | 0 (0.0%) |
| 15 to 17 Year Olds | 95 (78.5%) | 26 (21.5%) |
| 18 to 19 Year Olds | 44 (100.0%) | 0 (0.0%) |
| 20 to 24 Year Olds | 0 (0.0%) | 0 (0.0%) |
| 25 to 34 Year Olds | 36 (100.0%) | 0 (0.0%) |
| 35 Years and over | 0 (0.0%) | 0 (0.0%) |
| Total | 302 (86.3%) | 48 (13.7%) |
Educational Attainment by Field of Study in Apple Mountain Lake
Business (217 | 67.8%), literature & languages (36 | 11.3%), education (23 | 7.2%), science & technology (19 | 5.9%), and bio, nature & agricultural (14 | 4.4%) are the most common fields of study among 320 individuals in Apple Mountain Lake who have obtained a bachelor's degree or higher.
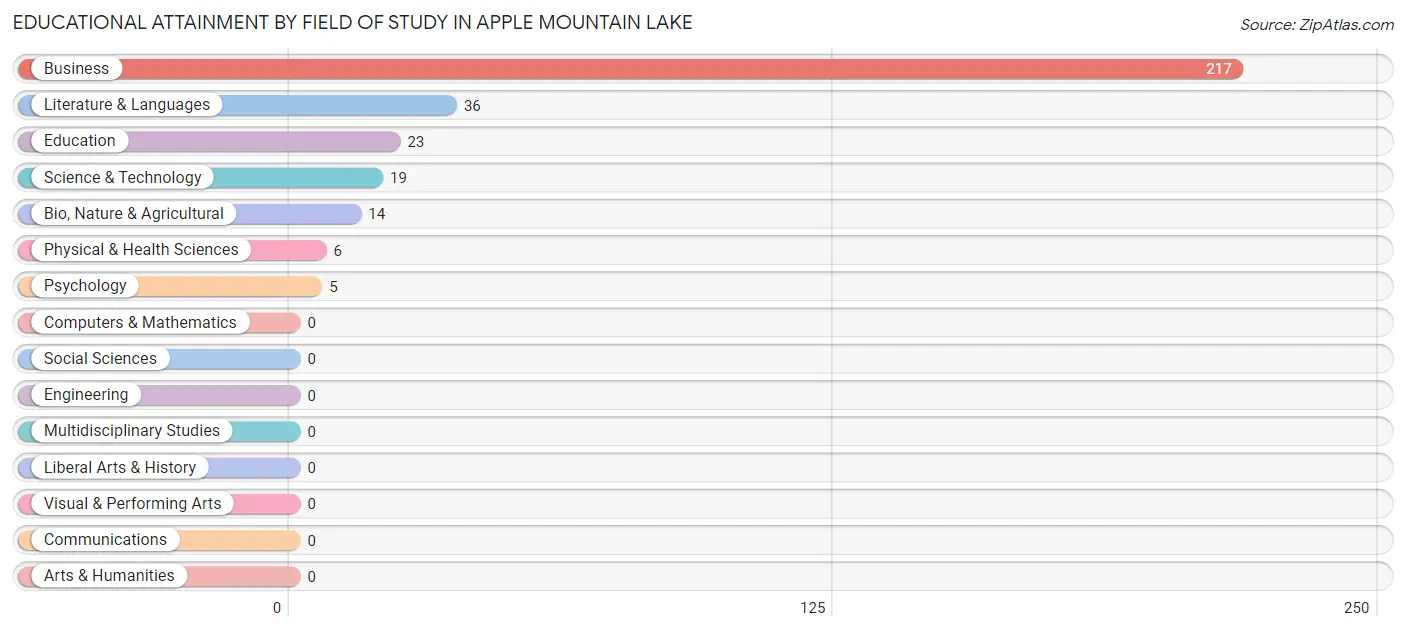
| Field of Study | # Graduates | % Graduates |
| Computers & Mathematics | 0 | 0.0% |
| Bio, Nature & Agricultural | 14 | 4.4% |
| Physical & Health Sciences | 6 | 1.9% |
| Psychology | 5 | 1.6% |
| Social Sciences | 0 | 0.0% |
| Engineering | 0 | 0.0% |
| Multidisciplinary Studies | 0 | 0.0% |
| Science & Technology | 19 | 5.9% |
| Business | 217 | 67.8% |
| Education | 23 | 7.2% |
| Literature & Languages | 36 | 11.3% |
| Liberal Arts & History | 0 | 0.0% |
| Visual & Performing Arts | 0 | 0.0% |
| Communications | 0 | 0.0% |
| Arts & Humanities | 0 | 0.0% |
| Total | 320 | 100.0% |
Transportation & Commute in Apple Mountain Lake
Vehicle Availability by Sex in Apple Mountain Lake
The most prevalent vehicle ownership categories in Apple Mountain Lake are males with 2 vehicles (365, accounting for 62.4%) and females with 2 vehicles (62, making up 135.7%).
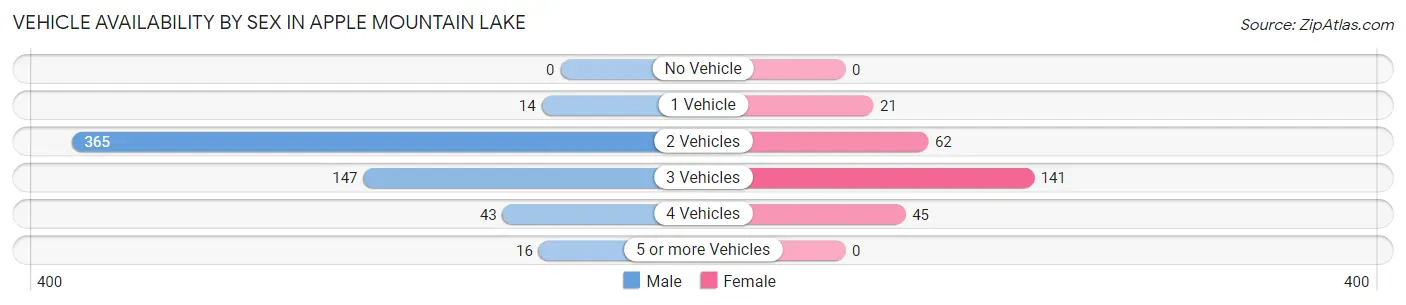
| Vehicles Available | Male | Female |
| No Vehicle | 0 (0.0%) | 0 (0.0%) |
| 1 Vehicle | 14 (2.4%) | 21 (7.8%) |
| 2 Vehicles | 365 (62.4%) | 62 (23.1%) |
| 3 Vehicles | 147 (25.1%) | 141 (52.4%) |
| 4 Vehicles | 43 (7.3%) | 45 (16.7%) |
| 5 or more Vehicles | 16 (2.7%) | 0 (0.0%) |
| Total | 585 (100.0%) | 269 (100.0%) |
Commute Time in Apple Mountain Lake
The most frequently occuring commute durations in Apple Mountain Lake are 60 to 89 minutes (409 commuters, 51.1%), 45 to 59 minutes (89 commuters, 11.1%), and 40 to 44 minutes (71 commuters, 8.9%).
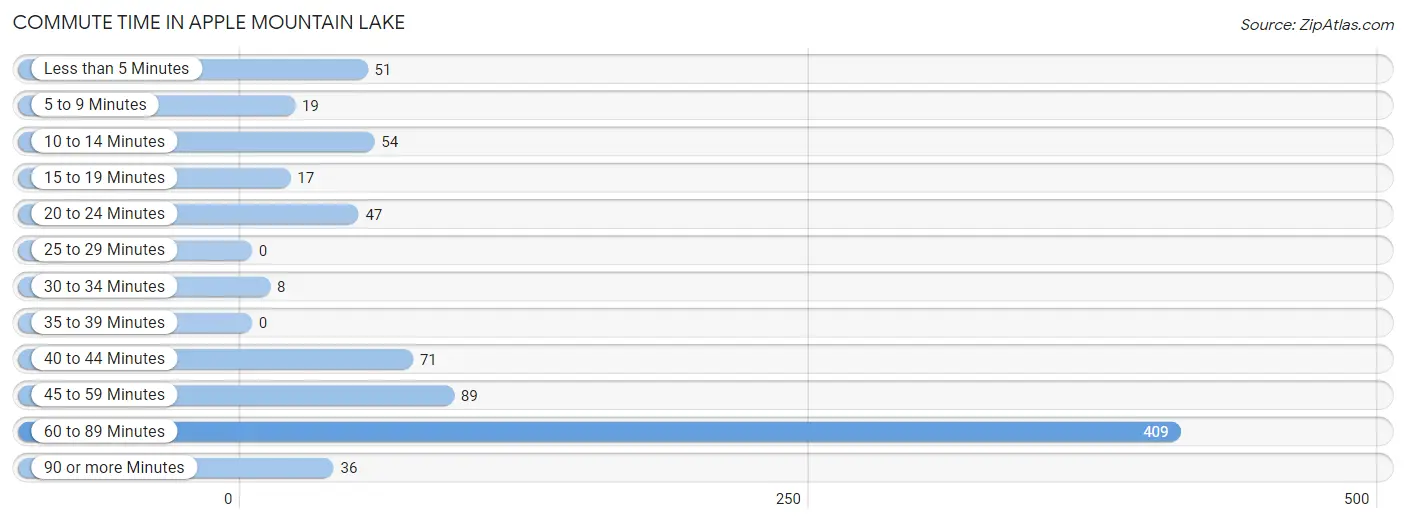
| Commute Time | # Commuters | % Commuters |
| Less than 5 Minutes | 51 | 6.4% |
| 5 to 9 Minutes | 19 | 2.4% |
| 10 to 14 Minutes | 54 | 6.7% |
| 15 to 19 Minutes | 17 | 2.1% |
| 20 to 24 Minutes | 47 | 5.9% |
| 25 to 29 Minutes | 0 | 0.0% |
| 30 to 34 Minutes | 8 | 1.0% |
| 35 to 39 Minutes | 0 | 0.0% |
| 40 to 44 Minutes | 71 | 8.9% |
| 45 to 59 Minutes | 89 | 11.1% |
| 60 to 89 Minutes | 409 | 51.1% |
| 90 or more Minutes | 36 | 4.5% |
Commute Time by Sex in Apple Mountain Lake
The most common commute times in Apple Mountain Lake are 60 to 89 minutes (325 commuters, 59.4%) for males and 60 to 89 minutes (84 commuters, 33.1%) for females.
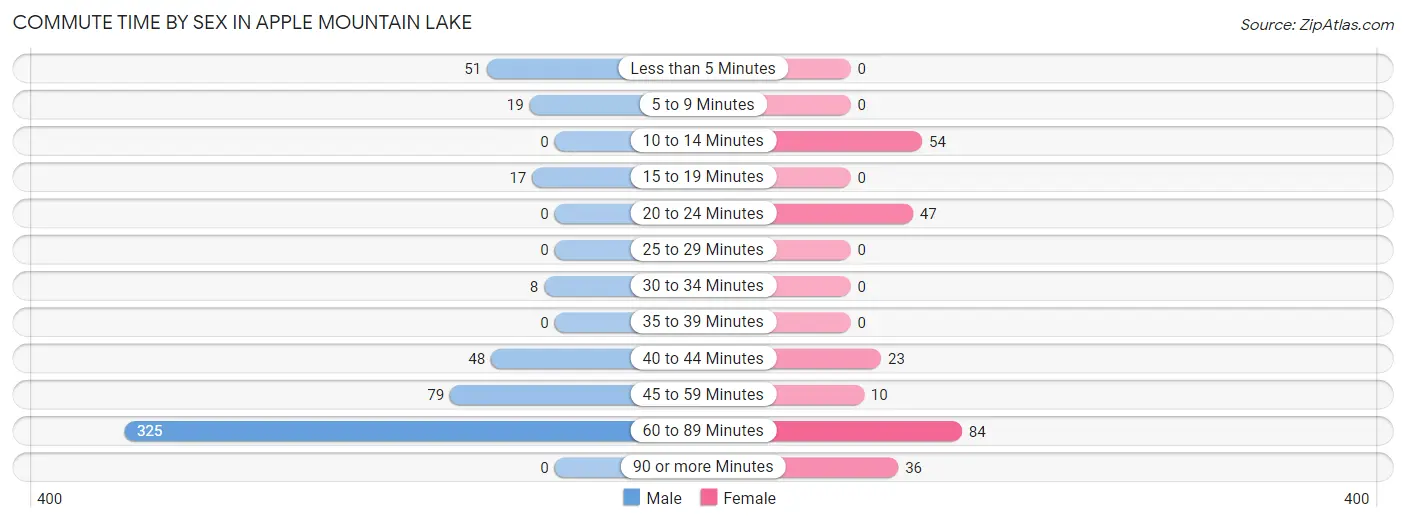
| Commute Time | Male | Female |
| Less than 5 Minutes | 51 (9.3%) | 0 (0.0%) |
| 5 to 9 Minutes | 19 (3.5%) | 0 (0.0%) |
| 10 to 14 Minutes | 0 (0.0%) | 54 (21.3%) |
| 15 to 19 Minutes | 17 (3.1%) | 0 (0.0%) |
| 20 to 24 Minutes | 0 (0.0%) | 47 (18.5%) |
| 25 to 29 Minutes | 0 (0.0%) | 0 (0.0%) |
| 30 to 34 Minutes | 8 (1.5%) | 0 (0.0%) |
| 35 to 39 Minutes | 0 (0.0%) | 0 (0.0%) |
| 40 to 44 Minutes | 48 (8.8%) | 23 (9.1%) |
| 45 to 59 Minutes | 79 (14.4%) | 10 (3.9%) |
| 60 to 89 Minutes | 325 (59.4%) | 84 (33.1%) |
| 90 or more Minutes | 0 (0.0%) | 36 (14.2%) |
Time of Departure to Work by Sex in Apple Mountain Lake
The most frequent times of departure to work in Apple Mountain Lake are 12:00 AM to 4:59 AM (153, 28.0%) for males and 7:00 AM to 7:29 AM (78, 30.7%) for females.
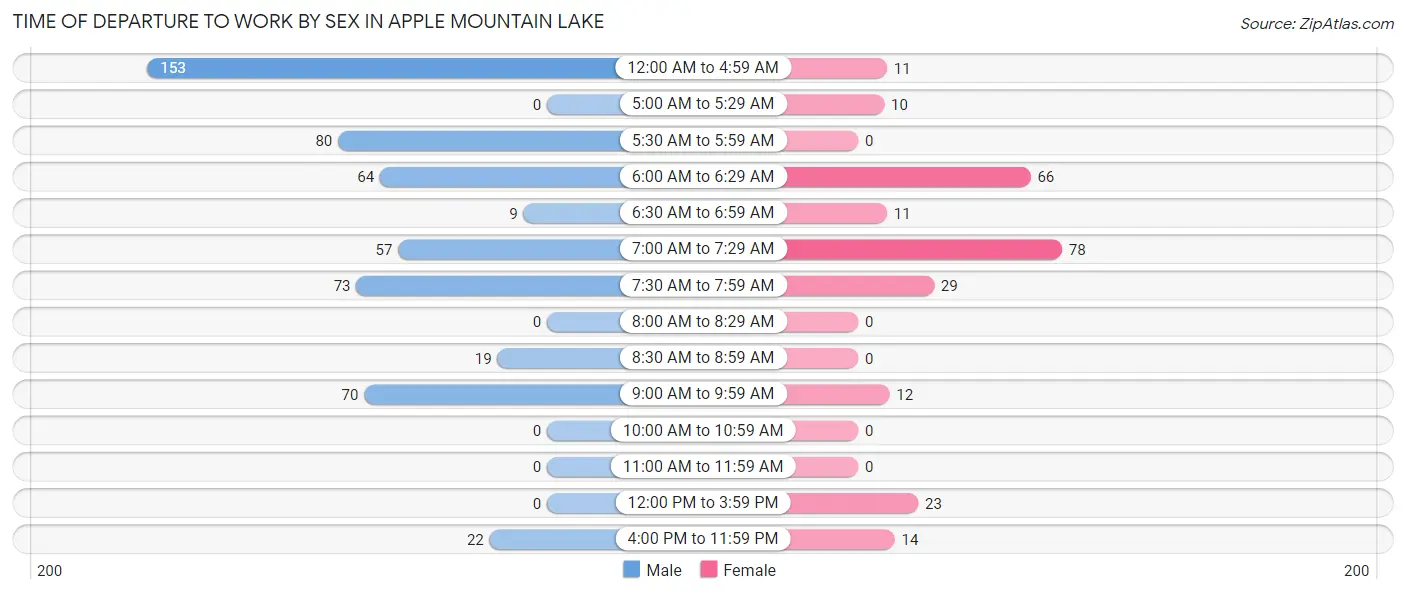
| Time of Departure | Male | Female |
| 12:00 AM to 4:59 AM | 153 (28.0%) | 11 (4.3%) |
| 5:00 AM to 5:29 AM | 0 (0.0%) | 10 (3.9%) |
| 5:30 AM to 5:59 AM | 80 (14.6%) | 0 (0.0%) |
| 6:00 AM to 6:29 AM | 64 (11.7%) | 66 (26.0%) |
| 6:30 AM to 6:59 AM | 9 (1.7%) | 11 (4.3%) |
| 7:00 AM to 7:29 AM | 57 (10.4%) | 78 (30.7%) |
| 7:30 AM to 7:59 AM | 73 (13.4%) | 29 (11.4%) |
| 8:00 AM to 8:29 AM | 0 (0.0%) | 0 (0.0%) |
| 8:30 AM to 8:59 AM | 19 (3.5%) | 0 (0.0%) |
| 9:00 AM to 9:59 AM | 70 (12.8%) | 12 (4.7%) |
| 10:00 AM to 10:59 AM | 0 (0.0%) | 0 (0.0%) |
| 11:00 AM to 11:59 AM | 0 (0.0%) | 0 (0.0%) |
| 12:00 PM to 3:59 PM | 0 (0.0%) | 23 (9.1%) |
| 4:00 PM to 11:59 PM | 22 (4.0%) | 14 (5.5%) |
| Total | 547 (100.0%) | 254 (100.0%) |
Housing Occupancy in Apple Mountain Lake
Occupancy by Ownership in Apple Mountain Lake
Of the total 492 dwellings in Apple Mountain Lake, owner-occupied units account for 398 (80.9%), while renter-occupied units make up 94 (19.1%).
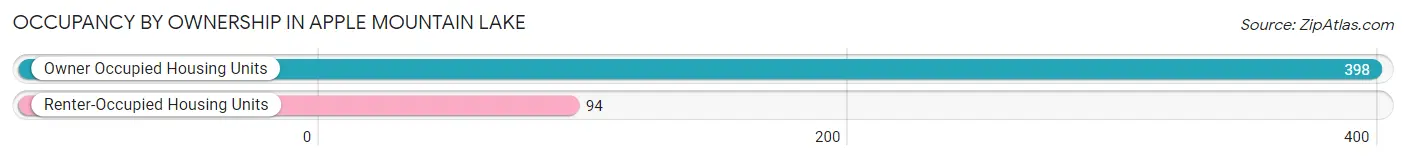
| Occupancy | # Housing Units | % Housing Units |
| Owner Occupied Housing Units | 398 | 80.9% |
| Renter-Occupied Housing Units | 94 | 19.1% |
| Total Occupied Housing Units | 492 | 100.0% |
Occupancy by Household Size in Apple Mountain Lake
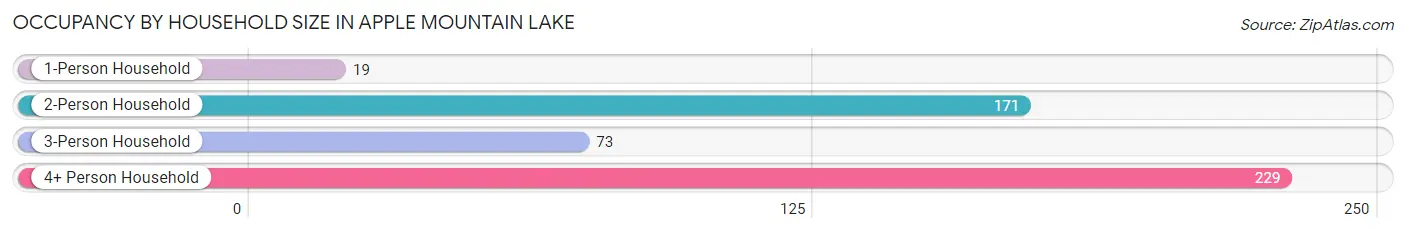
| Household Size | # Housing Units | % Housing Units |
| 1-Person Household | 19 | 3.9% |
| 2-Person Household | 171 | 34.8% |
| 3-Person Household | 73 | 14.8% |
| 4+ Person Household | 229 | 46.5% |
| Total Housing Units | 492 | 100.0% |
Occupancy by Ownership by Household Size in Apple Mountain Lake
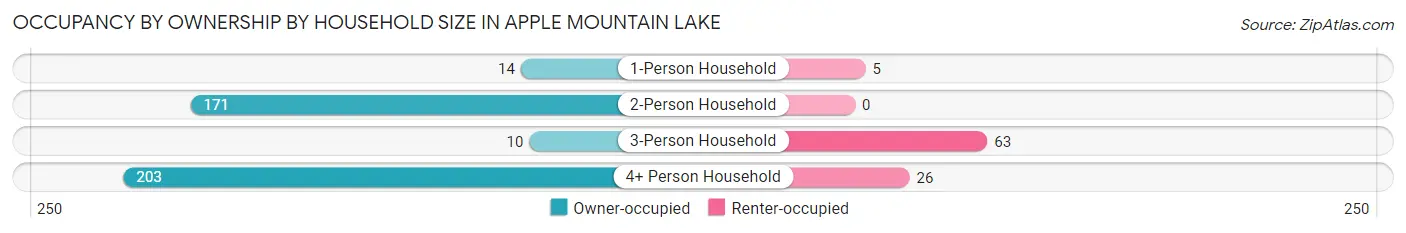
| Household Size | Owner-occupied | Renter-occupied |
| 1-Person Household | 14 (73.7%) | 5 (26.3%) |
| 2-Person Household | 171 (100.0%) | 0 (0.0%) |
| 3-Person Household | 10 (13.7%) | 63 (86.3%) |
| 4+ Person Household | 203 (88.6%) | 26 (11.4%) |
| Total Housing Units | 398 (80.9%) | 94 (19.1%) |
Occupancy by Educational Attainment in Apple Mountain Lake
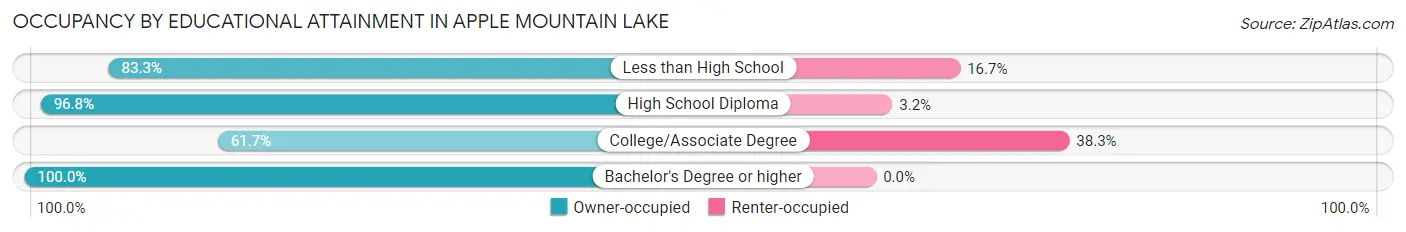
| Household Size | Owner-occupied | Renter-occupied |
| Less than High School | 60 (83.3%) | 12 (16.7%) |
| High School Diploma | 151 (96.8%) | 5 (3.2%) |
| College/Associate Degree | 124 (61.7%) | 77 (38.3%) |
| Bachelor's Degree or higher | 63 (100.0%) | 0 (0.0%) |
Occupancy by Age of Householder in Apple Mountain Lake
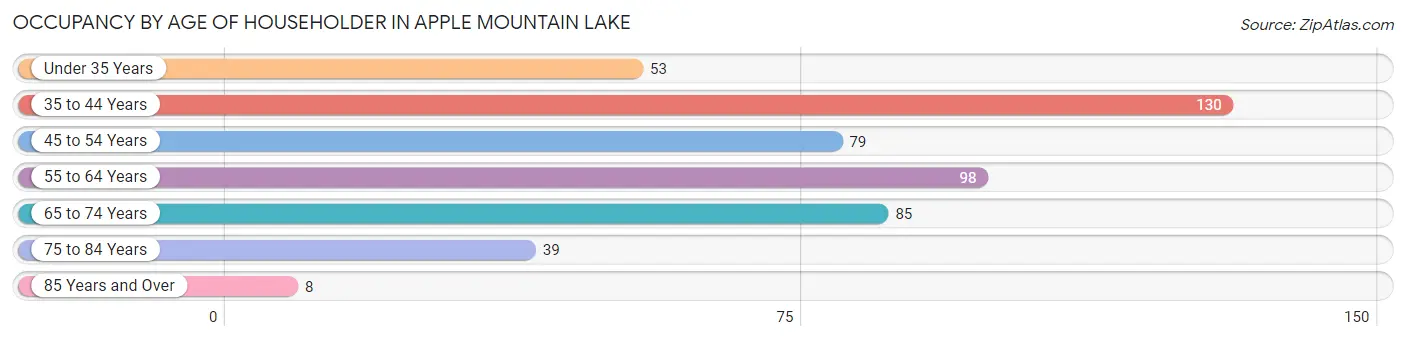
| Age Bracket | # Households | % Households |
| Under 35 Years | 53 | 10.8% |
| 35 to 44 Years | 130 | 26.4% |
| 45 to 54 Years | 79 | 16.1% |
| 55 to 64 Years | 98 | 19.9% |
| 65 to 74 Years | 85 | 17.3% |
| 75 to 84 Years | 39 | 7.9% |
| 85 Years and Over | 8 | 1.6% |
| Total | 492 | 100.0% |
Housing Finances in Apple Mountain Lake
Median Income by Occupancy in Apple Mountain Lake
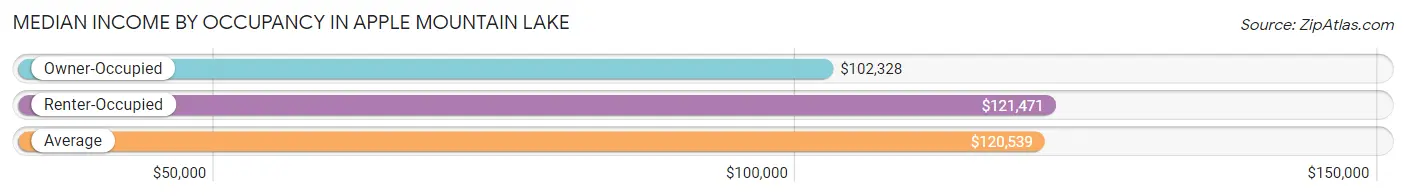
| Occupancy Type | # Households | Median Income |
| Owner-Occupied | 398 (80.9%) | $102,328 |
| Renter-Occupied | 94 (19.1%) | $121,471 |
| Average | 492 (100.0%) | $120,539 |
Occupancy by Householder Income Bracket in Apple Mountain Lake
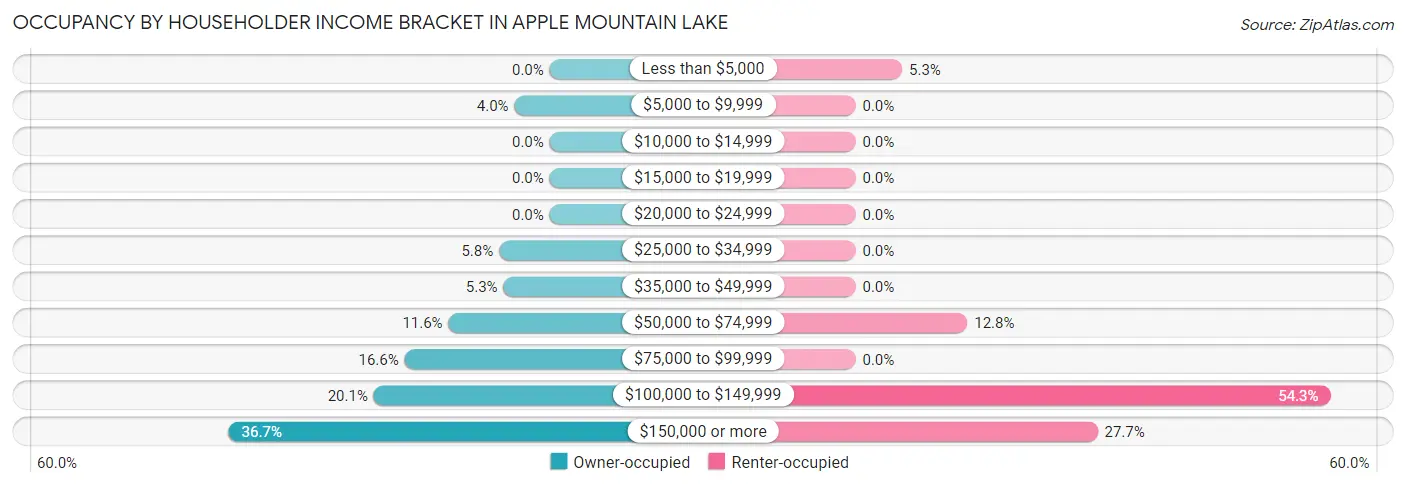
| Income Bracket | Owner-occupied | Renter-occupied |
| Less than $5,000 | 0 (0.0%) | 5 (5.3%) |
| $5,000 to $9,999 | 16 (4.0%) | 0 (0.0%) |
| $10,000 to $14,999 | 0 (0.0%) | 0 (0.0%) |
| $15,000 to $19,999 | 0 (0.0%) | 0 (0.0%) |
| $20,000 to $24,999 | 0 (0.0%) | 0 (0.0%) |
| $25,000 to $34,999 | 23 (5.8%) | 0 (0.0%) |
| $35,000 to $49,999 | 21 (5.3%) | 0 (0.0%) |
| $50,000 to $74,999 | 46 (11.6%) | 12 (12.8%) |
| $75,000 to $99,999 | 66 (16.6%) | 0 (0.0%) |
| $100,000 to $149,999 | 80 (20.1%) | 51 (54.3%) |
| $150,000 or more | 146 (36.7%) | 26 (27.7%) |
| Total | 398 (100.0%) | 94 (100.0%) |
Monthly Housing Cost Tiers in Apple Mountain Lake
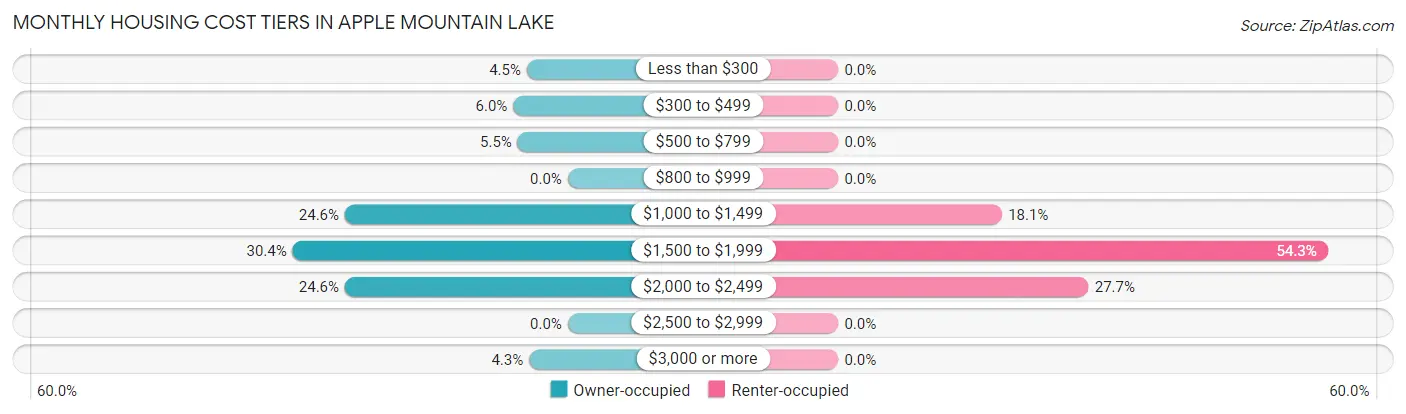
| Monthly Cost | Owner-occupied | Renter-occupied |
| Less than $300 | 18 (4.5%) | 0 (0.0%) |
| $300 to $499 | 24 (6.0%) | 0 (0.0%) |
| $500 to $799 | 22 (5.5%) | 0 (0.0%) |
| $800 to $999 | 0 (0.0%) | 0 (0.0%) |
| $1,000 to $1,499 | 98 (24.6%) | 17 (18.1%) |
| $1,500 to $1,999 | 121 (30.4%) | 51 (54.3%) |
| $2,000 to $2,499 | 98 (24.6%) | 26 (27.7%) |
| $2,500 to $2,999 | 0 (0.0%) | 0 (0.0%) |
| $3,000 or more | 17 (4.3%) | 0 (0.0%) |
| Total | 398 (100.0%) | 94 (100.0%) |
Physical Housing Characteristics in Apple Mountain Lake
Housing Structures in Apple Mountain Lake
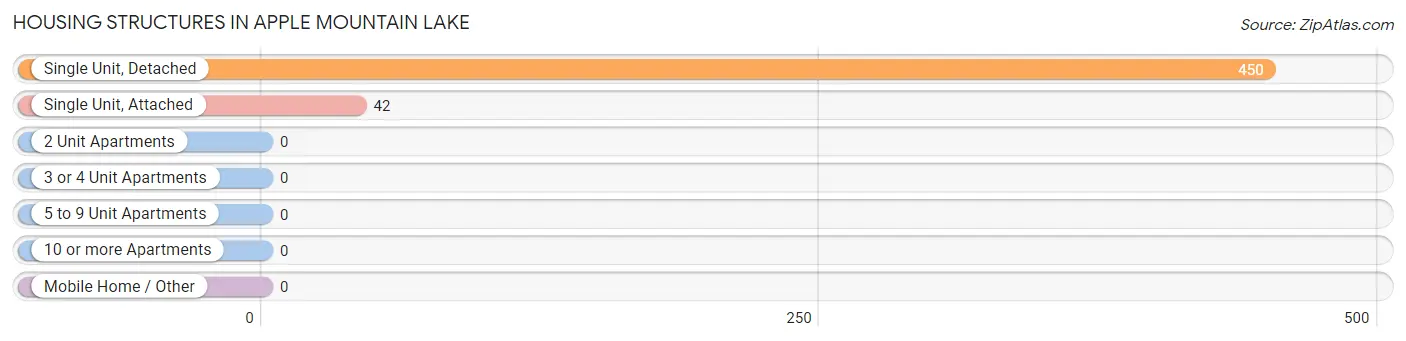
| Structure Type | # Housing Units | % Housing Units |
| Single Unit, Detached | 450 | 91.5% |
| Single Unit, Attached | 42 | 8.5% |
| 2 Unit Apartments | 0 | 0.0% |
| 3 or 4 Unit Apartments | 0 | 0.0% |
| 5 to 9 Unit Apartments | 0 | 0.0% |
| 10 or more Apartments | 0 | 0.0% |
| Mobile Home / Other | 0 | 0.0% |
| Total | 492 | 100.0% |
Housing Structures by Occupancy in Apple Mountain Lake
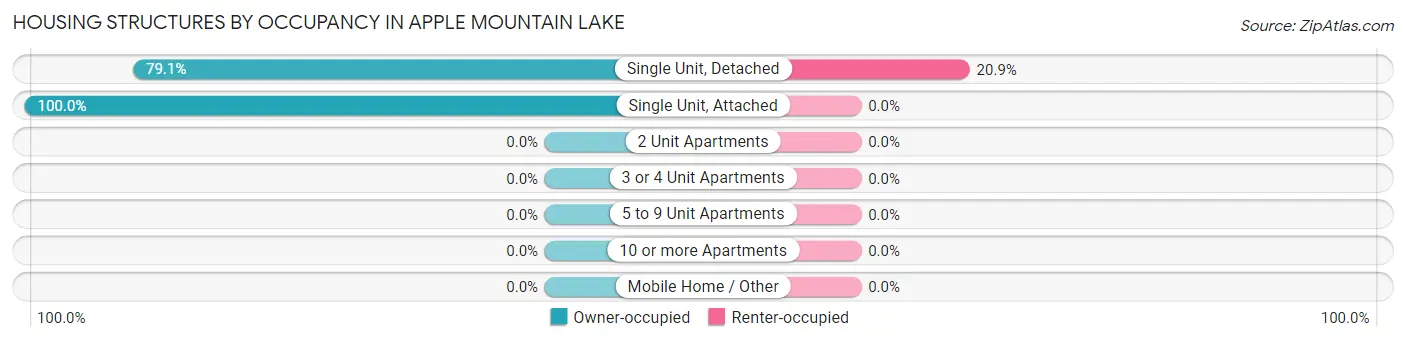
| Structure Type | Owner-occupied | Renter-occupied |
| Single Unit, Detached | 356 (79.1%) | 94 (20.9%) |
| Single Unit, Attached | 42 (100.0%) | 0 (0.0%) |
| 2 Unit Apartments | 0 (0.0%) | 0 (0.0%) |
| 3 or 4 Unit Apartments | 0 (0.0%) | 0 (0.0%) |
| 5 to 9 Unit Apartments | 0 (0.0%) | 0 (0.0%) |
| 10 or more Apartments | 0 (0.0%) | 0 (0.0%) |
| Mobile Home / Other | 0 (0.0%) | 0 (0.0%) |
| Total | 398 (80.9%) | 94 (19.1%) |
Housing Structures by Number of Rooms in Apple Mountain Lake
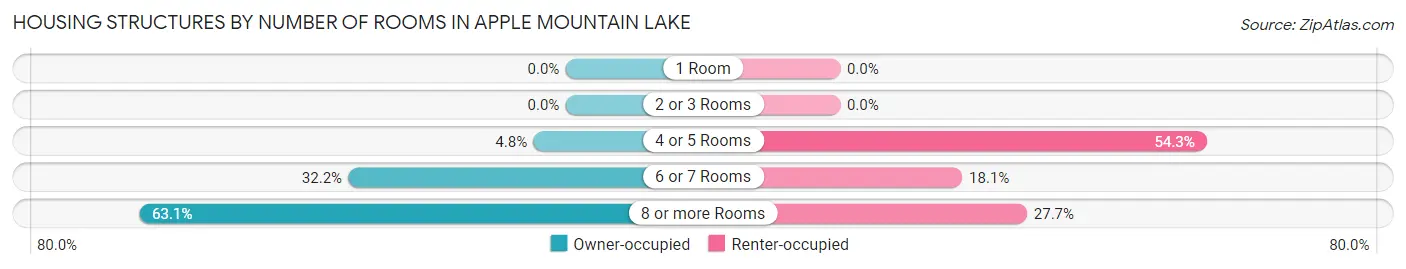
| Number of Rooms | Owner-occupied | Renter-occupied |
| 1 Room | 0 (0.0%) | 0 (0.0%) |
| 2 or 3 Rooms | 0 (0.0%) | 0 (0.0%) |
| 4 or 5 Rooms | 19 (4.8%) | 51 (54.3%) |
| 6 or 7 Rooms | 128 (32.2%) | 17 (18.1%) |
| 8 or more Rooms | 251 (63.1%) | 26 (27.7%) |
| Total | 398 (100.0%) | 94 (100.0%) |
Housing Structure by Heating Type in Apple Mountain Lake
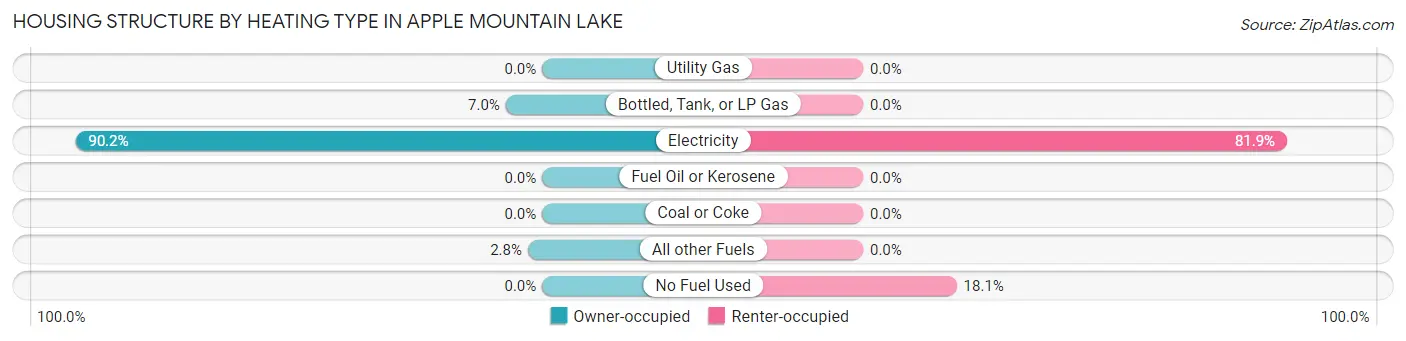
| Heating Type | Owner-occupied | Renter-occupied |
| Utility Gas | 0 (0.0%) | 0 (0.0%) |
| Bottled, Tank, or LP Gas | 28 (7.0%) | 0 (0.0%) |
| Electricity | 359 (90.2%) | 77 (81.9%) |
| Fuel Oil or Kerosene | 0 (0.0%) | 0 (0.0%) |
| Coal or Coke | 0 (0.0%) | 0 (0.0%) |
| All other Fuels | 11 (2.8%) | 0 (0.0%) |
| No Fuel Used | 0 (0.0%) | 17 (18.1%) |
| Total | 398 (100.0%) | 94 (100.0%) |
Household Vehicle Usage in Apple Mountain Lake
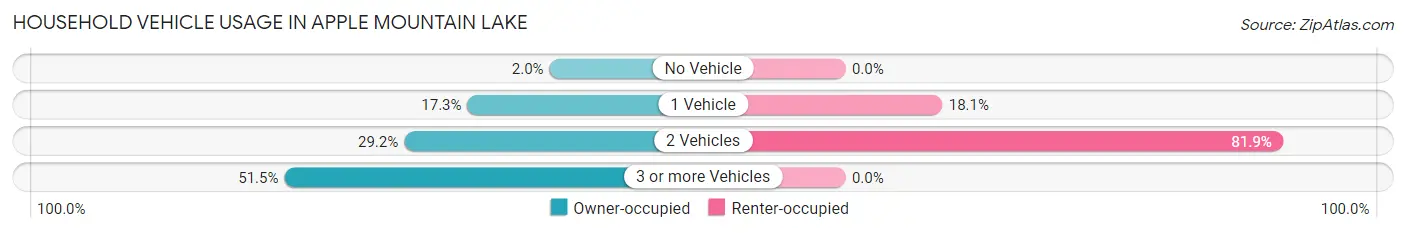
| Vehicles per Household | Owner-occupied | Renter-occupied |
| No Vehicle | 8 (2.0%) | 0 (0.0%) |
| 1 Vehicle | 69 (17.3%) | 17 (18.1%) |
| 2 Vehicles | 116 (29.1%) | 77 (81.9%) |
| 3 or more Vehicles | 205 (51.5%) | 0 (0.0%) |
| Total | 398 (100.0%) | 94 (100.0%) |
Real Estate & Mortgages in Apple Mountain Lake
Real Estate and Mortgage Overview in Apple Mountain Lake
| Characteristic | Without Mortgage | With Mortgage |
| Housing Units | 82 | 316 |
| Median Property Value | $281,100 | $329,000 |
| Median Household Income | - | - |
| Monthly Housing Costs | $495 | $17 |
| Real Estate Taxes | $1,573 | $0 |
Property Value by Mortgage Status in Apple Mountain Lake
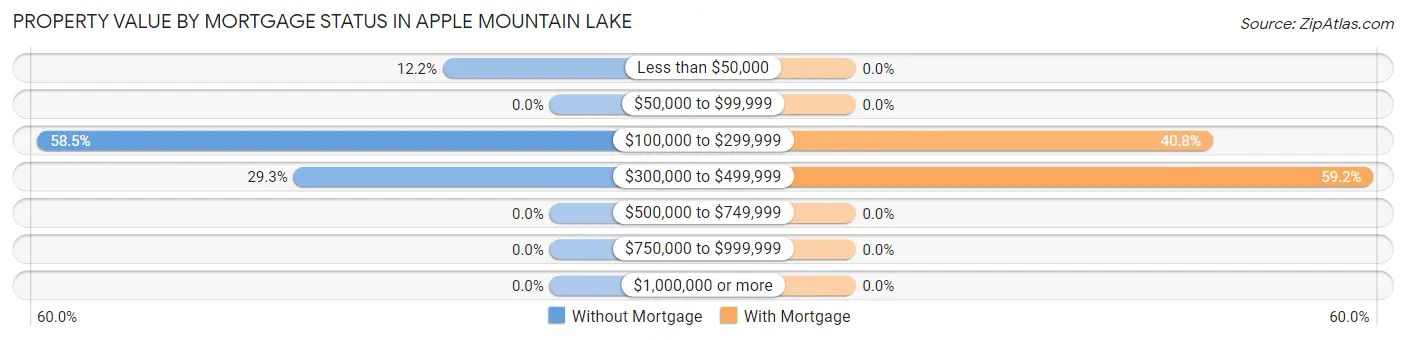
| Property Value | Without Mortgage | With Mortgage |
| Less than $50,000 | 10 (12.2%) | 0 (0.0%) |
| $50,000 to $99,999 | 0 (0.0%) | 0 (0.0%) |
| $100,000 to $299,999 | 48 (58.5%) | 129 (40.8%) |
| $300,000 to $499,999 | 24 (29.3%) | 187 (59.2%) |
| $500,000 to $749,999 | 0 (0.0%) | 0 (0.0%) |
| $750,000 to $999,999 | 0 (0.0%) | 0 (0.0%) |
| $1,000,000 or more | 0 (0.0%) | 0 (0.0%) |
| Total | 82 (100.0%) | 316 (100.0%) |
Household Income by Mortgage Status in Apple Mountain Lake
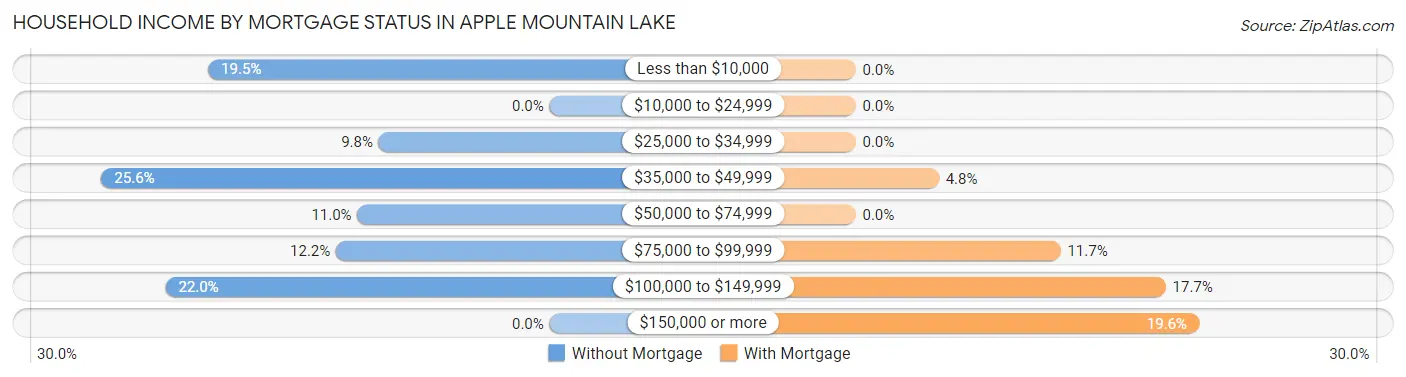
| Household Income | Without Mortgage | With Mortgage |
| Less than $10,000 | 16 (19.5%) | 0 (0.0%) |
| $10,000 to $24,999 | 0 (0.0%) | 0 (0.0%) |
| $25,000 to $34,999 | 8 (9.8%) | 0 (0.0%) |
| $35,000 to $49,999 | 21 (25.6%) | 15 (4.8%) |
| $50,000 to $74,999 | 9 (11.0%) | 0 (0.0%) |
| $75,000 to $99,999 | 10 (12.2%) | 37 (11.7%) |
| $100,000 to $149,999 | 18 (22.0%) | 56 (17.7%) |
| $150,000 or more | 0 (0.0%) | 62 (19.6%) |
| Total | 82 (100.0%) | 316 (100.0%) |
Property Value to Household Income Ratio in Apple Mountain Lake
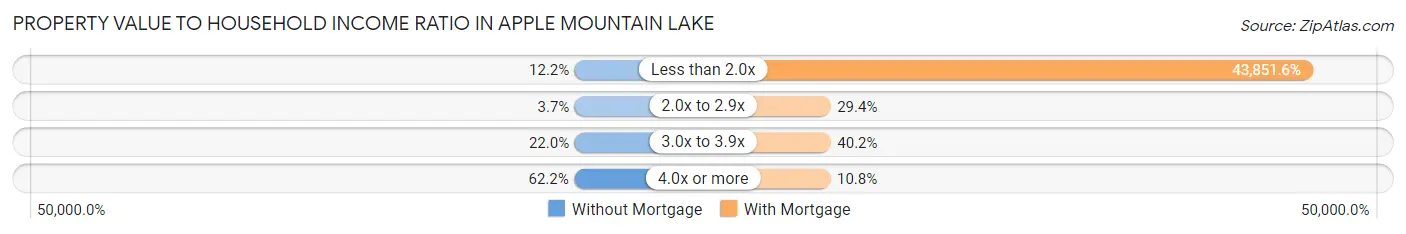
| Value-to-Income Ratio | Without Mortgage | With Mortgage |
| Less than 2.0x | 10 (12.2%) | 138,571 (43,851.6%) |
| 2.0x to 2.9x | 3 (3.7%) | 93 (29.4%) |
| 3.0x to 3.9x | 18 (22.0%) | 127 (40.2%) |
| 4.0x or more | 51 (62.2%) | 34 (10.8%) |
| Total | 82 (100.0%) | 316 (100.0%) |
Real Estate Taxes by Mortgage Status in Apple Mountain Lake
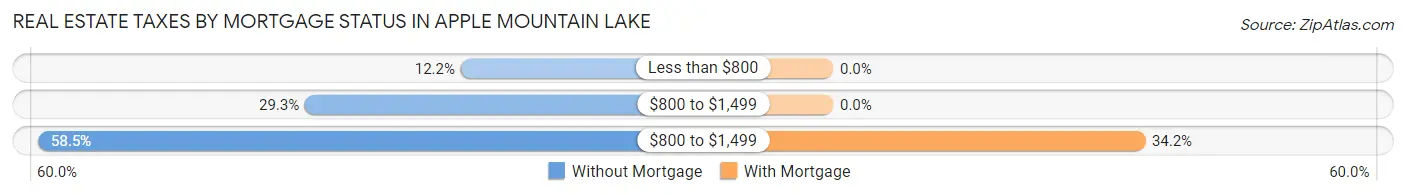
| Property Taxes | Without Mortgage | With Mortgage |
| Less than $800 | 10 (12.2%) | 0 (0.0%) |
| $800 to $1,499 | 24 (29.3%) | 0 (0.0%) |
| $800 to $1,499 | 48 (58.5%) | 108 (34.2%) |
| Total | 82 (100.0%) | 316 (100.0%) |
Health & Disability in Apple Mountain Lake
Health Insurance Coverage by Age in Apple Mountain Lake
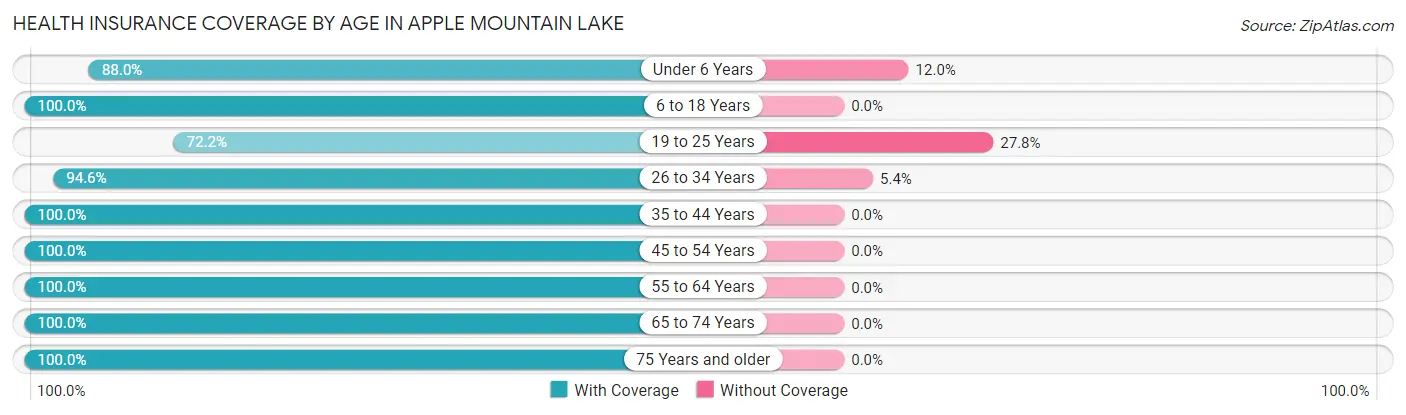
| Age Bracket | With Coverage | Without Coverage |
| Under 6 Years | 66 (88.0%) | 9 (12.0%) |
| 6 to 18 Years | 244 (100.0%) | 0 (0.0%) |
| 19 to 25 Years | 148 (72.2%) | 57 (27.8%) |
| 26 to 34 Years | 194 (94.6%) | 11 (5.4%) |
| 35 to 44 Years | 269 (100.0%) | 0 (0.0%) |
| 45 to 54 Years | 226 (100.0%) | 0 (0.0%) |
| 55 to 64 Years | 113 (100.0%) | 0 (0.0%) |
| 65 to 74 Years | 200 (100.0%) | 0 (0.0%) |
| 75 Years and older | 47 (100.0%) | 0 (0.0%) |
| Total | 1,507 (95.1%) | 77 (4.9%) |
Health Insurance Coverage by Citizenship Status in Apple Mountain Lake
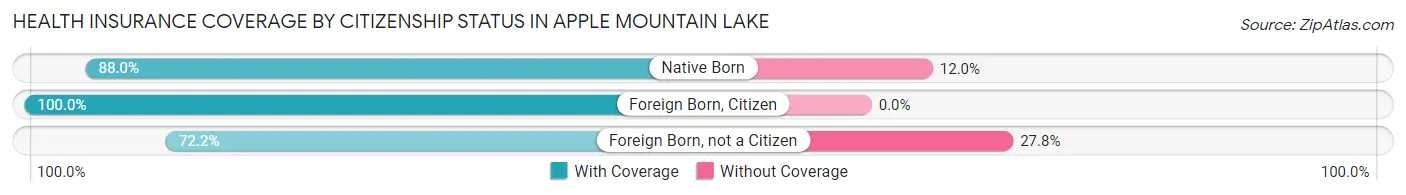
| Citizenship Status | With Coverage | Without Coverage |
| Native Born | 66 (88.0%) | 9 (12.0%) |
| Foreign Born, Citizen | 244 (100.0%) | 0 (0.0%) |
| Foreign Born, not a Citizen | 148 (72.2%) | 57 (27.8%) |
Health Insurance Coverage by Household Income in Apple Mountain Lake
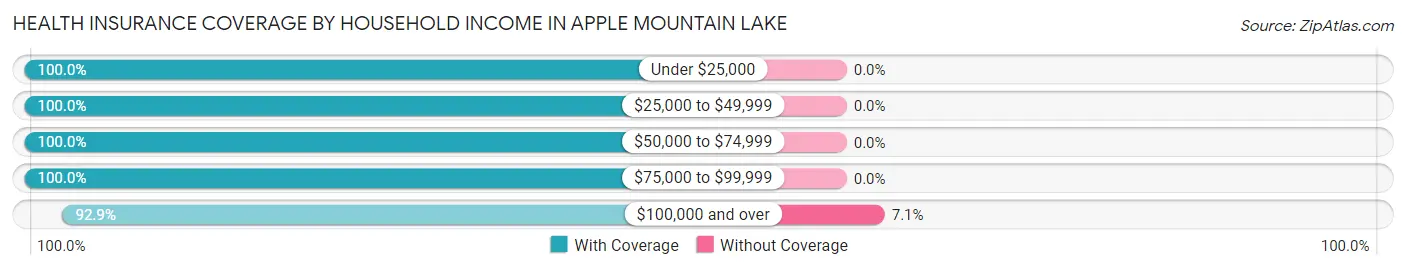
| Household Income | With Coverage | Without Coverage |
| Under $25,000 | 36 (100.0%) | 0 (0.0%) |
| $25,000 to $49,999 | 142 (100.0%) | 0 (0.0%) |
| $50,000 to $74,999 | 139 (100.0%) | 0 (0.0%) |
| $75,000 to $99,999 | 185 (100.0%) | 0 (0.0%) |
| $100,000 and over | 1,005 (92.9%) | 77 (7.1%) |
Public vs Private Health Insurance Coverage by Age in Apple Mountain Lake
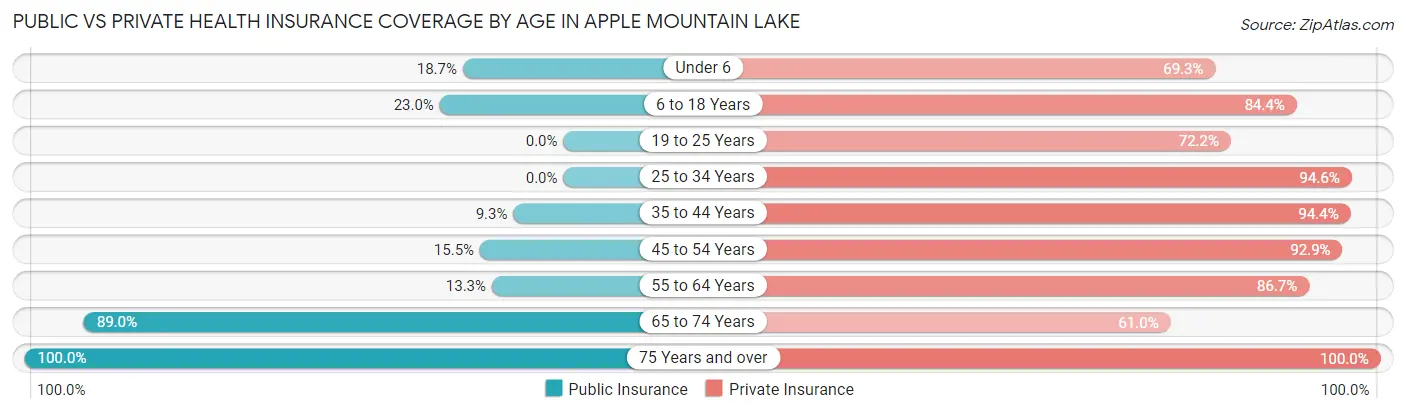
| Age Bracket | Public Insurance | Private Insurance |
| Under 6 | 14 (18.7%) | 52 (69.3%) |
| 6 to 18 Years | 56 (23.0%) | 206 (84.4%) |
| 19 to 25 Years | 0 (0.0%) | 148 (72.2%) |
| 25 to 34 Years | 0 (0.0%) | 194 (94.6%) |
| 35 to 44 Years | 25 (9.3%) | 254 (94.4%) |
| 45 to 54 Years | 35 (15.5%) | 210 (92.9%) |
| 55 to 64 Years | 15 (13.3%) | 98 (86.7%) |
| 65 to 74 Years | 178 (89.0%) | 122 (61.0%) |
| 75 Years and over | 47 (100.0%) | 47 (100.0%) |
| Total | 370 (23.4%) | 1,331 (84.0%) |
Disability Status by Sex by Age in Apple Mountain Lake
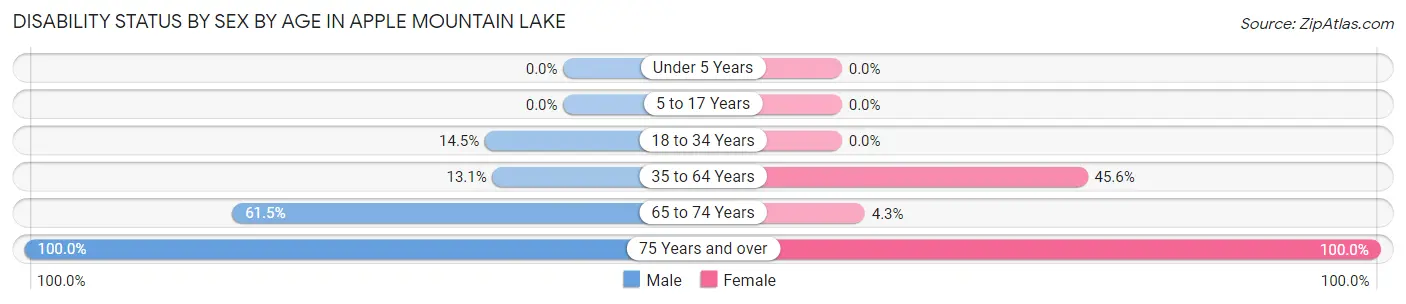
| Age Bracket | Male | Female |
| Under 5 Years | 0 (0.0%) | 0 (0.0%) |
| 5 to 17 Years | 0 (0.0%) | 0 (0.0%) |
| 18 to 34 Years | 44 (14.5%) | 0 (0.0%) |
| 35 to 64 Years | 41 (13.1%) | 135 (45.6%) |
| 65 to 74 Years | 51 (61.5%) | 5 (4.3%) |
| 75 Years and over | 6 (100.0%) | 41 (100.0%) |
Disability Class by Sex by Age in Apple Mountain Lake
Disability Class: Hearing Difficulty
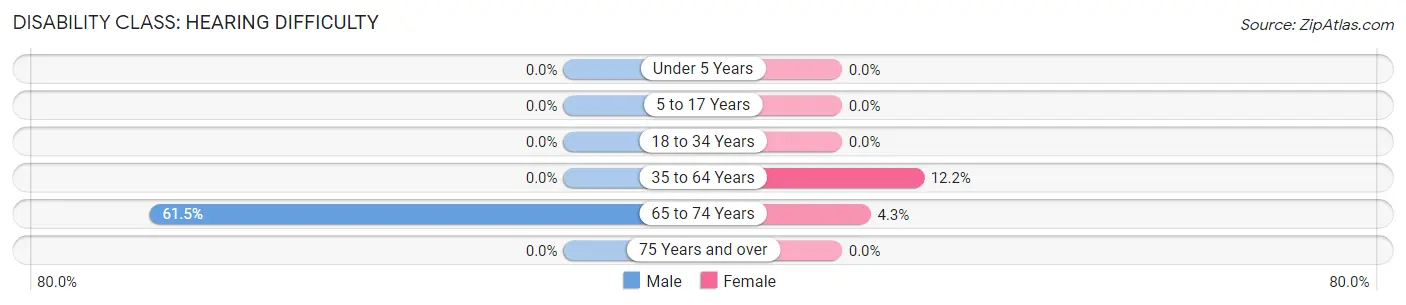
| Age Bracket | Male | Female |
| Under 5 Years | 0 (0.0%) | 0 (0.0%) |
| 5 to 17 Years | 0 (0.0%) | 0 (0.0%) |
| 18 to 34 Years | 0 (0.0%) | 0 (0.0%) |
| 35 to 64 Years | 0 (0.0%) | 36 (12.2%) |
| 65 to 74 Years | 51 (61.5%) | 5 (4.3%) |
| 75 Years and over | 0 (0.0%) | 0 (0.0%) |
Disability Class: Vision Difficulty
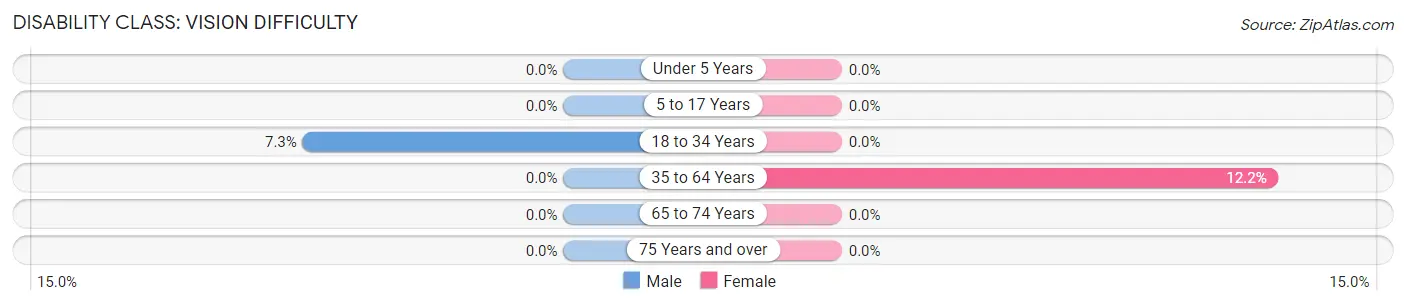
| Age Bracket | Male | Female |
| Under 5 Years | 0 (0.0%) | 0 (0.0%) |
| 5 to 17 Years | 0 (0.0%) | 0 (0.0%) |
| 18 to 34 Years | 22 (7.3%) | 0 (0.0%) |
| 35 to 64 Years | 0 (0.0%) | 36 (12.2%) |
| 65 to 74 Years | 0 (0.0%) | 0 (0.0%) |
| 75 Years and over | 0 (0.0%) | 0 (0.0%) |
Disability Class: Cognitive Difficulty
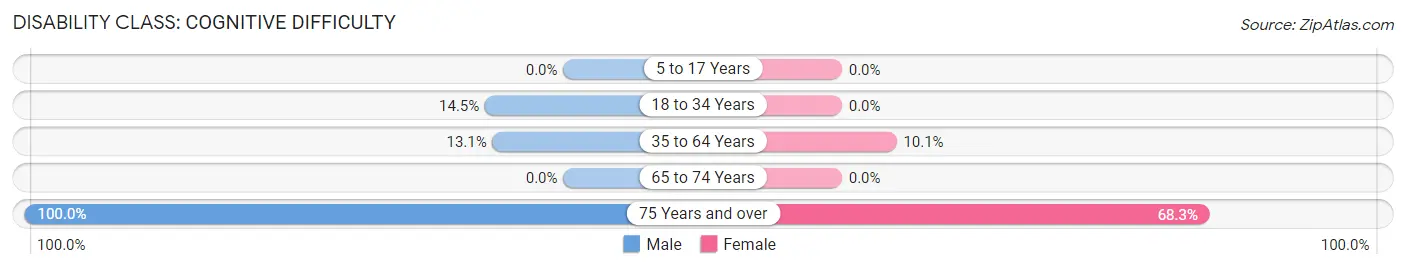
| Age Bracket | Male | Female |
| 5 to 17 Years | 0 (0.0%) | 0 (0.0%) |
| 18 to 34 Years | 44 (14.5%) | 0 (0.0%) |
| 35 to 64 Years | 41 (13.1%) | 30 (10.1%) |
| 65 to 74 Years | 0 (0.0%) | 0 (0.0%) |
| 75 Years and over | 6 (100.0%) | 28 (68.3%) |
Disability Class: Ambulatory Difficulty
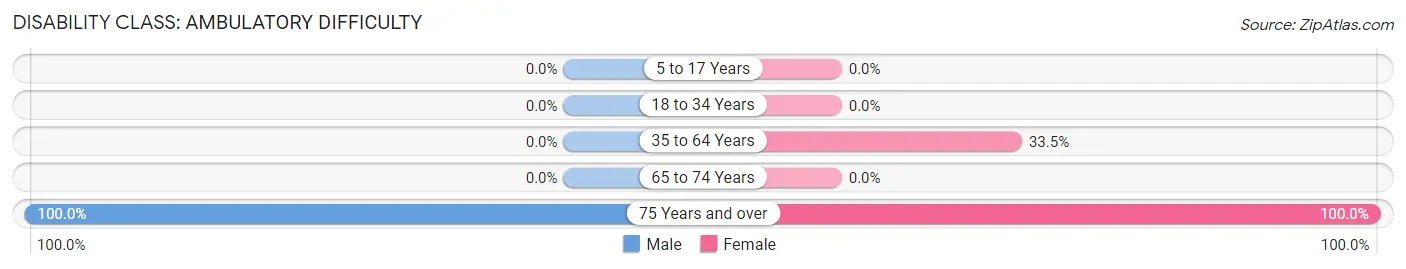
| Age Bracket | Male | Female |
| 5 to 17 Years | 0 (0.0%) | 0 (0.0%) |
| 18 to 34 Years | 0 (0.0%) | 0 (0.0%) |
| 35 to 64 Years | 0 (0.0%) | 99 (33.5%) |
| 65 to 74 Years | 0 (0.0%) | 0 (0.0%) |
| 75 Years and over | 6 (100.0%) | 41 (100.0%) |
Disability Class: Self-Care Difficulty
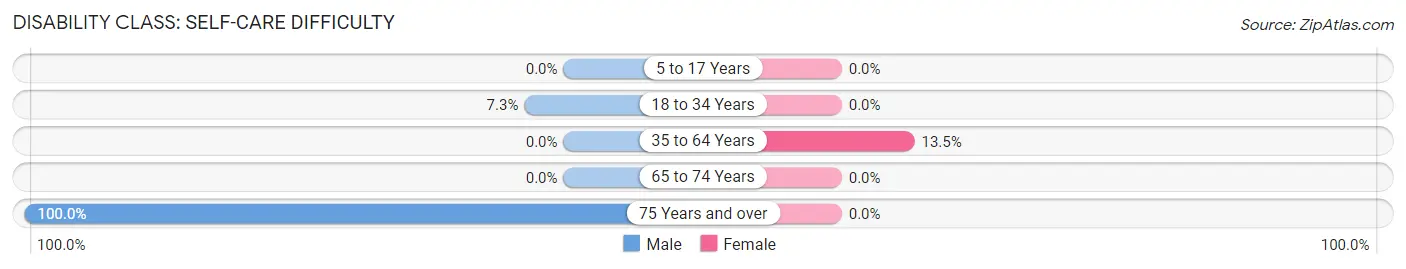
| Age Bracket | Male | Female |
| 5 to 17 Years | 0 (0.0%) | 0 (0.0%) |
| 18 to 34 Years | 22 (7.3%) | 0 (0.0%) |
| 35 to 64 Years | 0 (0.0%) | 40 (13.5%) |
| 65 to 74 Years | 0 (0.0%) | 0 (0.0%) |
| 75 Years and over | 6 (100.0%) | 0 (0.0%) |
Technology Access in Apple Mountain Lake
Computing Device Access in Apple Mountain Lake
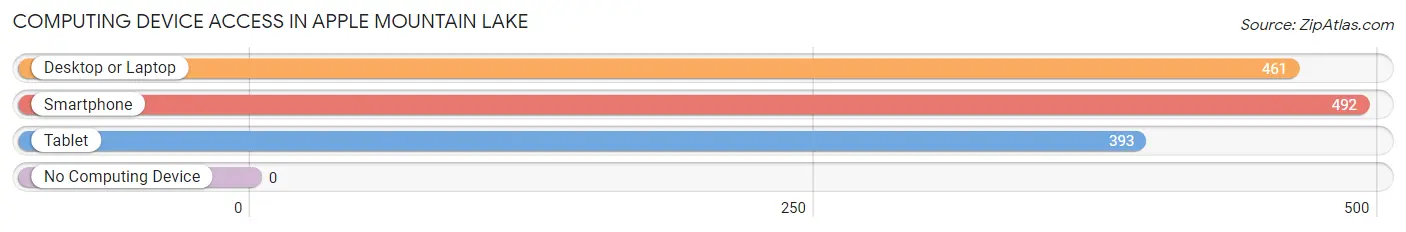
| Device Type | # Households | % Households |
| Desktop or Laptop | 461 | 93.7% |
| Smartphone | 492 | 100.0% |
| Tablet | 393 | 79.9% |
| No Computing Device | 0 | 0.0% |
| Total | 492 | 100.0% |
Internet Access in Apple Mountain Lake
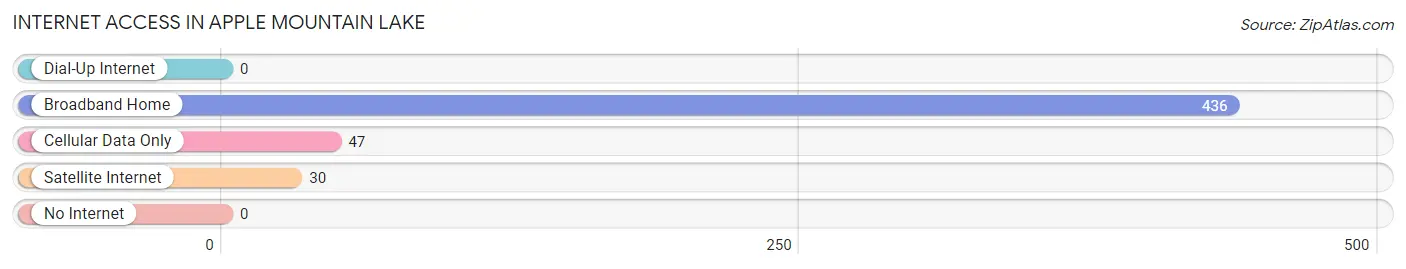
| Internet Type | # Households | % Households |
| Dial-Up Internet | 0 | 0.0% |
| Broadband Home | 436 | 88.6% |
| Cellular Data Only | 47 | 9.6% |
| Satellite Internet | 30 | 6.1% |
| No Internet | 0 | 0.0% |
| Total | 492 | 100.0% |
Apple Mountain Lake Summary
Apple Mountain Lake, VA is a small town located in the Shenandoah Valley of Virginia. It is situated in the foothills of the Blue Ridge Mountains and is surrounded by the George Washington National Forest. The town is located in the northern part of the state, about an hour and a half from Washington, D.C. and two hours from Richmond.
History
Apple Mountain Lake was founded in 1790 by a group of settlers from Pennsylvania. The town was originally called Apple Mountain, but the name was changed to Apple Mountain Lake in 1820 when a lake was created by damming a nearby stream. The lake was used for fishing and recreation, and the town quickly became a popular destination for tourists.
In the late 19th century, Apple Mountain Lake became a popular summer resort for wealthy families from the east coast. The town was home to several large hotels and resorts, and the lake was a popular spot for swimming and boating.
In the early 20th century, the town began to decline as the popularity of the resorts faded. The Great Depression hit the town hard, and many of the businesses and hotels closed. The town was revitalized in the 1950s when the nearby George Washington National Forest was established. The forest brought new visitors to the area, and the town began to grow again.
Geography
Apple Mountain Lake is located in the northern part of Virginia, in the Shenandoah Valley. The town is situated in the foothills of the Blue Ridge Mountains and is surrounded by the George Washington National Forest. The town is located about an hour and a half from Washington, D.C. and two hours from Richmond.
The town is situated on the banks of Apple Mountain Lake, a man-made lake created by damming a nearby stream. The lake is a popular spot for fishing and boating, and is home to a variety of wildlife. The lake is also a popular spot for swimming and other water activities.
Economy
Apple Mountain Lake is a small town with a population of just over 1,000 people. The town’s economy is largely based on tourism, with many visitors coming to the area to enjoy the lake and the nearby George Washington National Forest. The town is also home to several small businesses, including restaurants, shops, and lodging.
Demographics
As of the 2010 census, the population of Apple Mountain Lake was 1,072. The town is predominantly white, with 91.3% of the population identifying as white. The town also has a small African American population, with 4.3% of the population identifying as African American. The median household income in the town is $45,000, and the median age is 44.
Conclusion
Apple Mountain Lake, VA is a small town located in the Shenandoah Valley of Virginia. The town is situated in the foothills of the Blue Ridge Mountains and is surrounded by the George Washington National Forest. The town is home to a population of just over 1,000 people, and the economy is largely based on tourism. The town is predominantly white, with a small African American population. Apple Mountain Lake is a popular destination for tourists, and the lake is a popular spot for fishing and other water activities.
Common Questions
What is Per Capita Income in Apple Mountain Lake?
Per Capita income in Apple Mountain Lake is $36,616.
What is the Median Family Income in Apple Mountain Lake?
Median Family Income in Apple Mountain Lake is $107,708.
What is the Median Household income in Apple Mountain Lake?
Median Household Income in Apple Mountain Lake is $120,539.
What is Income or Wage Gap in Apple Mountain Lake?
Income or Wage Gap in Apple Mountain Lake is 36.4%.
Women in Apple Mountain Lake earn 63.6 cents for every dollar earned by a man.
What is Inequality or Gini Index in Apple Mountain Lake?
Inequality or Gini Index in Apple Mountain Lake is 0.27.
What is the Total Population of Apple Mountain Lake?
Total Population of Apple Mountain Lake is 1,584.
What is the Total Male Population of Apple Mountain Lake?
Total Male Population of Apple Mountain Lake is 933.
What is the Total Female Population of Apple Mountain Lake?
Total Female Population of Apple Mountain Lake is 651.
What is the Ratio of Males per 100 Females in Apple Mountain Lake?
There are 143.32 Males per 100 Females in Apple Mountain Lake.
What is the Ratio of Females per 100 Males in Apple Mountain Lake?
There are 69.77 Females per 100 Males in Apple Mountain Lake.
What is the Median Population Age in Apple Mountain Lake?
Median Population Age in Apple Mountain Lake is 35.9 Years.
What is the Average Family Size in Apple Mountain Lake
Average Family Size in Apple Mountain Lake is 3.2 People.
What is the Average Household Size in Apple Mountain Lake
Average Household Size in Apple Mountain Lake is 3.2 People.
How Large is the Labor Force in Apple Mountain Lake?
There are 893 People in the Labor Forcein in Apple Mountain Lake.
What is the Percentage of People in the Labor Force in Apple Mountain Lake?
66.7% of People are in the Labor Force in Apple Mountain Lake.
What is the Unemployment Rate in Apple Mountain Lake?
Unemployment Rate in Apple Mountain Lake is 1.9%.