Chatmoss, VA Map & Demographics
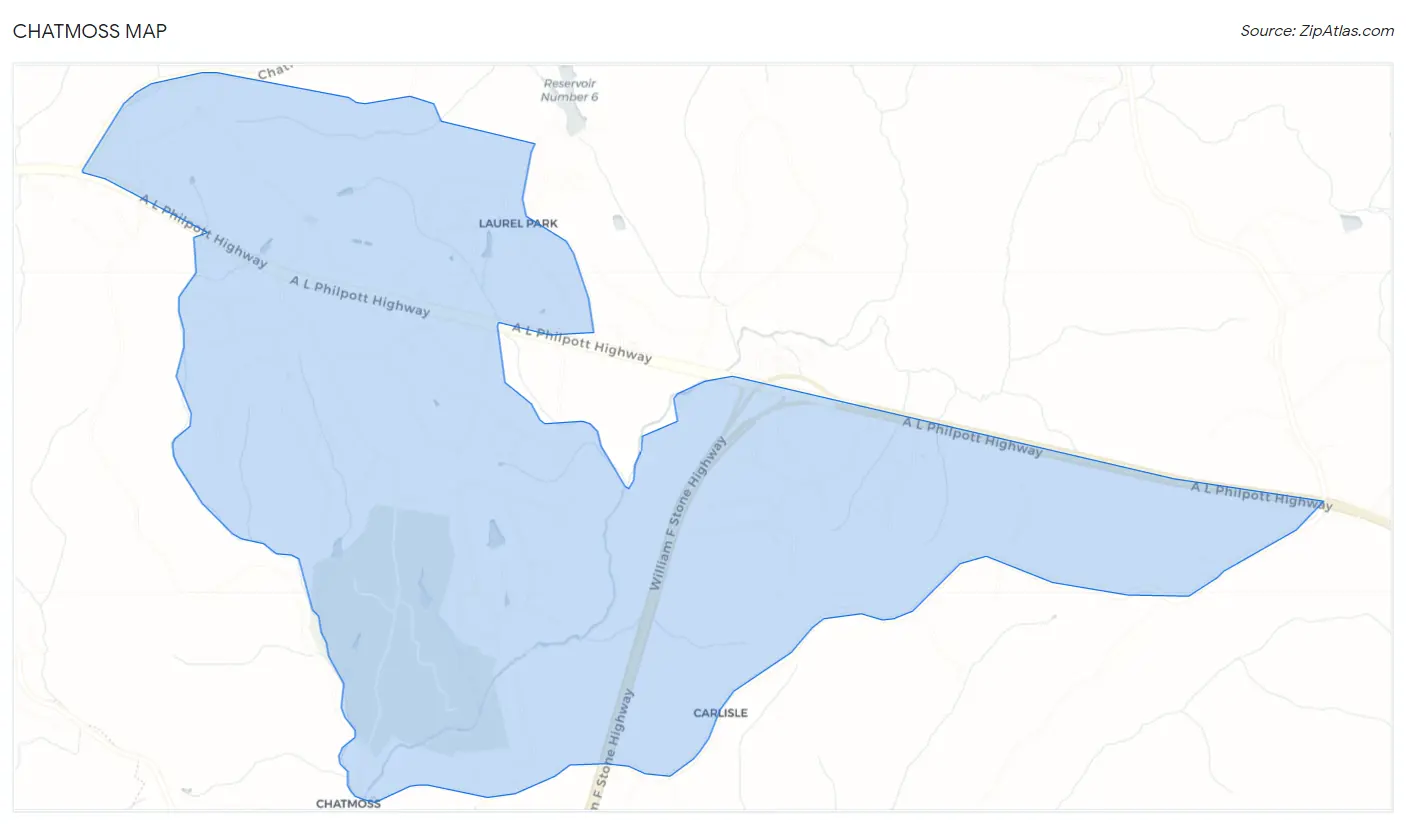
Chatmoss Map
Chatmoss Overview
$58,851
PER CAPITA INCOME
$108,527
AVG FAMILY INCOME
$68,945
AVG HOUSEHOLD INCOME
46.5%
WAGE / INCOME GAP [ % ]
53.5¢/ $1
WAGE / INCOME GAP [ $ ]
0.49
INEQUALITY / GINI INDEX
1,064
TOTAL POPULATION
462
MALE POPULATION
602
FEMALE POPULATION
76.74
MALES / 100 FEMALES
130.30
FEMALES / 100 MALES
63.4
MEDIAN AGE
2.3
AVG FAMILY SIZE
1.9
AVG HOUSEHOLD SIZE
615
LABOR FORCE [ PEOPLE ]
60.2%
PERCENT IN LABOR FORCE
Income in Chatmoss
Income Overview in Chatmoss
Per Capita Income in Chatmoss is $58,851, while median incomes of families and households are $108,527 and $68,945 respectively.
| Characteristic | Number | Measure |
| Per Capita Income | 1,064 | $58,851 |
| Median Family Income | 325 | $108,527 |
| Mean Family Income | 325 | $139,544 |
| Median Household Income | 575 | $68,945 |
| Mean Household Income | 575 | $107,473 |
| Income Deficit | 325 | $0 |
| Wage / Income Gap (%) | 1,064 | 46.46% |
| Wage / Income Gap ($) | 1,064 | 53.54¢ per $1 |
| Gini / Inequality Index | 1,064 | 0.49 |
Earnings by Sex in Chatmoss
Average Earnings in Chatmoss are $37,171, $46,350 for men and $24,818 for women, a difference of 46.5%.
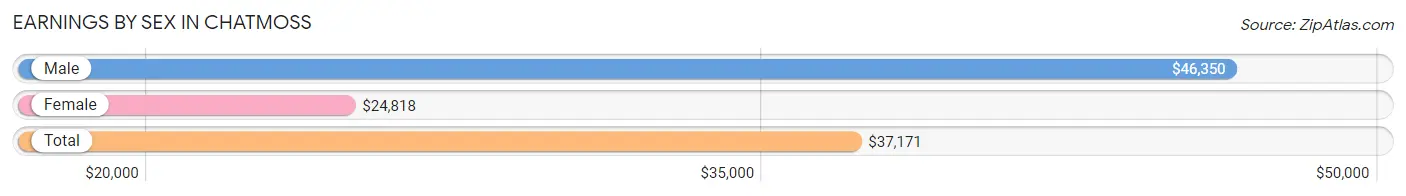
| Sex | Number | Average Earnings |
| Male | 286 (42.3%) | $46,350 |
| Female | 390 (57.7%) | $24,818 |
| Total | 676 (100.0%) | $37,171 |
Earnings by Sex by Income Bracket in Chatmoss
The most common earnings brackets in Chatmoss are $35,000 to $39,999 for men (84 | 29.4%) and $22,500 to $24,999 for women (55 | 14.1%).
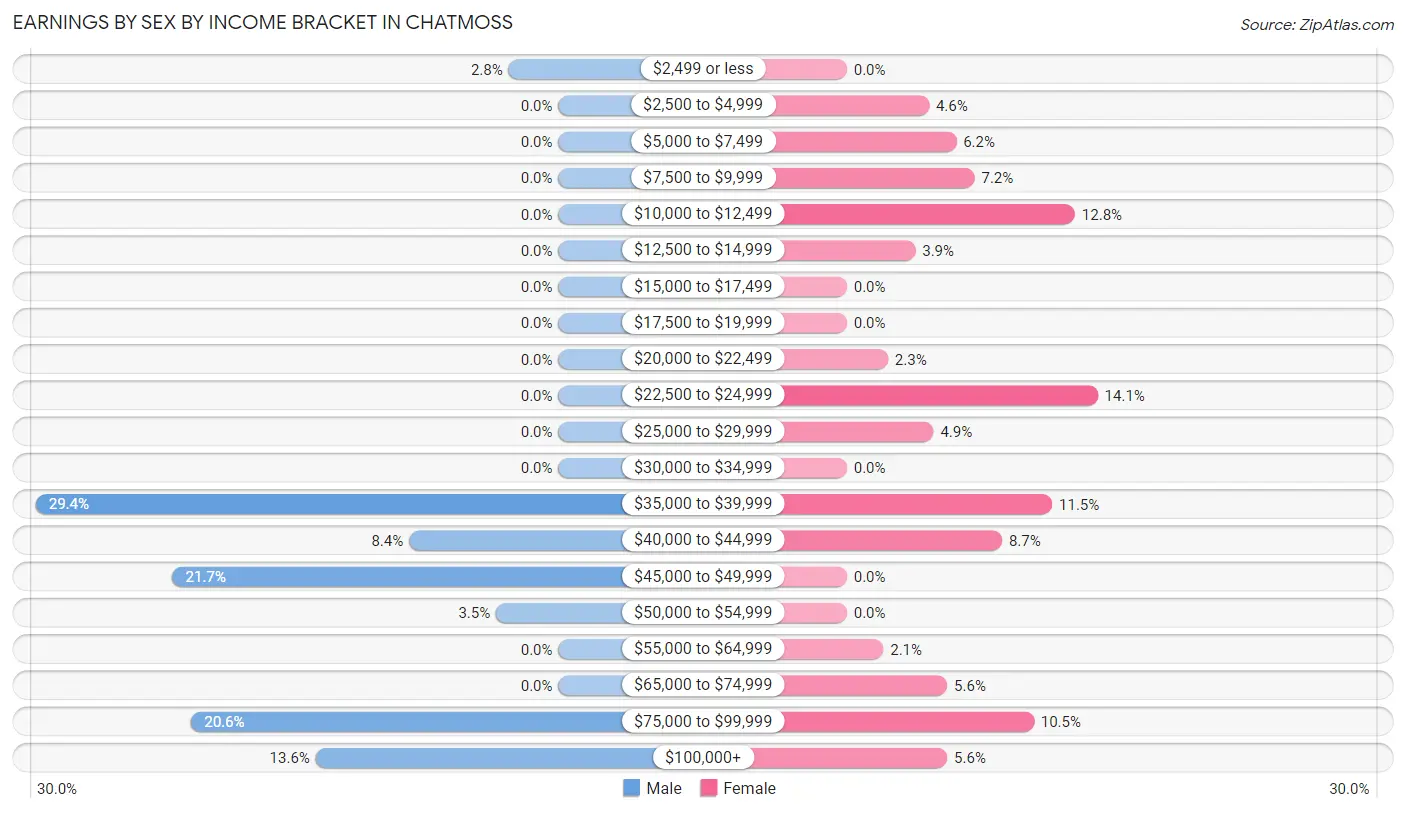
| Income | Male | Female |
| $2,499 or less | 8 (2.8%) | 0 (0.0%) |
| $2,500 to $4,999 | 0 (0.0%) | 18 (4.6%) |
| $5,000 to $7,499 | 0 (0.0%) | 24 (6.1%) |
| $7,500 to $9,999 | 0 (0.0%) | 28 (7.2%) |
| $10,000 to $12,499 | 0 (0.0%) | 50 (12.8%) |
| $12,500 to $14,999 | 0 (0.0%) | 15 (3.8%) |
| $15,000 to $17,499 | 0 (0.0%) | 0 (0.0%) |
| $17,500 to $19,999 | 0 (0.0%) | 0 (0.0%) |
| $20,000 to $22,499 | 0 (0.0%) | 9 (2.3%) |
| $22,500 to $24,999 | 0 (0.0%) | 55 (14.1%) |
| $25,000 to $29,999 | 0 (0.0%) | 19 (4.9%) |
| $30,000 to $34,999 | 0 (0.0%) | 0 (0.0%) |
| $35,000 to $39,999 | 84 (29.4%) | 45 (11.5%) |
| $40,000 to $44,999 | 24 (8.4%) | 34 (8.7%) |
| $45,000 to $49,999 | 62 (21.7%) | 0 (0.0%) |
| $50,000 to $54,999 | 10 (3.5%) | 0 (0.0%) |
| $55,000 to $64,999 | 0 (0.0%) | 8 (2.1%) |
| $65,000 to $74,999 | 0 (0.0%) | 22 (5.6%) |
| $75,000 to $99,999 | 59 (20.6%) | 41 (10.5%) |
| $100,000+ | 39 (13.6%) | 22 (5.6%) |
| Total | 286 (100.0%) | 390 (100.0%) |
Earnings by Sex by Educational Attainment in Chatmoss
Average earnings in Chatmoss are $46,350 for men and $36,639 for women, a difference of 20.9%. Men with an educational attainment of college or associate's degree enjoy the highest average annual earnings of $43,385, while those with college or associate's degree education earn the least with $43,385. Women with an educational attainment of college or associate's degree earn the most with the average annual earnings of $41,635, while those with college or associate's degree education have the smallest earnings of $41,635.
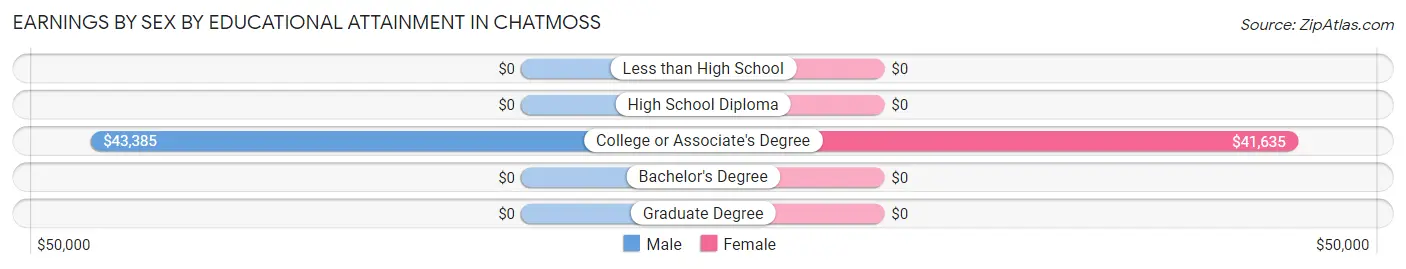
| Educational Attainment | Male Income | Female Income |
| Less than High School | - | - |
| High School Diploma | - | - |
| College or Associate's Degree | $43,385 | $41,635 |
| Bachelor's Degree | - | - |
| Graduate Degree | - | - |
| Total | $46,350 | $36,639 |
Family Income in Chatmoss
Family Income Brackets in Chatmoss
According to the Chatmoss family income data, there are 71 families falling into the $200,000+ income range, which is the most common income bracket and makes up 21.8% of all families.
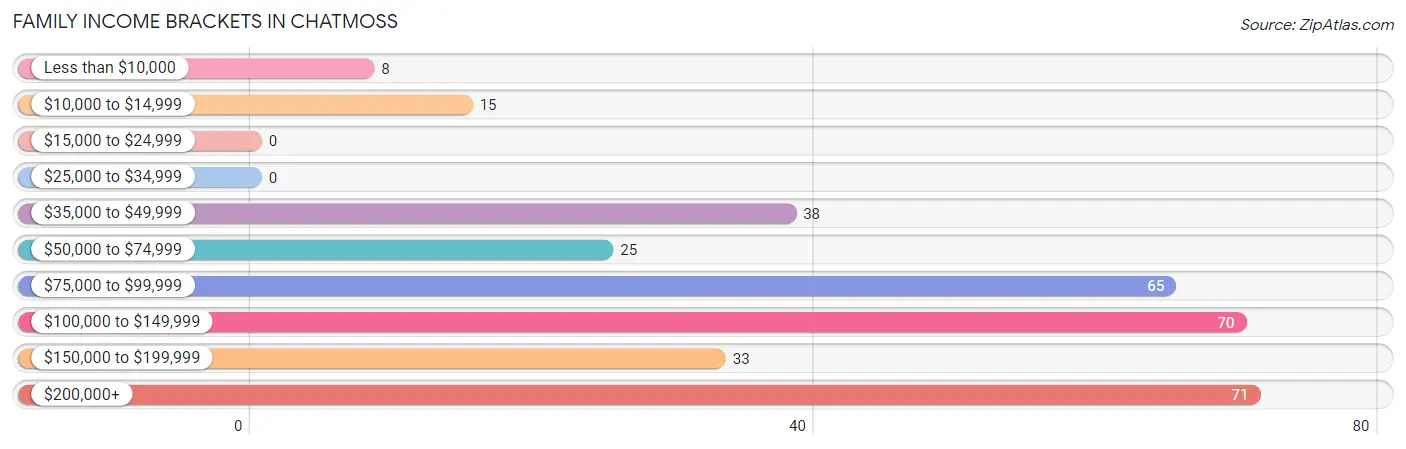
| Income Bracket | # Families | % Families |
| Less than $10,000 | 8 | 2.5% |
| $10,000 to $14,999 | 15 | 4.6% |
| $15,000 to $24,999 | 0 | 0.0% |
| $25,000 to $34,999 | 0 | 0.0% |
| $35,000 to $49,999 | 38 | 11.7% |
| $50,000 to $74,999 | 25 | 7.7% |
| $75,000 to $99,999 | 65 | 20.0% |
| $100,000 to $149,999 | 70 | 21.5% |
| $150,000 to $199,999 | 33 | 10.2% |
| $200,000+ | 71 | 21.8% |
Family Income by Famaliy Size in Chatmoss
3-person families (45 | 13.9%) account for the highest median family income in Chatmoss with $109,330 per family, while 2-person families (276 | 84.9%) have the highest median income of $49,490 per family member.
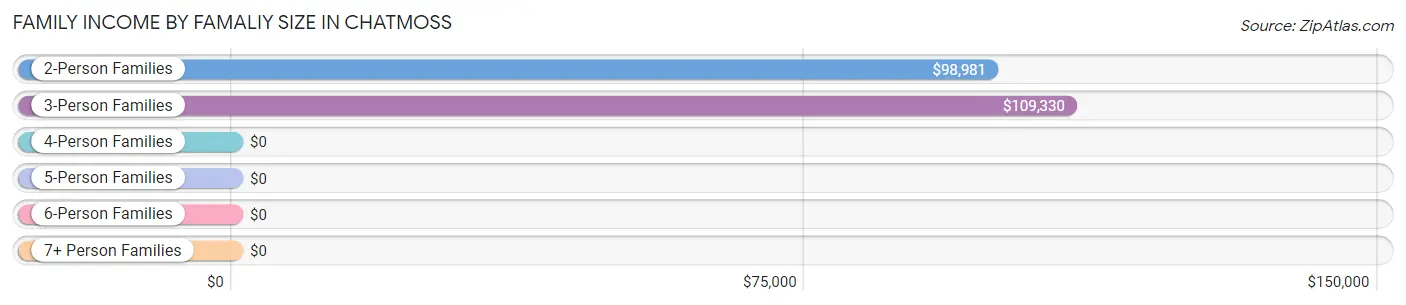
| Income Bracket | # Families | Median Income |
| 2-Person Families | 276 (84.9%) | $98,981 |
| 3-Person Families | 45 (13.9%) | $109,330 |
| 4-Person Families | 4 (1.2%) | $0 |
| 5-Person Families | 0 (0.0%) | $0 |
| 6-Person Families | 0 (0.0%) | $0 |
| 7+ Person Families | 0 (0.0%) | $0 |
| Total | 325 (100.0%) | $108,527 |
Family Income by Number of Earners in Chatmoss
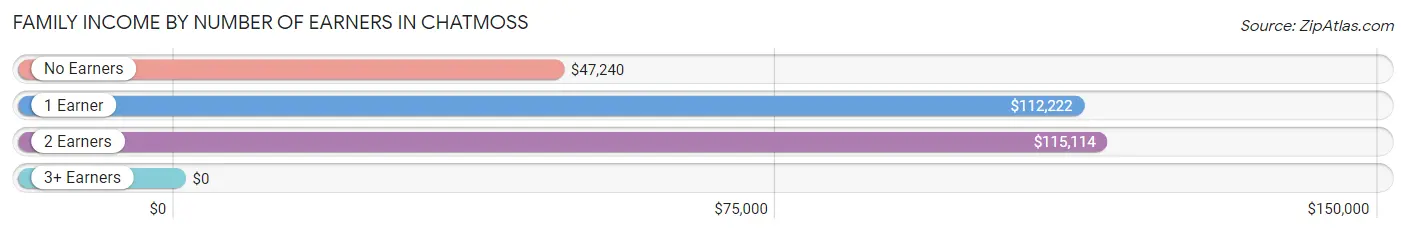
| Number of Earners | # Families | Median Income |
| No Earners | 59 (18.1%) | $47,240 |
| 1 Earner | 94 (28.9%) | $112,222 |
| 2 Earners | 164 (50.5%) | $115,114 |
| 3+ Earners | 8 (2.5%) | $0 |
| Total | 325 (100.0%) | $108,527 |
Household Income in Chatmoss
Household Income Brackets in Chatmoss
With 133 households falling in the category, the $35,000 to $49,999 income range is the most frequent in Chatmoss, accounting for 23.1% of all households. In contrast, only 8 households (1.4%) fall into the less than $10,000 income bracket, making it the least populous group.
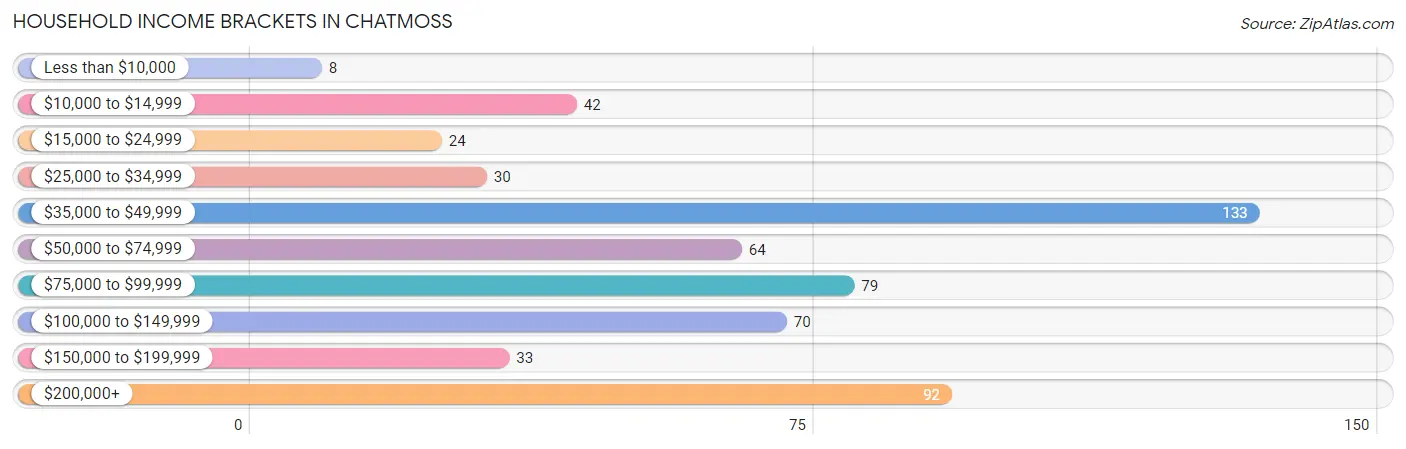
| Income Bracket | # Households | % Households |
| Less than $10,000 | 8 | 1.4% |
| $10,000 to $14,999 | 42 | 7.3% |
| $15,000 to $24,999 | 24 | 4.2% |
| $25,000 to $34,999 | 30 | 5.2% |
| $35,000 to $49,999 | 133 | 23.1% |
| $50,000 to $74,999 | 64 | 11.1% |
| $75,000 to $99,999 | 79 | 13.7% |
| $100,000 to $149,999 | 70 | 12.2% |
| $150,000 to $199,999 | 33 | 5.7% |
| $200,000+ | 92 | 16.0% |
Household Income by Householder Age in Chatmoss
The median household income in Chatmoss is $68,945, with the highest median household income of $69,922 found in the 65+ years age bracket for the primary householder. A total of 310 households (53.9%) fall into this category.
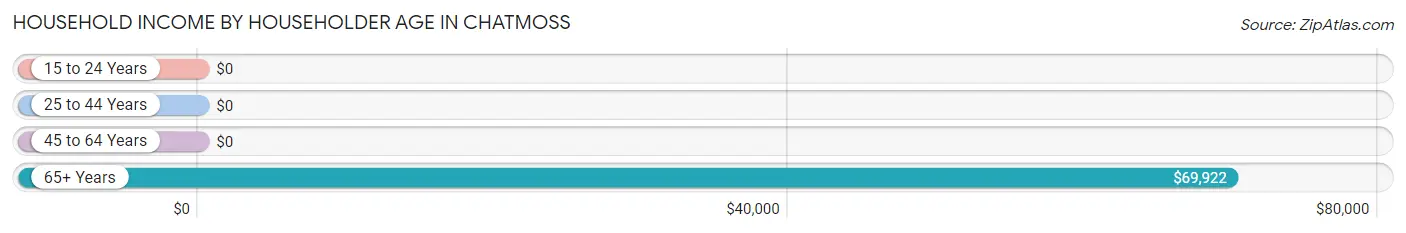
| Income Bracket | # Households | Median Income |
| 15 to 24 Years | 0 (0.0%) | $0 |
| 25 to 44 Years | 0 (0.0%) | $0 |
| 45 to 64 Years | 265 (46.1%) | $0 |
| 65+ Years | 310 (53.9%) | $69,922 |
| Total | 575 (100.0%) | $68,945 |
Poverty in Chatmoss
Income Below Poverty by Sex and Age in Chatmoss
With 9.3% poverty level for males and 16.8% for females among the residents of Chatmoss, 12 to 14 year old males and 18 to 24 year old females are the most vulnerable to poverty, with 42 males (100.0%) and 50 females (47.6%) in their respective age groups living below the poverty level.
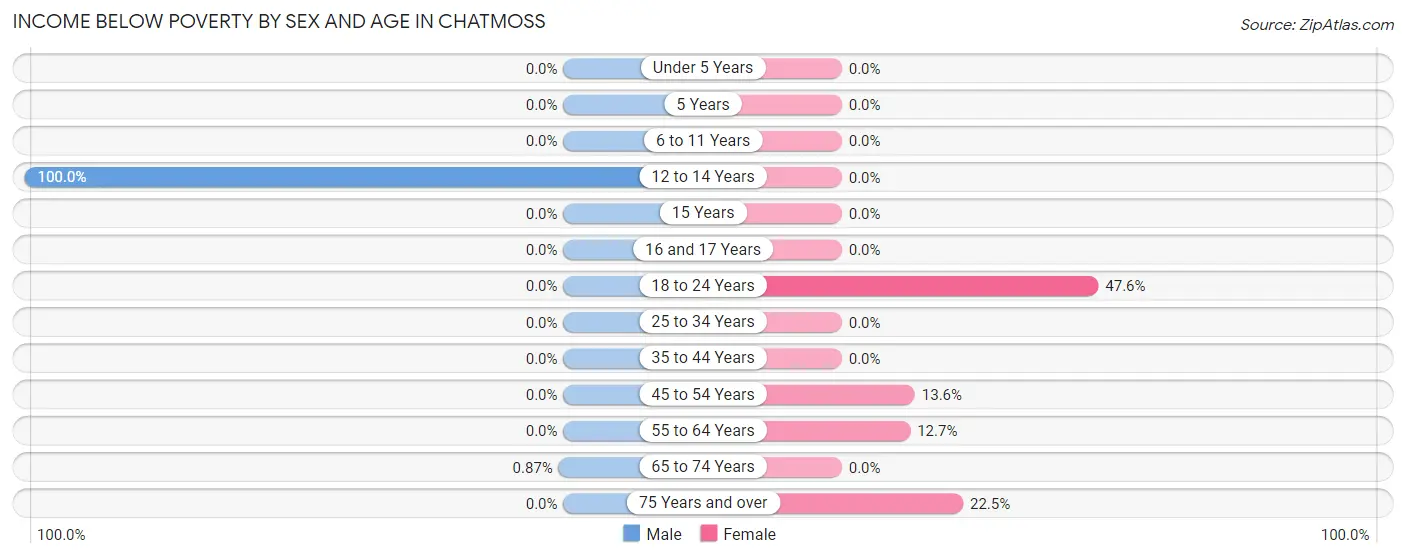
| Age Bracket | Male | Female |
| Under 5 Years | 0 (0.0%) | 0 (0.0%) |
| 5 Years | 0 (0.0%) | 0 (0.0%) |
| 6 to 11 Years | 0 (0.0%) | 0 (0.0%) |
| 12 to 14 Years | 42 (100.0%) | 0 (0.0%) |
| 15 Years | 0 (0.0%) | 0 (0.0%) |
| 16 and 17 Years | 0 (0.0%) | 0 (0.0%) |
| 18 to 24 Years | 0 (0.0%) | 50 (47.6%) |
| 25 to 34 Years | 0 (0.0%) | 0 (0.0%) |
| 35 to 44 Years | 0 (0.0%) | 0 (0.0%) |
| 45 to 54 Years | 0 (0.0%) | 8 (13.6%) |
| 55 to 64 Years | 0 (0.0%) | 16 (12.7%) |
| 65 to 74 Years | 1 (0.9%) | 0 (0.0%) |
| 75 Years and over | 0 (0.0%) | 27 (22.5%) |
| Total | 43 (9.3%) | 101 (16.8%) |
Income Above Poverty by Sex and Age in Chatmoss
According to the poverty statistics in Chatmoss, males aged 25 to 34 years and females aged 25 to 34 years are the age groups that are most secure financially, with 100.0% of males and 100.0% of females in these age groups living above the poverty line.
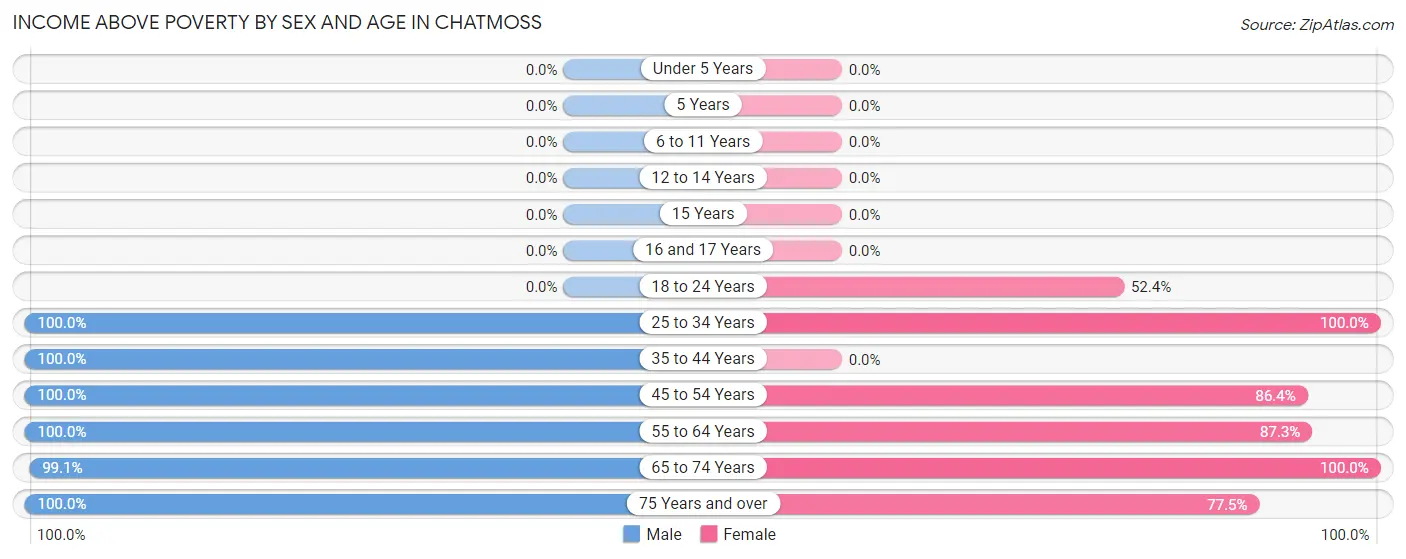
| Age Bracket | Male | Female |
| Under 5 Years | 0 (0.0%) | 0 (0.0%) |
| 5 Years | 0 (0.0%) | 0 (0.0%) |
| 6 to 11 Years | 0 (0.0%) | 0 (0.0%) |
| 12 to 14 Years | 0 (0.0%) | 0 (0.0%) |
| 15 Years | 0 (0.0%) | 0 (0.0%) |
| 16 and 17 Years | 0 (0.0%) | 0 (0.0%) |
| 18 to 24 Years | 0 (0.0%) | 55 (52.4%) |
| 25 to 34 Years | 8 (100.0%) | 18 (100.0%) |
| 35 to 44 Years | 49 (100.0%) | 0 (0.0%) |
| 45 to 54 Years | 116 (100.0%) | 51 (86.4%) |
| 55 to 64 Years | 76 (100.0%) | 110 (87.3%) |
| 65 to 74 Years | 114 (99.1%) | 174 (100.0%) |
| 75 Years and over | 56 (100.0%) | 93 (77.5%) |
| Total | 419 (90.7%) | 501 (83.2%) |
Income Below Poverty Among Married-Couple Families in Chatmoss
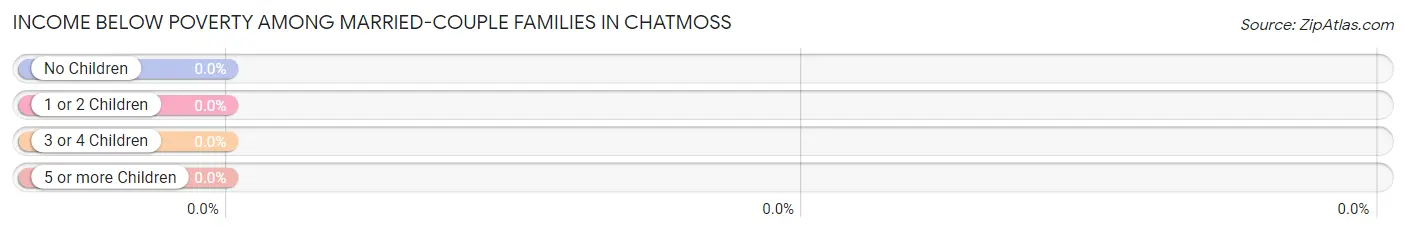
| Children | Above Poverty | Below Poverty |
| No Children | 278 (100.0%) | 0 (0.0%) |
| 1 or 2 Children | 0 (0.0%) | 0 (0.0%) |
| 3 or 4 Children | 0 (0.0%) | 0 (0.0%) |
| 5 or more Children | 0 (0.0%) | 0 (0.0%) |
| Total | 278 (100.0%) | 0 (0.0%) |
Income Below Poverty Among Single-Parent Households in Chatmoss
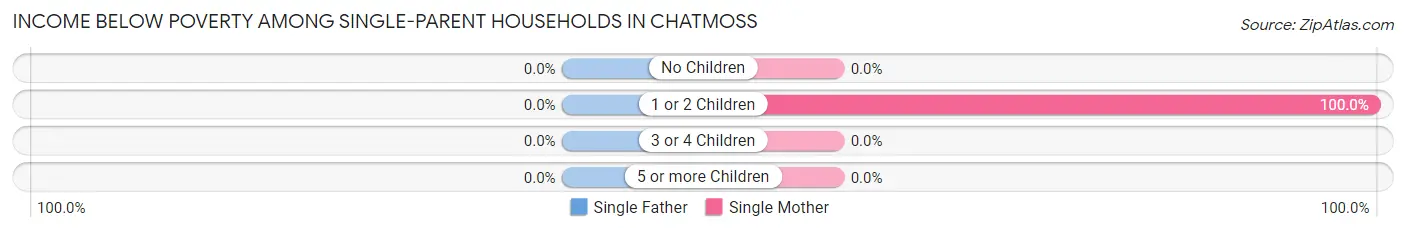
| Children | Single Father | Single Mother |
| No Children | 0 (0.0%) | 0 (0.0%) |
| 1 or 2 Children | 0 (0.0%) | 23 (100.0%) |
| 3 or 4 Children | 0 (0.0%) | 0 (0.0%) |
| 5 or more Children | 0 (0.0%) | 0 (0.0%) |
| Total | 0 (0.0%) | 23 (48.9%) |
Income Below Poverty Among Married-Couple vs Single-Parent Households in Chatmoss
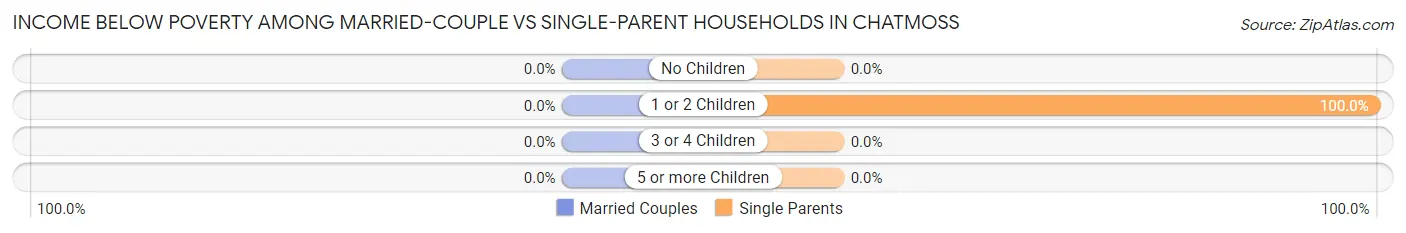
| Children | Married-Couple Families | Single-Parent Households |
| No Children | 0 (0.0%) | 0 (0.0%) |
| 1 or 2 Children | 0 (0.0%) | 23 (100.0%) |
| 3 or 4 Children | 0 (0.0%) | 0 (0.0%) |
| 5 or more Children | 0 (0.0%) | 0 (0.0%) |
| Total | 0 (0.0%) | 23 (48.9%) |
Race in Chatmoss
The most populous races in Chatmoss are White / Caucasian (707 | 66.4%), Black / African American (333 | 31.3%), and Hispanic or Latino (27 | 2.5%).
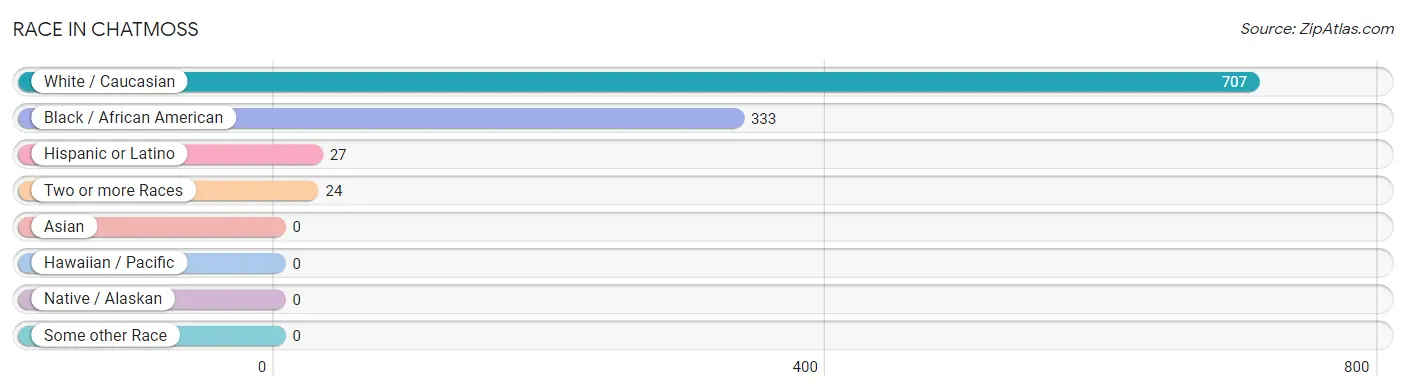
| Race | # Population | % Population |
| Asian | 0 | 0.0% |
| Black / African American | 333 | 31.3% |
| Hawaiian / Pacific | 0 | 0.0% |
| Hispanic or Latino | 27 | 2.5% |
| Native / Alaskan | 0 | 0.0% |
| White / Caucasian | 707 | 66.4% |
| Two or more Races | 24 | 2.3% |
| Some other Race | 0 | 0.0% |
| Total | 1,064 | 100.0% |
Ancestry in Chatmoss
The most populous ancestries reported in Chatmoss are English (314 | 29.5%), European (179 | 16.8%), American (94 | 8.8%), German (68 | 6.4%), and Irish (50 | 4.7%), together accounting for 66.2% of all Chatmoss residents.
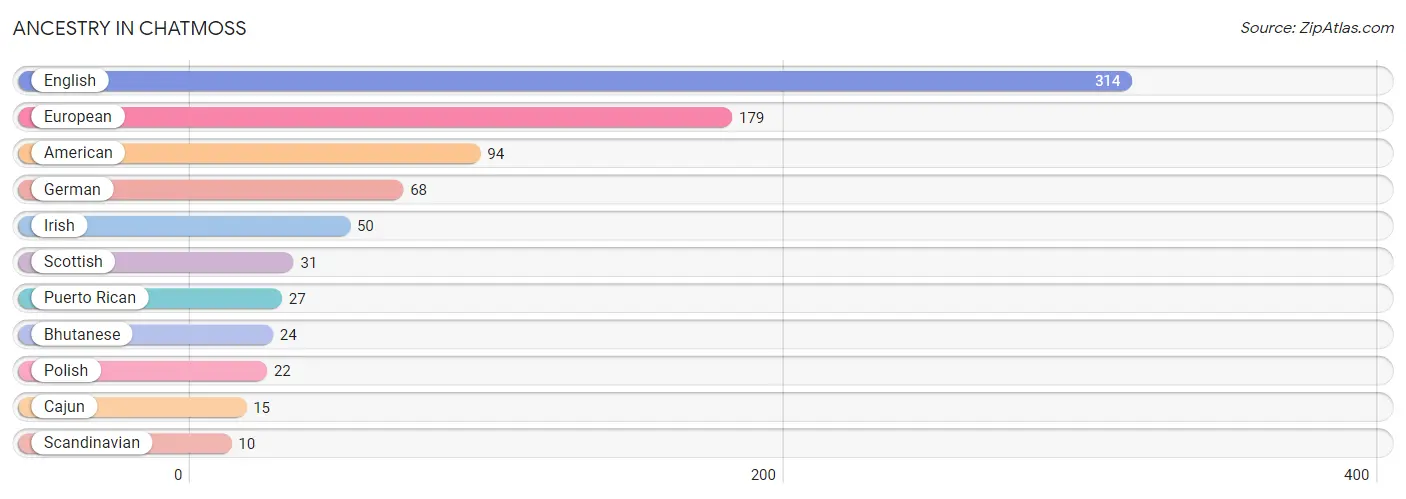
| Ancestry | # Population | % Population |
| American | 94 | 8.8% |
| Bhutanese | 24 | 2.3% |
| Cajun | 15 | 1.4% |
| English | 314 | 29.5% |
| European | 179 | 16.8% |
| German | 68 | 6.4% |
| Irish | 50 | 4.7% |
| Polish | 22 | 2.1% |
| Puerto Rican | 27 | 2.5% |
| Scandinavian | 10 | 0.9% |
| Scottish | 31 | 2.9% | View All 11 Rows |
Immigrants in Chatmoss

| Immigration Origin | # Population | % Population | View All 0 Rows |
Sex and Age in Chatmoss
Sex and Age in Chatmoss
The most populous age groups in Chatmoss are 50 to 54 Years (116 | 25.1%) for men and 70 to 74 Years (115 | 19.1%) for women.
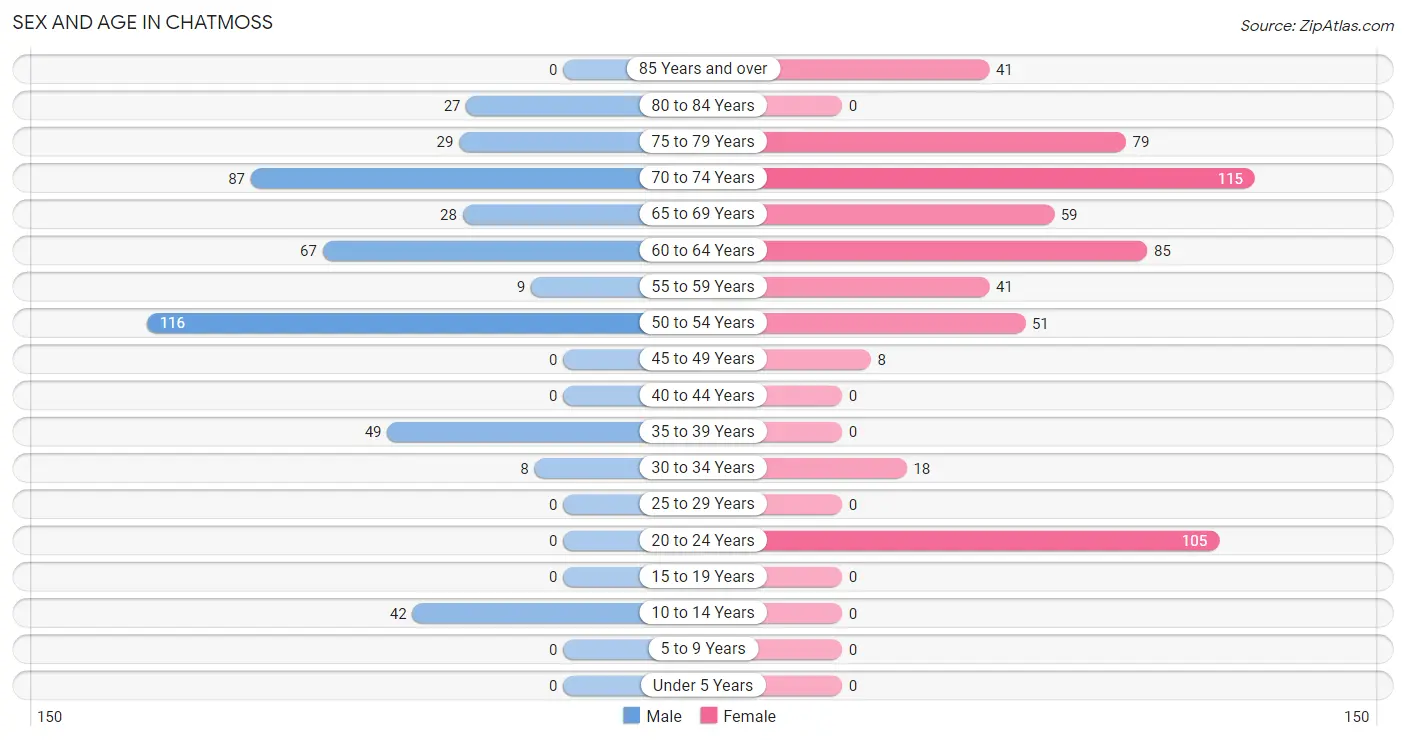
| Age Bracket | Male | Female |
| Under 5 Years | 0 (0.0%) | 0 (0.0%) |
| 5 to 9 Years | 0 (0.0%) | 0 (0.0%) |
| 10 to 14 Years | 42 (9.1%) | 0 (0.0%) |
| 15 to 19 Years | 0 (0.0%) | 0 (0.0%) |
| 20 to 24 Years | 0 (0.0%) | 105 (17.4%) |
| 25 to 29 Years | 0 (0.0%) | 0 (0.0%) |
| 30 to 34 Years | 8 (1.7%) | 18 (3.0%) |
| 35 to 39 Years | 49 (10.6%) | 0 (0.0%) |
| 40 to 44 Years | 0 (0.0%) | 0 (0.0%) |
| 45 to 49 Years | 0 (0.0%) | 8 (1.3%) |
| 50 to 54 Years | 116 (25.1%) | 51 (8.5%) |
| 55 to 59 Years | 9 (1.9%) | 41 (6.8%) |
| 60 to 64 Years | 67 (14.5%) | 85 (14.1%) |
| 65 to 69 Years | 28 (6.1%) | 59 (9.8%) |
| 70 to 74 Years | 87 (18.8%) | 115 (19.1%) |
| 75 to 79 Years | 29 (6.3%) | 79 (13.1%) |
| 80 to 84 Years | 27 (5.8%) | 0 (0.0%) |
| 85 Years and over | 0 (0.0%) | 41 (6.8%) |
| Total | 462 (100.0%) | 602 (100.0%) |
Families and Households in Chatmoss
Median Family Size in Chatmoss
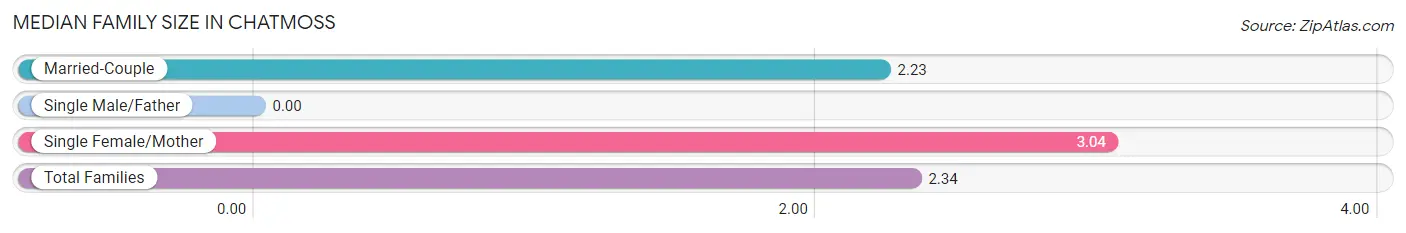
| Family Type | # Families | Family Size |
| Married-Couple | 278 (85.5%) | 2.23 |
| Single Male/Father | 0 (0.0%) | - |
| Single Female/Mother | 47 (14.5%) | 3.04 |
| Total Families | 325 (100.0%) | 2.34 |
Median Household Size in Chatmoss
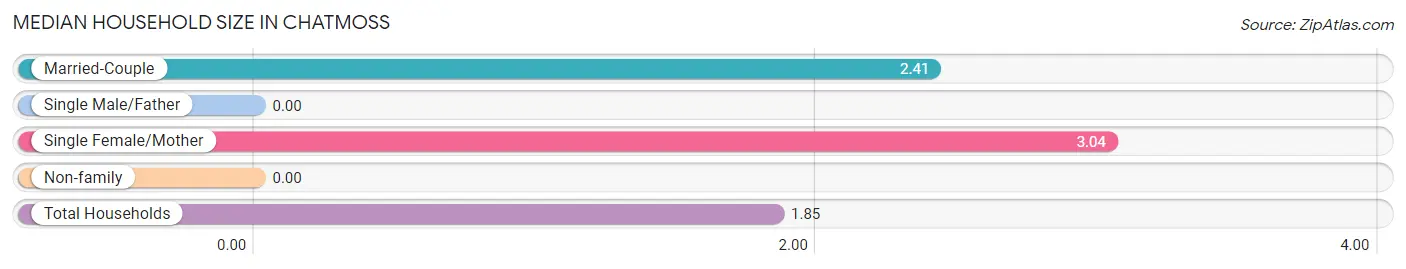
| Household Type | # Households | Household Size |
| Married-Couple | 278 (48.3%) | 2.41 |
| Single Male/Father | 0 (0.0%) | - |
| Single Female/Mother | 47 (8.2%) | 3.04 |
| Non-family | 250 (43.5%) | - |
| Total Households | 575 (100.0%) | 1.85 |
Household Size by Marriage Status in Chatmoss
Out of a total of 575 households in Chatmoss, 325 (56.5%) are family households, while 250 (43.5%) are nonfamily households. The most numerous type of family households are 2-person households, comprising 276, and the most common type of nonfamily households are 1-person households, comprising 250.
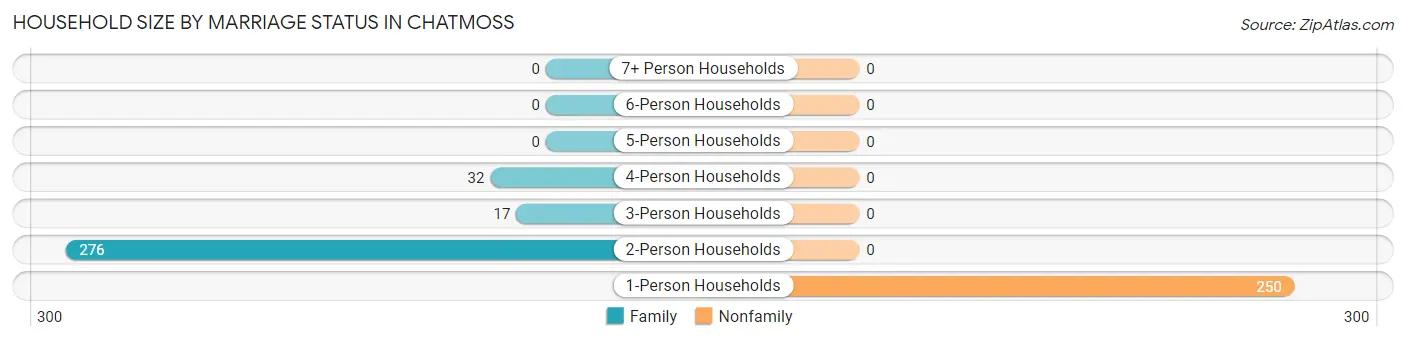
| Household Size | Family Households | Nonfamily Households |
| 1-Person Households | - | 250 (43.5%) |
| 2-Person Households | 276 (48.0%) | 0 (0.0%) |
| 3-Person Households | 17 (3.0%) | 0 (0.0%) |
| 4-Person Households | 32 (5.6%) | 0 (0.0%) |
| 5-Person Households | 0 (0.0%) | 0 (0.0%) |
| 6-Person Households | 0 (0.0%) | 0 (0.0%) |
| 7+ Person Households | 0 (0.0%) | 0 (0.0%) |
| Total | 325 (56.5%) | 250 (43.5%) |
Female Fertility in Chatmoss
Fertility by Age in Chatmoss
| Age Bracket | Women with Births | Births / 1,000 Women |
| 15 to 19 years | 0 (0.0%) | 0.0 |
| 20 to 34 years | 0 (0.0%) | 0.0 |
| 35 to 50 years | 0 (0.0%) | 0.0 |
| Total | 0 (0.0%) | 0.0 |
Fertility by Age by Marriage Status in Chatmoss
| Age Bracket | Married | Unmarried |
| 15 to 19 years | 0 (0.0%) | 0 (0.0%) |
| 20 to 34 years | 0 (0.0%) | 0 (0.0%) |
| 35 to 50 years | 0 (0.0%) | 0 (0.0%) |
| Total | 0 (0.0%) | 0 (0.0%) |
Fertility by Education in Chatmoss
| Educational Attainment | Women with Births | Births / 1,000 Women |
| Less than High School | 0 (0.0%) | 0.0 |
| High School Diploma | 0 (0.0%) | 0.0 |
| College or Associate's Degree | 0 (0.0%) | 0.0 |
| Bachelor's Degree | 0 (0.0%) | 0.0 |
| Graduate Degree | 0 (0.0%) | 0.0 |
| Total | 0 (0.0%) | 0.0 |
Fertility by Education by Marriage Status in Chatmoss
| Educational Attainment | Married | Unmarried |
| Less than High School | 0 (0.0%) | 0 (0.0%) |
| High School Diploma | 0 (0.0%) | 0 (0.0%) |
| College or Associate's Degree | 0 (0.0%) | 0 (0.0%) |
| Bachelor's Degree | 0 (0.0%) | 0 (0.0%) |
| Graduate Degree | 0 (0.0%) | 0 (0.0%) |
| Total | 0 (0.0%) | 0 (0.0%) |
Employment Characteristics in Chatmoss
Employment by Class of Employer in Chatmoss
Among the 615 employed individuals in Chatmoss, private company employees (444 | 72.2%), not-for-profit organizations (75 | 12.2%), and local government employees (51 | 8.3%) make up the most common classes of employment.
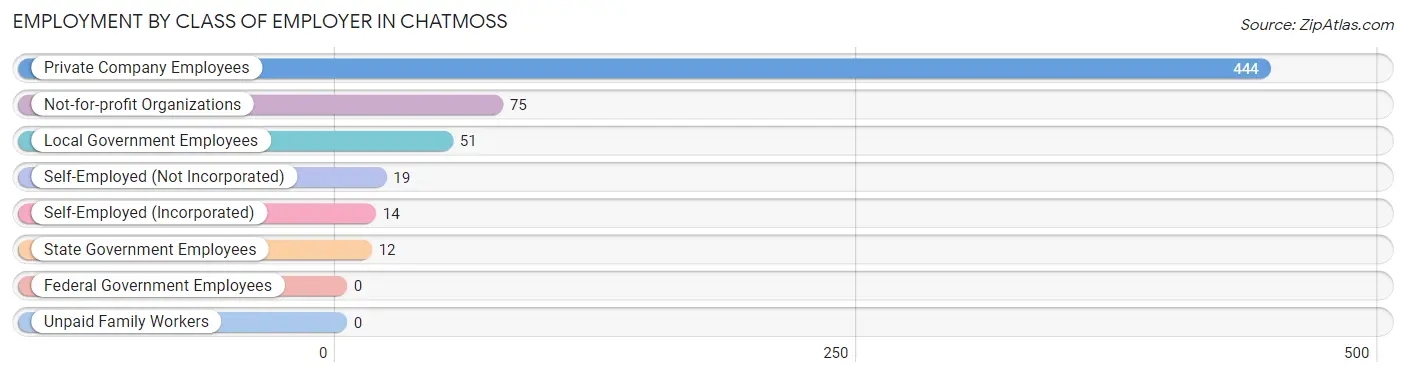
| Employer Class | # Employees | % Employees |
| Private Company Employees | 444 | 72.2% |
| Self-Employed (Incorporated) | 14 | 2.3% |
| Self-Employed (Not Incorporated) | 19 | 3.1% |
| Not-for-profit Organizations | 75 | 12.2% |
| Local Government Employees | 51 | 8.3% |
| State Government Employees | 12 | 1.9% |
| Federal Government Employees | 0 | 0.0% |
| Unpaid Family Workers | 0 | 0.0% |
| Total | 615 | 100.0% |
Employment Status by Age in Chatmoss
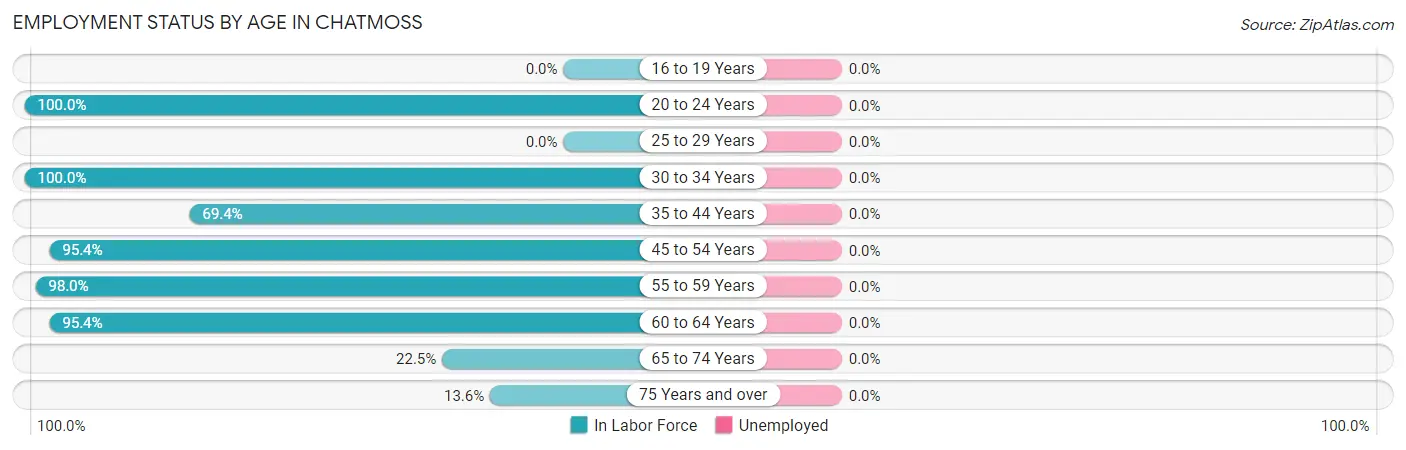
| Age Bracket | In Labor Force | Unemployed |
| 16 to 19 Years | 0 (0.0%) | 0 (0.0%) |
| 20 to 24 Years | 105 (100.0%) | 0 (0.0%) |
| 25 to 29 Years | 0 (0.0%) | 0 (0.0%) |
| 30 to 34 Years | 26 (100.0%) | 0 (0.0%) |
| 35 to 44 Years | 34 (69.4%) | 0 (0.0%) |
| 45 to 54 Years | 167 (95.4%) | 0 (0.0%) |
| 55 to 59 Years | 49 (98.0%) | 0 (0.0%) |
| 60 to 64 Years | 145 (95.4%) | 0 (0.0%) |
| 65 to 74 Years | 65 (22.5%) | 0 (0.0%) |
| 75 Years and over | 24 (13.6%) | 0 (0.0%) |
| Total | 615 (60.2%) | 0 (0.0%) |
Employment Status by Educational Attainment in Chatmoss
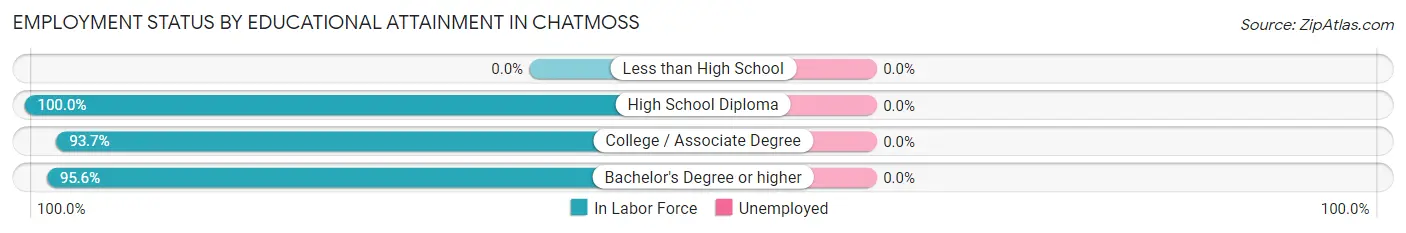
| Educational Attainment | In Labor Force | Unemployed |
| Less than High School | 0 (0.0%) | 0 (0.0%) |
| High School Diploma | 48 (100.0%) | 0 (0.0%) |
| College / Associate Degree | 222 (93.7%) | 0 (0.0%) |
| Bachelor's Degree or higher | 151 (95.6%) | 0 (0.0%) |
| Total | 421 (93.1%) | 0 (0.0%) |
Employment Occupations by Sex in Chatmoss
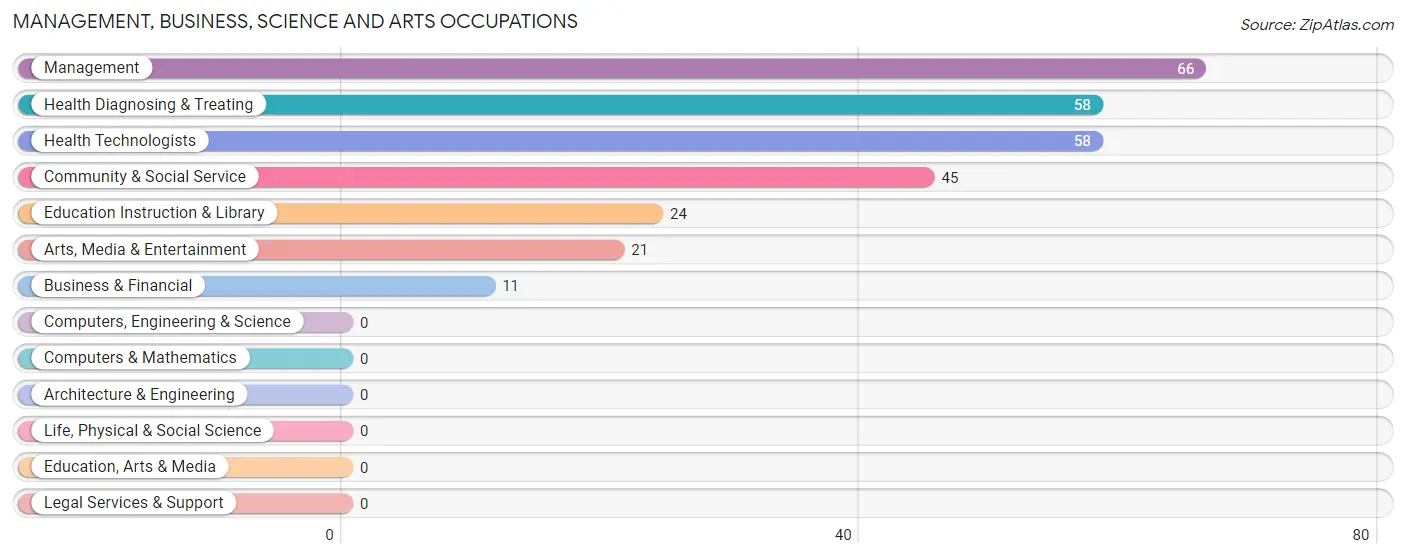
Management, Business, Science and Arts Occupations
The most common Management, Business, Science and Arts occupations in Chatmoss are Management (66 | 10.7%), Health Diagnosing & Treating (58 | 9.4%), Health Technologists (58 | 9.4%), Community & Social Service (45 | 7.3%), and Education Instruction & Library (24 | 3.9%).
Management, Business, Science and Arts Occupations by Sex
Within the Management, Business, Science and Arts occupations in Chatmoss, the most male-oriented occupations are Business & Financial (100.0%), Arts, Media & Entertainment (100.0%), and Management (66.7%), while the most female-oriented occupations are Education Instruction & Library (100.0%), Health Diagnosing & Treating (100.0%), and Health Technologists (100.0%).
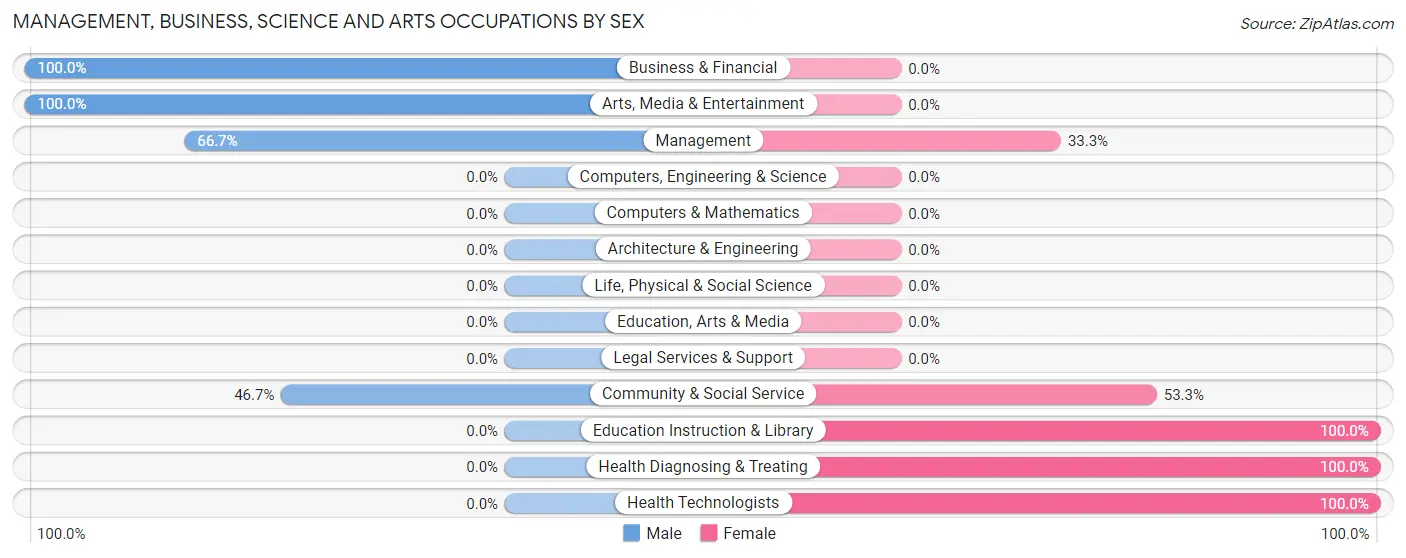
| Occupation | Male | Female |
| Management | 44 (66.7%) | 22 (33.3%) |
| Business & Financial | 11 (100.0%) | 0 (0.0%) |
| Computers, Engineering & Science | 0 (0.0%) | 0 (0.0%) |
| Computers & Mathematics | 0 (0.0%) | 0 (0.0%) |
| Architecture & Engineering | 0 (0.0%) | 0 (0.0%) |
| Life, Physical & Social Science | 0 (0.0%) | 0 (0.0%) |
| Community & Social Service | 21 (46.7%) | 24 (53.3%) |
| Education, Arts & Media | 0 (0.0%) | 0 (0.0%) |
| Legal Services & Support | 0 (0.0%) | 0 (0.0%) |
| Education Instruction & Library | 0 (0.0%) | 24 (100.0%) |
| Arts, Media & Entertainment | 21 (100.0%) | 0 (0.0%) |
| Health Diagnosing & Treating | 0 (0.0%) | 58 (100.0%) |
| Health Technologists | 0 (0.0%) | 58 (100.0%) |
| Total (Category) | 76 (42.2%) | 104 (57.8%) |
| Total (Overall) | 286 (46.5%) | 329 (53.5%) |
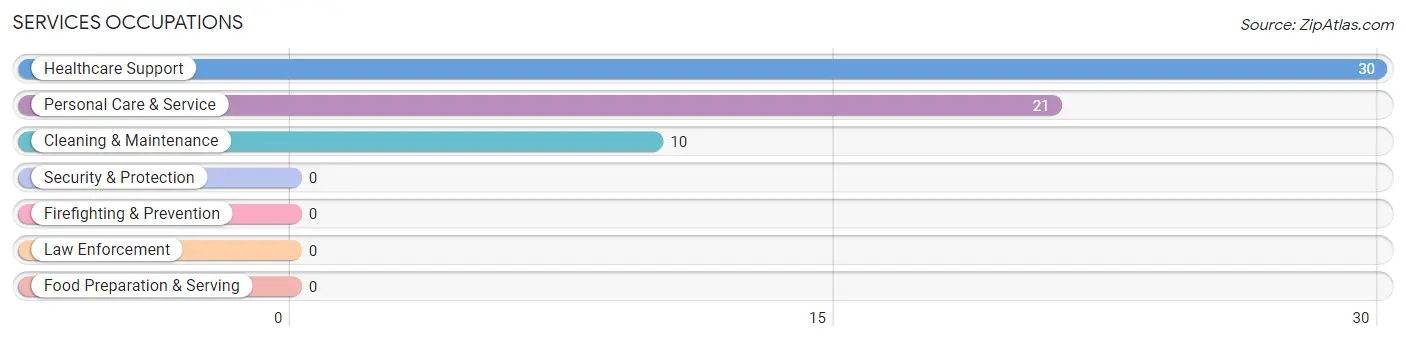
Services Occupations
The most common Services occupations in Chatmoss are Healthcare Support (30 | 4.9%), Personal Care & Service (21 | 3.4%), and Cleaning & Maintenance (10 | 1.6%).
Services Occupations by Sex
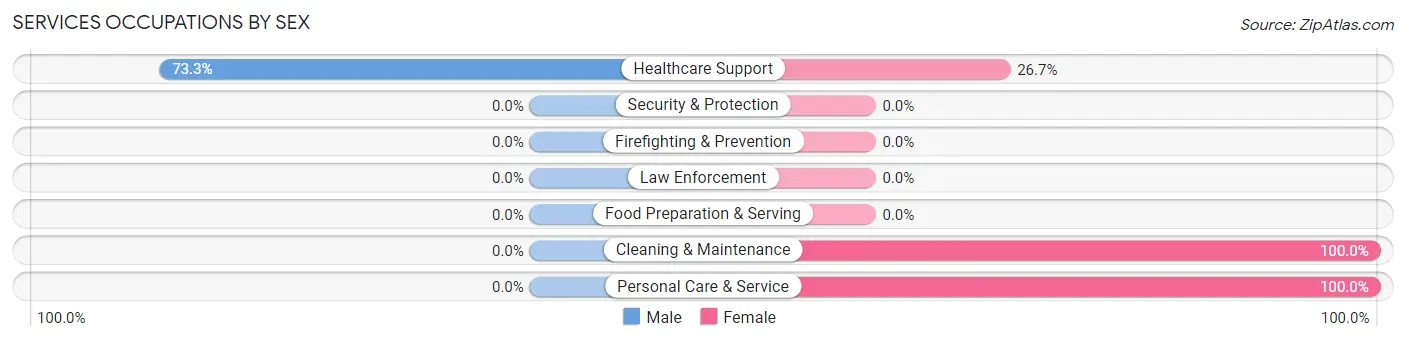
| Occupation | Male | Female |
| Healthcare Support | 22 (73.3%) | 8 (26.7%) |
| Security & Protection | 0 (0.0%) | 0 (0.0%) |
| Firefighting & Prevention | 0 (0.0%) | 0 (0.0%) |
| Law Enforcement | 0 (0.0%) | 0 (0.0%) |
| Food Preparation & Serving | 0 (0.0%) | 0 (0.0%) |
| Cleaning & Maintenance | 0 (0.0%) | 10 (100.0%) |
| Personal Care & Service | 0 (0.0%) | 21 (100.0%) |
| Total (Category) | 22 (36.1%) | 39 (63.9%) |
| Total (Overall) | 286 (46.5%) | 329 (53.5%) |
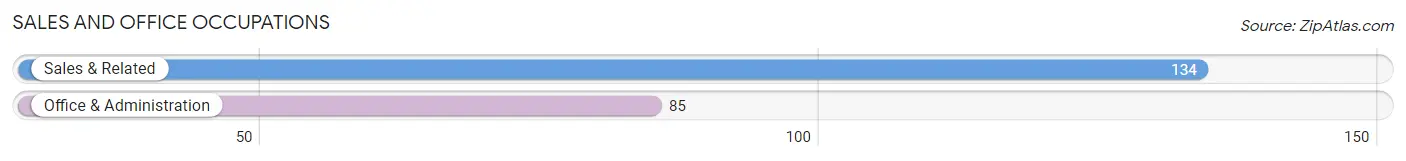
Sales and Office Occupations
The most common Sales and Office occupations in Chatmoss are Sales & Related (134 | 21.8%), and Office & Administration (85 | 13.8%).
Sales and Office Occupations by Sex
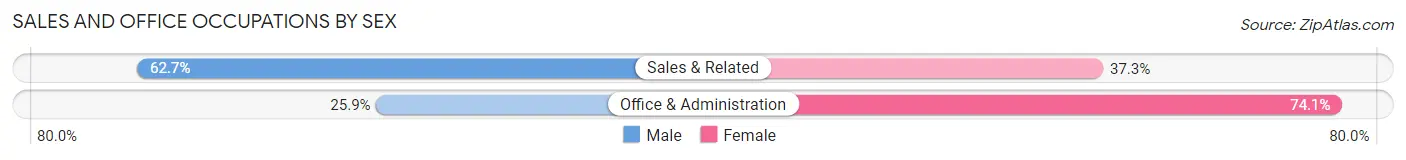
| Occupation | Male | Female |
| Sales & Related | 84 (62.7%) | 50 (37.3%) |
| Office & Administration | 22 (25.9%) | 63 (74.1%) |
| Total (Category) | 106 (48.4%) | 113 (51.6%) |
| Total (Overall) | 286 (46.5%) | 329 (53.5%) |
Natural Resources, Construction and Maintenance Occupations
Natural Resources, Construction and Maintenance Occupations by Sex
| Occupation | Male | Female |
| Farming, Fishing & Forestry | 0 (0.0%) | 0 (0.0%) |
| Construction & Extraction | 0 (0.0%) | 0 (0.0%) |
| Installation, Maintenance & Repair | 0 (0.0%) | 0 (0.0%) |
| Total (Category) | 0 (0.0%) | 0 (0.0%) |
| Total (Overall) | 286 (46.5%) | 329 (53.5%) |
Production, Transportation and Moving Occupations
The most common Production, Transportation and Moving occupations in Chatmoss are Material Moving (92 | 15.0%), Production (45 | 7.3%), and Transportation (18 | 2.9%).
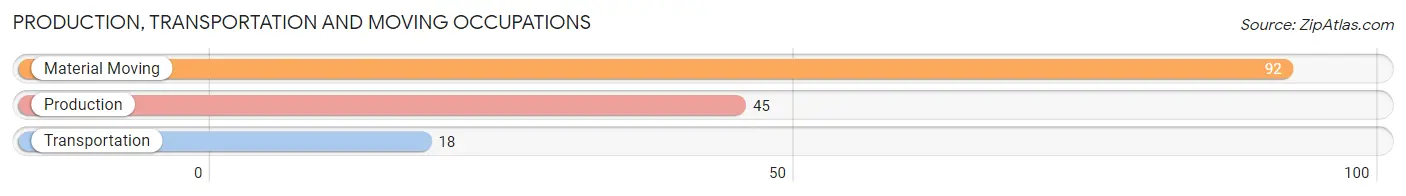
Production, Transportation and Moving Occupations by Sex
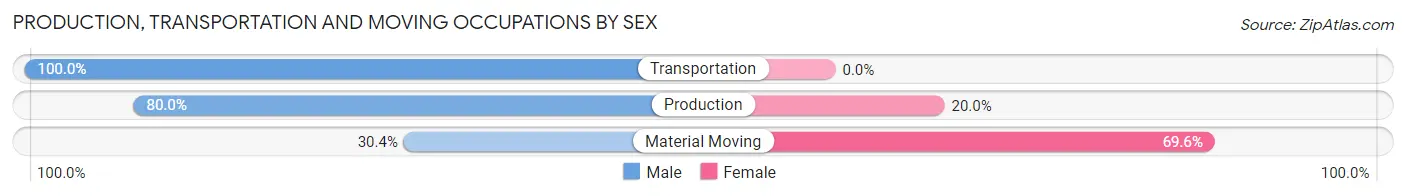
| Occupation | Male | Female |
| Production | 36 (80.0%) | 9 (20.0%) |
| Transportation | 18 (100.0%) | 0 (0.0%) |
| Material Moving | 28 (30.4%) | 64 (69.6%) |
| Total (Category) | 82 (52.9%) | 73 (47.1%) |
| Total (Overall) | 286 (46.5%) | 329 (53.5%) |
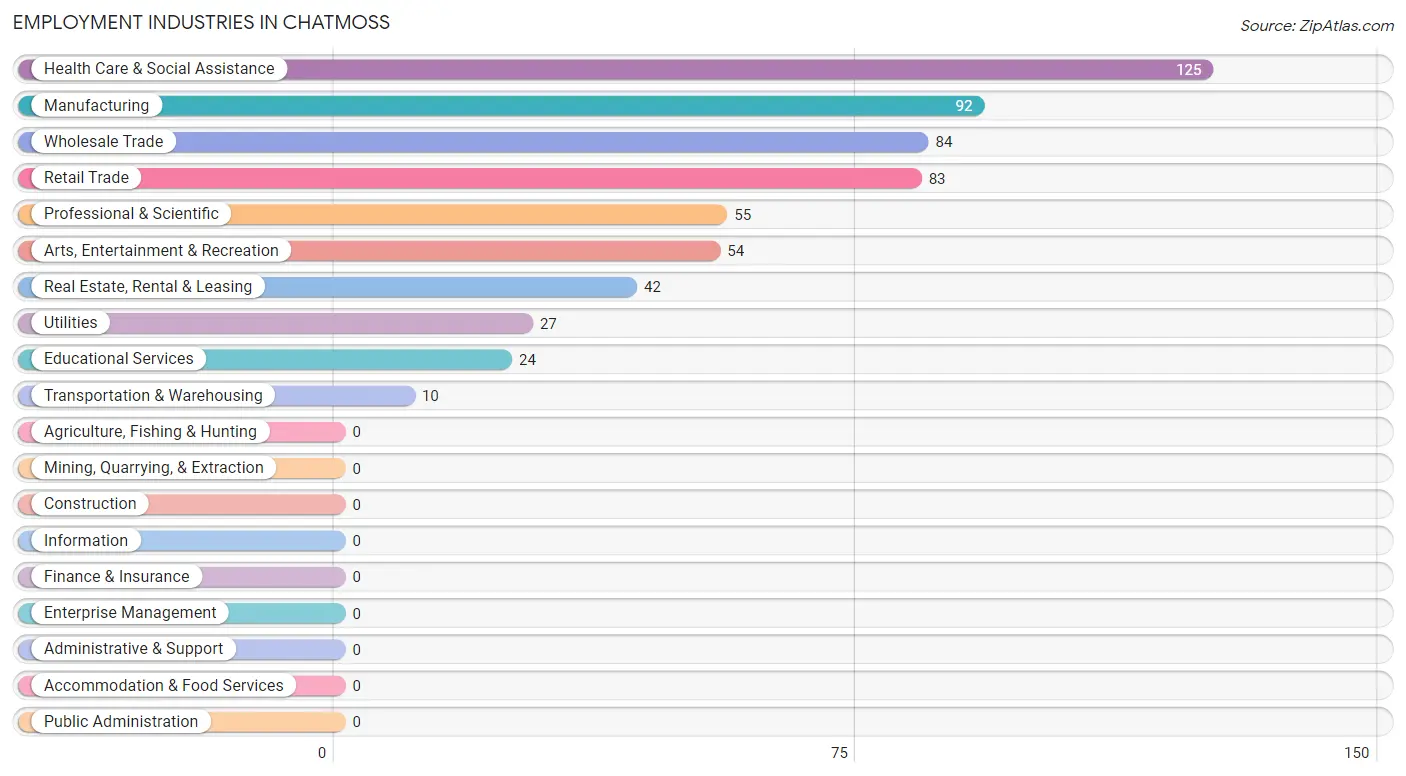
Employment Industries by Sex in Chatmoss
Employment Industries in Chatmoss
The major employment industries in Chatmoss include Health Care & Social Assistance (125 | 20.3%), Manufacturing (92 | 15.0%), Wholesale Trade (84 | 13.7%), Retail Trade (83 | 13.5%), and Professional & Scientific (55 | 8.9%).
Employment Industries by Sex in Chatmoss
The Chatmoss industries that see more men than women are Wholesale Trade (100.0%), Transportation & Warehousing (100.0%), and Utilities (100.0%), whereas the industries that tend to have a higher number of women are Retail Trade (100.0%), Professional & Scientific (100.0%), and Educational Services (100.0%).
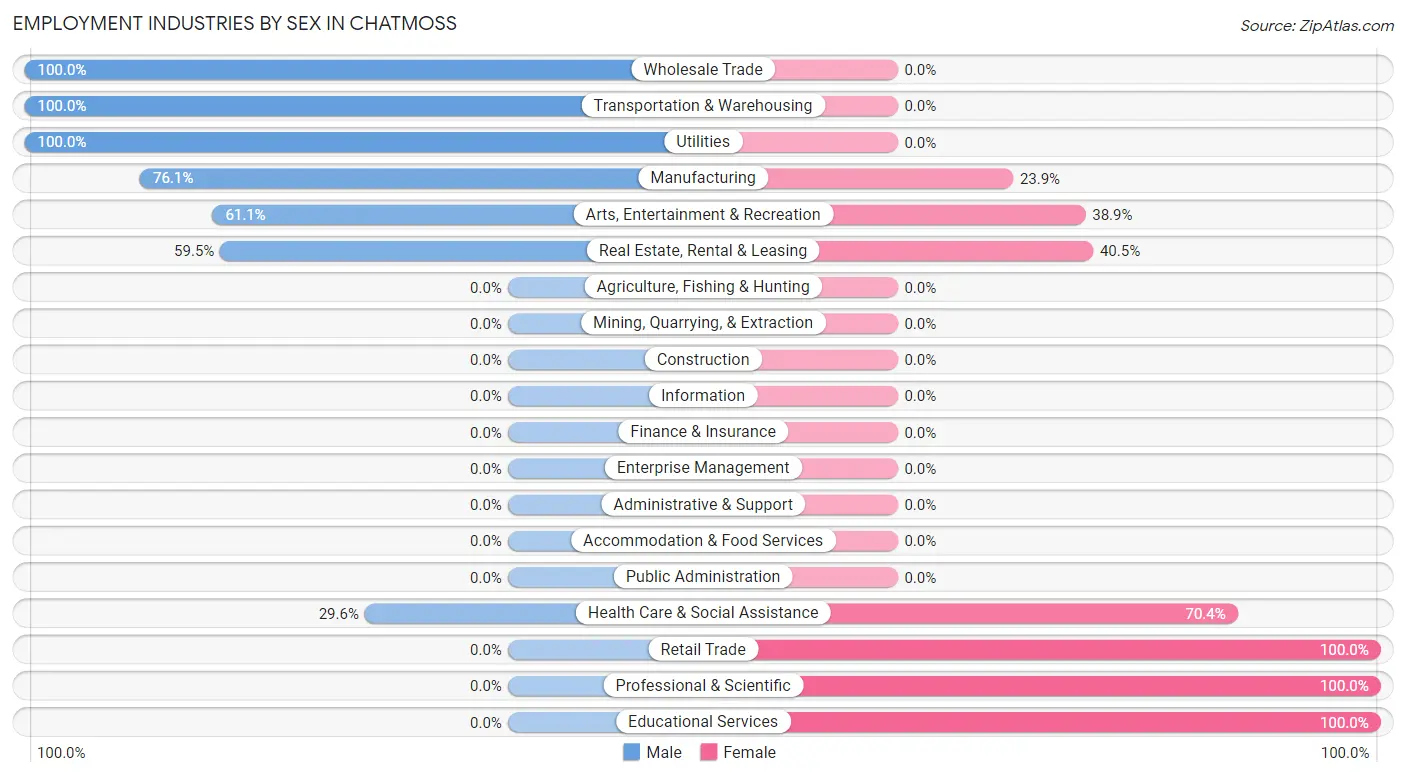
| Industry | Male | Female |
| Agriculture, Fishing & Hunting | 0 (0.0%) | 0 (0.0%) |
| Mining, Quarrying, & Extraction | 0 (0.0%) | 0 (0.0%) |
| Construction | 0 (0.0%) | 0 (0.0%) |
| Manufacturing | 70 (76.1%) | 22 (23.9%) |
| Wholesale Trade | 84 (100.0%) | 0 (0.0%) |
| Retail Trade | 0 (0.0%) | 83 (100.0%) |
| Transportation & Warehousing | 10 (100.0%) | 0 (0.0%) |
| Utilities | 27 (100.0%) | 0 (0.0%) |
| Information | 0 (0.0%) | 0 (0.0%) |
| Finance & Insurance | 0 (0.0%) | 0 (0.0%) |
| Real Estate, Rental & Leasing | 25 (59.5%) | 17 (40.5%) |
| Professional & Scientific | 0 (0.0%) | 55 (100.0%) |
| Enterprise Management | 0 (0.0%) | 0 (0.0%) |
| Administrative & Support | 0 (0.0%) | 0 (0.0%) |
| Educational Services | 0 (0.0%) | 24 (100.0%) |
| Health Care & Social Assistance | 37 (29.6%) | 88 (70.4%) |
| Arts, Entertainment & Recreation | 33 (61.1%) | 21 (38.9%) |
| Accommodation & Food Services | 0 (0.0%) | 0 (0.0%) |
| Public Administration | 0 (0.0%) | 0 (0.0%) |
| Total | 286 (46.5%) | 329 (53.5%) |
Education in Chatmoss
School Enrollment in Chatmoss
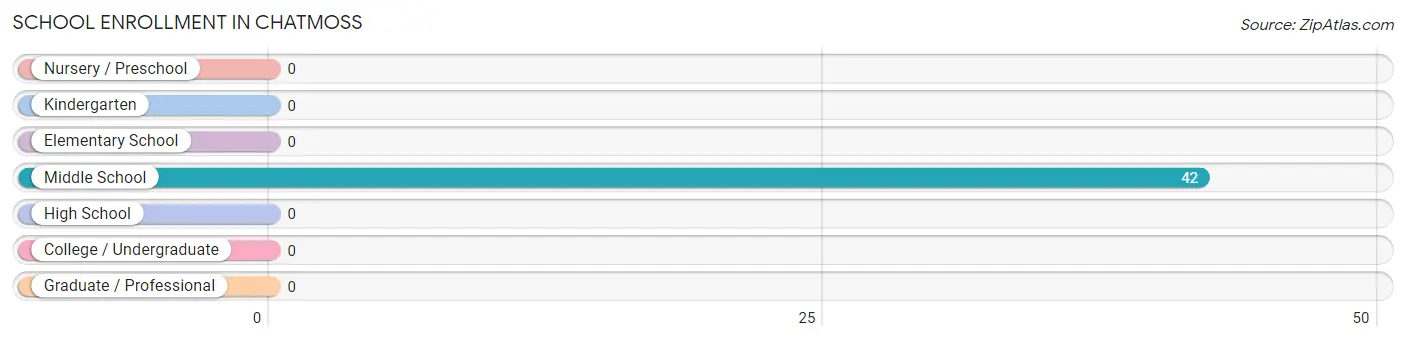
| School Level | # Students | % Students |
| Nursery / Preschool | 0 | 0.0% |
| Kindergarten | 0 | 0.0% |
| Elementary School | 0 | 0.0% |
| Middle School | 42 | 100.0% |
| High School | 0 | 0.0% |
| College / Undergraduate | 0 | 0.0% |
| Graduate / Professional | 0 | 0.0% |
| Total | 42 | 100.0% |
School Enrollment by Age by Funding Source in Chatmoss
| Age Bracket | Public School | Private School |
| 3 to 4 Year Olds | 0 (0.0%) | 0 (0.0%) |
| 5 to 9 Year Old | 0 (0.0%) | 0 (0.0%) |
| 10 to 14 Year Olds | 42 (100.0%) | 0 (0.0%) |
| 15 to 17 Year Olds | 0 (0.0%) | 0 (0.0%) |
| 18 to 19 Year Olds | 0 (0.0%) | 0 (0.0%) |
| 20 to 24 Year Olds | 0 (0.0%) | 0 (0.0%) |
| 25 to 34 Year Olds | 0 (0.0%) | 0 (0.0%) |
| 35 Years and over | 0 (0.0%) | 0 (0.0%) |
| Total | 42 (100.0%) | 0 (0.0%) |
Educational Attainment by Field of Study in Chatmoss
Education (94 | 26.4%), arts & humanities (54 | 15.2%), literature & languages (48 | 13.5%), liberal arts & history (48 | 13.5%), and engineering (40 | 11.2%) are the most common fields of study among 356 individuals in Chatmoss who have obtained a bachelor's degree or higher.
| Field of Study | # Graduates | % Graduates |
| Computers & Mathematics | 7 | 2.0% |
| Bio, Nature & Agricultural | 0 | 0.0% |
| Physical & Health Sciences | 0 | 0.0% |
| Psychology | 0 | 0.0% |
| Social Sciences | 14 | 3.9% |
| Engineering | 40 | 11.2% |
| Multidisciplinary Studies | 0 | 0.0% |
| Science & Technology | 2 | 0.6% |
| Business | 37 | 10.4% |
| Education | 94 | 26.4% |
| Literature & Languages | 48 | 13.5% |
| Liberal Arts & History | 48 | 13.5% |
| Visual & Performing Arts | 0 | 0.0% |
| Communications | 12 | 3.4% |
| Arts & Humanities | 54 | 15.2% |
| Total | 356 | 100.0% |
Transportation & Commute in Chatmoss
Vehicle Availability by Sex in Chatmoss
The most prevalent vehicle ownership categories in Chatmoss are males with 3 vehicles (95, accounting for 33.2%) and females with 3 vehicles (85, making up 28.9%).
| Vehicles Available | Male | Female |
| No Vehicle | 0 (0.0%) | 0 (0.0%) |
| 1 Vehicle | 84 (29.4%) | 24 (7.3%) |
| 2 Vehicles | 68 (23.8%) | 97 (29.5%) |
| 3 Vehicles | 95 (33.2%) | 85 (25.8%) |
| 4 Vehicles | 0 (0.0%) | 10 (3.0%) |
| 5 or more Vehicles | 39 (13.6%) | 113 (34.4%) |
| Total | 286 (100.0%) | 329 (100.0%) |
Commute Time in Chatmoss
The most frequently occuring commute durations in Chatmoss are 15 to 19 minutes (136 commuters, 24.9%), 10 to 14 minutes (102 commuters, 18.7%), and 40 to 44 minutes (59 commuters, 10.8%).
| Commute Time | # Commuters | % Commuters |
| Less than 5 Minutes | 21 | 3.8% |
| 5 to 9 Minutes | 45 | 8.3% |
| 10 to 14 Minutes | 102 | 18.7% |
| 15 to 19 Minutes | 136 | 24.9% |
| 20 to 24 Minutes | 41 | 7.5% |
| 25 to 29 Minutes | 27 | 5.0% |
| 30 to 34 Minutes | 27 | 5.0% |
| 35 to 39 Minutes | 43 | 7.9% |
| 40 to 44 Minutes | 59 | 10.8% |
| 45 to 59 Minutes | 10 | 1.8% |
| 60 to 89 Minutes | 34 | 6.2% |
| 90 or more Minutes | 0 | 0.0% |
Commute Time by Sex in Chatmoss
The most common commute times in Chatmoss are 15 to 19 minutes (112 commuters, 39.2%) for males and 10 to 14 minutes (57 commuters, 22.0%) for females.
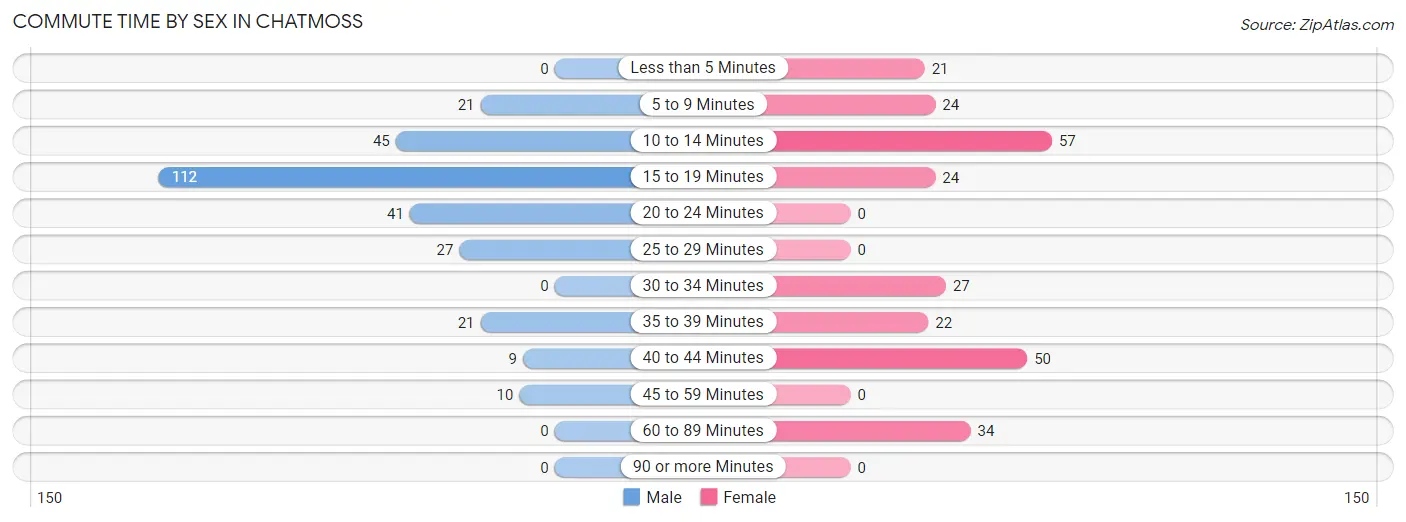
| Commute Time | Male | Female |
| Less than 5 Minutes | 0 (0.0%) | 21 (8.1%) |
| 5 to 9 Minutes | 21 (7.3%) | 24 (9.3%) |
| 10 to 14 Minutes | 45 (15.7%) | 57 (22.0%) |
| 15 to 19 Minutes | 112 (39.2%) | 24 (9.3%) |
| 20 to 24 Minutes | 41 (14.3%) | 0 (0.0%) |
| 25 to 29 Minutes | 27 (9.4%) | 0 (0.0%) |
| 30 to 34 Minutes | 0 (0.0%) | 27 (10.4%) |
| 35 to 39 Minutes | 21 (7.3%) | 22 (8.5%) |
| 40 to 44 Minutes | 9 (3.2%) | 50 (19.3%) |
| 45 to 59 Minutes | 10 (3.5%) | 0 (0.0%) |
| 60 to 89 Minutes | 0 (0.0%) | 34 (13.1%) |
| 90 or more Minutes | 0 (0.0%) | 0 (0.0%) |
Time of Departure to Work by Sex in Chatmoss
The most frequent times of departure to work in Chatmoss are 12:00 AM to 4:59 AM (94, 32.9%) for males and 7:30 AM to 7:59 AM (89, 34.4%) for females.
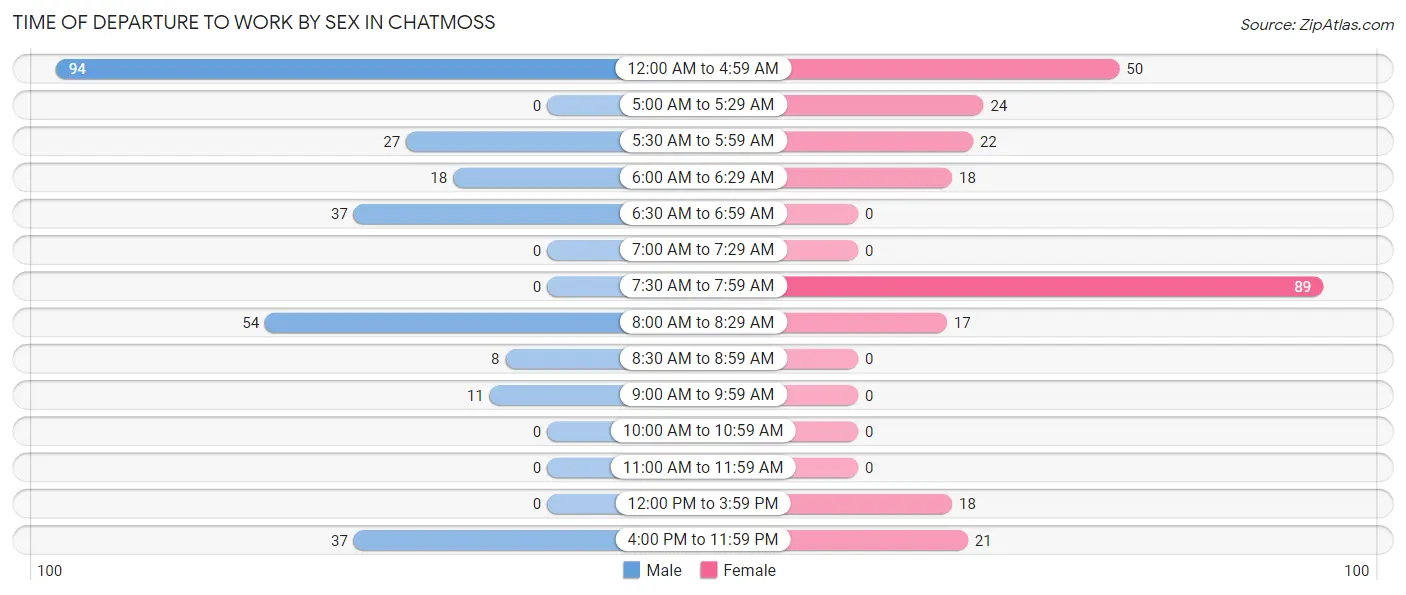
| Time of Departure | Male | Female |
| 12:00 AM to 4:59 AM | 94 (32.9%) | 50 (19.3%) |
| 5:00 AM to 5:29 AM | 0 (0.0%) | 24 (9.3%) |
| 5:30 AM to 5:59 AM | 27 (9.4%) | 22 (8.5%) |
| 6:00 AM to 6:29 AM | 18 (6.3%) | 18 (7.0%) |
| 6:30 AM to 6:59 AM | 37 (12.9%) | 0 (0.0%) |
| 7:00 AM to 7:29 AM | 0 (0.0%) | 0 (0.0%) |
| 7:30 AM to 7:59 AM | 0 (0.0%) | 89 (34.4%) |
| 8:00 AM to 8:29 AM | 54 (18.9%) | 17 (6.6%) |
| 8:30 AM to 8:59 AM | 8 (2.8%) | 0 (0.0%) |
| 9:00 AM to 9:59 AM | 11 (3.8%) | 0 (0.0%) |
| 10:00 AM to 10:59 AM | 0 (0.0%) | 0 (0.0%) |
| 11:00 AM to 11:59 AM | 0 (0.0%) | 0 (0.0%) |
| 12:00 PM to 3:59 PM | 0 (0.0%) | 18 (7.0%) |
| 4:00 PM to 11:59 PM | 37 (12.9%) | 21 (8.1%) |
| Total | 286 (100.0%) | 259 (100.0%) |
Housing Occupancy in Chatmoss
Occupancy by Ownership in Chatmoss
Of the total 575 dwellings in Chatmoss, owner-occupied units account for 474 (82.4%), while renter-occupied units make up 101 (17.6%).
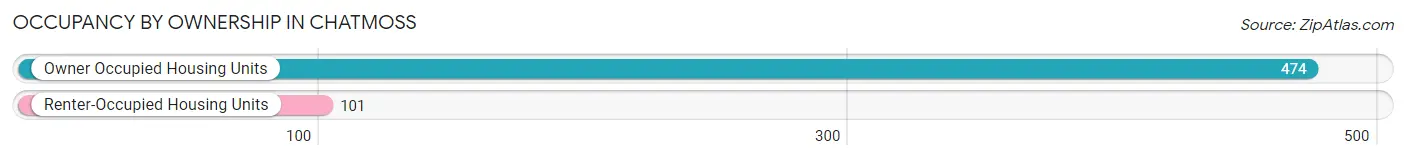
| Occupancy | # Housing Units | % Housing Units |
| Owner Occupied Housing Units | 474 | 82.4% |
| Renter-Occupied Housing Units | 101 | 17.6% |
| Total Occupied Housing Units | 575 | 100.0% |
Occupancy by Household Size in Chatmoss
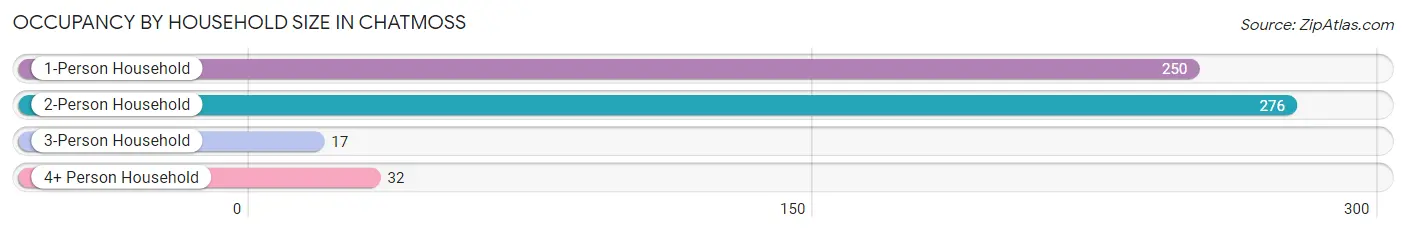
| Household Size | # Housing Units | % Housing Units |
| 1-Person Household | 250 | 43.5% |
| 2-Person Household | 276 | 48.0% |
| 3-Person Household | 17 | 3.0% |
| 4+ Person Household | 32 | 5.6% |
| Total Housing Units | 575 | 100.0% |
Occupancy by Ownership by Household Size in Chatmoss
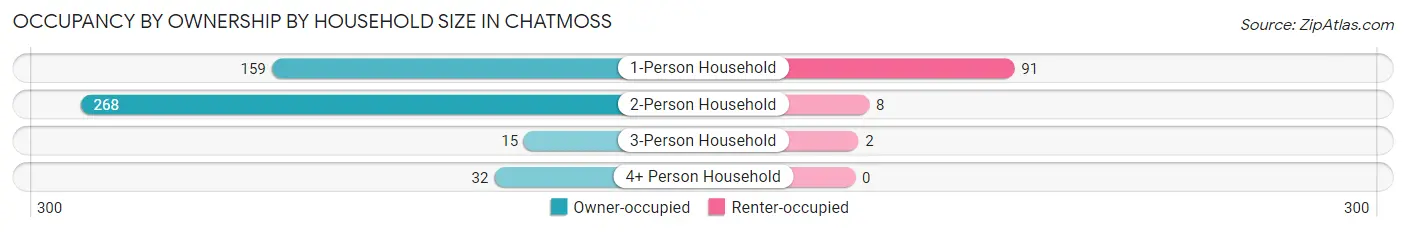
| Household Size | Owner-occupied | Renter-occupied |
| 1-Person Household | 159 (63.6%) | 91 (36.4%) |
| 2-Person Household | 268 (97.1%) | 8 (2.9%) |
| 3-Person Household | 15 (88.2%) | 2 (11.8%) |
| 4+ Person Household | 32 (100.0%) | 0 (0.0%) |
| Total Housing Units | 474 (82.4%) | 101 (17.6%) |
Occupancy by Educational Attainment in Chatmoss
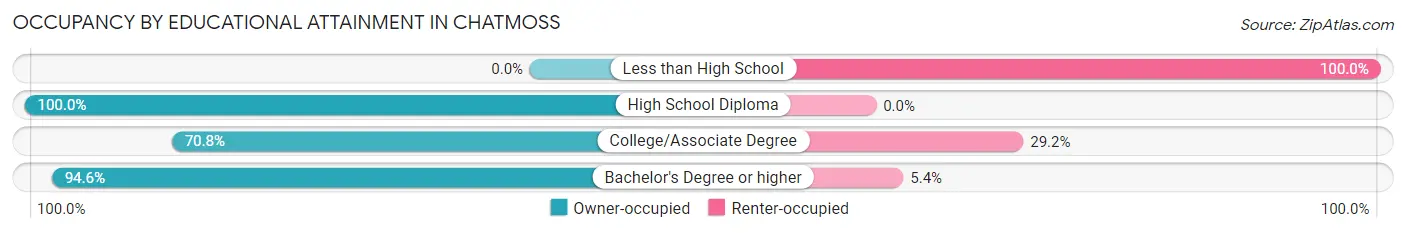
| Household Size | Owner-occupied | Renter-occupied |
| Less than High School | 0 (0.0%) | 8 (100.0%) |
| High School Diploma | 112 (100.0%) | 0 (0.0%) |
| College/Associate Degree | 204 (70.8%) | 84 (29.2%) |
| Bachelor's Degree or higher | 158 (94.6%) | 9 (5.4%) |
Occupancy by Age of Householder in Chatmoss
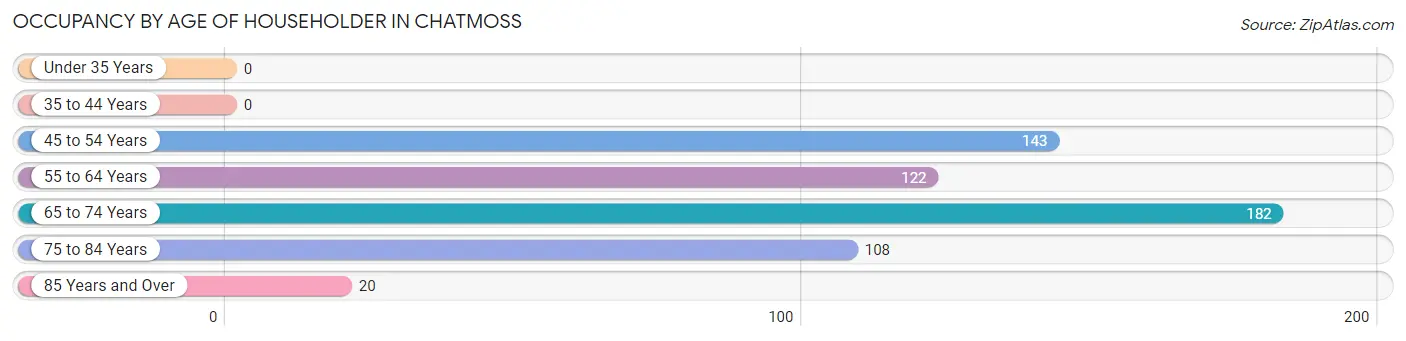
| Age Bracket | # Households | % Households |
| Under 35 Years | 0 | 0.0% |
| 35 to 44 Years | 0 | 0.0% |
| 45 to 54 Years | 143 | 24.9% |
| 55 to 64 Years | 122 | 21.2% |
| 65 to 74 Years | 182 | 31.7% |
| 75 to 84 Years | 108 | 18.8% |
| 85 Years and Over | 20 | 3.5% |
| Total | 575 | 100.0% |
Housing Finances in Chatmoss
Median Income by Occupancy in Chatmoss
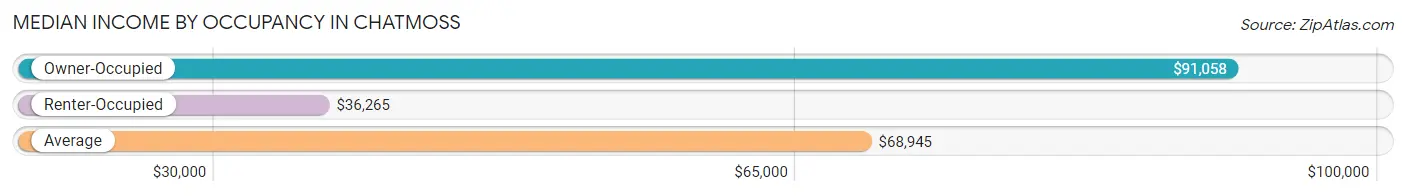
| Occupancy Type | # Households | Median Income |
| Owner-Occupied | 474 (82.4%) | $91,058 |
| Renter-Occupied | 101 (17.6%) | $36,265 |
| Average | 575 (100.0%) | $68,945 |
Occupancy by Householder Income Bracket in Chatmoss
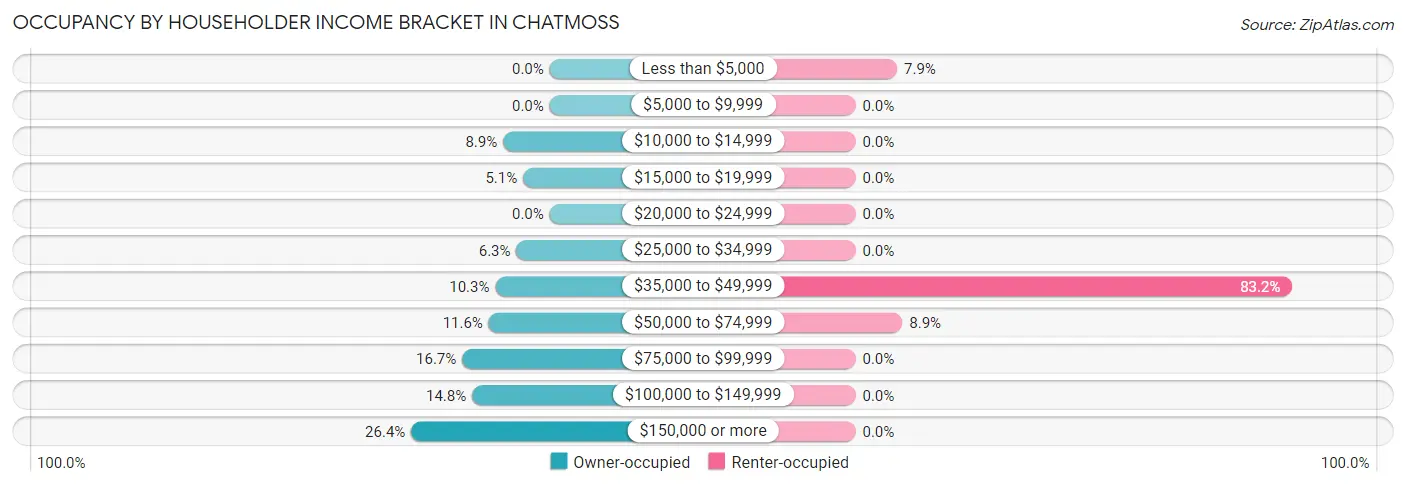
| Income Bracket | Owner-occupied | Renter-occupied |
| Less than $5,000 | 0 (0.0%) | 8 (7.9%) |
| $5,000 to $9,999 | 0 (0.0%) | 0 (0.0%) |
| $10,000 to $14,999 | 42 (8.9%) | 0 (0.0%) |
| $15,000 to $19,999 | 24 (5.1%) | 0 (0.0%) |
| $20,000 to $24,999 | 0 (0.0%) | 0 (0.0%) |
| $25,000 to $34,999 | 30 (6.3%) | 0 (0.0%) |
| $35,000 to $49,999 | 49 (10.3%) | 84 (83.2%) |
| $50,000 to $74,999 | 55 (11.6%) | 9 (8.9%) |
| $75,000 to $99,999 | 79 (16.7%) | 0 (0.0%) |
| $100,000 to $149,999 | 70 (14.8%) | 0 (0.0%) |
| $150,000 or more | 125 (26.4%) | 0 (0.0%) |
| Total | 474 (100.0%) | 101 (100.0%) |
Monthly Housing Cost Tiers in Chatmoss
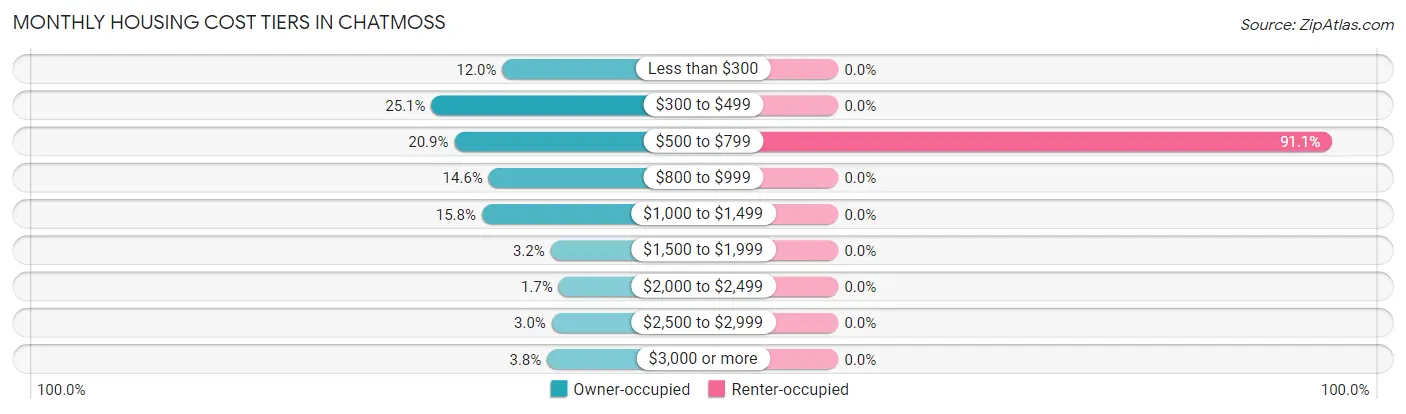
| Monthly Cost | Owner-occupied | Renter-occupied |
| Less than $300 | 57 (12.0%) | 0 (0.0%) |
| $300 to $499 | 119 (25.1%) | 0 (0.0%) |
| $500 to $799 | 99 (20.9%) | 92 (91.1%) |
| $800 to $999 | 69 (14.6%) | 0 (0.0%) |
| $1,000 to $1,499 | 75 (15.8%) | 0 (0.0%) |
| $1,500 to $1,999 | 15 (3.2%) | 0 (0.0%) |
| $2,000 to $2,499 | 8 (1.7%) | 0 (0.0%) |
| $2,500 to $2,999 | 14 (2.9%) | 0 (0.0%) |
| $3,000 or more | 18 (3.8%) | 0 (0.0%) |
| Total | 474 (100.0%) | 101 (100.0%) |
Physical Housing Characteristics in Chatmoss
Housing Structures in Chatmoss
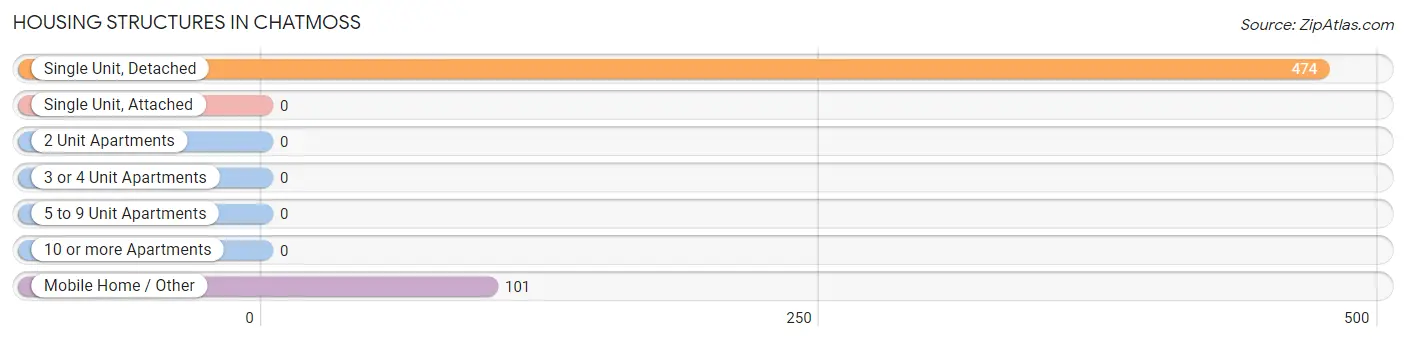
| Structure Type | # Housing Units | % Housing Units |
| Single Unit, Detached | 474 | 82.4% |
| Single Unit, Attached | 0 | 0.0% |
| 2 Unit Apartments | 0 | 0.0% |
| 3 or 4 Unit Apartments | 0 | 0.0% |
| 5 to 9 Unit Apartments | 0 | 0.0% |
| 10 or more Apartments | 0 | 0.0% |
| Mobile Home / Other | 101 | 17.6% |
| Total | 575 | 100.0% |
Housing Structures by Occupancy in Chatmoss
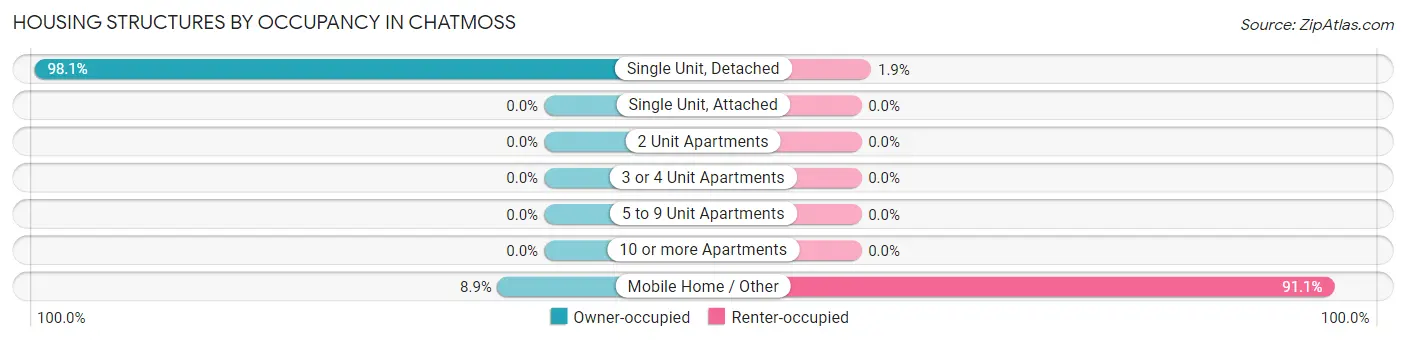
| Structure Type | Owner-occupied | Renter-occupied |
| Single Unit, Detached | 465 (98.1%) | 9 (1.9%) |
| Single Unit, Attached | 0 (0.0%) | 0 (0.0%) |
| 2 Unit Apartments | 0 (0.0%) | 0 (0.0%) |
| 3 or 4 Unit Apartments | 0 (0.0%) | 0 (0.0%) |
| 5 to 9 Unit Apartments | 0 (0.0%) | 0 (0.0%) |
| 10 or more Apartments | 0 (0.0%) | 0 (0.0%) |
| Mobile Home / Other | 9 (8.9%) | 92 (91.1%) |
| Total | 474 (82.4%) | 101 (17.6%) |
Housing Structures by Number of Rooms in Chatmoss
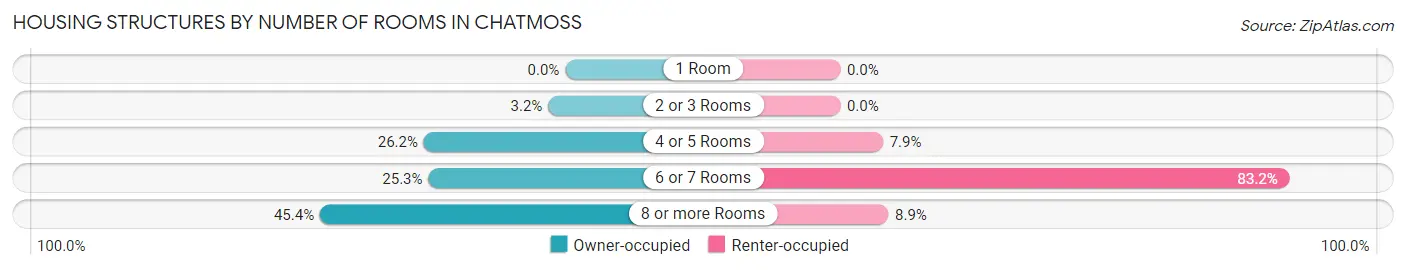
| Number of Rooms | Owner-occupied | Renter-occupied |
| 1 Room | 0 (0.0%) | 0 (0.0%) |
| 2 or 3 Rooms | 15 (3.2%) | 0 (0.0%) |
| 4 or 5 Rooms | 124 (26.2%) | 8 (7.9%) |
| 6 or 7 Rooms | 120 (25.3%) | 84 (83.2%) |
| 8 or more Rooms | 215 (45.4%) | 9 (8.9%) |
| Total | 474 (100.0%) | 101 (100.0%) |
Housing Structure by Heating Type in Chatmoss
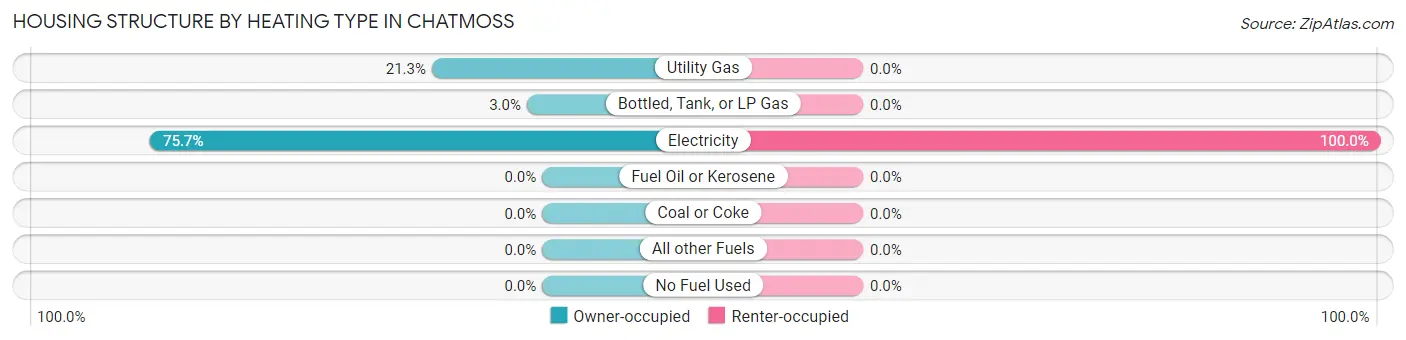
| Heating Type | Owner-occupied | Renter-occupied |
| Utility Gas | 101 (21.3%) | 0 (0.0%) |
| Bottled, Tank, or LP Gas | 14 (2.9%) | 0 (0.0%) |
| Electricity | 359 (75.7%) | 101 (100.0%) |
| Fuel Oil or Kerosene | 0 (0.0%) | 0 (0.0%) |
| Coal or Coke | 0 (0.0%) | 0 (0.0%) |
| All other Fuels | 0 (0.0%) | 0 (0.0%) |
| No Fuel Used | 0 (0.0%) | 0 (0.0%) |
| Total | 474 (100.0%) | 101 (100.0%) |
Household Vehicle Usage in Chatmoss
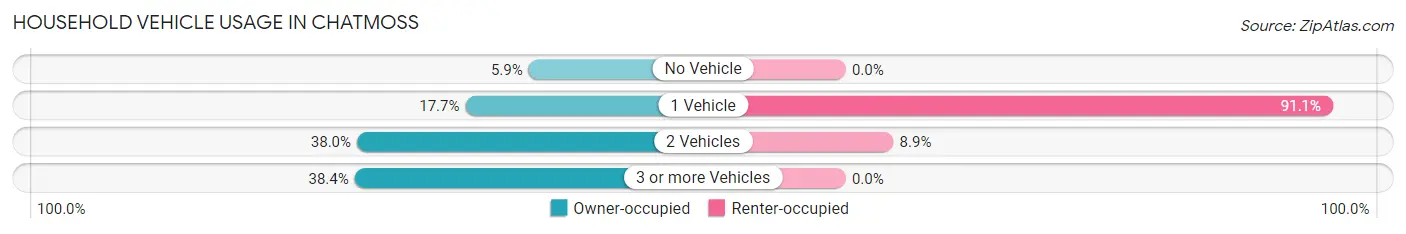
| Vehicles per Household | Owner-occupied | Renter-occupied |
| No Vehicle | 28 (5.9%) | 0 (0.0%) |
| 1 Vehicle | 84 (17.7%) | 92 (91.1%) |
| 2 Vehicles | 180 (38.0%) | 9 (8.9%) |
| 3 or more Vehicles | 182 (38.4%) | 0 (0.0%) |
| Total | 474 (100.0%) | 101 (100.0%) |
Real Estate & Mortgages in Chatmoss
Real Estate and Mortgage Overview in Chatmoss
| Characteristic | Without Mortgage | With Mortgage |
| Housing Units | 296 | 178 |
| Median Property Value | $217,900 | $207,000 |
| Median Household Income | $58,000 | $55 |
| Monthly Housing Costs | $446 | $18 |
| Real Estate Taxes | $1,224 | $0 |
Property Value by Mortgage Status in Chatmoss
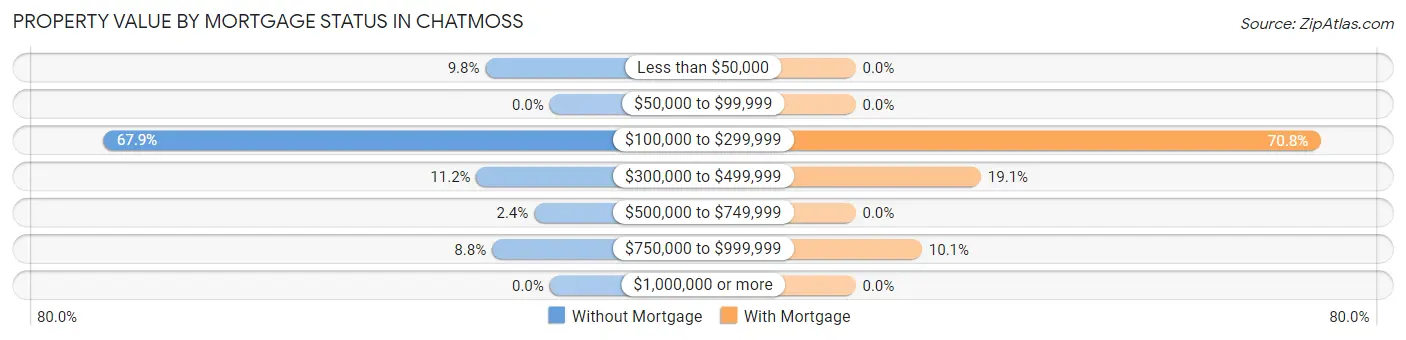
| Property Value | Without Mortgage | With Mortgage |
| Less than $50,000 | 29 (9.8%) | 0 (0.0%) |
| $50,000 to $99,999 | 0 (0.0%) | 0 (0.0%) |
| $100,000 to $299,999 | 201 (67.9%) | 126 (70.8%) |
| $300,000 to $499,999 | 33 (11.2%) | 34 (19.1%) |
| $500,000 to $749,999 | 7 (2.4%) | 0 (0.0%) |
| $750,000 to $999,999 | 26 (8.8%) | 18 (10.1%) |
| $1,000,000 or more | 0 (0.0%) | 0 (0.0%) |
| Total | 296 (100.0%) | 178 (100.0%) |
Household Income by Mortgage Status in Chatmoss
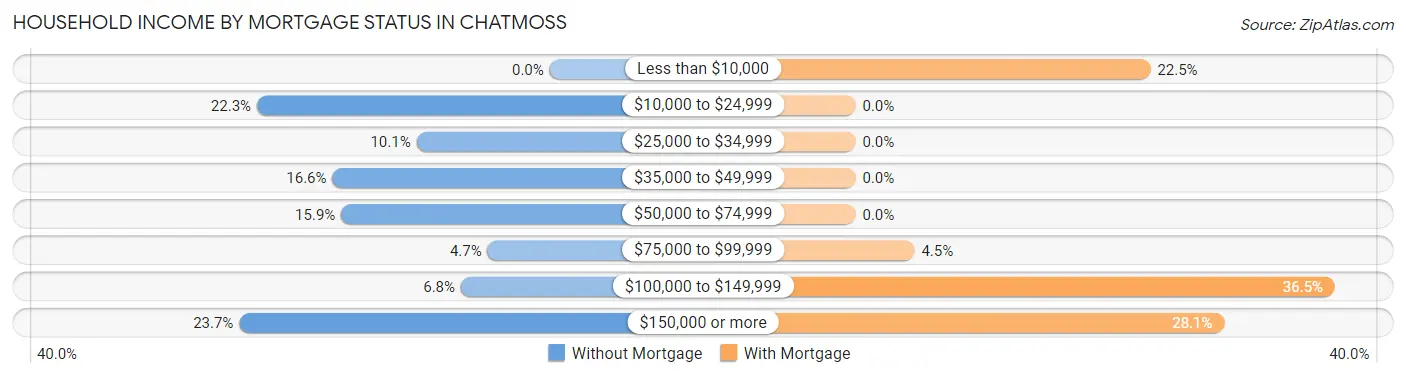
| Household Income | Without Mortgage | With Mortgage |
| Less than $10,000 | 0 (0.0%) | 40 (22.5%) |
| $10,000 to $24,999 | 66 (22.3%) | 0 (0.0%) |
| $25,000 to $34,999 | 30 (10.1%) | 0 (0.0%) |
| $35,000 to $49,999 | 49 (16.6%) | 0 (0.0%) |
| $50,000 to $74,999 | 47 (15.9%) | 0 (0.0%) |
| $75,000 to $99,999 | 14 (4.7%) | 8 (4.5%) |
| $100,000 to $149,999 | 20 (6.8%) | 65 (36.5%) |
| $150,000 or more | 70 (23.6%) | 50 (28.1%) |
| Total | 296 (100.0%) | 178 (100.0%) |
Property Value to Household Income Ratio in Chatmoss
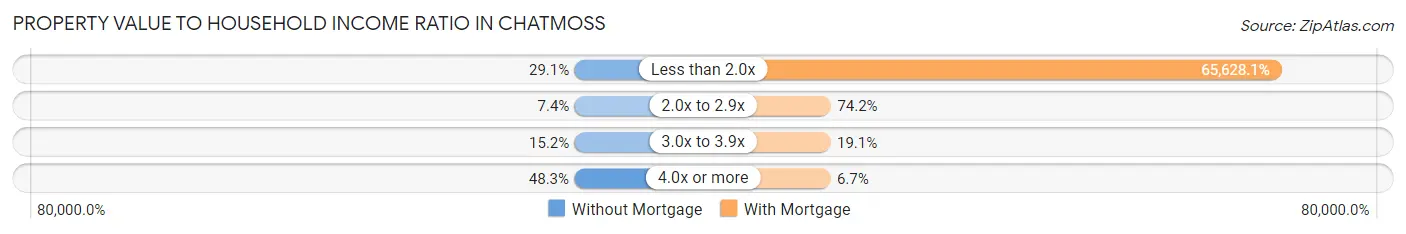
| Value-to-Income Ratio | Without Mortgage | With Mortgage |
| Less than 2.0x | 86 (29.0%) | 116,818 (65,628.1%) |
| 2.0x to 2.9x | 22 (7.4%) | 132 (74.2%) |
| 3.0x to 3.9x | 45 (15.2%) | 34 (19.1%) |
| 4.0x or more | 143 (48.3%) | 12 (6.7%) |
| Total | 296 (100.0%) | 178 (100.0%) |
Real Estate Taxes by Mortgage Status in Chatmoss
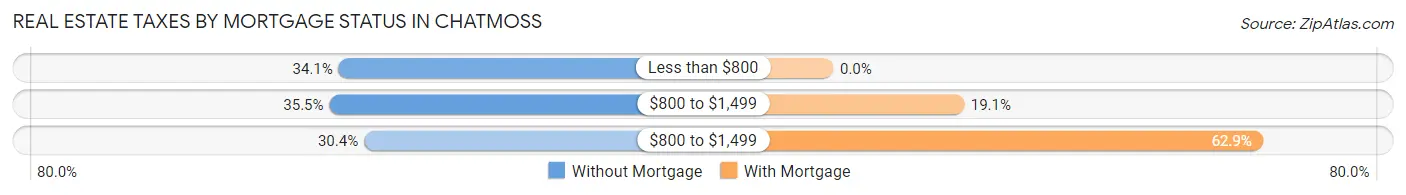
| Property Taxes | Without Mortgage | With Mortgage |
| Less than $800 | 101 (34.1%) | 0 (0.0%) |
| $800 to $1,499 | 105 (35.5%) | 34 (19.1%) |
| $800 to $1,499 | 90 (30.4%) | 112 (62.9%) |
| Total | 296 (100.0%) | 178 (100.0%) |
Health & Disability in Chatmoss
Health Insurance Coverage by Age in Chatmoss
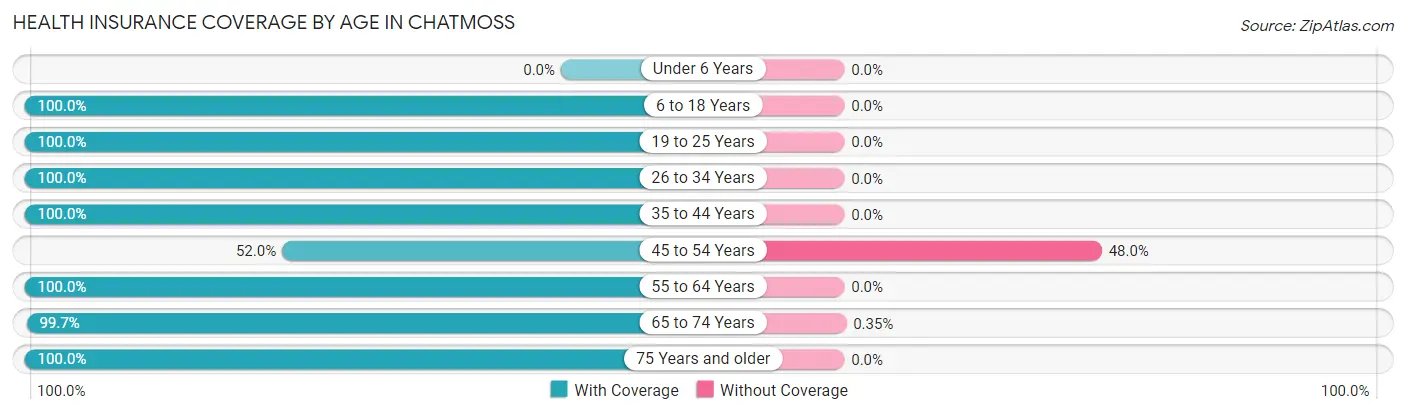
| Age Bracket | With Coverage | Without Coverage |
| Under 6 Years | 0 (0.0%) | 0 (0.0%) |
| 6 to 18 Years | 42 (100.0%) | 0 (0.0%) |
| 19 to 25 Years | 105 (100.0%) | 0 (0.0%) |
| 26 to 34 Years | 26 (100.0%) | 0 (0.0%) |
| 35 to 44 Years | 49 (100.0%) | 0 (0.0%) |
| 45 to 54 Years | 91 (52.0%) | 84 (48.0%) |
| 55 to 64 Years | 202 (100.0%) | 0 (0.0%) |
| 65 to 74 Years | 288 (99.7%) | 1 (0.4%) |
| 75 Years and older | 176 (100.0%) | 0 (0.0%) |
| Total | 979 (92.0%) | 85 (8.0%) |
Health Insurance Coverage by Citizenship Status in Chatmoss
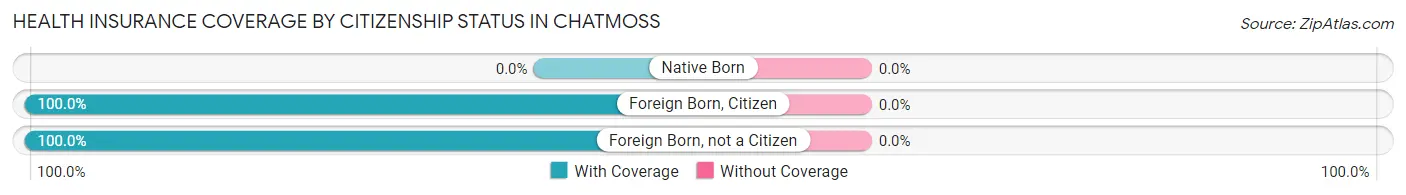
| Citizenship Status | With Coverage | Without Coverage |
| Native Born | 0 (0.0%) | 0 (0.0%) |
| Foreign Born, Citizen | 42 (100.0%) | 0 (0.0%) |
| Foreign Born, not a Citizen | 105 (100.0%) | 0 (0.0%) |
Health Insurance Coverage by Household Income in Chatmoss
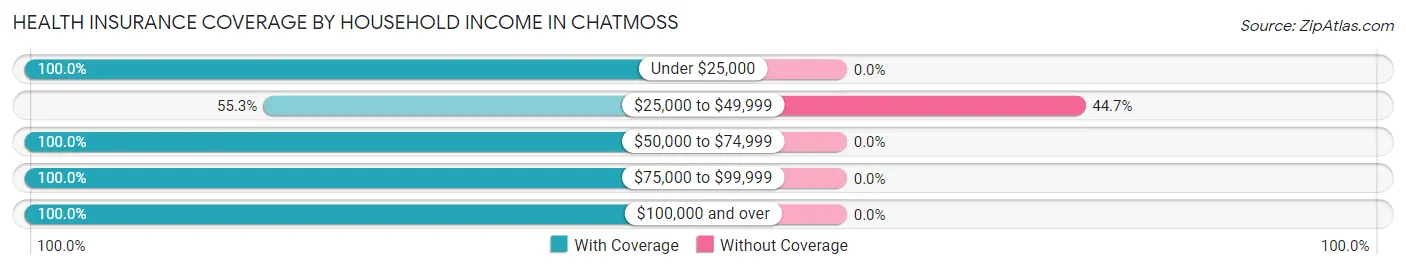
| Household Income | With Coverage | Without Coverage |
| Under $25,000 | 116 (100.0%) | 0 (0.0%) |
| $25,000 to $49,999 | 104 (55.3%) | 84 (44.7%) |
| $50,000 to $74,999 | 116 (100.0%) | 0 (0.0%) |
| $75,000 to $99,999 | 141 (100.0%) | 0 (0.0%) |
| $100,000 and over | 501 (100.0%) | 0 (0.0%) |
Public vs Private Health Insurance Coverage by Age in Chatmoss
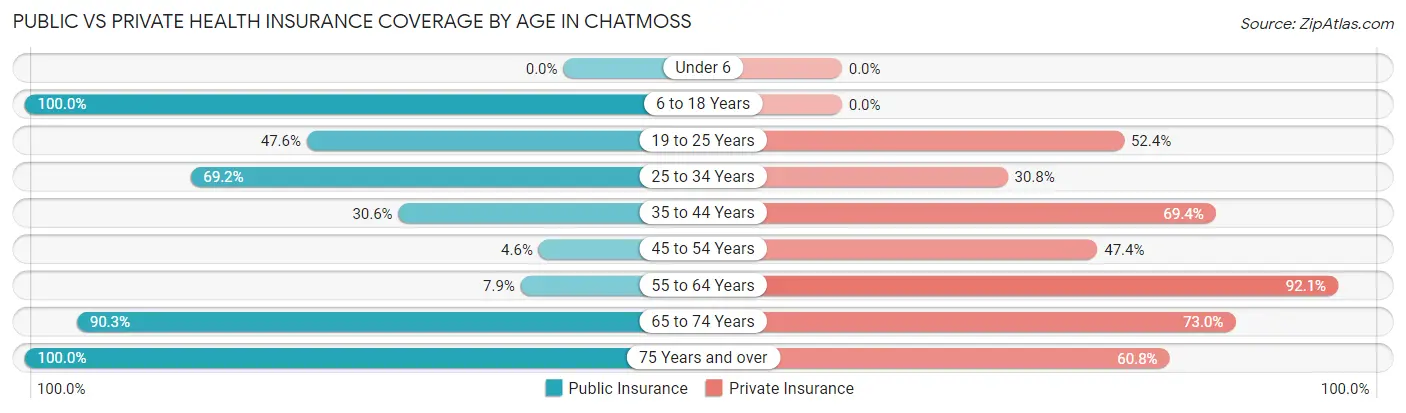
| Age Bracket | Public Insurance | Private Insurance |
| Under 6 | 0 (0.0%) | 0 (0.0%) |
| 6 to 18 Years | 42 (100.0%) | 0 (0.0%) |
| 19 to 25 Years | 50 (47.6%) | 55 (52.4%) |
| 25 to 34 Years | 18 (69.2%) | 8 (30.8%) |
| 35 to 44 Years | 15 (30.6%) | 34 (69.4%) |
| 45 to 54 Years | 8 (4.6%) | 83 (47.4%) |
| 55 to 64 Years | 16 (7.9%) | 186 (92.1%) |
| 65 to 74 Years | 261 (90.3%) | 211 (73.0%) |
| 75 Years and over | 176 (100.0%) | 107 (60.8%) |
| Total | 586 (55.1%) | 684 (64.3%) |
Disability Status by Sex by Age in Chatmoss
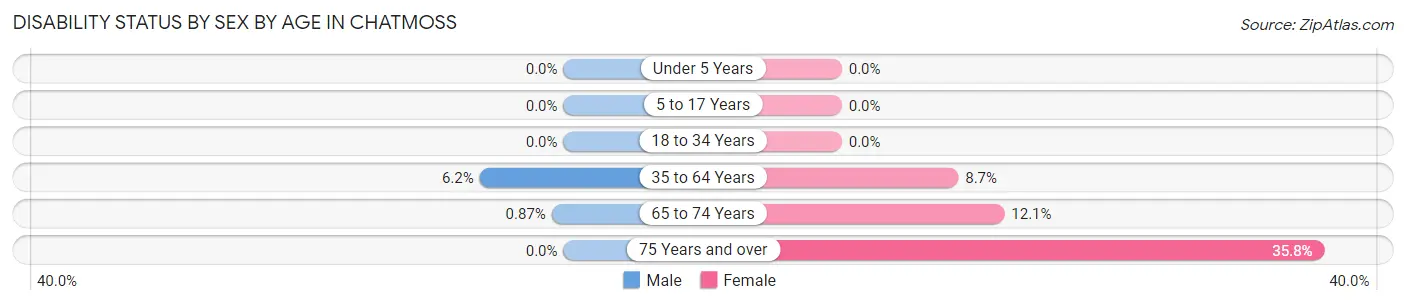
| Age Bracket | Male | Female |
| Under 5 Years | 0 (0.0%) | 0 (0.0%) |
| 5 to 17 Years | 0 (0.0%) | 0 (0.0%) |
| 18 to 34 Years | 0 (0.0%) | 0 (0.0%) |
| 35 to 64 Years | 15 (6.2%) | 16 (8.6%) |
| 65 to 74 Years | 1 (0.9%) | 21 (12.1%) |
| 75 Years and over | 0 (0.0%) | 43 (35.8%) |
Disability Class by Sex by Age in Chatmoss
Disability Class: Hearing Difficulty
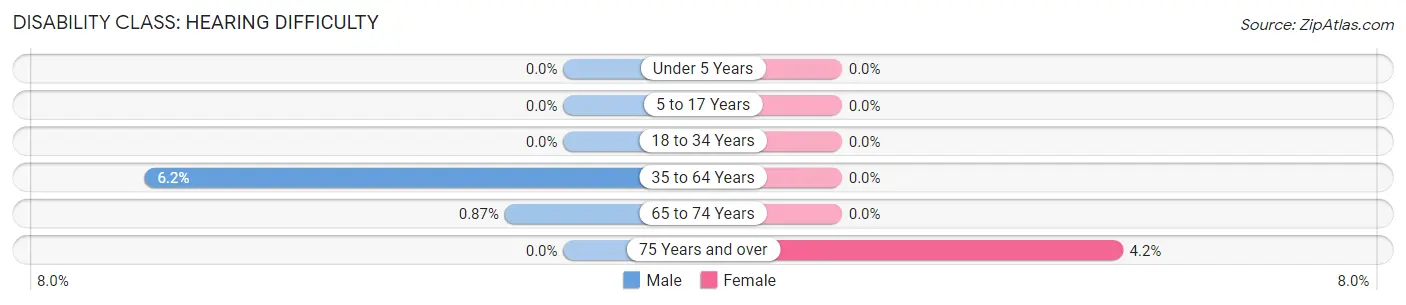
| Age Bracket | Male | Female |
| Under 5 Years | 0 (0.0%) | 0 (0.0%) |
| 5 to 17 Years | 0 (0.0%) | 0 (0.0%) |
| 18 to 34 Years | 0 (0.0%) | 0 (0.0%) |
| 35 to 64 Years | 15 (6.2%) | 0 (0.0%) |
| 65 to 74 Years | 1 (0.9%) | 0 (0.0%) |
| 75 Years and over | 0 (0.0%) | 5 (4.2%) |
Disability Class: Vision Difficulty
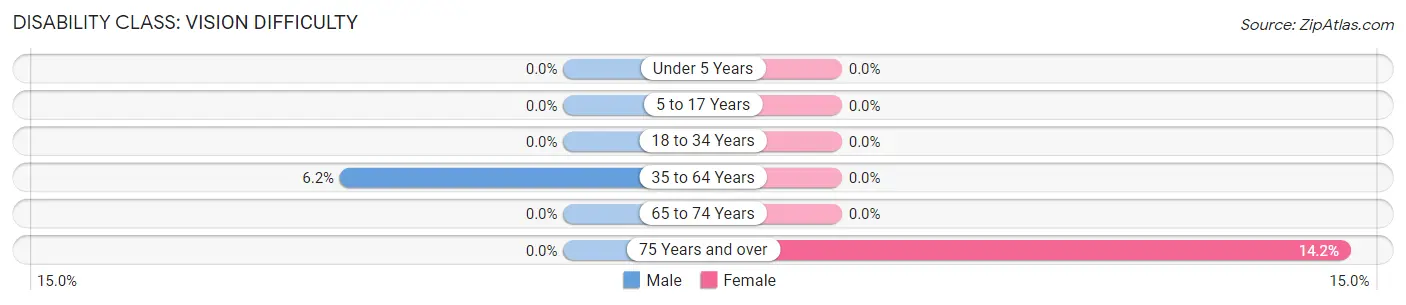
| Age Bracket | Male | Female |
| Under 5 Years | 0 (0.0%) | 0 (0.0%) |
| 5 to 17 Years | 0 (0.0%) | 0 (0.0%) |
| 18 to 34 Years | 0 (0.0%) | 0 (0.0%) |
| 35 to 64 Years | 15 (6.2%) | 0 (0.0%) |
| 65 to 74 Years | 0 (0.0%) | 0 (0.0%) |
| 75 Years and over | 0 (0.0%) | 17 (14.2%) |
Disability Class: Cognitive Difficulty
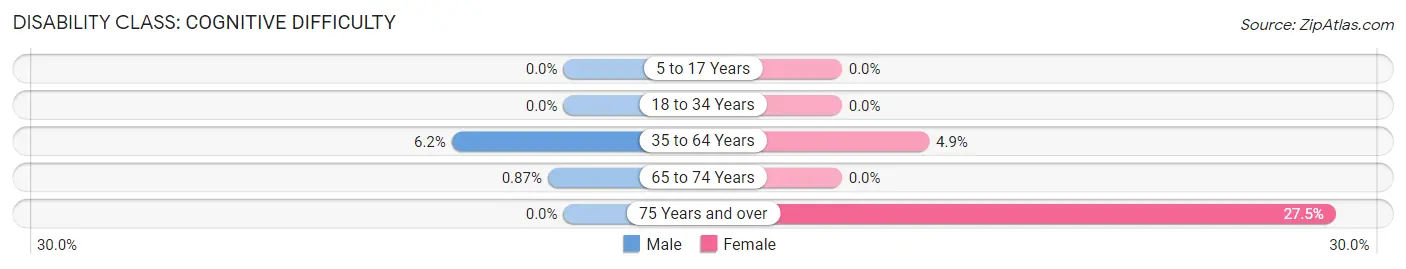
| Age Bracket | Male | Female |
| 5 to 17 Years | 0 (0.0%) | 0 (0.0%) |
| 18 to 34 Years | 0 (0.0%) | 0 (0.0%) |
| 35 to 64 Years | 15 (6.2%) | 9 (4.9%) |
| 65 to 74 Years | 1 (0.9%) | 0 (0.0%) |
| 75 Years and over | 0 (0.0%) | 33 (27.5%) |
Disability Class: Ambulatory Difficulty
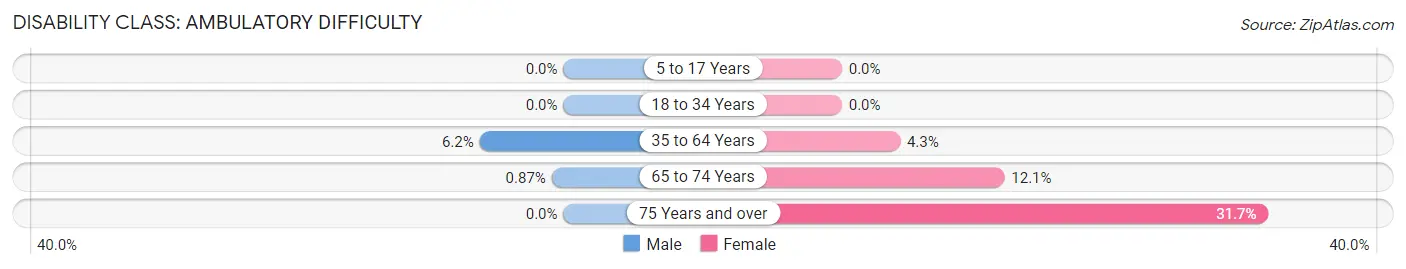
| Age Bracket | Male | Female |
| 5 to 17 Years | 0 (0.0%) | 0 (0.0%) |
| 18 to 34 Years | 0 (0.0%) | 0 (0.0%) |
| 35 to 64 Years | 15 (6.2%) | 8 (4.3%) |
| 65 to 74 Years | 1 (0.9%) | 21 (12.1%) |
| 75 Years and over | 0 (0.0%) | 38 (31.7%) |
Disability Class: Self-Care Difficulty
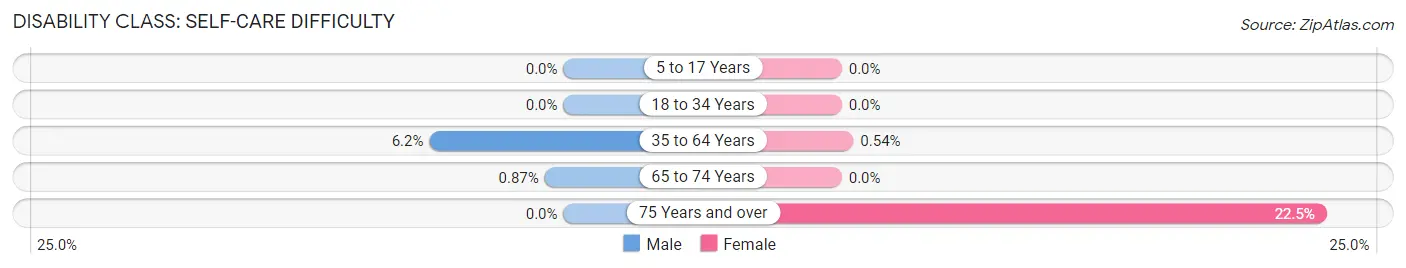
| Age Bracket | Male | Female |
| 5 to 17 Years | 0 (0.0%) | 0 (0.0%) |
| 18 to 34 Years | 0 (0.0%) | 0 (0.0%) |
| 35 to 64 Years | 15 (6.2%) | 1 (0.5%) |
| 65 to 74 Years | 1 (0.9%) | 0 (0.0%) |
| 75 Years and over | 0 (0.0%) | 27 (22.5%) |
Technology Access in Chatmoss
Computing Device Access in Chatmoss
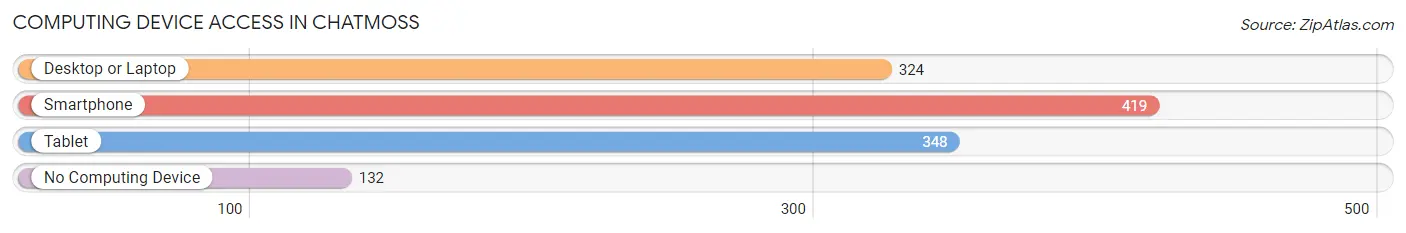
| Device Type | # Households | % Households |
| Desktop or Laptop | 324 | 56.4% |
| Smartphone | 419 | 72.9% |
| Tablet | 348 | 60.5% |
| No Computing Device | 132 | 23.0% |
| Total | 575 | 100.0% |
Internet Access in Chatmoss
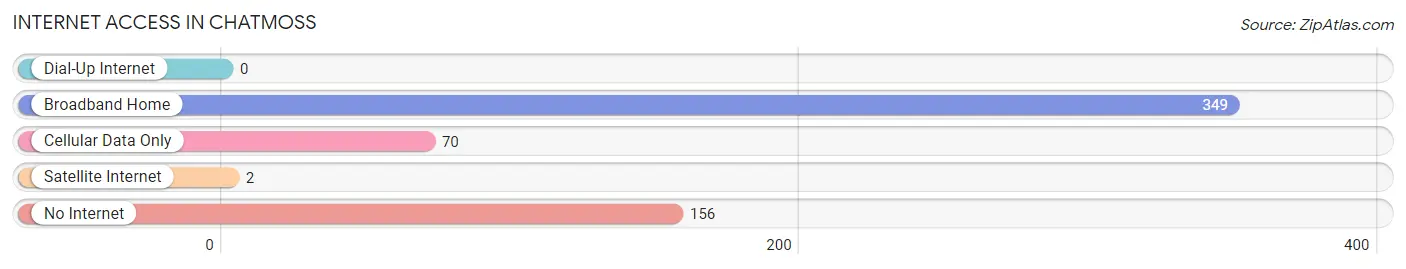
| Internet Type | # Households | % Households |
| Dial-Up Internet | 0 | 0.0% |
| Broadband Home | 349 | 60.7% |
| Cellular Data Only | 70 | 12.2% |
| Satellite Internet | 2 | 0.4% |
| No Internet | 156 | 27.1% |
| Total | 575 | 100.0% |
Chatmoss Summary
Chatmoss is a small unincorporated community located in the southern part of Henry County, Virginia. It is situated along the banks of the Smith River, which is a tributary of the Roanoke River. The community is located approximately 10 miles south of Martinsville and is part of the Martinsville-Henry County Metropolitan Statistical Area.
History
The area that is now known as Chatmoss was first settled in the late 1700s by a group of settlers from North Carolina. The community was originally known as “Chatmoss”, which is derived from the Native American word “Chattamos”, meaning “place of many trees”. The community was officially established in 1820 and was named after the nearby Chatmoss Plantation.
The community was primarily an agricultural area, with many of the residents working as farmers. The area was also home to several small businesses, including a general store, a blacksmith shop, and a grist mill.
In the late 1800s, the community began to experience a period of growth and development. The Chatmoss Railroad was built in 1887, connecting the community to the nearby towns of Martinsville and Ridgeway. This allowed for the transportation of goods and people to and from the area.
In the early 1900s, the community experienced a period of decline. The railroad was abandoned in the 1920s and the population began to decline. The community was further impacted by the Great Depression and World War II.
Geography
Chatmoss is located in the southern part of Henry County, Virginia. It is situated along the banks of the Smith River, which is a tributary of the Roanoke River. The community is located approximately 10 miles south of Martinsville and is part of the Martinsville-Henry County Metropolitan Statistical Area.
The area is mostly rural, with rolling hills and forests. The climate is temperate, with hot summers and cold winters. The average annual temperature is around 60 degrees Fahrenheit.
Economy
The economy of Chatmoss is largely based on agriculture. The area is home to several farms, which produce a variety of crops, including corn, soybeans, and tobacco. The area is also home to several small businesses, including a general store, a blacksmith shop, and a grist mill.
Demographics
As of the 2010 census, the population of Chatmoss was 1,093. The racial makeup of the community was 97.3% White, 0.9% African American, 0.2% Native American, 0.2% Asian, and 1.4% from other races. The median household income was $37,917, and the median family income was $45,000. The per capita income was $18,945.
Common Questions
What is Per Capita Income in Chatmoss?
Per Capita income in Chatmoss is $58,851.
What is the Median Family Income in Chatmoss?
Median Family Income in Chatmoss is $108,527.
What is the Median Household income in Chatmoss?
Median Household Income in Chatmoss is $68,945.
What is Income or Wage Gap in Chatmoss?
Income or Wage Gap in Chatmoss is 46.5%.
Women in Chatmoss earn 53.5 cents for every dollar earned by a man.
What is Inequality or Gini Index in Chatmoss?
Inequality or Gini Index in Chatmoss is 0.49.
What is the Total Population of Chatmoss?
Total Population of Chatmoss is 1,064.
What is the Total Male Population of Chatmoss?
Total Male Population of Chatmoss is 462.
What is the Total Female Population of Chatmoss?
Total Female Population of Chatmoss is 602.
What is the Ratio of Males per 100 Females in Chatmoss?
There are 76.74 Males per 100 Females in Chatmoss.
What is the Ratio of Females per 100 Males in Chatmoss?
There are 130.30 Females per 100 Males in Chatmoss.
What is the Median Population Age in Chatmoss?
Median Population Age in Chatmoss is 63.4 Years.
What is the Average Family Size in Chatmoss
Average Family Size in Chatmoss is 2.3 People.
What is the Average Household Size in Chatmoss
Average Household Size in Chatmoss is 1.9 People.
How Large is the Labor Force in Chatmoss?
There are 615 People in the Labor Forcein in Chatmoss.
What is the Percentage of People in the Labor Force in Chatmoss?
60.2% of People are in the Labor Force in Chatmoss.