Onancock, VA Map & Demographics
Onancock Map
Onancock Overview
$36,685
PER CAPITA INCOME
$68,188
AVG FAMILY INCOME
$51,830
AVG HOUSEHOLD INCOME
16.0%
WAGE / INCOME GAP [ % ]
84.0¢/ $1
WAGE / INCOME GAP [ $ ]
$10,189
FAMILY INCOME DEFICIT
0.47
INEQUALITY / GINI INDEX
1,434
TOTAL POPULATION
646
MALE POPULATION
788
FEMALE POPULATION
81.98
MALES / 100 FEMALES
121.98
FEMALES / 100 MALES
45.5
MEDIAN AGE
2.7
AVG FAMILY SIZE
2.0
AVG HOUSEHOLD SIZE
596
LABOR FORCE [ PEOPLE ]
54.5%
PERCENT IN LABOR FORCE
9.7%
UNEMPLOYMENT RATE
Onancock Zip Codes
Onancock Area Codes
Income in Onancock
Income Overview in Onancock
Per Capita Income in Onancock is $36,685, while median incomes of families and households are $68,188 and $51,830 respectively.
| Characteristic | Number | Measure |
| Per Capita Income | 1,434 | $36,685 |
| Median Family Income | 400 | $68,188 |
| Mean Family Income | 400 | $96,288 |
| Median Household Income | 696 | $51,830 |
| Mean Household Income | 696 | $77,064 |
| Income Deficit | 400 | $10,189 |
| Wage / Income Gap (%) | 1,434 | 16.04% |
| Wage / Income Gap ($) | 1,434 | 83.96¢ per $1 |
| Gini / Inequality Index | 1,434 | 0.47 |
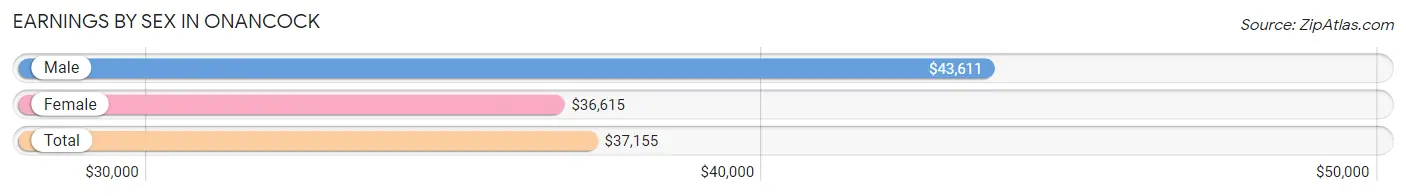
Earnings by Sex in Onancock
Average Earnings in Onancock are $37,155, $43,611 for men and $36,615 for women, a difference of 16.0%.
| Sex | Number | Average Earnings |
| Male | 264 (45.1%) | $43,611 |
| Female | 322 (54.9%) | $36,615 |
| Total | 586 (100.0%) | $37,155 |
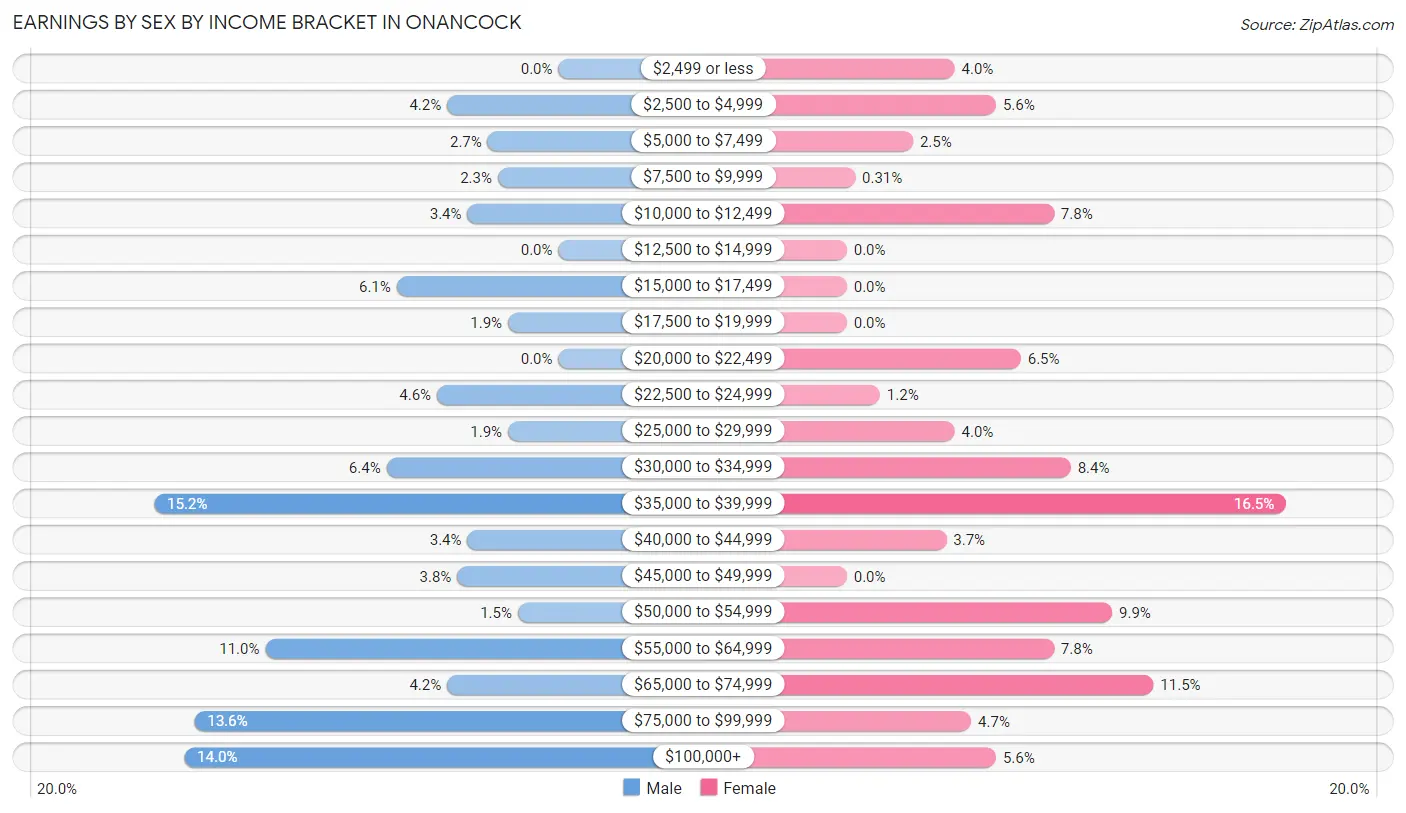
Earnings by Sex by Income Bracket in Onancock
The most common earnings brackets in Onancock are $35,000 to $39,999 for men (40 | 15.1%) and $35,000 to $39,999 for women (53 | 16.5%).
| Income | Male | Female |
| $2,499 or less | 0 (0.0%) | 13 (4.0%) |
| $2,500 to $4,999 | 11 (4.2%) | 18 (5.6%) |
| $5,000 to $7,499 | 7 (2.6%) | 8 (2.5%) |
| $7,500 to $9,999 | 6 (2.3%) | 1 (0.3%) |
| $10,000 to $12,499 | 9 (3.4%) | 25 (7.8%) |
| $12,500 to $14,999 | 0 (0.0%) | 0 (0.0%) |
| $15,000 to $17,499 | 16 (6.1%) | 0 (0.0%) |
| $17,500 to $19,999 | 5 (1.9%) | 0 (0.0%) |
| $20,000 to $22,499 | 0 (0.0%) | 21 (6.5%) |
| $22,500 to $24,999 | 12 (4.5%) | 4 (1.2%) |
| $25,000 to $29,999 | 5 (1.9%) | 13 (4.0%) |
| $30,000 to $34,999 | 17 (6.4%) | 27 (8.4%) |
| $35,000 to $39,999 | 40 (15.1%) | 53 (16.5%) |
| $40,000 to $44,999 | 9 (3.4%) | 12 (3.7%) |
| $45,000 to $49,999 | 10 (3.8%) | 0 (0.0%) |
| $50,000 to $54,999 | 4 (1.5%) | 32 (9.9%) |
| $55,000 to $64,999 | 29 (11.0%) | 25 (7.8%) |
| $65,000 to $74,999 | 11 (4.2%) | 37 (11.5%) |
| $75,000 to $99,999 | 36 (13.6%) | 15 (4.7%) |
| $100,000+ | 37 (14.0%) | 18 (5.6%) |
| Total | 264 (100.0%) | 322 (100.0%) |
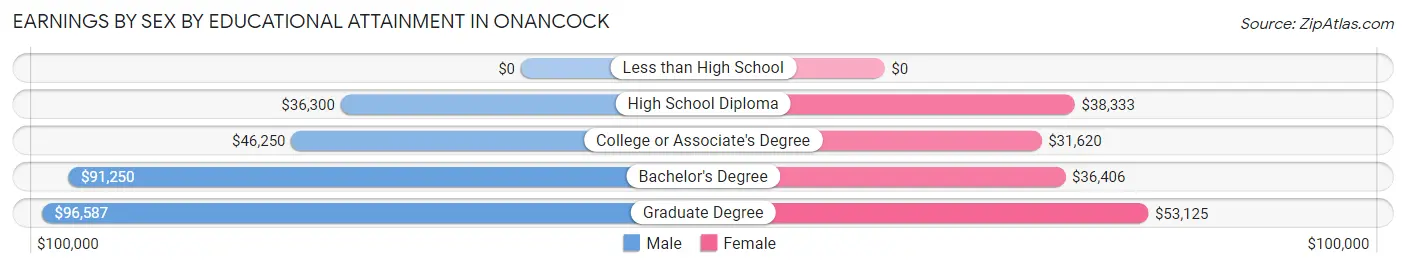
Earnings by Sex by Educational Attainment in Onancock
Average earnings in Onancock are $47,031 for men and $36,536 for women, a difference of 22.3%. Men with an educational attainment of graduate degree enjoy the highest average annual earnings of $96,587, while those with high school diploma education earn the least with $36,300. Women with an educational attainment of graduate degree earn the most with the average annual earnings of $53,125, while those with college or associate's degree education have the smallest earnings of $31,620.
| Educational Attainment | Male Income | Female Income |
| Less than High School | - | - |
| High School Diploma | $36,300 | $38,333 |
| College or Associate's Degree | $46,250 | $31,620 |
| Bachelor's Degree | $91,250 | $36,406 |
| Graduate Degree | $96,587 | $53,125 |
| Total | $47,031 | $36,536 |
Family Income in Onancock
Family Income Brackets in Onancock
According to the Onancock family income data, there are 111 families falling into the $50,000 to $74,999 income range, which is the most common income bracket and makes up 27.8% of all families. Conversely, the $15,000 to $24,999 income bracket is the least frequent group with only 6 families (1.5%) belonging to this category.
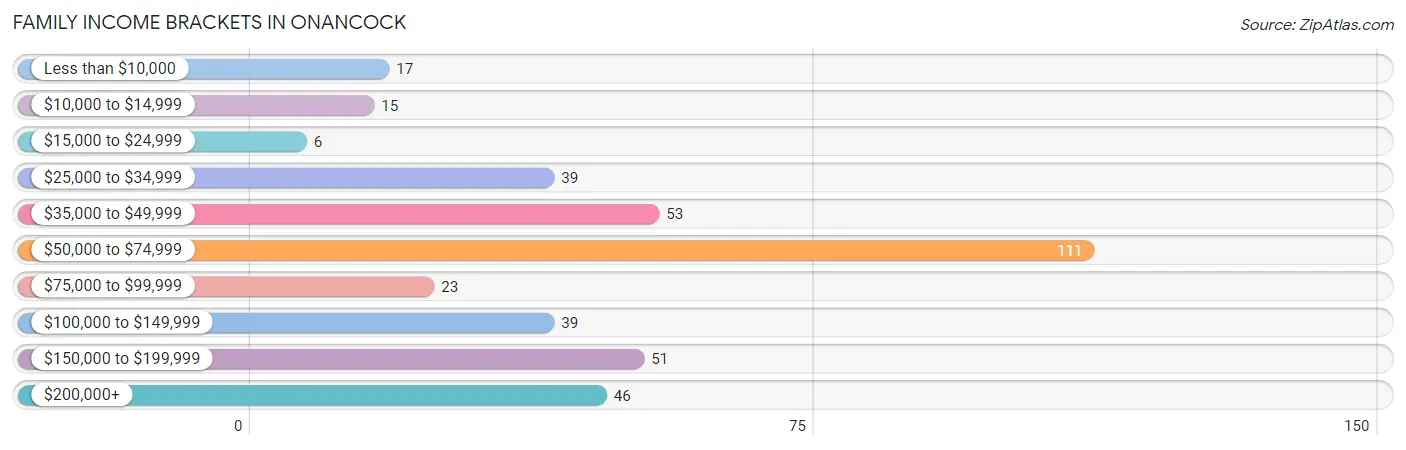
| Income Bracket | # Families | % Families |
| Less than $10,000 | 17 | 4.3% |
| $10,000 to $14,999 | 15 | 3.8% |
| $15,000 to $24,999 | 6 | 1.5% |
| $25,000 to $34,999 | 39 | 9.8% |
| $35,000 to $49,999 | 53 | 13.3% |
| $50,000 to $74,999 | 111 | 27.8% |
| $75,000 to $99,999 | 23 | 5.8% |
| $100,000 to $149,999 | 39 | 9.8% |
| $150,000 to $199,999 | 51 | 12.8% |
| $200,000+ | 46 | 11.5% |
Family Income by Famaliy Size in Onancock
2-person families (250 | 62.5%) account for the highest median family income in Onancock with $78,333 per family, while 2-person families (250 | 62.5%) have the highest median income of $39,166 per family member.
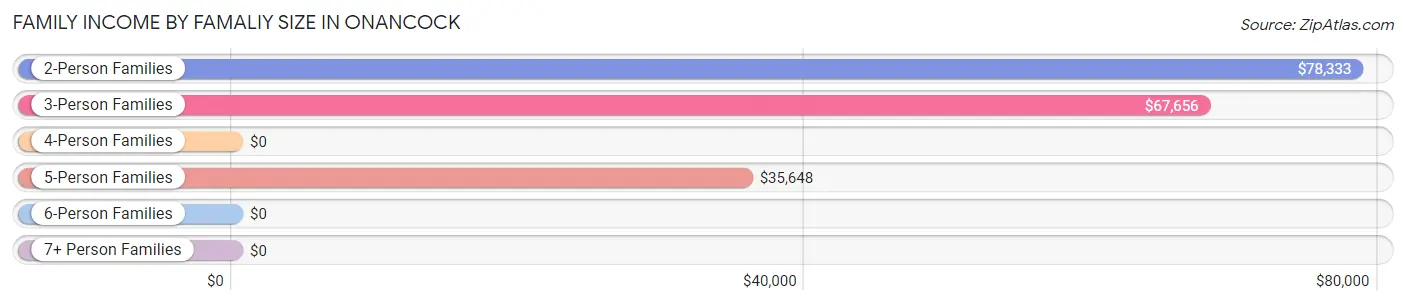
| Income Bracket | # Families | Median Income |
| 2-Person Families | 250 (62.5%) | $78,333 |
| 3-Person Families | 40 (10.0%) | $67,656 |
| 4-Person Families | 60 (15.0%) | $0 |
| 5-Person Families | 50 (12.5%) | $35,648 |
| 6-Person Families | 0 (0.0%) | $0 |
| 7+ Person Families | 0 (0.0%) | $0 |
| Total | 400 (100.0%) | $68,188 |
Family Income by Number of Earners in Onancock
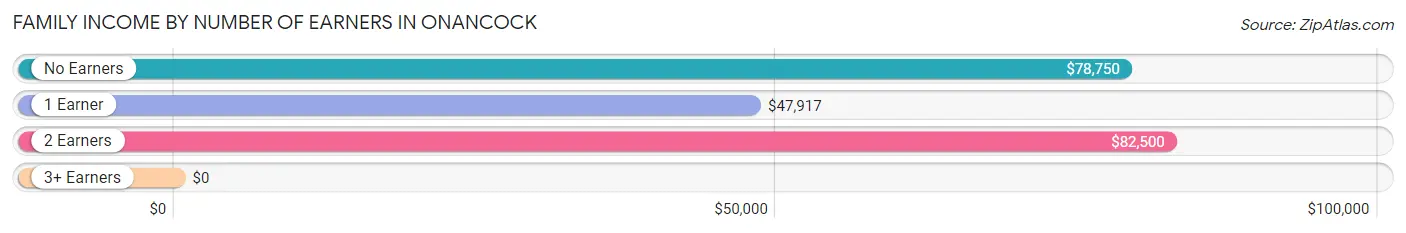
| Number of Earners | # Families | Median Income |
| No Earners | 117 (29.2%) | $78,750 |
| 1 Earner | 165 (41.2%) | $47,917 |
| 2 Earners | 106 (26.5%) | $82,500 |
| 3+ Earners | 12 (3.0%) | $0 |
| Total | 400 (100.0%) | $68,188 |
Household Income in Onancock
Household Income Brackets in Onancock
With 190 households falling in the category, the $50,000 to $74,999 income range is the most frequent in Onancock, accounting for 27.3% of all households. In contrast, only 34 households (4.9%) fall into the $75,000 to $99,999 income bracket, making it the least populous group.
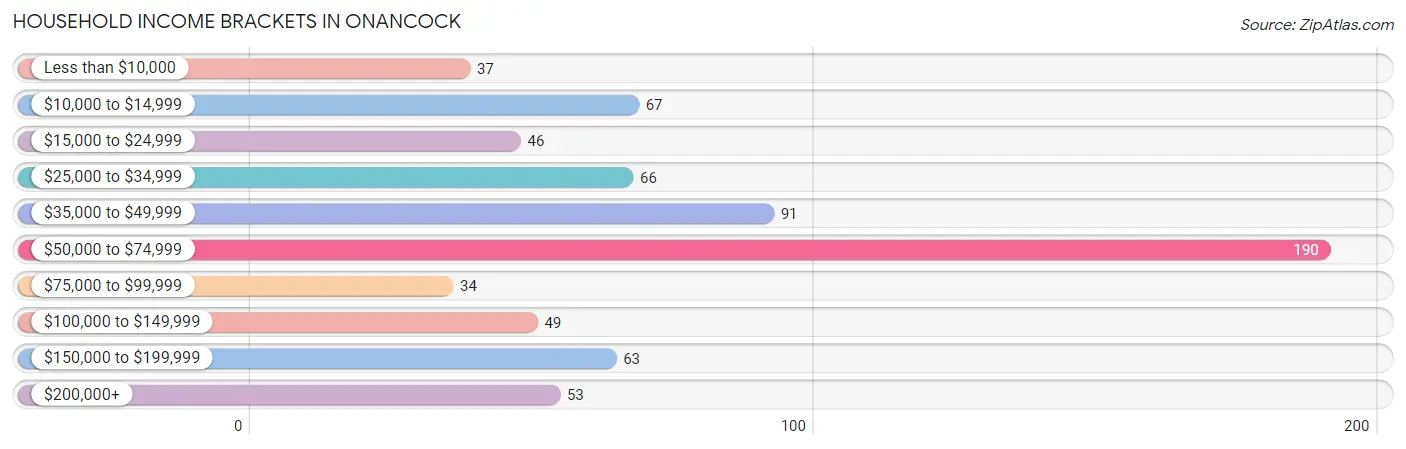
| Income Bracket | # Households | % Households |
| Less than $10,000 | 37 | 5.3% |
| $10,000 to $14,999 | 67 | 9.6% |
| $15,000 to $24,999 | 46 | 6.6% |
| $25,000 to $34,999 | 66 | 9.5% |
| $35,000 to $49,999 | 91 | 13.1% |
| $50,000 to $74,999 | 190 | 27.3% |
| $75,000 to $99,999 | 34 | 4.9% |
| $100,000 to $149,999 | 49 | 7.0% |
| $150,000 to $199,999 | 63 | 9.1% |
| $200,000+ | 53 | 7.6% |
Household Income by Householder Age in Onancock
The median household income in Onancock is $51,830, with the highest median household income of $71,184 found in the 45 to 64 years age bracket for the primary householder. A total of 184 households (26.4%) fall into this category. Meanwhile, the 15 to 24 years age bracket for the primary householder has the lowest median household income of $0, with 18 households (2.6%) in this group.
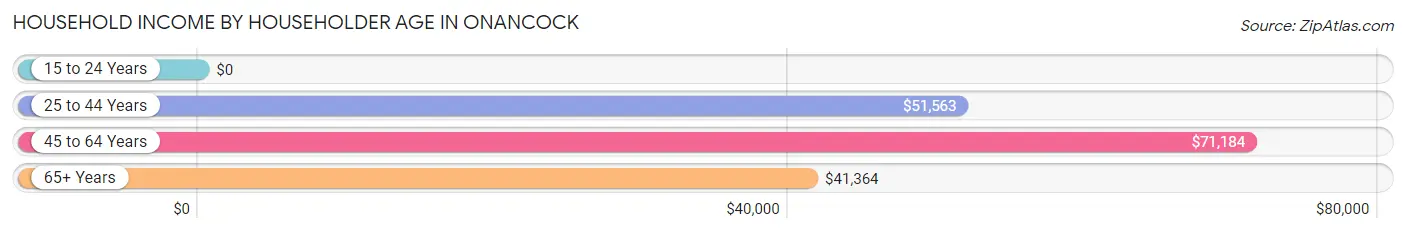
| Income Bracket | # Households | Median Income |
| 15 to 24 Years | 18 (2.6%) | $0 |
| 25 to 44 Years | 174 (25.0%) | $51,563 |
| 45 to 64 Years | 184 (26.4%) | $71,184 |
| 65+ Years | 320 (46.0%) | $41,364 |
| Total | 696 (100.0%) | $51,830 |
Poverty in Onancock
Income Below Poverty by Sex and Age in Onancock
With 17.2% poverty level for males and 22.5% for females among the residents of Onancock, under 5 year old males and 18 to 24 year old females are the most vulnerable to poverty, with 40 males (64.5%) and 23 females (60.5%) in their respective age groups living below the poverty level.
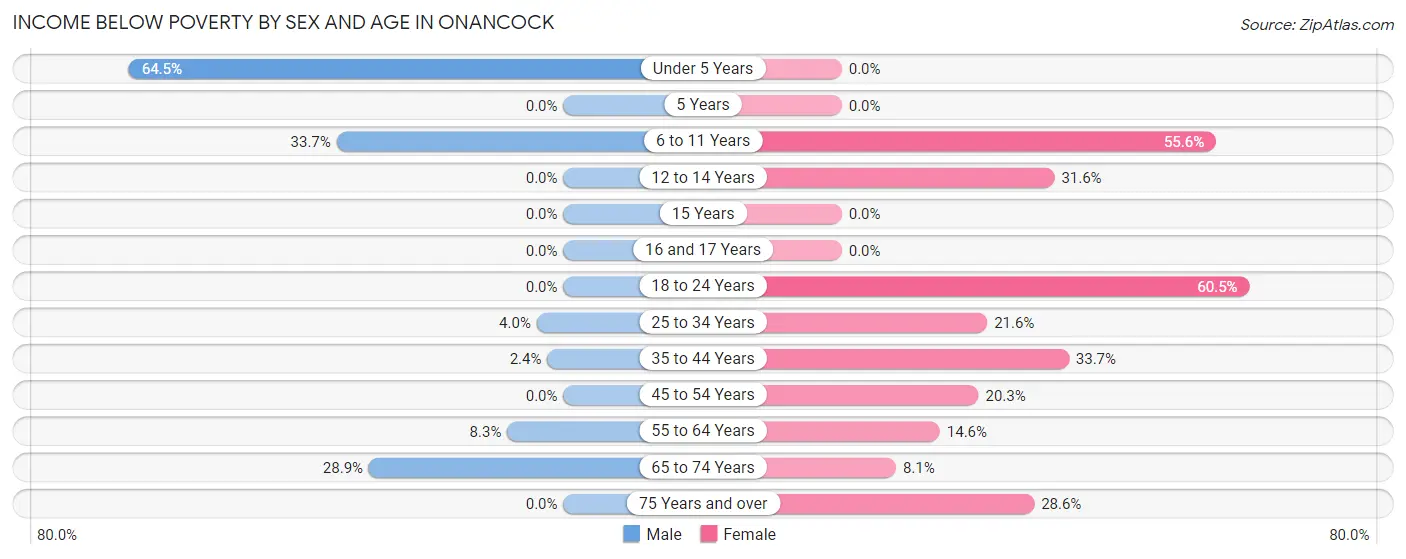
| Age Bracket | Male | Female |
| Under 5 Years | 40 (64.5%) | 0 (0.0%) |
| 5 Years | 0 (0.0%) | 0 (0.0%) |
| 6 to 11 Years | 33 (33.7%) | 20 (55.6%) |
| 12 to 14 Years | 0 (0.0%) | 12 (31.6%) |
| 15 Years | 0 (0.0%) | 0 (0.0%) |
| 16 and 17 Years | 0 (0.0%) | 0 (0.0%) |
| 18 to 24 Years | 0 (0.0%) | 23 (60.5%) |
| 25 to 34 Years | 3 (4.0%) | 19 (21.6%) |
| 35 to 44 Years | 1 (2.4%) | 29 (33.7%) |
| 45 to 54 Years | 0 (0.0%) | 13 (20.3%) |
| 55 to 64 Years | 6 (8.3%) | 15 (14.6%) |
| 65 to 74 Years | 28 (28.9%) | 14 (8.1%) |
| 75 Years and over | 0 (0.0%) | 32 (28.6%) |
| Total | 111 (17.2%) | 177 (22.5%) |
Income Above Poverty by Sex and Age in Onancock
According to the poverty statistics in Onancock, males aged 5 years and females aged under 5 years are the age groups that are most secure financially, with 100.0% of males and 100.0% of females in these age groups living above the poverty line.
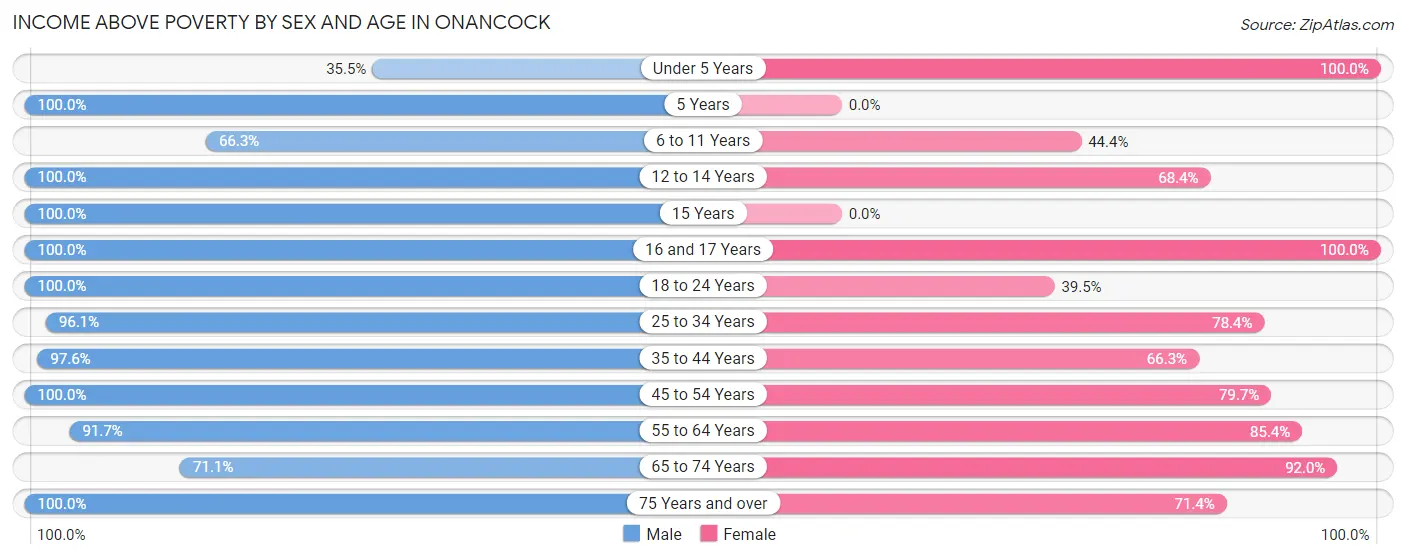
| Age Bracket | Male | Female |
| Under 5 Years | 22 (35.5%) | 45 (100.0%) |
| 5 Years | 35 (100.0%) | 0 (0.0%) |
| 6 to 11 Years | 65 (66.3%) | 16 (44.4%) |
| 12 to 14 Years | 17 (100.0%) | 26 (68.4%) |
| 15 Years | 10 (100.0%) | 0 (0.0%) |
| 16 and 17 Years | 12 (100.0%) | 4 (100.0%) |
| 18 to 24 Years | 17 (100.0%) | 15 (39.5%) |
| 25 to 34 Years | 73 (96.1%) | 69 (78.4%) |
| 35 to 44 Years | 41 (97.6%) | 57 (66.3%) |
| 45 to 54 Years | 34 (100.0%) | 51 (79.7%) |
| 55 to 64 Years | 66 (91.7%) | 88 (85.4%) |
| 65 to 74 Years | 69 (71.1%) | 160 (91.9%) |
| 75 Years and over | 74 (100.0%) | 80 (71.4%) |
| Total | 535 (82.8%) | 611 (77.5%) |
Income Below Poverty Among Married-Couple Families in Onancock
The poverty statistics for married-couple families in Onancock show that 6.1% or 15 of the total 246 families live below the poverty line. Families with 1 or 2 children have the highest poverty rate of 10.3%, comprising of 6 families. On the other hand, families with no children have the lowest poverty rate of 4.8%, which includes 9 families.
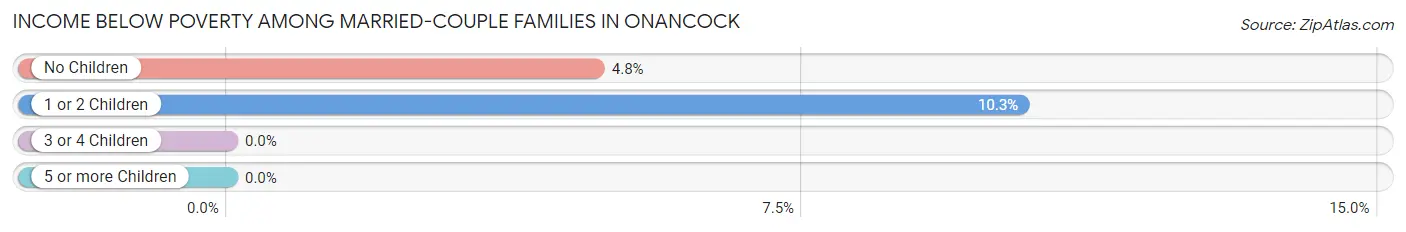
| Children | Above Poverty | Below Poverty |
| No Children | 179 (95.2%) | 9 (4.8%) |
| 1 or 2 Children | 52 (89.7%) | 6 (10.3%) |
| 3 or 4 Children | 0 (0.0%) | 0 (0.0%) |
| 5 or more Children | 0 (0.0%) | 0 (0.0%) |
| Total | 231 (93.9%) | 15 (6.1%) |
Income Below Poverty Among Single-Parent Households in Onancock
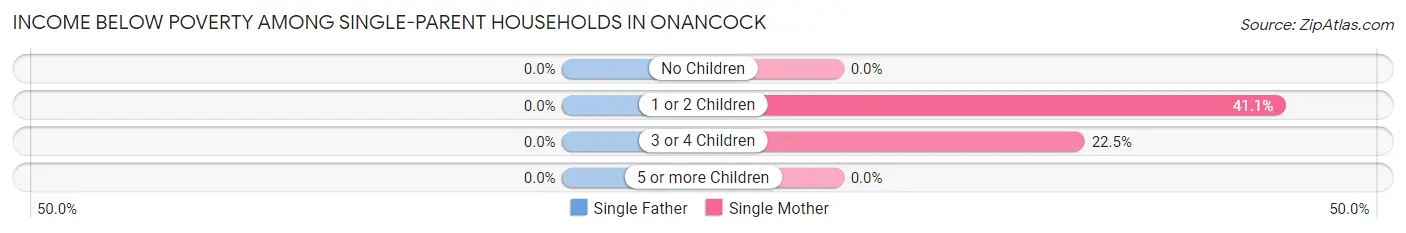
| Children | Single Father | Single Mother |
| No Children | 0 (0.0%) | 0 (0.0%) |
| 1 or 2 Children | 0 (0.0%) | 30 (41.1%) |
| 3 or 4 Children | 0 (0.0%) | 11 (22.5%) |
| 5 or more Children | 0 (0.0%) | 0 (0.0%) |
| Total | 0 (0.0%) | 41 (28.3%) |
Income Below Poverty Among Married-Couple vs Single-Parent Households in Onancock
The poverty data for Onancock shows that 15 of the married-couple family households (6.1%) and 41 of the single-parent households (26.6%) are living below the poverty level. Within the married-couple family households, those with 1 or 2 children have the highest poverty rate, with 6 households (10.3%) falling below the poverty line. Among the single-parent households, those with 1 or 2 children have the highest poverty rate, with 30 household (36.6%) living below poverty.
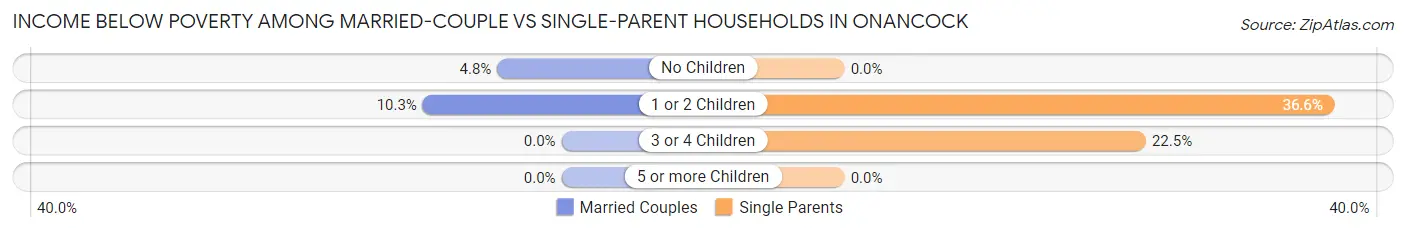
| Children | Married-Couple Families | Single-Parent Households |
| No Children | 9 (4.8%) | 0 (0.0%) |
| 1 or 2 Children | 6 (10.3%) | 30 (36.6%) |
| 3 or 4 Children | 0 (0.0%) | 11 (22.5%) |
| 5 or more Children | 0 (0.0%) | 0 (0.0%) |
| Total | 15 (6.1%) | 41 (26.6%) |
Race in Onancock
The most populous races in Onancock are White / Caucasian (743 | 51.8%), Black / African American (591 | 41.2%), and Two or more Races (95 | 6.6%).
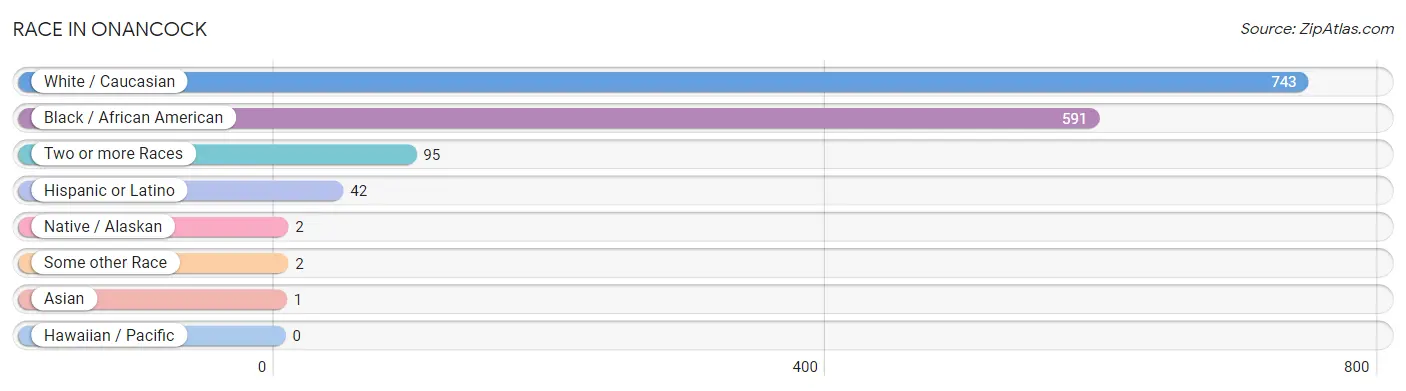
| Race | # Population | % Population |
| Asian | 1 | 0.1% |
| Black / African American | 591 | 41.2% |
| Hawaiian / Pacific | 0 | 0.0% |
| Hispanic or Latino | 42 | 2.9% |
| Native / Alaskan | 2 | 0.1% |
| White / Caucasian | 743 | 51.8% |
| Two or more Races | 95 | 6.6% |
| Some other Race | 2 | 0.1% |
| Total | 1,434 | 100.0% |
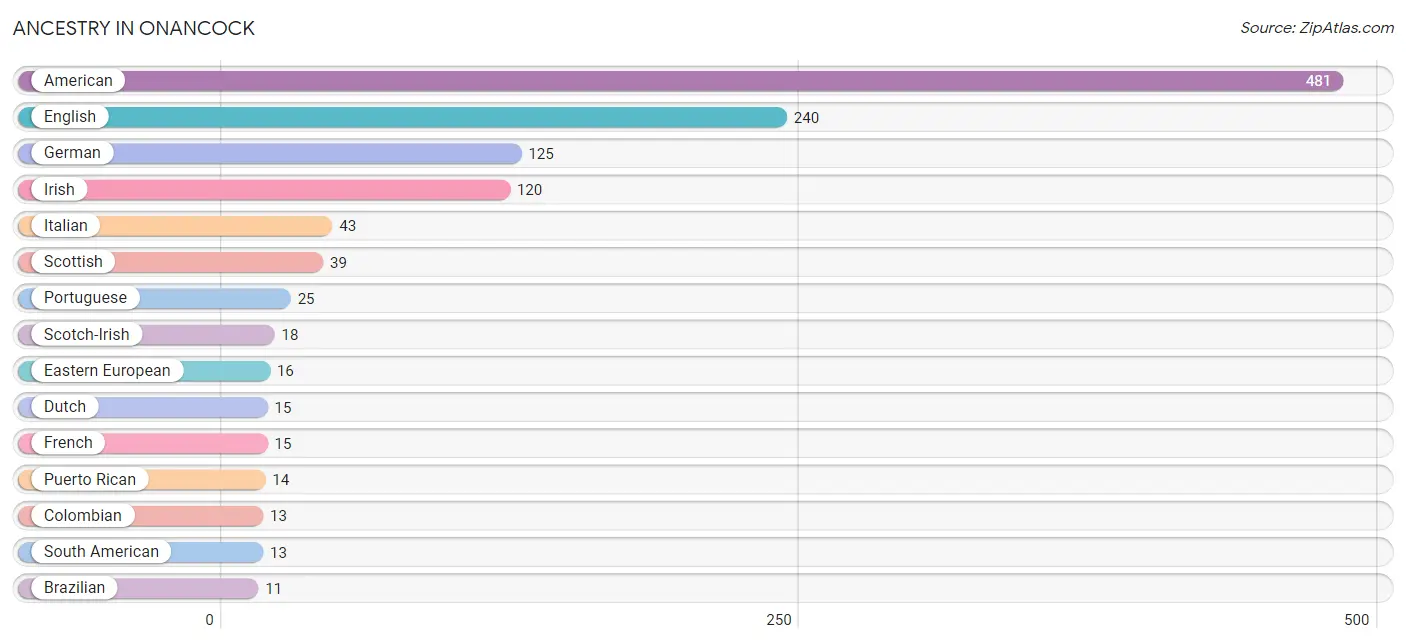
Ancestry in Onancock
The most populous ancestries reported in Onancock are American (481 | 33.5%), English (240 | 16.7%), German (125 | 8.7%), Irish (120 | 8.4%), and Italian (43 | 3.0%), together accounting for 70.4% of all Onancock residents.
| Ancestry | # Population | % Population |
| Albanian | 4 | 0.3% |
| American | 481 | 33.5% |
| Apache | 2 | 0.1% |
| Austrian | 4 | 0.3% |
| Brazilian | 11 | 0.8% |
| British | 6 | 0.4% |
| Colombian | 13 | 0.9% |
| Czech | 3 | 0.2% |
| Danish | 1 | 0.1% |
| Dutch | 15 | 1.1% |
| Eastern European | 16 | 1.1% |
| English | 240 | 16.7% |
| European | 9 | 0.6% |
| Finnish | 4 | 0.3% |
| French | 15 | 1.1% |
| French Canadian | 9 | 0.6% |
| German | 125 | 8.7% |
| Haitian | 10 | 0.7% |
| Hungarian | 2 | 0.1% |
| Indian (Asian) | 1 | 0.1% |
| Irish | 120 | 8.4% |
| Italian | 43 | 3.0% |
| Jamaican | 10 | 0.7% |
| Mexican | 3 | 0.2% |
| Northern European | 1 | 0.1% |
| Polish | 8 | 0.6% |
| Portuguese | 25 | 1.7% |
| Puerto Rican | 14 | 1.0% |
| Scandinavian | 2 | 0.1% |
| Scotch-Irish | 18 | 1.3% |
| Scottish | 39 | 2.7% |
| Slovak | 3 | 0.2% |
| South American | 13 | 0.9% |
| Swedish | 3 | 0.2% |
| Ukrainian | 1 | 0.1% |
| Welsh | 10 | 0.7% | View All 36 Rows |
Immigrants in Onancock
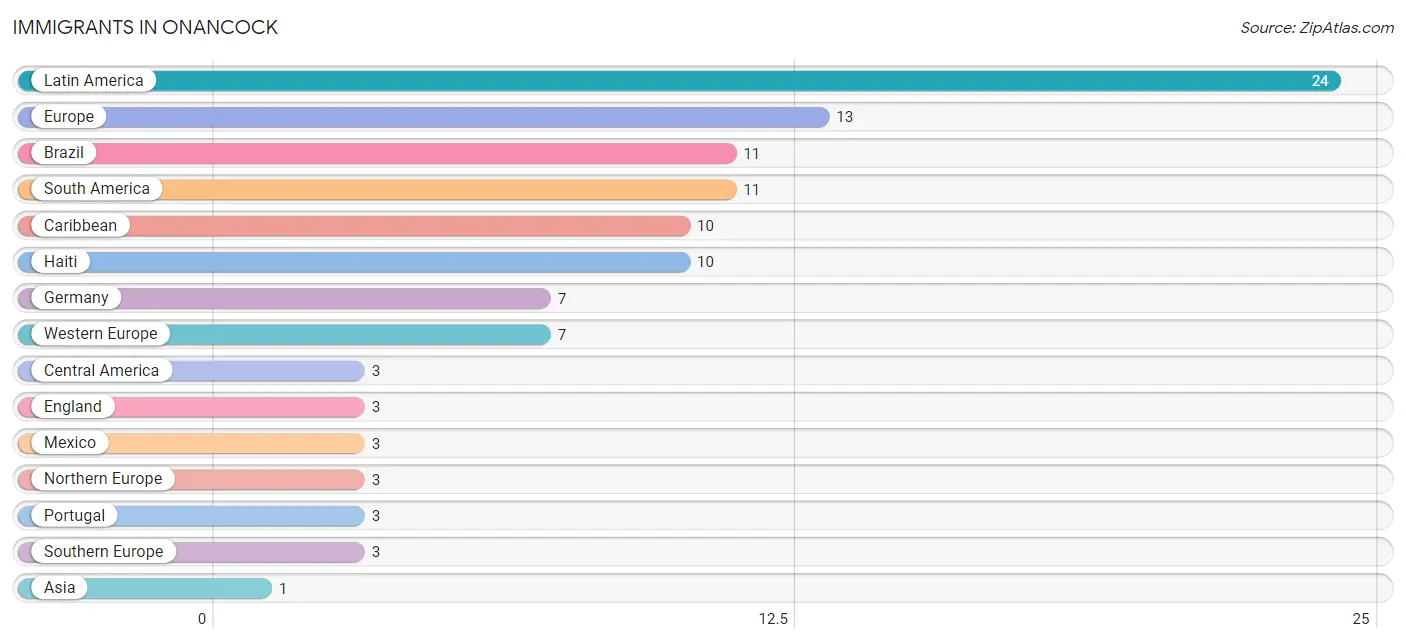
The most numerous immigrant groups reported in Onancock came from Latin America (24 | 1.7%), Europe (13 | 0.9%), Brazil (11 | 0.8%), South America (11 | 0.8%), and Caribbean (10 | 0.7%), together accounting for 4.8% of all Onancock residents.
| Immigration Origin | # Population | % Population |
| Asia | 1 | 0.1% |
| Brazil | 11 | 0.8% |
| Caribbean | 10 | 0.7% |
| Central America | 3 | 0.2% |
| China | 1 | 0.1% |
| Eastern Asia | 1 | 0.1% |
| England | 3 | 0.2% |
| Europe | 13 | 0.9% |
| Germany | 7 | 0.5% |
| Haiti | 10 | 0.7% |
| Latin America | 24 | 1.7% |
| Mexico | 3 | 0.2% |
| Northern Europe | 3 | 0.2% |
| Portugal | 3 | 0.2% |
| South America | 11 | 0.8% |
| Southern Europe | 3 | 0.2% |
| Western Europe | 7 | 0.5% | View All 17 Rows |
Sex and Age in Onancock
Sex and Age in Onancock
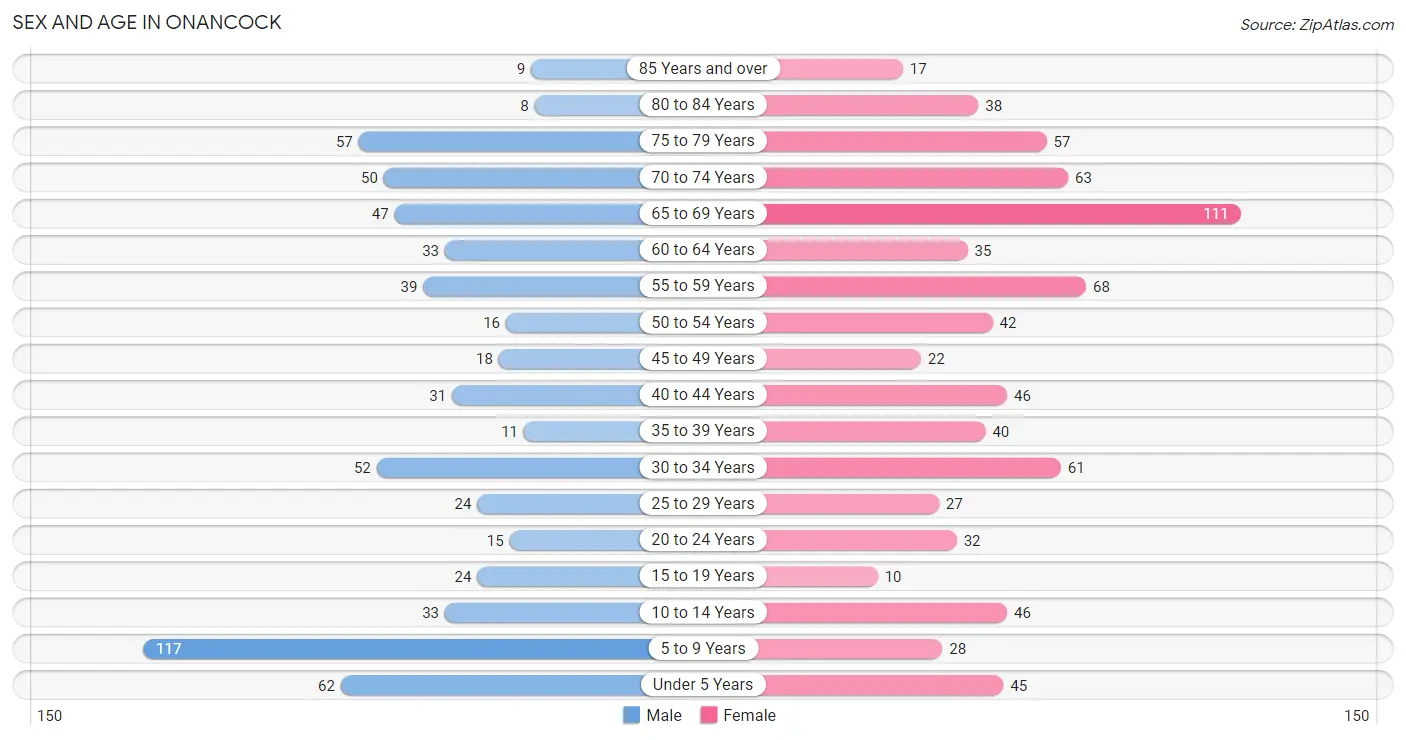
The most populous age groups in Onancock are 5 to 9 Years (117 | 18.1%) for men and 65 to 69 Years (111 | 14.1%) for women.
| Age Bracket | Male | Female |
| Under 5 Years | 62 (9.6%) | 45 (5.7%) |
| 5 to 9 Years | 117 (18.1%) | 28 (3.5%) |
| 10 to 14 Years | 33 (5.1%) | 46 (5.8%) |
| 15 to 19 Years | 24 (3.7%) | 10 (1.3%) |
| 20 to 24 Years | 15 (2.3%) | 32 (4.1%) |
| 25 to 29 Years | 24 (3.7%) | 27 (3.4%) |
| 30 to 34 Years | 52 (8.1%) | 61 (7.7%) |
| 35 to 39 Years | 11 (1.7%) | 40 (5.1%) |
| 40 to 44 Years | 31 (4.8%) | 46 (5.8%) |
| 45 to 49 Years | 18 (2.8%) | 22 (2.8%) |
| 50 to 54 Years | 16 (2.5%) | 42 (5.3%) |
| 55 to 59 Years | 39 (6.0%) | 68 (8.6%) |
| 60 to 64 Years | 33 (5.1%) | 35 (4.4%) |
| 65 to 69 Years | 47 (7.3%) | 111 (14.1%) |
| 70 to 74 Years | 50 (7.7%) | 63 (8.0%) |
| 75 to 79 Years | 57 (8.8%) | 57 (7.2%) |
| 80 to 84 Years | 8 (1.2%) | 38 (4.8%) |
| 85 Years and over | 9 (1.4%) | 17 (2.2%) |
| Total | 646 (100.0%) | 788 (100.0%) |
Families and Households in Onancock
Median Family Size in Onancock
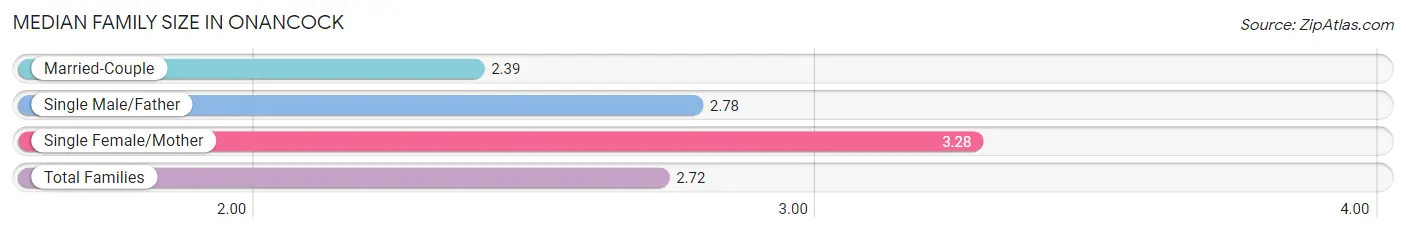
The median family size in Onancock is 2.72 persons per family, with single female/mother families (145 | 36.2%) accounting for the largest median family size of 3.28 persons per family. On the other hand, married-couple families (246 | 61.5%) represent the smallest median family size with 2.39 persons per family.
| Family Type | # Families | Family Size |
| Married-Couple | 246 (61.5%) | 2.39 |
| Single Male/Father | 9 (2.2%) | 2.78 |
| Single Female/Mother | 145 (36.2%) | 3.28 |
| Total Families | 400 (100.0%) | 2.72 |
Median Household Size in Onancock
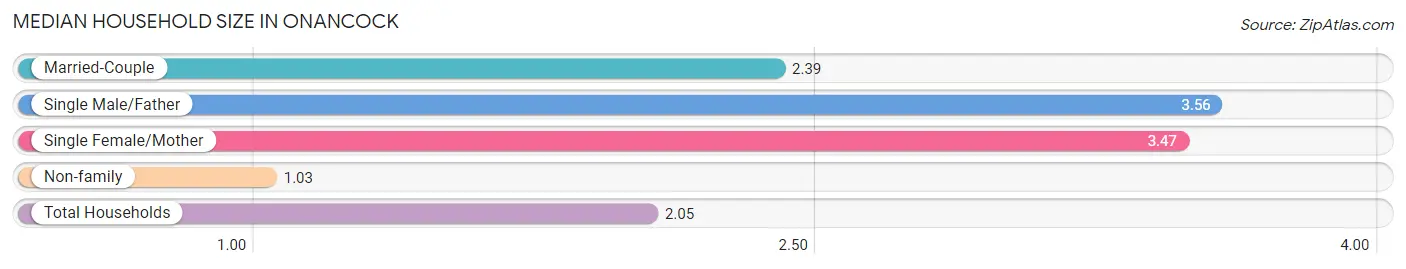
The median household size in Onancock is 2.05 persons per household, with single male/father households (9 | 1.3%) accounting for the largest median household size of 3.56 persons per household. non-family households (296 | 42.5%) represent the smallest median household size with 1.03 persons per household.
| Household Type | # Households | Household Size |
| Married-Couple | 246 (35.3%) | 2.39 |
| Single Male/Father | 9 (1.3%) | 3.56 |
| Single Female/Mother | 145 (20.8%) | 3.47 |
| Non-family | 296 (42.5%) | 1.03 |
| Total Households | 696 (100.0%) | 2.05 |
Household Size by Marriage Status in Onancock
Out of a total of 696 households in Onancock, 400 (57.5%) are family households, while 296 (42.5%) are nonfamily households. The most numerous type of family households are 2-person households, comprising 234, and the most common type of nonfamily households are 1-person households, comprising 281.
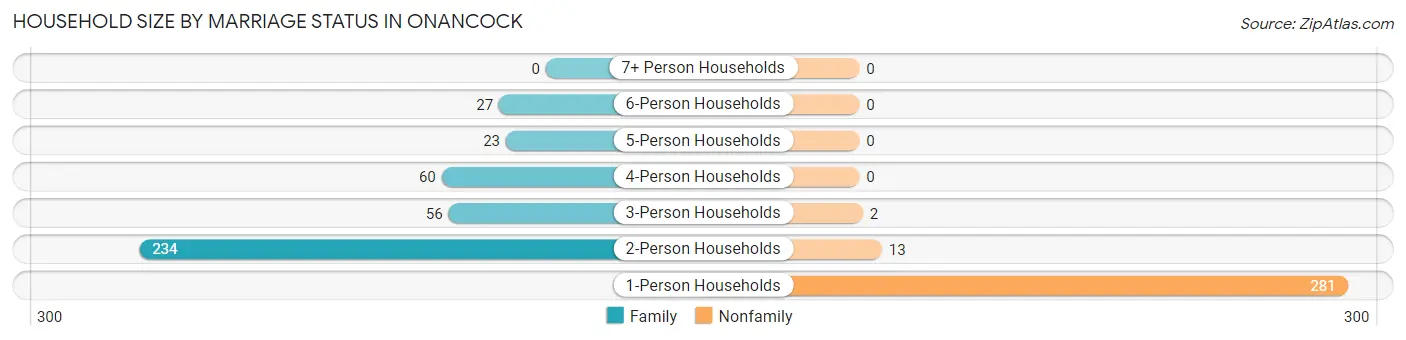
| Household Size | Family Households | Nonfamily Households |
| 1-Person Households | - | 281 (40.4%) |
| 2-Person Households | 234 (33.6%) | 13 (1.9%) |
| 3-Person Households | 56 (8.1%) | 2 (0.3%) |
| 4-Person Households | 60 (8.6%) | 0 (0.0%) |
| 5-Person Households | 23 (3.3%) | 0 (0.0%) |
| 6-Person Households | 27 (3.9%) | 0 (0.0%) |
| 7+ Person Households | 0 (0.0%) | 0 (0.0%) |
| Total | 400 (57.5%) | 296 (42.5%) |
Female Fertility in Onancock
Fertility by Age in Onancock
Average fertility rate in Onancock is 28.0 births per 1,000 women. Women in the age bracket of 20 to 34 years have the highest fertility rate with 58.0 births per 1,000 women. Women in the age bracket of 20 to 34 years acount for 100.0% of all women with births.
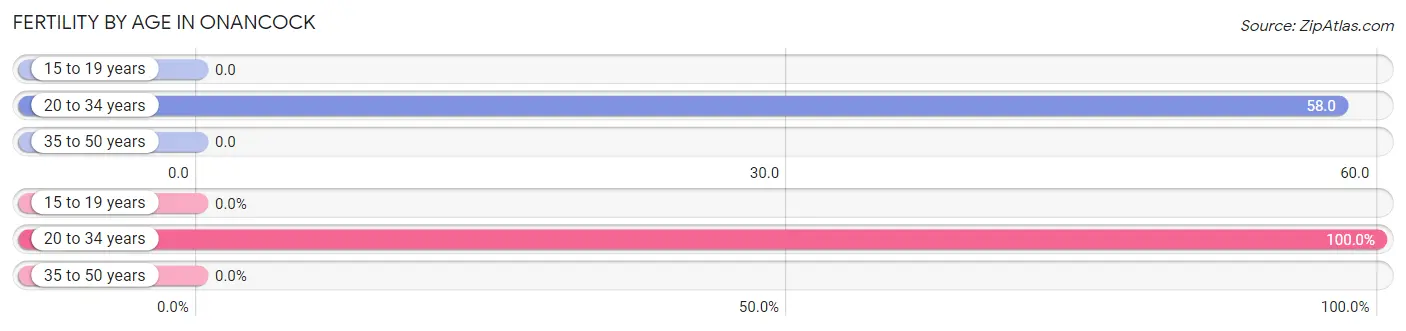
| Age Bracket | Women with Births | Births / 1,000 Women |
| 15 to 19 years | 0 (0.0%) | 0.0 |
| 20 to 34 years | 7 (100.0%) | 58.0 |
| 35 to 50 years | 0 (0.0%) | 0.0 |
| Total | 7 (100.0%) | 28.0 |
Fertility by Age by Marriage Status in Onancock
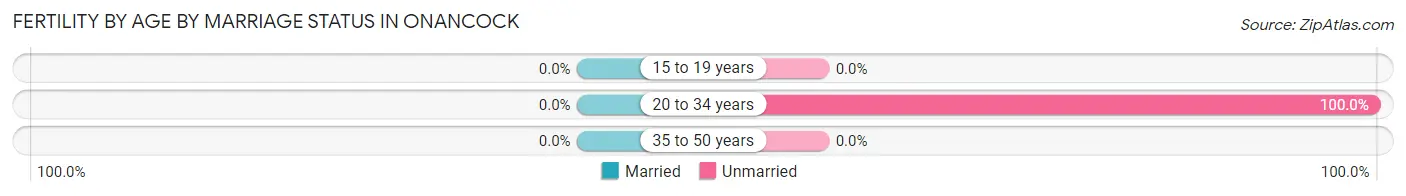
| Age Bracket | Married | Unmarried |
| 15 to 19 years | 0 (0.0%) | 0 (0.0%) |
| 20 to 34 years | 0 (0.0%) | 7 (100.0%) |
| 35 to 50 years | 0 (0.0%) | 0 (0.0%) |
| Total | 0 (0.0%) | 7 (100.0%) |
Fertility by Education in Onancock
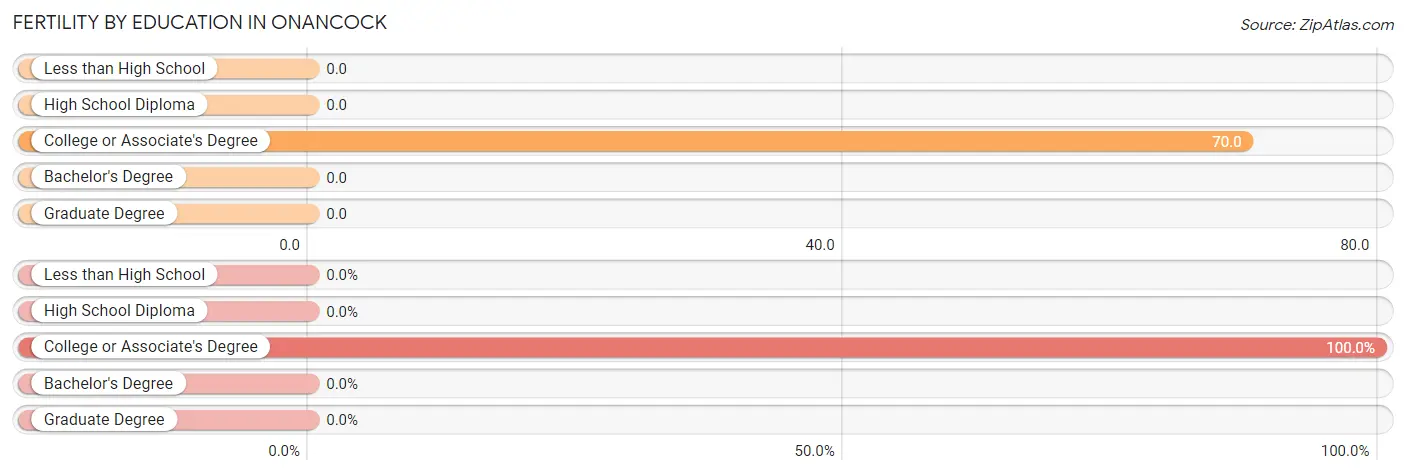
| Educational Attainment | Women with Births | Births / 1,000 Women |
| Less than High School | 0 (0.0%) | 0.0 |
| High School Diploma | 0 (0.0%) | 0.0 |
| College or Associate's Degree | 7 (100.0%) | 70.0 |
| Bachelor's Degree | 0 (0.0%) | 0.0 |
| Graduate Degree | 0 (0.0%) | 0.0 |
| Total | 7 (100.0%) | 28.0 |
Fertility by Education by Marriage Status in Onancock
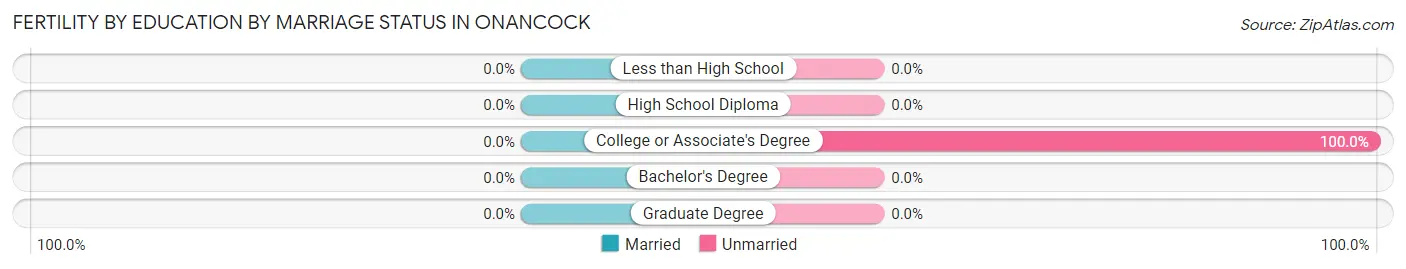
| Educational Attainment | Married | Unmarried |
| Less than High School | 0 (0.0%) | 0 (0.0%) |
| High School Diploma | 0 (0.0%) | 0 (0.0%) |
| College or Associate's Degree | 0 (0.0%) | 7 (100.0%) |
| Bachelor's Degree | 0 (0.0%) | 0 (0.0%) |
| Graduate Degree | 0 (0.0%) | 0 (0.0%) |
| Total | 0 (0.0%) | 7 (100.0%) |
Employment Characteristics in Onancock
Employment by Class of Employer in Onancock
Among the 534 employed individuals in Onancock, private company employees (311 | 58.2%), local government employees (52 | 9.7%), and self-employed (incorporated) (44 | 8.2%) make up the most common classes of employment.
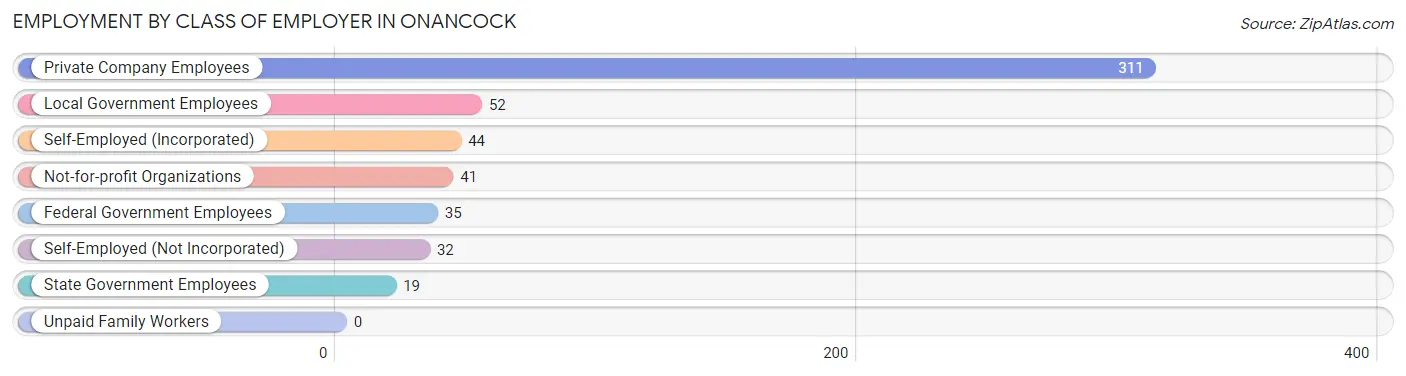
| Employer Class | # Employees | % Employees |
| Private Company Employees | 311 | 58.2% |
| Self-Employed (Incorporated) | 44 | 8.2% |
| Self-Employed (Not Incorporated) | 32 | 6.0% |
| Not-for-profit Organizations | 41 | 7.7% |
| Local Government Employees | 52 | 9.7% |
| State Government Employees | 19 | 3.6% |
| Federal Government Employees | 35 | 6.6% |
| Unpaid Family Workers | 0 | 0.0% |
| Total | 534 | 100.0% |
Employment Status by Age in Onancock
According to the labor force statistics for Onancock, out of the total population over 16 years of age (1,093), 54.5% or 596 individuals are in the labor force, with 9.7% or 58 of them unemployed. The age group with the highest labor force participation rate is 25 to 29 years, with 100.0% or 51 individuals in the labor force. Within the labor force, the 20 to 24 years age range has the highest percentage of unemployed individuals, with 56.1% or 23 of them being unemployed.
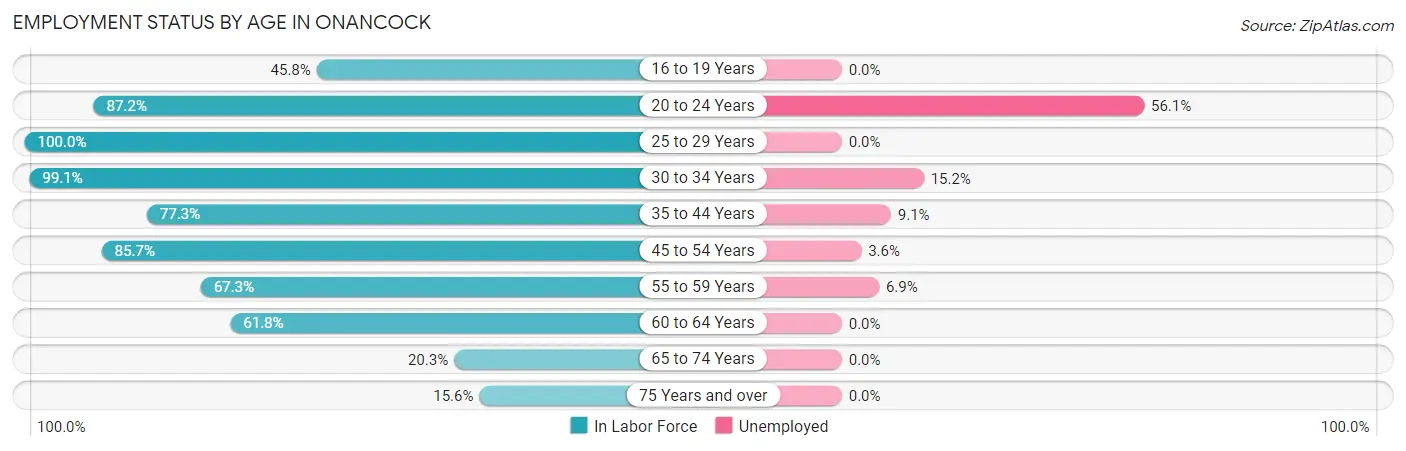
| Age Bracket | In Labor Force | Unemployed |
| 16 to 19 Years | 11 (45.8%) | 0 (0.0%) |
| 20 to 24 Years | 41 (87.2%) | 23 (56.1%) |
| 25 to 29 Years | 51 (100.0%) | 0 (0.0%) |
| 30 to 34 Years | 112 (99.1%) | 17 (15.2%) |
| 35 to 44 Years | 99 (77.3%) | 9 (9.1%) |
| 45 to 54 Years | 84 (85.7%) | 3 (3.6%) |
| 55 to 59 Years | 72 (67.3%) | 5 (6.9%) |
| 60 to 64 Years | 42 (61.8%) | 0 (0.0%) |
| 65 to 74 Years | 55 (20.3%) | 0 (0.0%) |
| 75 Years and over | 29 (15.6%) | 0 (0.0%) |
| Total | 596 (54.5%) | 58 (9.7%) |
Employment Status by Educational Attainment in Onancock
According to labor force statistics for Onancock, 81.4% of individuals (460) out of the total population between 25 and 64 years of age (565) are in the labor force, with 7.5% or 34 of them being unemployed. The group with the highest labor force participation rate are those with the educational attainment of high school diploma, with 87.0% or 134 individuals in the labor force. Within the labor force, individuals with less than high school education have the highest percentage of unemployment, with 27.6% or 8 of them being unemployed.
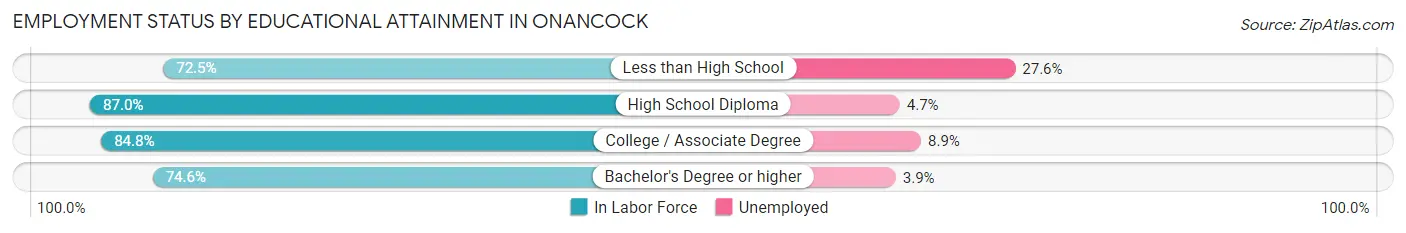
| Educational Attainment | In Labor Force | Unemployed |
| Less than High School | 29 (72.5%) | 11 (27.6%) |
| High School Diploma | 134 (87.0%) | 7 (4.7%) |
| College / Associate Degree | 168 (84.8%) | 18 (8.9%) |
| Bachelor's Degree or higher | 129 (74.6%) | 7 (3.9%) |
| Total | 460 (81.4%) | 42 (7.5%) |
Employment Occupations by Sex in Onancock
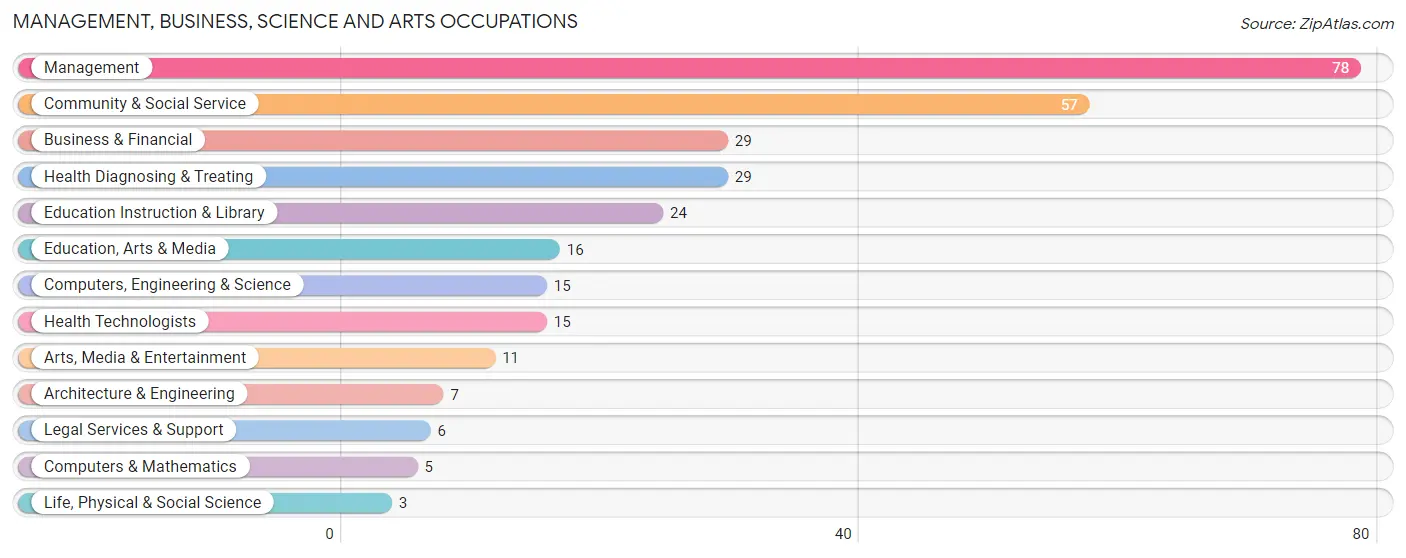
Management, Business, Science and Arts Occupations
The most common Management, Business, Science and Arts occupations in Onancock are Management (78 | 14.6%), Community & Social Service (57 | 10.7%), Business & Financial (29 | 5.4%), Health Diagnosing & Treating (29 | 5.4%), and Education Instruction & Library (24 | 4.5%).
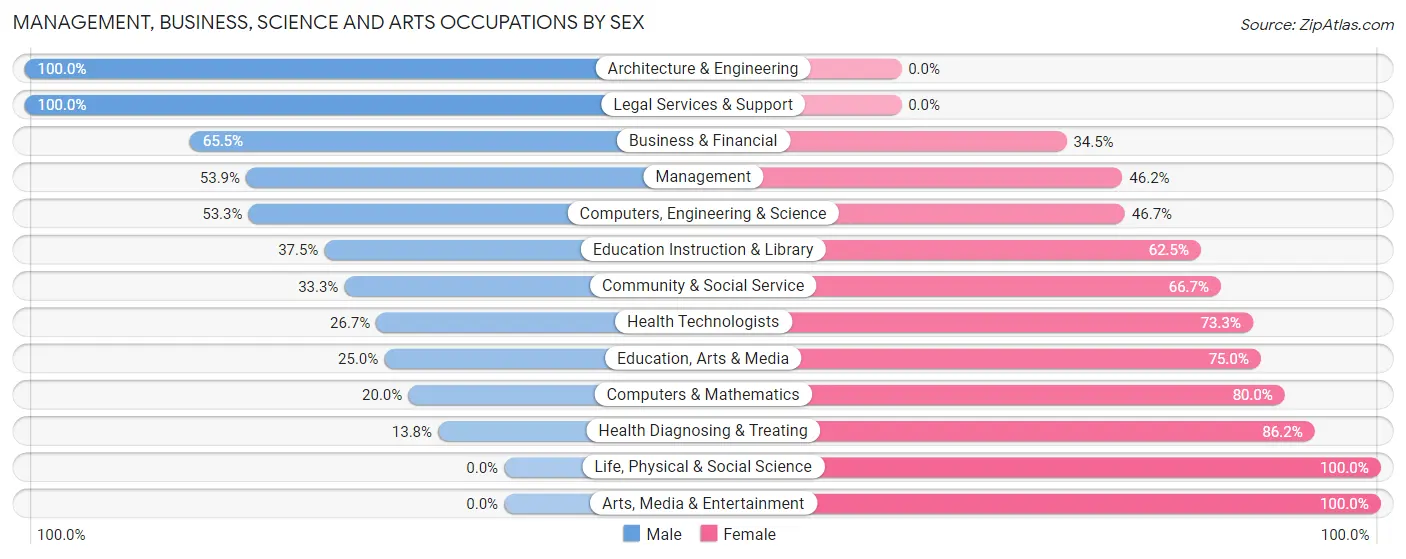
Management, Business, Science and Arts Occupations by Sex
Within the Management, Business, Science and Arts occupations in Onancock, the most male-oriented occupations are Architecture & Engineering (100.0%), Legal Services & Support (100.0%), and Business & Financial (65.5%), while the most female-oriented occupations are Life, Physical & Social Science (100.0%), Arts, Media & Entertainment (100.0%), and Health Diagnosing & Treating (86.2%).
| Occupation | Male | Female |
| Management | 42 (53.8%) | 36 (46.2%) |
| Business & Financial | 19 (65.5%) | 10 (34.5%) |
| Computers, Engineering & Science | 8 (53.3%) | 7 (46.7%) |
| Computers & Mathematics | 1 (20.0%) | 4 (80.0%) |
| Architecture & Engineering | 7 (100.0%) | 0 (0.0%) |
| Life, Physical & Social Science | 0 (0.0%) | 3 (100.0%) |
| Community & Social Service | 19 (33.3%) | 38 (66.7%) |
| Education, Arts & Media | 4 (25.0%) | 12 (75.0%) |
| Legal Services & Support | 6 (100.0%) | 0 (0.0%) |
| Education Instruction & Library | 9 (37.5%) | 15 (62.5%) |
| Arts, Media & Entertainment | 0 (0.0%) | 11 (100.0%) |
| Health Diagnosing & Treating | 4 (13.8%) | 25 (86.2%) |
| Health Technologists | 4 (26.7%) | 11 (73.3%) |
| Total (Category) | 92 (44.2%) | 116 (55.8%) |
| Total (Overall) | 235 (44.1%) | 298 (55.9%) |
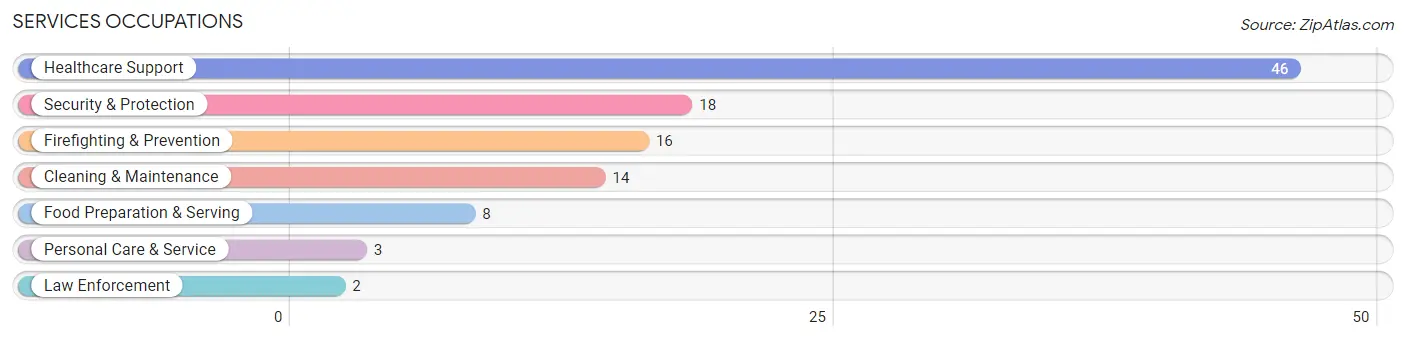
Services Occupations
The most common Services occupations in Onancock are Healthcare Support (46 | 8.6%), Security & Protection (18 | 3.4%), Firefighting & Prevention (16 | 3.0%), Cleaning & Maintenance (14 | 2.6%), and Food Preparation & Serving (8 | 1.5%).
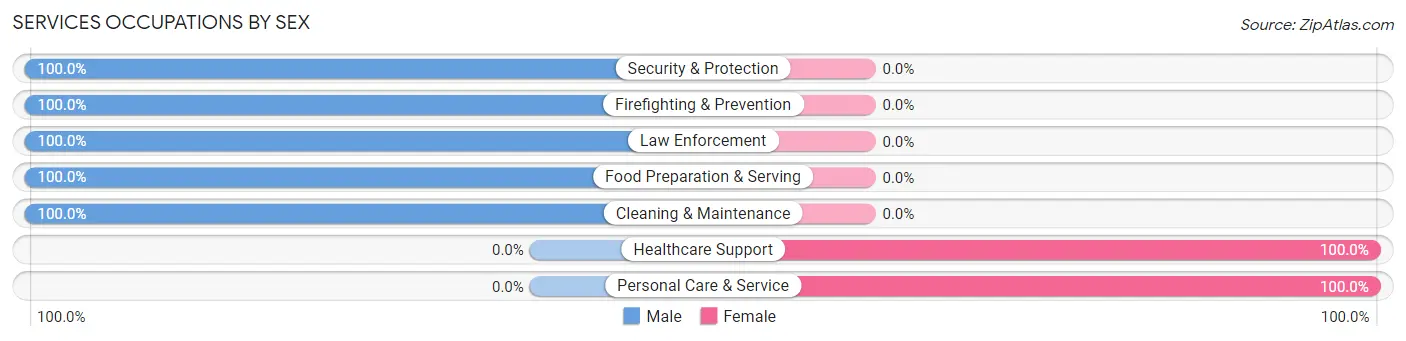
Services Occupations by Sex
Within the Services occupations in Onancock, the most male-oriented occupations are Security & Protection (100.0%), Firefighting & Prevention (100.0%), and Law Enforcement (100.0%), while the most female-oriented occupations are Healthcare Support (100.0%), and Personal Care & Service (100.0%).
| Occupation | Male | Female |
| Healthcare Support | 0 (0.0%) | 46 (100.0%) |
| Security & Protection | 18 (100.0%) | 0 (0.0%) |
| Firefighting & Prevention | 16 (100.0%) | 0 (0.0%) |
| Law Enforcement | 2 (100.0%) | 0 (0.0%) |
| Food Preparation & Serving | 8 (100.0%) | 0 (0.0%) |
| Cleaning & Maintenance | 14 (100.0%) | 0 (0.0%) |
| Personal Care & Service | 0 (0.0%) | 3 (100.0%) |
| Total (Category) | 40 (44.9%) | 49 (55.1%) |
| Total (Overall) | 235 (44.1%) | 298 (55.9%) |
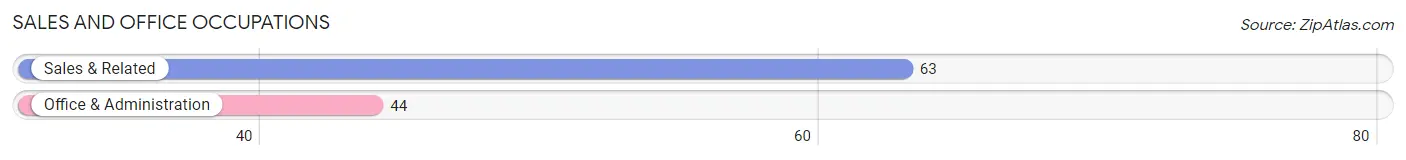
Sales and Office Occupations
The most common Sales and Office occupations in Onancock are Sales & Related (63 | 11.8%), and Office & Administration (44 | 8.3%).
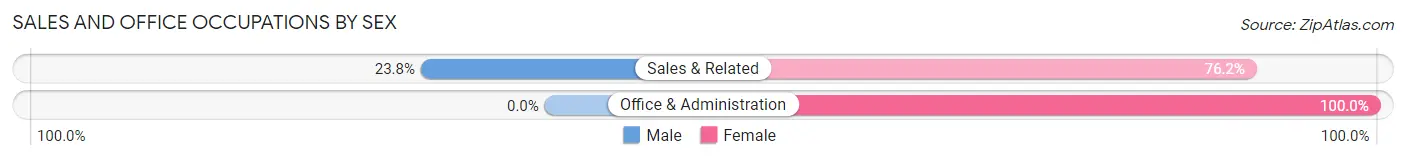
Sales and Office Occupations by Sex
| Occupation | Male | Female |
| Sales & Related | 15 (23.8%) | 48 (76.2%) |
| Office & Administration | 0 (0.0%) | 44 (100.0%) |
| Total (Category) | 15 (14.0%) | 92 (86.0%) |
| Total (Overall) | 235 (44.1%) | 298 (55.9%) |
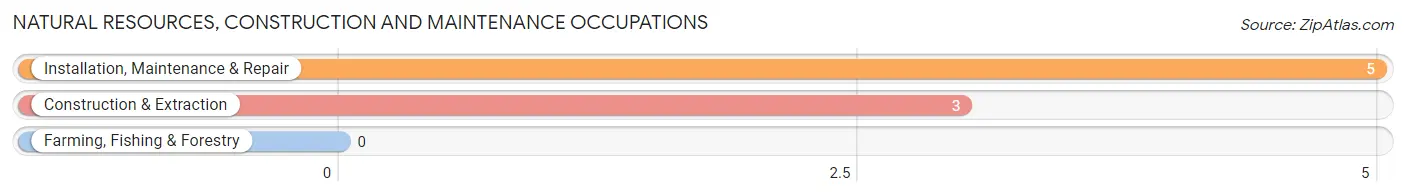
Natural Resources, Construction and Maintenance Occupations
The most common Natural Resources, Construction and Maintenance occupations in Onancock are Installation, Maintenance & Repair (5 | 0.9%), and Construction & Extraction (3 | 0.6%).
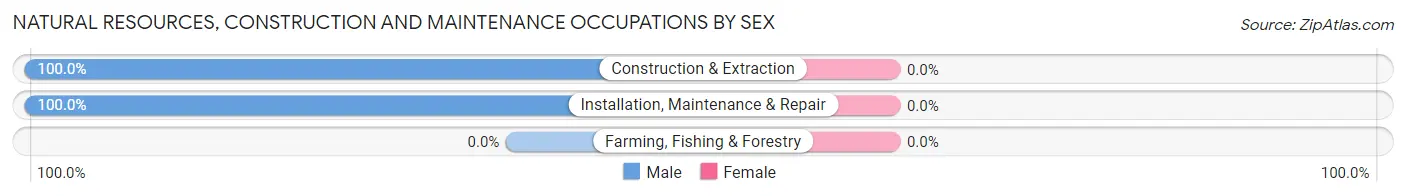
Natural Resources, Construction and Maintenance Occupations by Sex
| Occupation | Male | Female |
| Farming, Fishing & Forestry | 0 (0.0%) | 0 (0.0%) |
| Construction & Extraction | 3 (100.0%) | 0 (0.0%) |
| Installation, Maintenance & Repair | 5 (100.0%) | 0 (0.0%) |
| Total (Category) | 8 (100.0%) | 0 (0.0%) |
| Total (Overall) | 235 (44.1%) | 298 (55.9%) |
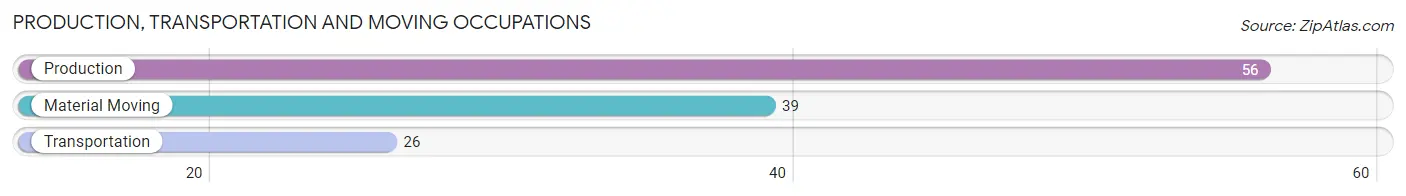
Production, Transportation and Moving Occupations
The most common Production, Transportation and Moving occupations in Onancock are Production (56 | 10.5%), Material Moving (39 | 7.3%), and Transportation (26 | 4.9%).
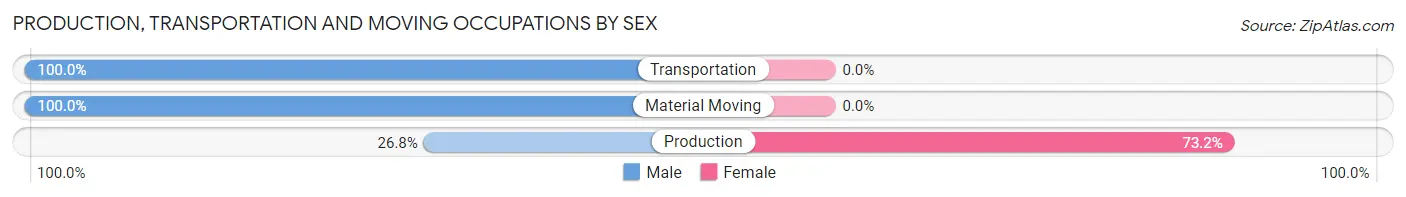
Production, Transportation and Moving Occupations by Sex
| Occupation | Male | Female |
| Production | 15 (26.8%) | 41 (73.2%) |
| Transportation | 26 (100.0%) | 0 (0.0%) |
| Material Moving | 39 (100.0%) | 0 (0.0%) |
| Total (Category) | 80 (66.1%) | 41 (33.9%) |
| Total (Overall) | 235 (44.1%) | 298 (55.9%) |
Employment Industries by Sex in Onancock
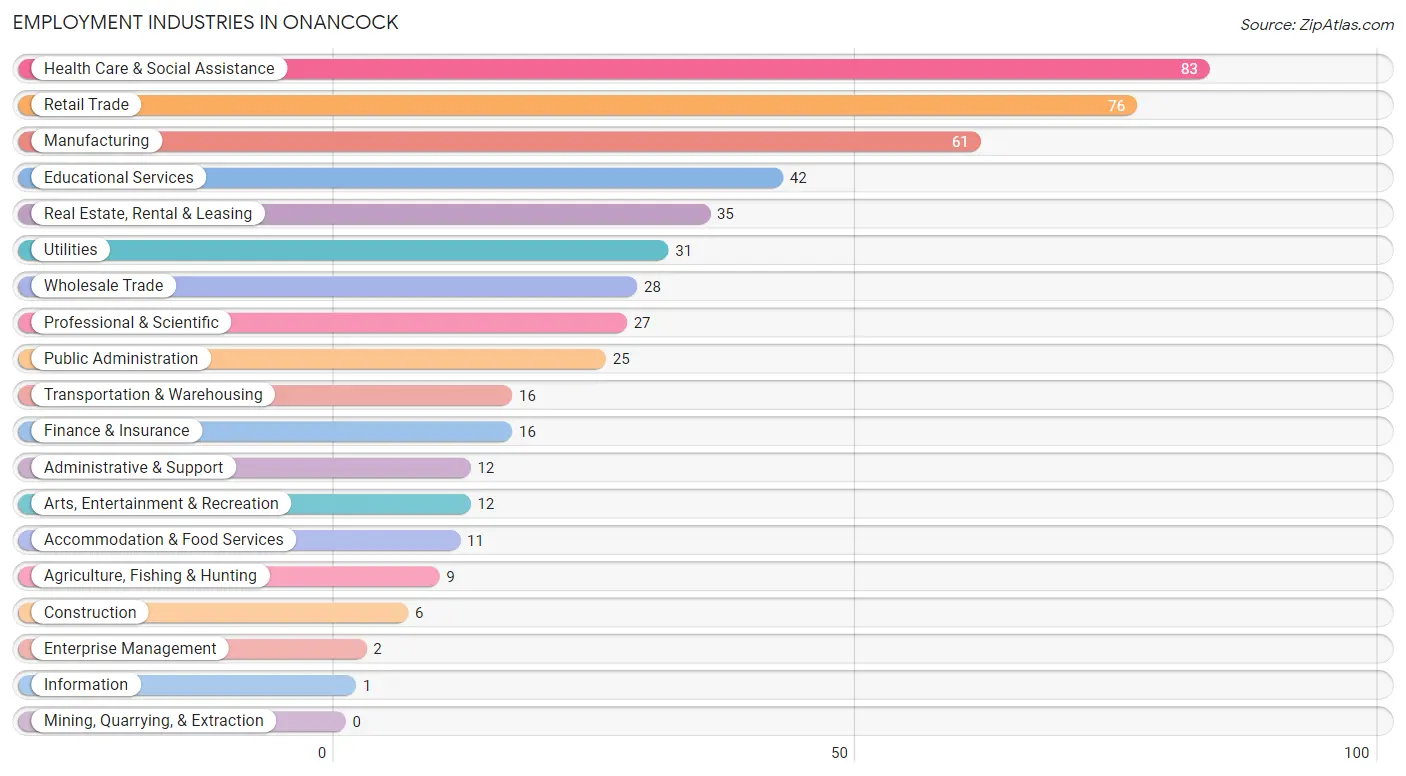
Employment Industries in Onancock
The major employment industries in Onancock include Health Care & Social Assistance (83 | 15.6%), Retail Trade (76 | 14.3%), Manufacturing (61 | 11.4%), Educational Services (42 | 7.9%), and Real Estate, Rental & Leasing (35 | 6.6%).
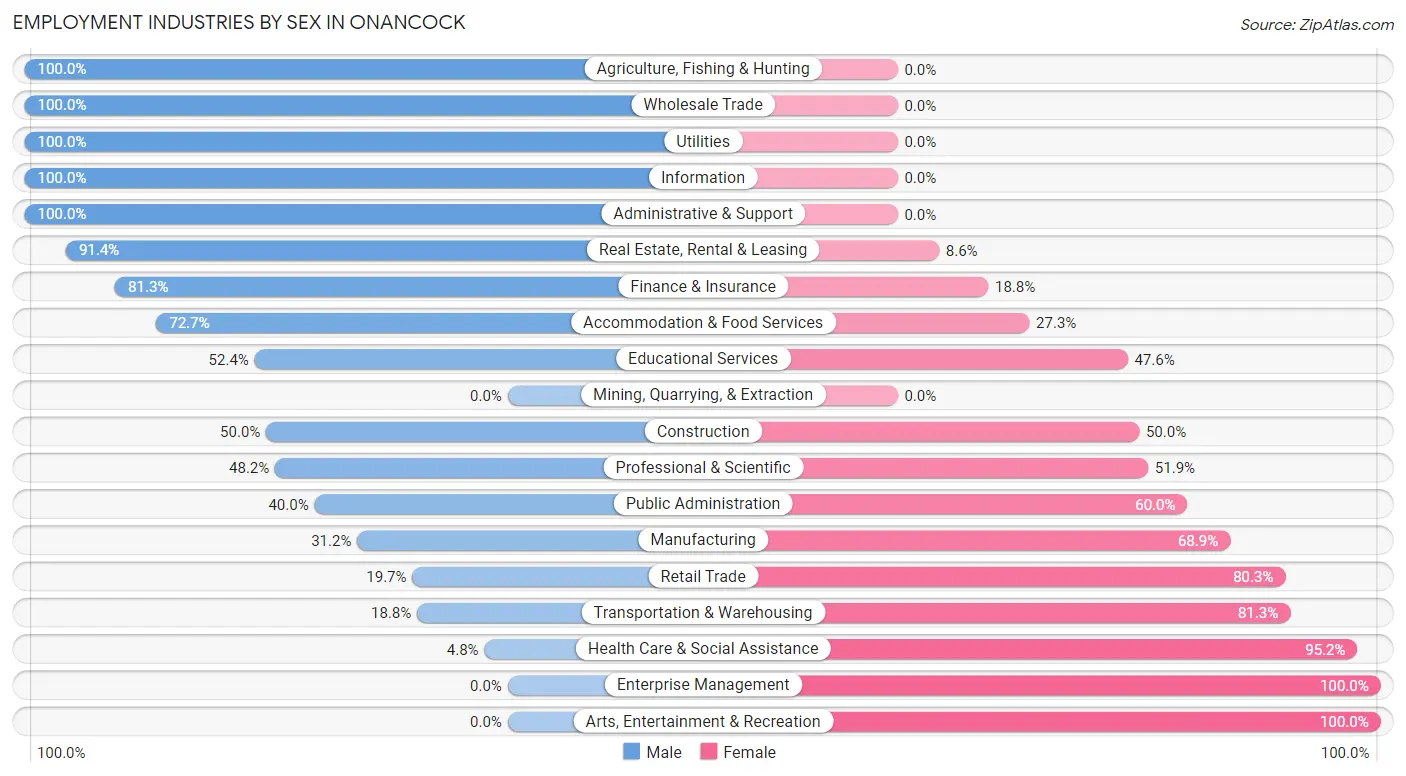
Employment Industries by Sex in Onancock
The Onancock industries that see more men than women are Agriculture, Fishing & Hunting (100.0%), Wholesale Trade (100.0%), and Utilities (100.0%), whereas the industries that tend to have a higher number of women are Enterprise Management (100.0%), Arts, Entertainment & Recreation (100.0%), and Health Care & Social Assistance (95.2%).
| Industry | Male | Female |
| Agriculture, Fishing & Hunting | 9 (100.0%) | 0 (0.0%) |
| Mining, Quarrying, & Extraction | 0 (0.0%) | 0 (0.0%) |
| Construction | 3 (50.0%) | 3 (50.0%) |
| Manufacturing | 19 (31.1%) | 42 (68.9%) |
| Wholesale Trade | 28 (100.0%) | 0 (0.0%) |
| Retail Trade | 15 (19.7%) | 61 (80.3%) |
| Transportation & Warehousing | 3 (18.8%) | 13 (81.2%) |
| Utilities | 31 (100.0%) | 0 (0.0%) |
| Information | 1 (100.0%) | 0 (0.0%) |
| Finance & Insurance | 13 (81.2%) | 3 (18.8%) |
| Real Estate, Rental & Leasing | 32 (91.4%) | 3 (8.6%) |
| Professional & Scientific | 13 (48.1%) | 14 (51.8%) |
| Enterprise Management | 0 (0.0%) | 2 (100.0%) |
| Administrative & Support | 12 (100.0%) | 0 (0.0%) |
| Educational Services | 22 (52.4%) | 20 (47.6%) |
| Health Care & Social Assistance | 4 (4.8%) | 79 (95.2%) |
| Arts, Entertainment & Recreation | 0 (0.0%) | 12 (100.0%) |
| Accommodation & Food Services | 8 (72.7%) | 3 (27.3%) |
| Public Administration | 10 (40.0%) | 15 (60.0%) |
| Total | 235 (44.1%) | 298 (55.9%) |
Education in Onancock
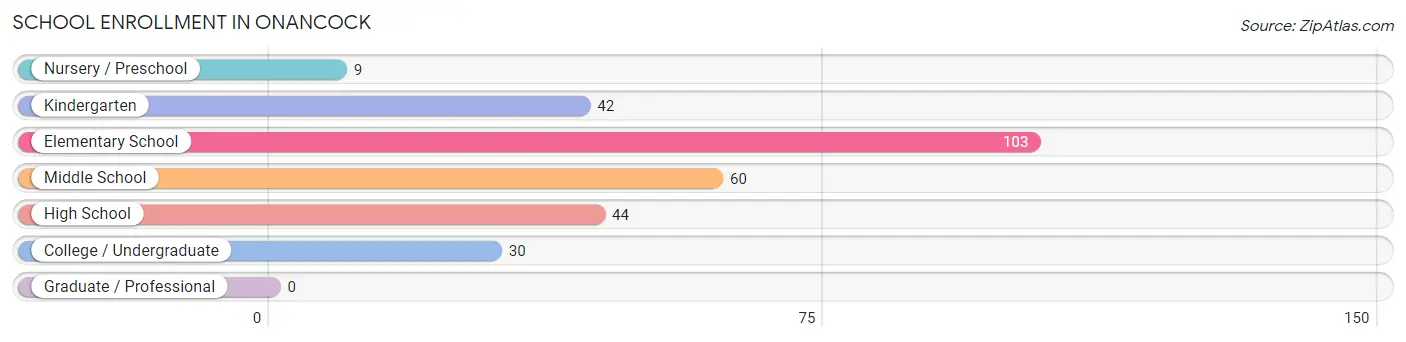
School Enrollment in Onancock
The most common levels of schooling among the 288 students in Onancock are elementary school (103 | 35.8%), middle school (60 | 20.8%), and high school (44 | 15.3%).
| School Level | # Students | % Students |
| Nursery / Preschool | 9 | 3.1% |
| Kindergarten | 42 | 14.6% |
| Elementary School | 103 | 35.8% |
| Middle School | 60 | 20.8% |
| High School | 44 | 15.3% |
| College / Undergraduate | 30 | 10.4% |
| Graduate / Professional | 0 | 0.0% |
| Total | 288 | 100.0% |
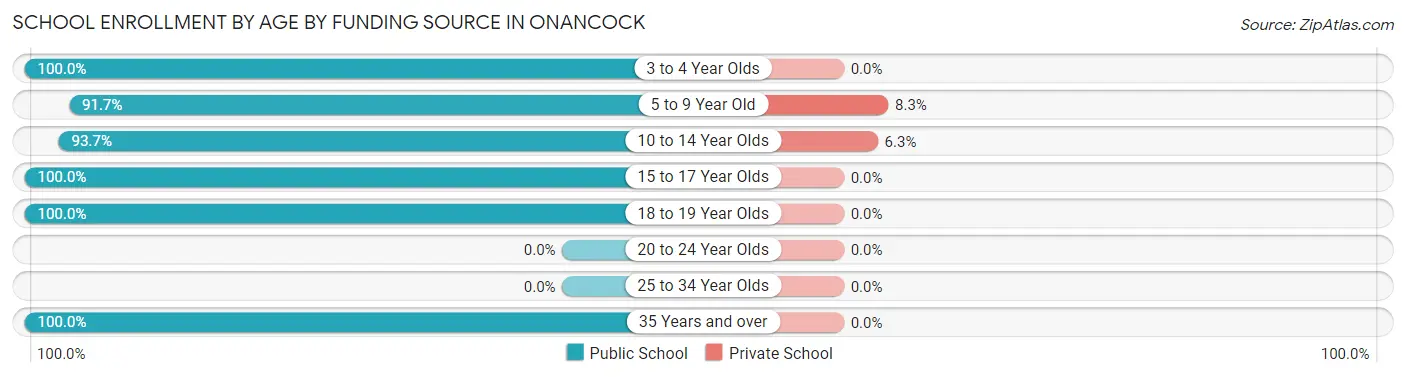
School Enrollment by Age by Funding Source in Onancock
Out of a total of 288 students who are enrolled in schools in Onancock, 17 (5.9%) attend a private institution, while the remaining 271 (94.1%) are enrolled in public schools. The age group of 5 to 9 year old has the highest likelihood of being enrolled in private schools, with 12 (8.3% in the age bracket) enrolled. Conversely, the age group of 3 to 4 year olds has the lowest likelihood of being enrolled in a private school, with 9 (100.0% in the age bracket) attending a public institution.
| Age Bracket | Public School | Private School |
| 3 to 4 Year Olds | 9 (100.0%) | 0 (0.0%) |
| 5 to 9 Year Old | 133 (91.7%) | 12 (8.3%) |
| 10 to 14 Year Olds | 74 (93.7%) | 5 (6.3%) |
| 15 to 17 Year Olds | 22 (100.0%) | 0 (0.0%) |
| 18 to 19 Year Olds | 5 (100.0%) | 0 (0.0%) |
| 20 to 24 Year Olds | 0 (0.0%) | 0 (0.0%) |
| 25 to 34 Year Olds | 0 (0.0%) | 0 (0.0%) |
| 35 Years and over | 28 (100.0%) | 0 (0.0%) |
| Total | 271 (94.1%) | 17 (5.9%) |
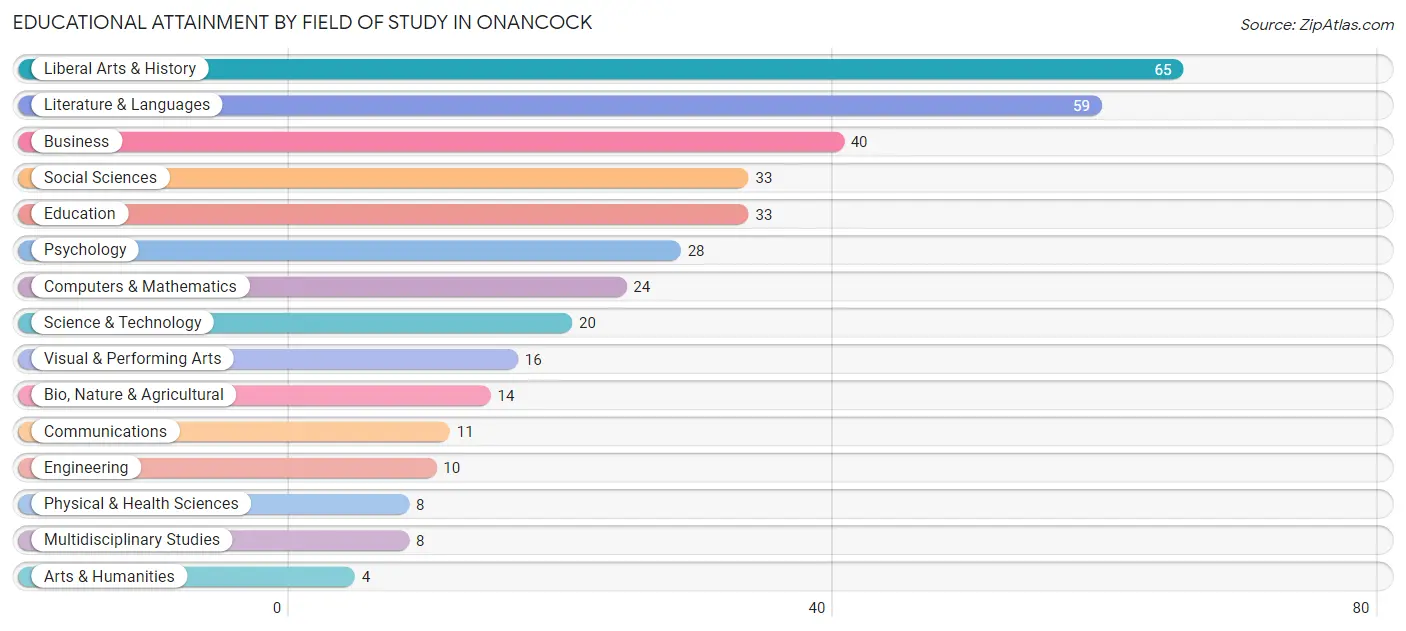
Educational Attainment by Field of Study in Onancock
Liberal arts & history (65 | 17.4%), literature & languages (59 | 15.8%), business (40 | 10.7%), social sciences (33 | 8.8%), and education (33 | 8.8%) are the most common fields of study among 373 individuals in Onancock who have obtained a bachelor's degree or higher.
| Field of Study | # Graduates | % Graduates |
| Computers & Mathematics | 24 | 6.4% |
| Bio, Nature & Agricultural | 14 | 3.7% |
| Physical & Health Sciences | 8 | 2.1% |
| Psychology | 28 | 7.5% |
| Social Sciences | 33 | 8.8% |
| Engineering | 10 | 2.7% |
| Multidisciplinary Studies | 8 | 2.1% |
| Science & Technology | 20 | 5.4% |
| Business | 40 | 10.7% |
| Education | 33 | 8.8% |
| Literature & Languages | 59 | 15.8% |
| Liberal Arts & History | 65 | 17.4% |
| Visual & Performing Arts | 16 | 4.3% |
| Communications | 11 | 2.9% |
| Arts & Humanities | 4 | 1.1% |
| Total | 373 | 100.0% |
Transportation & Commute in Onancock
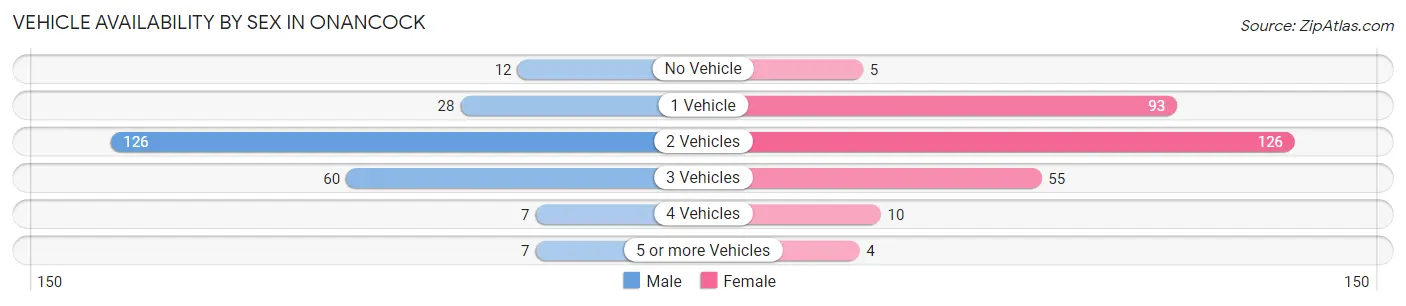
Vehicle Availability by Sex in Onancock
The most prevalent vehicle ownership categories in Onancock are males with 2 vehicles (126, accounting for 52.5%) and females with 2 vehicles (126, making up 43.0%).
| Vehicles Available | Male | Female |
| No Vehicle | 12 (5.0%) | 5 (1.7%) |
| 1 Vehicle | 28 (11.7%) | 93 (31.7%) |
| 2 Vehicles | 126 (52.5%) | 126 (43.0%) |
| 3 Vehicles | 60 (25.0%) | 55 (18.8%) |
| 4 Vehicles | 7 (2.9%) | 10 (3.4%) |
| 5 or more Vehicles | 7 (2.9%) | 4 (1.4%) |
| Total | 240 (100.0%) | 293 (100.0%) |
Commute Time in Onancock
The most frequently occuring commute durations in Onancock are 10 to 14 minutes (156 commuters, 32.5%), 5 to 9 minutes (93 commuters, 19.4%), and 15 to 19 minutes (51 commuters, 10.6%).
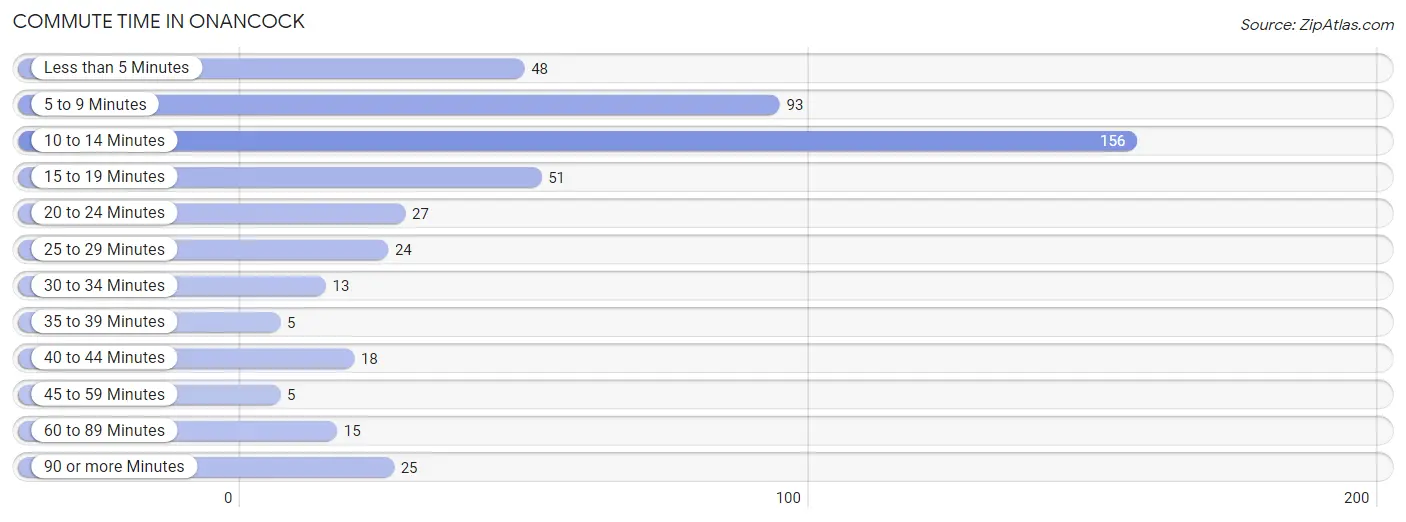
| Commute Time | # Commuters | % Commuters |
| Less than 5 Minutes | 48 | 10.0% |
| 5 to 9 Minutes | 93 | 19.4% |
| 10 to 14 Minutes | 156 | 32.5% |
| 15 to 19 Minutes | 51 | 10.6% |
| 20 to 24 Minutes | 27 | 5.6% |
| 25 to 29 Minutes | 24 | 5.0% |
| 30 to 34 Minutes | 13 | 2.7% |
| 35 to 39 Minutes | 5 | 1.0% |
| 40 to 44 Minutes | 18 | 3.7% |
| 45 to 59 Minutes | 5 | 1.0% |
| 60 to 89 Minutes | 15 | 3.1% |
| 90 or more Minutes | 25 | 5.2% |
Commute Time by Sex in Onancock
The most common commute times in Onancock are 10 to 14 minutes (74 commuters, 33.9%) for males and 10 to 14 minutes (82 commuters, 31.3%) for females.
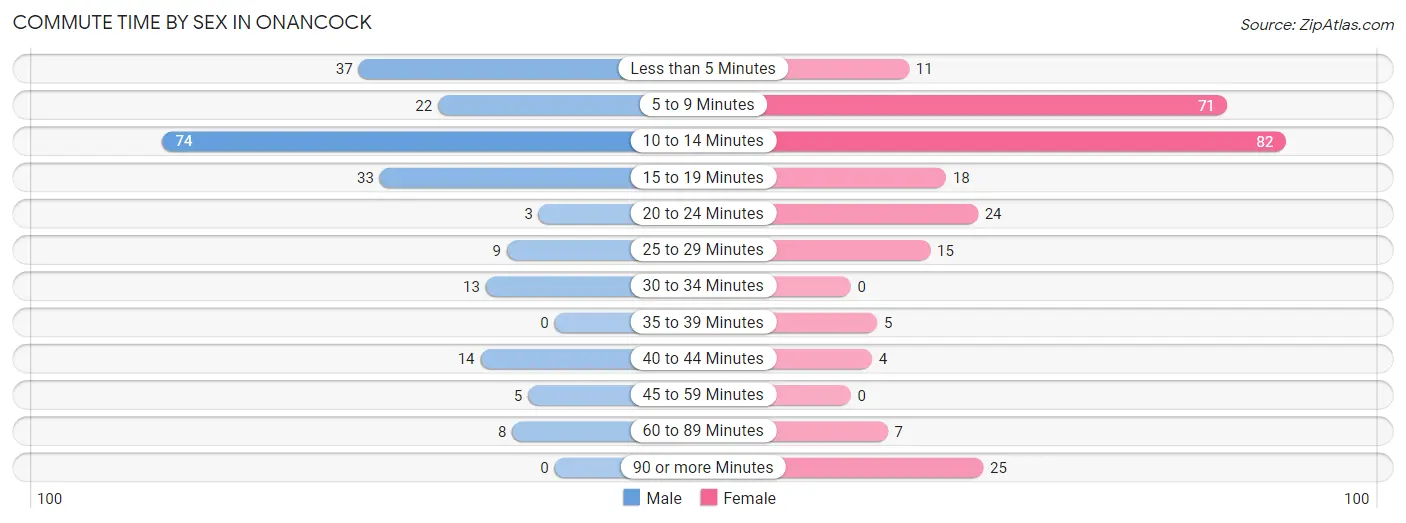
| Commute Time | Male | Female |
| Less than 5 Minutes | 37 (17.0%) | 11 (4.2%) |
| 5 to 9 Minutes | 22 (10.1%) | 71 (27.1%) |
| 10 to 14 Minutes | 74 (33.9%) | 82 (31.3%) |
| 15 to 19 Minutes | 33 (15.1%) | 18 (6.9%) |
| 20 to 24 Minutes | 3 (1.4%) | 24 (9.2%) |
| 25 to 29 Minutes | 9 (4.1%) | 15 (5.7%) |
| 30 to 34 Minutes | 13 (6.0%) | 0 (0.0%) |
| 35 to 39 Minutes | 0 (0.0%) | 5 (1.9%) |
| 40 to 44 Minutes | 14 (6.4%) | 4 (1.5%) |
| 45 to 59 Minutes | 5 (2.3%) | 0 (0.0%) |
| 60 to 89 Minutes | 8 (3.7%) | 7 (2.7%) |
| 90 or more Minutes | 0 (0.0%) | 25 (9.5%) |
Time of Departure to Work by Sex in Onancock
The most frequent times of departure to work in Onancock are 7:00 AM to 7:29 AM (53, 24.3%) for males and 8:00 AM to 8:29 AM (77, 29.4%) for females.
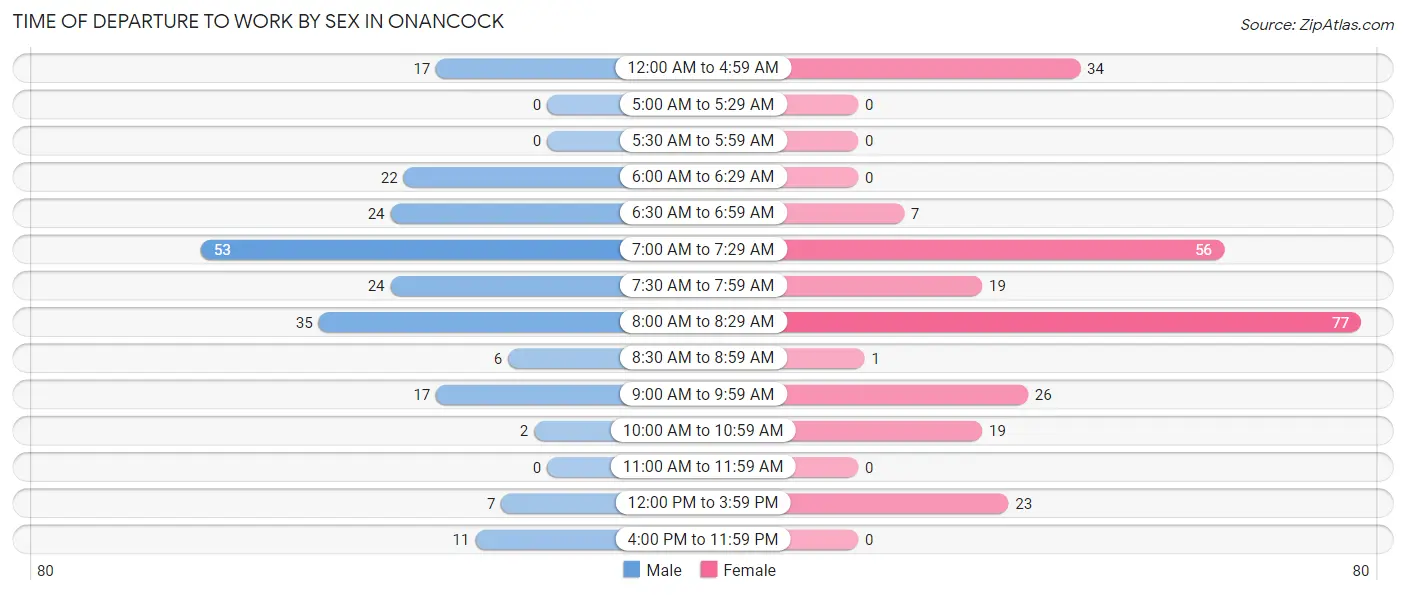
| Time of Departure | Male | Female |
| 12:00 AM to 4:59 AM | 17 (7.8%) | 34 (13.0%) |
| 5:00 AM to 5:29 AM | 0 (0.0%) | 0 (0.0%) |
| 5:30 AM to 5:59 AM | 0 (0.0%) | 0 (0.0%) |
| 6:00 AM to 6:29 AM | 22 (10.1%) | 0 (0.0%) |
| 6:30 AM to 6:59 AM | 24 (11.0%) | 7 (2.7%) |
| 7:00 AM to 7:29 AM | 53 (24.3%) | 56 (21.4%) |
| 7:30 AM to 7:59 AM | 24 (11.0%) | 19 (7.2%) |
| 8:00 AM to 8:29 AM | 35 (16.1%) | 77 (29.4%) |
| 8:30 AM to 8:59 AM | 6 (2.8%) | 1 (0.4%) |
| 9:00 AM to 9:59 AM | 17 (7.8%) | 26 (9.9%) |
| 10:00 AM to 10:59 AM | 2 (0.9%) | 19 (7.2%) |
| 11:00 AM to 11:59 AM | 0 (0.0%) | 0 (0.0%) |
| 12:00 PM to 3:59 PM | 7 (3.2%) | 23 (8.8%) |
| 4:00 PM to 11:59 PM | 11 (5.1%) | 0 (0.0%) |
| Total | 218 (100.0%) | 262 (100.0%) |
Housing Occupancy in Onancock
Occupancy by Ownership in Onancock
Of the total 696 dwellings in Onancock, owner-occupied units account for 433 (62.2%), while renter-occupied units make up 263 (37.8%).
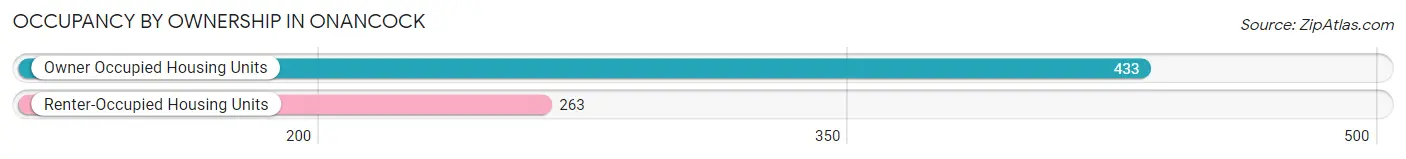
| Occupancy | # Housing Units | % Housing Units |
| Owner Occupied Housing Units | 433 | 62.2% |
| Renter-Occupied Housing Units | 263 | 37.8% |
| Total Occupied Housing Units | 696 | 100.0% |
Occupancy by Household Size in Onancock
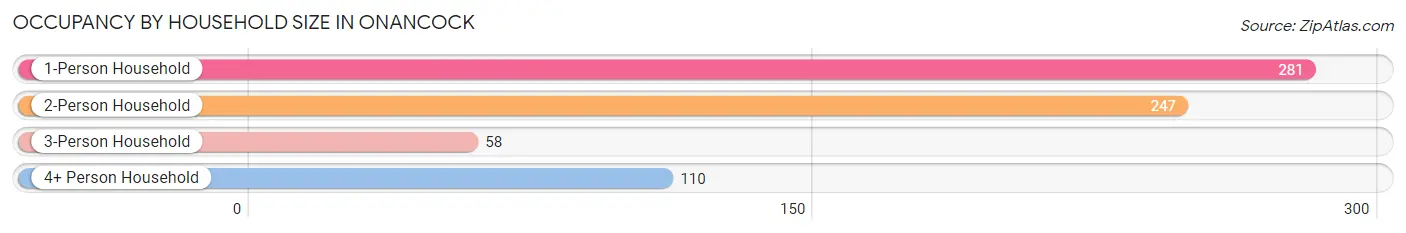
| Household Size | # Housing Units | % Housing Units |
| 1-Person Household | 281 | 40.4% |
| 2-Person Household | 247 | 35.5% |
| 3-Person Household | 58 | 8.3% |
| 4+ Person Household | 110 | 15.8% |
| Total Housing Units | 696 | 100.0% |
Occupancy by Ownership by Household Size in Onancock
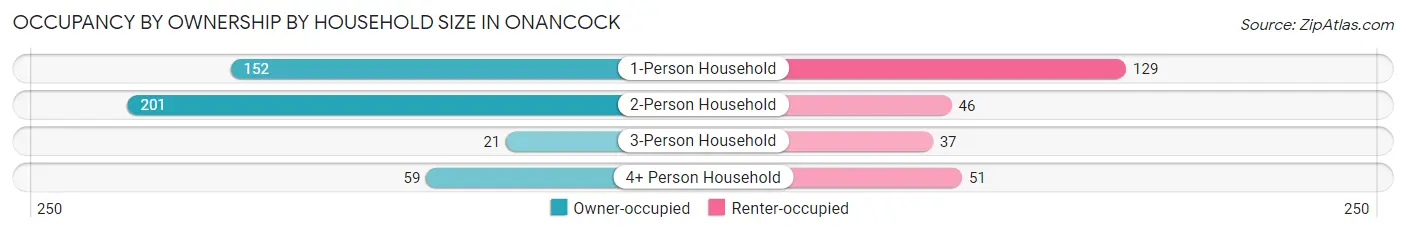
| Household Size | Owner-occupied | Renter-occupied |
| 1-Person Household | 152 (54.1%) | 129 (45.9%) |
| 2-Person Household | 201 (81.4%) | 46 (18.6%) |
| 3-Person Household | 21 (36.2%) | 37 (63.8%) |
| 4+ Person Household | 59 (53.6%) | 51 (46.4%) |
| Total Housing Units | 433 (62.2%) | 263 (37.8%) |
Occupancy by Educational Attainment in Onancock
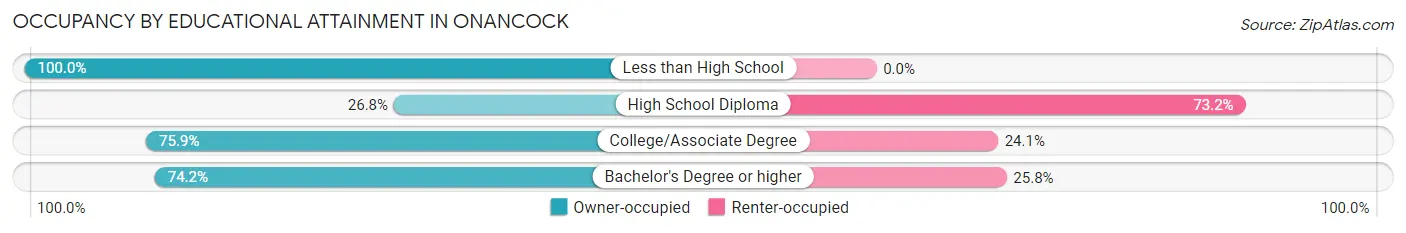
| Household Size | Owner-occupied | Renter-occupied |
| Less than High School | 48 (100.0%) | 0 (0.0%) |
| High School Diploma | 56 (26.8%) | 153 (73.2%) |
| College/Associate Degree | 148 (75.9%) | 47 (24.1%) |
| Bachelor's Degree or higher | 181 (74.2%) | 63 (25.8%) |
Occupancy by Age of Householder in Onancock
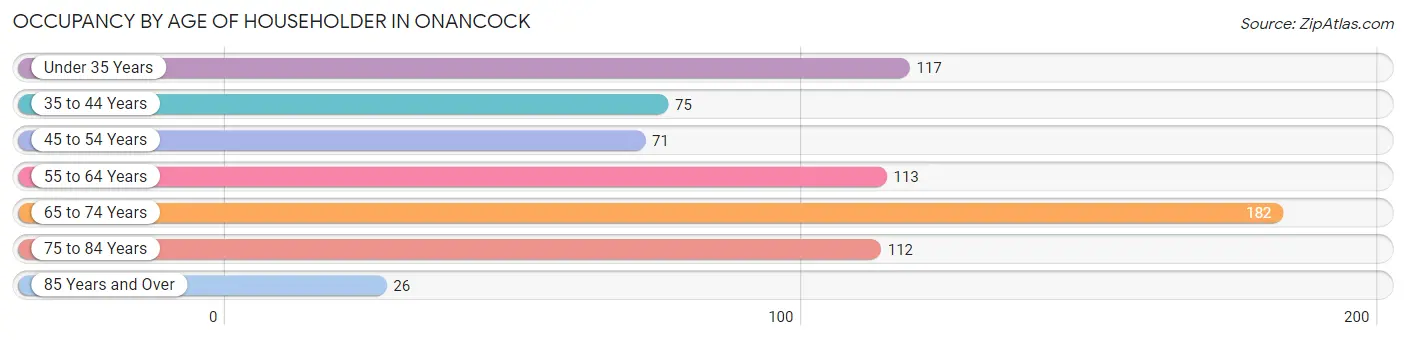
| Age Bracket | # Households | % Households |
| Under 35 Years | 117 | 16.8% |
| 35 to 44 Years | 75 | 10.8% |
| 45 to 54 Years | 71 | 10.2% |
| 55 to 64 Years | 113 | 16.2% |
| 65 to 74 Years | 182 | 26.2% |
| 75 to 84 Years | 112 | 16.1% |
| 85 Years and Over | 26 | 3.7% |
| Total | 696 | 100.0% |
Housing Finances in Onancock
Median Income by Occupancy in Onancock
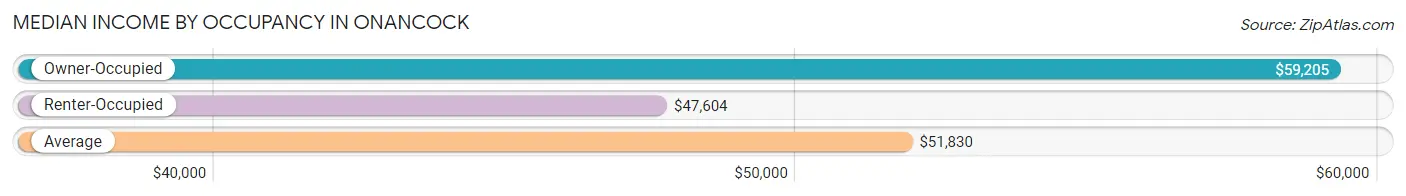
| Occupancy Type | # Households | Median Income |
| Owner-Occupied | 433 (62.2%) | $59,205 |
| Renter-Occupied | 263 (37.8%) | $47,604 |
| Average | 696 (100.0%) | $51,830 |
Occupancy by Householder Income Bracket in Onancock
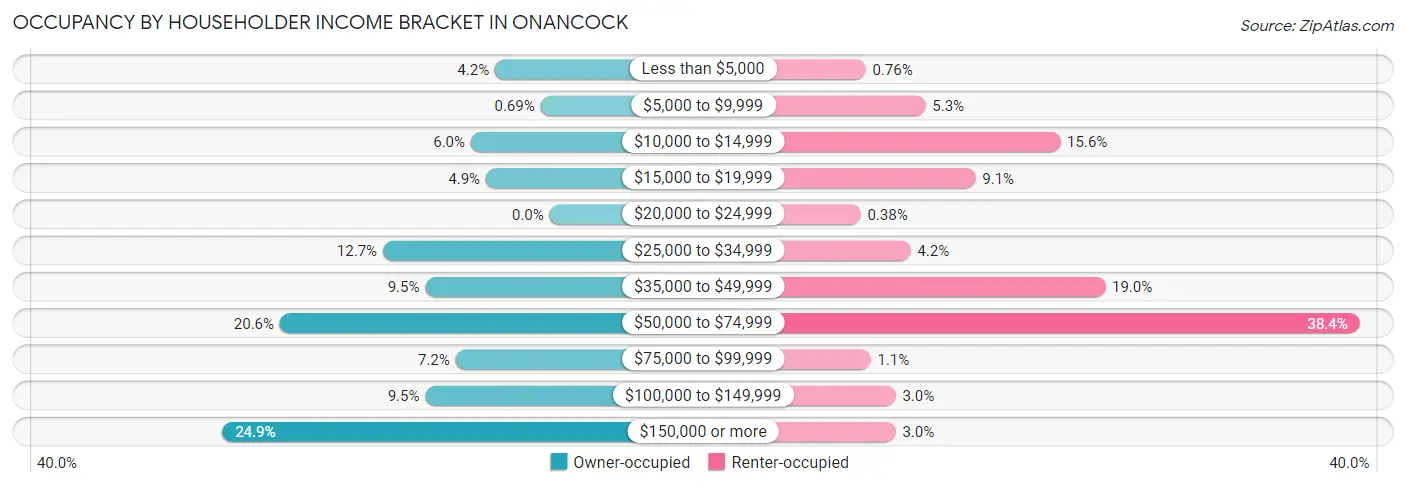
| Income Bracket | Owner-occupied | Renter-occupied |
| Less than $5,000 | 18 (4.2%) | 2 (0.8%) |
| $5,000 to $9,999 | 3 (0.7%) | 14 (5.3%) |
| $10,000 to $14,999 | 26 (6.0%) | 41 (15.6%) |
| $15,000 to $19,999 | 21 (4.9%) | 24 (9.1%) |
| $20,000 to $24,999 | 0 (0.0%) | 1 (0.4%) |
| $25,000 to $34,999 | 55 (12.7%) | 11 (4.2%) |
| $35,000 to $49,999 | 41 (9.5%) | 50 (19.0%) |
| $50,000 to $74,999 | 89 (20.5%) | 101 (38.4%) |
| $75,000 to $99,999 | 31 (7.2%) | 3 (1.1%) |
| $100,000 to $149,999 | 41 (9.5%) | 8 (3.0%) |
| $150,000 or more | 108 (24.9%) | 8 (3.0%) |
| Total | 433 (100.0%) | 263 (100.0%) |
Monthly Housing Cost Tiers in Onancock
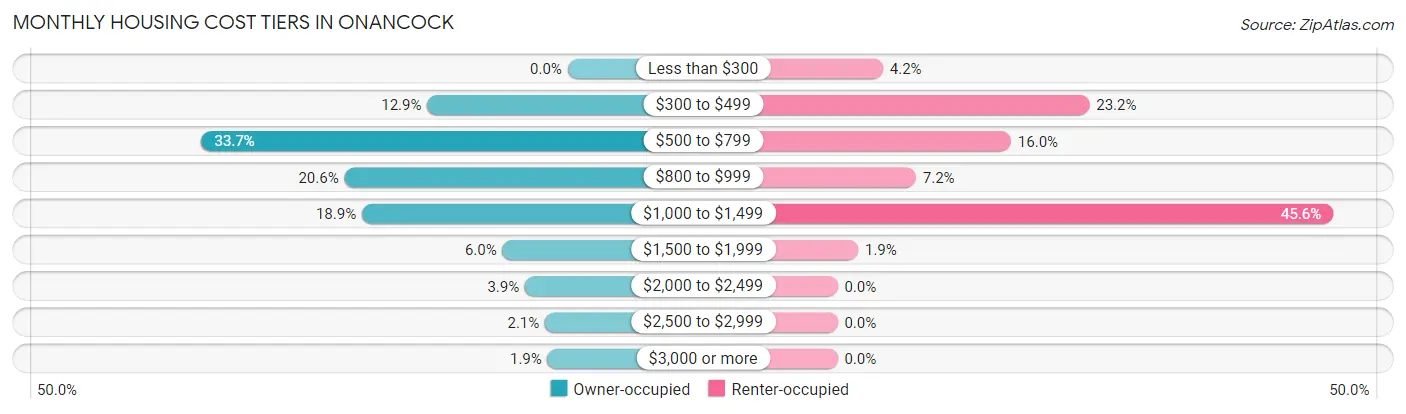
| Monthly Cost | Owner-occupied | Renter-occupied |
| Less than $300 | 0 (0.0%) | 11 (4.2%) |
| $300 to $499 | 56 (12.9%) | 61 (23.2%) |
| $500 to $799 | 146 (33.7%) | 42 (16.0%) |
| $800 to $999 | 89 (20.5%) | 19 (7.2%) |
| $1,000 to $1,499 | 82 (18.9%) | 120 (45.6%) |
| $1,500 to $1,999 | 26 (6.0%) | 5 (1.9%) |
| $2,000 to $2,499 | 17 (3.9%) | 0 (0.0%) |
| $2,500 to $2,999 | 9 (2.1%) | 0 (0.0%) |
| $3,000 or more | 8 (1.8%) | 0 (0.0%) |
| Total | 433 (100.0%) | 263 (100.0%) |
Physical Housing Characteristics in Onancock
Housing Structures in Onancock
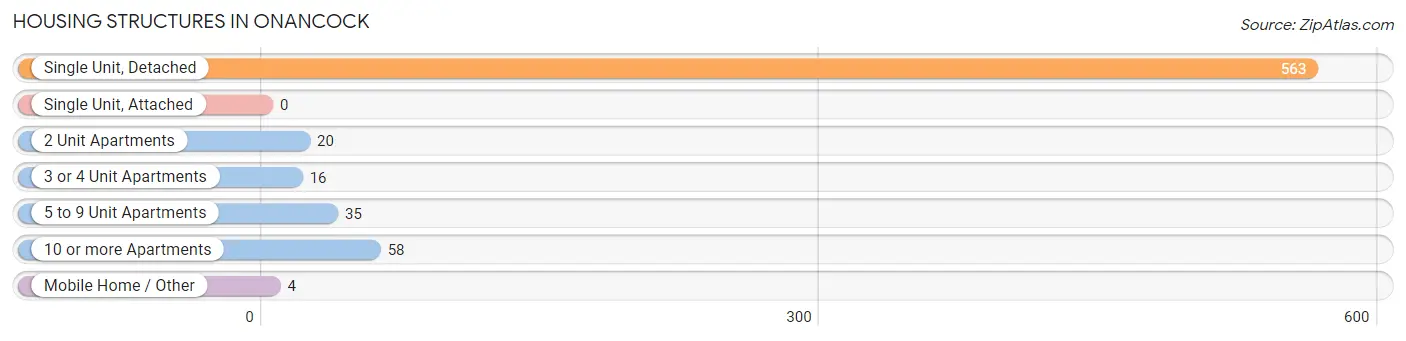
| Structure Type | # Housing Units | % Housing Units |
| Single Unit, Detached | 563 | 80.9% |
| Single Unit, Attached | 0 | 0.0% |
| 2 Unit Apartments | 20 | 2.9% |
| 3 or 4 Unit Apartments | 16 | 2.3% |
| 5 to 9 Unit Apartments | 35 | 5.0% |
| 10 or more Apartments | 58 | 8.3% |
| Mobile Home / Other | 4 | 0.6% |
| Total | 696 | 100.0% |
Housing Structures by Occupancy in Onancock
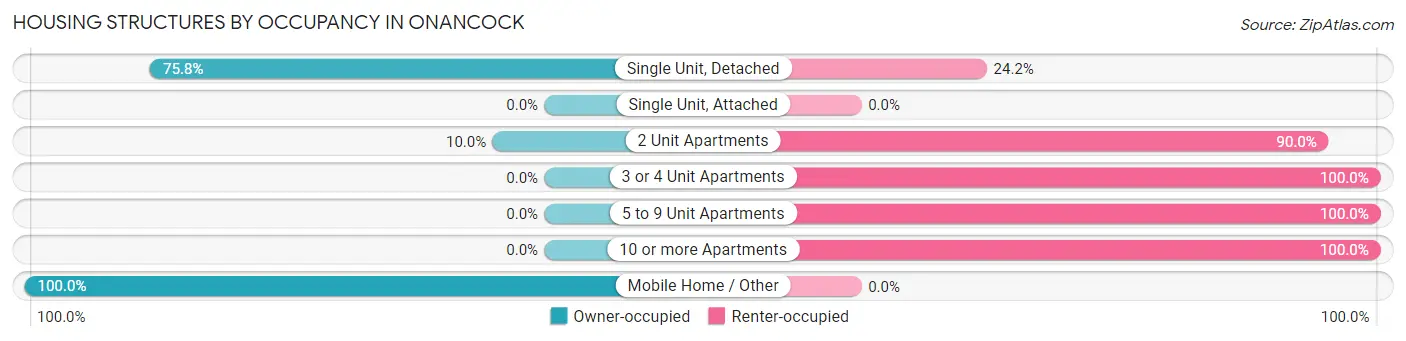
| Structure Type | Owner-occupied | Renter-occupied |
| Single Unit, Detached | 427 (75.8%) | 136 (24.2%) |
| Single Unit, Attached | 0 (0.0%) | 0 (0.0%) |
| 2 Unit Apartments | 2 (10.0%) | 18 (90.0%) |
| 3 or 4 Unit Apartments | 0 (0.0%) | 16 (100.0%) |
| 5 to 9 Unit Apartments | 0 (0.0%) | 35 (100.0%) |
| 10 or more Apartments | 0 (0.0%) | 58 (100.0%) |
| Mobile Home / Other | 4 (100.0%) | 0 (0.0%) |
| Total | 433 (62.2%) | 263 (37.8%) |
Housing Structures by Number of Rooms in Onancock
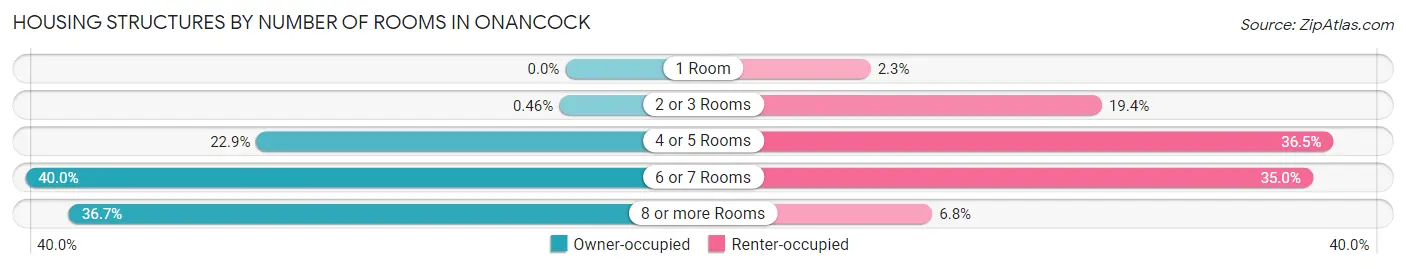
| Number of Rooms | Owner-occupied | Renter-occupied |
| 1 Room | 0 (0.0%) | 6 (2.3%) |
| 2 or 3 Rooms | 2 (0.5%) | 51 (19.4%) |
| 4 or 5 Rooms | 99 (22.9%) | 96 (36.5%) |
| 6 or 7 Rooms | 173 (40.0%) | 92 (35.0%) |
| 8 or more Rooms | 159 (36.7%) | 18 (6.8%) |
| Total | 433 (100.0%) | 263 (100.0%) |
Housing Structure by Heating Type in Onancock
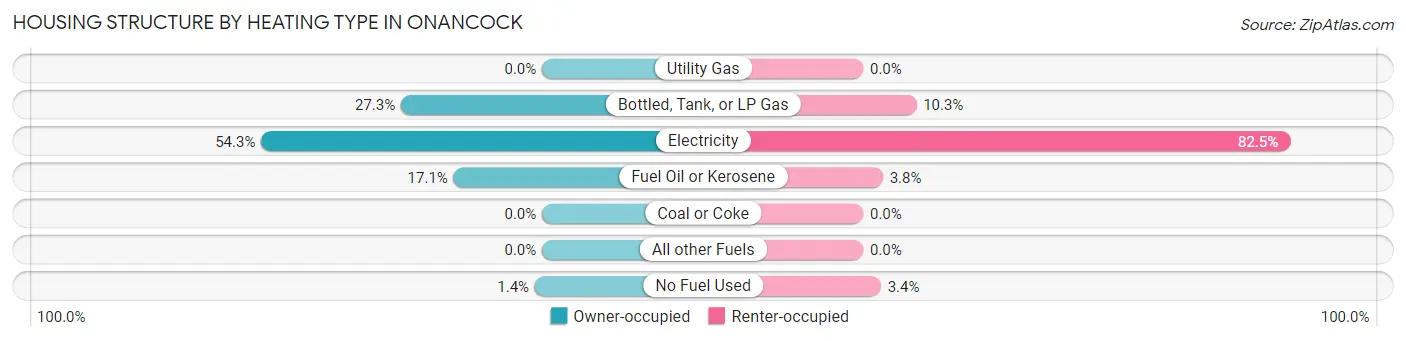
| Heating Type | Owner-occupied | Renter-occupied |
| Utility Gas | 0 (0.0%) | 0 (0.0%) |
| Bottled, Tank, or LP Gas | 118 (27.3%) | 27 (10.3%) |
| Electricity | 235 (54.3%) | 217 (82.5%) |
| Fuel Oil or Kerosene | 74 (17.1%) | 10 (3.8%) |
| Coal or Coke | 0 (0.0%) | 0 (0.0%) |
| All other Fuels | 0 (0.0%) | 0 (0.0%) |
| No Fuel Used | 6 (1.4%) | 9 (3.4%) |
| Total | 433 (100.0%) | 263 (100.0%) |
Household Vehicle Usage in Onancock
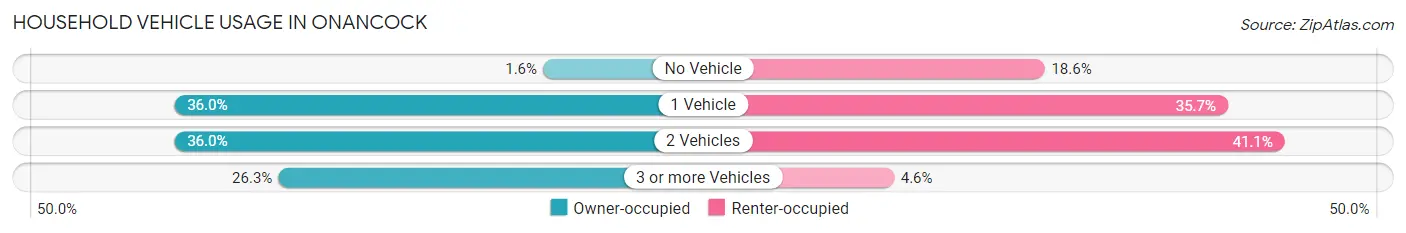
| Vehicles per Household | Owner-occupied | Renter-occupied |
| No Vehicle | 7 (1.6%) | 49 (18.6%) |
| 1 Vehicle | 156 (36.0%) | 94 (35.7%) |
| 2 Vehicles | 156 (36.0%) | 108 (41.1%) |
| 3 or more Vehicles | 114 (26.3%) | 12 (4.6%) |
| Total | 433 (100.0%) | 263 (100.0%) |
Real Estate & Mortgages in Onancock
Real Estate and Mortgage Overview in Onancock
| Characteristic | Without Mortgage | With Mortgage |
| Housing Units | 264 | 169 |
| Median Property Value | $216,700 | $247,200 |
| Median Household Income | $48,333 | $39 |
| Monthly Housing Costs | $641 | $8 |
| Real Estate Taxes | $1,479 | $11 |
Property Value by Mortgage Status in Onancock
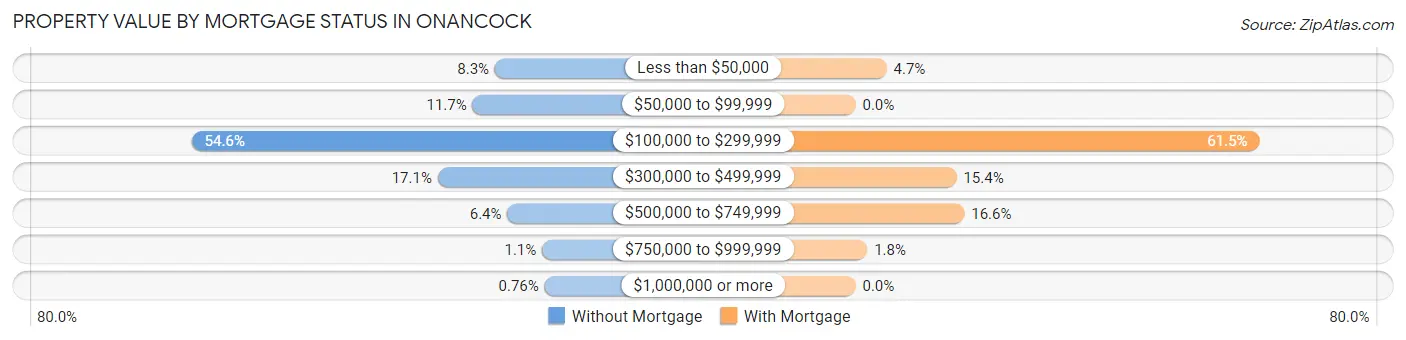
| Property Value | Without Mortgage | With Mortgage |
| Less than $50,000 | 22 (8.3%) | 8 (4.7%) |
| $50,000 to $99,999 | 31 (11.7%) | 0 (0.0%) |
| $100,000 to $299,999 | 144 (54.5%) | 104 (61.5%) |
| $300,000 to $499,999 | 45 (17.1%) | 26 (15.4%) |
| $500,000 to $749,999 | 17 (6.4%) | 28 (16.6%) |
| $750,000 to $999,999 | 3 (1.1%) | 3 (1.8%) |
| $1,000,000 or more | 2 (0.8%) | 0 (0.0%) |
| Total | 264 (100.0%) | 169 (100.0%) |
Household Income by Mortgage Status in Onancock
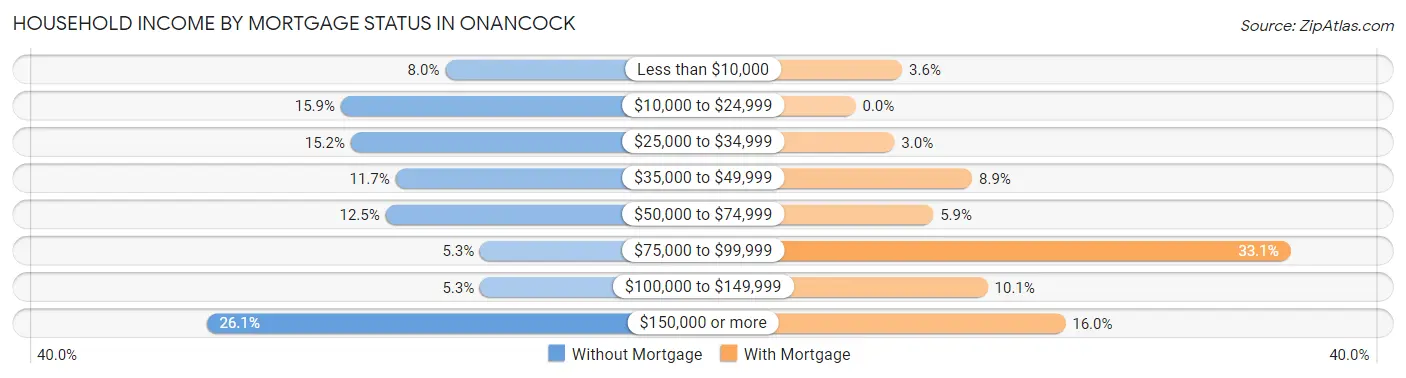
| Household Income | Without Mortgage | With Mortgage |
| Less than $10,000 | 21 (8.0%) | 6 (3.5%) |
| $10,000 to $24,999 | 42 (15.9%) | 0 (0.0%) |
| $25,000 to $34,999 | 40 (15.1%) | 5 (3.0%) |
| $35,000 to $49,999 | 31 (11.7%) | 15 (8.9%) |
| $50,000 to $74,999 | 33 (12.5%) | 10 (5.9%) |
| $75,000 to $99,999 | 14 (5.3%) | 56 (33.1%) |
| $100,000 to $149,999 | 14 (5.3%) | 17 (10.1%) |
| $150,000 or more | 69 (26.1%) | 27 (16.0%) |
| Total | 264 (100.0%) | 169 (100.0%) |
Property Value to Household Income Ratio in Onancock
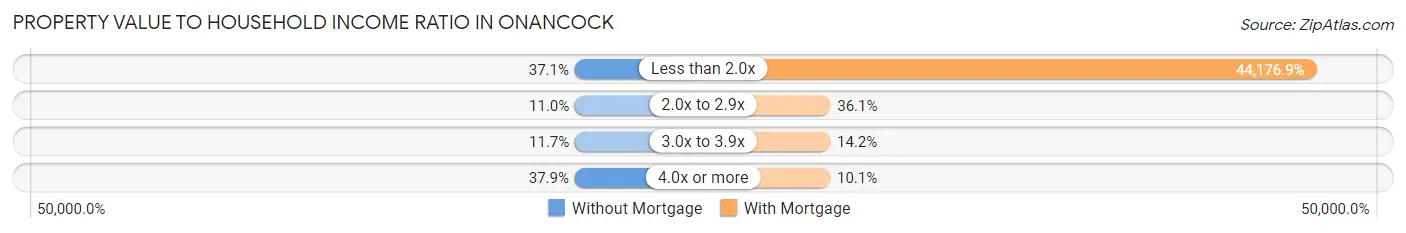
| Value-to-Income Ratio | Without Mortgage | With Mortgage |
| Less than 2.0x | 98 (37.1%) | 74,659 (44,176.9%) |
| 2.0x to 2.9x | 29 (11.0%) | 61 (36.1%) |
| 3.0x to 3.9x | 31 (11.7%) | 24 (14.2%) |
| 4.0x or more | 100 (37.9%) | 17 (10.1%) |
| Total | 264 (100.0%) | 169 (100.0%) |
Real Estate Taxes by Mortgage Status in Onancock
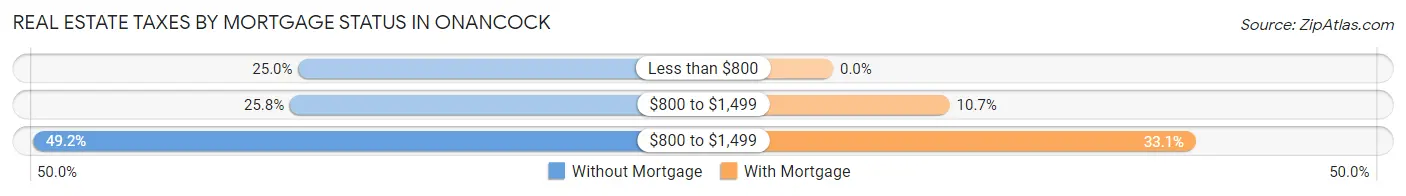
| Property Taxes | Without Mortgage | With Mortgage |
| Less than $800 | 66 (25.0%) | 0 (0.0%) |
| $800 to $1,499 | 68 (25.8%) | 18 (10.6%) |
| $800 to $1,499 | 130 (49.2%) | 56 (33.1%) |
| Total | 264 (100.0%) | 169 (100.0%) |
Health & Disability in Onancock
Health Insurance Coverage by Age in Onancock
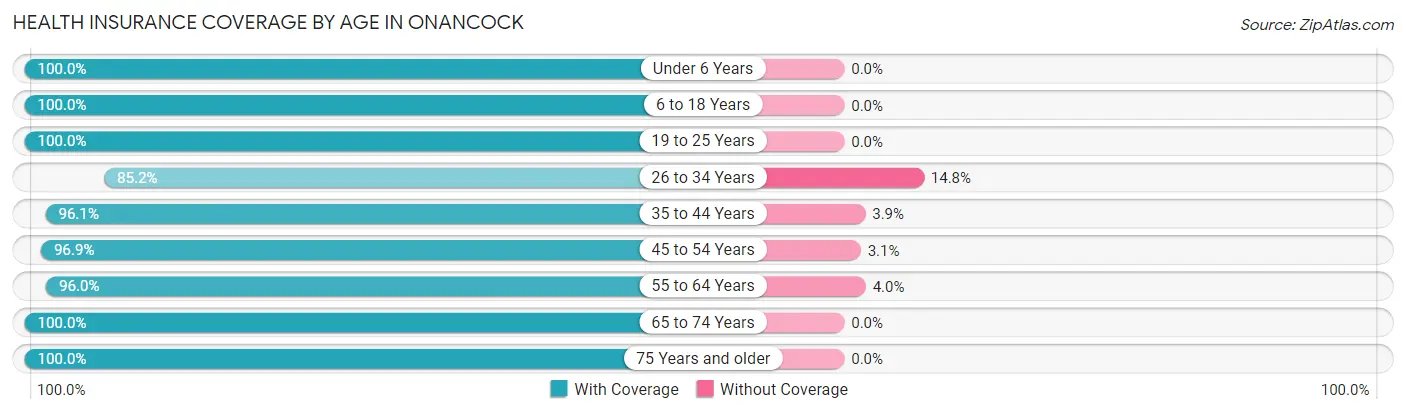
| Age Bracket | With Coverage | Without Coverage |
| Under 6 Years | 142 (100.0%) | 0 (0.0%) |
| 6 to 18 Years | 218 (100.0%) | 0 (0.0%) |
| 19 to 25 Years | 55 (100.0%) | 0 (0.0%) |
| 26 to 34 Years | 132 (85.2%) | 23 (14.8%) |
| 35 to 44 Years | 123 (96.1%) | 5 (3.9%) |
| 45 to 54 Years | 95 (96.9%) | 3 (3.1%) |
| 55 to 64 Years | 168 (96.0%) | 7 (4.0%) |
| 65 to 74 Years | 271 (100.0%) | 0 (0.0%) |
| 75 Years and older | 186 (100.0%) | 0 (0.0%) |
| Total | 1,390 (97.3%) | 38 (2.7%) |
Health Insurance Coverage by Citizenship Status in Onancock
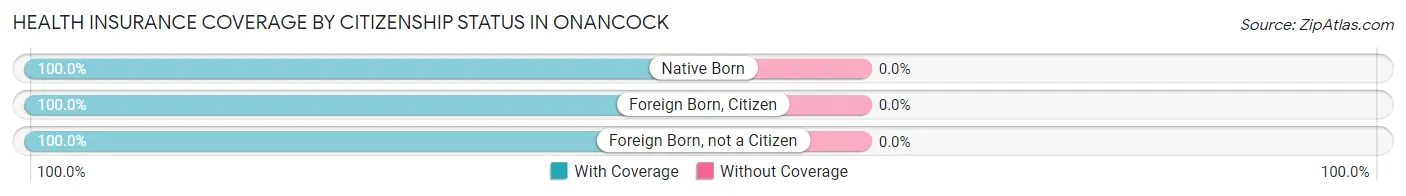
| Citizenship Status | With Coverage | Without Coverage |
| Native Born | 142 (100.0%) | 0 (0.0%) |
| Foreign Born, Citizen | 218 (100.0%) | 0 (0.0%) |
| Foreign Born, not a Citizen | 55 (100.0%) | 0 (0.0%) |
Health Insurance Coverage by Household Income in Onancock
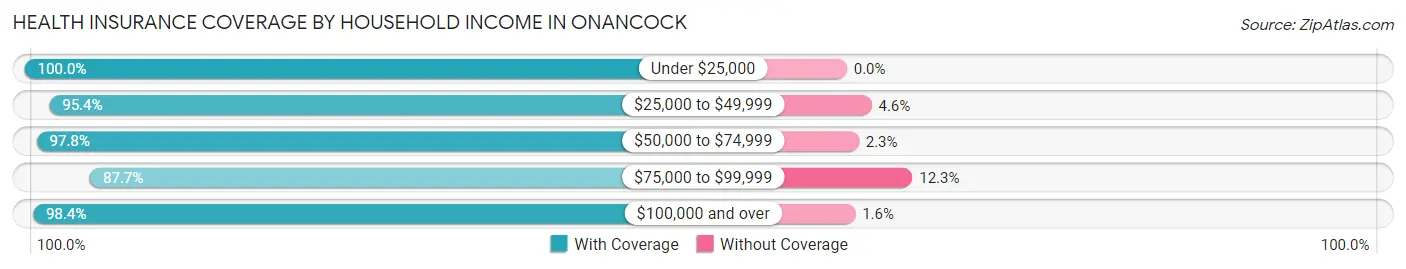
| Household Income | With Coverage | Without Coverage |
| Under $25,000 | 219 (100.0%) | 0 (0.0%) |
| $25,000 to $49,999 | 309 (95.4%) | 15 (4.6%) |
| $50,000 to $74,999 | 435 (97.8%) | 10 (2.2%) |
| $75,000 to $99,999 | 50 (87.7%) | 7 (12.3%) |
| $100,000 and over | 373 (98.4%) | 6 (1.6%) |
Public vs Private Health Insurance Coverage by Age in Onancock
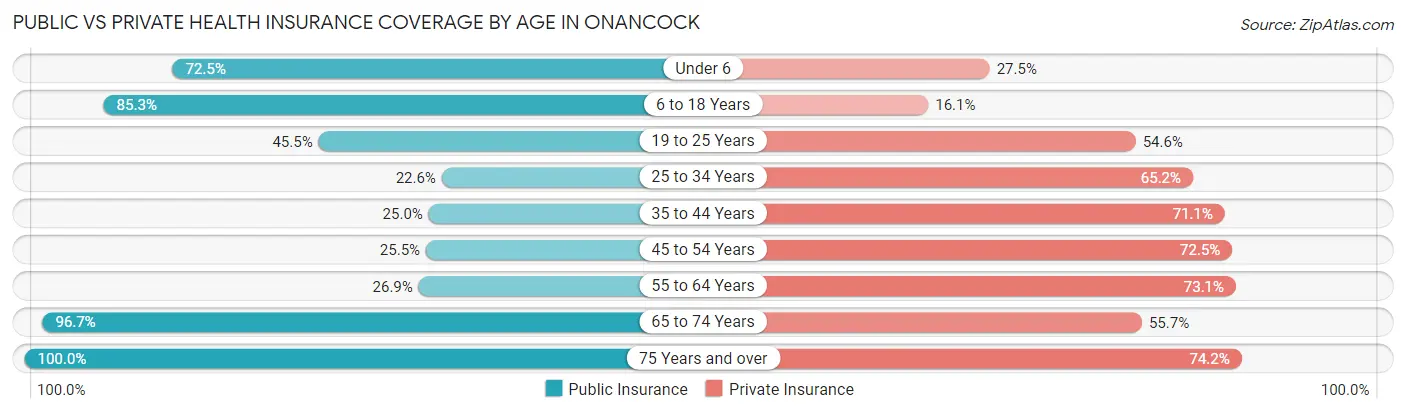
| Age Bracket | Public Insurance | Private Insurance |
| Under 6 | 103 (72.5%) | 39 (27.5%) |
| 6 to 18 Years | 186 (85.3%) | 35 (16.1%) |
| 19 to 25 Years | 25 (45.5%) | 30 (54.5%) |
| 25 to 34 Years | 35 (22.6%) | 101 (65.2%) |
| 35 to 44 Years | 32 (25.0%) | 91 (71.1%) |
| 45 to 54 Years | 25 (25.5%) | 71 (72.5%) |
| 55 to 64 Years | 47 (26.9%) | 128 (73.1%) |
| 65 to 74 Years | 262 (96.7%) | 151 (55.7%) |
| 75 Years and over | 186 (100.0%) | 138 (74.2%) |
| Total | 901 (63.1%) | 784 (54.9%) |
Disability Status by Sex by Age in Onancock
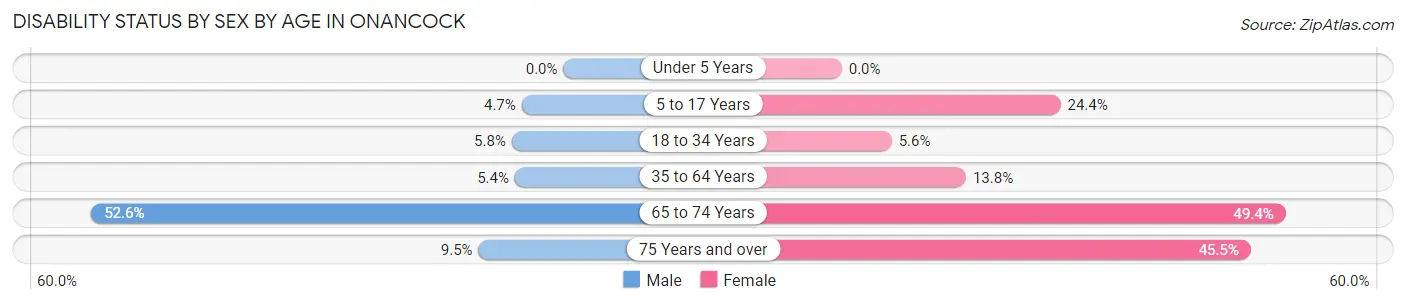
| Age Bracket | Male | Female |
| Under 5 Years | 0 (0.0%) | 0 (0.0%) |
| 5 to 17 Years | 8 (4.6%) | 19 (24.4%) |
| 18 to 34 Years | 5 (5.8%) | 7 (5.6%) |
| 35 to 64 Years | 8 (5.4%) | 35 (13.8%) |
| 65 to 74 Years | 51 (52.6%) | 86 (49.4%) |
| 75 Years and over | 7 (9.5%) | 51 (45.5%) |
Disability Class by Sex by Age in Onancock
Disability Class: Hearing Difficulty
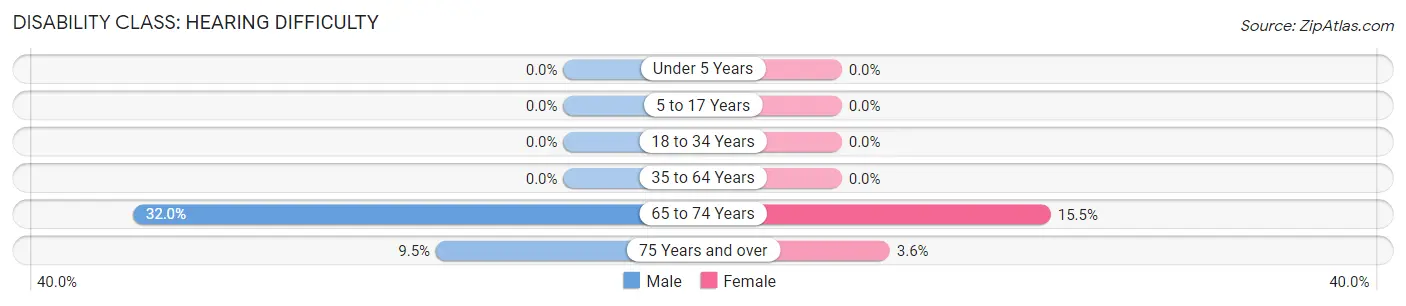
| Age Bracket | Male | Female |
| Under 5 Years | 0 (0.0%) | 0 (0.0%) |
| 5 to 17 Years | 0 (0.0%) | 0 (0.0%) |
| 18 to 34 Years | 0 (0.0%) | 0 (0.0%) |
| 35 to 64 Years | 0 (0.0%) | 0 (0.0%) |
| 65 to 74 Years | 31 (32.0%) | 27 (15.5%) |
| 75 Years and over | 7 (9.5%) | 4 (3.6%) |
Disability Class: Vision Difficulty
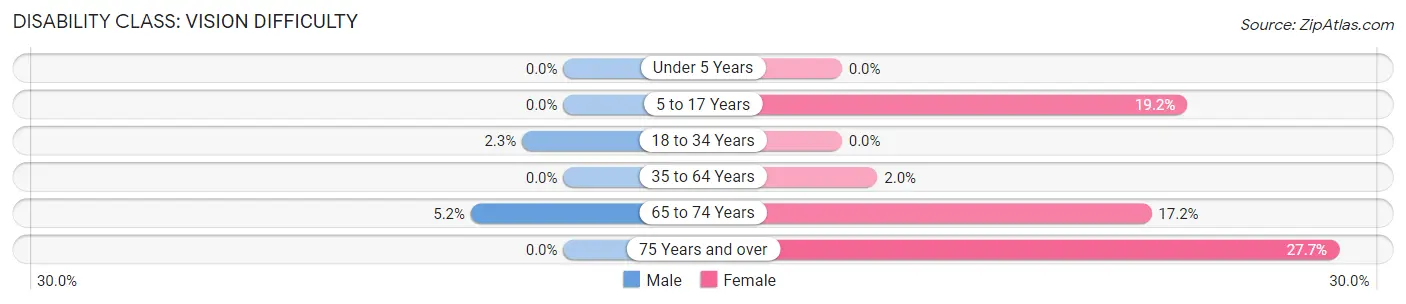
| Age Bracket | Male | Female |
| Under 5 Years | 0 (0.0%) | 0 (0.0%) |
| 5 to 17 Years | 0 (0.0%) | 15 (19.2%) |
| 18 to 34 Years | 2 (2.3%) | 0 (0.0%) |
| 35 to 64 Years | 0 (0.0%) | 5 (2.0%) |
| 65 to 74 Years | 5 (5.1%) | 30 (17.2%) |
| 75 Years and over | 0 (0.0%) | 31 (27.7%) |
Disability Class: Cognitive Difficulty
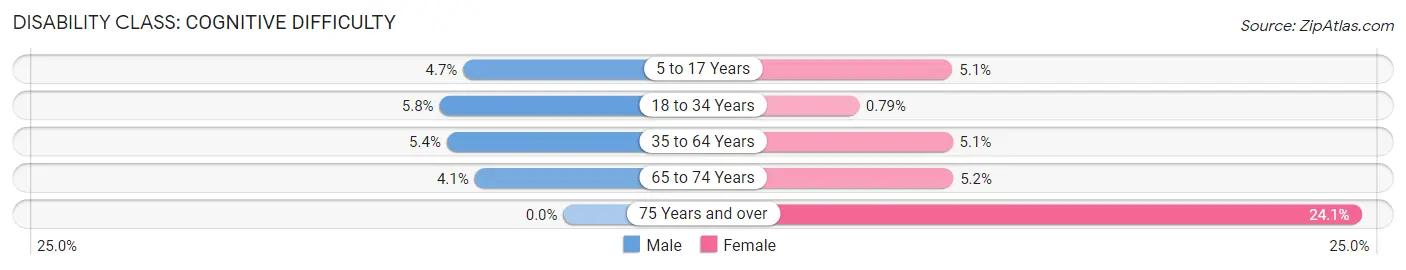
| Age Bracket | Male | Female |
| 5 to 17 Years | 8 (4.6%) | 4 (5.1%) |
| 18 to 34 Years | 5 (5.8%) | 1 (0.8%) |
| 35 to 64 Years | 8 (5.4%) | 13 (5.1%) |
| 65 to 74 Years | 4 (4.1%) | 9 (5.2%) |
| 75 Years and over | 0 (0.0%) | 27 (24.1%) |
Disability Class: Ambulatory Difficulty
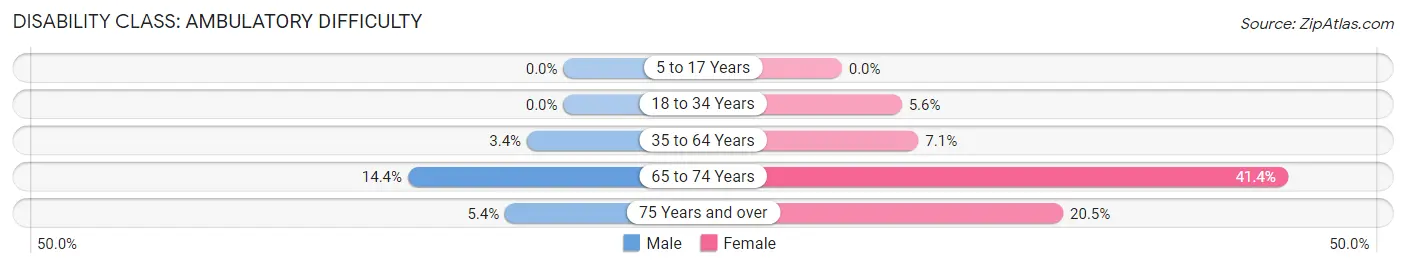
| Age Bracket | Male | Female |
| 5 to 17 Years | 0 (0.0%) | 0 (0.0%) |
| 18 to 34 Years | 0 (0.0%) | 7 (5.6%) |
| 35 to 64 Years | 5 (3.4%) | 18 (7.1%) |
| 65 to 74 Years | 14 (14.4%) | 72 (41.4%) |
| 75 Years and over | 4 (5.4%) | 23 (20.5%) |
Disability Class: Self-Care Difficulty
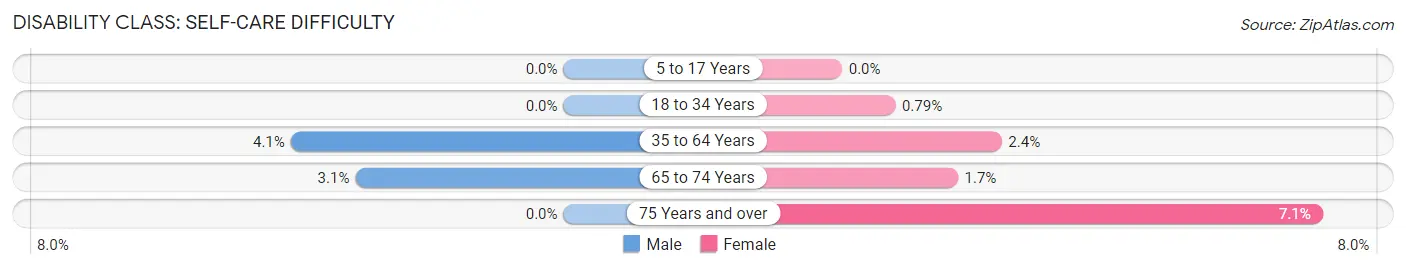
| Age Bracket | Male | Female |
| 5 to 17 Years | 0 (0.0%) | 0 (0.0%) |
| 18 to 34 Years | 0 (0.0%) | 1 (0.8%) |
| 35 to 64 Years | 6 (4.1%) | 6 (2.4%) |
| 65 to 74 Years | 3 (3.1%) | 3 (1.7%) |
| 75 Years and over | 0 (0.0%) | 8 (7.1%) |
Technology Access in Onancock
Computing Device Access in Onancock
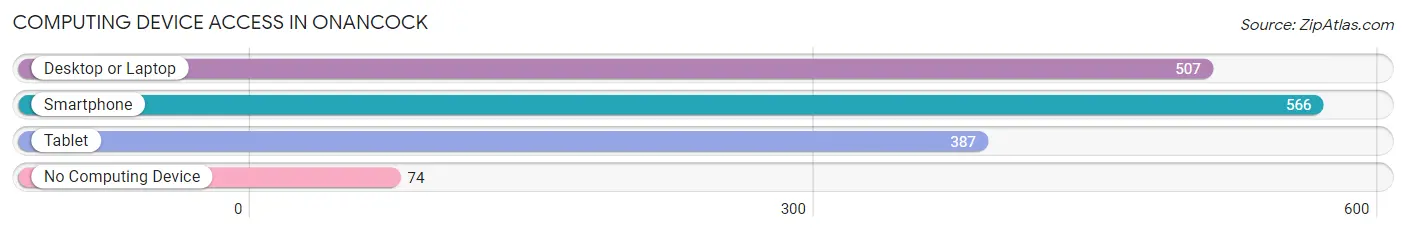
| Device Type | # Households | % Households |
| Desktop or Laptop | 507 | 72.8% |
| Smartphone | 566 | 81.3% |
| Tablet | 387 | 55.6% |
| No Computing Device | 74 | 10.6% |
| Total | 696 | 100.0% |
Internet Access in Onancock
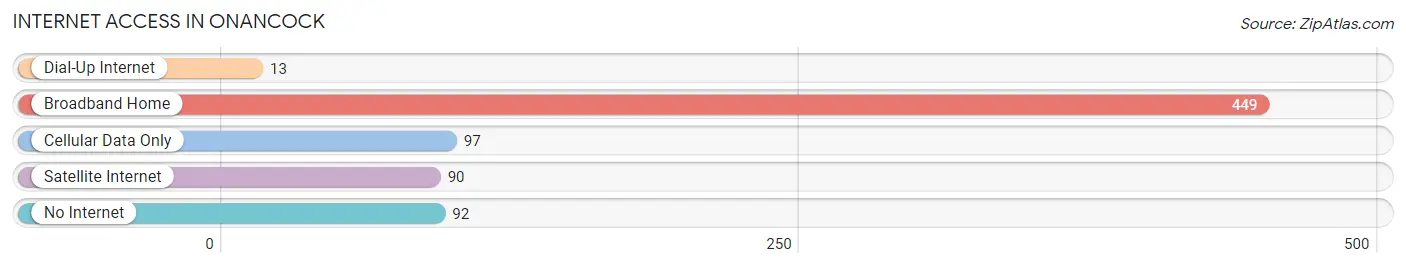
| Internet Type | # Households | % Households |
| Dial-Up Internet | 13 | 1.9% |
| Broadband Home | 449 | 64.5% |
| Cellular Data Only | 97 | 13.9% |
| Satellite Internet | 90 | 12.9% |
| No Internet | 92 | 13.2% |
| Total | 696 | 100.0% |
Onancock Summary
Onancock, Virginia is a small town located in the Eastern Shore region of the state. It is situated on the western shore of the Chesapeake Bay, about 30 miles south of the Maryland border. The town has a population of 1,200 people and is the county seat of Accomack County.
History
Onancock was founded in 1680 by English settlers. The town was originally known as "Onancock Creek" and was part of the original Accomack County. The town was named after the Native American chief, Onancock, who lived in the area. The town was incorporated in 1742 and was the first town in the county to be incorporated.
In the late 1700s, Onancock was a thriving port town. It was a major center for the shipping of tobacco, grain, and other goods. The town was also a major center for shipbuilding and fishing.
In the early 1800s, Onancock was a major center for the slave trade. The town was home to several large plantations and was a major stop on the Underground Railroad.
In the late 1800s, Onancock began to decline as a port town. The town was bypassed by the railroad and the shipping industry moved to larger ports. The town began to focus on agriculture and fishing.
In the early 1900s, Onancock began to experience a revival. The town was revitalized by the construction of a new bridge across the Chesapeake Bay. The bridge connected Onancock to the mainland and allowed for increased tourism and commerce.
Geography
Onancock is located on the western shore of the Chesapeake Bay. The town is situated on a peninsula between Onancock Creek and Onancock Harbor. The town is surrounded by wetlands and is home to several wildlife preserves.
The town is located in the humid subtropical climate zone and experiences hot, humid summers and mild winters. The average annual temperature is around 60 degrees Fahrenheit.
Economy
Onancock's economy is largely based on tourism and agriculture. The town is home to several seafood restaurants, marinas, and other tourist attractions. The town is also home to several farms and is a major producer of corn, soybeans, and other crops.
The town is also home to several small businesses, including a brewery, a winery, and a distillery. The town is also home to several art galleries and antique shops.
Demographics
As of the 2010 census, Onancock had a population of 1,200 people. The town is predominantly white (90.2%) and the median household income is $41,250. The town is home to a large number of retirees and is a popular destination for retirees.
The town is home to several churches, including the Onancock United Methodist Church, the Onancock Baptist Church, and the Onancock Presbyterian Church. The town is also home to several schools, including the Onancock Elementary School, the Onancock Middle School, and the Onancock High School.
Common Questions
What is Per Capita Income in Onancock?
Per Capita income in Onancock is $36,685.
What is the Median Family Income in Onancock?
Median Family Income in Onancock is $68,188.
What is the Median Household income in Onancock?
Median Household Income in Onancock is $51,830.
What is Income or Wage Gap in Onancock?
Income or Wage Gap in Onancock is 16.0%.
Women in Onancock earn 84.0 cents for every dollar earned by a man.
What is Family Income Deficit in Onancock?
Family Income Deficit in Onancock is $10,189.
Families that are below poverty line in Onancock earn $10,189 less on average than the poverty threshold level.
What is Inequality or Gini Index in Onancock?
Inequality or Gini Index in Onancock is 0.47.
What is the Total Population of Onancock?
Total Population of Onancock is 1,434.
What is the Total Male Population of Onancock?
Total Male Population of Onancock is 646.
What is the Total Female Population of Onancock?
Total Female Population of Onancock is 788.
What is the Ratio of Males per 100 Females in Onancock?
There are 81.98 Males per 100 Females in Onancock.
What is the Ratio of Females per 100 Males in Onancock?
There are 121.98 Females per 100 Males in Onancock.
What is the Median Population Age in Onancock?
Median Population Age in Onancock is 45.5 Years.
What is the Average Family Size in Onancock
Average Family Size in Onancock is 2.7 People.
What is the Average Household Size in Onancock
Average Household Size in Onancock is 2.0 People.
How Large is the Labor Force in Onancock?
There are 596 People in the Labor Forcein in Onancock.
What is the Percentage of People in the Labor Force in Onancock?
54.5% of People are in the Labor Force in Onancock.
What is the Unemployment Rate in Onancock?
Unemployment Rate in Onancock is 9.7%.