Kilmarnock, VA Map & Demographics
Kilmarnock Map
Kilmarnock Overview
$27,486
PER CAPITA INCOME
$44,242
AVG FAMILY INCOME
$36,875
AVG HOUSEHOLD INCOME
52.6%
WAGE / INCOME GAP [ % ]
47.4¢/ $1
WAGE / INCOME GAP [ $ ]
0.47
INEQUALITY / GINI INDEX
1,284
TOTAL POPULATION
517
MALE POPULATION
767
FEMALE POPULATION
67.41
MALES / 100 FEMALES
148.36
FEMALES / 100 MALES
60.2
MEDIAN AGE
2.6
AVG FAMILY SIZE
1.7
AVG HOUSEHOLD SIZE
444
LABOR FORCE [ PEOPLE ]
39.4%
PERCENT IN LABOR FORCE
5.6%
UNEMPLOYMENT RATE
Kilmarnock Zip Codes
Kilmarnock Area Codes
Income in Kilmarnock
Income Overview in Kilmarnock
Per Capita Income in Kilmarnock is $27,486, while median incomes of families and households are $44,242 and $36,875 respectively.
| Characteristic | Number | Measure |
| Per Capita Income | 1,284 | $27,486 |
| Median Family Income | 268 | $44,242 |
| Mean Family Income | 268 | $67,068 |
| Median Household Income | 645 | $36,875 |
| Mean Household Income | 645 | $50,521 |
| Income Deficit | 268 | $0 |
| Wage / Income Gap (%) | 1,284 | 52.56% |
| Wage / Income Gap ($) | 1,284 | 47.44¢ per $1 |
| Gini / Inequality Index | 1,284 | 0.47 |
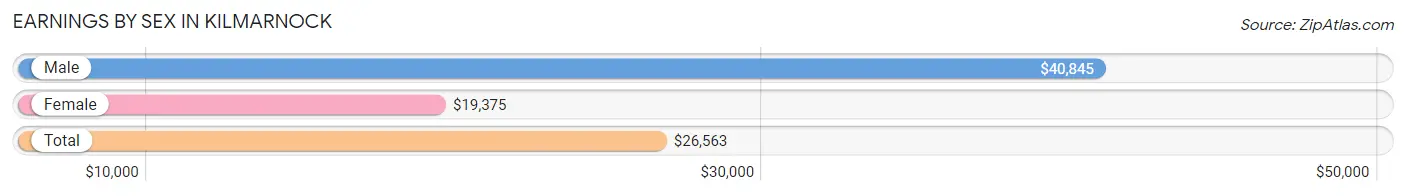
Earnings by Sex in Kilmarnock
Average Earnings in Kilmarnock are $26,563, $40,845 for men and $19,375 for women, a difference of 52.6%.
| Sex | Number | Average Earnings |
| Male | 213 (43.9%) | $40,845 |
| Female | 272 (56.1%) | $19,375 |
| Total | 485 (100.0%) | $26,563 |
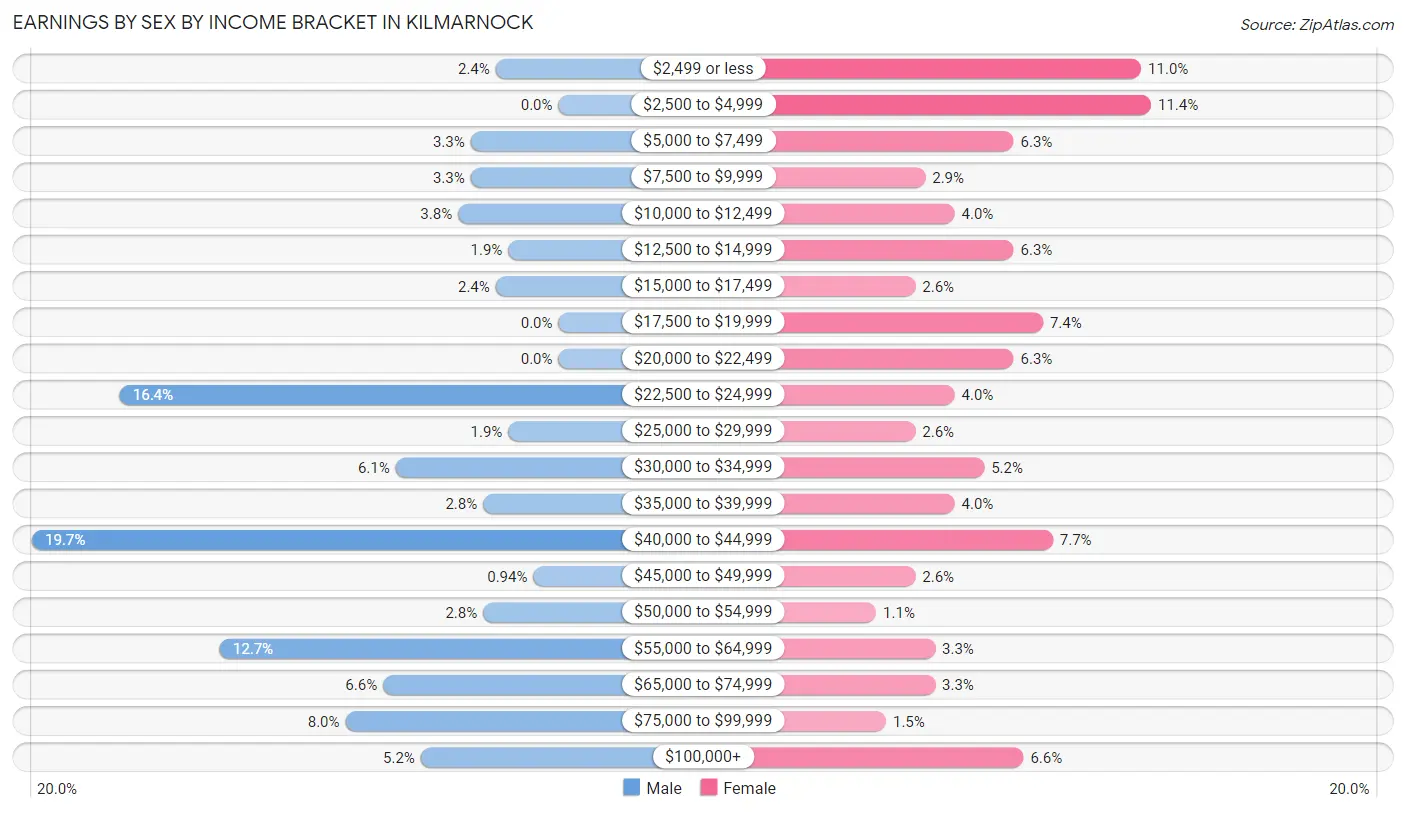
Earnings by Sex by Income Bracket in Kilmarnock
The most common earnings brackets in Kilmarnock are $40,000 to $44,999 for men (42 | 19.7%) and $2,500 to $4,999 for women (31 | 11.4%).
| Income | Male | Female |
| $2,499 or less | 5 (2.4%) | 30 (11.0%) |
| $2,500 to $4,999 | 0 (0.0%) | 31 (11.4%) |
| $5,000 to $7,499 | 7 (3.3%) | 17 (6.2%) |
| $7,500 to $9,999 | 7 (3.3%) | 8 (2.9%) |
| $10,000 to $12,499 | 8 (3.8%) | 11 (4.0%) |
| $12,500 to $14,999 | 4 (1.9%) | 17 (6.2%) |
| $15,000 to $17,499 | 5 (2.4%) | 7 (2.6%) |
| $17,500 to $19,999 | 0 (0.0%) | 20 (7.3%) |
| $20,000 to $22,499 | 0 (0.0%) | 17 (6.2%) |
| $22,500 to $24,999 | 35 (16.4%) | 11 (4.0%) |
| $25,000 to $29,999 | 4 (1.9%) | 7 (2.6%) |
| $30,000 to $34,999 | 13 (6.1%) | 14 (5.1%) |
| $35,000 to $39,999 | 6 (2.8%) | 11 (4.0%) |
| $40,000 to $44,999 | 42 (19.7%) | 21 (7.7%) |
| $45,000 to $49,999 | 2 (0.9%) | 7 (2.6%) |
| $50,000 to $54,999 | 6 (2.8%) | 3 (1.1%) |
| $55,000 to $64,999 | 27 (12.7%) | 9 (3.3%) |
| $65,000 to $74,999 | 14 (6.6%) | 9 (3.3%) |
| $75,000 to $99,999 | 17 (8.0%) | 4 (1.5%) |
| $100,000+ | 11 (5.2%) | 18 (6.6%) |
| Total | 213 (100.0%) | 272 (100.0%) |
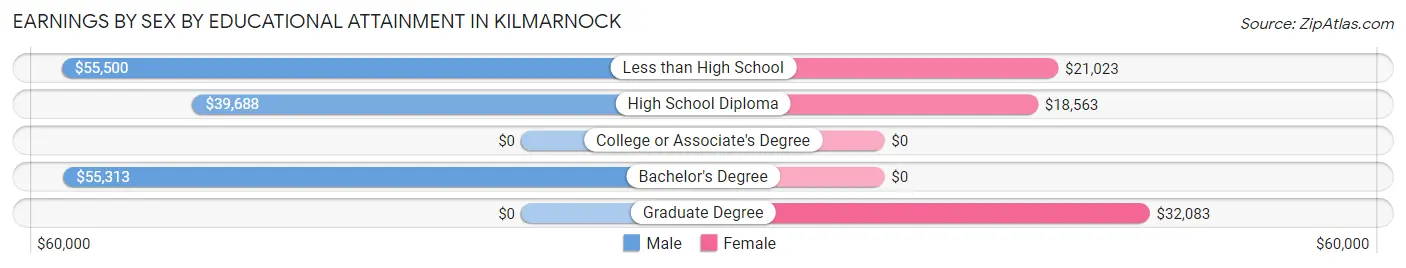
Earnings by Sex by Educational Attainment in Kilmarnock
Average earnings in Kilmarnock are $41,250 for men and $21,838 for women, a difference of 47.1%. Men with an educational attainment of less than high school enjoy the highest average annual earnings of $55,500, while those with high school diploma education earn the least with $39,688. Women with an educational attainment of graduate degree earn the most with the average annual earnings of $32,083, while those with high school diploma education have the smallest earnings of $18,563.
| Educational Attainment | Male Income | Female Income |
| Less than High School | $55,500 | $21,023 |
| High School Diploma | $39,688 | $18,563 |
| College or Associate's Degree | - | - |
| Bachelor's Degree | $55,313 | $0 |
| Graduate Degree | - | - |
| Total | $41,250 | $21,838 |
Family Income in Kilmarnock
Family Income Brackets in Kilmarnock
According to the Kilmarnock family income data, there are 76 families falling into the $35,000 to $49,999 income range, which is the most common income bracket and makes up 28.4% of all families. Conversely, the $25,000 to $34,999 income bracket is the least frequent group with only 5 families (1.9%) belonging to this category.
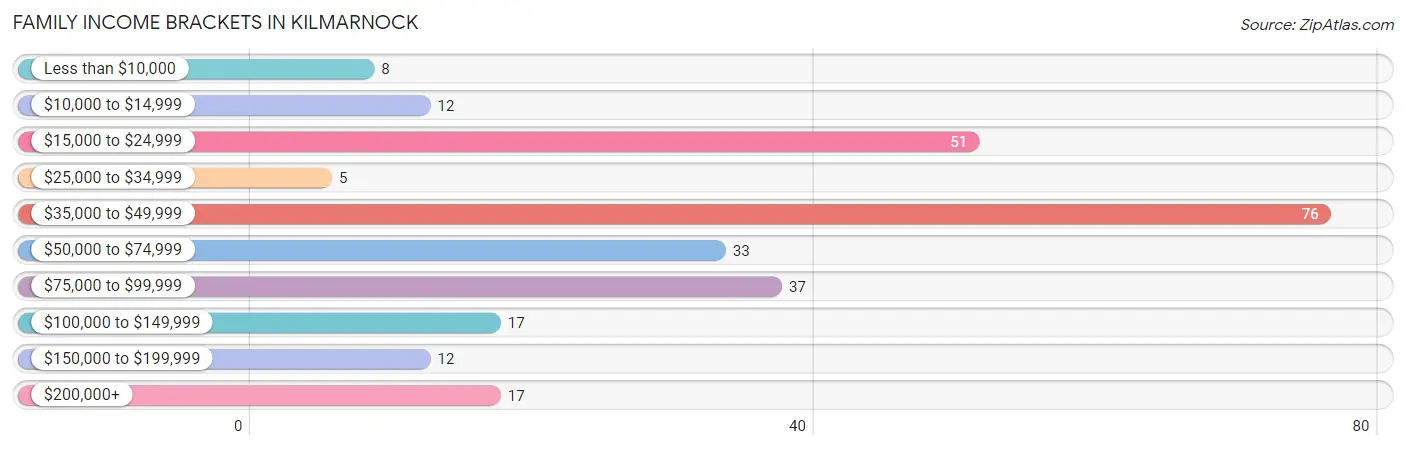
| Income Bracket | # Families | % Families |
| Less than $10,000 | 8 | 3.0% |
| $10,000 to $14,999 | 12 | 4.5% |
| $15,000 to $24,999 | 51 | 19.0% |
| $25,000 to $34,999 | 5 | 1.9% |
| $35,000 to $49,999 | 76 | 28.4% |
| $50,000 to $74,999 | 33 | 12.3% |
| $75,000 to $99,999 | 37 | 13.8% |
| $100,000 to $149,999 | 17 | 6.3% |
| $150,000 to $199,999 | 12 | 4.5% |
| $200,000+ | 17 | 6.3% |
Family Income by Famaliy Size in Kilmarnock
4-person families (21 | 7.8%) account for the highest median family income in Kilmarnock with $70,893 per family, while 2-person families (184 | 68.7%) have the highest median income of $28,125 per family member.
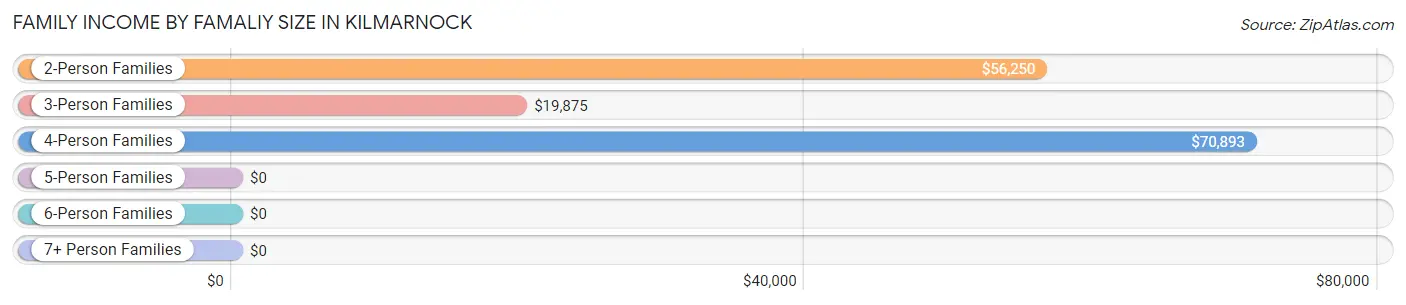
| Income Bracket | # Families | Median Income |
| 2-Person Families | 184 (68.7%) | $56,250 |
| 3-Person Families | 52 (19.4%) | $19,875 |
| 4-Person Families | 21 (7.8%) | $70,893 |
| 5-Person Families | 11 (4.1%) | $0 |
| 6-Person Families | 0 (0.0%) | $0 |
| 7+ Person Families | 0 (0.0%) | $0 |
| Total | 268 (100.0%) | $44,242 |
Family Income by Number of Earners in Kilmarnock
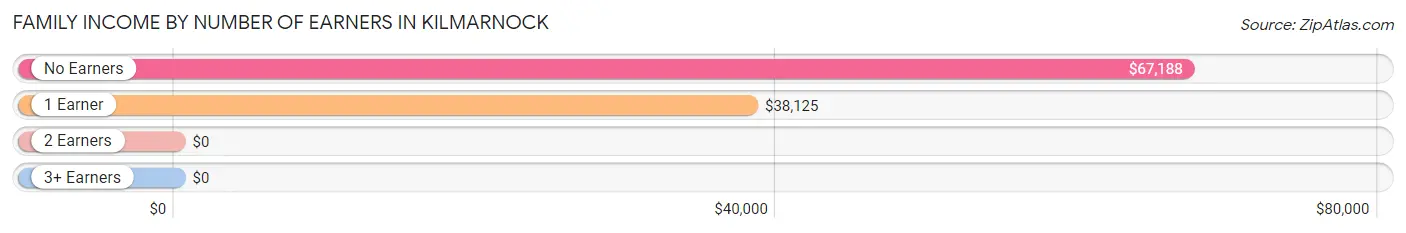
| Number of Earners | # Families | Median Income |
| No Earners | 41 (15.3%) | $67,188 |
| 1 Earner | 144 (53.7%) | $38,125 |
| 2 Earners | 83 (31.0%) | $0 |
| 3+ Earners | 0 (0.0%) | $0 |
| Total | 268 (100.0%) | $44,242 |
Household Income in Kilmarnock
Household Income Brackets in Kilmarnock
With 126 households falling in the category, the $35,000 to $49,999 income range is the most frequent in Kilmarnock, accounting for 19.5% of all households. In contrast, only 19 households (2.9%) fall into the $150,000 to $199,999 income bracket, making it the least populous group.
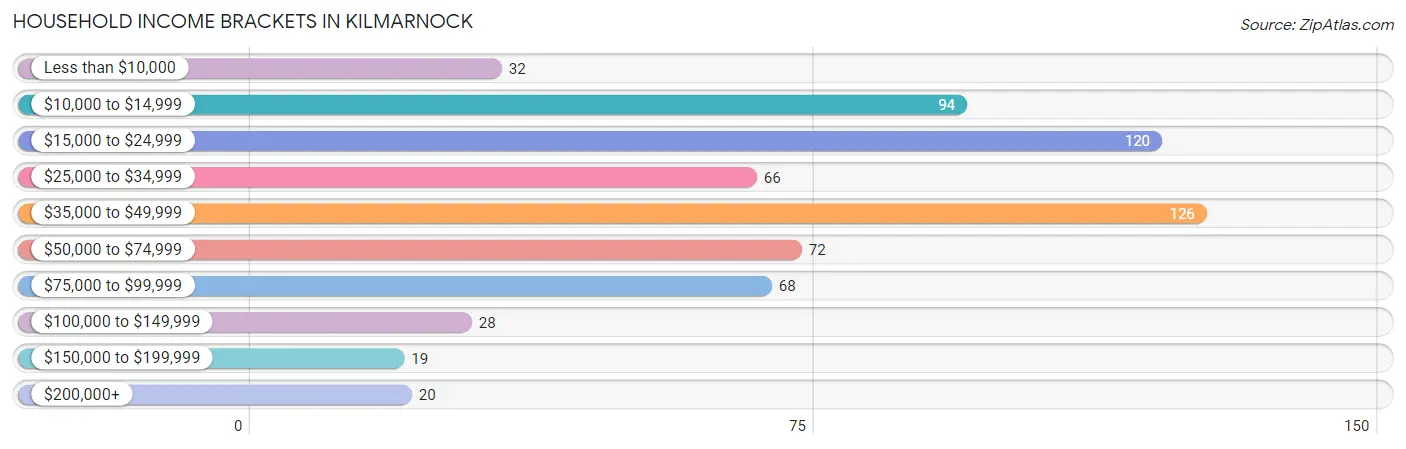
| Income Bracket | # Households | % Households |
| Less than $10,000 | 32 | 5.0% |
| $10,000 to $14,999 | 94 | 14.6% |
| $15,000 to $24,999 | 120 | 18.6% |
| $25,000 to $34,999 | 66 | 10.2% |
| $35,000 to $49,999 | 126 | 19.5% |
| $50,000 to $74,999 | 72 | 11.2% |
| $75,000 to $99,999 | 68 | 10.5% |
| $100,000 to $149,999 | 28 | 4.3% |
| $150,000 to $199,999 | 19 | 2.9% |
| $200,000+ | 20 | 3.1% |
Household Income by Householder Age in Kilmarnock
The median household income in Kilmarnock is $36,875, with the highest median household income of $43,674 found in the 25 to 44 years age bracket for the primary householder. A total of 147 households (22.8%) fall into this category. Meanwhile, the 15 to 24 years age bracket for the primary householder has the lowest median household income of $0, with 8 households (1.2%) in this group.
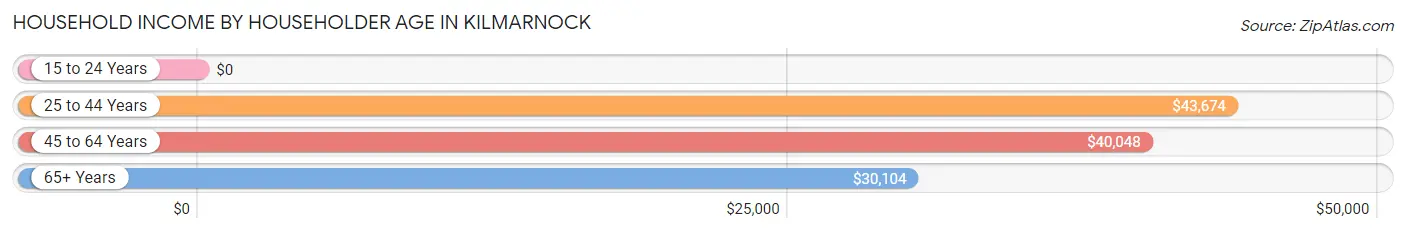
| Income Bracket | # Households | Median Income |
| 15 to 24 Years | 8 (1.2%) | $0 |
| 25 to 44 Years | 147 (22.8%) | $43,674 |
| 45 to 64 Years | 155 (24.0%) | $40,048 |
| 65+ Years | 335 (51.9%) | $30,104 |
| Total | 645 (100.0%) | $36,875 |
Poverty in Kilmarnock
Income Below Poverty by Sex and Age in Kilmarnock
With 24.1% poverty level for males and 33.4% for females among the residents of Kilmarnock, under 5 year old males and 16 and 17 year old females are the most vulnerable to poverty, with 20 males (100.0%) and 21 females (100.0%) in their respective age groups living below the poverty level.
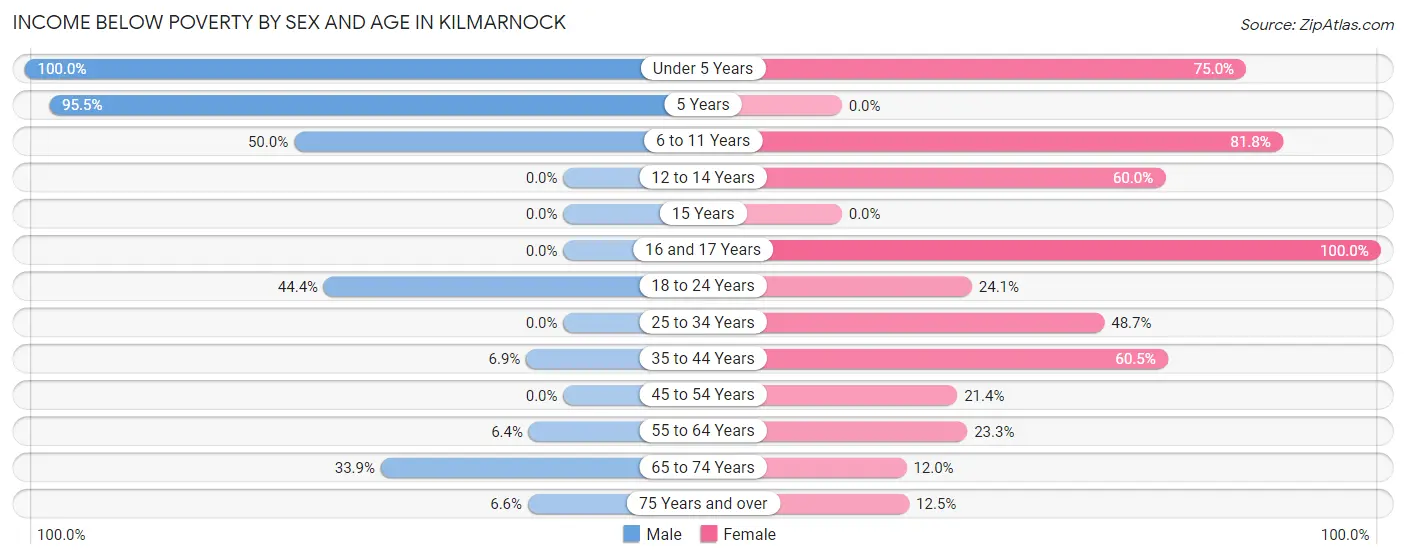
| Age Bracket | Male | Female |
| Under 5 Years | 20 (100.0%) | 21 (75.0%) |
| 5 Years | 21 (95.5%) | 0 (0.0%) |
| 6 to 11 Years | 11 (50.0%) | 27 (81.8%) |
| 12 to 14 Years | 0 (0.0%) | 9 (60.0%) |
| 15 Years | 0 (0.0%) | 0 (0.0%) |
| 16 and 17 Years | 0 (0.0%) | 21 (100.0%) |
| 18 to 24 Years | 8 (44.4%) | 7 (24.1%) |
| 25 to 34 Years | 0 (0.0%) | 38 (48.7%) |
| 35 to 44 Years | 4 (6.9%) | 26 (60.5%) |
| 45 to 54 Years | 0 (0.0%) | 12 (21.4%) |
| 55 to 64 Years | 5 (6.4%) | 27 (23.3%) |
| 65 to 74 Years | 41 (33.9%) | 12 (12.0%) |
| 75 Years and over | 5 (6.6%) | 16 (12.5%) |
| Total | 115 (24.1%) | 216 (33.4%) |
Income Above Poverty by Sex and Age in Kilmarnock
According to the poverty statistics in Kilmarnock, males aged 15 years and females aged 65 to 74 years are the age groups that are most secure financially, with 100.0% of males and 88.0% of females in these age groups living above the poverty line.
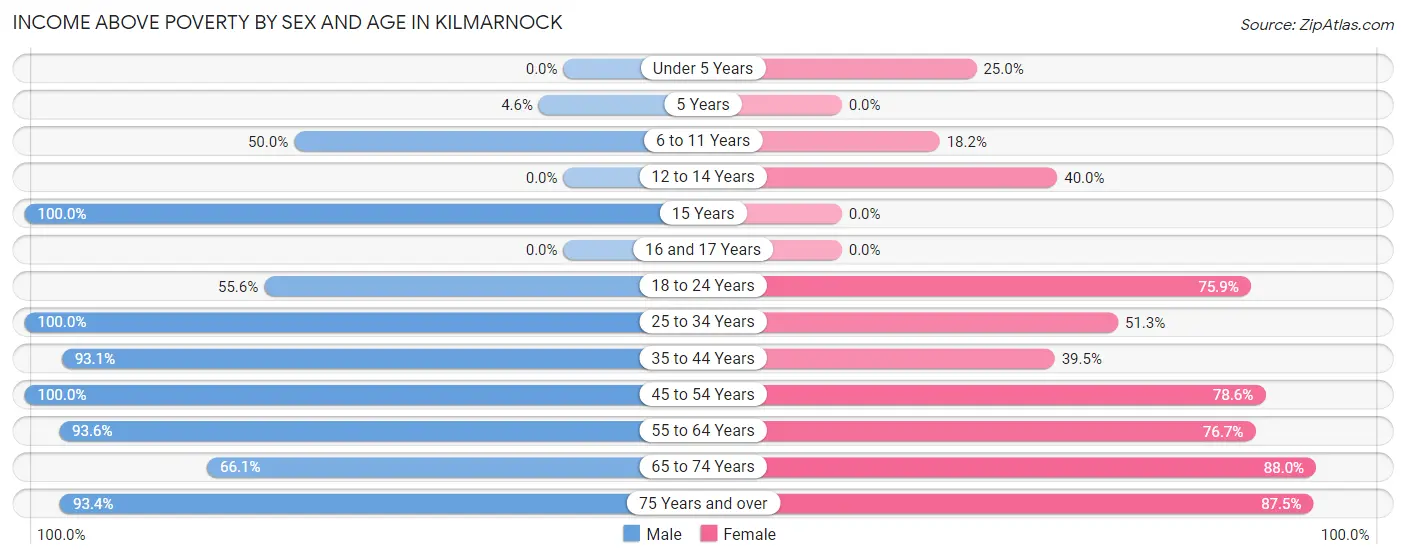
| Age Bracket | Male | Female |
| Under 5 Years | 0 (0.0%) | 7 (25.0%) |
| 5 Years | 1 (4.5%) | 0 (0.0%) |
| 6 to 11 Years | 11 (50.0%) | 6 (18.2%) |
| 12 to 14 Years | 0 (0.0%) | 6 (40.0%) |
| 15 Years | 7 (100.0%) | 0 (0.0%) |
| 16 and 17 Years | 0 (0.0%) | 0 (0.0%) |
| 18 to 24 Years | 10 (55.6%) | 22 (75.9%) |
| 25 to 34 Years | 40 (100.0%) | 40 (51.3%) |
| 35 to 44 Years | 54 (93.1%) | 17 (39.5%) |
| 45 to 54 Years | 16 (100.0%) | 44 (78.6%) |
| 55 to 64 Years | 73 (93.6%) | 89 (76.7%) |
| 65 to 74 Years | 80 (66.1%) | 88 (88.0%) |
| 75 Years and over | 71 (93.4%) | 112 (87.5%) |
| Total | 363 (75.9%) | 431 (66.6%) |
Income Below Poverty Among Married-Couple Families in Kilmarnock
The poverty statistics for married-couple families in Kilmarnock show that 2.8% or 5 of the total 177 families live below the poverty line. Families with no children have the highest poverty rate of 3.0%, comprising of 5 families. On the other hand, families with 1 or 2 children have the lowest poverty rate of 0.0%, which includes 0 families.
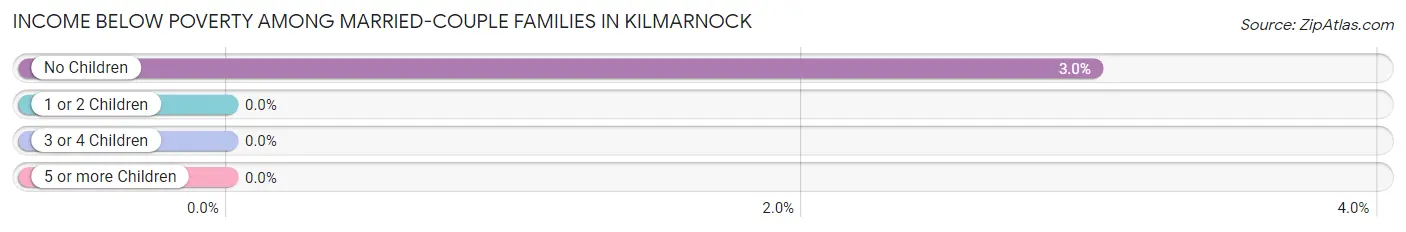
| Children | Above Poverty | Below Poverty |
| No Children | 161 (97.0%) | 5 (3.0%) |
| 1 or 2 Children | 11 (100.0%) | 0 (0.0%) |
| 3 or 4 Children | 0 (0.0%) | 0 (0.0%) |
| 5 or more Children | 0 (0.0%) | 0 (0.0%) |
| Total | 172 (97.2%) | 5 (2.8%) |
Income Below Poverty Among Single-Parent Households in Kilmarnock
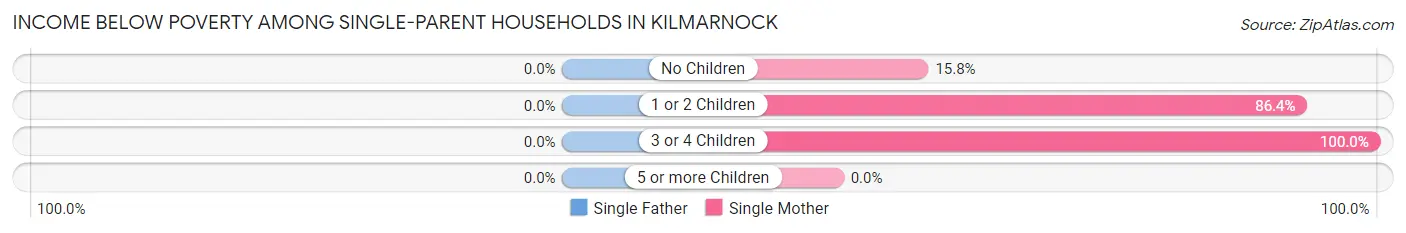
| Children | Single Father | Single Mother |
| No Children | 0 (0.0%) | 3 (15.8%) |
| 1 or 2 Children | 0 (0.0%) | 57 (86.4%) |
| 3 or 4 Children | 0 (0.0%) | 6 (100.0%) |
| 5 or more Children | 0 (0.0%) | 0 (0.0%) |
| Total | 0 (0.0%) | 66 (72.5%) |
Income Below Poverty Among Married-Couple vs Single-Parent Households in Kilmarnock
The poverty data for Kilmarnock shows that 5 of the married-couple family households (2.8%) and 66 of the single-parent households (72.5%) are living below the poverty level. Within the married-couple family households, those with no children have the highest poverty rate, with 5 households (3.0%) falling below the poverty line. Among the single-parent households, those with 3 or 4 children have the highest poverty rate, with 6 household (100.0%) living below poverty.
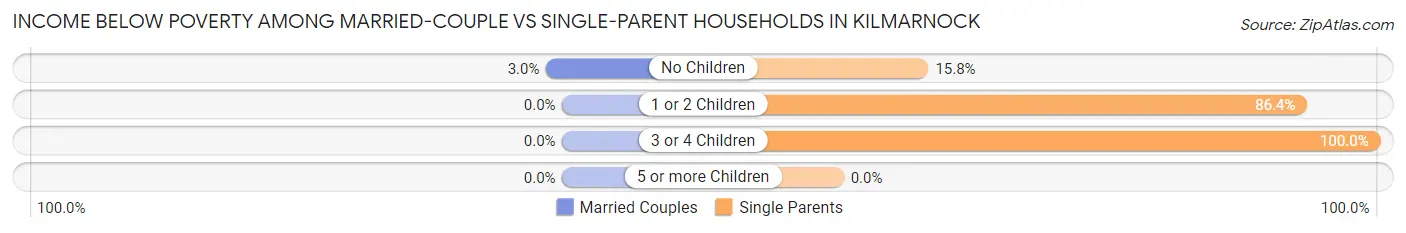
| Children | Married-Couple Families | Single-Parent Households |
| No Children | 5 (3.0%) | 3 (15.8%) |
| 1 or 2 Children | 0 (0.0%) | 57 (86.4%) |
| 3 or 4 Children | 0 (0.0%) | 6 (100.0%) |
| 5 or more Children | 0 (0.0%) | 0 (0.0%) |
| Total | 5 (2.8%) | 66 (72.5%) |
Race in Kilmarnock
The most populous races in Kilmarnock are White / Caucasian (910 | 70.9%), Black / African American (326 | 25.4%), and Two or more Races (29 | 2.3%).
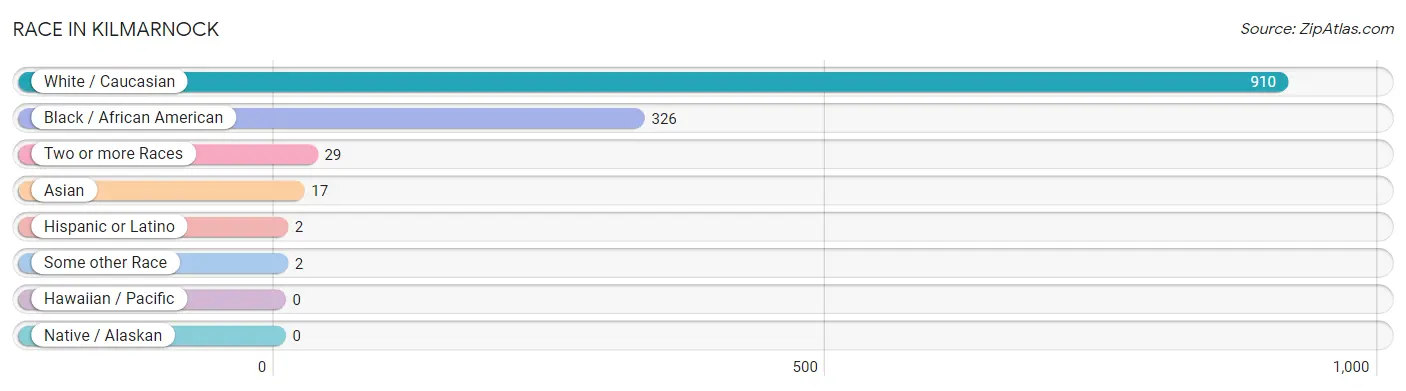
| Race | # Population | % Population |
| Asian | 17 | 1.3% |
| Black / African American | 326 | 25.4% |
| Hawaiian / Pacific | 0 | 0.0% |
| Hispanic or Latino | 2 | 0.2% |
| Native / Alaskan | 0 | 0.0% |
| White / Caucasian | 910 | 70.9% |
| Two or more Races | 29 | 2.3% |
| Some other Race | 2 | 0.2% |
| Total | 1,284 | 100.0% |
Ancestry in Kilmarnock
The most populous ancestries reported in Kilmarnock are American (230 | 17.9%), English (122 | 9.5%), German (122 | 9.5%), Irish (65 | 5.1%), and Subsaharan African (42 | 3.3%), together accounting for 45.2% of all Kilmarnock residents.
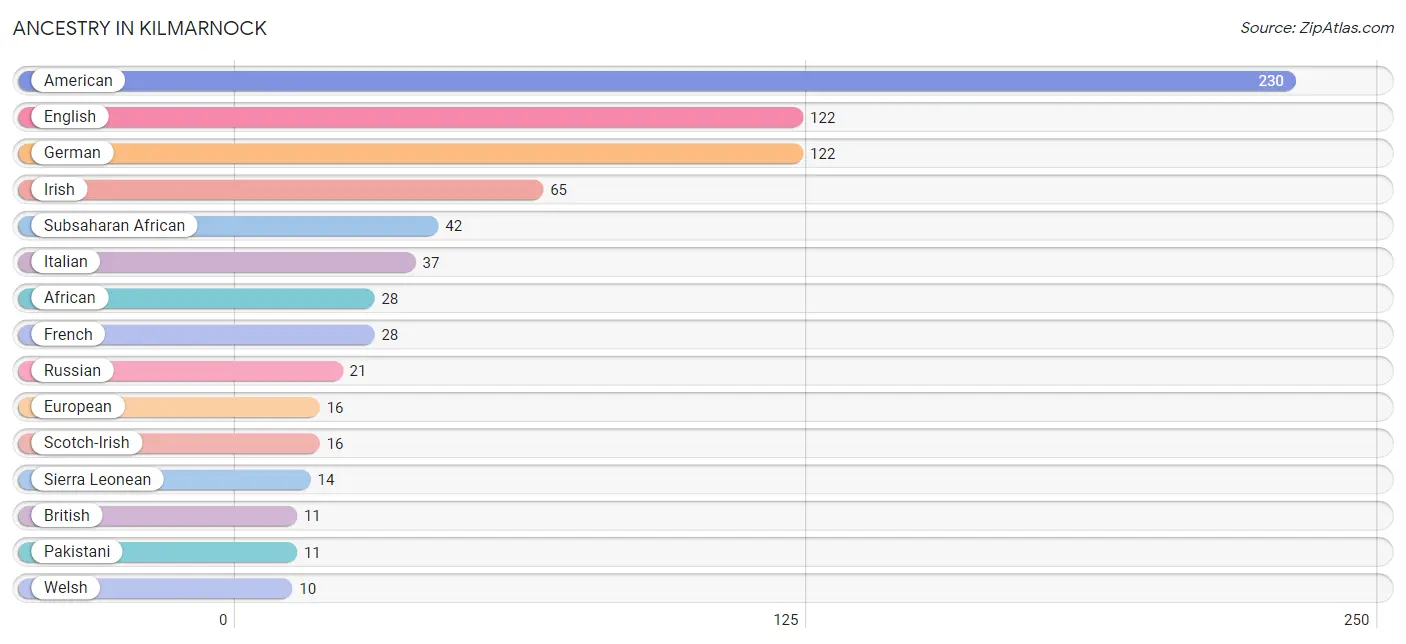
| Ancestry | # Population | % Population |
| African | 28 | 2.2% |
| American | 230 | 17.9% |
| Armenian | 5 | 0.4% |
| British | 11 | 0.9% |
| Burmese | 3 | 0.2% |
| Chickasaw | 5 | 0.4% |
| Danish | 3 | 0.2% |
| Dutch | 6 | 0.5% |
| Eastern European | 4 | 0.3% |
| English | 122 | 9.5% |
| European | 16 | 1.3% |
| French | 28 | 2.2% |
| French Canadian | 3 | 0.2% |
| German | 122 | 9.5% |
| Greek | 3 | 0.2% |
| Irish | 65 | 5.1% |
| Italian | 37 | 2.9% |
| Mexican | 2 | 0.2% |
| Northern European | 3 | 0.2% |
| Norwegian | 7 | 0.5% |
| Pakistani | 11 | 0.9% |
| Polish | 6 | 0.5% |
| Russian | 21 | 1.6% |
| Scandinavian | 4 | 0.3% |
| Scotch-Irish | 16 | 1.3% |
| Scottish | 5 | 0.4% |
| Sierra Leonean | 14 | 1.1% |
| Slovak | 2 | 0.2% |
| Subsaharan African | 42 | 3.3% |
| Swedish | 9 | 0.7% |
| Swiss | 3 | 0.2% |
| Thai | 3 | 0.2% |
| Welsh | 10 | 0.8% | View All 33 Rows |
Immigrants in Kilmarnock
The most numerous immigrant groups reported in Kilmarnock came from Asia (48 | 3.7%), South Central Asia (28 | 2.2%), Europe (16 | 1.3%), Africa (14 | 1.1%), and Eastern Europe (14 | 1.1%), together accounting for 9.3% of all Kilmarnock residents.
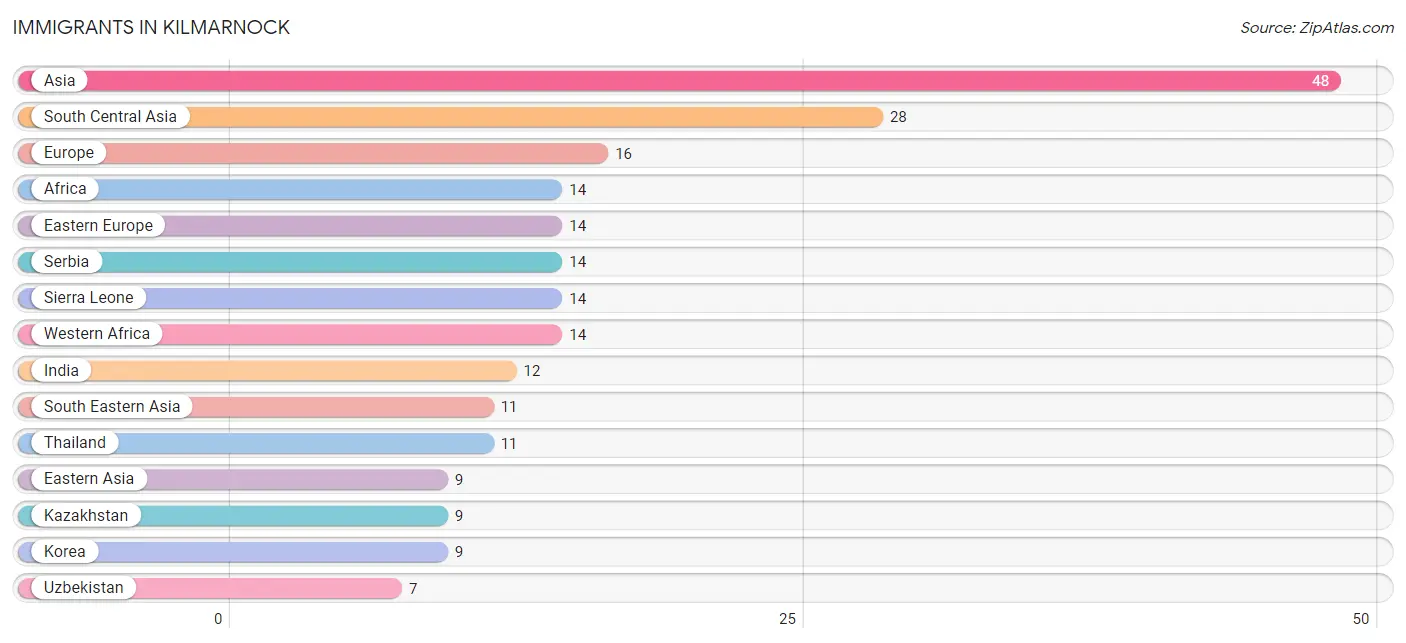
| Immigration Origin | # Population | % Population |
| Africa | 14 | 1.1% |
| Asia | 48 | 3.7% |
| Canada | 3 | 0.2% |
| Eastern Asia | 9 | 0.7% |
| Eastern Europe | 14 | 1.1% |
| England | 2 | 0.2% |
| Europe | 16 | 1.3% |
| India | 12 | 0.9% |
| Kazakhstan | 9 | 0.7% |
| Korea | 9 | 0.7% |
| Northern Europe | 2 | 0.2% |
| Serbia | 14 | 1.1% |
| Sierra Leone | 14 | 1.1% |
| South Central Asia | 28 | 2.2% |
| South Eastern Asia | 11 | 0.9% |
| Thailand | 11 | 0.9% |
| Uzbekistan | 7 | 0.5% |
| Western Africa | 14 | 1.1% | View All 18 Rows |
Sex and Age in Kilmarnock
Sex and Age in Kilmarnock
The most populous age groups in Kilmarnock are 70 to 74 Years (85 | 16.4%) for men and 85 Years and over (91 | 11.9%) for women.
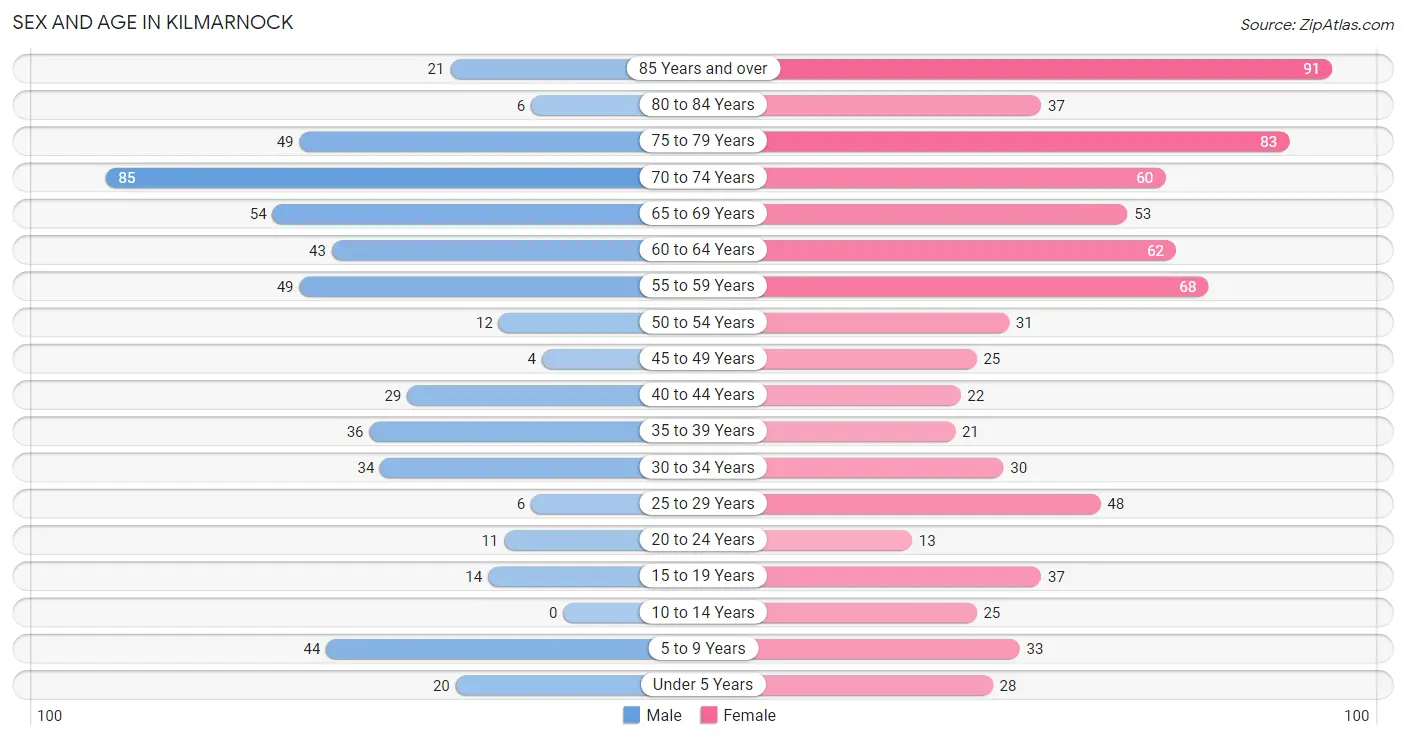
| Age Bracket | Male | Female |
| Under 5 Years | 20 (3.9%) | 28 (3.6%) |
| 5 to 9 Years | 44 (8.5%) | 33 (4.3%) |
| 10 to 14 Years | 0 (0.0%) | 25 (3.3%) |
| 15 to 19 Years | 14 (2.7%) | 37 (4.8%) |
| 20 to 24 Years | 11 (2.1%) | 13 (1.7%) |
| 25 to 29 Years | 6 (1.2%) | 48 (6.3%) |
| 30 to 34 Years | 34 (6.6%) | 30 (3.9%) |
| 35 to 39 Years | 36 (7.0%) | 21 (2.7%) |
| 40 to 44 Years | 29 (5.6%) | 22 (2.9%) |
| 45 to 49 Years | 4 (0.8%) | 25 (3.3%) |
| 50 to 54 Years | 12 (2.3%) | 31 (4.0%) |
| 55 to 59 Years | 49 (9.5%) | 68 (8.9%) |
| 60 to 64 Years | 43 (8.3%) | 62 (8.1%) |
| 65 to 69 Years | 54 (10.4%) | 53 (6.9%) |
| 70 to 74 Years | 85 (16.4%) | 60 (7.8%) |
| 75 to 79 Years | 49 (9.5%) | 83 (10.8%) |
| 80 to 84 Years | 6 (1.2%) | 37 (4.8%) |
| 85 Years and over | 21 (4.1%) | 91 (11.9%) |
| Total | 517 (100.0%) | 767 (100.0%) |
Families and Households in Kilmarnock
Median Family Size in Kilmarnock
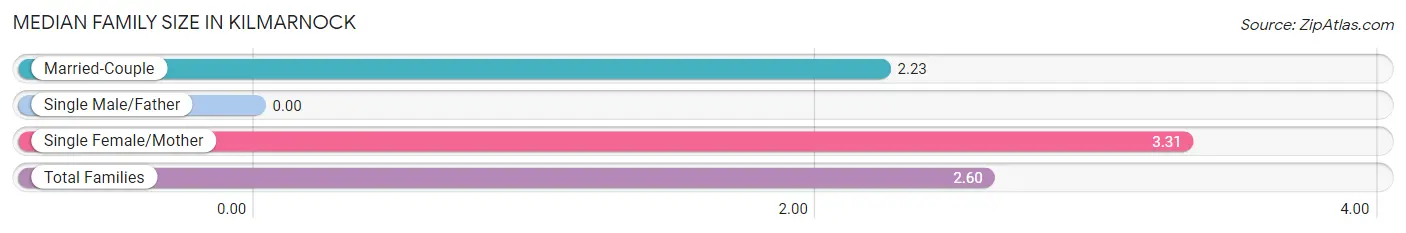
| Family Type | # Families | Family Size |
| Married-Couple | 177 (66.0%) | 2.23 |
| Single Male/Father | 0 (0.0%) | - |
| Single Female/Mother | 91 (34.0%) | 3.31 |
| Total Families | 268 (100.0%) | 2.60 |
Median Household Size in Kilmarnock
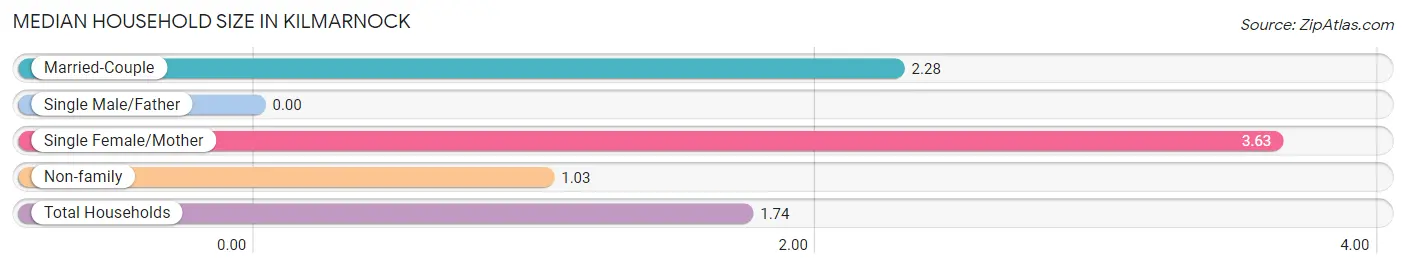
| Household Type | # Households | Household Size |
| Married-Couple | 177 (27.4%) | 2.28 |
| Single Male/Father | 0 (0.0%) | - |
| Single Female/Mother | 91 (14.1%) | 3.63 |
| Non-family | 377 (58.5%) | 1.03 |
| Total Households | 645 (100.0%) | 1.74 |
Household Size by Marriage Status in Kilmarnock
Out of a total of 645 households in Kilmarnock, 268 (41.5%) are family households, while 377 (58.5%) are nonfamily households. The most numerous type of family households are 2-person households, comprising 174, and the most common type of nonfamily households are 1-person households, comprising 365.
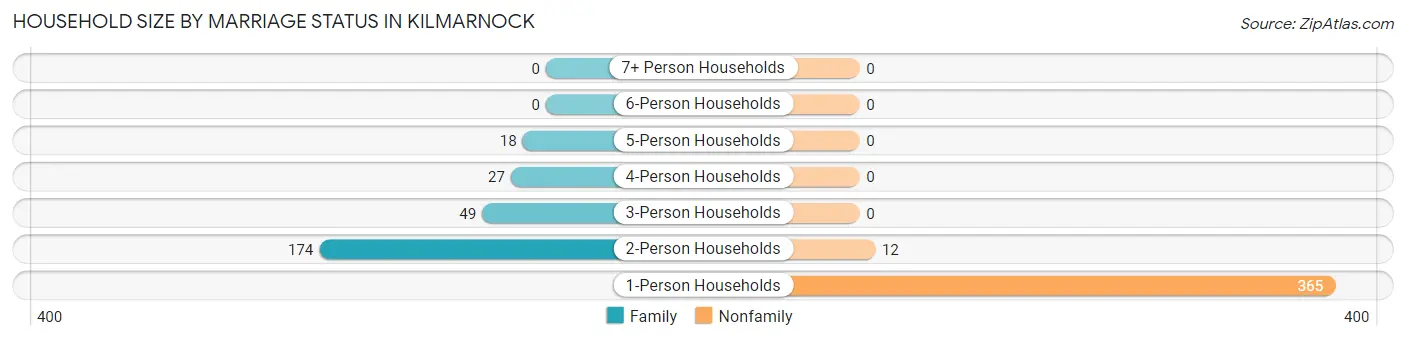
| Household Size | Family Households | Nonfamily Households |
| 1-Person Households | - | 365 (56.6%) |
| 2-Person Households | 174 (27.0%) | 12 (1.9%) |
| 3-Person Households | 49 (7.6%) | 0 (0.0%) |
| 4-Person Households | 27 (4.2%) | 0 (0.0%) |
| 5-Person Households | 18 (2.8%) | 0 (0.0%) |
| 6-Person Households | 0 (0.0%) | 0 (0.0%) |
| 7+ Person Households | 0 (0.0%) | 0 (0.0%) |
| Total | 268 (41.5%) | 377 (58.5%) |
Female Fertility in Kilmarnock
Fertility by Age in Kilmarnock
| Age Bracket | Women with Births | Births / 1,000 Women |
| 15 to 19 years | 0 (0.0%) | 0.0 |
| 20 to 34 years | 0 (0.0%) | 0.0 |
| 35 to 50 years | 0 (0.0%) | 0.0 |
| Total | 0 (0.0%) | 0.0 |
Fertility by Age by Marriage Status in Kilmarnock
| Age Bracket | Married | Unmarried |
| 15 to 19 years | 0 (0.0%) | 0 (0.0%) |
| 20 to 34 years | 0 (0.0%) | 0 (0.0%) |
| 35 to 50 years | 0 (0.0%) | 0 (0.0%) |
| Total | 0 (0.0%) | 0 (0.0%) |
Fertility by Education in Kilmarnock
| Educational Attainment | Women with Births | Births / 1,000 Women |
| Less than High School | 0 (0.0%) | 0.0 |
| High School Diploma | 0 (0.0%) | 0.0 |
| College or Associate's Degree | 0 (0.0%) | 0.0 |
| Bachelor's Degree | 0 (0.0%) | 0.0 |
| Graduate Degree | 0 (0.0%) | 0.0 |
| Total | 0 (0.0%) | 0.0 |
Fertility by Education by Marriage Status in Kilmarnock
| Educational Attainment | Married | Unmarried |
| Less than High School | 0 (0.0%) | 0 (0.0%) |
| High School Diploma | 0 (0.0%) | 0 (0.0%) |
| College or Associate's Degree | 0 (0.0%) | 0 (0.0%) |
| Bachelor's Degree | 0 (0.0%) | 0 (0.0%) |
| Graduate Degree | 0 (0.0%) | 0 (0.0%) |
| Total | 0 (0.0%) | 0 (0.0%) |
Employment Characteristics in Kilmarnock
Employment by Class of Employer in Kilmarnock
Among the 417 employed individuals in Kilmarnock, private company employees (260 | 62.4%), local government employees (48 | 11.5%), and not-for-profit organizations (35 | 8.4%) make up the most common classes of employment.
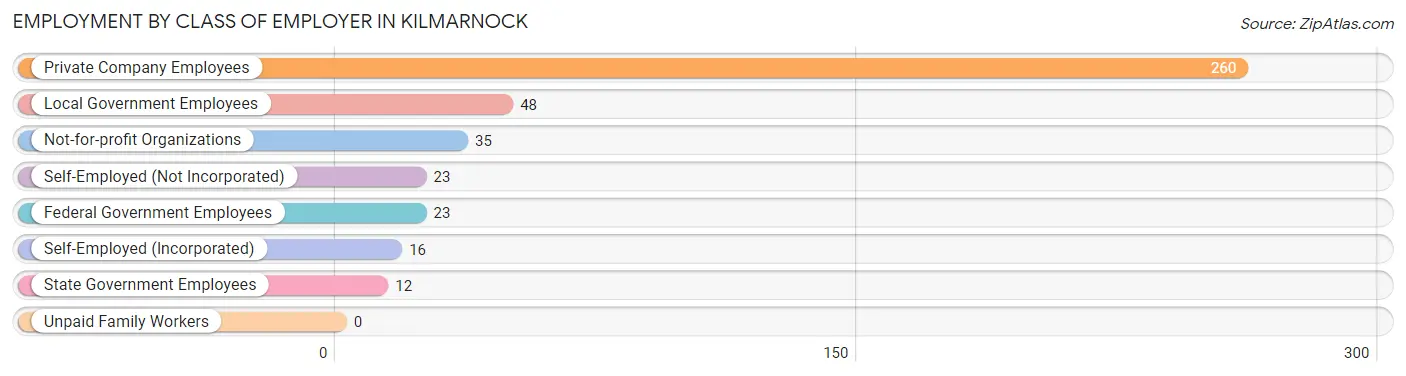
| Employer Class | # Employees | % Employees |
| Private Company Employees | 260 | 62.4% |
| Self-Employed (Incorporated) | 16 | 3.8% |
| Self-Employed (Not Incorporated) | 23 | 5.5% |
| Not-for-profit Organizations | 35 | 8.4% |
| Local Government Employees | 48 | 11.5% |
| State Government Employees | 12 | 2.9% |
| Federal Government Employees | 23 | 5.5% |
| Unpaid Family Workers | 0 | 0.0% |
| Total | 417 | 100.0% |
Employment Status by Age in Kilmarnock
According to the labor force statistics for Kilmarnock, out of the total population over 16 years of age (1,127), 39.4% or 444 individuals are in the labor force, with 5.6% or 25 of them unemployed. The age group with the highest labor force participation rate is 20 to 24 years, with 100.0% or 24 individuals in the labor force. Within the labor force, the 16 to 19 years age range has the highest percentage of unemployed individuals, with 69.0% or 20 of them being unemployed.
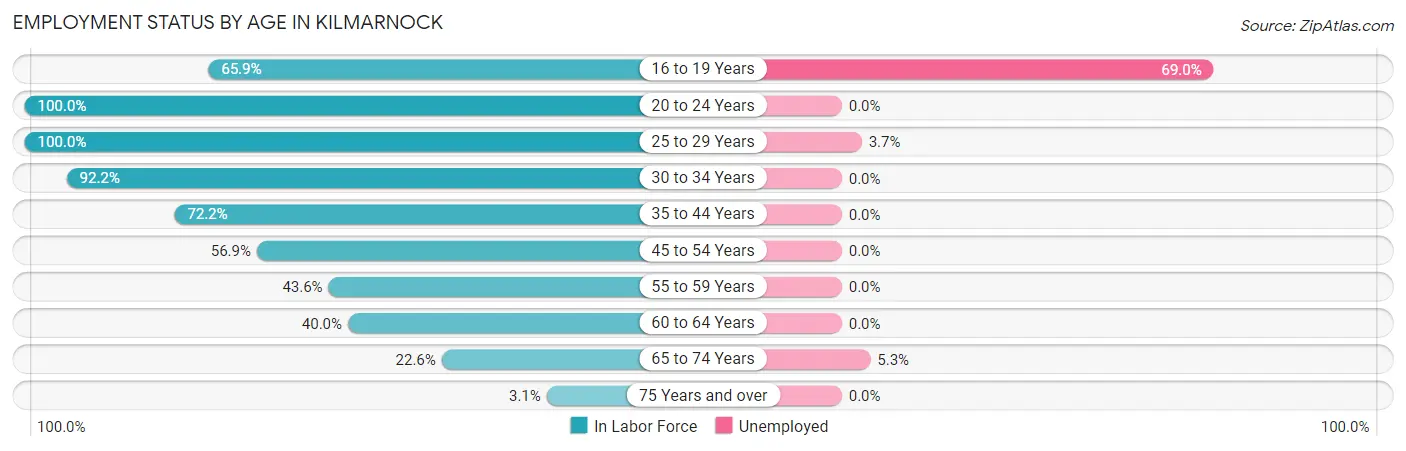
| Age Bracket | In Labor Force | Unemployed |
| 16 to 19 Years | 29 (65.9%) | 20 (69.0%) |
| 20 to 24 Years | 24 (100.0%) | 0 (0.0%) |
| 25 to 29 Years | 54 (100.0%) | 2 (3.7%) |
| 30 to 34 Years | 59 (92.2%) | 0 (0.0%) |
| 35 to 44 Years | 78 (72.2%) | 0 (0.0%) |
| 45 to 54 Years | 41 (56.9%) | 0 (0.0%) |
| 55 to 59 Years | 51 (43.6%) | 0 (0.0%) |
| 60 to 64 Years | 42 (40.0%) | 0 (0.0%) |
| 65 to 74 Years | 57 (22.6%) | 3 (5.3%) |
| 75 Years and over | 9 (3.1%) | 0 (0.0%) |
| Total | 444 (39.4%) | 25 (5.6%) |
Employment Status by Educational Attainment in Kilmarnock
According to labor force statistics for Kilmarnock, 62.5% of individuals (325) out of the total population between 25 and 64 years of age (520) are in the labor force, with 0.6% or 2 of them being unemployed. The group with the highest labor force participation rate are those with the educational attainment of high school diploma, with 72.8% or 139 individuals in the labor force. Within the labor force, individuals with high school diploma education have the highest percentage of unemployment, with 1.4% or 2 of them being unemployed.
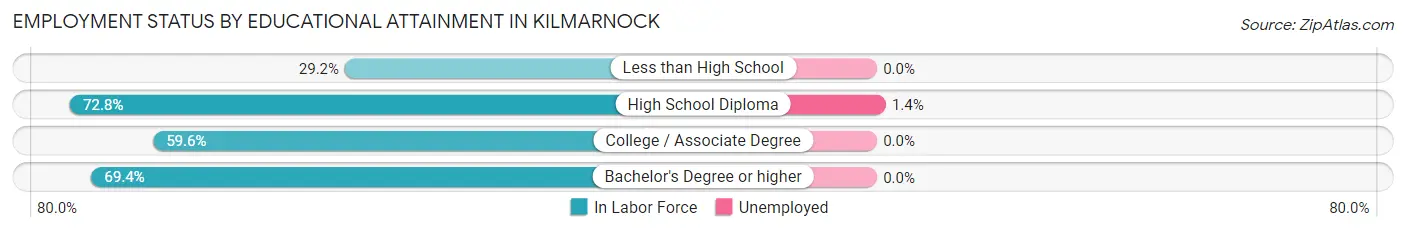
| Educational Attainment | In Labor Force | Unemployed |
| Less than High School | 19 (29.2%) | 0 (0.0%) |
| High School Diploma | 139 (72.8%) | 3 (1.4%) |
| College / Associate Degree | 99 (59.6%) | 0 (0.0%) |
| Bachelor's Degree or higher | 68 (69.4%) | 0 (0.0%) |
| Total | 325 (62.5%) | 3 (0.6%) |
Employment Occupations by Sex in Kilmarnock
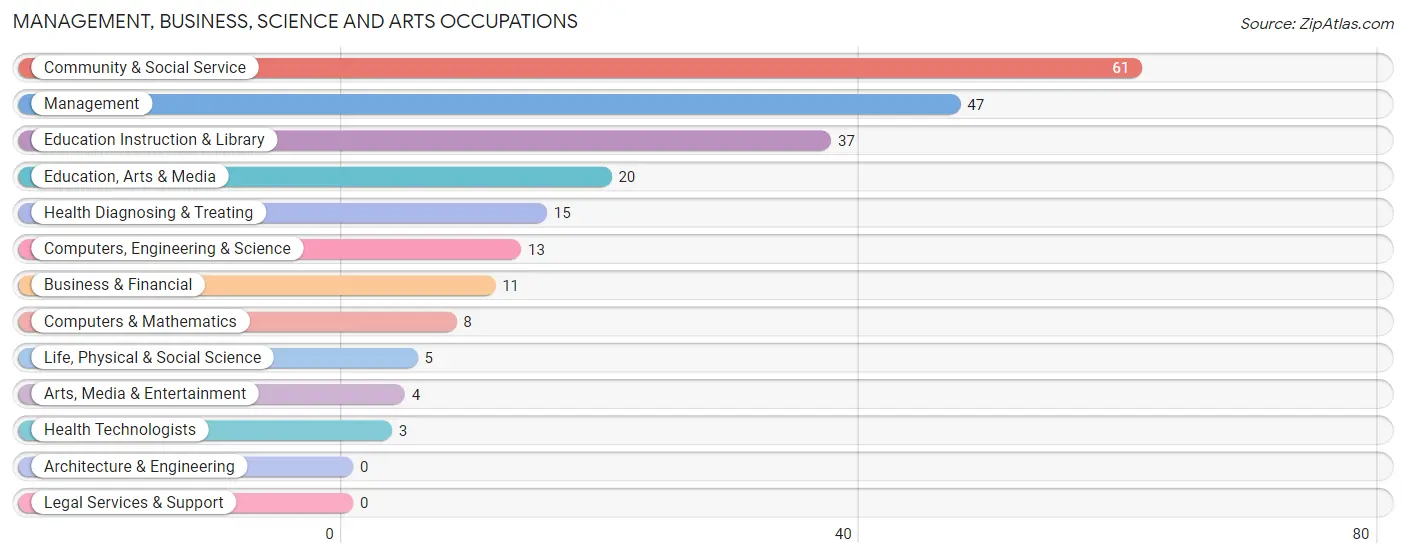
Management, Business, Science and Arts Occupations
The most common Management, Business, Science and Arts occupations in Kilmarnock are Community & Social Service (61 | 14.6%), Management (47 | 11.2%), Education Instruction & Library (37 | 8.8%), Education, Arts & Media (20 | 4.8%), and Health Diagnosing & Treating (15 | 3.6%).
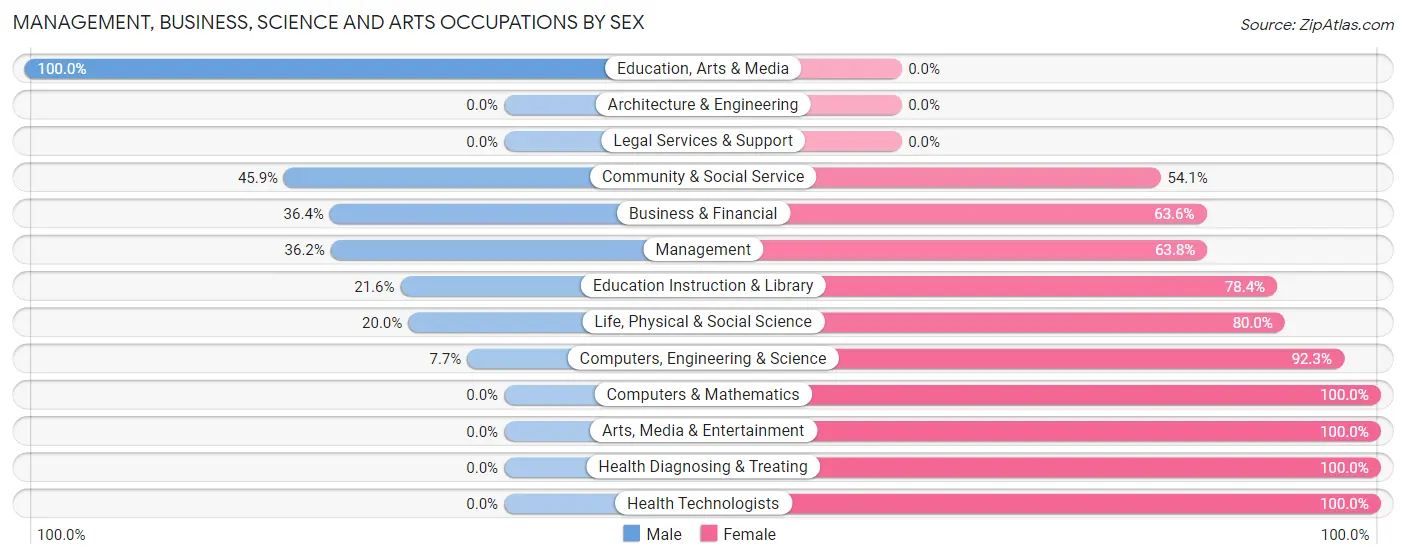
Management, Business, Science and Arts Occupations by Sex
Within the Management, Business, Science and Arts occupations in Kilmarnock, the most male-oriented occupations are Education, Arts & Media (100.0%), Community & Social Service (45.9%), and Business & Financial (36.4%), while the most female-oriented occupations are Computers & Mathematics (100.0%), Arts, Media & Entertainment (100.0%), and Health Diagnosing & Treating (100.0%).
| Occupation | Male | Female |
| Management | 17 (36.2%) | 30 (63.8%) |
| Business & Financial | 4 (36.4%) | 7 (63.6%) |
| Computers, Engineering & Science | 1 (7.7%) | 12 (92.3%) |
| Computers & Mathematics | 0 (0.0%) | 8 (100.0%) |
| Architecture & Engineering | 0 (0.0%) | 0 (0.0%) |
| Life, Physical & Social Science | 1 (20.0%) | 4 (80.0%) |
| Community & Social Service | 28 (45.9%) | 33 (54.1%) |
| Education, Arts & Media | 20 (100.0%) | 0 (0.0%) |
| Legal Services & Support | 0 (0.0%) | 0 (0.0%) |
| Education Instruction & Library | 8 (21.6%) | 29 (78.4%) |
| Arts, Media & Entertainment | 0 (0.0%) | 4 (100.0%) |
| Health Diagnosing & Treating | 0 (0.0%) | 15 (100.0%) |
| Health Technologists | 0 (0.0%) | 3 (100.0%) |
| Total (Category) | 50 (34.0%) | 97 (66.0%) |
| Total (Overall) | 192 (45.8%) | 227 (54.2%) |
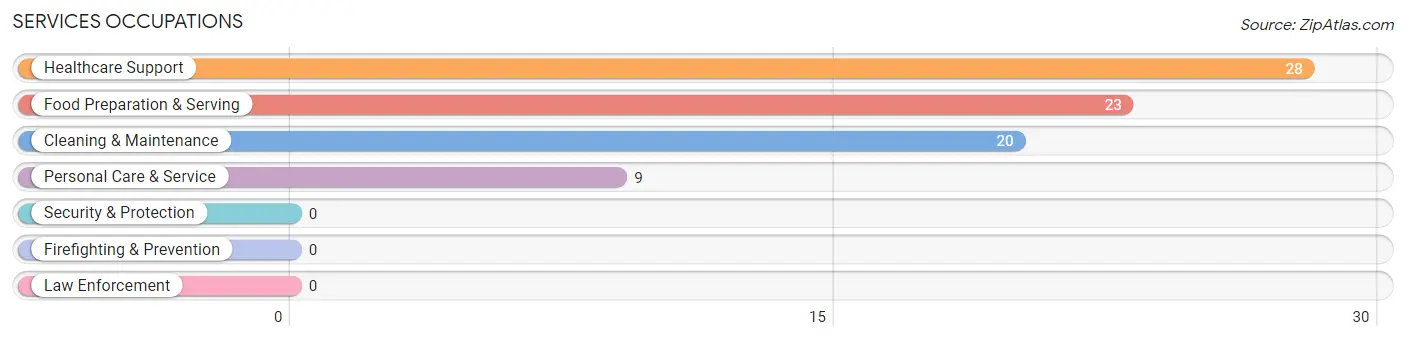
Services Occupations
The most common Services occupations in Kilmarnock are Healthcare Support (28 | 6.7%), Food Preparation & Serving (23 | 5.5%), Cleaning & Maintenance (20 | 4.8%), and Personal Care & Service (9 | 2.1%).
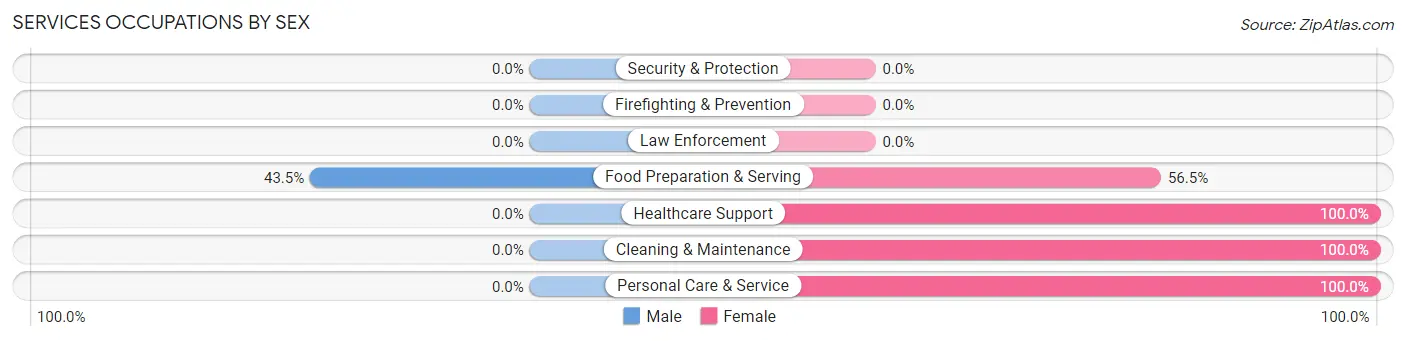
Services Occupations by Sex
| Occupation | Male | Female |
| Healthcare Support | 0 (0.0%) | 28 (100.0%) |
| Security & Protection | 0 (0.0%) | 0 (0.0%) |
| Firefighting & Prevention | 0 (0.0%) | 0 (0.0%) |
| Law Enforcement | 0 (0.0%) | 0 (0.0%) |
| Food Preparation & Serving | 10 (43.5%) | 13 (56.5%) |
| Cleaning & Maintenance | 0 (0.0%) | 20 (100.0%) |
| Personal Care & Service | 0 (0.0%) | 9 (100.0%) |
| Total (Category) | 10 (12.5%) | 70 (87.5%) |
| Total (Overall) | 192 (45.8%) | 227 (54.2%) |
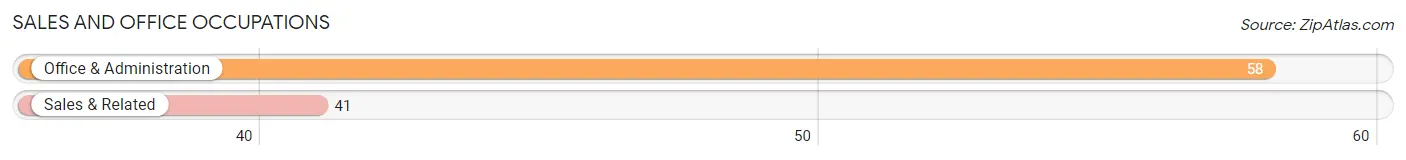
Sales and Office Occupations
The most common Sales and Office occupations in Kilmarnock are Office & Administration (58 | 13.8%), and Sales & Related (41 | 9.8%).
Sales and Office Occupations by Sex
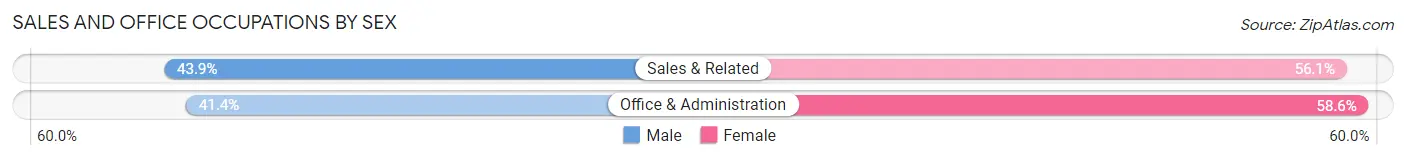
| Occupation | Male | Female |
| Sales & Related | 18 (43.9%) | 23 (56.1%) |
| Office & Administration | 24 (41.4%) | 34 (58.6%) |
| Total (Category) | 42 (42.4%) | 57 (57.6%) |
| Total (Overall) | 192 (45.8%) | 227 (54.2%) |
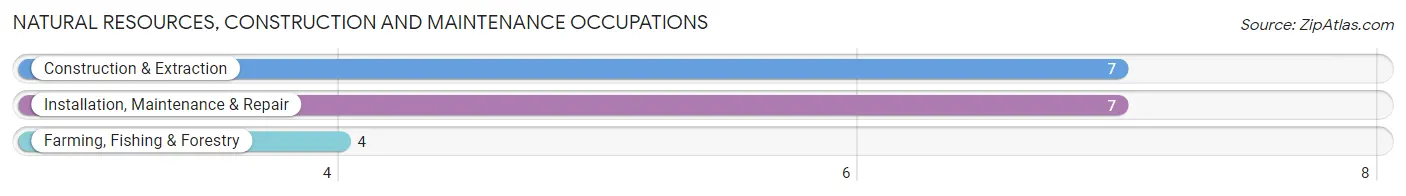
Natural Resources, Construction and Maintenance Occupations
The most common Natural Resources, Construction and Maintenance occupations in Kilmarnock are Construction & Extraction (7 | 1.7%), Installation, Maintenance & Repair (7 | 1.7%), and Farming, Fishing & Forestry (4 | 0.9%).
Natural Resources, Construction and Maintenance Occupations by Sex
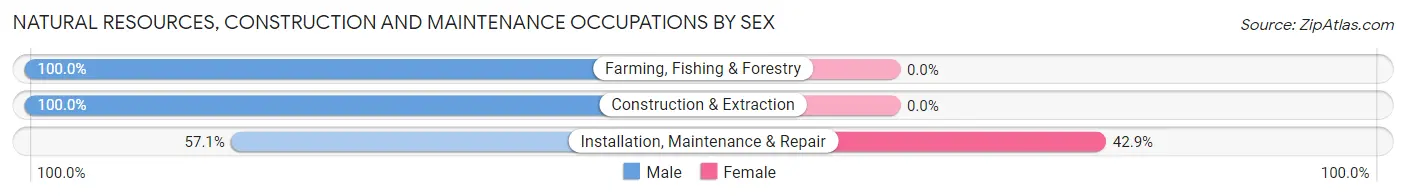
| Occupation | Male | Female |
| Farming, Fishing & Forestry | 4 (100.0%) | 0 (0.0%) |
| Construction & Extraction | 7 (100.0%) | 0 (0.0%) |
| Installation, Maintenance & Repair | 4 (57.1%) | 3 (42.9%) |
| Total (Category) | 15 (83.3%) | 3 (16.7%) |
| Total (Overall) | 192 (45.8%) | 227 (54.2%) |
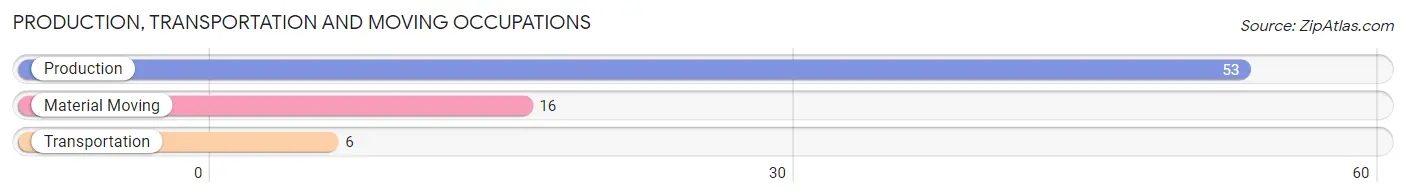
Production, Transportation and Moving Occupations
The most common Production, Transportation and Moving occupations in Kilmarnock are Production (53 | 12.7%), Material Moving (16 | 3.8%), and Transportation (6 | 1.4%).
Production, Transportation and Moving Occupations by Sex
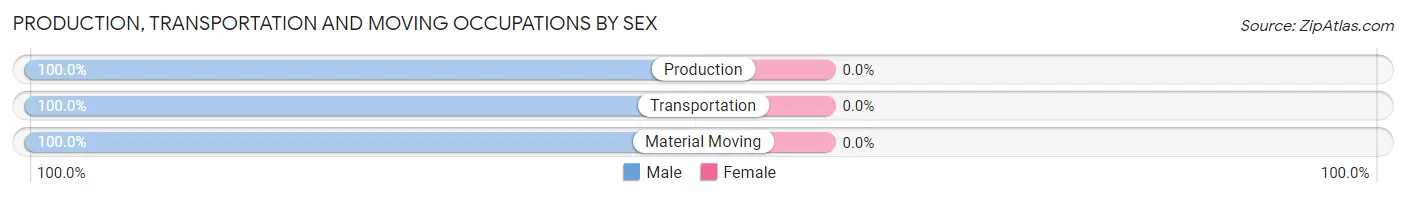
| Occupation | Male | Female |
| Production | 53 (100.0%) | 0 (0.0%) |
| Transportation | 6 (100.0%) | 0 (0.0%) |
| Material Moving | 16 (100.0%) | 0 (0.0%) |
| Total (Category) | 75 (100.0%) | 0 (0.0%) |
| Total (Overall) | 192 (45.8%) | 227 (54.2%) |
Employment Industries by Sex in Kilmarnock
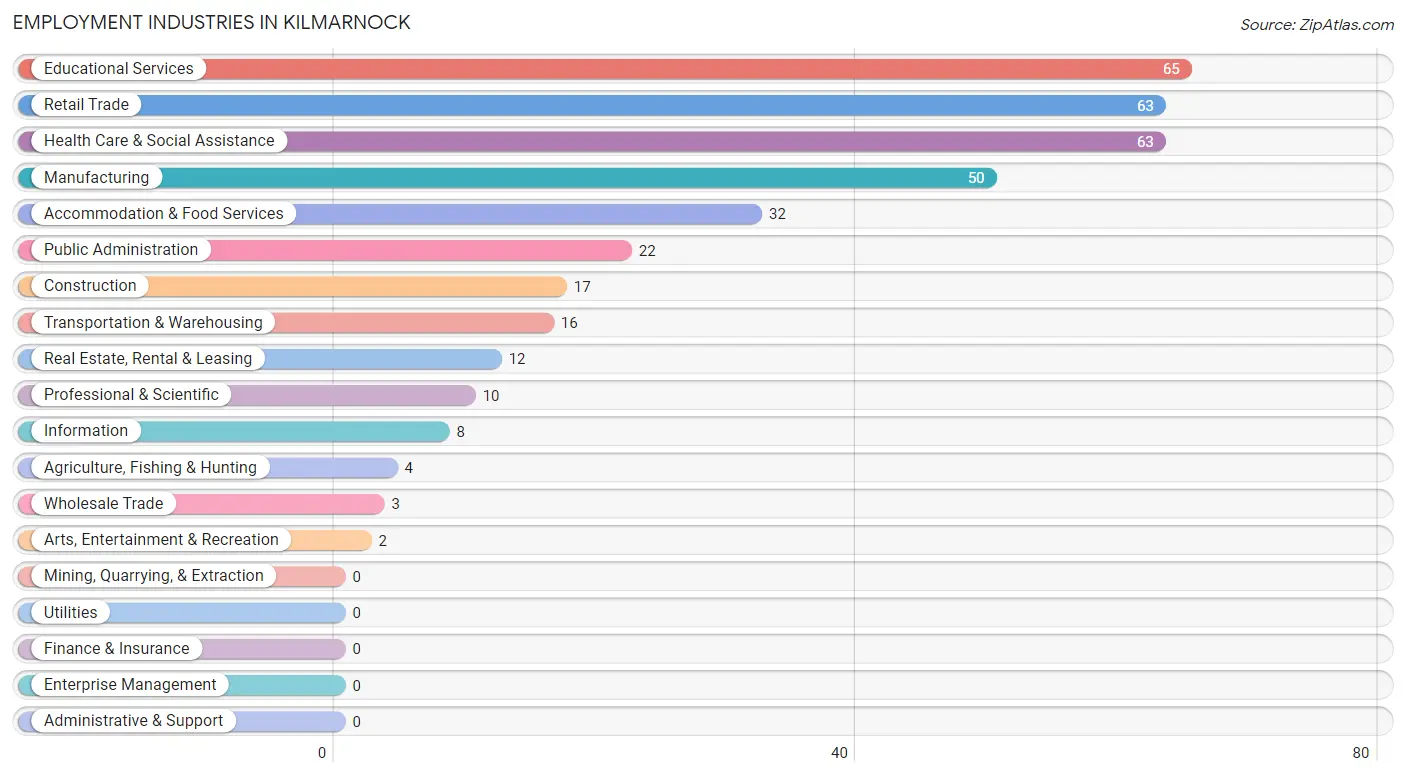
Employment Industries in Kilmarnock
The major employment industries in Kilmarnock include Educational Services (65 | 15.5%), Retail Trade (63 | 15.0%), Health Care & Social Assistance (63 | 15.0%), Manufacturing (50 | 11.9%), and Accommodation & Food Services (32 | 7.6%).
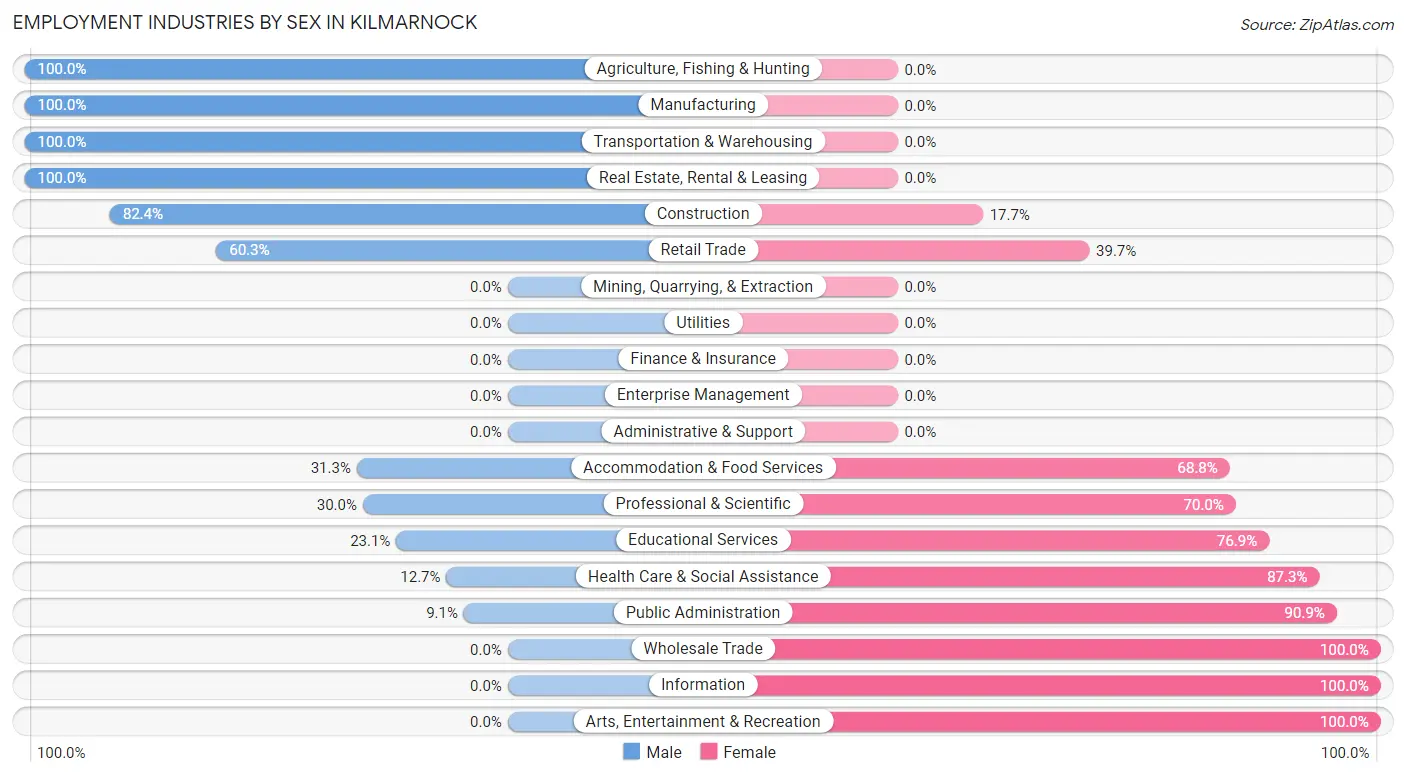
Employment Industries by Sex in Kilmarnock
The Kilmarnock industries that see more men than women are Agriculture, Fishing & Hunting (100.0%), Manufacturing (100.0%), and Transportation & Warehousing (100.0%), whereas the industries that tend to have a higher number of women are Wholesale Trade (100.0%), Information (100.0%), and Arts, Entertainment & Recreation (100.0%).
| Industry | Male | Female |
| Agriculture, Fishing & Hunting | 4 (100.0%) | 0 (0.0%) |
| Mining, Quarrying, & Extraction | 0 (0.0%) | 0 (0.0%) |
| Construction | 14 (82.4%) | 3 (17.6%) |
| Manufacturing | 50 (100.0%) | 0 (0.0%) |
| Wholesale Trade | 0 (0.0%) | 3 (100.0%) |
| Retail Trade | 38 (60.3%) | 25 (39.7%) |
| Transportation & Warehousing | 16 (100.0%) | 0 (0.0%) |
| Utilities | 0 (0.0%) | 0 (0.0%) |
| Information | 0 (0.0%) | 8 (100.0%) |
| Finance & Insurance | 0 (0.0%) | 0 (0.0%) |
| Real Estate, Rental & Leasing | 12 (100.0%) | 0 (0.0%) |
| Professional & Scientific | 3 (30.0%) | 7 (70.0%) |
| Enterprise Management | 0 (0.0%) | 0 (0.0%) |
| Administrative & Support | 0 (0.0%) | 0 (0.0%) |
| Educational Services | 15 (23.1%) | 50 (76.9%) |
| Health Care & Social Assistance | 8 (12.7%) | 55 (87.3%) |
| Arts, Entertainment & Recreation | 0 (0.0%) | 2 (100.0%) |
| Accommodation & Food Services | 10 (31.2%) | 22 (68.8%) |
| Public Administration | 2 (9.1%) | 20 (90.9%) |
| Total | 192 (45.8%) | 227 (54.2%) |
Education in Kilmarnock
School Enrollment in Kilmarnock
The most common levels of schooling among the 198 students in Kilmarnock are elementary school (55 | 27.8%), high school (50 | 25.3%), and college / undergraduate (42 | 21.2%).
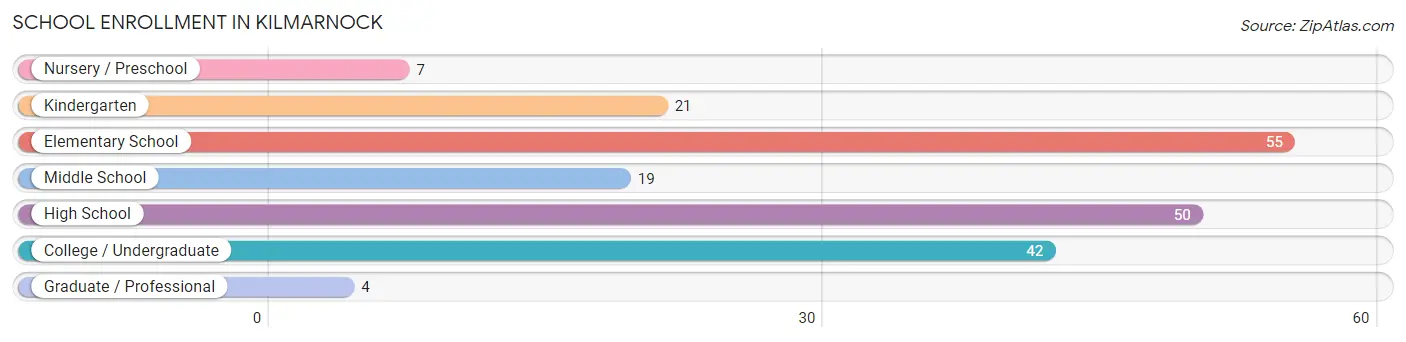
| School Level | # Students | % Students |
| Nursery / Preschool | 7 | 3.5% |
| Kindergarten | 21 | 10.6% |
| Elementary School | 55 | 27.8% |
| Middle School | 19 | 9.6% |
| High School | 50 | 25.3% |
| College / Undergraduate | 42 | 21.2% |
| Graduate / Professional | 4 | 2.0% |
| Total | 198 | 100.0% |
School Enrollment by Age by Funding Source in Kilmarnock
Out of a total of 198 students who are enrolled in schools in Kilmarnock, 39 (19.7%) attend a private institution, while the remaining 159 (80.3%) are enrolled in public schools. The age group of 3 to 4 year olds has the highest likelihood of being enrolled in private schools, with 6 (100.0% in the age bracket) enrolled. Conversely, the age group of 10 to 14 year olds has the lowest likelihood of being enrolled in a private school, with 25 (100.0% in the age bracket) attending a public institution.
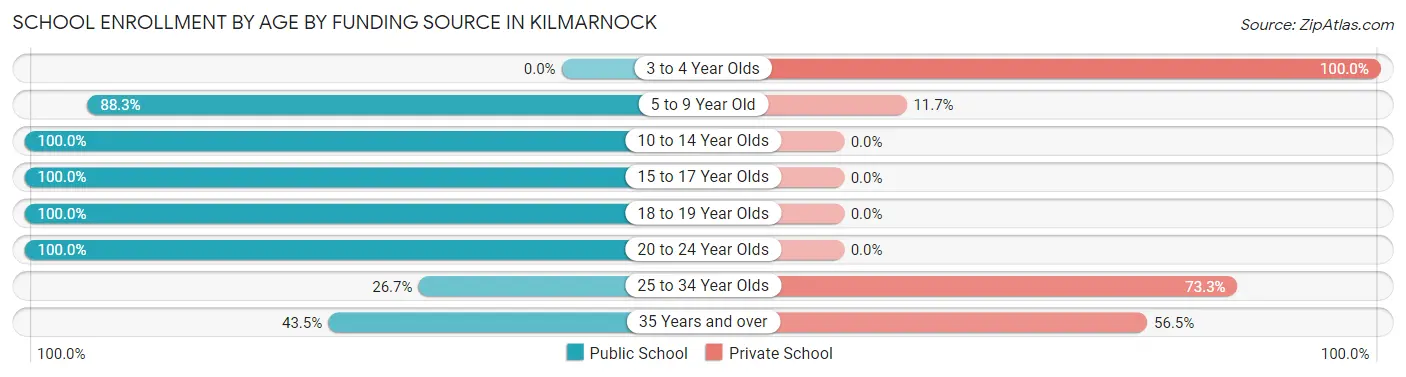
| Age Bracket | Public School | Private School |
| 3 to 4 Year Olds | 0 (0.0%) | 6 (100.0%) |
| 5 to 9 Year Old | 68 (88.3%) | 9 (11.7%) |
| 10 to 14 Year Olds | 25 (100.0%) | 0 (0.0%) |
| 15 to 17 Year Olds | 28 (100.0%) | 0 (0.0%) |
| 18 to 19 Year Olds | 16 (100.0%) | 0 (0.0%) |
| 20 to 24 Year Olds | 8 (100.0%) | 0 (0.0%) |
| 25 to 34 Year Olds | 4 (26.7%) | 11 (73.3%) |
| 35 Years and over | 10 (43.5%) | 13 (56.5%) |
| Total | 159 (80.3%) | 39 (19.7%) |
Educational Attainment by Field of Study in Kilmarnock
Education (62 | 24.0%), business (57 | 22.1%), liberal arts & history (24 | 9.3%), psychology (19 | 7.4%), and social sciences (18 | 7.0%) are the most common fields of study among 258 individuals in Kilmarnock who have obtained a bachelor's degree or higher.
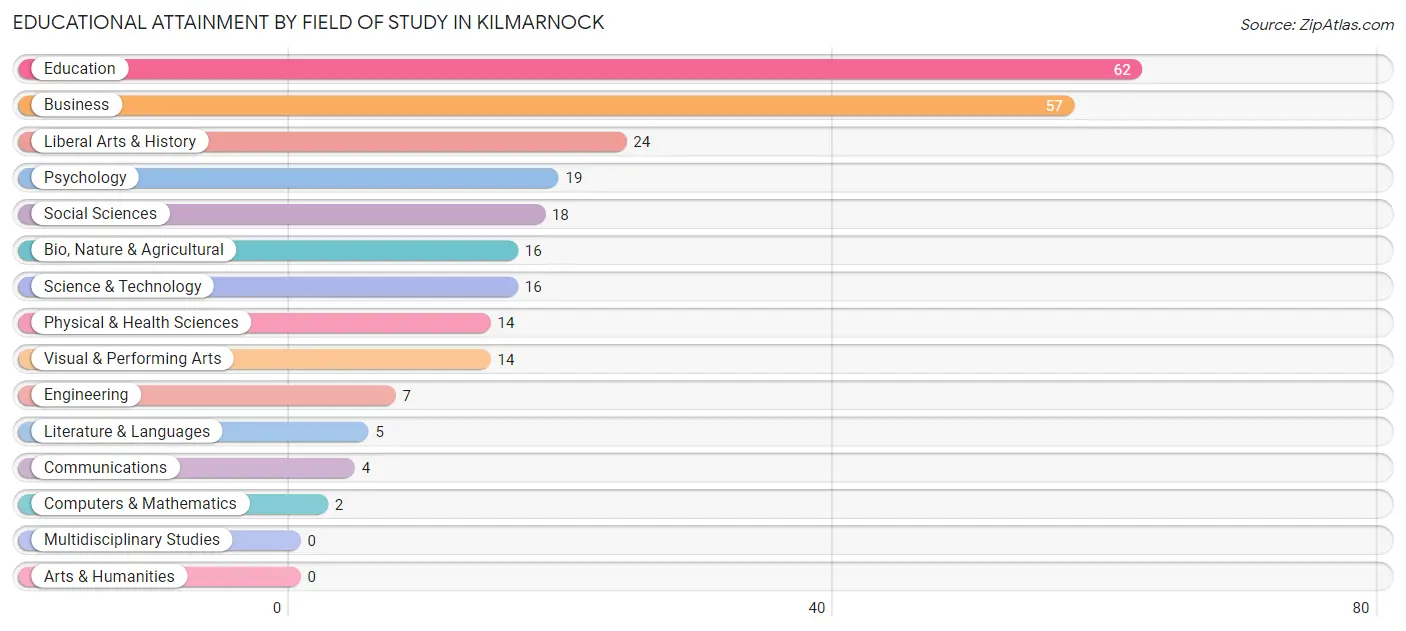
| Field of Study | # Graduates | % Graduates |
| Computers & Mathematics | 2 | 0.8% |
| Bio, Nature & Agricultural | 16 | 6.2% |
| Physical & Health Sciences | 14 | 5.4% |
| Psychology | 19 | 7.4% |
| Social Sciences | 18 | 7.0% |
| Engineering | 7 | 2.7% |
| Multidisciplinary Studies | 0 | 0.0% |
| Science & Technology | 16 | 6.2% |
| Business | 57 | 22.1% |
| Education | 62 | 24.0% |
| Literature & Languages | 5 | 1.9% |
| Liberal Arts & History | 24 | 9.3% |
| Visual & Performing Arts | 14 | 5.4% |
| Communications | 4 | 1.5% |
| Arts & Humanities | 0 | 0.0% |
| Total | 258 | 100.0% |
Transportation & Commute in Kilmarnock
Vehicle Availability by Sex in Kilmarnock
The most prevalent vehicle ownership categories in Kilmarnock are males with 2 vehicles (77, accounting for 40.5%) and females with 2 vehicles (83, making up 33.9%).
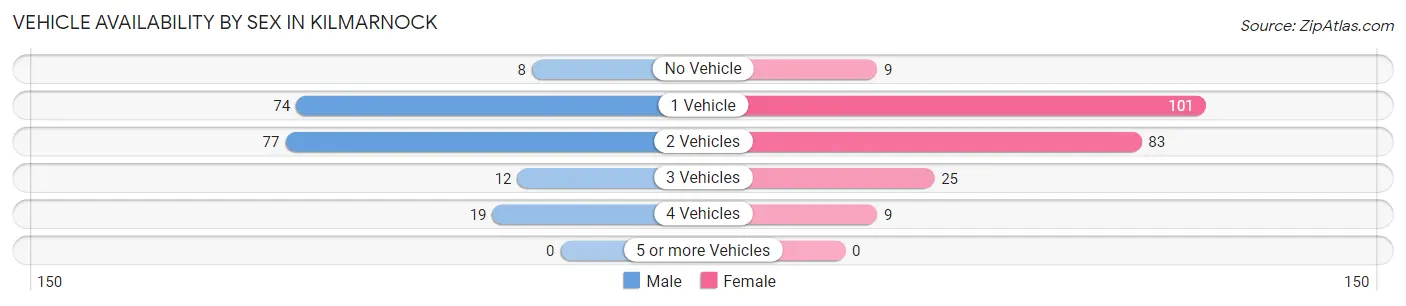
| Vehicles Available | Male | Female |
| No Vehicle | 8 (4.2%) | 9 (4.0%) |
| 1 Vehicle | 74 (39.0%) | 101 (44.5%) |
| 2 Vehicles | 77 (40.5%) | 83 (36.6%) |
| 3 Vehicles | 12 (6.3%) | 25 (11.0%) |
| 4 Vehicles | 19 (10.0%) | 9 (4.0%) |
| 5 or more Vehicles | 0 (0.0%) | 0 (0.0%) |
| Total | 190 (100.0%) | 227 (100.0%) |
Commute Time in Kilmarnock
The most frequently occuring commute durations in Kilmarnock are 5 to 9 minutes (159 commuters, 39.5%), 10 to 14 minutes (60 commuters, 14.9%), and 30 to 34 minutes (47 commuters, 11.7%).
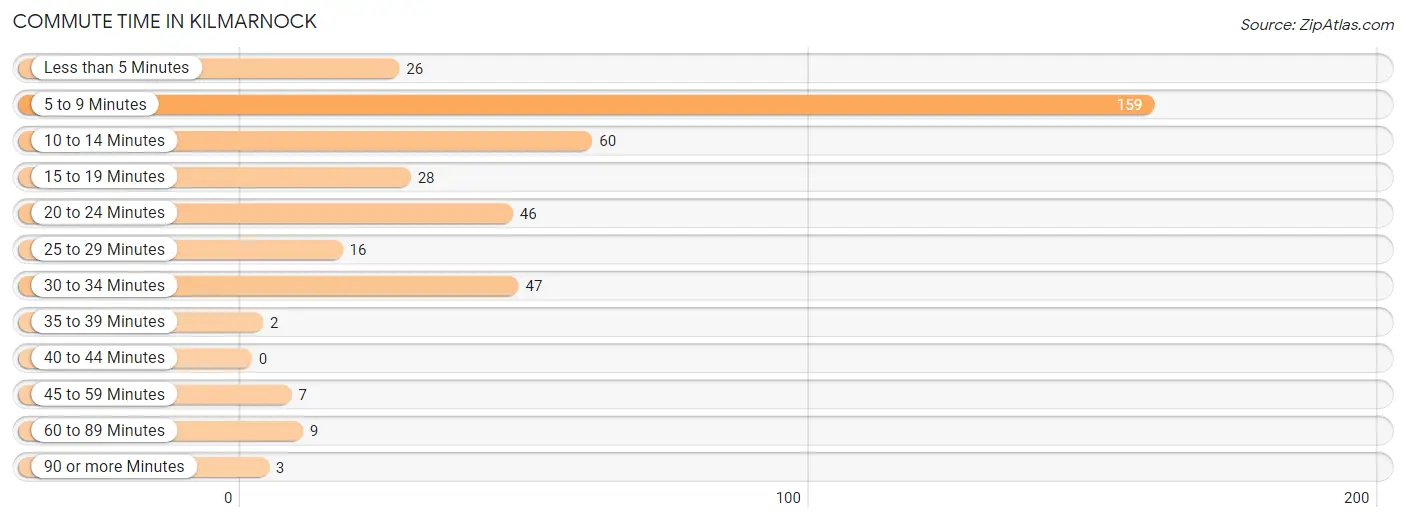
| Commute Time | # Commuters | % Commuters |
| Less than 5 Minutes | 26 | 6.5% |
| 5 to 9 Minutes | 159 | 39.5% |
| 10 to 14 Minutes | 60 | 14.9% |
| 15 to 19 Minutes | 28 | 7.0% |
| 20 to 24 Minutes | 46 | 11.4% |
| 25 to 29 Minutes | 16 | 4.0% |
| 30 to 34 Minutes | 47 | 11.7% |
| 35 to 39 Minutes | 2 | 0.5% |
| 40 to 44 Minutes | 0 | 0.0% |
| 45 to 59 Minutes | 7 | 1.7% |
| 60 to 89 Minutes | 9 | 2.2% |
| 90 or more Minutes | 3 | 0.7% |
Commute Time by Sex in Kilmarnock
The most common commute times in Kilmarnock are 5 to 9 minutes (63 commuters, 35.0%) for males and 5 to 9 minutes (96 commuters, 43.0%) for females.
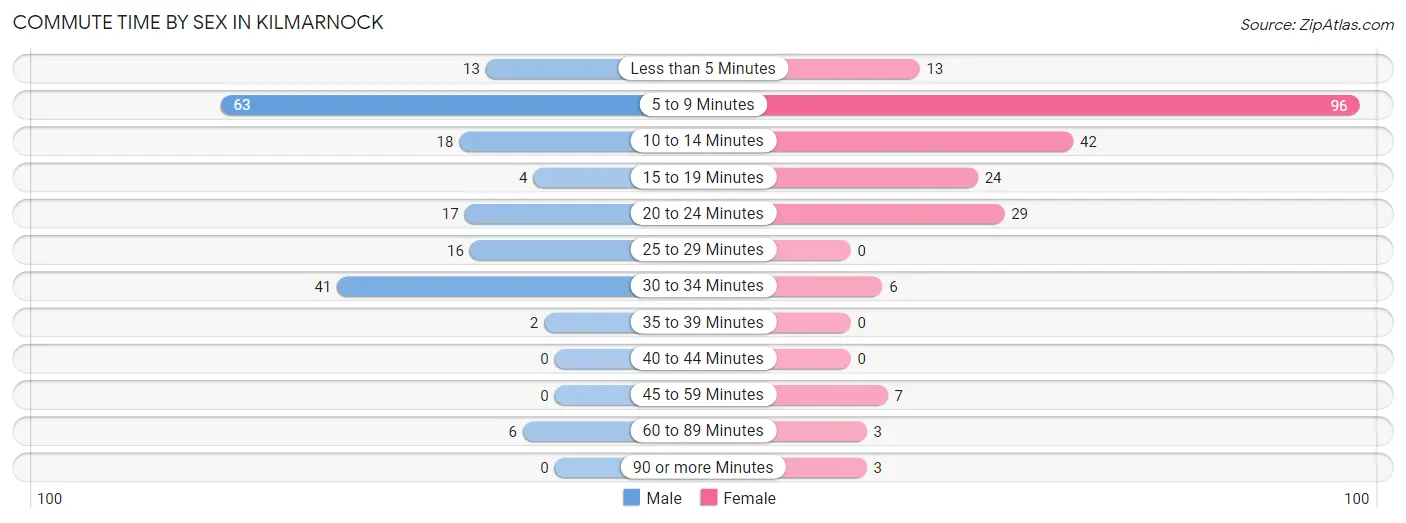
| Commute Time | Male | Female |
| Less than 5 Minutes | 13 (7.2%) | 13 (5.8%) |
| 5 to 9 Minutes | 63 (35.0%) | 96 (43.0%) |
| 10 to 14 Minutes | 18 (10.0%) | 42 (18.8%) |
| 15 to 19 Minutes | 4 (2.2%) | 24 (10.8%) |
| 20 to 24 Minutes | 17 (9.4%) | 29 (13.0%) |
| 25 to 29 Minutes | 16 (8.9%) | 0 (0.0%) |
| 30 to 34 Minutes | 41 (22.8%) | 6 (2.7%) |
| 35 to 39 Minutes | 2 (1.1%) | 0 (0.0%) |
| 40 to 44 Minutes | 0 (0.0%) | 0 (0.0%) |
| 45 to 59 Minutes | 0 (0.0%) | 7 (3.1%) |
| 60 to 89 Minutes | 6 (3.3%) | 3 (1.3%) |
| 90 or more Minutes | 0 (0.0%) | 3 (1.3%) |
Time of Departure to Work by Sex in Kilmarnock
The most frequent times of departure to work in Kilmarnock are 6:30 AM to 6:59 AM (46, 25.6%) for males and 9:00 AM to 9:59 AM (41, 18.4%) for females.
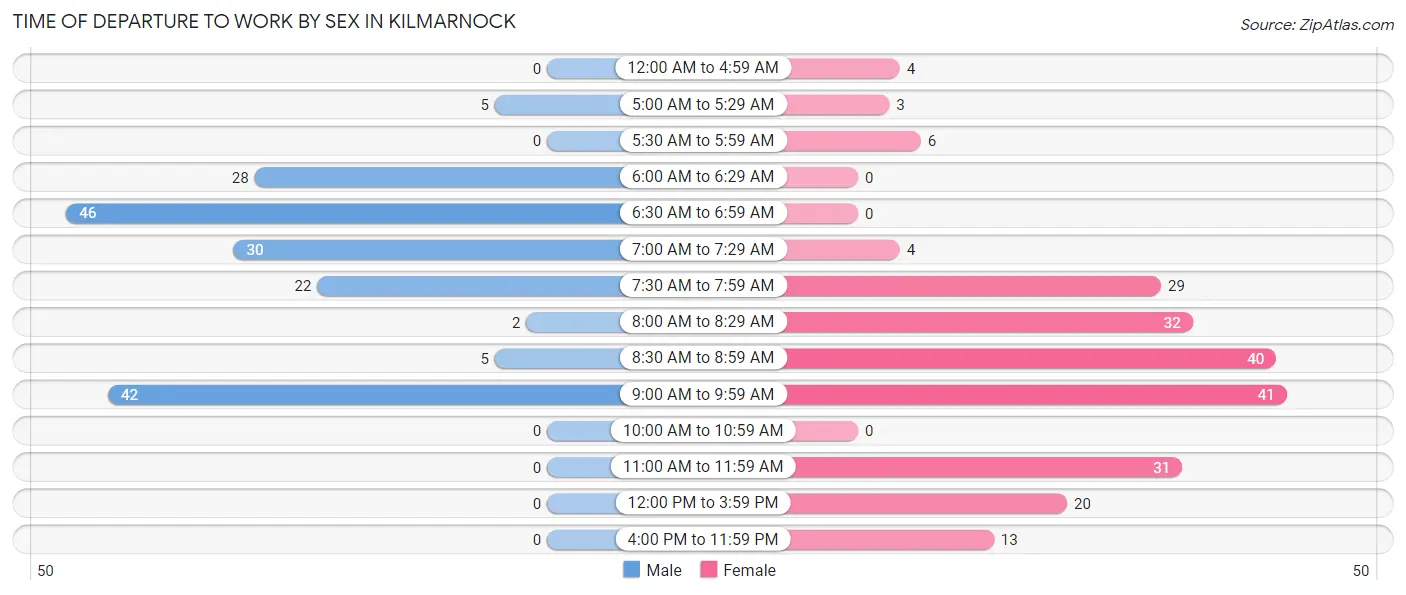
| Time of Departure | Male | Female |
| 12:00 AM to 4:59 AM | 0 (0.0%) | 4 (1.8%) |
| 5:00 AM to 5:29 AM | 5 (2.8%) | 3 (1.3%) |
| 5:30 AM to 5:59 AM | 0 (0.0%) | 6 (2.7%) |
| 6:00 AM to 6:29 AM | 28 (15.6%) | 0 (0.0%) |
| 6:30 AM to 6:59 AM | 46 (25.6%) | 0 (0.0%) |
| 7:00 AM to 7:29 AM | 30 (16.7%) | 4 (1.8%) |
| 7:30 AM to 7:59 AM | 22 (12.2%) | 29 (13.0%) |
| 8:00 AM to 8:29 AM | 2 (1.1%) | 32 (14.3%) |
| 8:30 AM to 8:59 AM | 5 (2.8%) | 40 (17.9%) |
| 9:00 AM to 9:59 AM | 42 (23.3%) | 41 (18.4%) |
| 10:00 AM to 10:59 AM | 0 (0.0%) | 0 (0.0%) |
| 11:00 AM to 11:59 AM | 0 (0.0%) | 31 (13.9%) |
| 12:00 PM to 3:59 PM | 0 (0.0%) | 20 (9.0%) |
| 4:00 PM to 11:59 PM | 0 (0.0%) | 13 (5.8%) |
| Total | 180 (100.0%) | 223 (100.0%) |
Housing Occupancy in Kilmarnock
Occupancy by Ownership in Kilmarnock
Of the total 645 dwellings in Kilmarnock, owner-occupied units account for 353 (54.7%), while renter-occupied units make up 292 (45.3%).
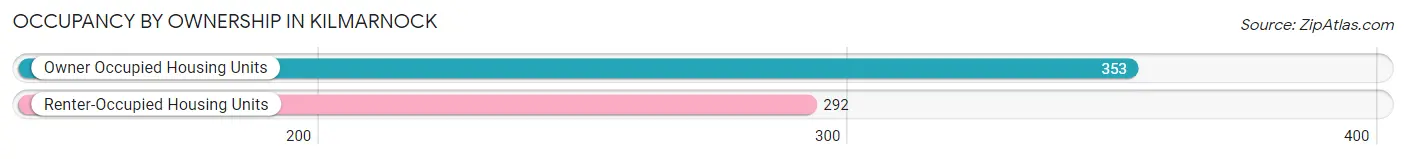
| Occupancy | # Housing Units | % Housing Units |
| Owner Occupied Housing Units | 353 | 54.7% |
| Renter-Occupied Housing Units | 292 | 45.3% |
| Total Occupied Housing Units | 645 | 100.0% |
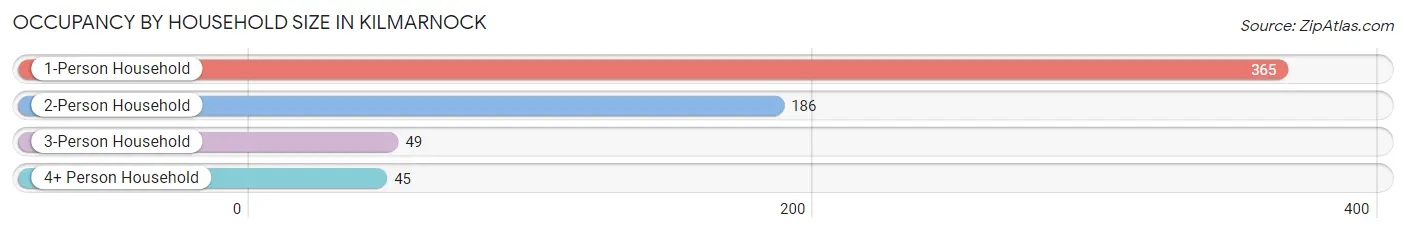
Occupancy by Household Size in Kilmarnock
| Household Size | # Housing Units | % Housing Units |
| 1-Person Household | 365 | 56.6% |
| 2-Person Household | 186 | 28.8% |
| 3-Person Household | 49 | 7.6% |
| 4+ Person Household | 45 | 7.0% |
| Total Housing Units | 645 | 100.0% |
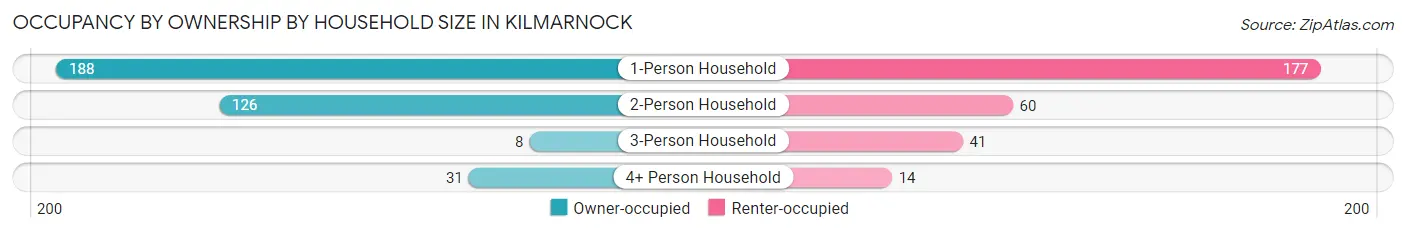
Occupancy by Ownership by Household Size in Kilmarnock
| Household Size | Owner-occupied | Renter-occupied |
| 1-Person Household | 188 (51.5%) | 177 (48.5%) |
| 2-Person Household | 126 (67.7%) | 60 (32.3%) |
| 3-Person Household | 8 (16.3%) | 41 (83.7%) |
| 4+ Person Household | 31 (68.9%) | 14 (31.1%) |
| Total Housing Units | 353 (54.7%) | 292 (45.3%) |
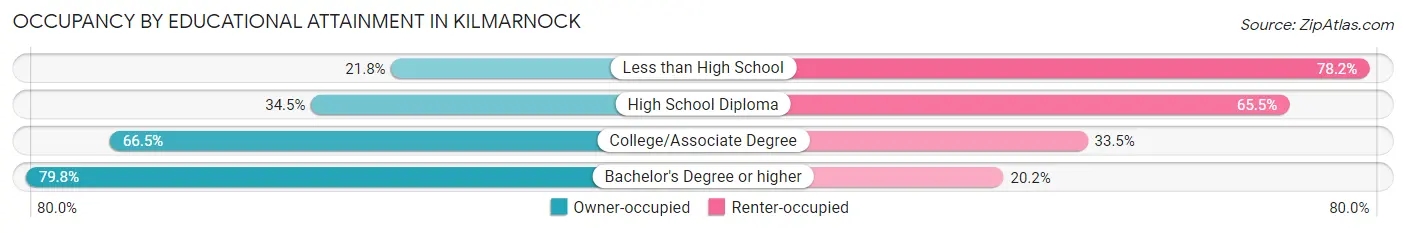
Occupancy by Educational Attainment in Kilmarnock
| Household Size | Owner-occupied | Renter-occupied |
| Less than High School | 24 (21.8%) | 86 (78.2%) |
| High School Diploma | 58 (34.5%) | 110 (65.5%) |
| College/Associate Degree | 109 (66.5%) | 55 (33.5%) |
| Bachelor's Degree or higher | 162 (79.8%) | 41 (20.2%) |
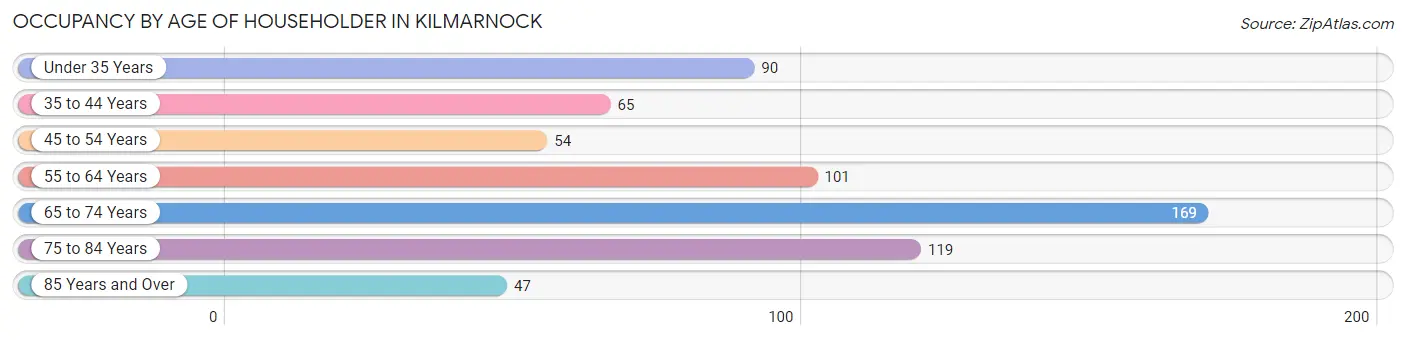
Occupancy by Age of Householder in Kilmarnock
| Age Bracket | # Households | % Households |
| Under 35 Years | 90 | 14.0% |
| 35 to 44 Years | 65 | 10.1% |
| 45 to 54 Years | 54 | 8.4% |
| 55 to 64 Years | 101 | 15.7% |
| 65 to 74 Years | 169 | 26.2% |
| 75 to 84 Years | 119 | 18.4% |
| 85 Years and Over | 47 | 7.3% |
| Total | 645 | 100.0% |
Housing Finances in Kilmarnock
Median Income by Occupancy in Kilmarnock
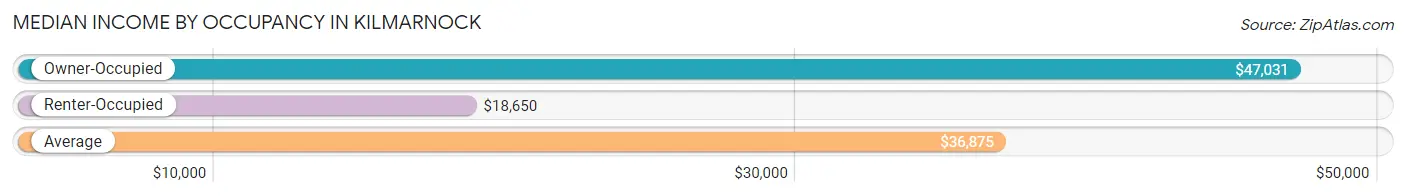
| Occupancy Type | # Households | Median Income |
| Owner-Occupied | 353 (54.7%) | $47,031 |
| Renter-Occupied | 292 (45.3%) | $18,650 |
| Average | 645 (100.0%) | $36,875 |
Occupancy by Householder Income Bracket in Kilmarnock
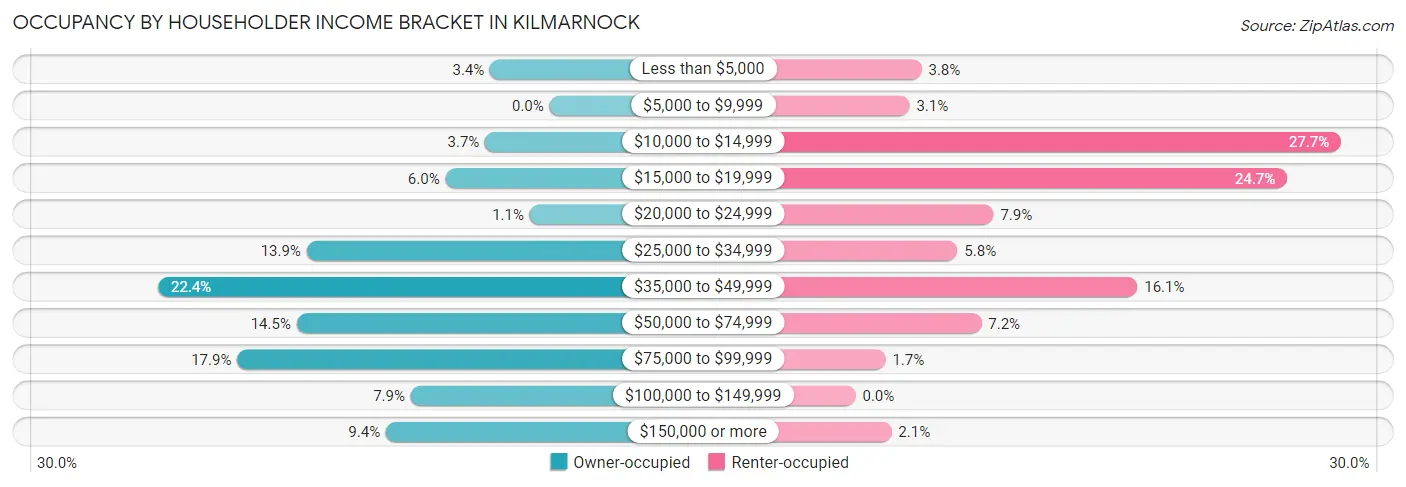
| Income Bracket | Owner-occupied | Renter-occupied |
| Less than $5,000 | 12 (3.4%) | 11 (3.8%) |
| $5,000 to $9,999 | 0 (0.0%) | 9 (3.1%) |
| $10,000 to $14,999 | 13 (3.7%) | 81 (27.7%) |
| $15,000 to $19,999 | 21 (5.9%) | 72 (24.7%) |
| $20,000 to $24,999 | 4 (1.1%) | 23 (7.9%) |
| $25,000 to $34,999 | 49 (13.9%) | 17 (5.8%) |
| $35,000 to $49,999 | 79 (22.4%) | 47 (16.1%) |
| $50,000 to $74,999 | 51 (14.4%) | 21 (7.2%) |
| $75,000 to $99,999 | 63 (17.8%) | 5 (1.7%) |
| $100,000 to $149,999 | 28 (7.9%) | 0 (0.0%) |
| $150,000 or more | 33 (9.3%) | 6 (2.1%) |
| Total | 353 (100.0%) | 292 (100.0%) |
Monthly Housing Cost Tiers in Kilmarnock
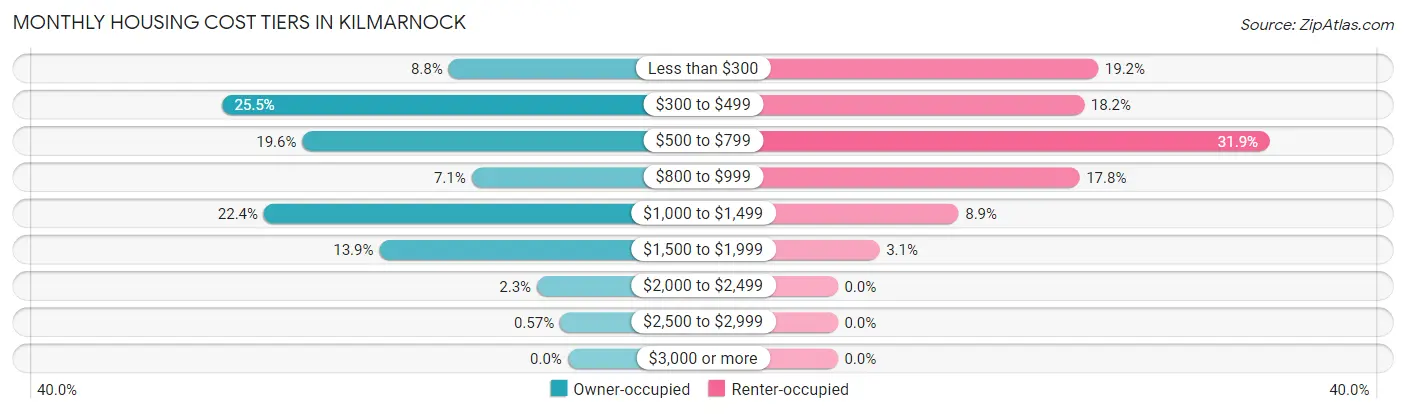
| Monthly Cost | Owner-occupied | Renter-occupied |
| Less than $300 | 31 (8.8%) | 56 (19.2%) |
| $300 to $499 | 90 (25.5%) | 53 (18.1%) |
| $500 to $799 | 69 (19.6%) | 93 (31.9%) |
| $800 to $999 | 25 (7.1%) | 52 (17.8%) |
| $1,000 to $1,499 | 79 (22.4%) | 26 (8.9%) |
| $1,500 to $1,999 | 49 (13.9%) | 9 (3.1%) |
| $2,000 to $2,499 | 8 (2.3%) | 0 (0.0%) |
| $2,500 to $2,999 | 2 (0.6%) | 0 (0.0%) |
| $3,000 or more | 0 (0.0%) | 0 (0.0%) |
| Total | 353 (100.0%) | 292 (100.0%) |
Physical Housing Characteristics in Kilmarnock
Housing Structures in Kilmarnock
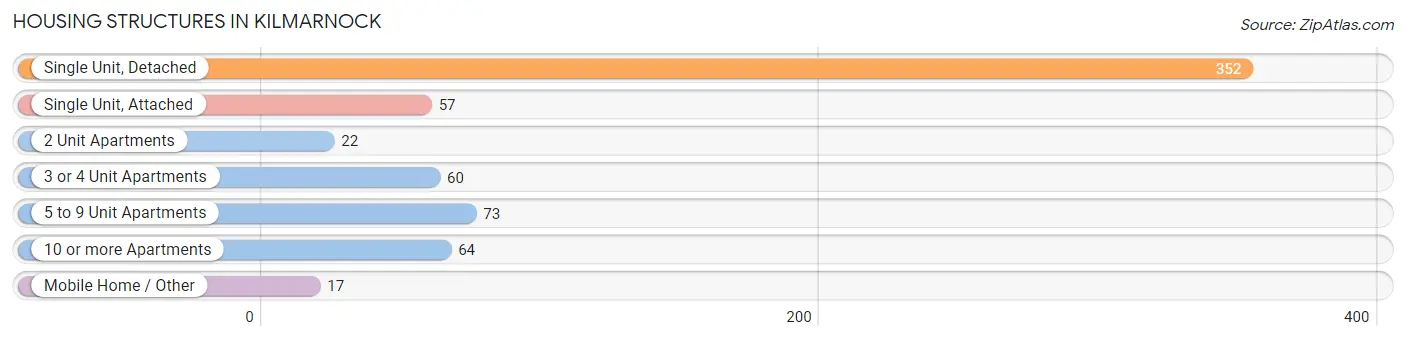
| Structure Type | # Housing Units | % Housing Units |
| Single Unit, Detached | 352 | 54.6% |
| Single Unit, Attached | 57 | 8.8% |
| 2 Unit Apartments | 22 | 3.4% |
| 3 or 4 Unit Apartments | 60 | 9.3% |
| 5 to 9 Unit Apartments | 73 | 11.3% |
| 10 or more Apartments | 64 | 9.9% |
| Mobile Home / Other | 17 | 2.6% |
| Total | 645 | 100.0% |
Housing Structures by Occupancy in Kilmarnock
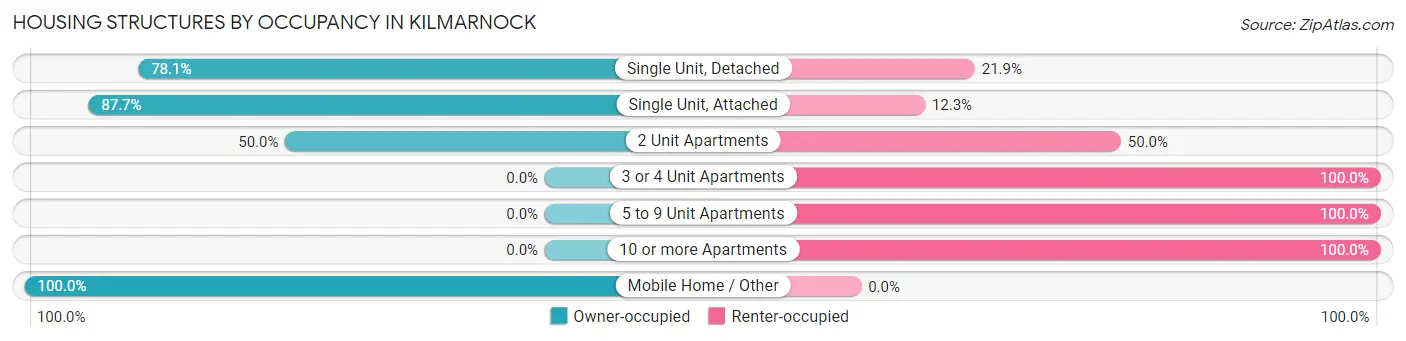
| Structure Type | Owner-occupied | Renter-occupied |
| Single Unit, Detached | 275 (78.1%) | 77 (21.9%) |
| Single Unit, Attached | 50 (87.7%) | 7 (12.3%) |
| 2 Unit Apartments | 11 (50.0%) | 11 (50.0%) |
| 3 or 4 Unit Apartments | 0 (0.0%) | 60 (100.0%) |
| 5 to 9 Unit Apartments | 0 (0.0%) | 73 (100.0%) |
| 10 or more Apartments | 0 (0.0%) | 64 (100.0%) |
| Mobile Home / Other | 17 (100.0%) | 0 (0.0%) |
| Total | 353 (54.7%) | 292 (45.3%) |
Housing Structures by Number of Rooms in Kilmarnock
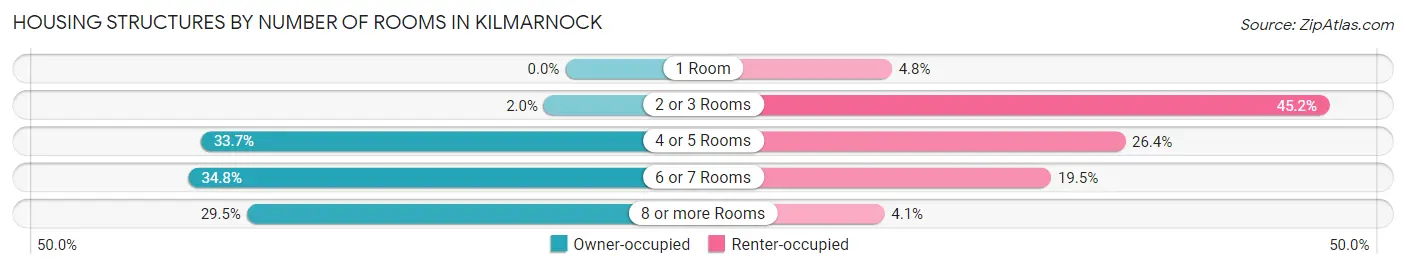
| Number of Rooms | Owner-occupied | Renter-occupied |
| 1 Room | 0 (0.0%) | 14 (4.8%) |
| 2 or 3 Rooms | 7 (2.0%) | 132 (45.2%) |
| 4 or 5 Rooms | 119 (33.7%) | 77 (26.4%) |
| 6 or 7 Rooms | 123 (34.8%) | 57 (19.5%) |
| 8 or more Rooms | 104 (29.5%) | 12 (4.1%) |
| Total | 353 (100.0%) | 292 (100.0%) |
Housing Structure by Heating Type in Kilmarnock
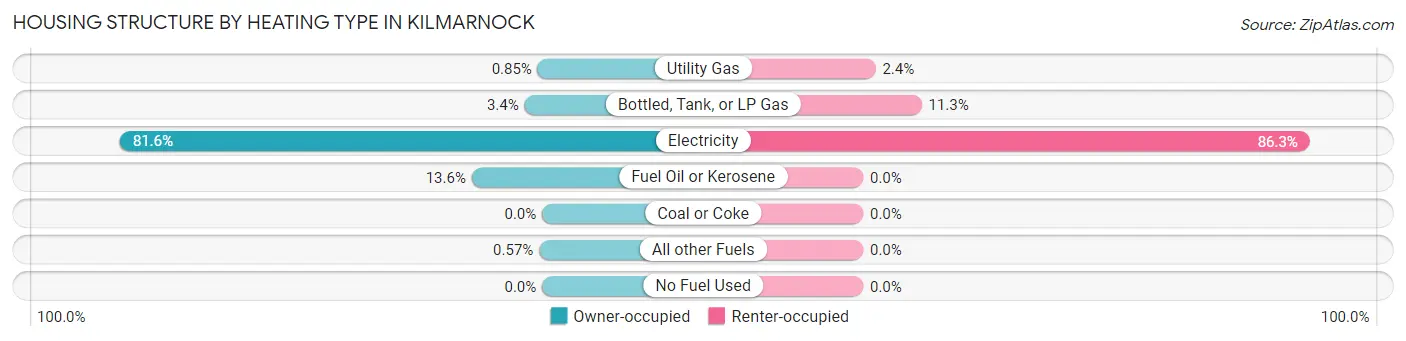
| Heating Type | Owner-occupied | Renter-occupied |
| Utility Gas | 3 (0.9%) | 7 (2.4%) |
| Bottled, Tank, or LP Gas | 12 (3.4%) | 33 (11.3%) |
| Electricity | 288 (81.6%) | 252 (86.3%) |
| Fuel Oil or Kerosene | 48 (13.6%) | 0 (0.0%) |
| Coal or Coke | 0 (0.0%) | 0 (0.0%) |
| All other Fuels | 2 (0.6%) | 0 (0.0%) |
| No Fuel Used | 0 (0.0%) | 0 (0.0%) |
| Total | 353 (100.0%) | 292 (100.0%) |
Household Vehicle Usage in Kilmarnock
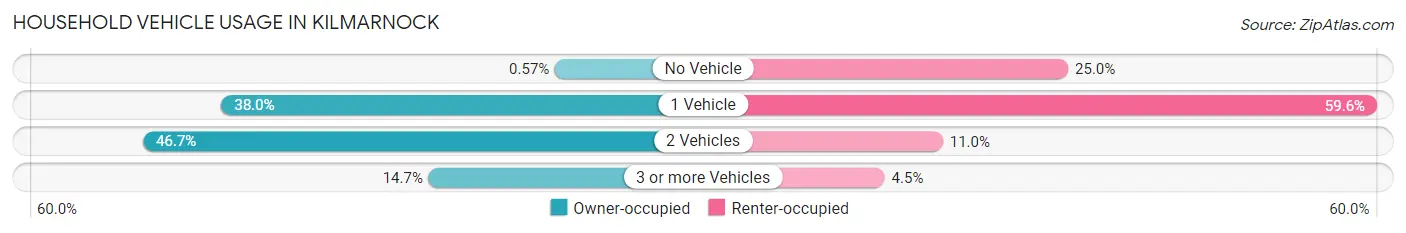
| Vehicles per Household | Owner-occupied | Renter-occupied |
| No Vehicle | 2 (0.6%) | 73 (25.0%) |
| 1 Vehicle | 134 (38.0%) | 174 (59.6%) |
| 2 Vehicles | 165 (46.7%) | 32 (11.0%) |
| 3 or more Vehicles | 52 (14.7%) | 13 (4.4%) |
| Total | 353 (100.0%) | 292 (100.0%) |
Real Estate & Mortgages in Kilmarnock
Real Estate and Mortgage Overview in Kilmarnock
| Characteristic | Without Mortgage | With Mortgage |
| Housing Units | 197 | 156 |
| Median Property Value | $213,000 | $231,600 |
| Median Household Income | $41,458 | $18 |
| Monthly Housing Costs | $442 | $0 |
| Real Estate Taxes | $1,225 | $3 |
Property Value by Mortgage Status in Kilmarnock
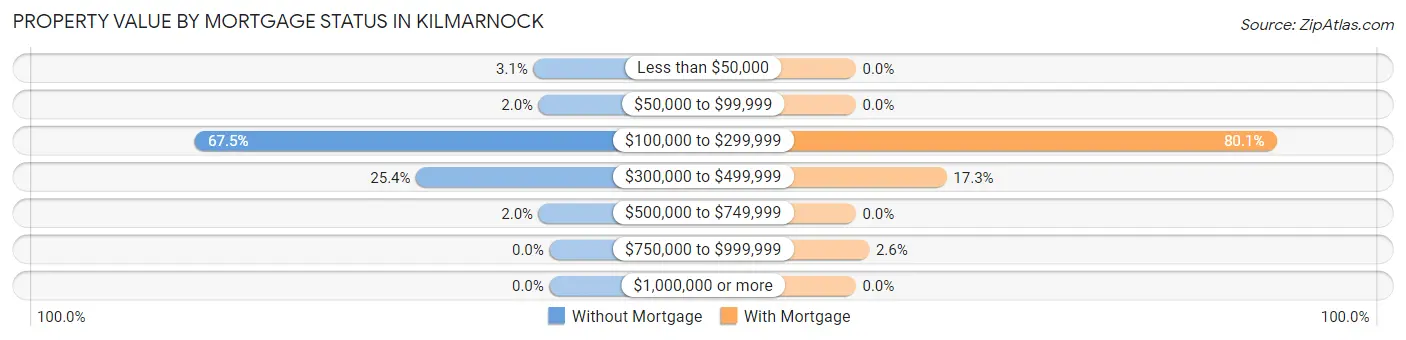
| Property Value | Without Mortgage | With Mortgage |
| Less than $50,000 | 6 (3.0%) | 0 (0.0%) |
| $50,000 to $99,999 | 4 (2.0%) | 0 (0.0%) |
| $100,000 to $299,999 | 133 (67.5%) | 125 (80.1%) |
| $300,000 to $499,999 | 50 (25.4%) | 27 (17.3%) |
| $500,000 to $749,999 | 4 (2.0%) | 0 (0.0%) |
| $750,000 to $999,999 | 0 (0.0%) | 4 (2.6%) |
| $1,000,000 or more | 0 (0.0%) | 0 (0.0%) |
| Total | 197 (100.0%) | 156 (100.0%) |
Household Income by Mortgage Status in Kilmarnock
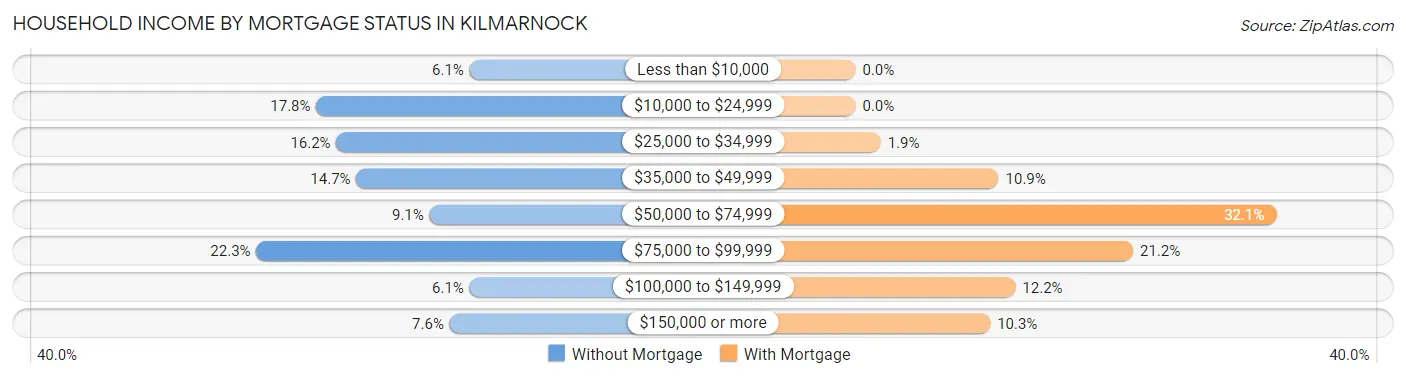
| Household Income | Without Mortgage | With Mortgage |
| Less than $10,000 | 12 (6.1%) | 0 (0.0%) |
| $10,000 to $24,999 | 35 (17.8%) | 0 (0.0%) |
| $25,000 to $34,999 | 32 (16.2%) | 3 (1.9%) |
| $35,000 to $49,999 | 29 (14.7%) | 17 (10.9%) |
| $50,000 to $74,999 | 18 (9.1%) | 50 (32.1%) |
| $75,000 to $99,999 | 44 (22.3%) | 33 (21.1%) |
| $100,000 to $149,999 | 12 (6.1%) | 19 (12.2%) |
| $150,000 or more | 15 (7.6%) | 16 (10.3%) |
| Total | 197 (100.0%) | 156 (100.0%) |
Property Value to Household Income Ratio in Kilmarnock
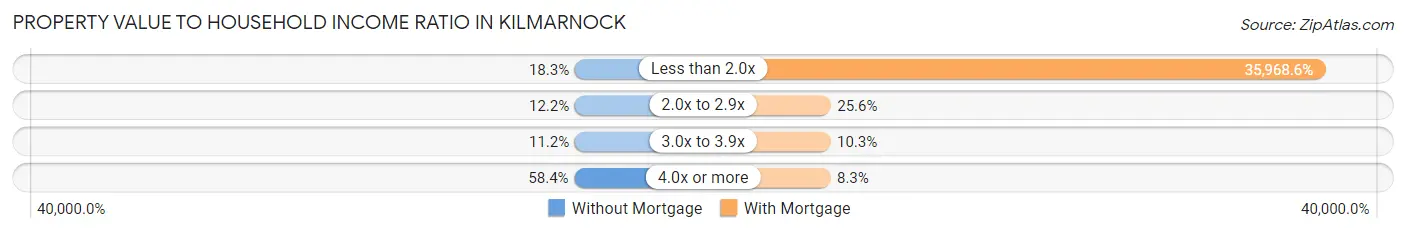
| Value-to-Income Ratio | Without Mortgage | With Mortgage |
| Less than 2.0x | 36 (18.3%) | 56,111 (35,968.6%) |
| 2.0x to 2.9x | 24 (12.2%) | 40 (25.6%) |
| 3.0x to 3.9x | 22 (11.2%) | 16 (10.3%) |
| 4.0x or more | 115 (58.4%) | 13 (8.3%) |
| Total | 197 (100.0%) | 156 (100.0%) |
Real Estate Taxes by Mortgage Status in Kilmarnock
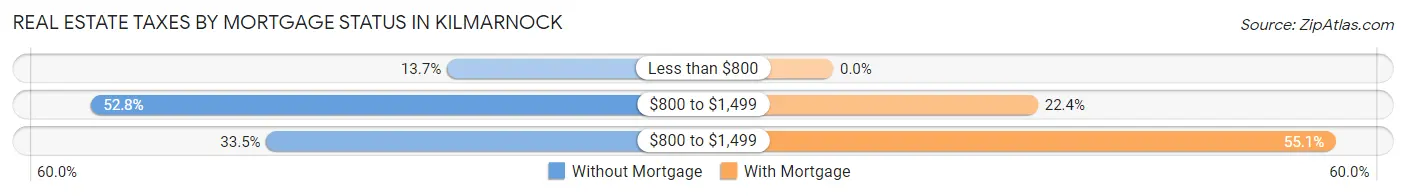
| Property Taxes | Without Mortgage | With Mortgage |
| Less than $800 | 27 (13.7%) | 0 (0.0%) |
| $800 to $1,499 | 104 (52.8%) | 35 (22.4%) |
| $800 to $1,499 | 66 (33.5%) | 86 (55.1%) |
| Total | 197 (100.0%) | 156 (100.0%) |
Health & Disability in Kilmarnock
Health Insurance Coverage by Age in Kilmarnock
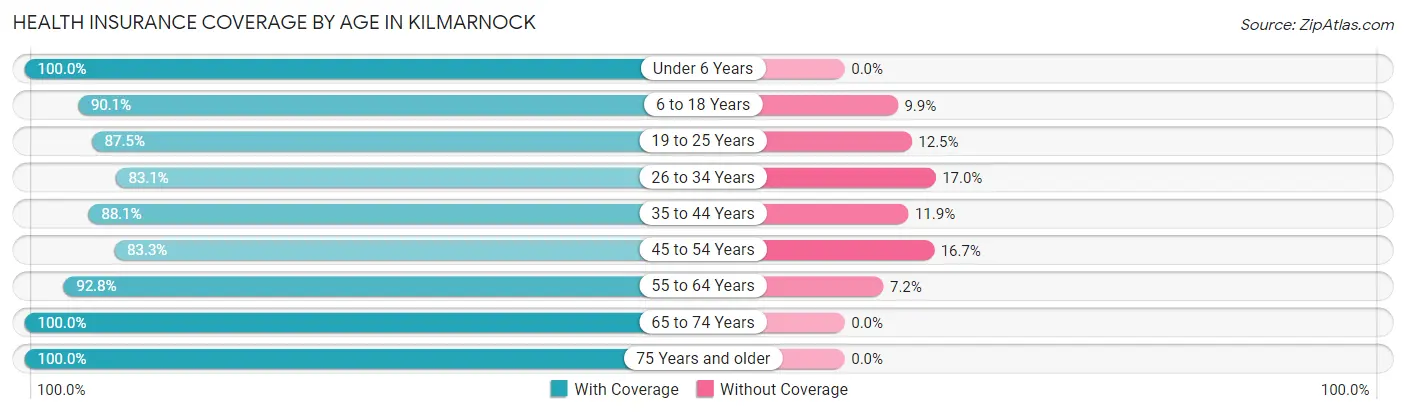
| Age Bracket | With Coverage | Without Coverage |
| Under 6 Years | 70 (100.0%) | 0 (0.0%) |
| 6 to 18 Years | 118 (90.1%) | 13 (9.9%) |
| 19 to 25 Years | 21 (87.5%) | 3 (12.5%) |
| 26 to 34 Years | 98 (83.1%) | 20 (17.0%) |
| 35 to 44 Years | 89 (88.1%) | 12 (11.9%) |
| 45 to 54 Years | 60 (83.3%) | 12 (16.7%) |
| 55 to 64 Years | 180 (92.8%) | 14 (7.2%) |
| 65 to 74 Years | 221 (100.0%) | 0 (0.0%) |
| 75 Years and older | 204 (100.0%) | 0 (0.0%) |
| Total | 1,061 (93.5%) | 74 (6.5%) |
Health Insurance Coverage by Citizenship Status in Kilmarnock
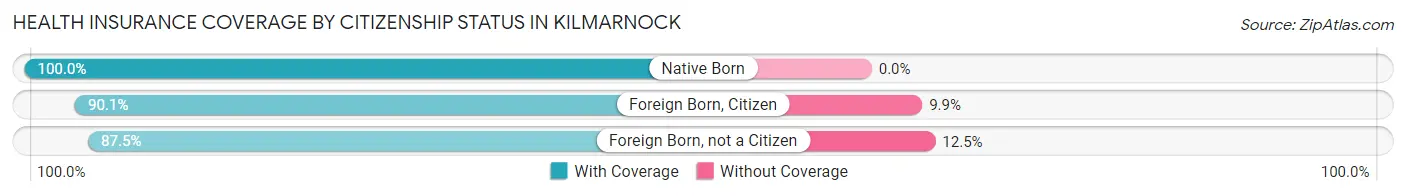
| Citizenship Status | With Coverage | Without Coverage |
| Native Born | 70 (100.0%) | 0 (0.0%) |
| Foreign Born, Citizen | 118 (90.1%) | 13 (9.9%) |
| Foreign Born, not a Citizen | 21 (87.5%) | 3 (12.5%) |
Health Insurance Coverage by Household Income in Kilmarnock
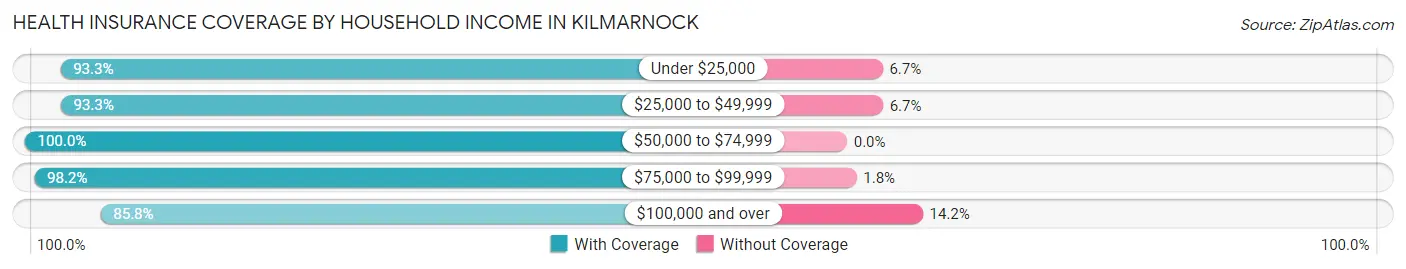
| Household Income | With Coverage | Without Coverage |
| Under $25,000 | 349 (93.3%) | 25 (6.7%) |
| $25,000 to $49,999 | 277 (93.3%) | 20 (6.7%) |
| $50,000 to $74,999 | 164 (100.0%) | 0 (0.0%) |
| $75,000 to $99,999 | 110 (98.2%) | 2 (1.8%) |
| $100,000 and over | 151 (85.8%) | 25 (14.2%) |
Public vs Private Health Insurance Coverage by Age in Kilmarnock
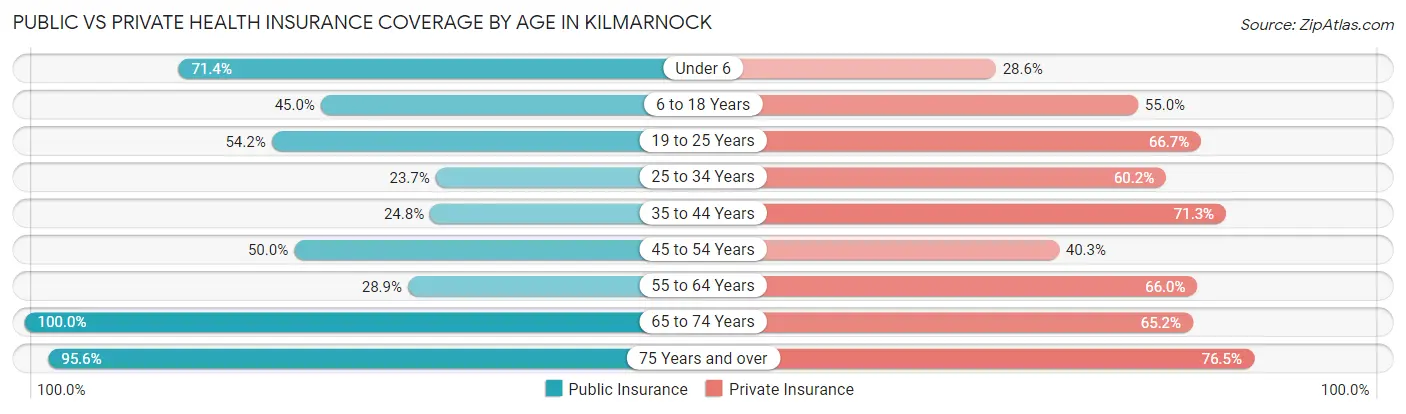
| Age Bracket | Public Insurance | Private Insurance |
| Under 6 | 50 (71.4%) | 20 (28.6%) |
| 6 to 18 Years | 59 (45.0%) | 72 (55.0%) |
| 19 to 25 Years | 13 (54.2%) | 16 (66.7%) |
| 25 to 34 Years | 28 (23.7%) | 71 (60.2%) |
| 35 to 44 Years | 25 (24.7%) | 72 (71.3%) |
| 45 to 54 Years | 36 (50.0%) | 29 (40.3%) |
| 55 to 64 Years | 56 (28.9%) | 128 (66.0%) |
| 65 to 74 Years | 221 (100.0%) | 144 (65.2%) |
| 75 Years and over | 195 (95.6%) | 156 (76.5%) |
| Total | 683 (60.2%) | 708 (62.4%) |
Disability Status by Sex by Age in Kilmarnock
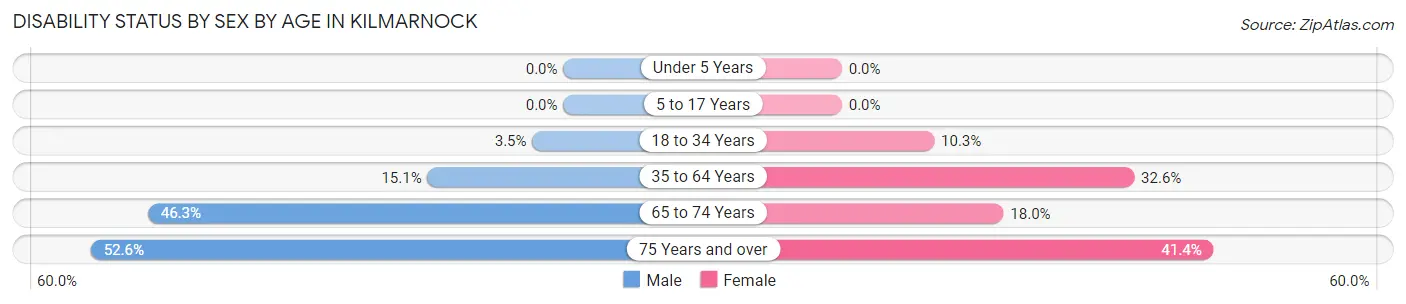
| Age Bracket | Male | Female |
| Under 5 Years | 0 (0.0%) | 0 (0.0%) |
| 5 to 17 Years | 0 (0.0%) | 0 (0.0%) |
| 18 to 34 Years | 2 (3.5%) | 11 (10.3%) |
| 35 to 64 Years | 23 (15.1%) | 70 (32.6%) |
| 65 to 74 Years | 56 (46.3%) | 18 (18.0%) |
| 75 Years and over | 40 (52.6%) | 53 (41.4%) |
Disability Class by Sex by Age in Kilmarnock
Disability Class: Hearing Difficulty
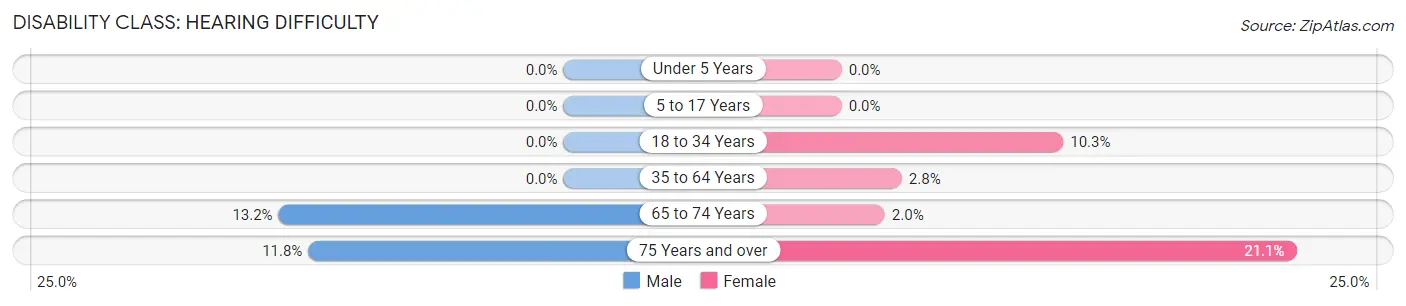
| Age Bracket | Male | Female |
| Under 5 Years | 0 (0.0%) | 0 (0.0%) |
| 5 to 17 Years | 0 (0.0%) | 0 (0.0%) |
| 18 to 34 Years | 0 (0.0%) | 11 (10.3%) |
| 35 to 64 Years | 0 (0.0%) | 6 (2.8%) |
| 65 to 74 Years | 16 (13.2%) | 2 (2.0%) |
| 75 Years and over | 9 (11.8%) | 27 (21.1%) |
Disability Class: Vision Difficulty
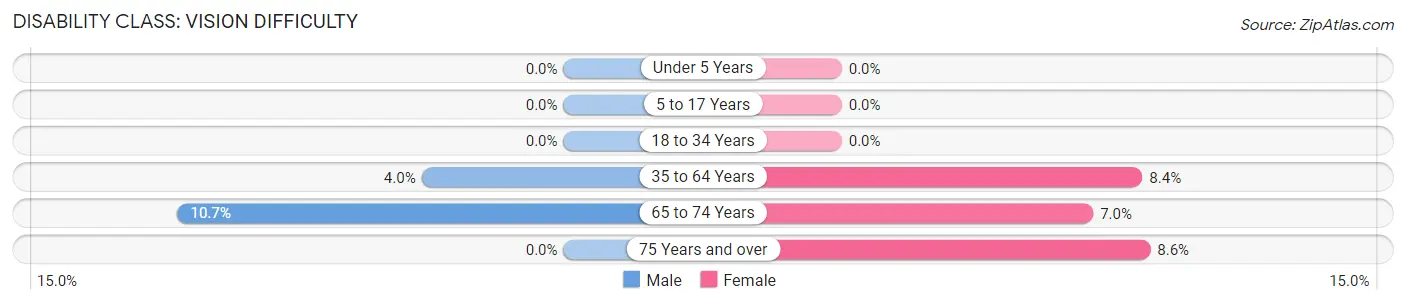
| Age Bracket | Male | Female |
| Under 5 Years | 0 (0.0%) | 0 (0.0%) |
| 5 to 17 Years | 0 (0.0%) | 0 (0.0%) |
| 18 to 34 Years | 0 (0.0%) | 0 (0.0%) |
| 35 to 64 Years | 6 (4.0%) | 18 (8.4%) |
| 65 to 74 Years | 13 (10.7%) | 7 (7.0%) |
| 75 Years and over | 0 (0.0%) | 11 (8.6%) |
Disability Class: Cognitive Difficulty
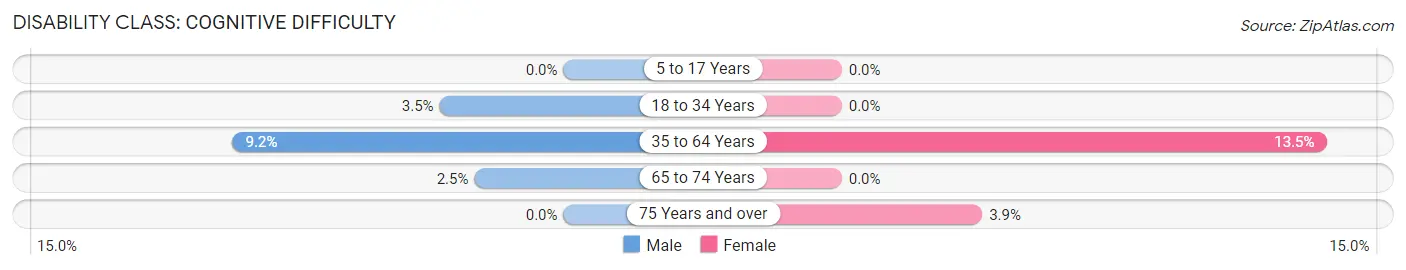
| Age Bracket | Male | Female |
| 5 to 17 Years | 0 (0.0%) | 0 (0.0%) |
| 18 to 34 Years | 2 (3.5%) | 0 (0.0%) |
| 35 to 64 Years | 14 (9.2%) | 29 (13.5%) |
| 65 to 74 Years | 3 (2.5%) | 0 (0.0%) |
| 75 Years and over | 0 (0.0%) | 5 (3.9%) |
Disability Class: Ambulatory Difficulty
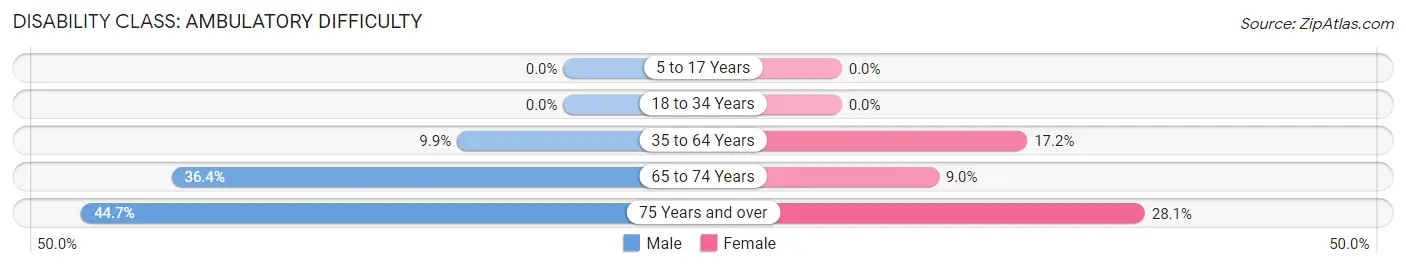
| Age Bracket | Male | Female |
| 5 to 17 Years | 0 (0.0%) | 0 (0.0%) |
| 18 to 34 Years | 0 (0.0%) | 0 (0.0%) |
| 35 to 64 Years | 15 (9.9%) | 37 (17.2%) |
| 65 to 74 Years | 44 (36.4%) | 9 (9.0%) |
| 75 Years and over | 34 (44.7%) | 36 (28.1%) |
Disability Class: Self-Care Difficulty
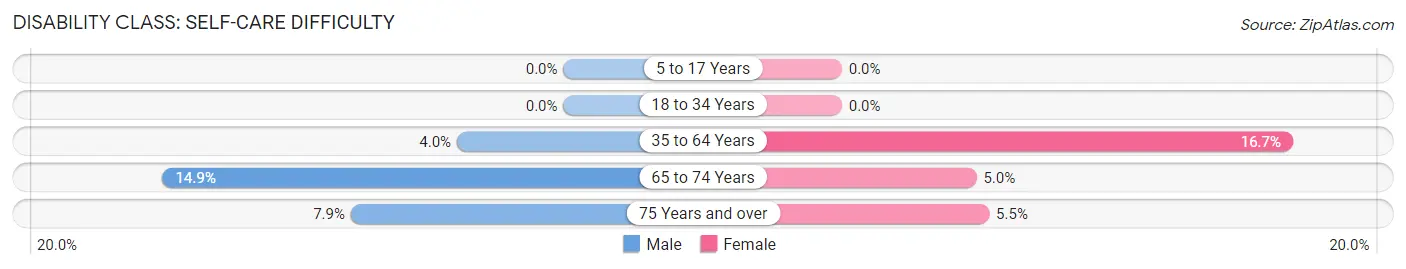
| Age Bracket | Male | Female |
| 5 to 17 Years | 0 (0.0%) | 0 (0.0%) |
| 18 to 34 Years | 0 (0.0%) | 0 (0.0%) |
| 35 to 64 Years | 6 (4.0%) | 36 (16.7%) |
| 65 to 74 Years | 18 (14.9%) | 5 (5.0%) |
| 75 Years and over | 6 (7.9%) | 7 (5.5%) |
Technology Access in Kilmarnock
Computing Device Access in Kilmarnock
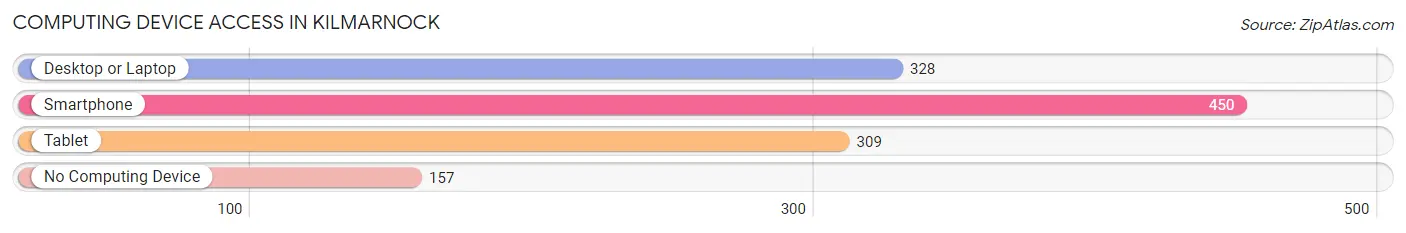
| Device Type | # Households | % Households |
| Desktop or Laptop | 328 | 50.8% |
| Smartphone | 450 | 69.8% |
| Tablet | 309 | 47.9% |
| No Computing Device | 157 | 24.3% |
| Total | 645 | 100.0% |
Internet Access in Kilmarnock
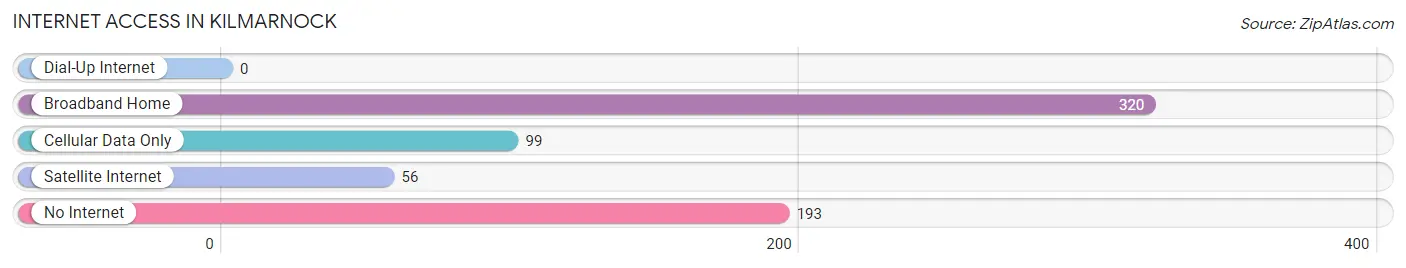
| Internet Type | # Households | % Households |
| Dial-Up Internet | 0 | 0.0% |
| Broadband Home | 320 | 49.6% |
| Cellular Data Only | 99 | 15.3% |
| Satellite Internet | 56 | 8.7% |
| No Internet | 193 | 29.9% |
| Total | 645 | 100.0% |
Kilmarnock Summary
Kilmarnock is a town located in Lancaster County, Virginia, United States. The population was 1,015 at the 2010 census. It is the county seat of Lancaster County. Kilmarnock is located on the Rappahannock River, which forms the boundary between Lancaster and Northumberland counties.
History
Kilmarnock was founded in 1730 by William Fitzhugh, a planter and politician from Stafford County, Virginia. The town was named after Kilmarnock, Scotland, the birthplace of Fitzhugh's father. The town was incorporated in 1742 and became the county seat of Lancaster County in 1748.
Kilmarnock was an important port in the 18th and 19th centuries, with ships sailing to ports in the Caribbean, Europe, and the American colonies. The town was also a center of the tobacco trade, with tobacco warehouses and a tobacco inspection station.
During the American Civil War, Kilmarnock was occupied by Union forces in 1862 and 1863. The town was the site of a skirmish in 1863, when Confederate forces attempted to retake the town.
Geography
Kilmarnock is located at 37°45'N 76°25'W (37.75, -76.42). According to the United States Census Bureau, the town has a total area of 0.7 square miles (1.8 km2), all of it land.
Economy
Kilmarnock is a small town with a limited economy. The town is home to several small businesses, including restaurants, retail stores, and professional services. The town is also home to a number of historic sites, including the Kilmarnock Historic District, which is listed on the National Register of Historic Places.
The town is also home to a number of marinas, which provide access to the Rappahannock River and Chesapeake Bay. The town is also home to a number of wineries, which produce a variety of wines.
Demographics
As of the census of 2010, there were 1,015 people, 441 households, and 263 families residing in the town. The population density was 1,444.3 people per square mile (558.7/km2). There were 486 housing units at an average density of 690.0 per square mile (266.3/km2). The racial makeup of the town was 79.2% White, 17.2% African American, 0.3% Native American, 0.7% Asian, 0.1% Pacific Islander, 0.7% from other races, and 1.9% from two or more races. Hispanic or Latino of any race were 2.2% of the population.
There were 441 households, out of which 24.3% had children under the age of 18 living with them, 43.2% were married couples living together, 13.6% had a female householder with no husband present, and 38.7% were non-families. 33.2% of all households were made up of individuals, and 15.2% had someone living alone who was 65 years of age or older. The average household size was 2.29 and the average family size was 2.90.
In the town, the population was spread out, with 22.2% under the age of 18, 6.7% from 18 to 24, 24.2% from 25 to 44, 28.2% from 45 to 64, and 18.7% who were 65 years of age or older. The median age was 42 years. For every 100 females, there were 87.2 males. For every 100 females age 18 and over, there were 83.2 males.
The median income for a household in the town was $37,500, and the median income for a family was $45,000. Males had a median income of $31,250 versus $25,000 for females. The per capita income for the town was $20,945. About 8.2% of families and 11.2% of the population were below the poverty line, including 15.2% of those under age 18 and 8.3% of those age 65 or over.
Common Questions
What is Per Capita Income in Kilmarnock?
Per Capita income in Kilmarnock is $27,486.
What is the Median Family Income in Kilmarnock?
Median Family Income in Kilmarnock is $44,242.
What is the Median Household income in Kilmarnock?
Median Household Income in Kilmarnock is $36,875.
What is Income or Wage Gap in Kilmarnock?
Income or Wage Gap in Kilmarnock is 52.6%.
Women in Kilmarnock earn 47.4 cents for every dollar earned by a man.
What is Inequality or Gini Index in Kilmarnock?
Inequality or Gini Index in Kilmarnock is 0.47.
What is the Total Population of Kilmarnock?
Total Population of Kilmarnock is 1,284.
What is the Total Male Population of Kilmarnock?
Total Male Population of Kilmarnock is 517.
What is the Total Female Population of Kilmarnock?
Total Female Population of Kilmarnock is 767.
What is the Ratio of Males per 100 Females in Kilmarnock?
There are 67.41 Males per 100 Females in Kilmarnock.
What is the Ratio of Females per 100 Males in Kilmarnock?
There are 148.36 Females per 100 Males in Kilmarnock.
What is the Median Population Age in Kilmarnock?
Median Population Age in Kilmarnock is 60.2 Years.
What is the Average Family Size in Kilmarnock
Average Family Size in Kilmarnock is 2.6 People.
What is the Average Household Size in Kilmarnock
Average Household Size in Kilmarnock is 1.7 People.
How Large is the Labor Force in Kilmarnock?
There are 444 People in the Labor Forcein in Kilmarnock.
What is the Percentage of People in the Labor Force in Kilmarnock?
39.4% of People are in the Labor Force in Kilmarnock.
What is the Unemployment Rate in Kilmarnock?
Unemployment Rate in Kilmarnock is 5.6%.