Warrenton, VA Map & Demographics
Warrenton Map
Warrenton Overview
$43,459
PER CAPITA INCOME
$124,545
AVG FAMILY INCOME
$83,737
AVG HOUSEHOLD INCOME
26.9%
WAGE / INCOME GAP [ % ]
73.1¢/ $1
WAGE / INCOME GAP [ $ ]
0.42
INEQUALITY / GINI INDEX
10,111
TOTAL POPULATION
4,560
MALE POPULATION
5,551
FEMALE POPULATION
82.15
MALES / 100 FEMALES
121.73
FEMALES / 100 MALES
38.2
MEDIAN AGE
3.4
AVG FAMILY SIZE
2.5
AVG HOUSEHOLD SIZE
5,255
LABOR FORCE [ PEOPLE ]
65.2%
PERCENT IN LABOR FORCE
2.1%
UNEMPLOYMENT RATE
Warrenton Area Codes
Income in Warrenton
Income Overview in Warrenton
Per Capita Income in Warrenton is $43,459, while median incomes of families and households are $124,545 and $83,737 respectively.
| Characteristic | Number | Measure |
| Per Capita Income | 10,111 | $43,459 |
| Median Family Income | 2,178 | $124,545 |
| Mean Family Income | 2,178 | $143,519 |
| Median Household Income | 3,928 | $83,737 |
| Mean Household Income | 3,928 | $108,278 |
| Income Deficit | 2,178 | $0 |
| Wage / Income Gap (%) | 10,111 | 26.92% |
| Wage / Income Gap ($) | 10,111 | 73.08¢ per $1 |
| Gini / Inequality Index | 10,111 | 0.42 |
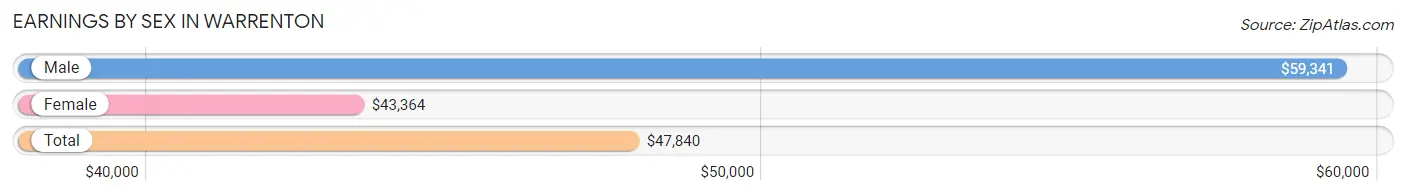
Earnings by Sex in Warrenton
Average Earnings in Warrenton are $47,840, $59,341 for men and $43,364 for women, a difference of 26.9%.
| Sex | Number | Average Earnings |
| Male | 2,907 (51.1%) | $59,341 |
| Female | 2,780 (48.9%) | $43,364 |
| Total | 5,687 (100.0%) | $47,840 |
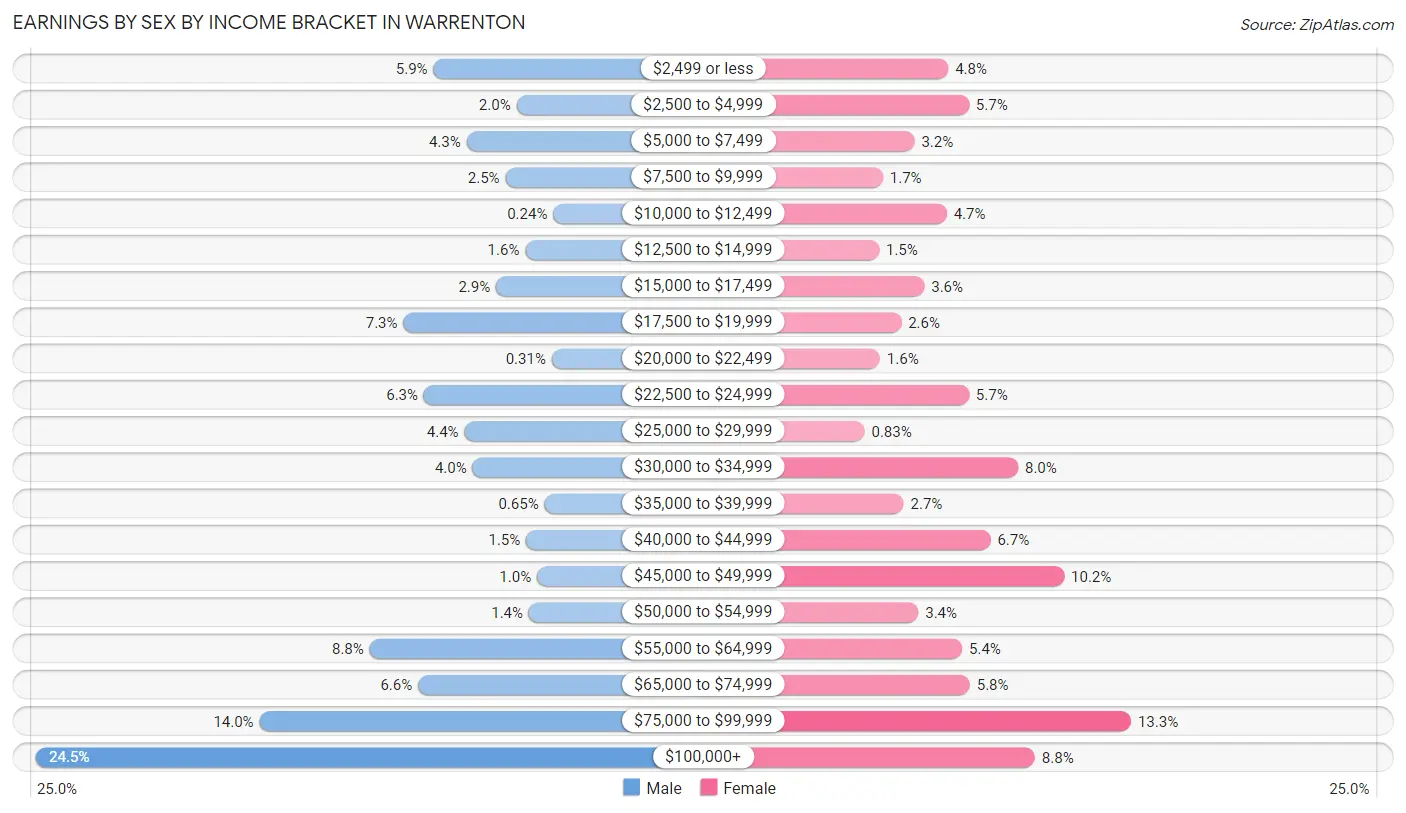
Earnings by Sex by Income Bracket in Warrenton
The most common earnings brackets in Warrenton are $100,000+ for men (711 | 24.5%) and $75,000 to $99,999 for women (370 | 13.3%).
| Income | Male | Female |
| $2,499 or less | 170 (5.9%) | 132 (4.8%) |
| $2,500 to $4,999 | 57 (2.0%) | 159 (5.7%) |
| $5,000 to $7,499 | 125 (4.3%) | 88 (3.2%) |
| $7,500 to $9,999 | 72 (2.5%) | 47 (1.7%) |
| $10,000 to $12,499 | 7 (0.2%) | 130 (4.7%) |
| $12,500 to $14,999 | 45 (1.5%) | 42 (1.5%) |
| $15,000 to $17,499 | 85 (2.9%) | 101 (3.6%) |
| $17,500 to $19,999 | 211 (7.3%) | 71 (2.5%) |
| $20,000 to $22,499 | 9 (0.3%) | 43 (1.5%) |
| $22,500 to $24,999 | 183 (6.3%) | 159 (5.7%) |
| $25,000 to $29,999 | 128 (4.4%) | 23 (0.8%) |
| $30,000 to $34,999 | 117 (4.0%) | 223 (8.0%) |
| $35,000 to $39,999 | 19 (0.6%) | 74 (2.7%) |
| $40,000 to $44,999 | 44 (1.5%) | 187 (6.7%) |
| $45,000 to $49,999 | 29 (1.0%) | 283 (10.2%) |
| $50,000 to $54,999 | 40 (1.4%) | 93 (3.4%) |
| $55,000 to $64,999 | 257 (8.8%) | 150 (5.4%) |
| $65,000 to $74,999 | 191 (6.6%) | 160 (5.8%) |
| $75,000 to $99,999 | 407 (14.0%) | 370 (13.3%) |
| $100,000+ | 711 (24.5%) | 245 (8.8%) |
| Total | 2,907 (100.0%) | 2,780 (100.0%) |
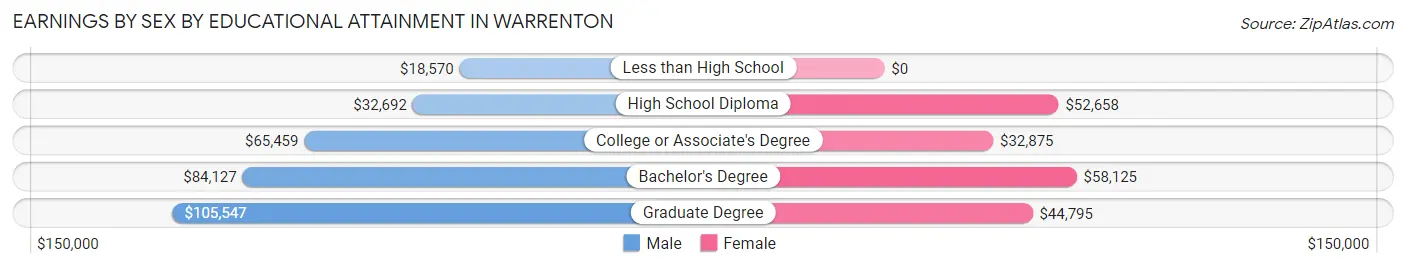
Earnings by Sex by Educational Attainment in Warrenton
Average earnings in Warrenton are $66,173 for men and $47,848 for women, a difference of 27.7%. Men with an educational attainment of graduate degree enjoy the highest average annual earnings of $105,547, while those with less than high school education earn the least with $18,570. Women with an educational attainment of bachelor's degree earn the most with the average annual earnings of $58,125, while those with college or associate's degree education have the smallest earnings of $32,875.
| Educational Attainment | Male Income | Female Income |
| Less than High School | $18,570 | $0 |
| High School Diploma | $32,692 | $52,658 |
| College or Associate's Degree | $65,459 | $32,875 |
| Bachelor's Degree | $84,127 | $58,125 |
| Graduate Degree | $105,547 | $44,795 |
| Total | $66,173 | $47,848 |
Family Income in Warrenton
Family Income Brackets in Warrenton
According to the Warrenton family income data, there are 484 families falling into the $150,000 to $199,999 income range, which is the most common income bracket and makes up 22.2% of all families. Conversely, the $15,000 to $24,999 income bracket is the least frequent group with only 17 families (0.8%) belonging to this category.
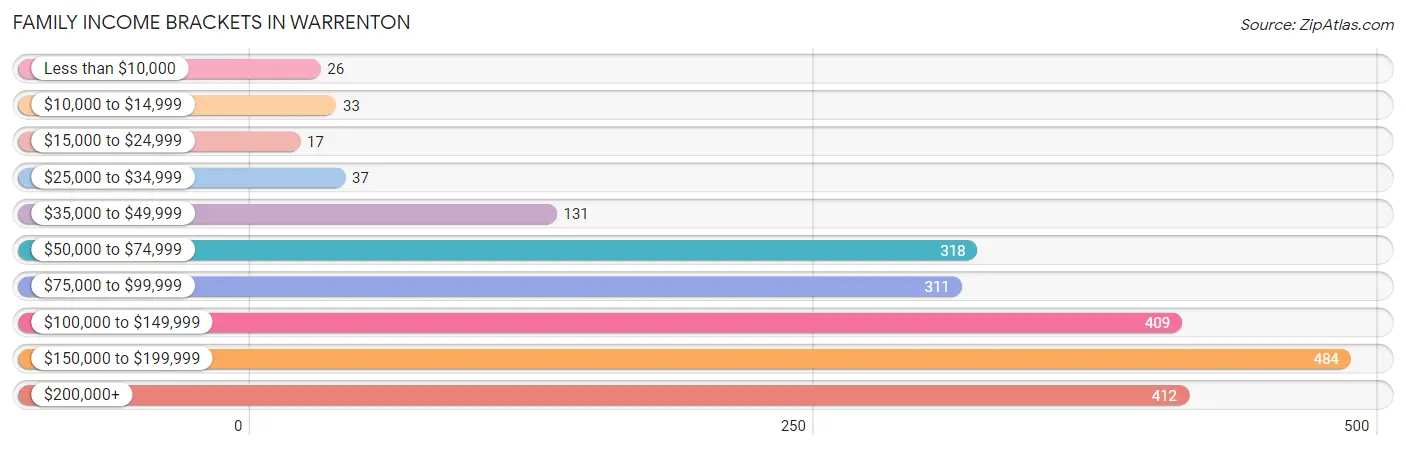
| Income Bracket | # Families | % Families |
| Less than $10,000 | 26 | 1.2% |
| $10,000 to $14,999 | 33 | 1.5% |
| $15,000 to $24,999 | 17 | 0.8% |
| $25,000 to $34,999 | 37 | 1.7% |
| $35,000 to $49,999 | 131 | 6.0% |
| $50,000 to $74,999 | 318 | 14.6% |
| $75,000 to $99,999 | 311 | 14.3% |
| $100,000 to $149,999 | 409 | 18.8% |
| $150,000 to $199,999 | 484 | 22.2% |
| $200,000+ | 412 | 18.9% |
Family Income by Famaliy Size in Warrenton
6-person families (132 | 6.1%) account for the highest median family income in Warrenton with $190,397 per family, while 2-person families (857 | 39.4%) have the highest median income of $50,903 per family member.
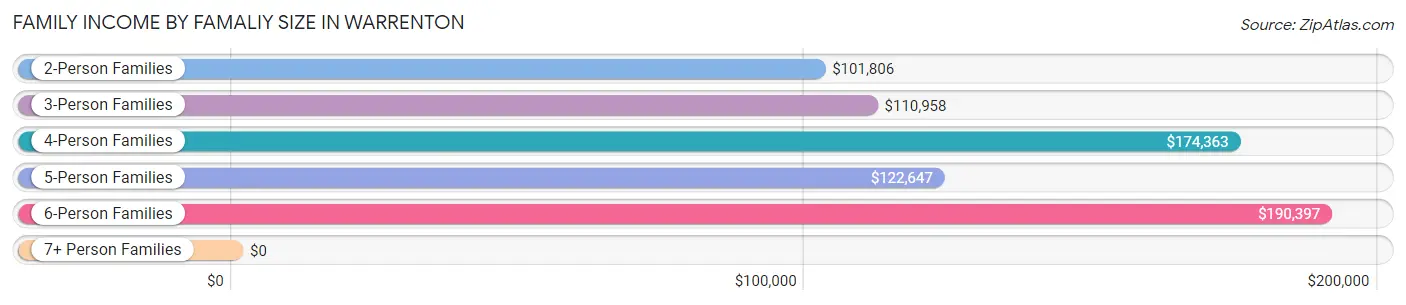
| Income Bracket | # Families | Median Income |
| 2-Person Families | 857 (39.4%) | $101,806 |
| 3-Person Families | 429 (19.7%) | $110,958 |
| 4-Person Families | 527 (24.2%) | $174,363 |
| 5-Person Families | 226 (10.4%) | $122,647 |
| 6-Person Families | 132 (6.1%) | $190,397 |
| 7+ Person Families | 7 (0.3%) | $0 |
| Total | 2,178 (100.0%) | $124,545 |
Family Income by Number of Earners in Warrenton
The median family income in Warrenton is $124,545, with families comprising 2 earners (962) having the highest median family income of $173,632, while families with no earners (176) have the lowest median family income of $69,833, accounting for 44.2% and 8.1% of families, respectively.
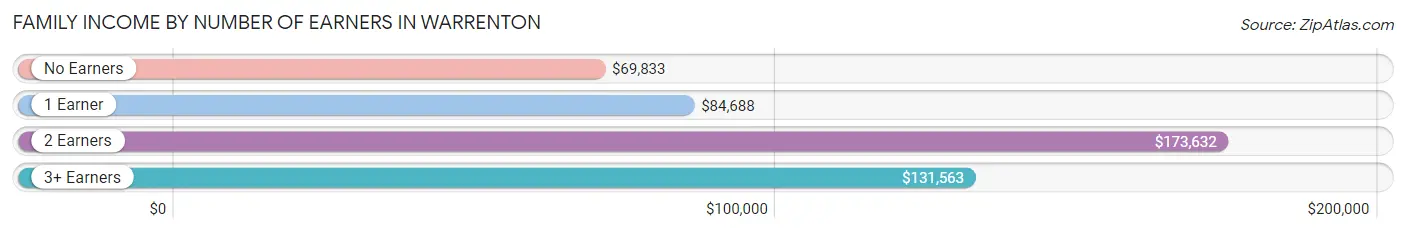
| Number of Earners | # Families | Median Income |
| No Earners | 176 (8.1%) | $69,833 |
| 1 Earner | 648 (29.7%) | $84,688 |
| 2 Earners | 962 (44.2%) | $173,632 |
| 3+ Earners | 392 (18.0%) | $131,563 |
| Total | 2,178 (100.0%) | $124,545 |
Household Income in Warrenton
Household Income Brackets in Warrenton
With 719 households falling in the category, the $50,000 to $74,999 income range is the most frequent in Warrenton, accounting for 18.3% of all households. In contrast, only 86 households (2.2%) fall into the less than $10,000 income bracket, making it the least populous group.
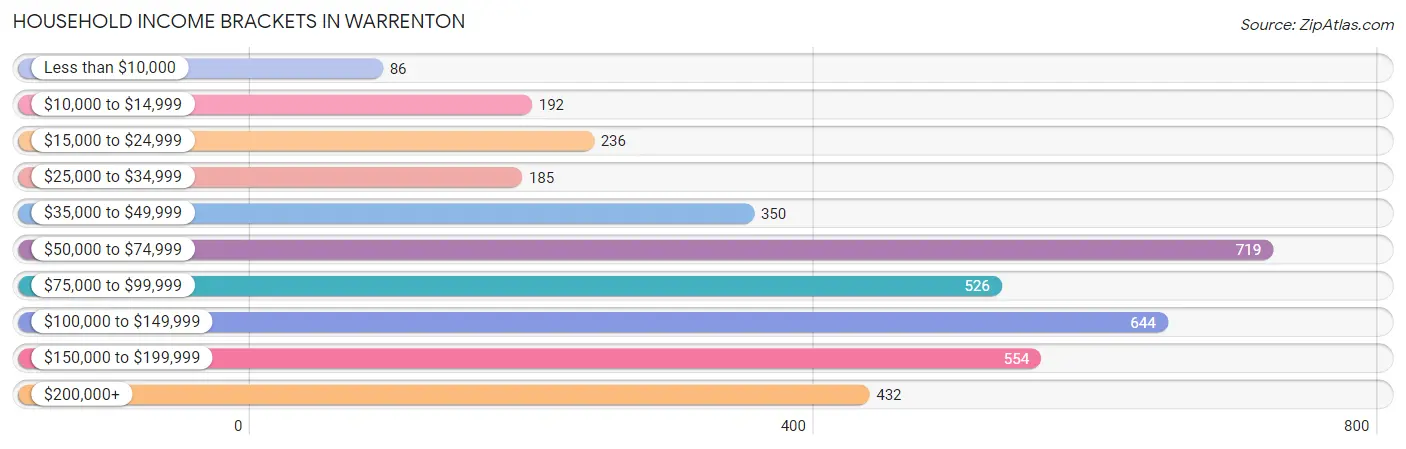
| Income Bracket | # Households | % Households |
| Less than $10,000 | 86 | 2.2% |
| $10,000 to $14,999 | 192 | 4.9% |
| $15,000 to $24,999 | 236 | 6.0% |
| $25,000 to $34,999 | 185 | 4.7% |
| $35,000 to $49,999 | 350 | 8.9% |
| $50,000 to $74,999 | 719 | 18.3% |
| $75,000 to $99,999 | 526 | 13.4% |
| $100,000 to $149,999 | 644 | 16.4% |
| $150,000 to $199,999 | 554 | 14.1% |
| $200,000+ | 432 | 11.0% |
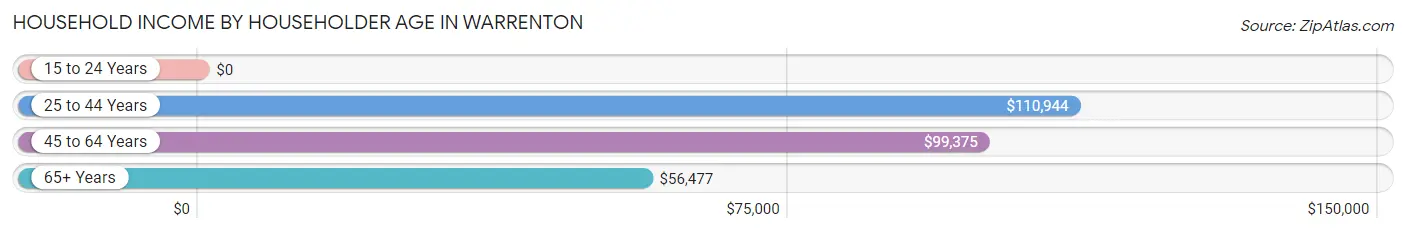
Household Income by Householder Age in Warrenton
The median household income in Warrenton is $83,737, with the highest median household income of $110,944 found in the 25 to 44 years age bracket for the primary householder. A total of 1,122 households (28.6%) fall into this category. Meanwhile, the 15 to 24 years age bracket for the primary householder has the lowest median household income of $0, with 74 households (1.9%) in this group.
| Income Bracket | # Households | Median Income |
| 15 to 24 Years | 74 (1.9%) | $0 |
| 25 to 44 Years | 1,122 (28.6%) | $110,944 |
| 45 to 64 Years | 1,619 (41.2%) | $99,375 |
| 65+ Years | 1,113 (28.3%) | $56,477 |
| Total | 3,928 (100.0%) | $83,737 |
Poverty in Warrenton
Income Below Poverty by Sex and Age in Warrenton
With 9.0% poverty level for males and 5.2% for females among the residents of Warrenton, 18 to 24 year old males and 75 year old and over females are the most vulnerable to poverty, with 120 males (25.9%) and 82 females (16.4%) in their respective age groups living below the poverty level.
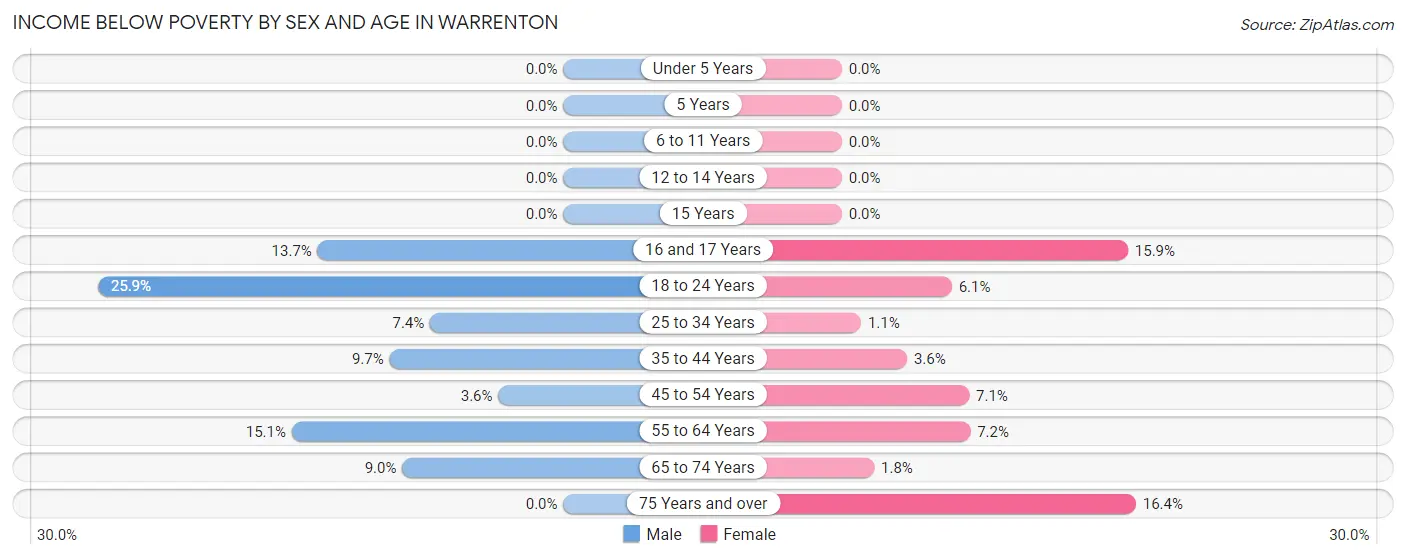
| Age Bracket | Male | Female |
| Under 5 Years | 0 (0.0%) | 0 (0.0%) |
| 5 Years | 0 (0.0%) | 0 (0.0%) |
| 6 to 11 Years | 0 (0.0%) | 0 (0.0%) |
| 12 to 14 Years | 0 (0.0%) | 0 (0.0%) |
| 15 Years | 0 (0.0%) | 0 (0.0%) |
| 16 and 17 Years | 13 (13.7%) | 29 (15.9%) |
| 18 to 24 Years | 120 (25.9%) | 29 (6.1%) |
| 25 to 34 Years | 42 (7.4%) | 6 (1.1%) |
| 35 to 44 Years | 63 (9.7%) | 20 (3.6%) |
| 45 to 54 Years | 23 (3.6%) | 56 (7.1%) |
| 55 to 64 Years | 114 (15.1%) | 47 (7.1%) |
| 65 to 74 Years | 26 (9.0%) | 8 (1.8%) |
| 75 Years and over | 0 (0.0%) | 82 (16.4%) |
| Total | 401 (9.0%) | 277 (5.2%) |
Income Above Poverty by Sex and Age in Warrenton
According to the poverty statistics in Warrenton, males aged under 5 years and females aged under 5 years are the age groups that are most secure financially, with 100.0% of males and 100.0% of females in these age groups living above the poverty line.
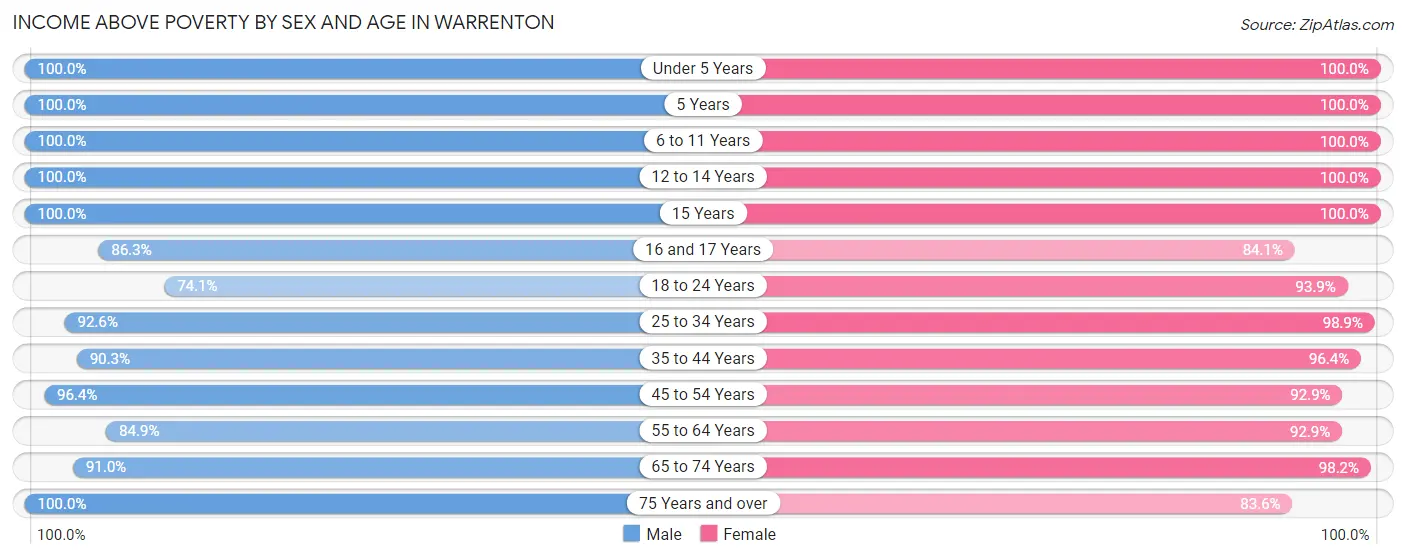
| Age Bracket | Male | Female |
| Under 5 Years | 273 (100.0%) | 509 (100.0%) |
| 5 Years | 145 (100.0%) | 13 (100.0%) |
| 6 to 11 Years | 184 (100.0%) | 351 (100.0%) |
| 12 to 14 Years | 172 (100.0%) | 254 (100.0%) |
| 15 Years | 79 (100.0%) | 12 (100.0%) |
| 16 and 17 Years | 82 (86.3%) | 153 (84.1%) |
| 18 to 24 Years | 343 (74.1%) | 445 (93.9%) |
| 25 to 34 Years | 524 (92.6%) | 557 (98.9%) |
| 35 to 44 Years | 588 (90.3%) | 531 (96.4%) |
| 45 to 54 Years | 612 (96.4%) | 734 (92.9%) |
| 55 to 64 Years | 640 (84.9%) | 610 (92.8%) |
| 65 to 74 Years | 264 (91.0%) | 436 (98.2%) |
| 75 Years and over | 161 (100.0%) | 419 (83.6%) |
| Total | 4,067 (91.0%) | 5,024 (94.8%) |
Income Below Poverty Among Married-Couple Families in Warrenton
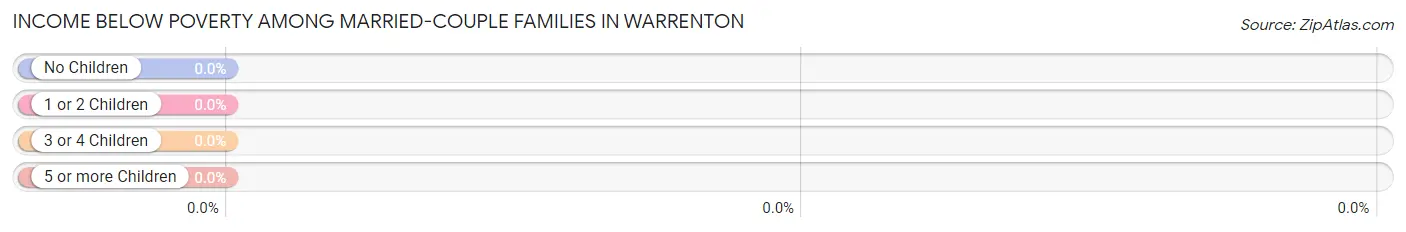
| Children | Above Poverty | Below Poverty |
| No Children | 636 (100.0%) | 0 (0.0%) |
| 1 or 2 Children | 677 (100.0%) | 0 (0.0%) |
| 3 or 4 Children | 220 (100.0%) | 0 (0.0%) |
| 5 or more Children | 7 (100.0%) | 0 (0.0%) |
| Total | 1,540 (100.0%) | 0 (0.0%) |
Income Below Poverty Among Single-Parent Households in Warrenton
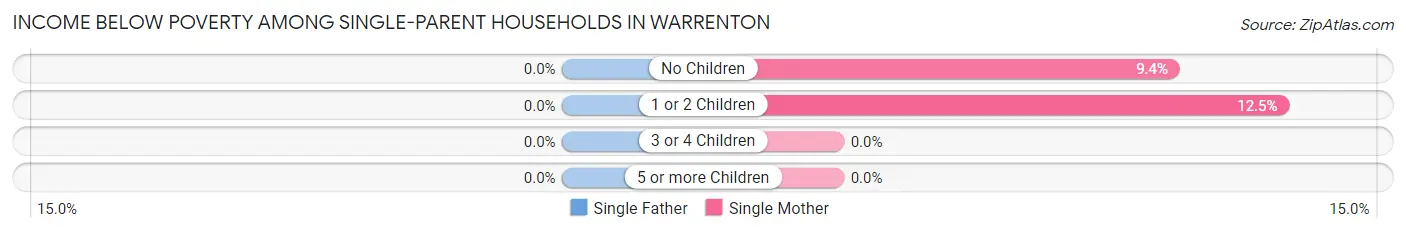
| Children | Single Father | Single Mother |
| No Children | 0 (0.0%) | 26 (9.4%) |
| 1 or 2 Children | 0 (0.0%) | 33 (12.4%) |
| 3 or 4 Children | 0 (0.0%) | 0 (0.0%) |
| 5 or more Children | 0 (0.0%) | 0 (0.0%) |
| Total | 0 (0.0%) | 59 (10.9%) |
Income Below Poverty Among Married-Couple vs Single-Parent Households in Warrenton
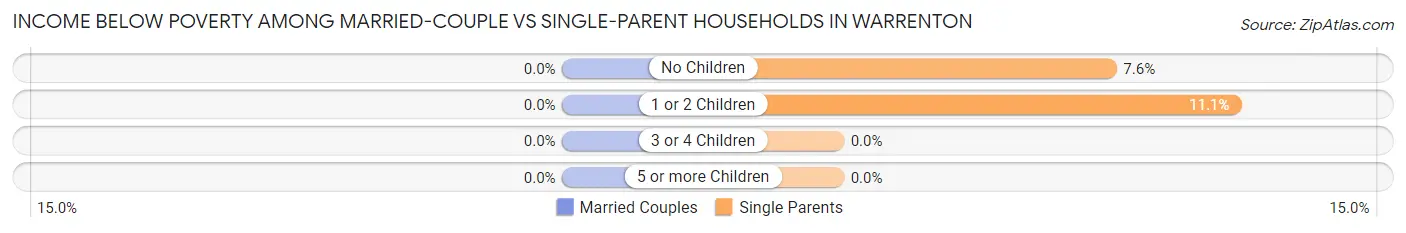
| Children | Married-Couple Families | Single-Parent Households |
| No Children | 0 (0.0%) | 26 (7.6%) |
| 1 or 2 Children | 0 (0.0%) | 33 (11.1%) |
| 3 or 4 Children | 0 (0.0%) | 0 (0.0%) |
| 5 or more Children | 0 (0.0%) | 0 (0.0%) |
| Total | 0 (0.0%) | 59 (9.2%) |
Race in Warrenton
The most populous races in Warrenton are White / Caucasian (7,719 | 76.3%), Two or more Races (1,084 | 10.7%), and Black / African American (833 | 8.2%).
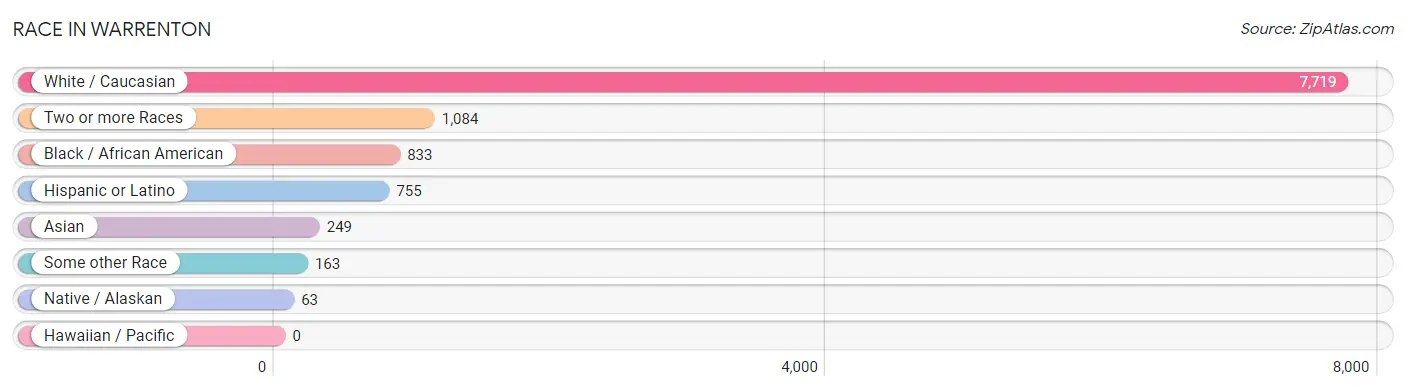
| Race | # Population | % Population |
| Asian | 249 | 2.5% |
| Black / African American | 833 | 8.2% |
| Hawaiian / Pacific | 0 | 0.0% |
| Hispanic or Latino | 755 | 7.5% |
| Native / Alaskan | 63 | 0.6% |
| White / Caucasian | 7,719 | 76.3% |
| Two or more Races | 1,084 | 10.7% |
| Some other Race | 163 | 1.6% |
| Total | 10,111 | 100.0% |
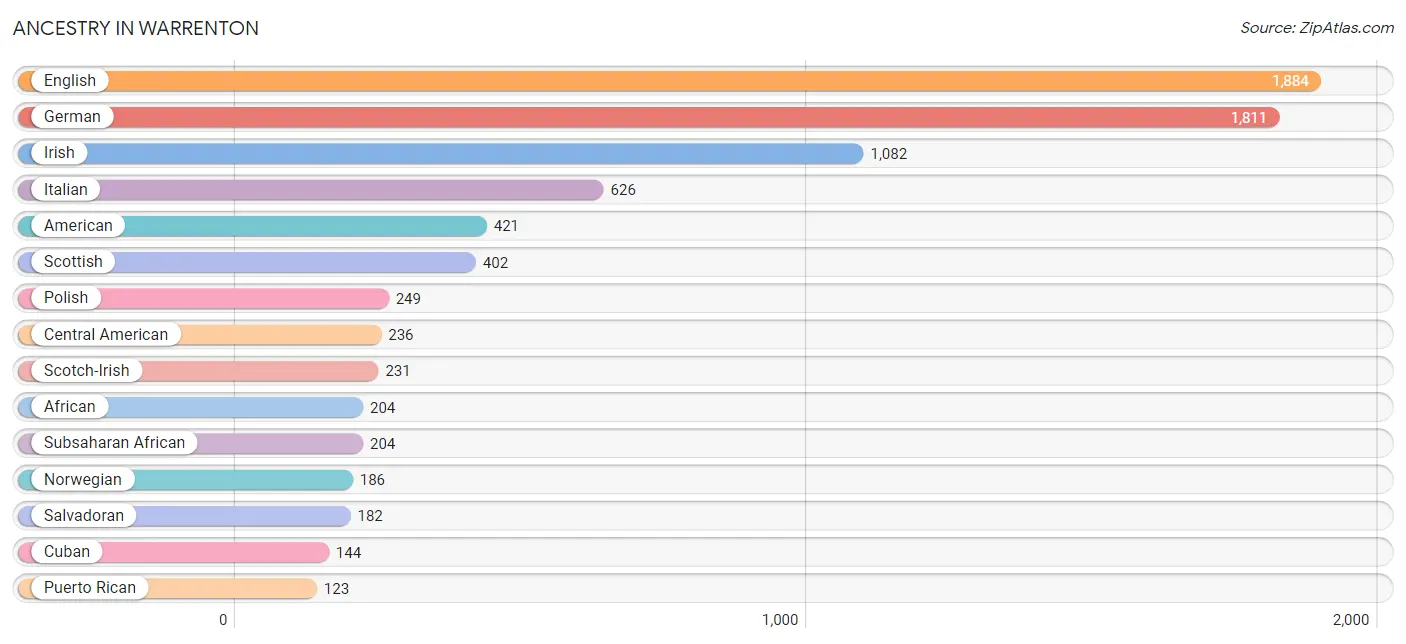
Ancestry in Warrenton
The most populous ancestries reported in Warrenton are English (1,884 | 18.6%), German (1,811 | 17.9%), Irish (1,082 | 10.7%), Italian (626 | 6.2%), and American (421 | 4.2%), together accounting for 57.6% of all Warrenton residents.
| Ancestry | # Population | % Population |
| African | 204 | 2.0% |
| Albanian | 43 | 0.4% |
| American | 421 | 4.2% |
| Australian | 7 | 0.1% |
| Austrian | 23 | 0.2% |
| Bolivian | 27 | 0.3% |
| Brazilian | 82 | 0.8% |
| British | 36 | 0.4% |
| Bulgarian | 7 | 0.1% |
| Burmese | 8 | 0.1% |
| Cajun | 35 | 0.4% |
| Canadian | 87 | 0.9% |
| Celtic | 43 | 0.4% |
| Central American | 236 | 2.3% |
| Central American Indian | 58 | 0.6% |
| Cherokee | 65 | 0.6% |
| Costa Rican | 23 | 0.2% |
| Cuban | 144 | 1.4% |
| Czech | 5 | 0.1% |
| Czechoslovakian | 23 | 0.2% |
| Dominican | 17 | 0.2% |
| Dutch | 113 | 1.1% |
| English | 1,884 | 18.6% |
| European | 99 | 1.0% |
| French | 93 | 0.9% |
| French Canadian | 32 | 0.3% |
| German | 1,811 | 17.9% |
| Guatemalan | 19 | 0.2% |
| Guyanese | 26 | 0.3% |
| Hungarian | 23 | 0.2% |
| Icelander | 14 | 0.1% |
| Indian (Asian) | 57 | 0.6% |
| Irish | 1,082 | 10.7% |
| Italian | 626 | 6.2% |
| Japanese | 11 | 0.1% |
| Korean | 60 | 0.6% |
| Mexican | 109 | 1.1% |
| Nicaraguan | 12 | 0.1% |
| Northern European | 103 | 1.0% |
| Norwegian | 186 | 1.8% |
| Polish | 249 | 2.5% |
| Portuguese | 24 | 0.2% |
| Puerto Rican | 123 | 1.2% |
| Salvadoran | 182 | 1.8% |
| Scandinavian | 98 | 1.0% |
| Scotch-Irish | 231 | 2.3% |
| Scottish | 402 | 4.0% |
| Slovak | 26 | 0.3% |
| South American | 37 | 0.4% |
| Sri Lankan | 107 | 1.1% |
| Subsaharan African | 204 | 2.0% |
| Swedish | 8 | 0.1% |
| Swiss | 12 | 0.1% |
| Thai | 64 | 0.6% |
| Ukrainian | 20 | 0.2% |
| Venezuelan | 10 | 0.1% |
| Welsh | 102 | 1.0% |
| Yaqui | 4 | 0.0% |
| Yugoslavian | 32 | 0.3% | View All 59 Rows |
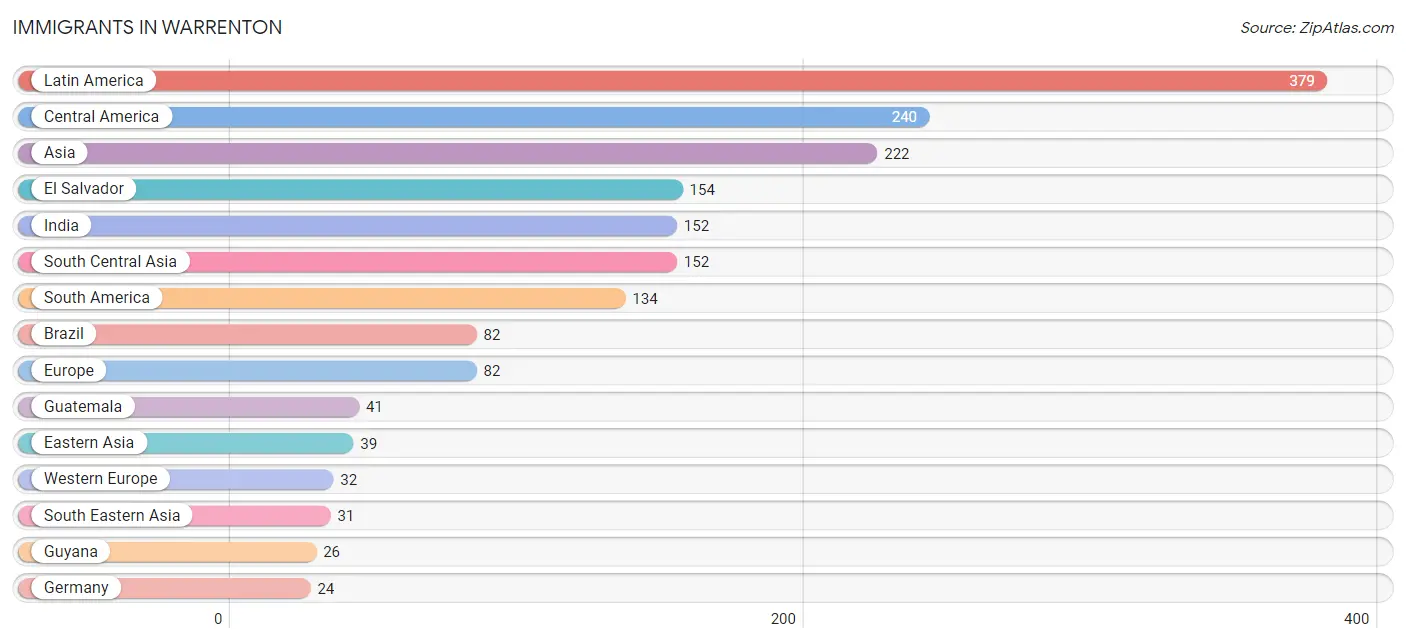
Immigrants in Warrenton
The most numerous immigrant groups reported in Warrenton came from Latin America (379 | 3.7%), Central America (240 | 2.4%), Asia (222 | 2.2%), El Salvador (154 | 1.5%), and India (152 | 1.5%), together accounting for 11.3% of all Warrenton residents.
| Immigration Origin | # Population | % Population |
| Africa | 14 | 0.1% |
| Asia | 222 | 2.2% |
| Bolivia | 16 | 0.2% |
| Brazil | 82 | 0.8% |
| Bulgaria | 7 | 0.1% |
| Cambodia | 11 | 0.1% |
| Caribbean | 5 | 0.1% |
| Central America | 240 | 2.4% |
| China | 22 | 0.2% |
| Costa Rica | 23 | 0.2% |
| Cuba | 5 | 0.1% |
| Eastern Asia | 39 | 0.4% |
| Eastern Europe | 7 | 0.1% |
| Egypt | 14 | 0.1% |
| El Salvador | 154 | 1.5% |
| England | 19 | 0.2% |
| Europe | 82 | 0.8% |
| France | 8 | 0.1% |
| Germany | 24 | 0.2% |
| Guatemala | 41 | 0.4% |
| Guyana | 26 | 0.3% |
| India | 152 | 1.5% |
| Italy | 19 | 0.2% |
| Korea | 17 | 0.2% |
| Latin America | 379 | 3.7% |
| Mexico | 10 | 0.1% |
| Nicaragua | 12 | 0.1% |
| Northern Africa | 14 | 0.1% |
| Northern Europe | 24 | 0.2% |
| Philippines | 20 | 0.2% |
| South America | 134 | 1.3% |
| South Central Asia | 152 | 1.5% |
| South Eastern Asia | 31 | 0.3% |
| Southern Europe | 19 | 0.2% |
| Venezuela | 10 | 0.1% |
| Western Europe | 32 | 0.3% | View All 36 Rows |
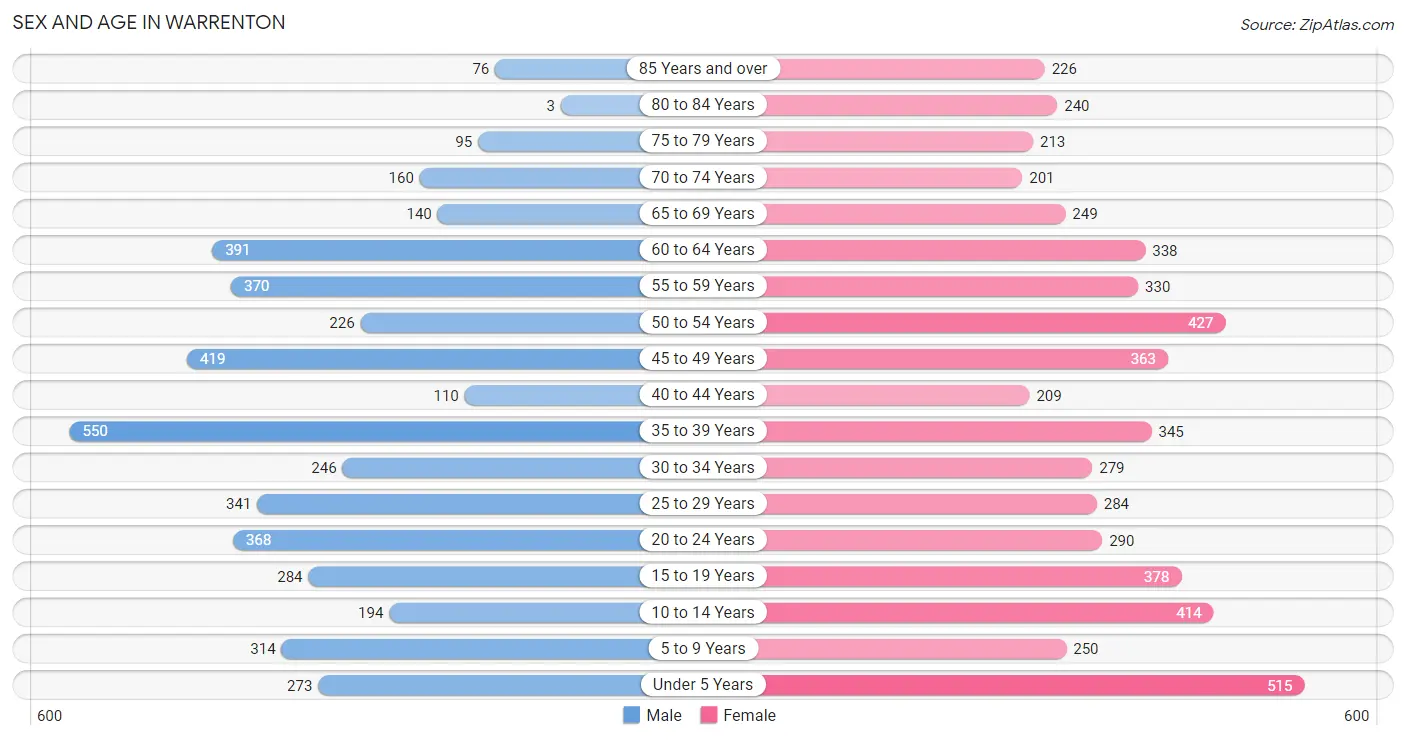
Sex and Age in Warrenton
Sex and Age in Warrenton
The most populous age groups in Warrenton are 35 to 39 Years (550 | 12.1%) for men and Under 5 Years (515 | 9.3%) for women.
| Age Bracket | Male | Female |
| Under 5 Years | 273 (6.0%) | 515 (9.3%) |
| 5 to 9 Years | 314 (6.9%) | 250 (4.5%) |
| 10 to 14 Years | 194 (4.3%) | 414 (7.5%) |
| 15 to 19 Years | 284 (6.2%) | 378 (6.8%) |
| 20 to 24 Years | 368 (8.1%) | 290 (5.2%) |
| 25 to 29 Years | 341 (7.5%) | 284 (5.1%) |
| 30 to 34 Years | 246 (5.4%) | 279 (5.0%) |
| 35 to 39 Years | 550 (12.1%) | 345 (6.2%) |
| 40 to 44 Years | 110 (2.4%) | 209 (3.8%) |
| 45 to 49 Years | 419 (9.2%) | 363 (6.5%) |
| 50 to 54 Years | 226 (5.0%) | 427 (7.7%) |
| 55 to 59 Years | 370 (8.1%) | 330 (5.9%) |
| 60 to 64 Years | 391 (8.6%) | 338 (6.1%) |
| 65 to 69 Years | 140 (3.1%) | 249 (4.5%) |
| 70 to 74 Years | 160 (3.5%) | 201 (3.6%) |
| 75 to 79 Years | 95 (2.1%) | 213 (3.8%) |
| 80 to 84 Years | 3 (0.1%) | 240 (4.3%) |
| 85 Years and over | 76 (1.7%) | 226 (4.1%) |
| Total | 4,560 (100.0%) | 5,551 (100.0%) |
Families and Households in Warrenton
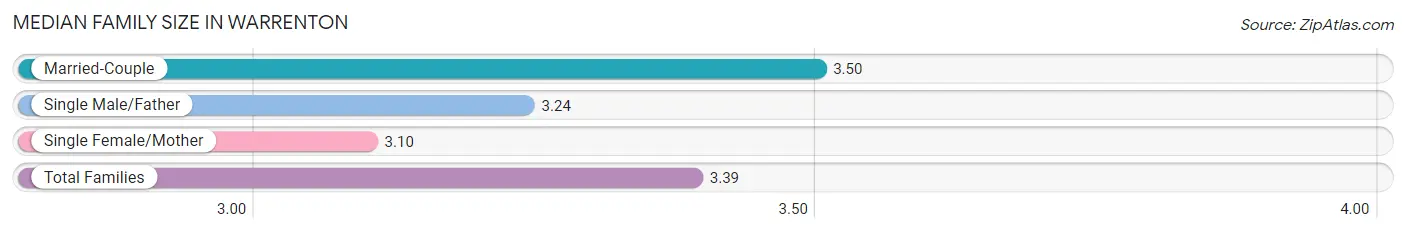
Median Family Size in Warrenton
The median family size in Warrenton is 3.39 persons per family, with married-couple families (1,540 | 70.7%) accounting for the largest median family size of 3.5 persons per family. On the other hand, single female/mother families (542 | 24.9%) represent the smallest median family size with 3.10 persons per family.
| Family Type | # Families | Family Size |
| Married-Couple | 1,540 (70.7%) | 3.50 |
| Single Male/Father | 96 (4.4%) | 3.24 |
| Single Female/Mother | 542 (24.9%) | 3.10 |
| Total Families | 2,178 (100.0%) | 3.39 |
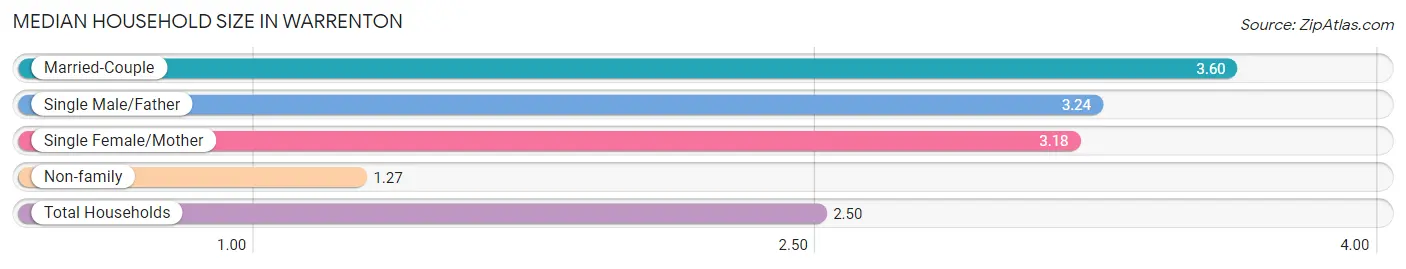
Median Household Size in Warrenton
The median household size in Warrenton is 2.50 persons per household, with married-couple households (1,540 | 39.2%) accounting for the largest median household size of 3.6 persons per household. non-family households (1,750 | 44.6%) represent the smallest median household size with 1.27 persons per household.
| Household Type | # Households | Household Size |
| Married-Couple | 1,540 (39.2%) | 3.60 |
| Single Male/Father | 96 (2.4%) | 3.24 |
| Single Female/Mother | 542 (13.8%) | 3.18 |
| Non-family | 1,750 (44.6%) | 1.27 |
| Total Households | 3,928 (100.0%) | 2.50 |
Household Size by Marriage Status in Warrenton
Out of a total of 3,928 households in Warrenton, 2,178 (55.4%) are family households, while 1,750 (44.6%) are nonfamily households. The most numerous type of family households are 2-person households, comprising 827, and the most common type of nonfamily households are 1-person households, comprising 1,408.
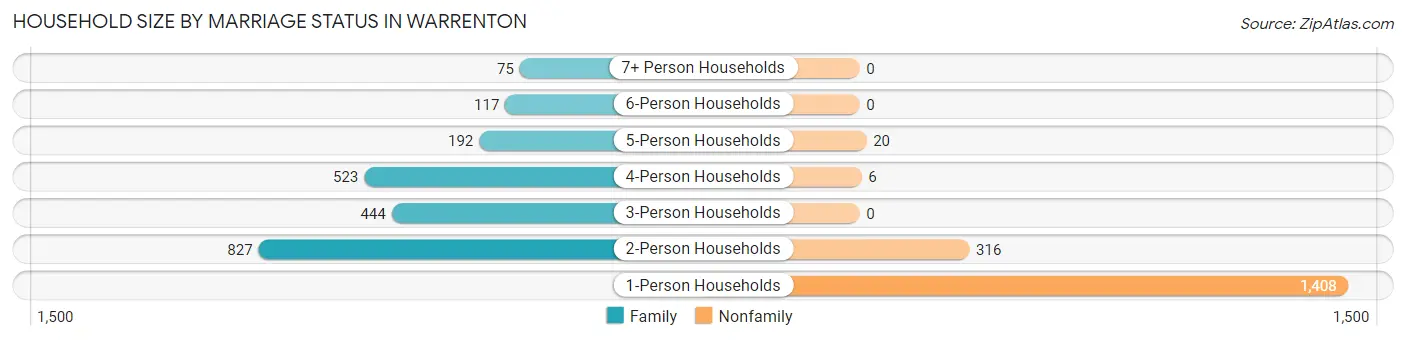
| Household Size | Family Households | Nonfamily Households |
| 1-Person Households | - | 1,408 (35.8%) |
| 2-Person Households | 827 (21.0%) | 316 (8.0%) |
| 3-Person Households | 444 (11.3%) | 0 (0.0%) |
| 4-Person Households | 523 (13.3%) | 6 (0.2%) |
| 5-Person Households | 192 (4.9%) | 20 (0.5%) |
| 6-Person Households | 117 (3.0%) | 0 (0.0%) |
| 7+ Person Households | 75 (1.9%) | 0 (0.0%) |
| Total | 2,178 (55.4%) | 1,750 (44.6%) |
Female Fertility in Warrenton
Fertility by Age in Warrenton
Average fertility rate in Warrenton is 52.0 births per 1,000 women. Women in the age bracket of 20 to 34 years have the highest fertility rate with 138.0 births per 1,000 women. Women in the age bracket of 20 to 34 years acount for 100.0% of all women with births.
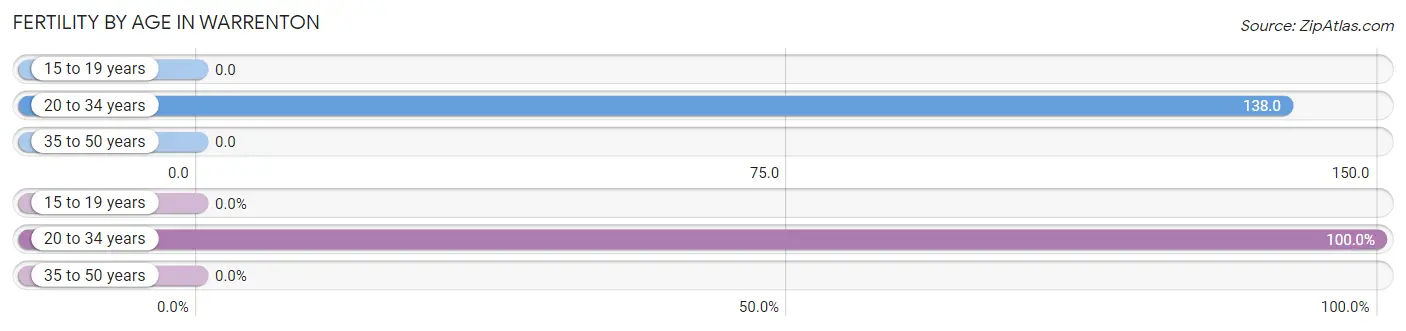
| Age Bracket | Women with Births | Births / 1,000 Women |
| 15 to 19 years | 0 (0.0%) | 0.0 |
| 20 to 34 years | 118 (100.0%) | 138.0 |
| 35 to 50 years | 0 (0.0%) | 0.0 |
| Total | 118 (100.0%) | 52.0 |
Fertility by Age by Marriage Status in Warrenton
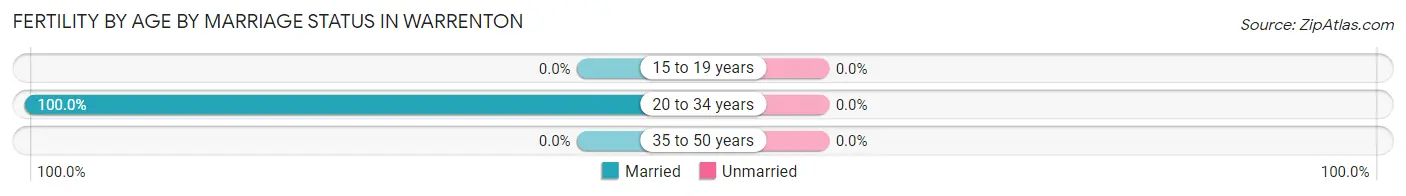
| Age Bracket | Married | Unmarried |
| 15 to 19 years | 0 (0.0%) | 0 (0.0%) |
| 20 to 34 years | 118 (100.0%) | 0 (0.0%) |
| 35 to 50 years | 0 (0.0%) | 0 (0.0%) |
| Total | 118 (100.0%) | 0 (0.0%) |
Fertility by Education in Warrenton
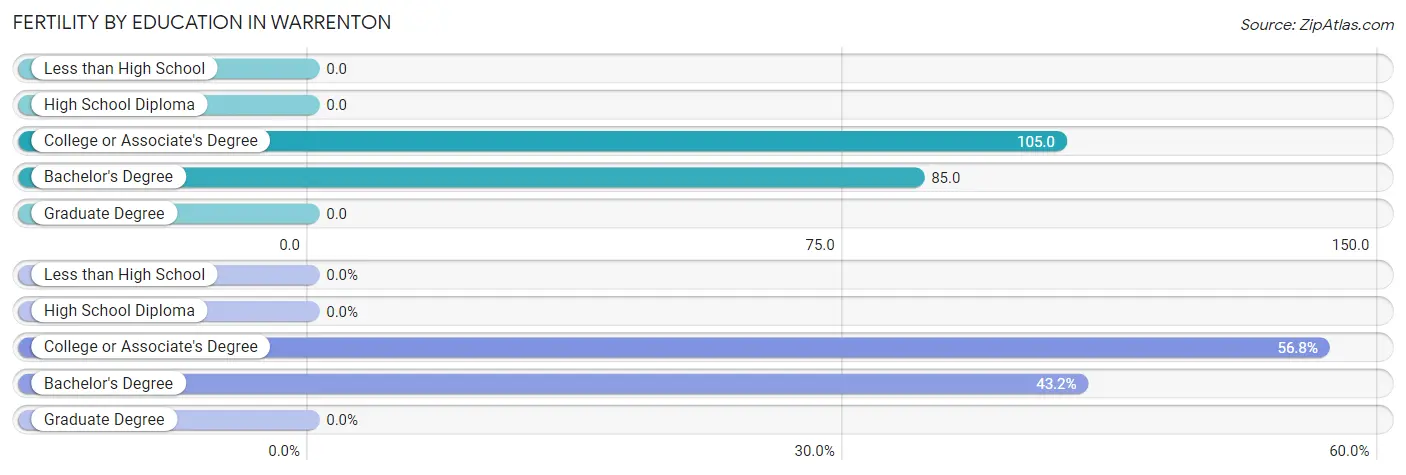
| Educational Attainment | Women with Births | Births / 1,000 Women |
| Less than High School | 0 (0.0%) | 0.0 |
| High School Diploma | 0 (0.0%) | 0.0 |
| College or Associate's Degree | 67 (56.8%) | 105.0 |
| Bachelor's Degree | 51 (43.2%) | 85.0 |
| Graduate Degree | 0 (0.0%) | 0.0 |
| Total | 118 (100.0%) | 52.0 |
Fertility by Education by Marriage Status in Warrenton
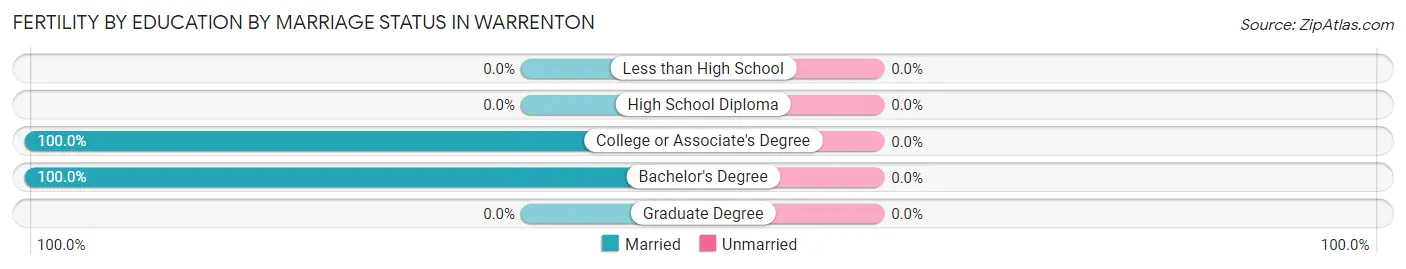
| Educational Attainment | Married | Unmarried |
| Less than High School | 0 (0.0%) | 0 (0.0%) |
| High School Diploma | 0 (0.0%) | 0 (0.0%) |
| College or Associate's Degree | 67 (100.0%) | 0 (0.0%) |
| Bachelor's Degree | 51 (100.0%) | 0 (0.0%) |
| Graduate Degree | 0 (0.0%) | 0 (0.0%) |
| Total | 118 (100.0%) | 0 (0.0%) |
Employment Characteristics in Warrenton
Employment by Class of Employer in Warrenton
Among the 5,112 employed individuals in Warrenton, private company employees (3,124 | 61.1%), local government employees (521 | 10.2%), and not-for-profit organizations (492 | 9.6%) make up the most common classes of employment.
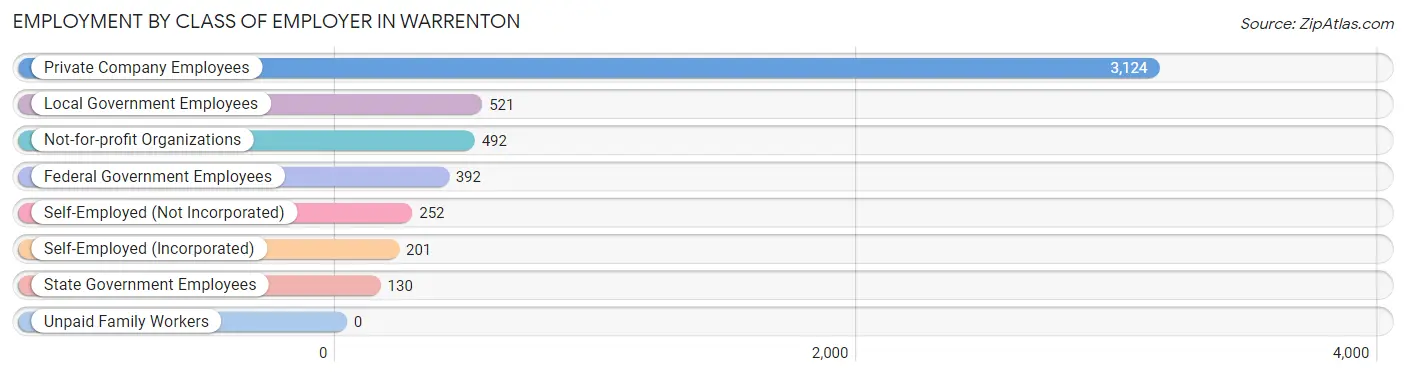
| Employer Class | # Employees | % Employees |
| Private Company Employees | 3,124 | 61.1% |
| Self-Employed (Incorporated) | 201 | 3.9% |
| Self-Employed (Not Incorporated) | 252 | 4.9% |
| Not-for-profit Organizations | 492 | 9.6% |
| Local Government Employees | 521 | 10.2% |
| State Government Employees | 130 | 2.5% |
| Federal Government Employees | 392 | 7.7% |
| Unpaid Family Workers | 0 | 0.0% |
| Total | 5,112 | 100.0% |
Employment Status by Age in Warrenton
According to the labor force statistics for Warrenton, out of the total population over 16 years of age (8,060), 65.2% or 5,255 individuals are in the labor force, with 2.1% or 110 of them unemployed. The age group with the highest labor force participation rate is 35 to 44 years, with 95.3% or 1,157 individuals in the labor force. Within the labor force, the 55 to 59 years age range has the highest percentage of unemployed individuals, with 10.2% or 53 of them being unemployed.
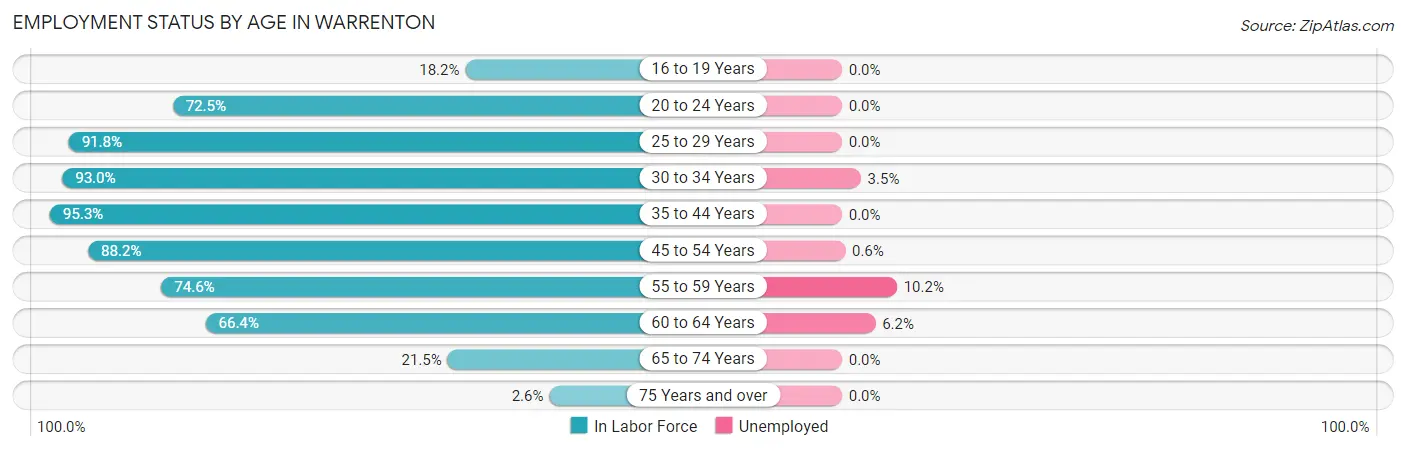
| Age Bracket | In Labor Force | Unemployed |
| 16 to 19 Years | 104 (18.2%) | 0 (0.0%) |
| 20 to 24 Years | 477 (72.5%) | 0 (0.0%) |
| 25 to 29 Years | 574 (91.8%) | 0 (0.0%) |
| 30 to 34 Years | 488 (93.0%) | 17 (3.5%) |
| 35 to 44 Years | 1,157 (95.3%) | 0 (0.0%) |
| 45 to 54 Years | 1,266 (88.2%) | 8 (0.6%) |
| 55 to 59 Years | 522 (74.6%) | 53 (10.2%) |
| 60 to 64 Years | 484 (66.4%) | 30 (6.2%) |
| 65 to 74 Years | 161 (21.5%) | 0 (0.0%) |
| 75 Years and over | 22 (2.6%) | 0 (0.0%) |
| Total | 5,255 (65.2%) | 110 (2.1%) |
Employment Status by Educational Attainment in Warrenton
According to labor force statistics for Warrenton, 85.9% of individuals (4,491) out of the total population between 25 and 64 years of age (5,228) are in the labor force, with 2.4% or 108 of them being unemployed. The group with the highest labor force participation rate are those with the educational attainment of college / associate degree, with 90.4% or 1,362 individuals in the labor force. Within the labor force, individuals with high school diploma education have the highest percentage of unemployment, with 3.8% or 25 of them being unemployed.
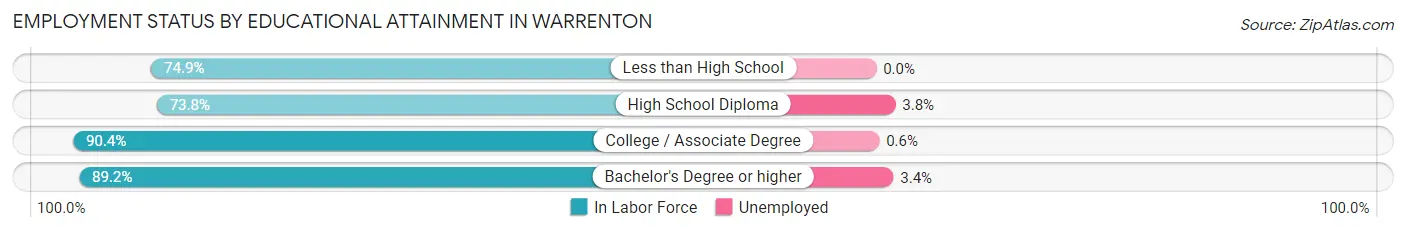
| Educational Attainment | In Labor Force | Unemployed |
| Less than High School | 275 (74.9%) | 0 (0.0%) |
| High School Diploma | 664 (73.8%) | 34 (3.8%) |
| College / Associate Degree | 1,362 (90.4%) | 9 (0.6%) |
| Bachelor's Degree or higher | 2,189 (89.2%) | 83 (3.4%) |
| Total | 4,491 (85.9%) | 125 (2.4%) |
Employment Occupations by Sex in Warrenton
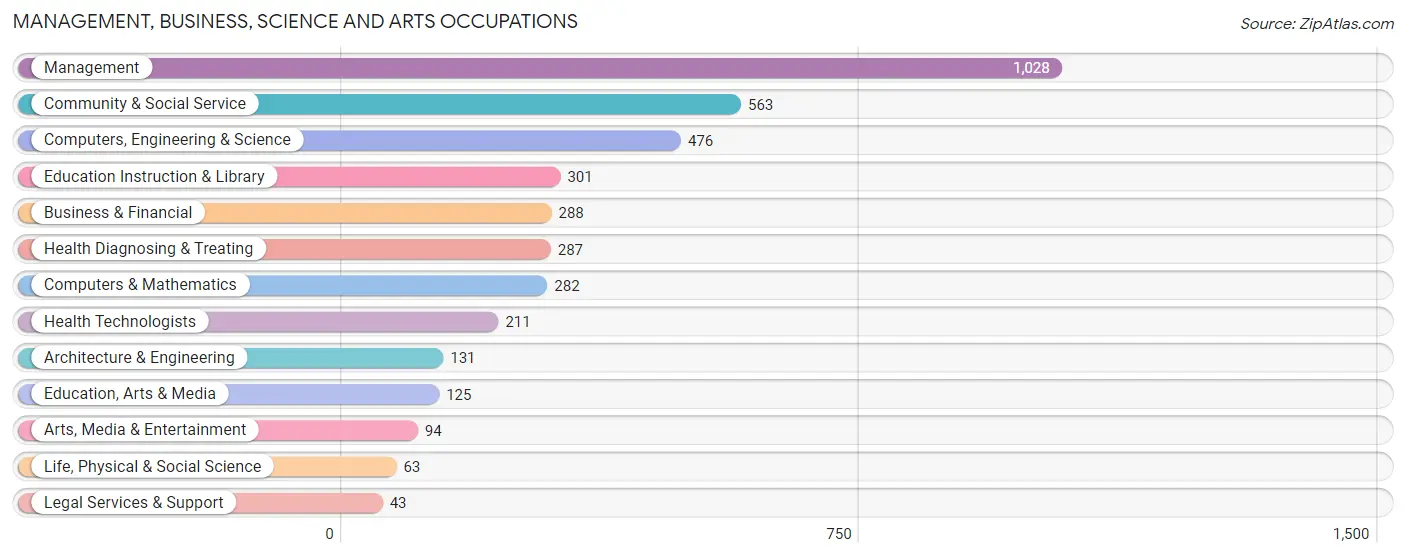
Management, Business, Science and Arts Occupations
The most common Management, Business, Science and Arts occupations in Warrenton are Management (1,028 | 20.0%), Community & Social Service (563 | 11.0%), Computers, Engineering & Science (476 | 9.3%), Education Instruction & Library (301 | 5.9%), and Business & Financial (288 | 5.6%).
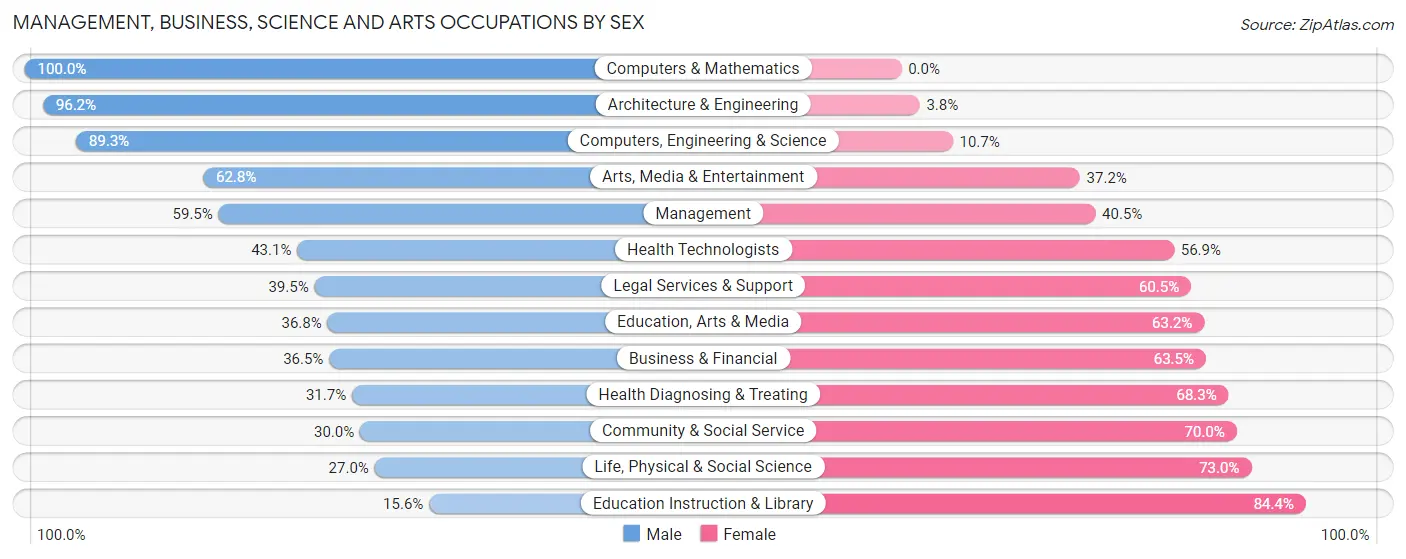
Management, Business, Science and Arts Occupations by Sex
Within the Management, Business, Science and Arts occupations in Warrenton, the most male-oriented occupations are Computers & Mathematics (100.0%), Architecture & Engineering (96.2%), and Computers, Engineering & Science (89.3%), while the most female-oriented occupations are Education Instruction & Library (84.4%), Life, Physical & Social Science (73.0%), and Community & Social Service (70.0%).
| Occupation | Male | Female |
| Management | 612 (59.5%) | 416 (40.5%) |
| Business & Financial | 105 (36.5%) | 183 (63.5%) |
| Computers, Engineering & Science | 425 (89.3%) | 51 (10.7%) |
| Computers & Mathematics | 282 (100.0%) | 0 (0.0%) |
| Architecture & Engineering | 126 (96.2%) | 5 (3.8%) |
| Life, Physical & Social Science | 17 (27.0%) | 46 (73.0%) |
| Community & Social Service | 169 (30.0%) | 394 (70.0%) |
| Education, Arts & Media | 46 (36.8%) | 79 (63.2%) |
| Legal Services & Support | 17 (39.5%) | 26 (60.5%) |
| Education Instruction & Library | 47 (15.6%) | 254 (84.4%) |
| Arts, Media & Entertainment | 59 (62.8%) | 35 (37.2%) |
| Health Diagnosing & Treating | 91 (31.7%) | 196 (68.3%) |
| Health Technologists | 91 (43.1%) | 120 (56.9%) |
| Total (Category) | 1,402 (53.1%) | 1,240 (46.9%) |
| Total (Overall) | 2,635 (51.4%) | 2,495 (48.6%) |
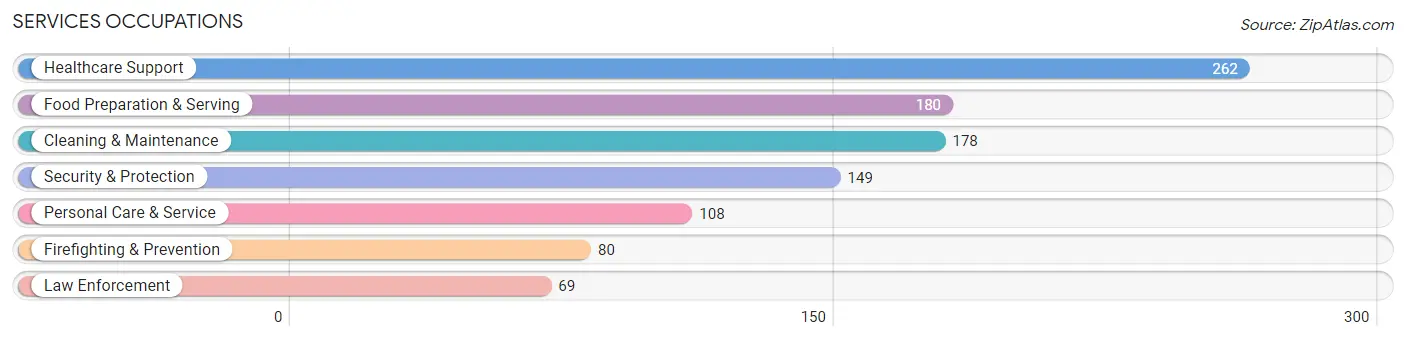
Services Occupations
The most common Services occupations in Warrenton are Healthcare Support (262 | 5.1%), Food Preparation & Serving (180 | 3.5%), Cleaning & Maintenance (178 | 3.5%), Security & Protection (149 | 2.9%), and Personal Care & Service (108 | 2.1%).
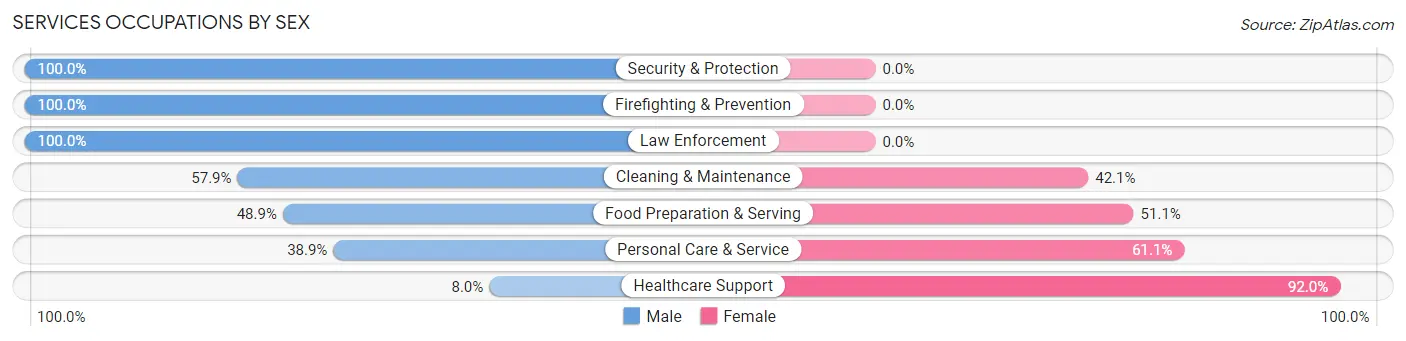
Services Occupations by Sex
Within the Services occupations in Warrenton, the most male-oriented occupations are Security & Protection (100.0%), Firefighting & Prevention (100.0%), and Law Enforcement (100.0%), while the most female-oriented occupations are Healthcare Support (92.0%), Personal Care & Service (61.1%), and Food Preparation & Serving (51.1%).
| Occupation | Male | Female |
| Healthcare Support | 21 (8.0%) | 241 (92.0%) |
| Security & Protection | 149 (100.0%) | 0 (0.0%) |
| Firefighting & Prevention | 80 (100.0%) | 0 (0.0%) |
| Law Enforcement | 69 (100.0%) | 0 (0.0%) |
| Food Preparation & Serving | 88 (48.9%) | 92 (51.1%) |
| Cleaning & Maintenance | 103 (57.9%) | 75 (42.1%) |
| Personal Care & Service | 42 (38.9%) | 66 (61.1%) |
| Total (Category) | 403 (46.0%) | 474 (54.0%) |
| Total (Overall) | 2,635 (51.4%) | 2,495 (48.6%) |
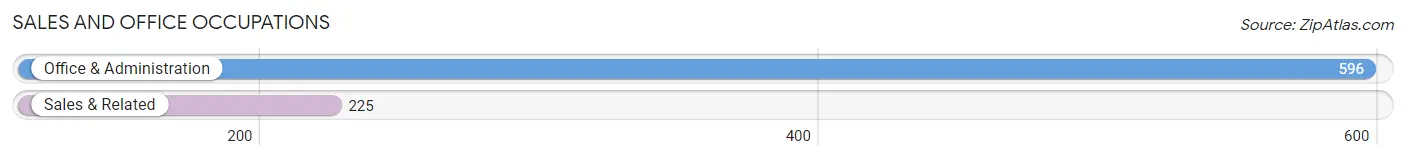
Sales and Office Occupations
The most common Sales and Office occupations in Warrenton are Office & Administration (596 | 11.6%), and Sales & Related (225 | 4.4%).
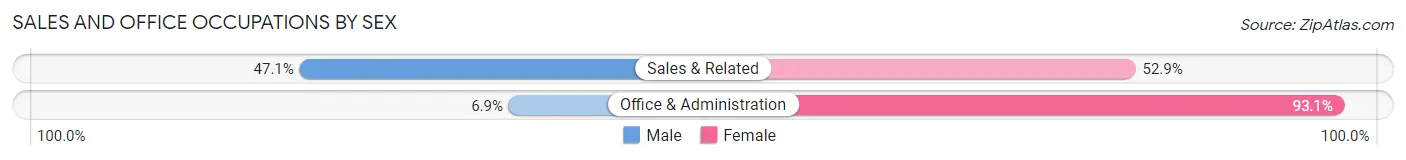
Sales and Office Occupations by Sex
| Occupation | Male | Female |
| Sales & Related | 106 (47.1%) | 119 (52.9%) |
| Office & Administration | 41 (6.9%) | 555 (93.1%) |
| Total (Category) | 147 (17.9%) | 674 (82.1%) |
| Total (Overall) | 2,635 (51.4%) | 2,495 (48.6%) |
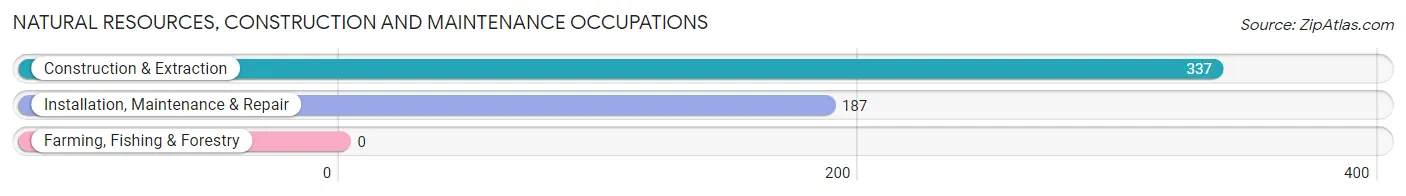
Natural Resources, Construction and Maintenance Occupations
The most common Natural Resources, Construction and Maintenance occupations in Warrenton are Construction & Extraction (337 | 6.6%), and Installation, Maintenance & Repair (187 | 3.6%).
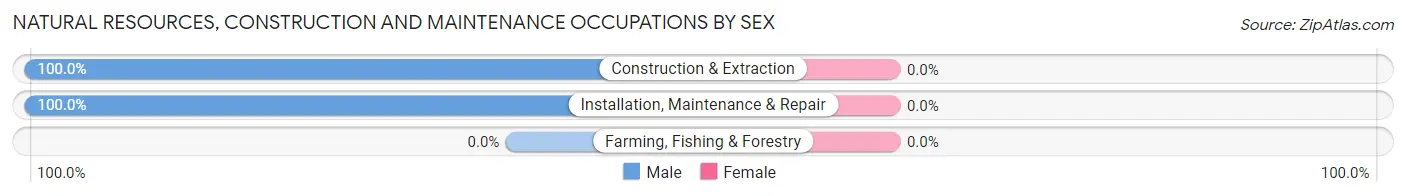
Natural Resources, Construction and Maintenance Occupations by Sex
| Occupation | Male | Female |
| Farming, Fishing & Forestry | 0 (0.0%) | 0 (0.0%) |
| Construction & Extraction | 337 (100.0%) | 0 (0.0%) |
| Installation, Maintenance & Repair | 187 (100.0%) | 0 (0.0%) |
| Total (Category) | 524 (100.0%) | 0 (0.0%) |
| Total (Overall) | 2,635 (51.4%) | 2,495 (48.6%) |
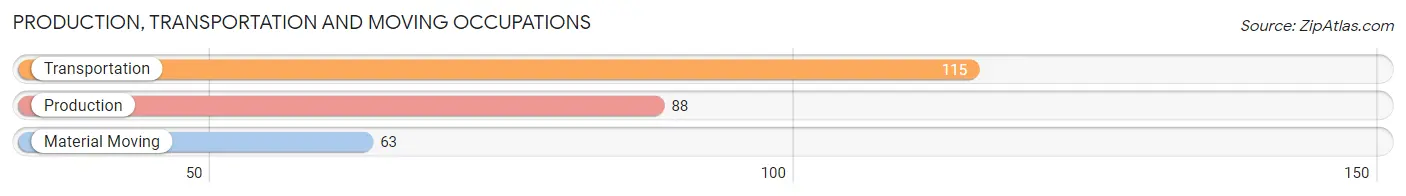
Production, Transportation and Moving Occupations
The most common Production, Transportation and Moving occupations in Warrenton are Transportation (115 | 2.2%), Production (88 | 1.7%), and Material Moving (63 | 1.2%).
Production, Transportation and Moving Occupations by Sex
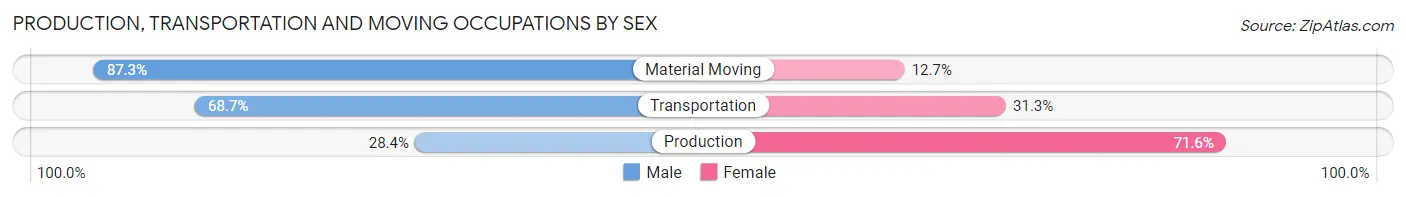
| Occupation | Male | Female |
| Production | 25 (28.4%) | 63 (71.6%) |
| Transportation | 79 (68.7%) | 36 (31.3%) |
| Material Moving | 55 (87.3%) | 8 (12.7%) |
| Total (Category) | 159 (59.8%) | 107 (40.2%) |
| Total (Overall) | 2,635 (51.4%) | 2,495 (48.6%) |
Employment Industries by Sex in Warrenton
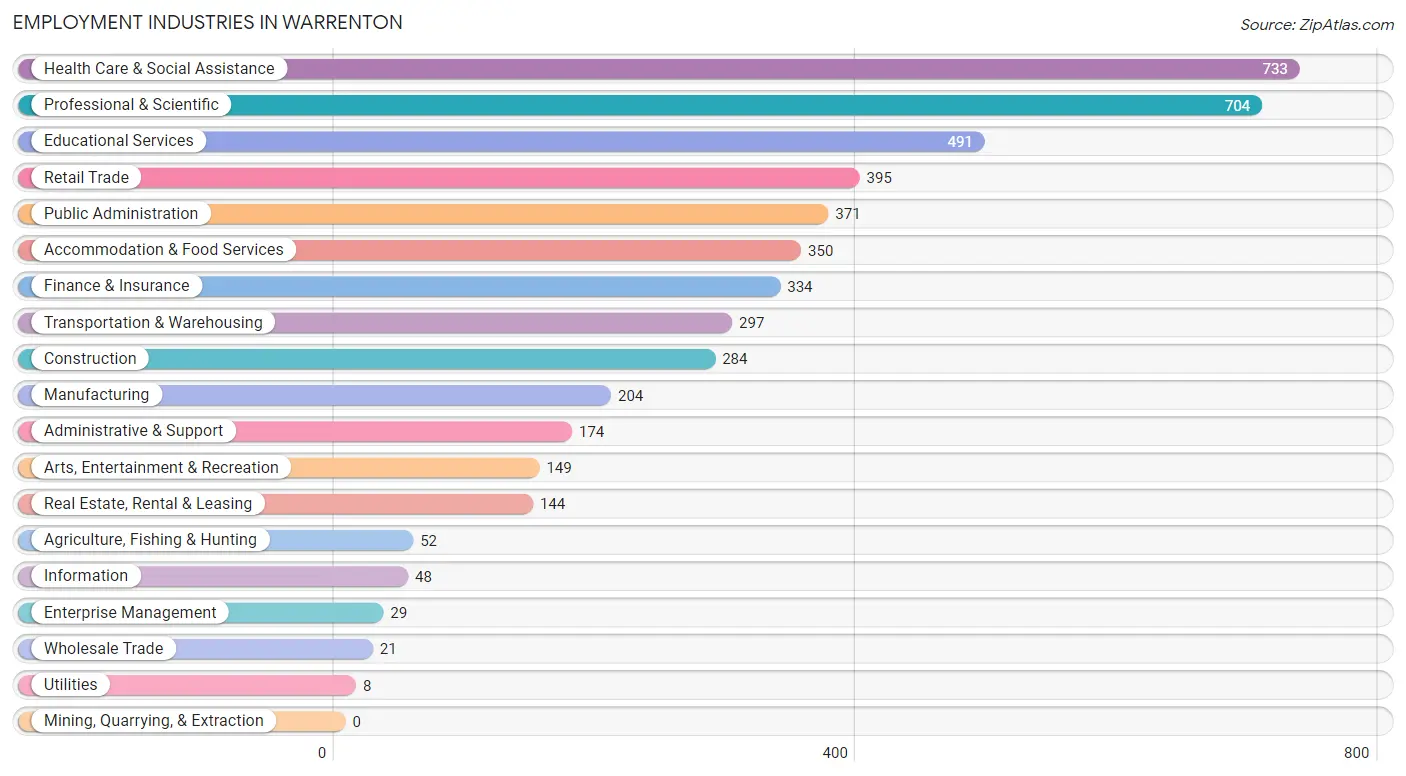
Employment Industries in Warrenton
The major employment industries in Warrenton include Health Care & Social Assistance (733 | 14.3%), Professional & Scientific (704 | 13.7%), Educational Services (491 | 9.6%), Retail Trade (395 | 7.7%), and Public Administration (371 | 7.2%).
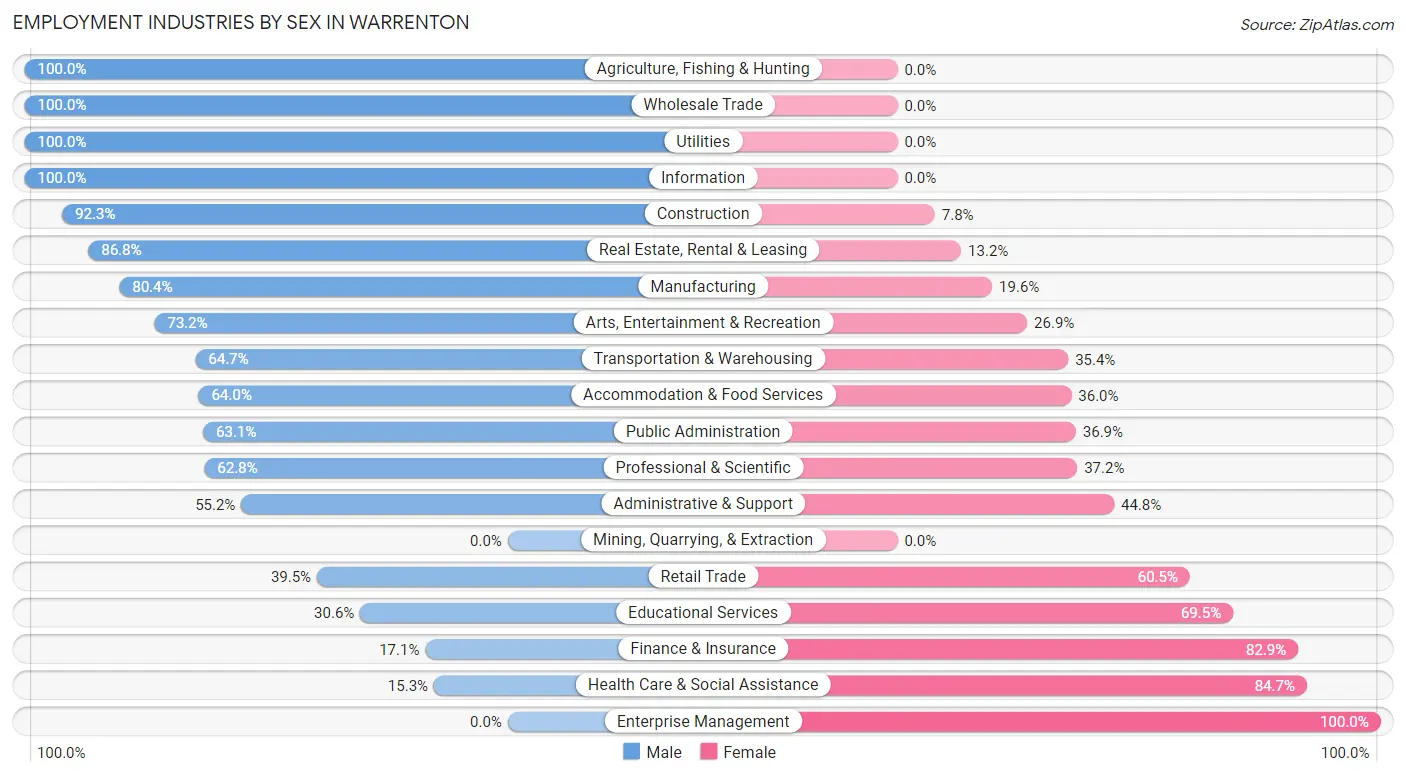
Employment Industries by Sex in Warrenton
The Warrenton industries that see more men than women are Agriculture, Fishing & Hunting (100.0%), Wholesale Trade (100.0%), and Utilities (100.0%), whereas the industries that tend to have a higher number of women are Enterprise Management (100.0%), Health Care & Social Assistance (84.7%), and Finance & Insurance (82.9%).
| Industry | Male | Female |
| Agriculture, Fishing & Hunting | 52 (100.0%) | 0 (0.0%) |
| Mining, Quarrying, & Extraction | 0 (0.0%) | 0 (0.0%) |
| Construction | 262 (92.2%) | 22 (7.7%) |
| Manufacturing | 164 (80.4%) | 40 (19.6%) |
| Wholesale Trade | 21 (100.0%) | 0 (0.0%) |
| Retail Trade | 156 (39.5%) | 239 (60.5%) |
| Transportation & Warehousing | 192 (64.6%) | 105 (35.3%) |
| Utilities | 8 (100.0%) | 0 (0.0%) |
| Information | 48 (100.0%) | 0 (0.0%) |
| Finance & Insurance | 57 (17.1%) | 277 (82.9%) |
| Real Estate, Rental & Leasing | 125 (86.8%) | 19 (13.2%) |
| Professional & Scientific | 442 (62.8%) | 262 (37.2%) |
| Enterprise Management | 0 (0.0%) | 29 (100.0%) |
| Administrative & Support | 96 (55.2%) | 78 (44.8%) |
| Educational Services | 150 (30.5%) | 341 (69.5%) |
| Health Care & Social Assistance | 112 (15.3%) | 621 (84.7%) |
| Arts, Entertainment & Recreation | 109 (73.2%) | 40 (26.9%) |
| Accommodation & Food Services | 224 (64.0%) | 126 (36.0%) |
| Public Administration | 234 (63.1%) | 137 (36.9%) |
| Total | 2,635 (51.4%) | 2,495 (48.6%) |
Education in Warrenton
School Enrollment in Warrenton
The most common levels of schooling among the 2,251 students in Warrenton are middle school (502 | 22.3%), high school (487 | 21.6%), and college / undergraduate (465 | 20.7%).
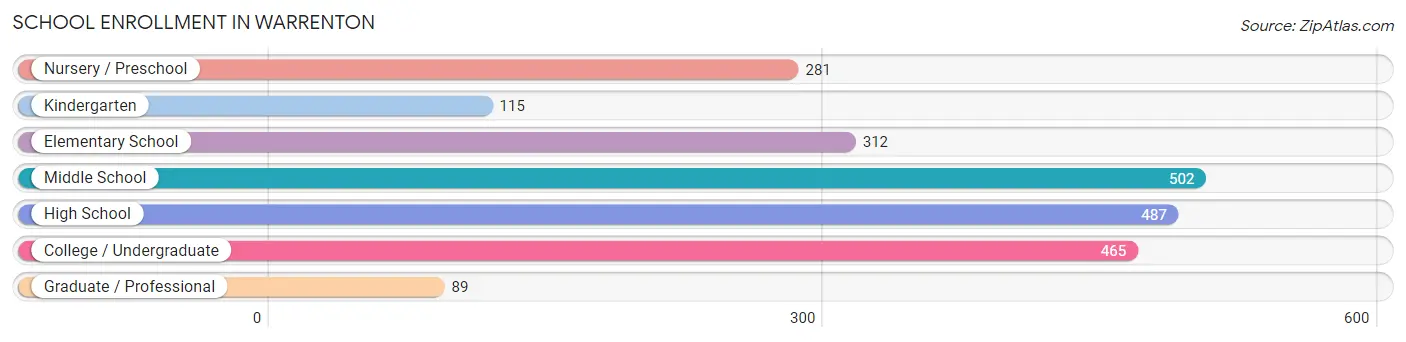
| School Level | # Students | % Students |
| Nursery / Preschool | 281 | 12.5% |
| Kindergarten | 115 | 5.1% |
| Elementary School | 312 | 13.9% |
| Middle School | 502 | 22.3% |
| High School | 487 | 21.6% |
| College / Undergraduate | 465 | 20.7% |
| Graduate / Professional | 89 | 4.0% |
| Total | 2,251 | 100.0% |
School Enrollment by Age by Funding Source in Warrenton
Out of a total of 2,251 students who are enrolled in schools in Warrenton, 603 (26.8%) attend a private institution, while the remaining 1,648 (73.2%) are enrolled in public schools. The age group of 3 to 4 year olds has the highest likelihood of being enrolled in private schools, with 160 (89.4% in the age bracket) enrolled. Conversely, the age group of 15 to 17 year olds has the lowest likelihood of being enrolled in a private school, with 352 (95.7% in the age bracket) attending a public institution.
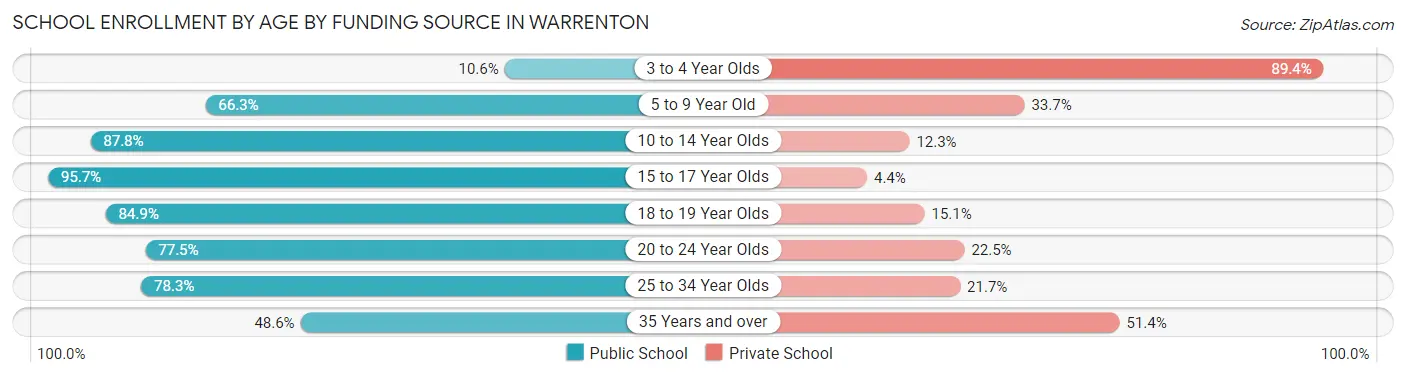
| Age Bracket | Public School | Private School |
| 3 to 4 Year Olds | 19 (10.6%) | 160 (89.4%) |
| 5 to 9 Year Old | 317 (66.3%) | 161 (33.7%) |
| 10 to 14 Year Olds | 523 (87.7%) | 73 (12.2%) |
| 15 to 17 Year Olds | 352 (95.7%) | 16 (4.3%) |
| 18 to 19 Year Olds | 124 (84.9%) | 22 (15.1%) |
| 20 to 24 Year Olds | 124 (77.5%) | 36 (22.5%) |
| 25 to 34 Year Olds | 83 (78.3%) | 23 (21.7%) |
| 35 Years and over | 106 (48.6%) | 112 (51.4%) |
| Total | 1,648 (73.2%) | 603 (26.8%) |
Educational Attainment by Field of Study in Warrenton
Business (453 | 13.7%), education (398 | 12.0%), arts & humanities (290 | 8.8%), social sciences (287 | 8.7%), and science & technology (266 | 8.1%) are the most common fields of study among 3,303 individuals in Warrenton who have obtained a bachelor's degree or higher.
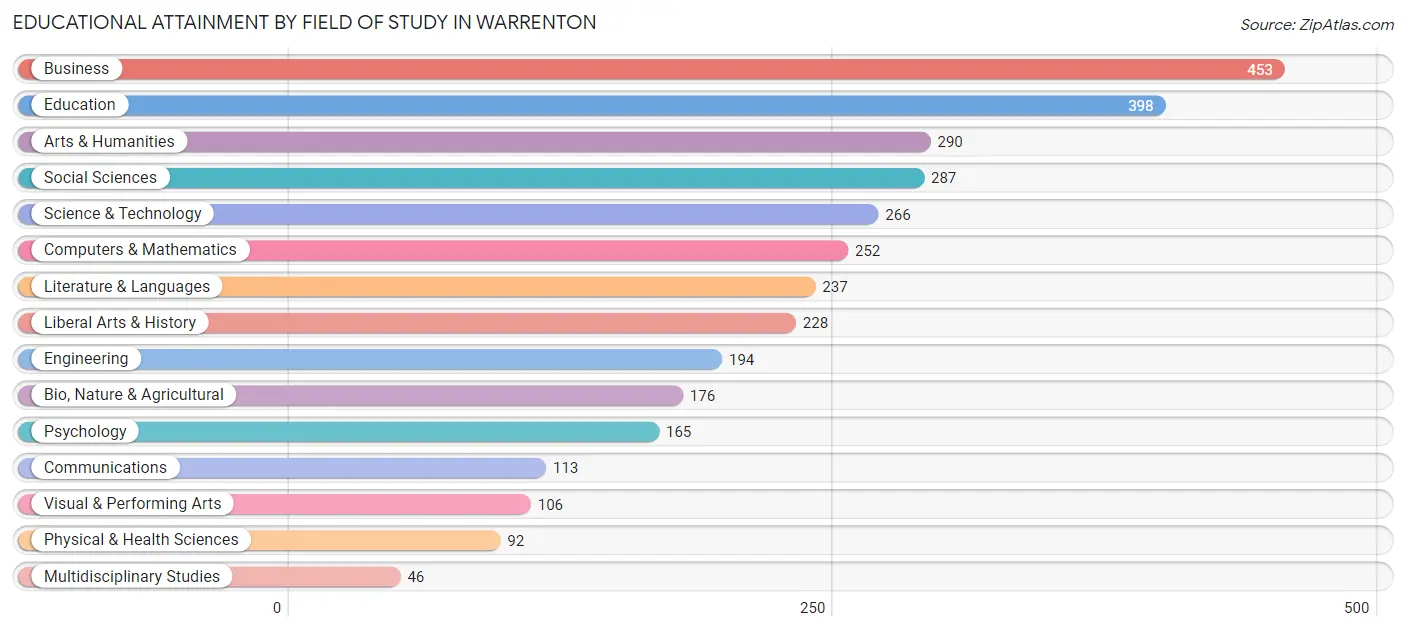
| Field of Study | # Graduates | % Graduates |
| Computers & Mathematics | 252 | 7.6% |
| Bio, Nature & Agricultural | 176 | 5.3% |
| Physical & Health Sciences | 92 | 2.8% |
| Psychology | 165 | 5.0% |
| Social Sciences | 287 | 8.7% |
| Engineering | 194 | 5.9% |
| Multidisciplinary Studies | 46 | 1.4% |
| Science & Technology | 266 | 8.1% |
| Business | 453 | 13.7% |
| Education | 398 | 12.0% |
| Literature & Languages | 237 | 7.2% |
| Liberal Arts & History | 228 | 6.9% |
| Visual & Performing Arts | 106 | 3.2% |
| Communications | 113 | 3.4% |
| Arts & Humanities | 290 | 8.8% |
| Total | 3,303 | 100.0% |
Transportation & Commute in Warrenton
Vehicle Availability by Sex in Warrenton
The most prevalent vehicle ownership categories in Warrenton are males with 2 vehicles (1,278, accounting for 48.8%) and females with 2 vehicles (1,079, making up 51.2%).
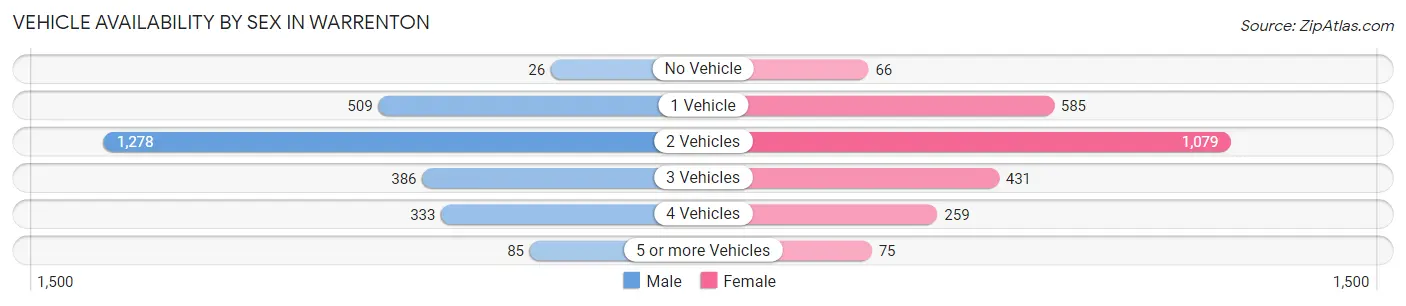
| Vehicles Available | Male | Female |
| No Vehicle | 26 (1.0%) | 66 (2.6%) |
| 1 Vehicle | 509 (19.5%) | 585 (23.4%) |
| 2 Vehicles | 1,278 (48.8%) | 1,079 (43.2%) |
| 3 Vehicles | 386 (14.7%) | 431 (17.3%) |
| 4 Vehicles | 333 (12.7%) | 259 (10.4%) |
| 5 or more Vehicles | 85 (3.3%) | 75 (3.0%) |
| Total | 2,617 (100.0%) | 2,495 (100.0%) |
Commute Time in Warrenton
The most frequently occuring commute durations in Warrenton are 5 to 9 minutes (881 commuters, 18.8%), 45 to 59 minutes (814 commuters, 17.4%), and 60 to 89 minutes (550 commuters, 11.8%).
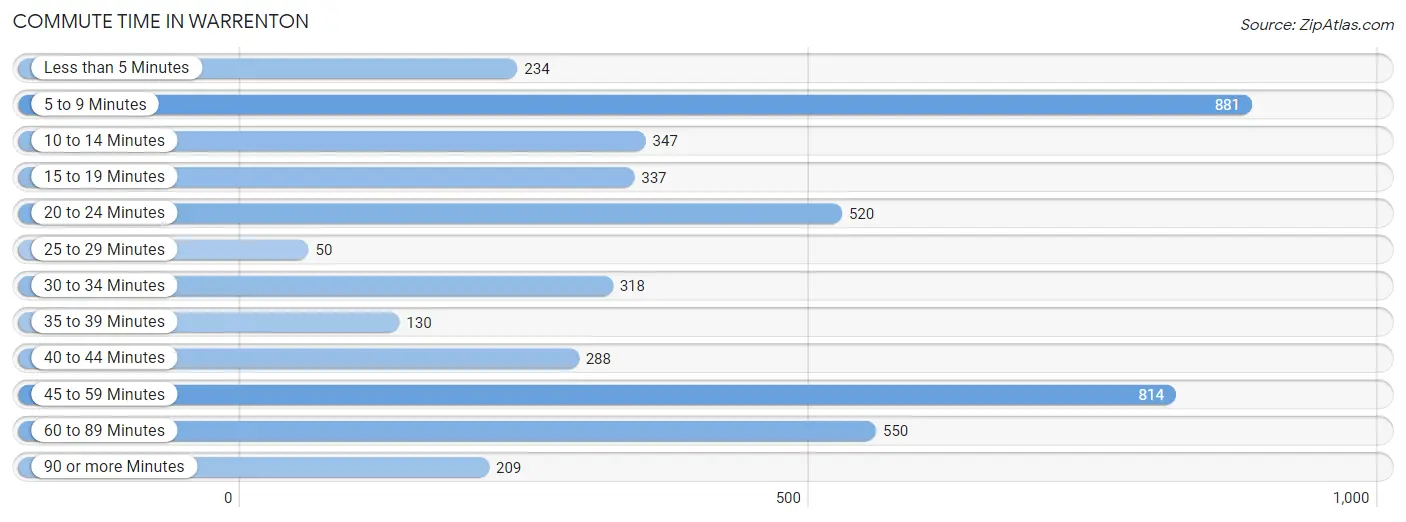
| Commute Time | # Commuters | % Commuters |
| Less than 5 Minutes | 234 | 5.0% |
| 5 to 9 Minutes | 881 | 18.8% |
| 10 to 14 Minutes | 347 | 7.4% |
| 15 to 19 Minutes | 337 | 7.2% |
| 20 to 24 Minutes | 520 | 11.1% |
| 25 to 29 Minutes | 50 | 1.1% |
| 30 to 34 Minutes | 318 | 6.8% |
| 35 to 39 Minutes | 130 | 2.8% |
| 40 to 44 Minutes | 288 | 6.2% |
| 45 to 59 Minutes | 814 | 17.4% |
| 60 to 89 Minutes | 550 | 11.8% |
| 90 or more Minutes | 209 | 4.5% |
Commute Time by Sex in Warrenton
The most common commute times in Warrenton are 45 to 59 minutes (573 commuters, 23.9%) for males and 5 to 9 minutes (542 commuters, 23.8%) for females.
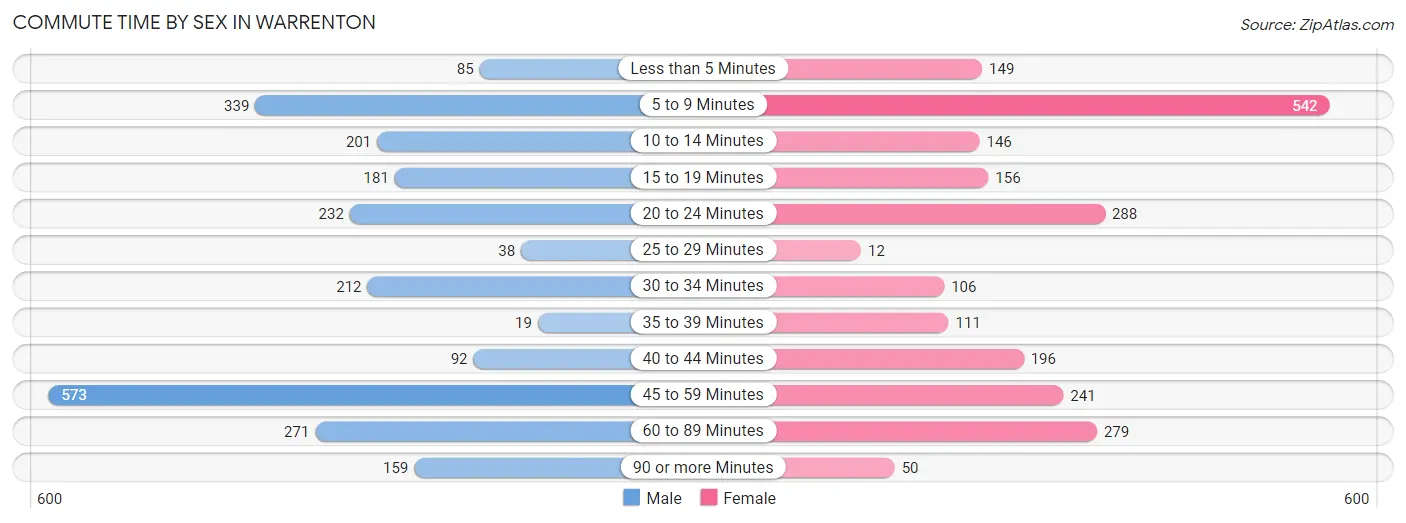
| Commute Time | Male | Female |
| Less than 5 Minutes | 85 (3.5%) | 149 (6.6%) |
| 5 to 9 Minutes | 339 (14.1%) | 542 (23.8%) |
| 10 to 14 Minutes | 201 (8.4%) | 146 (6.4%) |
| 15 to 19 Minutes | 181 (7.5%) | 156 (6.9%) |
| 20 to 24 Minutes | 232 (9.7%) | 288 (12.7%) |
| 25 to 29 Minutes | 38 (1.6%) | 12 (0.5%) |
| 30 to 34 Minutes | 212 (8.8%) | 106 (4.7%) |
| 35 to 39 Minutes | 19 (0.8%) | 111 (4.9%) |
| 40 to 44 Minutes | 92 (3.8%) | 196 (8.6%) |
| 45 to 59 Minutes | 573 (23.9%) | 241 (10.6%) |
| 60 to 89 Minutes | 271 (11.3%) | 279 (12.3%) |
| 90 or more Minutes | 159 (6.6%) | 50 (2.2%) |
Time of Departure to Work by Sex in Warrenton
The most frequent times of departure to work in Warrenton are 8:00 AM to 8:29 AM (344, 14.3%) for males and 7:30 AM to 7:59 AM (530, 23.3%) for females.
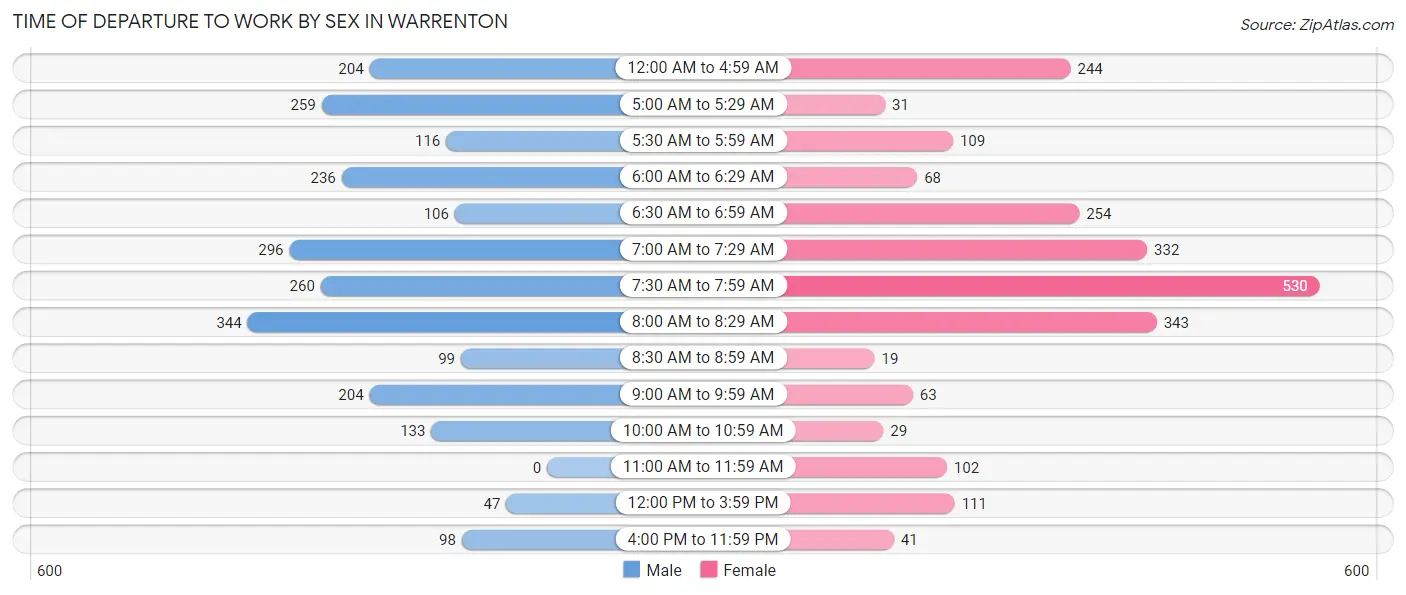
| Time of Departure | Male | Female |
| 12:00 AM to 4:59 AM | 204 (8.5%) | 244 (10.7%) |
| 5:00 AM to 5:29 AM | 259 (10.8%) | 31 (1.4%) |
| 5:30 AM to 5:59 AM | 116 (4.8%) | 109 (4.8%) |
| 6:00 AM to 6:29 AM | 236 (9.8%) | 68 (3.0%) |
| 6:30 AM to 6:59 AM | 106 (4.4%) | 254 (11.2%) |
| 7:00 AM to 7:29 AM | 296 (12.3%) | 332 (14.6%) |
| 7:30 AM to 7:59 AM | 260 (10.8%) | 530 (23.3%) |
| 8:00 AM to 8:29 AM | 344 (14.3%) | 343 (15.1%) |
| 8:30 AM to 8:59 AM | 99 (4.1%) | 19 (0.8%) |
| 9:00 AM to 9:59 AM | 204 (8.5%) | 63 (2.8%) |
| 10:00 AM to 10:59 AM | 133 (5.5%) | 29 (1.3%) |
| 11:00 AM to 11:59 AM | 0 (0.0%) | 102 (4.5%) |
| 12:00 PM to 3:59 PM | 47 (2.0%) | 111 (4.9%) |
| 4:00 PM to 11:59 PM | 98 (4.1%) | 41 (1.8%) |
| Total | 2,402 (100.0%) | 2,276 (100.0%) |
Housing Occupancy in Warrenton
Occupancy by Ownership in Warrenton
Of the total 3,928 dwellings in Warrenton, owner-occupied units account for 2,540 (64.7%), while renter-occupied units make up 1,388 (35.3%).
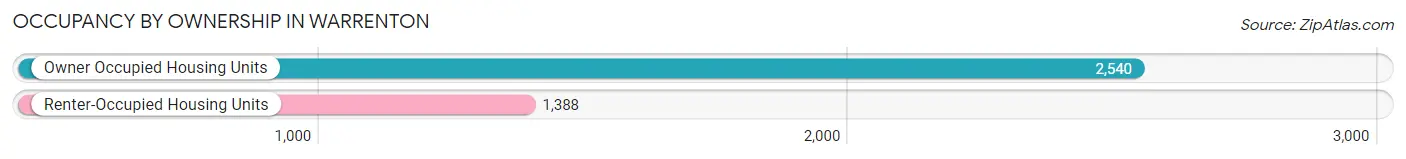
| Occupancy | # Housing Units | % Housing Units |
| Owner Occupied Housing Units | 2,540 | 64.7% |
| Renter-Occupied Housing Units | 1,388 | 35.3% |
| Total Occupied Housing Units | 3,928 | 100.0% |
Occupancy by Household Size in Warrenton
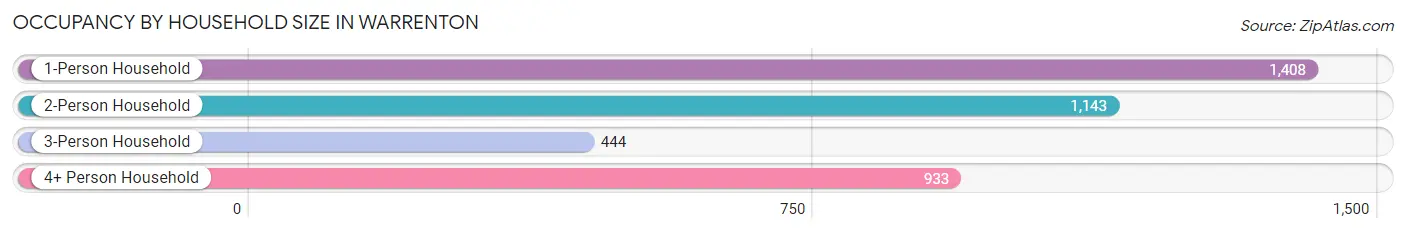
| Household Size | # Housing Units | % Housing Units |
| 1-Person Household | 1,408 | 35.8% |
| 2-Person Household | 1,143 | 29.1% |
| 3-Person Household | 444 | 11.3% |
| 4+ Person Household | 933 | 23.7% |
| Total Housing Units | 3,928 | 100.0% |
Occupancy by Ownership by Household Size in Warrenton
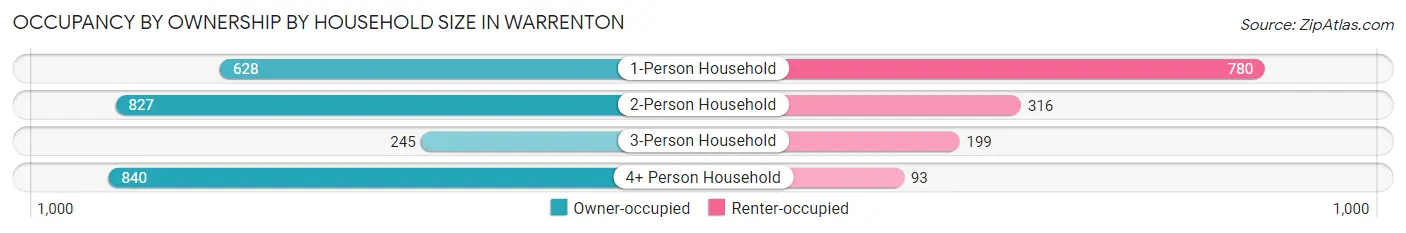
| Household Size | Owner-occupied | Renter-occupied |
| 1-Person Household | 628 (44.6%) | 780 (55.4%) |
| 2-Person Household | 827 (72.4%) | 316 (27.7%) |
| 3-Person Household | 245 (55.2%) | 199 (44.8%) |
| 4+ Person Household | 840 (90.0%) | 93 (10.0%) |
| Total Housing Units | 2,540 (64.7%) | 1,388 (35.3%) |
Occupancy by Educational Attainment in Warrenton
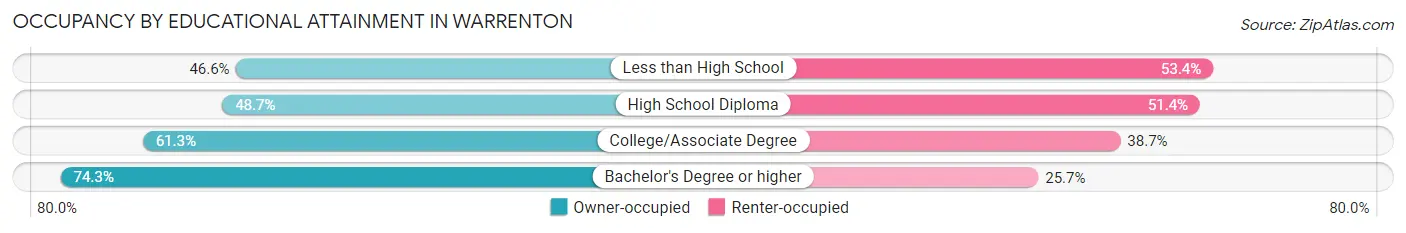
| Household Size | Owner-occupied | Renter-occupied |
| Less than High School | 61 (46.6%) | 70 (53.4%) |
| High School Diploma | 342 (48.6%) | 361 (51.3%) |
| College/Associate Degree | 759 (61.3%) | 480 (38.7%) |
| Bachelor's Degree or higher | 1,378 (74.3%) | 477 (25.7%) |
Occupancy by Age of Householder in Warrenton
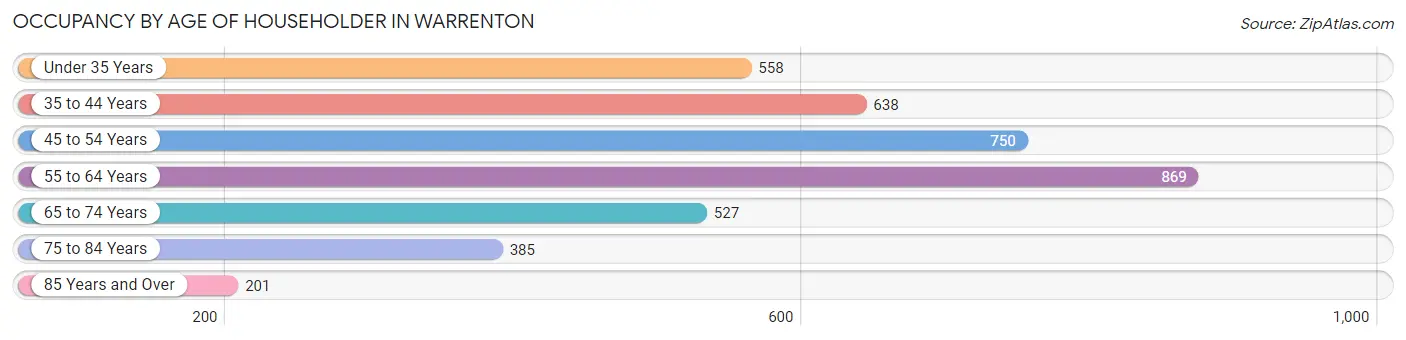
| Age Bracket | # Households | % Households |
| Under 35 Years | 558 | 14.2% |
| 35 to 44 Years | 638 | 16.2% |
| 45 to 54 Years | 750 | 19.1% |
| 55 to 64 Years | 869 | 22.1% |
| 65 to 74 Years | 527 | 13.4% |
| 75 to 84 Years | 385 | 9.8% |
| 85 Years and Over | 201 | 5.1% |
| Total | 3,928 | 100.0% |
Housing Finances in Warrenton
Median Income by Occupancy in Warrenton
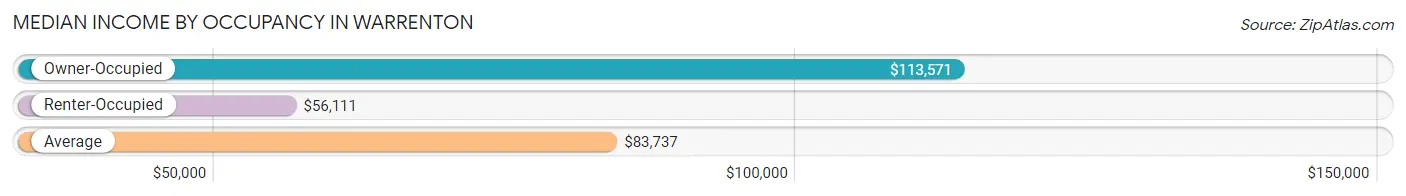
| Occupancy Type | # Households | Median Income |
| Owner-Occupied | 2,540 (64.7%) | $113,571 |
| Renter-Occupied | 1,388 (35.3%) | $56,111 |
| Average | 3,928 (100.0%) | $83,737 |
Occupancy by Householder Income Bracket in Warrenton
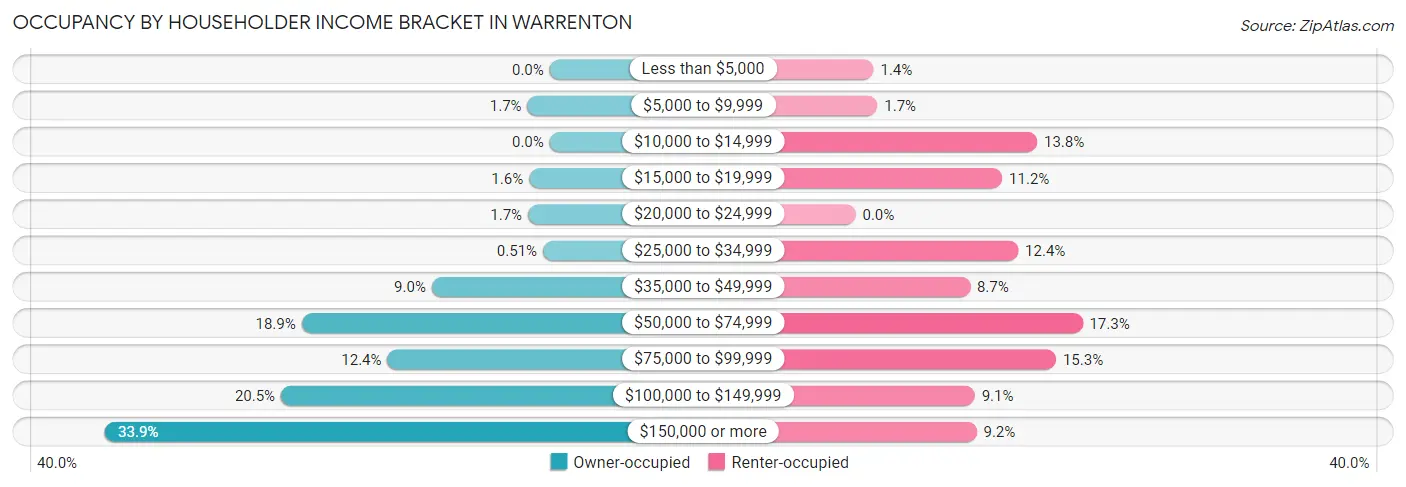
| Income Bracket | Owner-occupied | Renter-occupied |
| Less than $5,000 | 0 (0.0%) | 19 (1.4%) |
| $5,000 to $9,999 | 43 (1.7%) | 23 (1.7%) |
| $10,000 to $14,999 | 0 (0.0%) | 192 (13.8%) |
| $15,000 to $19,999 | 40 (1.6%) | 155 (11.2%) |
| $20,000 to $24,999 | 42 (1.7%) | 0 (0.0%) |
| $25,000 to $34,999 | 13 (0.5%) | 172 (12.4%) |
| $35,000 to $49,999 | 228 (9.0%) | 121 (8.7%) |
| $50,000 to $74,999 | 480 (18.9%) | 240 (17.3%) |
| $75,000 to $99,999 | 314 (12.4%) | 212 (15.3%) |
| $100,000 to $149,999 | 520 (20.5%) | 126 (9.1%) |
| $150,000 or more | 860 (33.9%) | 128 (9.2%) |
| Total | 2,540 (100.0%) | 1,388 (100.0%) |
Monthly Housing Cost Tiers in Warrenton
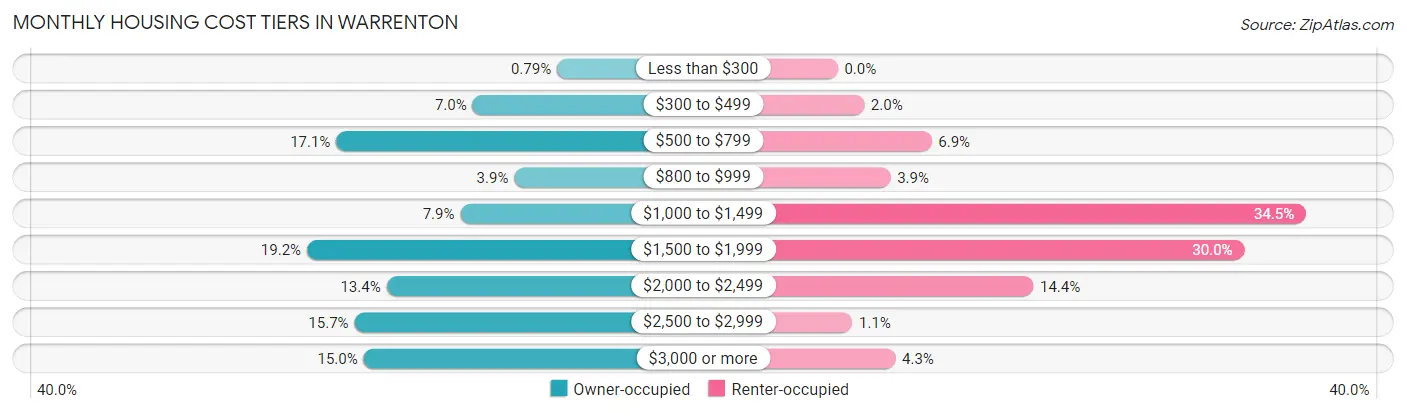
| Monthly Cost | Owner-occupied | Renter-occupied |
| Less than $300 | 20 (0.8%) | 0 (0.0%) |
| $300 to $499 | 178 (7.0%) | 27 (1.9%) |
| $500 to $799 | 433 (17.1%) | 96 (6.9%) |
| $800 to $999 | 100 (3.9%) | 54 (3.9%) |
| $1,000 to $1,499 | 201 (7.9%) | 479 (34.5%) |
| $1,500 to $1,999 | 488 (19.2%) | 416 (30.0%) |
| $2,000 to $2,499 | 339 (13.4%) | 200 (14.4%) |
| $2,500 to $2,999 | 399 (15.7%) | 15 (1.1%) |
| $3,000 or more | 382 (15.0%) | 59 (4.3%) |
| Total | 2,540 (100.0%) | 1,388 (100.0%) |
Physical Housing Characteristics in Warrenton
Housing Structures in Warrenton
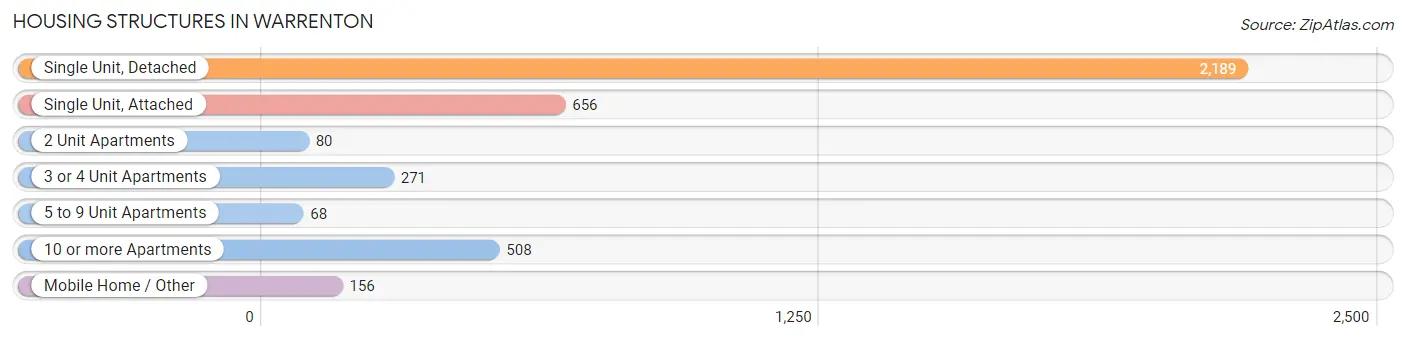
| Structure Type | # Housing Units | % Housing Units |
| Single Unit, Detached | 2,189 | 55.7% |
| Single Unit, Attached | 656 | 16.7% |
| 2 Unit Apartments | 80 | 2.0% |
| 3 or 4 Unit Apartments | 271 | 6.9% |
| 5 to 9 Unit Apartments | 68 | 1.7% |
| 10 or more Apartments | 508 | 12.9% |
| Mobile Home / Other | 156 | 4.0% |
| Total | 3,928 | 100.0% |
Housing Structures by Occupancy in Warrenton
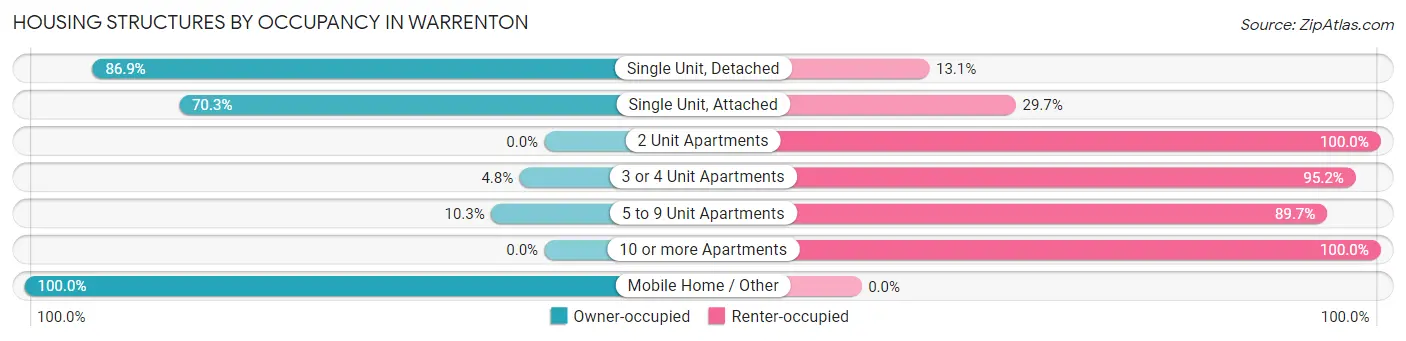
| Structure Type | Owner-occupied | Renter-occupied |
| Single Unit, Detached | 1,903 (86.9%) | 286 (13.1%) |
| Single Unit, Attached | 461 (70.3%) | 195 (29.7%) |
| 2 Unit Apartments | 0 (0.0%) | 80 (100.0%) |
| 3 or 4 Unit Apartments | 13 (4.8%) | 258 (95.2%) |
| 5 to 9 Unit Apartments | 7 (10.3%) | 61 (89.7%) |
| 10 or more Apartments | 0 (0.0%) | 508 (100.0%) |
| Mobile Home / Other | 156 (100.0%) | 0 (0.0%) |
| Total | 2,540 (64.7%) | 1,388 (35.3%) |
Housing Structures by Number of Rooms in Warrenton
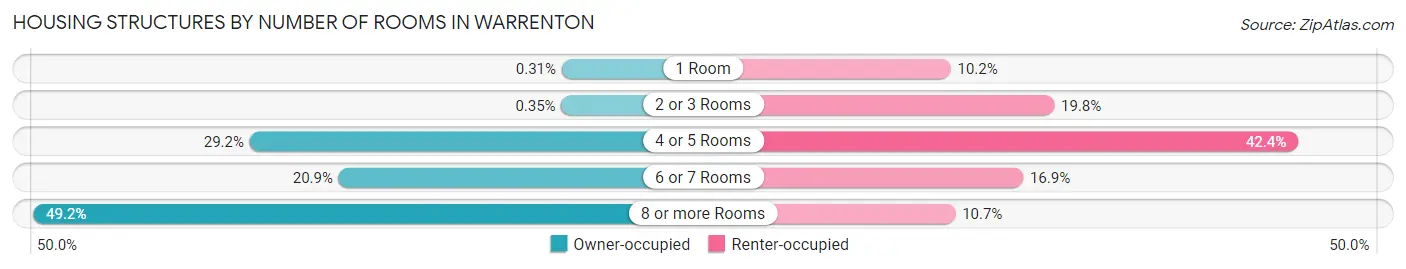
| Number of Rooms | Owner-occupied | Renter-occupied |
| 1 Room | 8 (0.3%) | 142 (10.2%) |
| 2 or 3 Rooms | 9 (0.4%) | 275 (19.8%) |
| 4 or 5 Rooms | 741 (29.2%) | 588 (42.4%) |
| 6 or 7 Rooms | 532 (20.9%) | 235 (16.9%) |
| 8 or more Rooms | 1,250 (49.2%) | 148 (10.7%) |
| Total | 2,540 (100.0%) | 1,388 (100.0%) |
Housing Structure by Heating Type in Warrenton
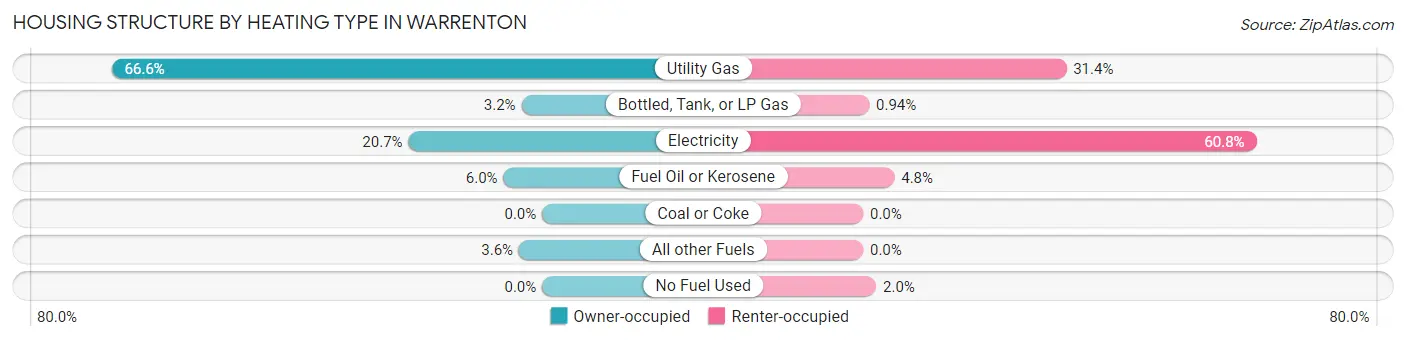
| Heating Type | Owner-occupied | Renter-occupied |
| Utility Gas | 1,691 (66.6%) | 436 (31.4%) |
| Bottled, Tank, or LP Gas | 81 (3.2%) | 13 (0.9%) |
| Electricity | 525 (20.7%) | 844 (60.8%) |
| Fuel Oil or Kerosene | 152 (6.0%) | 67 (4.8%) |
| Coal or Coke | 0 (0.0%) | 0 (0.0%) |
| All other Fuels | 91 (3.6%) | 0 (0.0%) |
| No Fuel Used | 0 (0.0%) | 28 (2.0%) |
| Total | 2,540 (100.0%) | 1,388 (100.0%) |
Household Vehicle Usage in Warrenton
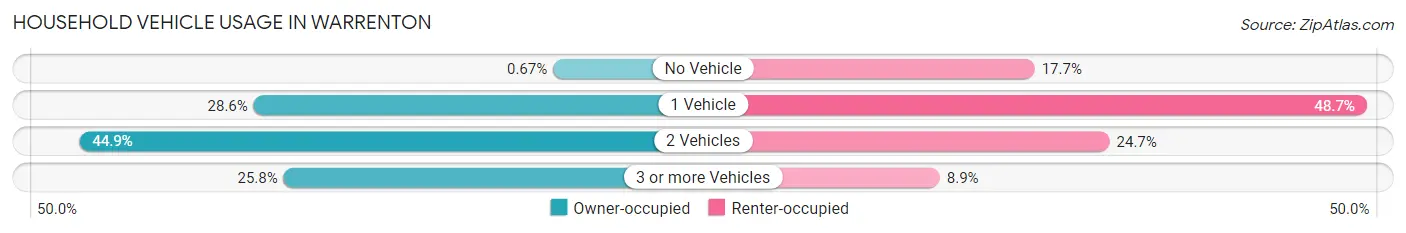
| Vehicles per Household | Owner-occupied | Renter-occupied |
| No Vehicle | 17 (0.7%) | 246 (17.7%) |
| 1 Vehicle | 727 (28.6%) | 676 (48.7%) |
| 2 Vehicles | 1,140 (44.9%) | 343 (24.7%) |
| 3 or more Vehicles | 656 (25.8%) | 123 (8.9%) |
| Total | 2,540 (100.0%) | 1,388 (100.0%) |
Real Estate & Mortgages in Warrenton
Real Estate and Mortgage Overview in Warrenton
| Characteristic | Without Mortgage | With Mortgage |
| Housing Units | 601 | 1,939 |
| Median Property Value | $437,600 | $411,800 |
| Median Household Income | $71,670 | $739 |
| Monthly Housing Costs | $703 | $382 |
| Real Estate Taxes | $2,870 | $104 |
Property Value by Mortgage Status in Warrenton
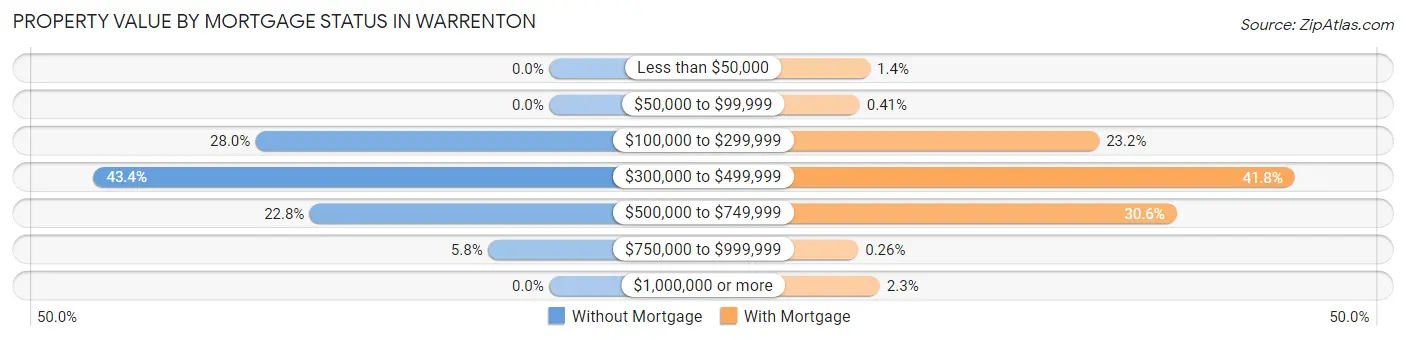
| Property Value | Without Mortgage | With Mortgage |
| Less than $50,000 | 0 (0.0%) | 27 (1.4%) |
| $50,000 to $99,999 | 0 (0.0%) | 8 (0.4%) |
| $100,000 to $299,999 | 168 (28.0%) | 450 (23.2%) |
| $300,000 to $499,999 | 261 (43.4%) | 811 (41.8%) |
| $500,000 to $749,999 | 137 (22.8%) | 593 (30.6%) |
| $750,000 to $999,999 | 35 (5.8%) | 5 (0.3%) |
| $1,000,000 or more | 0 (0.0%) | 45 (2.3%) |
| Total | 601 (100.0%) | 1,939 (100.0%) |
Household Income by Mortgage Status in Warrenton
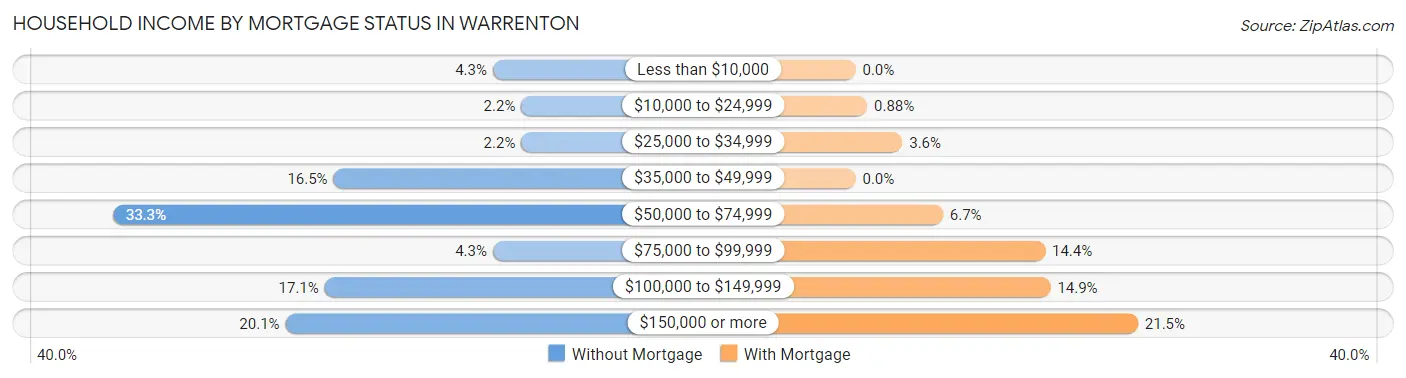
| Household Income | Without Mortgage | With Mortgage |
| Less than $10,000 | 26 (4.3%) | 0 (0.0%) |
| $10,000 to $24,999 | 13 (2.2%) | 17 (0.9%) |
| $25,000 to $34,999 | 13 (2.2%) | 69 (3.6%) |
| $35,000 to $49,999 | 99 (16.5%) | 0 (0.0%) |
| $50,000 to $74,999 | 200 (33.3%) | 129 (6.7%) |
| $75,000 to $99,999 | 26 (4.3%) | 280 (14.4%) |
| $100,000 to $149,999 | 103 (17.1%) | 288 (14.8%) |
| $150,000 or more | 121 (20.1%) | 417 (21.5%) |
| Total | 601 (100.0%) | 1,939 (100.0%) |
Property Value to Household Income Ratio in Warrenton
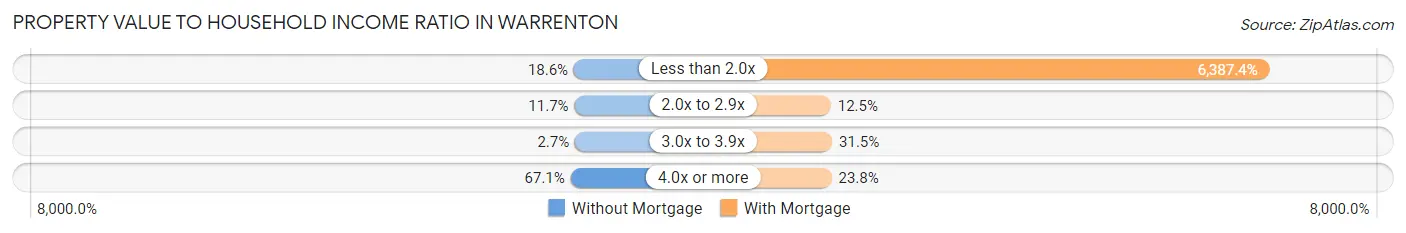
| Value-to-Income Ratio | Without Mortgage | With Mortgage |
| Less than 2.0x | 112 (18.6%) | 123,852 (6,387.4%) |
| 2.0x to 2.9x | 70 (11.7%) | 242 (12.5%) |
| 3.0x to 3.9x | 16 (2.7%) | 611 (31.5%) |
| 4.0x or more | 403 (67.0%) | 461 (23.8%) |
| Total | 601 (100.0%) | 1,939 (100.0%) |
Real Estate Taxes by Mortgage Status in Warrenton
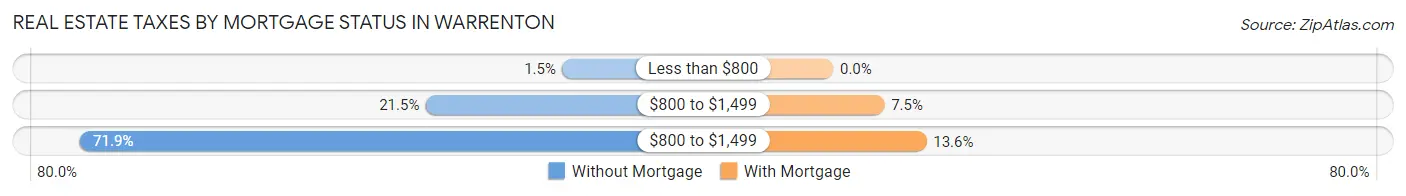
| Property Taxes | Without Mortgage | With Mortgage |
| Less than $800 | 9 (1.5%) | 0 (0.0%) |
| $800 to $1,499 | 129 (21.5%) | 145 (7.5%) |
| $800 to $1,499 | 432 (71.9%) | 264 (13.6%) |
| Total | 601 (100.0%) | 1,939 (100.0%) |
Health & Disability in Warrenton
Health Insurance Coverage by Age in Warrenton
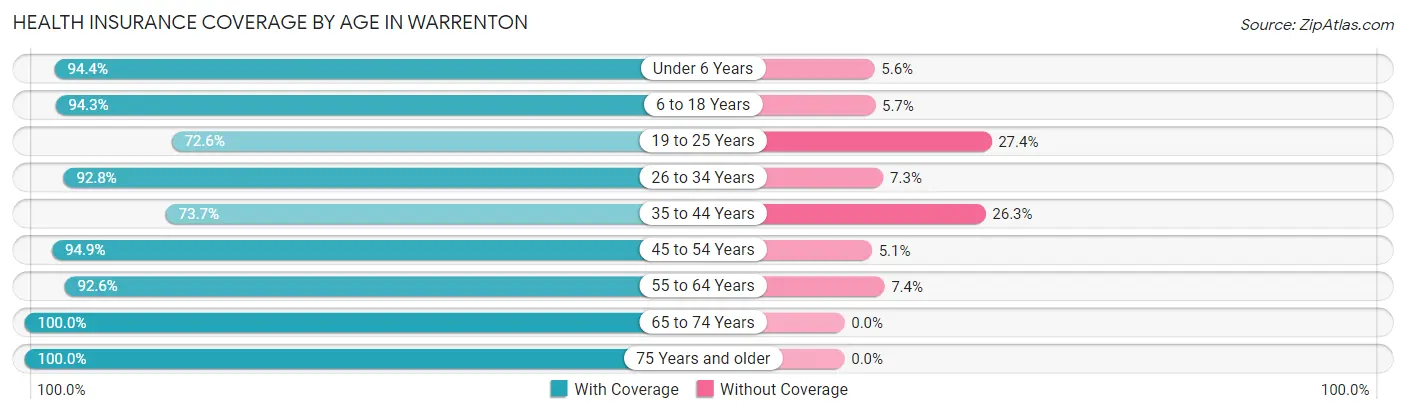
| Age Bracket | With Coverage | Without Coverage |
| Under 6 Years | 893 (94.4%) | 53 (5.6%) |
| 6 to 18 Years | 1,381 (94.3%) | 84 (5.7%) |
| 19 to 25 Years | 649 (72.6%) | 245 (27.4%) |
| 26 to 34 Years | 1,010 (92.7%) | 79 (7.2%) |
| 35 to 44 Years | 874 (73.7%) | 312 (26.3%) |
| 45 to 54 Years | 1,352 (94.9%) | 73 (5.1%) |
| 55 to 64 Years | 1,306 (92.6%) | 105 (7.4%) |
| 65 to 74 Years | 734 (100.0%) | 0 (0.0%) |
| 75 Years and older | 662 (100.0%) | 0 (0.0%) |
| Total | 8,861 (90.3%) | 951 (9.7%) |
Health Insurance Coverage by Citizenship Status in Warrenton
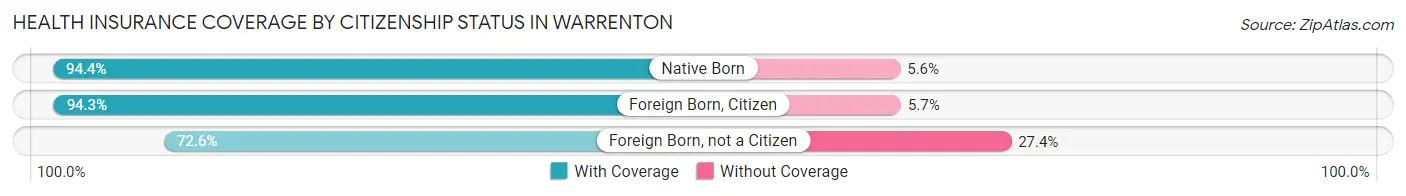
| Citizenship Status | With Coverage | Without Coverage |
| Native Born | 893 (94.4%) | 53 (5.6%) |
| Foreign Born, Citizen | 1,381 (94.3%) | 84 (5.7%) |
| Foreign Born, not a Citizen | 649 (72.6%) | 245 (27.4%) |
Health Insurance Coverage by Household Income in Warrenton
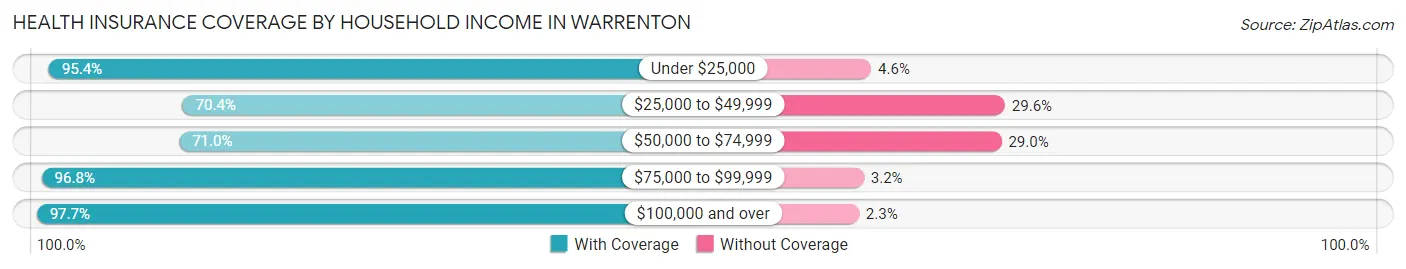
| Household Income | With Coverage | Without Coverage |
| Under $25,000 | 607 (95.4%) | 29 (4.6%) |
| $25,000 to $49,999 | 732 (70.4%) | 308 (29.6%) |
| $50,000 to $74,999 | 1,093 (71.0%) | 446 (29.0%) |
| $75,000 to $99,999 | 1,240 (96.8%) | 41 (3.2%) |
| $100,000 and over | 5,175 (97.7%) | 120 (2.3%) |
Public vs Private Health Insurance Coverage by Age in Warrenton
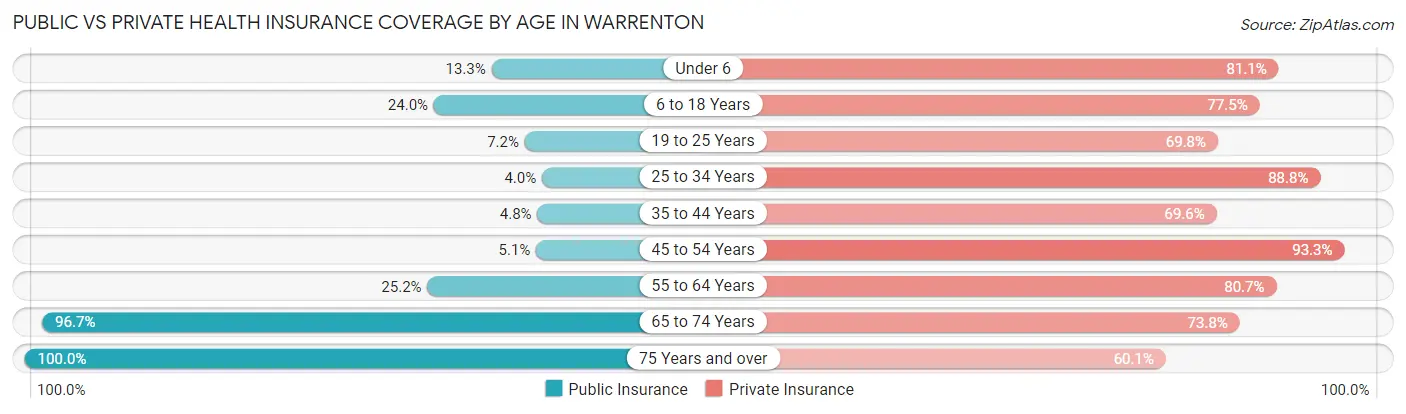
| Age Bracket | Public Insurance | Private Insurance |
| Under 6 | 126 (13.3%) | 767 (81.1%) |
| 6 to 18 Years | 352 (24.0%) | 1,136 (77.5%) |
| 19 to 25 Years | 64 (7.2%) | 624 (69.8%) |
| 25 to 34 Years | 43 (4.0%) | 967 (88.8%) |
| 35 to 44 Years | 57 (4.8%) | 825 (69.6%) |
| 45 to 54 Years | 72 (5.1%) | 1,329 (93.3%) |
| 55 to 64 Years | 356 (25.2%) | 1,138 (80.6%) |
| 65 to 74 Years | 710 (96.7%) | 542 (73.8%) |
| 75 Years and over | 662 (100.0%) | 398 (60.1%) |
| Total | 2,442 (24.9%) | 7,726 (78.7%) |
Disability Status by Sex by Age in Warrenton
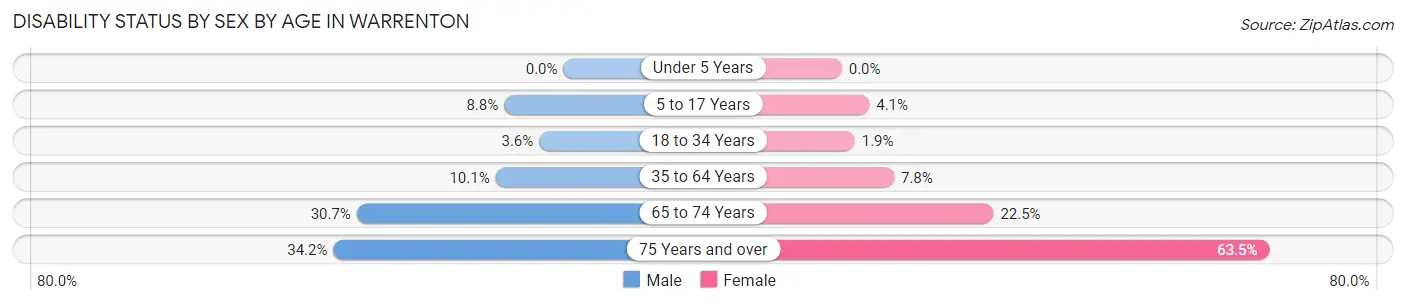
| Age Bracket | Male | Female |
| Under 5 Years | 0 (0.0%) | 0 (0.0%) |
| 5 to 17 Years | 60 (8.8%) | 35 (4.1%) |
| 18 to 34 Years | 37 (3.6%) | 20 (1.9%) |
| 35 to 64 Years | 204 (10.1%) | 155 (7.8%) |
| 65 to 74 Years | 89 (30.7%) | 100 (22.5%) |
| 75 Years and over | 55 (34.2%) | 318 (63.5%) |
Disability Class by Sex by Age in Warrenton
Disability Class: Hearing Difficulty
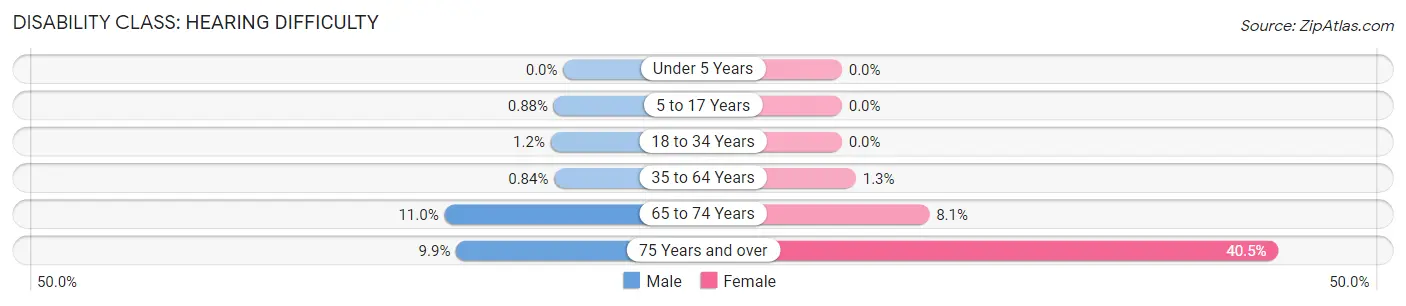
| Age Bracket | Male | Female |
| Under 5 Years | 0 (0.0%) | 0 (0.0%) |
| 5 to 17 Years | 6 (0.9%) | 0 (0.0%) |
| 18 to 34 Years | 12 (1.2%) | 0 (0.0%) |
| 35 to 64 Years | 17 (0.8%) | 26 (1.3%) |
| 65 to 74 Years | 32 (11.0%) | 36 (8.1%) |
| 75 Years and over | 16 (9.9%) | 203 (40.5%) |
Disability Class: Vision Difficulty
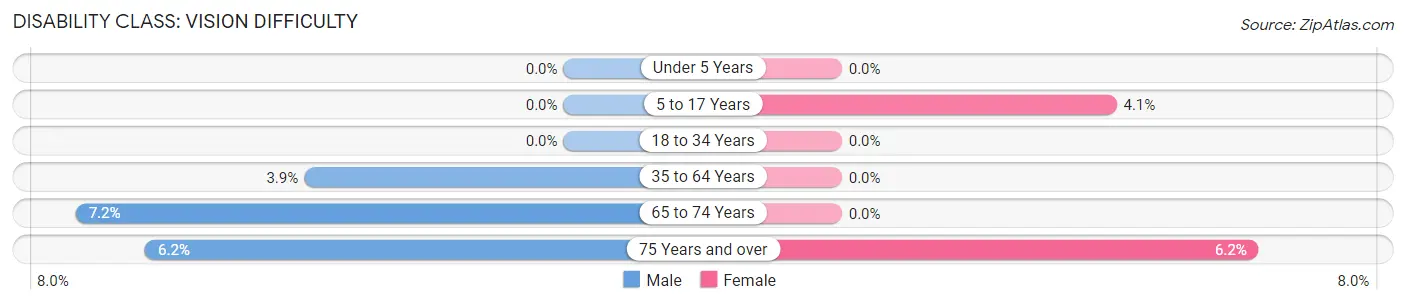
| Age Bracket | Male | Female |
| Under 5 Years | 0 (0.0%) | 0 (0.0%) |
| 5 to 17 Years | 0 (0.0%) | 35 (4.1%) |
| 18 to 34 Years | 0 (0.0%) | 0 (0.0%) |
| 35 to 64 Years | 78 (3.8%) | 0 (0.0%) |
| 65 to 74 Years | 21 (7.2%) | 0 (0.0%) |
| 75 Years and over | 10 (6.2%) | 31 (6.2%) |
Disability Class: Cognitive Difficulty
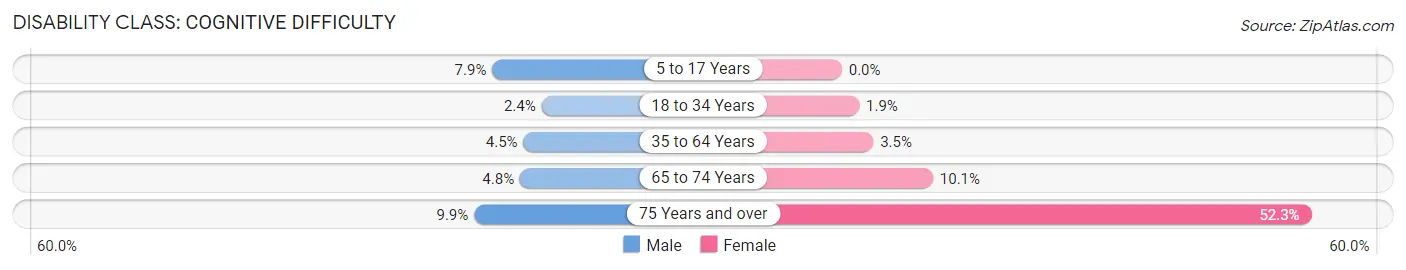
| Age Bracket | Male | Female |
| 5 to 17 Years | 54 (7.9%) | 0 (0.0%) |
| 18 to 34 Years | 25 (2.4%) | 20 (1.9%) |
| 35 to 64 Years | 90 (4.4%) | 70 (3.5%) |
| 65 to 74 Years | 14 (4.8%) | 45 (10.1%) |
| 75 Years and over | 16 (9.9%) | 262 (52.3%) |
Disability Class: Ambulatory Difficulty
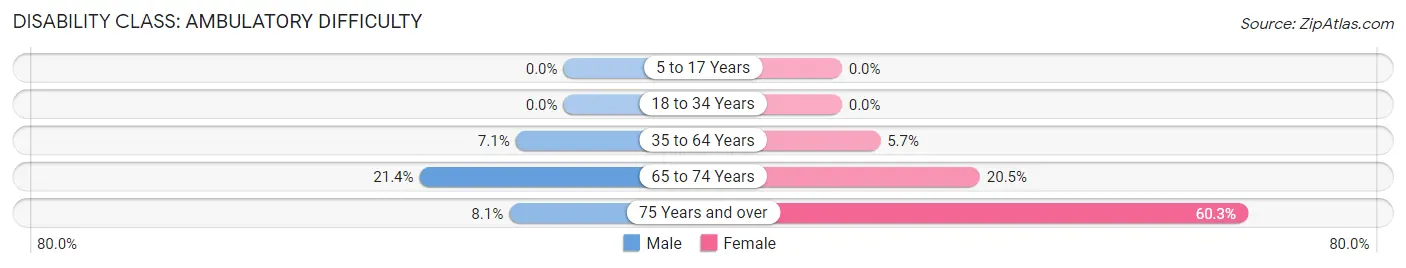
| Age Bracket | Male | Female |
| 5 to 17 Years | 0 (0.0%) | 0 (0.0%) |
| 18 to 34 Years | 0 (0.0%) | 0 (0.0%) |
| 35 to 64 Years | 144 (7.1%) | 114 (5.7%) |
| 65 to 74 Years | 62 (21.4%) | 91 (20.5%) |
| 75 Years and over | 13 (8.1%) | 302 (60.3%) |
Disability Class: Self-Care Difficulty
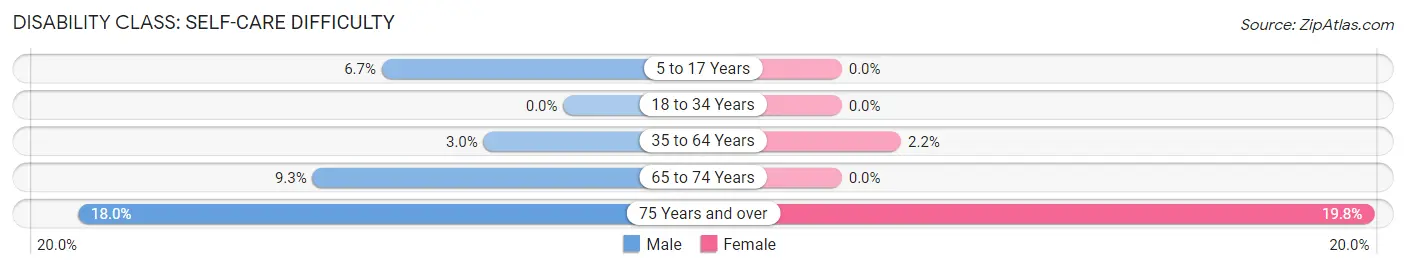
| Age Bracket | Male | Female |
| 5 to 17 Years | 46 (6.7%) | 0 (0.0%) |
| 18 to 34 Years | 0 (0.0%) | 0 (0.0%) |
| 35 to 64 Years | 60 (3.0%) | 44 (2.2%) |
| 65 to 74 Years | 27 (9.3%) | 0 (0.0%) |
| 75 Years and over | 29 (18.0%) | 99 (19.8%) |
Technology Access in Warrenton
Computing Device Access in Warrenton
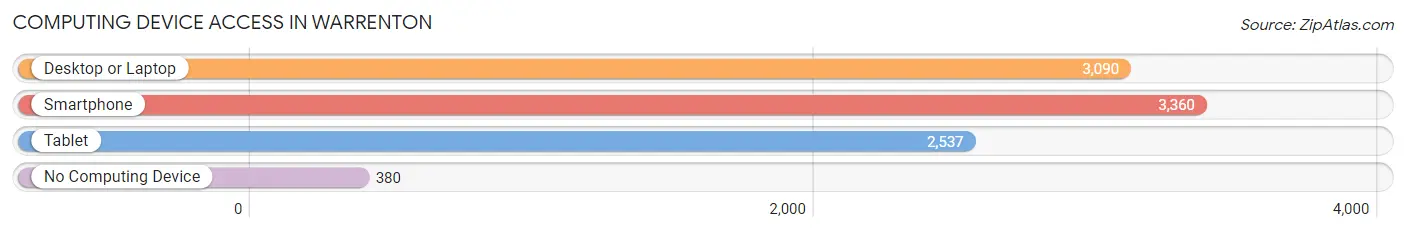
| Device Type | # Households | % Households |
| Desktop or Laptop | 3,090 | 78.7% |
| Smartphone | 3,360 | 85.5% |
| Tablet | 2,537 | 64.6% |
| No Computing Device | 380 | 9.7% |
| Total | 3,928 | 100.0% |
Internet Access in Warrenton
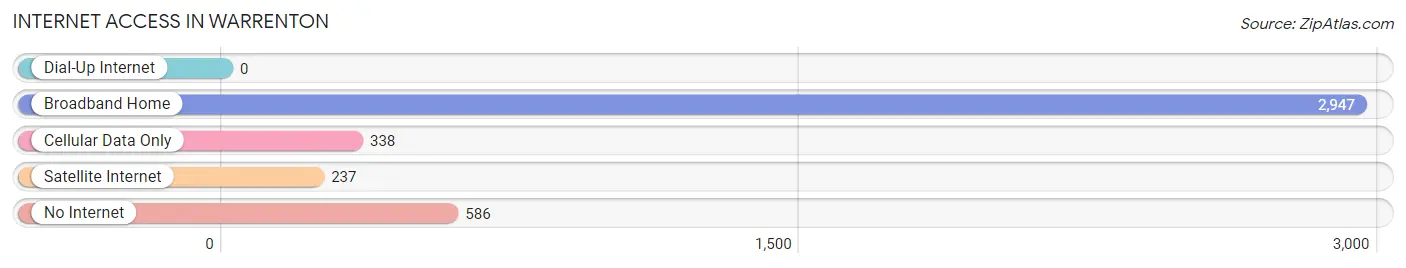
| Internet Type | # Households | % Households |
| Dial-Up Internet | 0 | 0.0% |
| Broadband Home | 2,947 | 75.0% |
| Cellular Data Only | 338 | 8.6% |
| Satellite Internet | 237 | 6.0% |
| No Internet | 586 | 14.9% |
| Total | 3,928 | 100.0% |
Warrenton Summary
Warrenton, Virginia is a small town located in the northern part of the state, about an hour’s drive from Washington, D.C. It is the county seat of Fauquier County and is home to a population of just over 9,000 people. Warrenton has a rich history, a diverse geography, a thriving economy, and a unique demographic makeup.
History
The area that is now Warrenton was first settled in the late 1700s by European settlers. The town was officially established in 1790 and was named after General Joseph Warren, a Revolutionary War hero. Warrenton quickly became an important trading center and was a major stop on the Fauquier and Alexandria Turnpike, which connected the town to Washington, D.C. During the Civil War, Warrenton was the site of several battles and skirmishes, and the town was occupied by Union forces in 1862. After the war, the town experienced a period of growth and prosperity, and by the early 1900s, Warrenton had become a popular tourist destination.
Geography
Warrenton is located in the northern part of Virginia, about an hour’s drive from Washington, D.C. The town is situated in the foothills of the Blue Ridge Mountains and is surrounded by rolling hills and lush forests. The town is bisected by the Rappahannock River, which provides a picturesque backdrop to the town. Warrenton is also home to several parks and recreational areas, including Sky Meadows State Park and the Warrenton Aquatic and Recreation Center.
Economy
Warrenton’s economy is largely based on agriculture and tourism. The town is home to several wineries and vineyards, as well as a number of small businesses. The town is also home to several government agencies, including the Fauquier County Sheriff’s Office and the Warrenton Police Department. In addition, Warrenton is home to a number of technology companies, including the software development firm, Appian.
Demographics
As of the 2010 census, Warrenton had a population of 9,611 people. The town is predominantly white, with a population that is approximately 85% white and 11% African American. The median household income in Warrenton is $63,000, and the median age is 38. The town is home to a diverse population, with a large Hispanic population and a growing Asian population.
Warrenton is a small town with a rich history, a diverse geography, a thriving economy, and a unique demographic makeup. The town is home to a population of just over 9,000 people and is a popular tourist destination. Warrenton is a great place to live, work, and play, and is a great example of a small town with a lot to offer.
Common Questions
What is Per Capita Income in Warrenton?
Per Capita income in Warrenton is $43,459.
What is the Median Family Income in Warrenton?
Median Family Income in Warrenton is $124,545.
What is the Median Household income in Warrenton?
Median Household Income in Warrenton is $83,737.
What is Income or Wage Gap in Warrenton?
Income or Wage Gap in Warrenton is 26.9%.
Women in Warrenton earn 73.1 cents for every dollar earned by a man.
What is Inequality or Gini Index in Warrenton?
Inequality or Gini Index in Warrenton is 0.42.
What is the Total Population of Warrenton?
Total Population of Warrenton is 10,111.
What is the Total Male Population of Warrenton?
Total Male Population of Warrenton is 4,560.
What is the Total Female Population of Warrenton?
Total Female Population of Warrenton is 5,551.
What is the Ratio of Males per 100 Females in Warrenton?
There are 82.15 Males per 100 Females in Warrenton.
What is the Ratio of Females per 100 Males in Warrenton?
There are 121.73 Females per 100 Males in Warrenton.
What is the Median Population Age in Warrenton?
Median Population Age in Warrenton is 38.2 Years.
What is the Average Family Size in Warrenton
Average Family Size in Warrenton is 3.4 People.
What is the Average Household Size in Warrenton
Average Household Size in Warrenton is 2.5 People.
How Large is the Labor Force in Warrenton?
There are 5,255 People in the Labor Forcein in Warrenton.
What is the Percentage of People in the Labor Force in Warrenton?
65.2% of People are in the Labor Force in Warrenton.
What is the Unemployment Rate in Warrenton?
Unemployment Rate in Warrenton is 2.1%.