Hot Springs, VA Map & Demographics
Hot Springs Map
Hot Springs Overview
$34,245
PER CAPITA INCOME
$115,833
AVG FAMILY INCOME
0.42
INEQUALITY / GINI INDEX
455
TOTAL POPULATION
247
MALE POPULATION
208
FEMALE POPULATION
118.75
MALES / 100 FEMALES
84.21
FEMALES / 100 MALES
58.5
MEDIAN AGE
2.0
AVG FAMILY SIZE
1.7
AVG HOUSEHOLD SIZE
255
LABOR FORCE [ PEOPLE ]
57.2%
PERCENT IN LABOR FORCE
1.2%
UNEMPLOYMENT RATE
Hot Springs Zip Codes
Hot Springs Area Codes
Income in Hot Springs
Income Overview in Hot Springs
| Characteristic | Number | Measure |
| Per Capita Income | 455 | $34,245 |
| Median Family Income | 118 | $115,833 |
| Mean Family Income | 118 | $107,281 |
| Median Household Income | 203 | $0 |
| Mean Household Income | 203 | $73,062 |
| Income Deficit | 118 | $0 |
| Wage / Income Gap (%) | 455 | 0.00% |
| Wage / Income Gap ($) | 455 | 100.00¢ per $1 |
| Gini / Inequality Index | 455 | 0.42 |
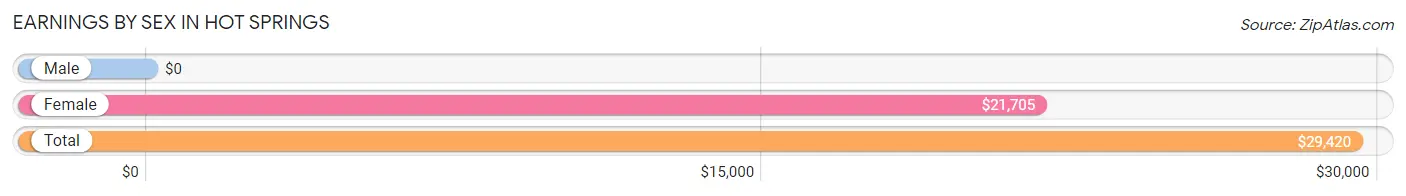
Earnings by Sex in Hot Springs
| Sex | Number | Average Earnings |
| Male | 199 (74.0%) | $0 |
| Female | 70 (26.0%) | $21,705 |
| Total | 269 (100.0%) | $29,420 |
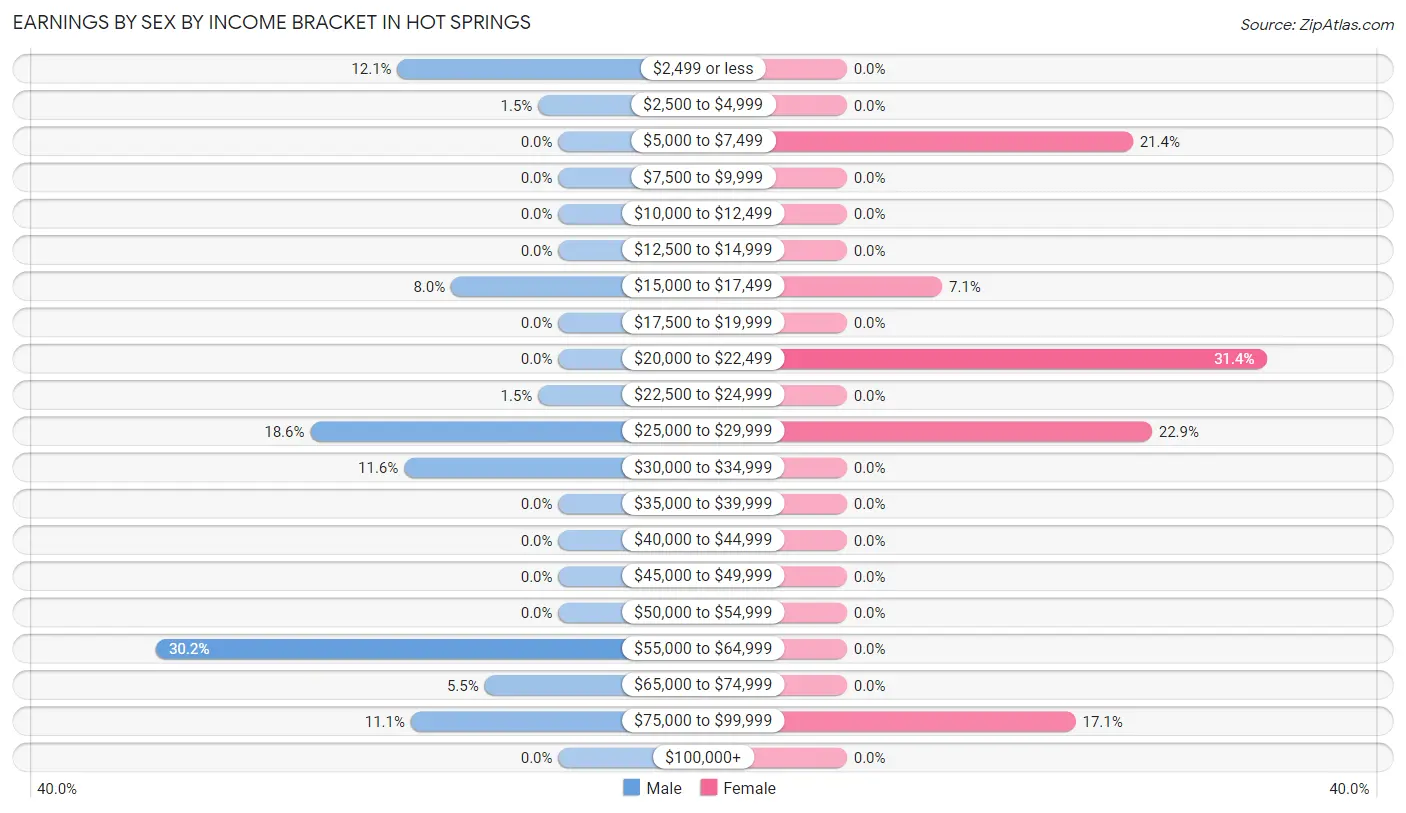
Earnings by Sex by Income Bracket in Hot Springs
The most common earnings brackets in Hot Springs are $55,000 to $64,999 for men (60 | 30.1%) and $20,000 to $22,499 for women (22 | 31.4%).
| Income | Male | Female |
| $2,499 or less | 24 (12.1%) | 0 (0.0%) |
| $2,500 to $4,999 | 3 (1.5%) | 0 (0.0%) |
| $5,000 to $7,499 | 0 (0.0%) | 15 (21.4%) |
| $7,500 to $9,999 | 0 (0.0%) | 0 (0.0%) |
| $10,000 to $12,499 | 0 (0.0%) | 0 (0.0%) |
| $12,500 to $14,999 | 0 (0.0%) | 0 (0.0%) |
| $15,000 to $17,499 | 16 (8.0%) | 5 (7.1%) |
| $17,500 to $19,999 | 0 (0.0%) | 0 (0.0%) |
| $20,000 to $22,499 | 0 (0.0%) | 22 (31.4%) |
| $22,500 to $24,999 | 3 (1.5%) | 0 (0.0%) |
| $25,000 to $29,999 | 37 (18.6%) | 16 (22.9%) |
| $30,000 to $34,999 | 23 (11.6%) | 0 (0.0%) |
| $35,000 to $39,999 | 0 (0.0%) | 0 (0.0%) |
| $40,000 to $44,999 | 0 (0.0%) | 0 (0.0%) |
| $45,000 to $49,999 | 0 (0.0%) | 0 (0.0%) |
| $50,000 to $54,999 | 0 (0.0%) | 0 (0.0%) |
| $55,000 to $64,999 | 60 (30.1%) | 0 (0.0%) |
| $65,000 to $74,999 | 11 (5.5%) | 0 (0.0%) |
| $75,000 to $99,999 | 22 (11.1%) | 12 (17.1%) |
| $100,000+ | 0 (0.0%) | 0 (0.0%) |
| Total | 199 (100.0%) | 70 (100.0%) |
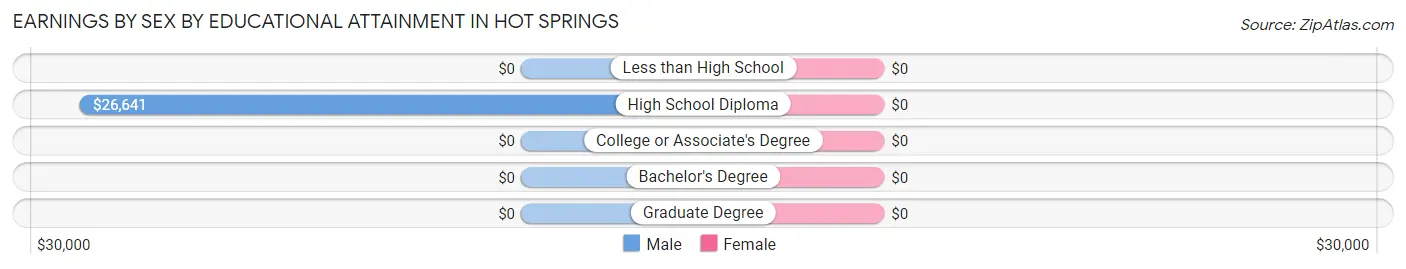
Earnings by Sex by Educational Attainment in Hot Springs
| Educational Attainment | Male Income | Female Income |
| Less than High School | - | - |
| High School Diploma | $26,641 | $0 |
| College or Associate's Degree | - | - |
| Bachelor's Degree | - | - |
| Graduate Degree | - | - |
| Total | $62,792 | $25,139 |
Family Income in Hot Springs
Family Income Brackets in Hot Springs
According to the Hot Springs family income data, there are 76 families falling into the $100,000 to $149,999 income range, which is the most common income bracket and makes up 64.4% of all families.
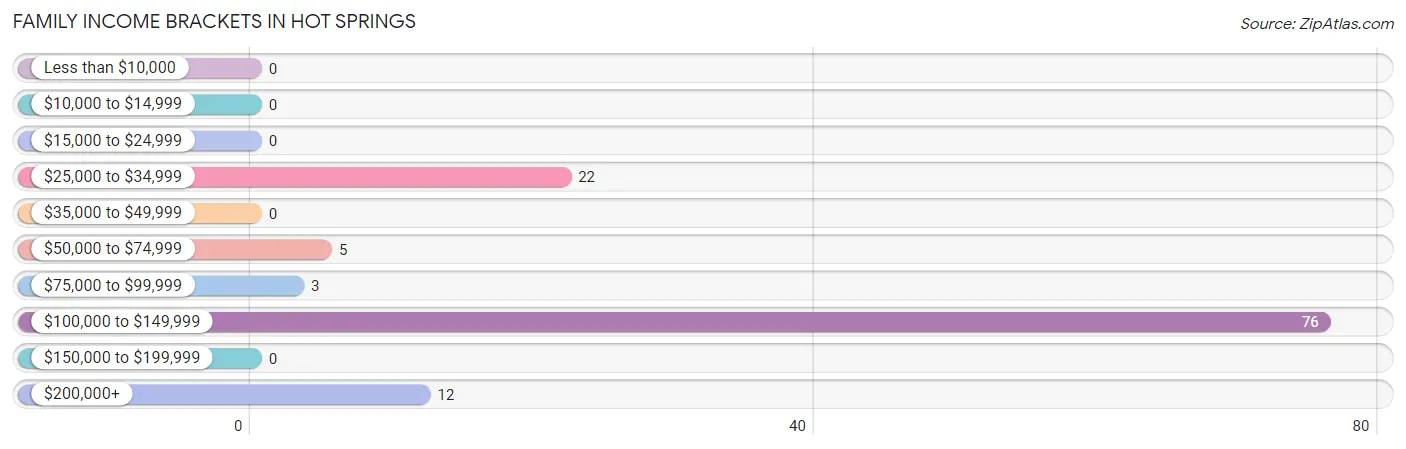
| Income Bracket | # Families | % Families |
| Less than $10,000 | 0 | 0.0% |
| $10,000 to $14,999 | 0 | 0.0% |
| $15,000 to $24,999 | 0 | 0.0% |
| $25,000 to $34,999 | 22 | 18.6% |
| $35,000 to $49,999 | 0 | 0.0% |
| $50,000 to $74,999 | 5 | 4.2% |
| $75,000 to $99,999 | 3 | 2.5% |
| $100,000 to $149,999 | 76 | 64.4% |
| $150,000 to $199,999 | 0 | 0.0% |
| $200,000+ | 12 | 10.2% |
Family Income by Famaliy Size in Hot Springs
2-person families (99 | 83.9%) account for the highest median family income in Hot Springs with $115,438 per family, while 2-person families (99 | 83.9%) have the highest median income of $57,719 per family member.
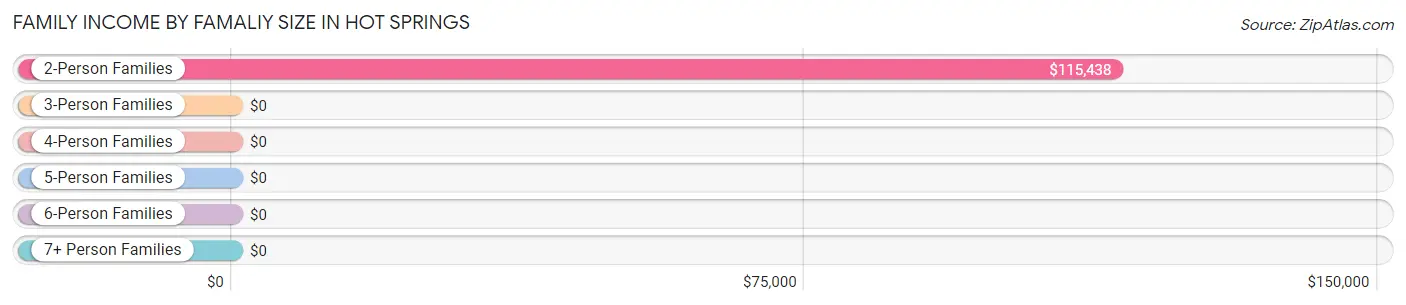
| Income Bracket | # Families | Median Income |
| 2-Person Families | 99 (83.9%) | $115,438 |
| 3-Person Families | 19 (16.1%) | $0 |
| 4-Person Families | 0 (0.0%) | $0 |
| 5-Person Families | 0 (0.0%) | $0 |
| 6-Person Families | 0 (0.0%) | $0 |
| 7+ Person Families | 0 (0.0%) | $0 |
| Total | 118 (100.0%) | $115,833 |
Family Income by Number of Earners in Hot Springs
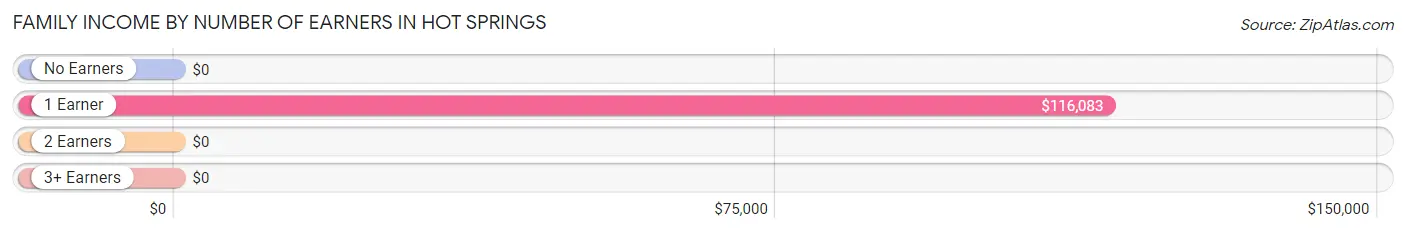
| Number of Earners | # Families | Median Income |
| No Earners | 0 (0.0%) | $0 |
| 1 Earner | 68 (57.6%) | $116,083 |
| 2 Earners | 38 (32.2%) | $0 |
| 3+ Earners | 12 (10.2%) | $0 |
| Total | 118 (100.0%) | $115,833 |
Household Income in Hot Springs
Household Income Brackets in Hot Springs
With 76 households falling in the category, the $100,000 to $149,999 income range is the most frequent in Hot Springs, accounting for 37.4% of all households.
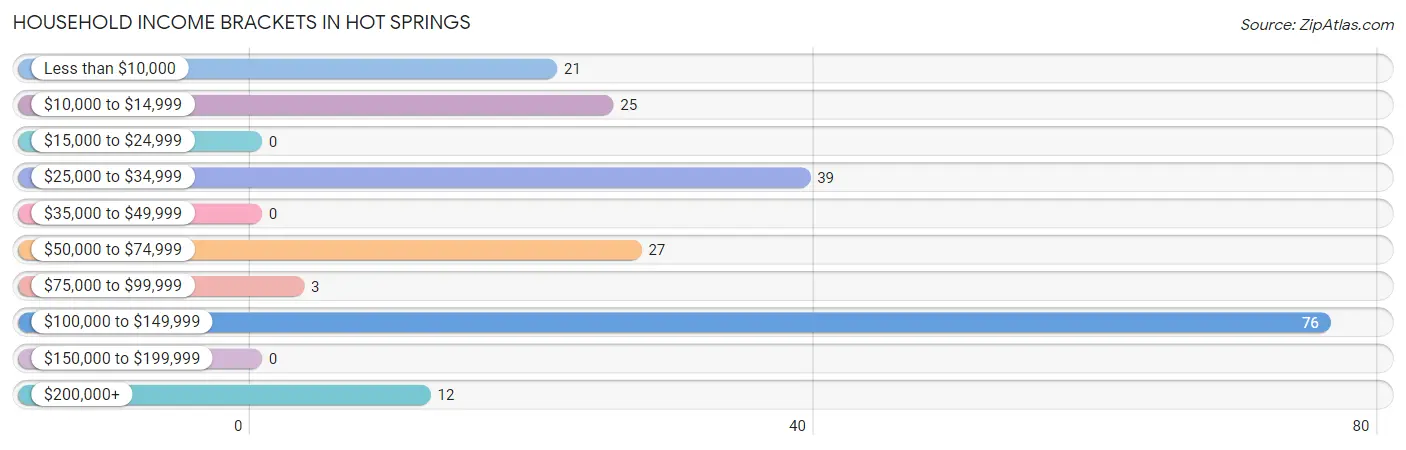
| Income Bracket | # Households | % Households |
| Less than $10,000 | 21 | 10.3% |
| $10,000 to $14,999 | 25 | 12.3% |
| $15,000 to $24,999 | 0 | 0.0% |
| $25,000 to $34,999 | 39 | 19.2% |
| $35,000 to $49,999 | 0 | 0.0% |
| $50,000 to $74,999 | 27 | 13.3% |
| $75,000 to $99,999 | 3 | 1.5% |
| $100,000 to $149,999 | 76 | 37.4% |
| $150,000 to $199,999 | 0 | 0.0% |
| $200,000+ | 12 | 5.9% |
Household Income by Householder Age in Hot Springs
The median household income in Hot Springs is $0, with the highest median household income of $115,563 found in the 65+ years age bracket for the primary householder. A total of 93 households (45.8%) fall into this category.
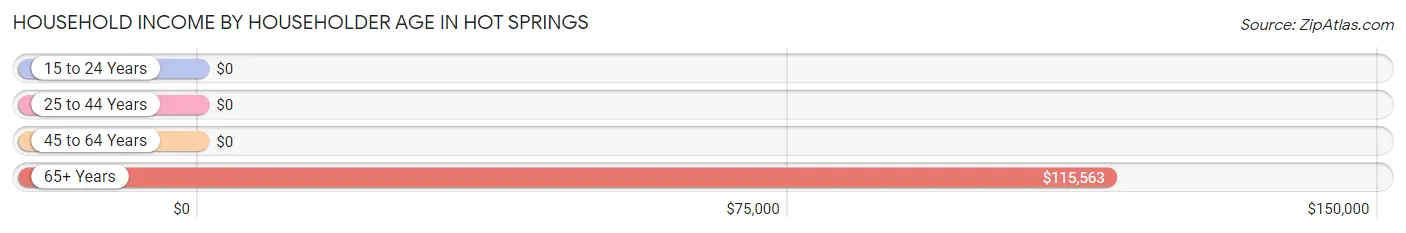
| Income Bracket | # Households | Median Income |
| 15 to 24 Years | 0 (0.0%) | $0 |
| 25 to 44 Years | 29 (14.3%) | $0 |
| 45 to 64 Years | 81 (39.9%) | $0 |
| 65+ Years | 93 (45.8%) | $115,563 |
| Total | 203 (100.0%) | $0 |
Poverty in Hot Springs
Income Below Poverty by Sex and Age in Hot Springs
With 30.0% poverty level for males and 32.6% for females among the residents of Hot Springs, 45 to 54 year old males and 18 to 24 year old females are the most vulnerable to poverty, with 16 males (100.0%) and 15 females (100.0%) in their respective age groups living below the poverty level.
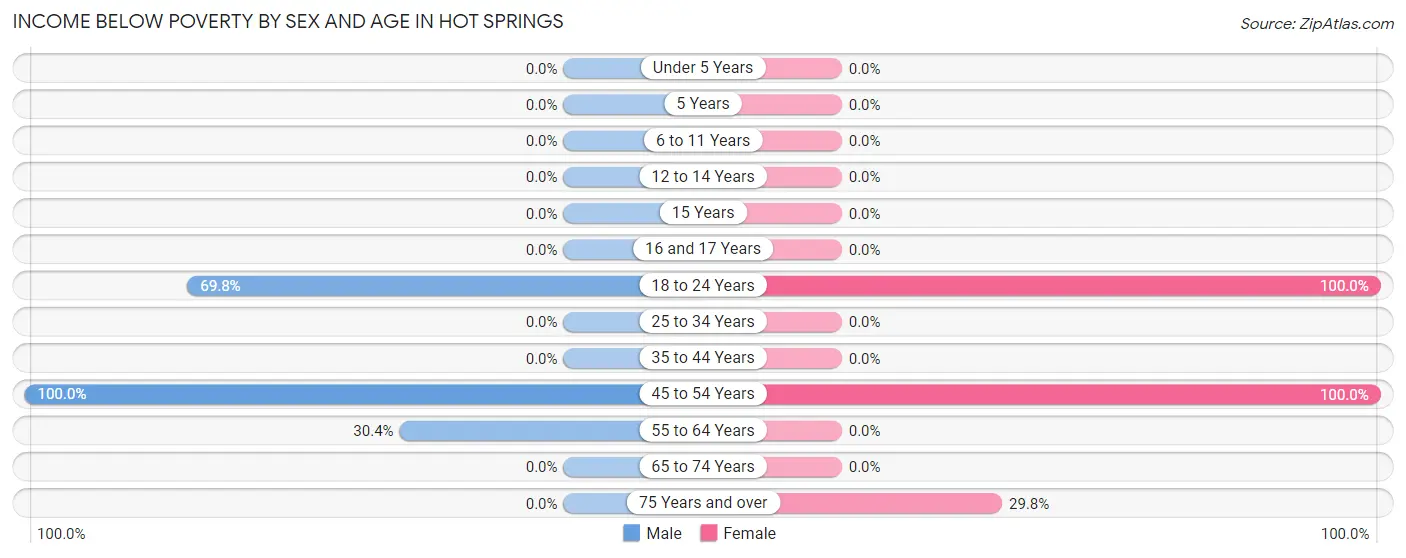
| Age Bracket | Male | Female |
| Under 5 Years | 0 (0.0%) | 0 (0.0%) |
| 5 Years | 0 (0.0%) | 0 (0.0%) |
| 6 to 11 Years | 0 (0.0%) | 0 (0.0%) |
| 12 to 14 Years | 0 (0.0%) | 0 (0.0%) |
| 15 Years | 0 (0.0%) | 0 (0.0%) |
| 16 and 17 Years | 0 (0.0%) | 0 (0.0%) |
| 18 to 24 Years | 30 (69.8%) | 15 (100.0%) |
| 25 to 34 Years | 0 (0.0%) | 0 (0.0%) |
| 35 to 44 Years | 0 (0.0%) | 0 (0.0%) |
| 45 to 54 Years | 16 (100.0%) | 21 (100.0%) |
| 55 to 64 Years | 28 (30.4%) | 0 (0.0%) |
| 65 to 74 Years | 0 (0.0%) | 0 (0.0%) |
| 75 Years and over | 0 (0.0%) | 25 (29.8%) |
| Total | 74 (30.0%) | 61 (32.6%) |
Income Above Poverty by Sex and Age in Hot Springs
According to the poverty statistics in Hot Springs, males aged 35 to 44 years and females aged 5 years are the age groups that are most secure financially, with 100.0% of males and 100.0% of females in these age groups living above the poverty line.
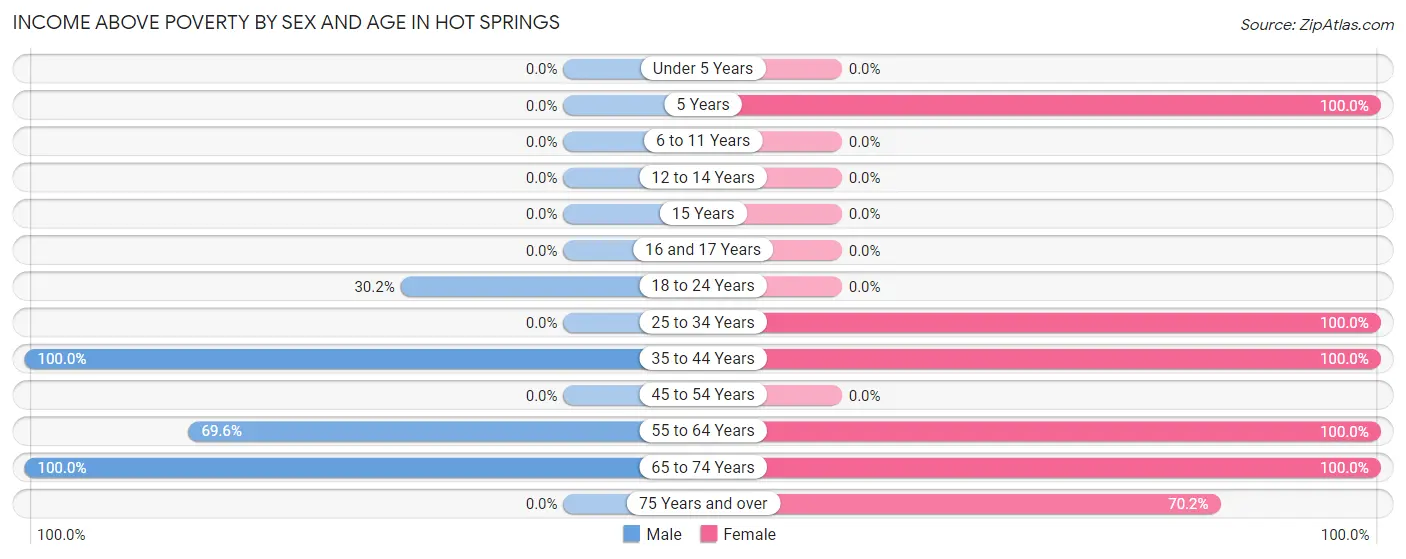
| Age Bracket | Male | Female |
| Under 5 Years | 0 (0.0%) | 0 (0.0%) |
| 5 Years | 0 (0.0%) | 9 (100.0%) |
| 6 to 11 Years | 0 (0.0%) | 0 (0.0%) |
| 12 to 14 Years | 0 (0.0%) | 0 (0.0%) |
| 15 Years | 0 (0.0%) | 0 (0.0%) |
| 16 and 17 Years | 0 (0.0%) | 0 (0.0%) |
| 18 to 24 Years | 13 (30.2%) | 0 (0.0%) |
| 25 to 34 Years | 0 (0.0%) | 7 (100.0%) |
| 35 to 44 Years | 29 (100.0%) | 22 (100.0%) |
| 45 to 54 Years | 0 (0.0%) | 0 (0.0%) |
| 55 to 64 Years | 64 (69.6%) | 21 (100.0%) |
| 65 to 74 Years | 67 (100.0%) | 8 (100.0%) |
| 75 Years and over | 0 (0.0%) | 59 (70.2%) |
| Total | 173 (70.0%) | 126 (67.4%) |
Income Below Poverty Among Married-Couple Families in Hot Springs
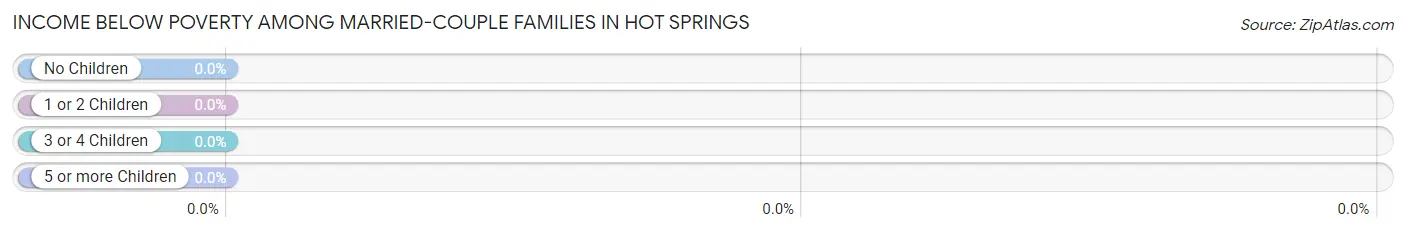
| Children | Above Poverty | Below Poverty |
| No Children | 89 (100.0%) | 0 (0.0%) |
| 1 or 2 Children | 7 (100.0%) | 0 (0.0%) |
| 3 or 4 Children | 0 (0.0%) | 0 (0.0%) |
| 5 or more Children | 0 (0.0%) | 0 (0.0%) |
| Total | 96 (100.0%) | 0 (0.0%) |
Income Below Poverty Among Single-Parent Households in Hot Springs
| Children | Single Father | Single Mother |
| No Children | 0 (0.0%) | 0 (0.0%) |
| 1 or 2 Children | 0 (0.0%) | 0 (0.0%) |
| 3 or 4 Children | 0 (0.0%) | 0 (0.0%) |
| 5 or more Children | 0 (0.0%) | 0 (0.0%) |
| Total | 0 (0.0%) | 0 (0.0%) |
Income Below Poverty Among Married-Couple vs Single-Parent Households in Hot Springs
| Children | Married-Couple Families | Single-Parent Households |
| No Children | 0 (0.0%) | 0 (0.0%) |
| 1 or 2 Children | 0 (0.0%) | 0 (0.0%) |
| 3 or 4 Children | 0 (0.0%) | 0 (0.0%) |
| 5 or more Children | 0 (0.0%) | 0 (0.0%) |
| Total | 0 (0.0%) | 0 (0.0%) |
Race in Hot Springs
The most populous races in Hot Springs are White / Caucasian (343 | 75.4%), Black / African American (98 | 21.5%), and Hispanic or Latino (16 | 3.5%).
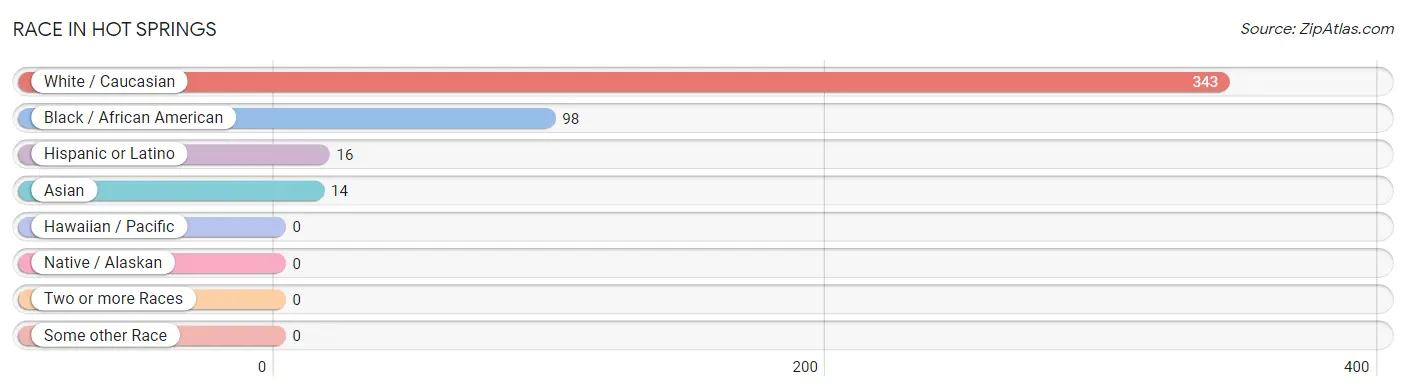
| Race | # Population | % Population |
| Asian | 14 | 3.1% |
| Black / African American | 98 | 21.5% |
| Hawaiian / Pacific | 0 | 0.0% |
| Hispanic or Latino | 16 | 3.5% |
| Native / Alaskan | 0 | 0.0% |
| White / Caucasian | 343 | 75.4% |
| Two or more Races | 0 | 0.0% |
| Some other Race | 0 | 0.0% |
| Total | 455 | 100.0% |
Ancestry in Hot Springs
The most populous ancestries reported in Hot Springs are Irish (55 | 12.1%), German (53 | 11.7%), English (49 | 10.8%), American (27 | 5.9%), and Mexican (16 | 3.5%), together accounting for 44.0% of all Hot Springs residents.
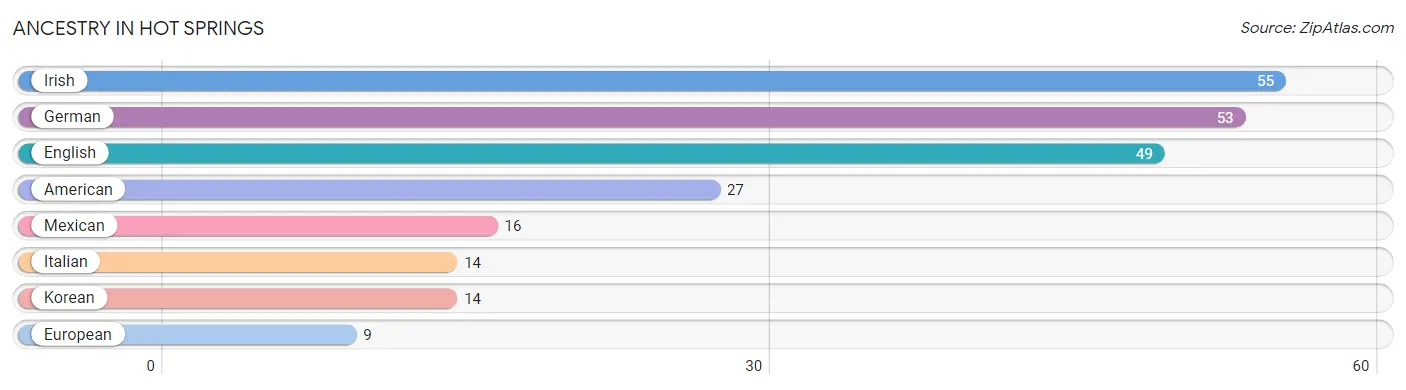
| Ancestry | # Population | % Population |
| American | 27 | 5.9% |
| English | 49 | 10.8% |
| European | 9 | 2.0% |
| German | 53 | 11.7% |
| Irish | 55 | 12.1% |
| Italian | 14 | 3.1% |
| Korean | 14 | 3.1% |
| Mexican | 16 | 3.5% | View All 8 Rows |
Immigrants in Hot Springs
The most numerous immigrant groups reported in Hot Springs came from Central America (16 | 3.5%), Latin America (16 | 3.5%), and Mexico (16 | 3.5%), together accounting for 10.6% of all Hot Springs residents.
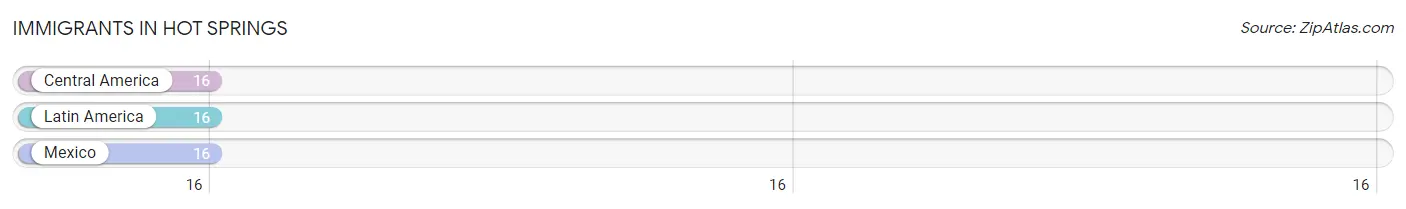
| Immigration Origin | # Population | % Population |
| Central America | 16 | 3.5% |
| Latin America | 16 | 3.5% |
| Mexico | 16 | 3.5% | View All 3 Rows |
Sex and Age in Hot Springs
Sex and Age in Hot Springs
The most populous age groups in Hot Springs are 55 to 59 Years (76 | 30.8%) for men and 75 to 79 Years (84 | 40.4%) for women.
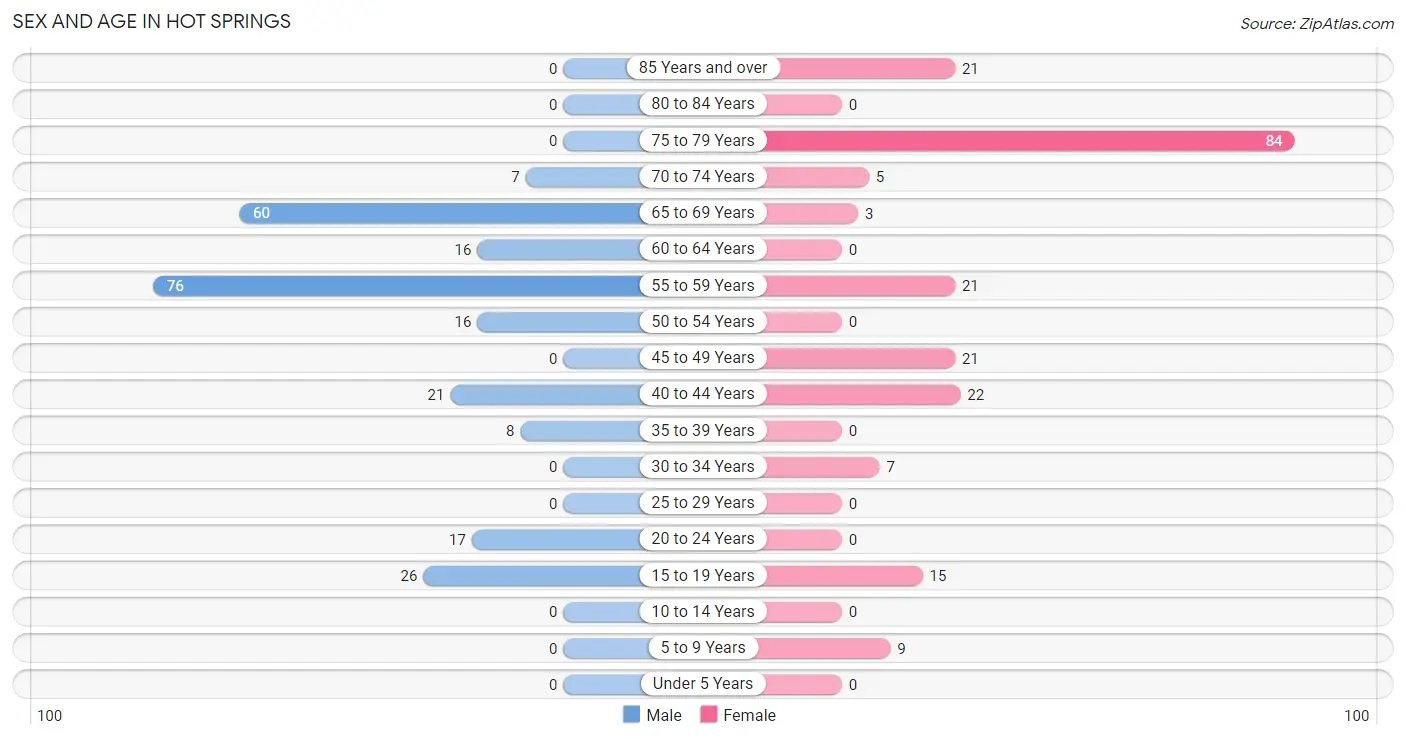
| Age Bracket | Male | Female |
| Under 5 Years | 0 (0.0%) | 0 (0.0%) |
| 5 to 9 Years | 0 (0.0%) | 9 (4.3%) |
| 10 to 14 Years | 0 (0.0%) | 0 (0.0%) |
| 15 to 19 Years | 26 (10.5%) | 15 (7.2%) |
| 20 to 24 Years | 17 (6.9%) | 0 (0.0%) |
| 25 to 29 Years | 0 (0.0%) | 0 (0.0%) |
| 30 to 34 Years | 0 (0.0%) | 7 (3.4%) |
| 35 to 39 Years | 8 (3.2%) | 0 (0.0%) |
| 40 to 44 Years | 21 (8.5%) | 22 (10.6%) |
| 45 to 49 Years | 0 (0.0%) | 21 (10.1%) |
| 50 to 54 Years | 16 (6.5%) | 0 (0.0%) |
| 55 to 59 Years | 76 (30.8%) | 21 (10.1%) |
| 60 to 64 Years | 16 (6.5%) | 0 (0.0%) |
| 65 to 69 Years | 60 (24.3%) | 3 (1.4%) |
| 70 to 74 Years | 7 (2.8%) | 5 (2.4%) |
| 75 to 79 Years | 0 (0.0%) | 84 (40.4%) |
| 80 to 84 Years | 0 (0.0%) | 0 (0.0%) |
| 85 Years and over | 0 (0.0%) | 21 (10.1%) |
| Total | 247 (100.0%) | 208 (100.0%) |
Families and Households in Hot Springs
Median Family Size in Hot Springs
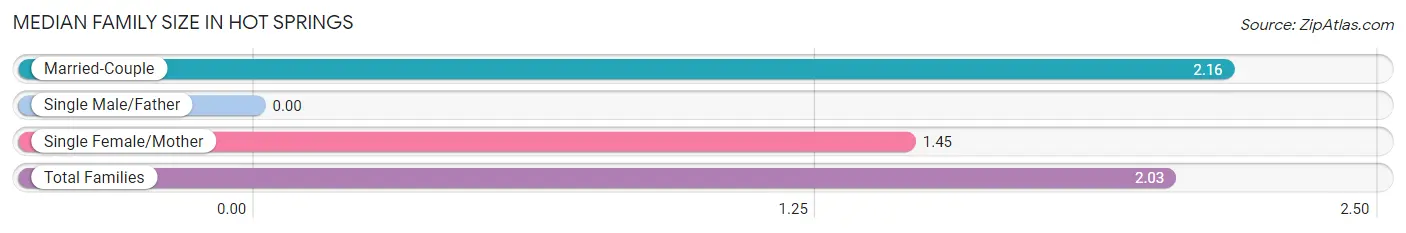
| Family Type | # Families | Family Size |
| Married-Couple | 96 (81.4%) | 2.16 |
| Single Male/Father | 0 (0.0%) | - |
| Single Female/Mother | 22 (18.6%) | 1.45 |
| Total Families | 118 (100.0%) | 2.03 |
Median Household Size in Hot Springs
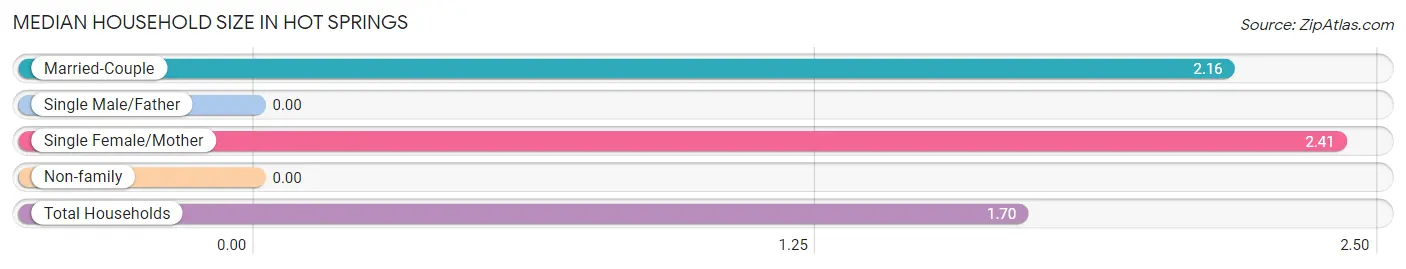
| Household Type | # Households | Household Size |
| Married-Couple | 96 (47.3%) | 2.16 |
| Single Male/Father | 0 (0.0%) | - |
| Single Female/Mother | 22 (10.8%) | 2.41 |
| Non-family | 85 (41.9%) | - |
| Total Households | 203 (100.0%) | 1.70 |
Household Size by Marriage Status in Hot Springs
Out of a total of 203 households in Hot Springs, 118 (58.1%) are family households, while 85 (41.9%) are nonfamily households. The most numerous type of family households are 2-person households, comprising 77, and the most common type of nonfamily households are 1-person households, comprising 85.
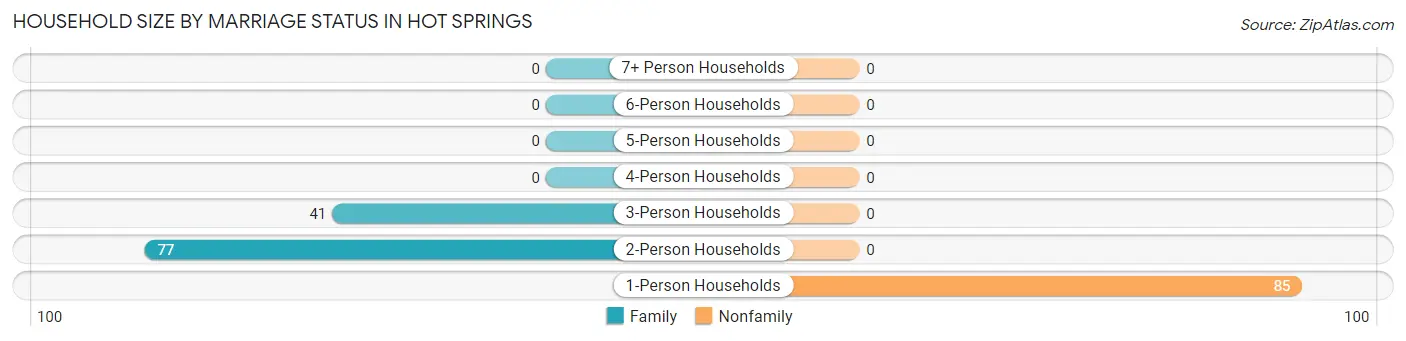
| Household Size | Family Households | Nonfamily Households |
| 1-Person Households | - | 85 (41.9%) |
| 2-Person Households | 77 (37.9%) | 0 (0.0%) |
| 3-Person Households | 41 (20.2%) | 0 (0.0%) |
| 4-Person Households | 0 (0.0%) | 0 (0.0%) |
| 5-Person Households | 0 (0.0%) | 0 (0.0%) |
| 6-Person Households | 0 (0.0%) | 0 (0.0%) |
| 7+ Person Households | 0 (0.0%) | 0 (0.0%) |
| Total | 118 (58.1%) | 85 (41.9%) |
Female Fertility in Hot Springs
Fertility by Age in Hot Springs
| Age Bracket | Women with Births | Births / 1,000 Women |
| 15 to 19 years | 0 (0.0%) | 0.0 |
| 20 to 34 years | 0 (0.0%) | 0.0 |
| 35 to 50 years | 0 (0.0%) | 0.0 |
| Total | 0 (0.0%) | 0.0 |
Fertility by Age by Marriage Status in Hot Springs
| Age Bracket | Married | Unmarried |
| 15 to 19 years | 0 (0.0%) | 0 (0.0%) |
| 20 to 34 years | 0 (0.0%) | 0 (0.0%) |
| 35 to 50 years | 0 (0.0%) | 0 (0.0%) |
| Total | 0 (0.0%) | 0 (0.0%) |
Fertility by Education in Hot Springs
| Educational Attainment | Women with Births | Births / 1,000 Women |
| Less than High School | 0 (0.0%) | 0.0 |
| High School Diploma | 0 (0.0%) | 0.0 |
| College or Associate's Degree | 0 (0.0%) | 0.0 |
| Bachelor's Degree | 0 (0.0%) | 0.0 |
| Graduate Degree | 0 (0.0%) | 0.0 |
| Total | 0 (0.0%) | 0.0 |
Fertility by Education by Marriage Status in Hot Springs
| Educational Attainment | Married | Unmarried |
| Less than High School | 0 (0.0%) | 0 (0.0%) |
| High School Diploma | 0 (0.0%) | 0 (0.0%) |
| College or Associate's Degree | 0 (0.0%) | 0 (0.0%) |
| Bachelor's Degree | 0 (0.0%) | 0 (0.0%) |
| Graduate Degree | 0 (0.0%) | 0 (0.0%) |
| Total | 0 (0.0%) | 0 (0.0%) |
Employment Characteristics in Hot Springs
Employment by Class of Employer in Hot Springs
Among the 252 employed individuals in Hot Springs, private company employees (164 | 65.1%), local government employees (83 | 32.9%), and federal government employees (5 | 2.0%) make up the most common classes of employment.
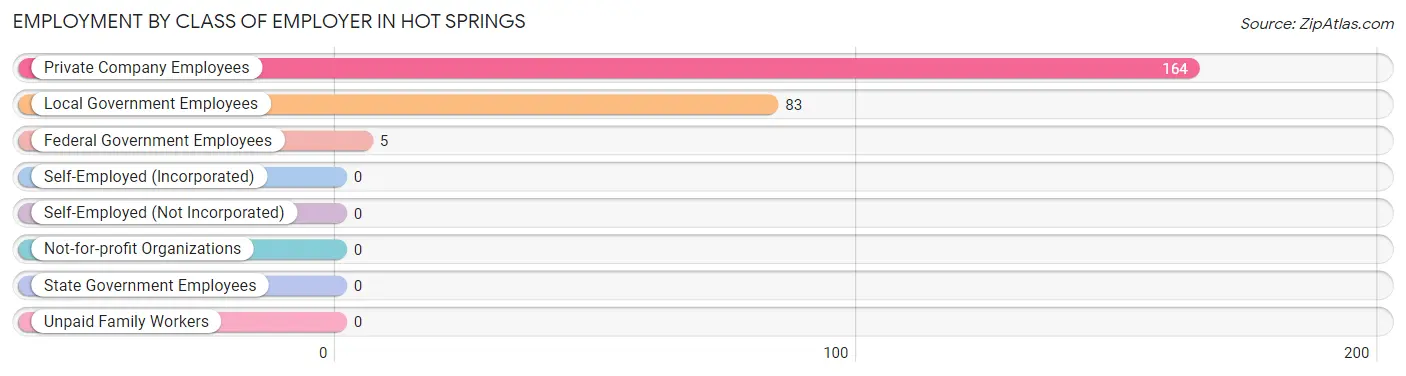
| Employer Class | # Employees | % Employees |
| Private Company Employees | 164 | 65.1% |
| Self-Employed (Incorporated) | 0 | 0.0% |
| Self-Employed (Not Incorporated) | 0 | 0.0% |
| Not-for-profit Organizations | 0 | 0.0% |
| Local Government Employees | 83 | 32.9% |
| State Government Employees | 0 | 0.0% |
| Federal Government Employees | 5 | 2.0% |
| Unpaid Family Workers | 0 | 0.0% |
| Total | 252 | 100.0% |
Employment Status by Age in Hot Springs
According to the labor force statistics for Hot Springs, out of the total population over 16 years of age (446), 57.2% or 255 individuals are in the labor force, with 1.2% or 3 of them unemployed. The age group with the highest labor force participation rate is 30 to 34 years, with 100.0% or 7 individuals in the labor force. Within the labor force, the 20 to 24 years age range has the highest percentage of unemployed individuals, with 100.0% or 3 of them being unemployed.
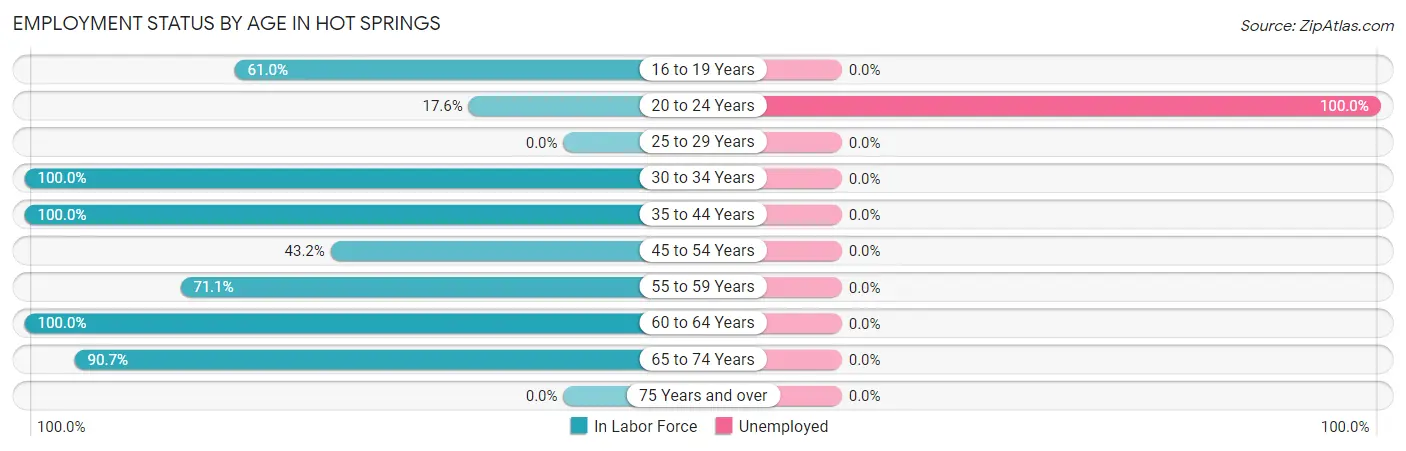
| Age Bracket | In Labor Force | Unemployed |
| 16 to 19 Years | 25 (61.0%) | 0 (0.0%) |
| 20 to 24 Years | 3 (17.6%) | 3 (100.0%) |
| 25 to 29 Years | 0 (0.0%) | 0 (0.0%) |
| 30 to 34 Years | 7 (100.0%) | 0 (0.0%) |
| 35 to 44 Years | 51 (100.0%) | 0 (0.0%) |
| 45 to 54 Years | 16 (43.2%) | 0 (0.0%) |
| 55 to 59 Years | 69 (71.1%) | 0 (0.0%) |
| 60 to 64 Years | 16 (100.0%) | 0 (0.0%) |
| 65 to 74 Years | 68 (90.7%) | 0 (0.0%) |
| 75 Years and over | 0 (0.0%) | 0 (0.0%) |
| Total | 255 (57.2%) | 3 (1.2%) |
Employment Status by Educational Attainment in Hot Springs
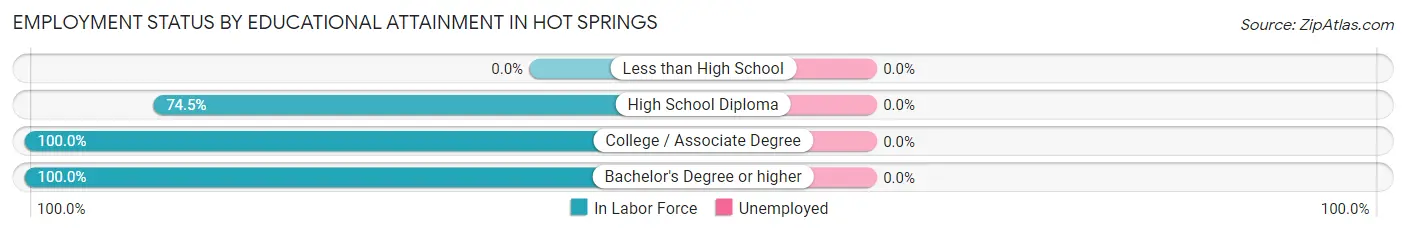
| Educational Attainment | In Labor Force | Unemployed |
| Less than High School | 0 (0.0%) | 0 (0.0%) |
| High School Diploma | 82 (74.5%) | 0 (0.0%) |
| College / Associate Degree | 23 (100.0%) | 0 (0.0%) |
| Bachelor's Degree or higher | 54 (100.0%) | 0 (0.0%) |
| Total | 159 (76.4%) | 0 (0.0%) |
Employment Occupations by Sex in Hot Springs
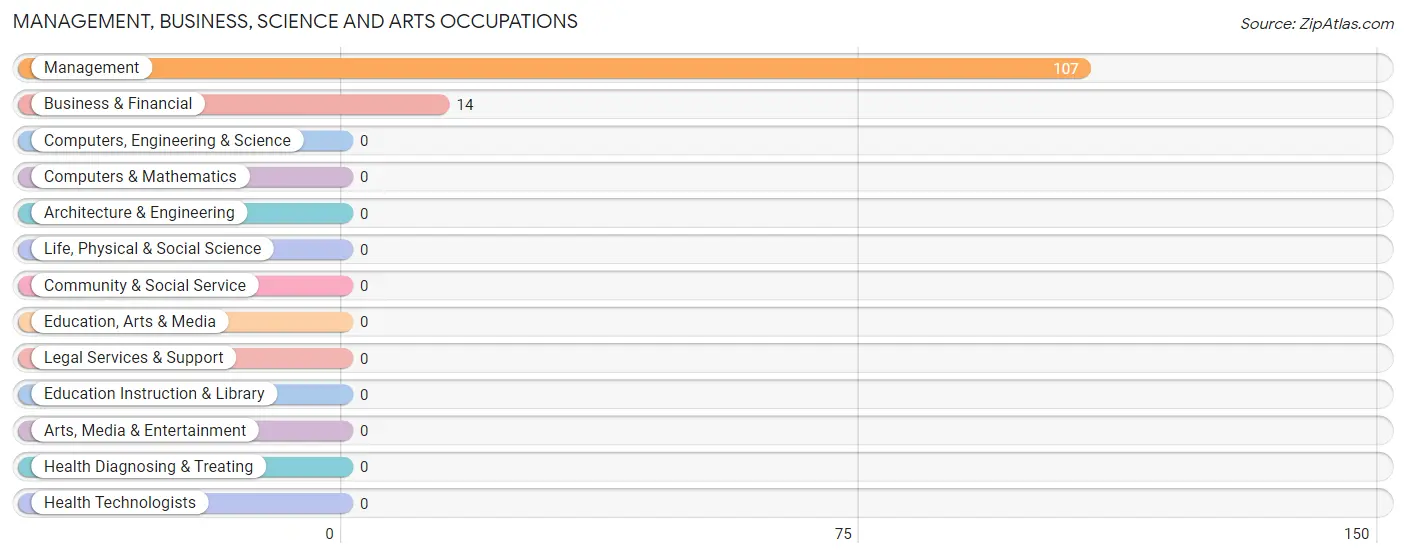
Management, Business, Science and Arts Occupations
The most common Management, Business, Science and Arts occupations in Hot Springs are Management (107 | 42.5%), and Business & Financial (14 | 5.6%).
Management, Business, Science and Arts Occupations by Sex
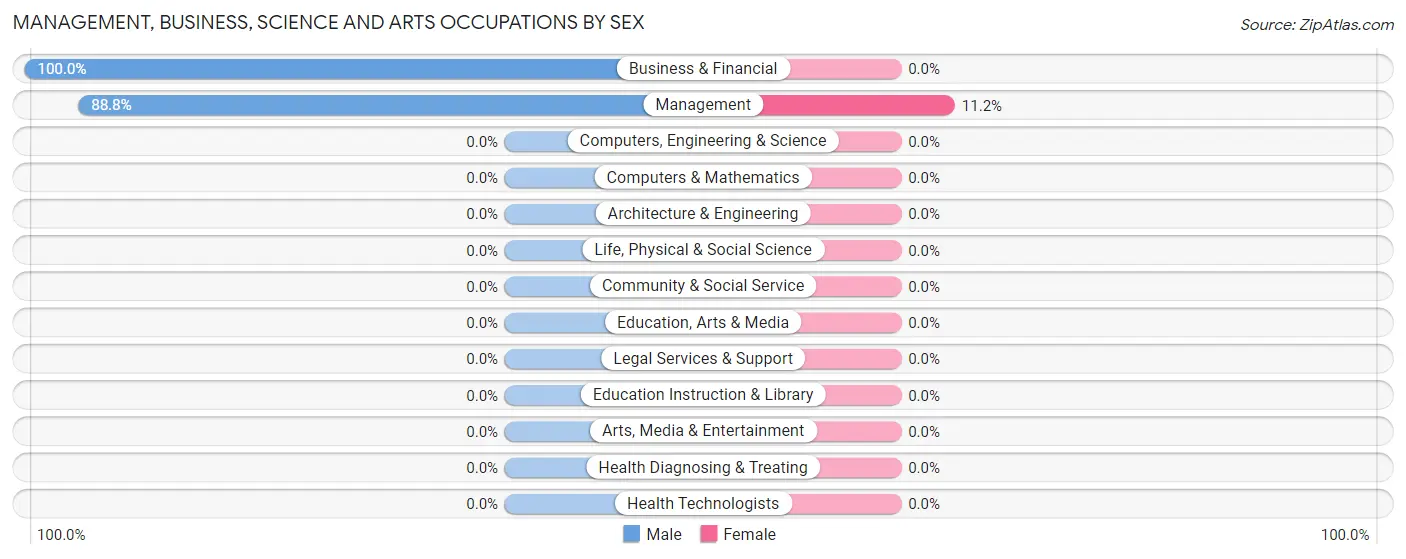
| Occupation | Male | Female |
| Management | 95 (88.8%) | 12 (11.2%) |
| Business & Financial | 14 (100.0%) | 0 (0.0%) |
| Computers, Engineering & Science | 0 (0.0%) | 0 (0.0%) |
| Computers & Mathematics | 0 (0.0%) | 0 (0.0%) |
| Architecture & Engineering | 0 (0.0%) | 0 (0.0%) |
| Life, Physical & Social Science | 0 (0.0%) | 0 (0.0%) |
| Community & Social Service | 0 (0.0%) | 0 (0.0%) |
| Education, Arts & Media | 0 (0.0%) | 0 (0.0%) |
| Legal Services & Support | 0 (0.0%) | 0 (0.0%) |
| Education Instruction & Library | 0 (0.0%) | 0 (0.0%) |
| Arts, Media & Entertainment | 0 (0.0%) | 0 (0.0%) |
| Health Diagnosing & Treating | 0 (0.0%) | 0 (0.0%) |
| Health Technologists | 0 (0.0%) | 0 (0.0%) |
| Total (Category) | 109 (90.1%) | 12 (9.9%) |
| Total (Overall) | 182 (72.2%) | 70 (27.8%) |
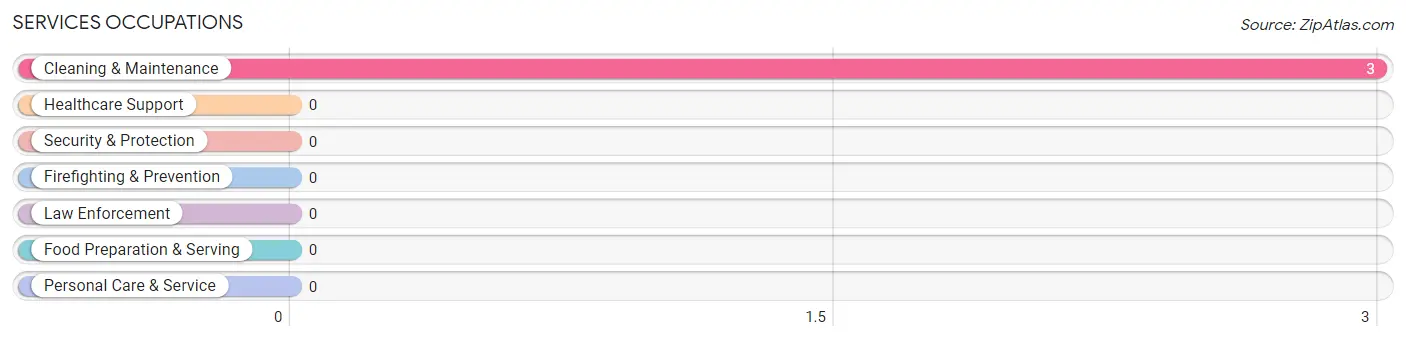
Services Occupations
The most common Services occupations in Hot Springs are , and Cleaning & Maintenance (3 | 1.2%).
Services Occupations by Sex
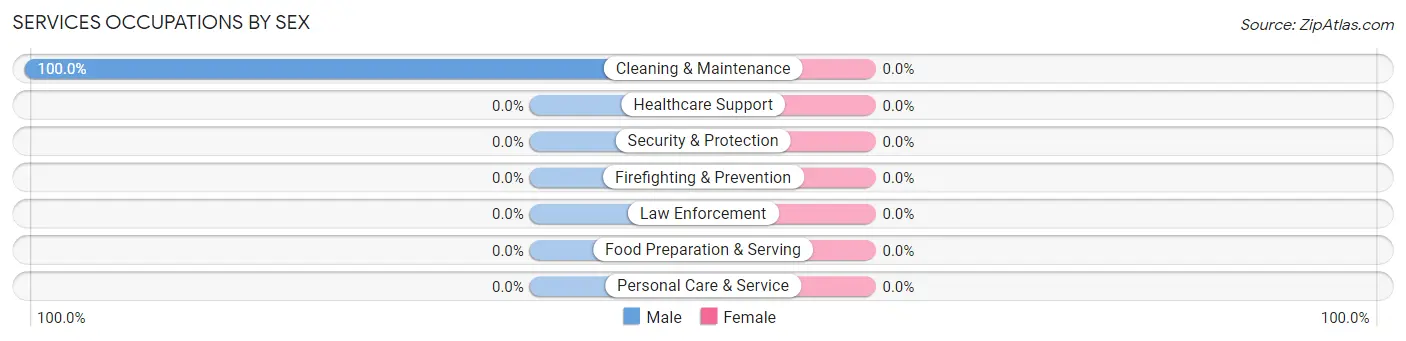
| Occupation | Male | Female |
| Healthcare Support | 0 (0.0%) | 0 (0.0%) |
| Security & Protection | 0 (0.0%) | 0 (0.0%) |
| Firefighting & Prevention | 0 (0.0%) | 0 (0.0%) |
| Law Enforcement | 0 (0.0%) | 0 (0.0%) |
| Food Preparation & Serving | 0 (0.0%) | 0 (0.0%) |
| Cleaning & Maintenance | 3 (100.0%) | 0 (0.0%) |
| Personal Care & Service | 0 (0.0%) | 0 (0.0%) |
| Total (Category) | 3 (100.0%) | 0 (0.0%) |
| Total (Overall) | 182 (72.2%) | 70 (27.8%) |
Sales and Office Occupations
The most common Sales and Office occupations in Hot Springs are Office & Administration (57 | 22.6%), and Sales & Related (34 | 13.5%).
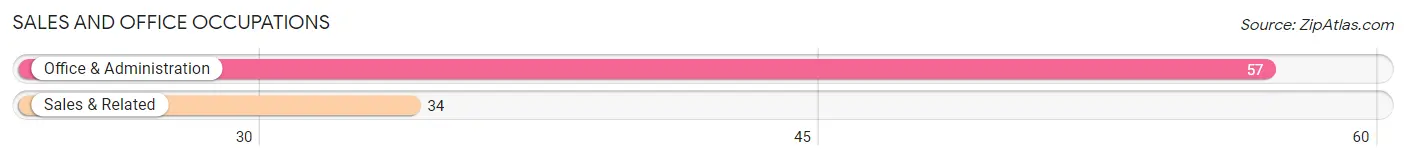
Sales and Office Occupations by Sex
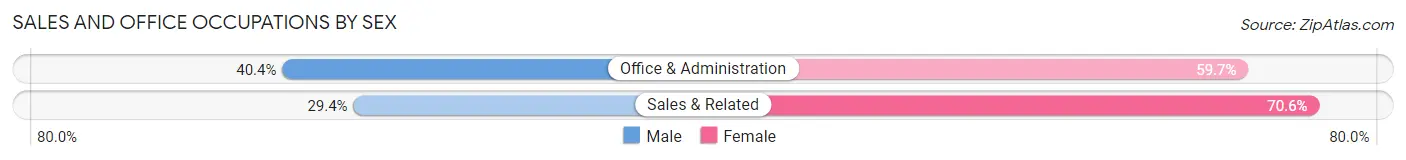
| Occupation | Male | Female |
| Sales & Related | 10 (29.4%) | 24 (70.6%) |
| Office & Administration | 23 (40.4%) | 34 (59.7%) |
| Total (Category) | 33 (36.3%) | 58 (63.7%) |
| Total (Overall) | 182 (72.2%) | 70 (27.8%) |
Natural Resources, Construction and Maintenance Occupations
The most common Natural Resources, Construction and Maintenance occupations in Hot Springs are , and Farming, Fishing & Forestry (16 | 6.4%).
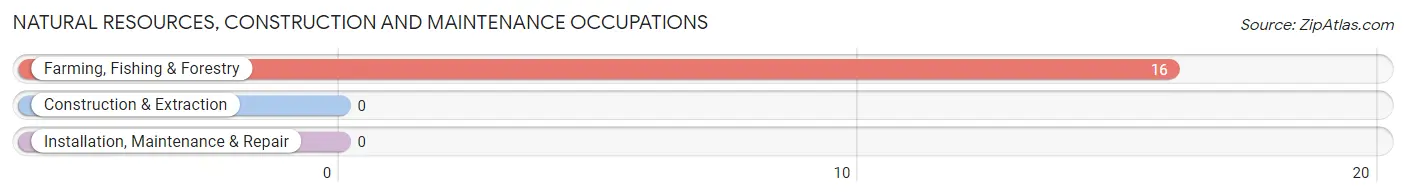
Natural Resources, Construction and Maintenance Occupations by Sex
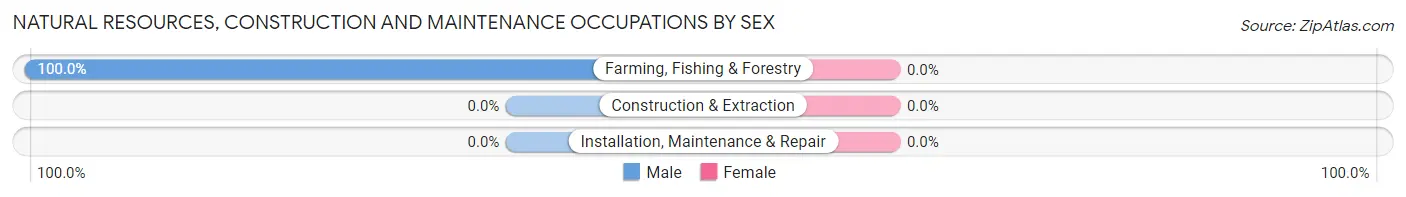
| Occupation | Male | Female |
| Farming, Fishing & Forestry | 16 (100.0%) | 0 (0.0%) |
| Construction & Extraction | 0 (0.0%) | 0 (0.0%) |
| Installation, Maintenance & Repair | 0 (0.0%) | 0 (0.0%) |
| Total (Category) | 16 (100.0%) | 0 (0.0%) |
| Total (Overall) | 182 (72.2%) | 70 (27.8%) |
Production, Transportation and Moving Occupations
The most common Production, Transportation and Moving occupations in Hot Springs are , and Production (21 | 8.3%).
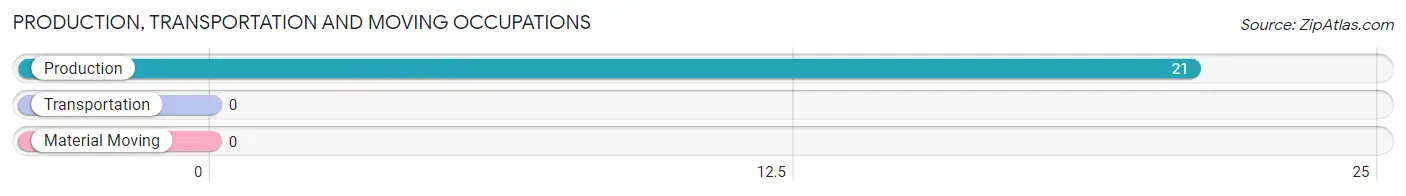
Production, Transportation and Moving Occupations by Sex
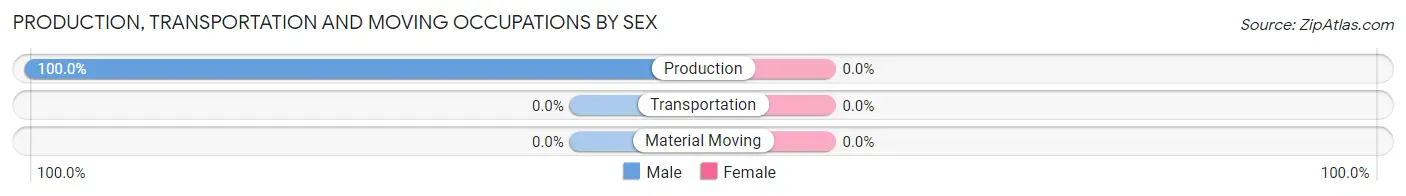
| Occupation | Male | Female |
| Production | 21 (100.0%) | 0 (0.0%) |
| Transportation | 0 (0.0%) | 0 (0.0%) |
| Material Moving | 0 (0.0%) | 0 (0.0%) |
| Total (Category) | 21 (100.0%) | 0 (0.0%) |
| Total (Overall) | 182 (72.2%) | 70 (27.8%) |
Employment Industries by Sex in Hot Springs
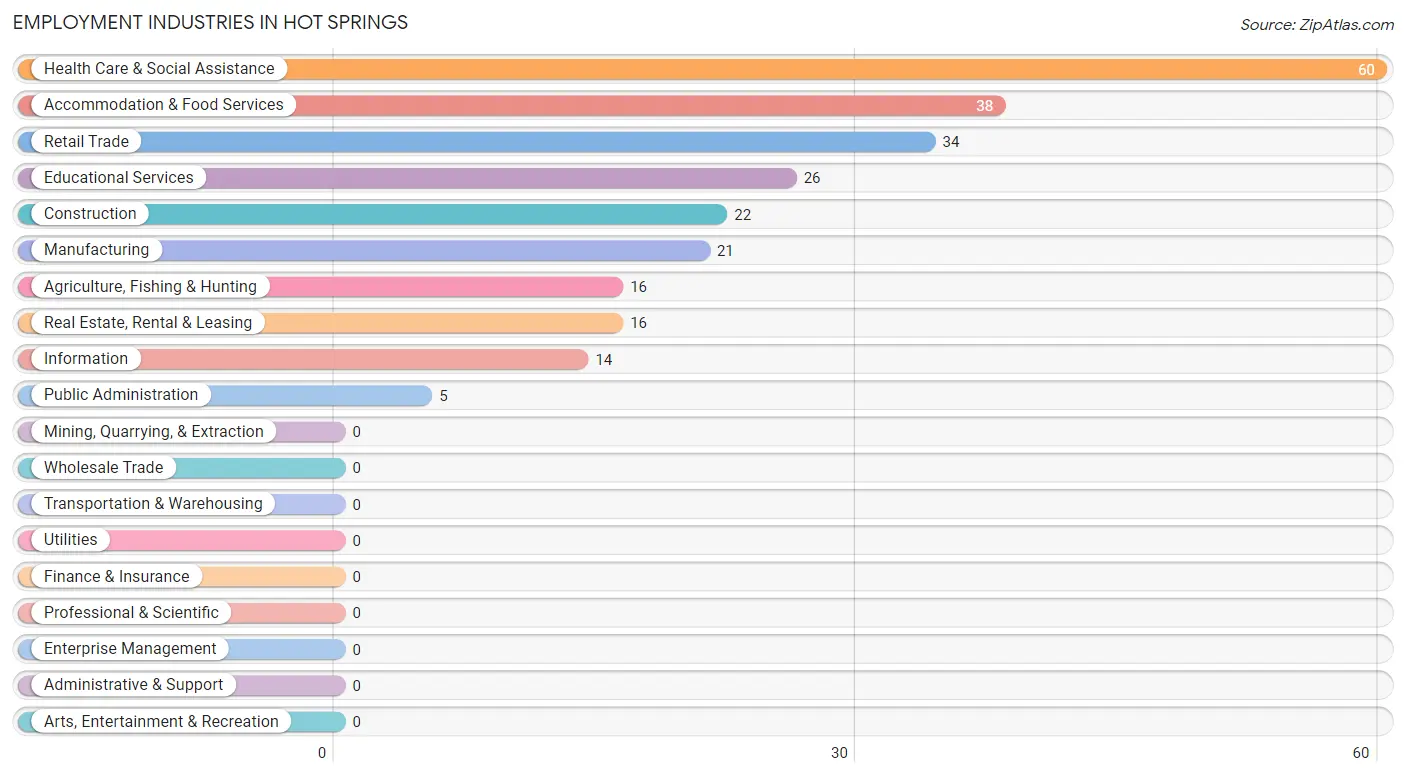
Employment Industries in Hot Springs
The major employment industries in Hot Springs include Health Care & Social Assistance (60 | 23.8%), Accommodation & Food Services (38 | 15.1%), Retail Trade (34 | 13.5%), Educational Services (26 | 10.3%), and Construction (22 | 8.7%).
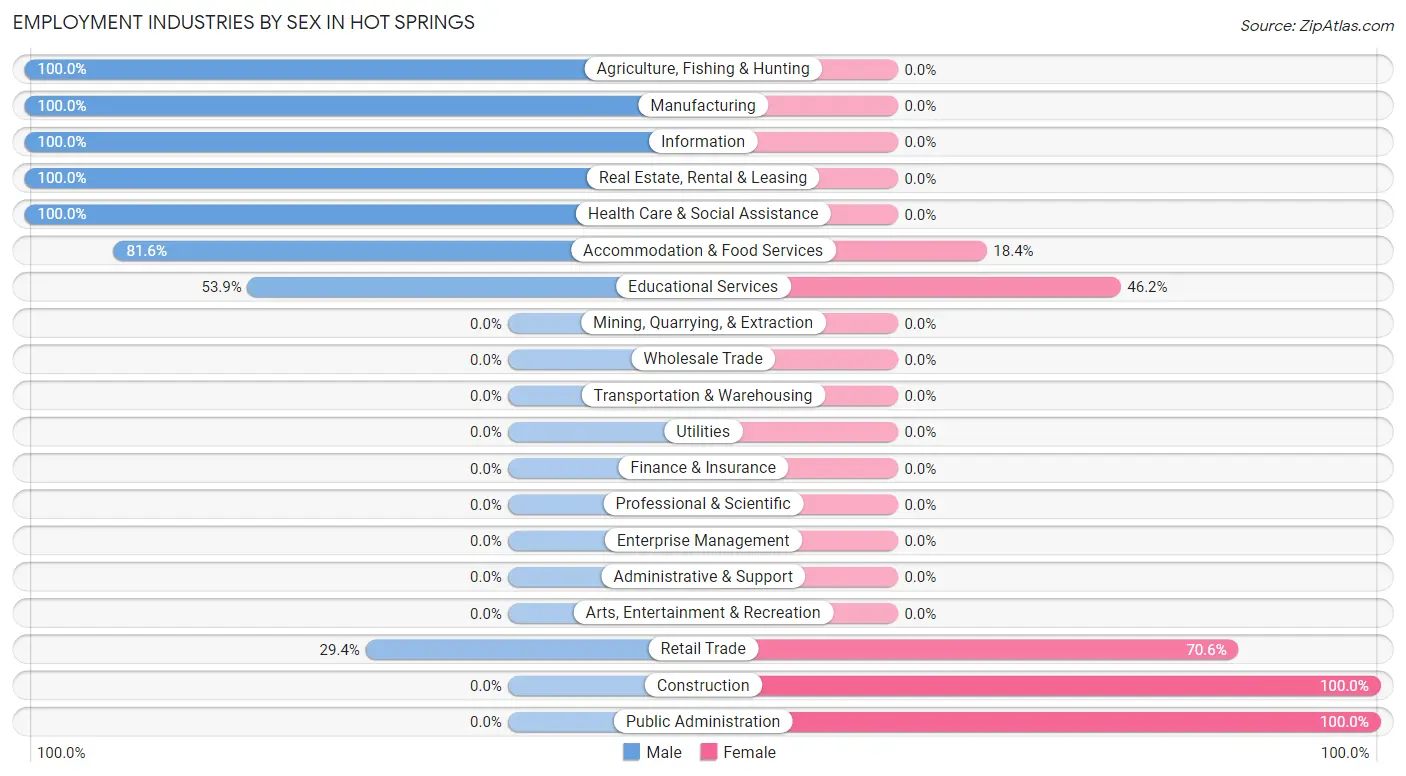
Employment Industries by Sex in Hot Springs
The Hot Springs industries that see more men than women are Agriculture, Fishing & Hunting (100.0%), Manufacturing (100.0%), and Information (100.0%), whereas the industries that tend to have a higher number of women are Construction (100.0%), Public Administration (100.0%), and Retail Trade (70.6%).
| Industry | Male | Female |
| Agriculture, Fishing & Hunting | 16 (100.0%) | 0 (0.0%) |
| Mining, Quarrying, & Extraction | 0 (0.0%) | 0 (0.0%) |
| Construction | 0 (0.0%) | 22 (100.0%) |
| Manufacturing | 21 (100.0%) | 0 (0.0%) |
| Wholesale Trade | 0 (0.0%) | 0 (0.0%) |
| Retail Trade | 10 (29.4%) | 24 (70.6%) |
| Transportation & Warehousing | 0 (0.0%) | 0 (0.0%) |
| Utilities | 0 (0.0%) | 0 (0.0%) |
| Information | 14 (100.0%) | 0 (0.0%) |
| Finance & Insurance | 0 (0.0%) | 0 (0.0%) |
| Real Estate, Rental & Leasing | 16 (100.0%) | 0 (0.0%) |
| Professional & Scientific | 0 (0.0%) | 0 (0.0%) |
| Enterprise Management | 0 (0.0%) | 0 (0.0%) |
| Administrative & Support | 0 (0.0%) | 0 (0.0%) |
| Educational Services | 14 (53.8%) | 12 (46.2%) |
| Health Care & Social Assistance | 60 (100.0%) | 0 (0.0%) |
| Arts, Entertainment & Recreation | 0 (0.0%) | 0 (0.0%) |
| Accommodation & Food Services | 31 (81.6%) | 7 (18.4%) |
| Public Administration | 0 (0.0%) | 5 (100.0%) |
| Total | 182 (72.2%) | 70 (27.8%) |
Education in Hot Springs
School Enrollment in Hot Springs
The most common levels of schooling among the 25 students in Hot Springs are college / undergraduate (16 | 64.0%), and kindergarten (9 | 36.0%).
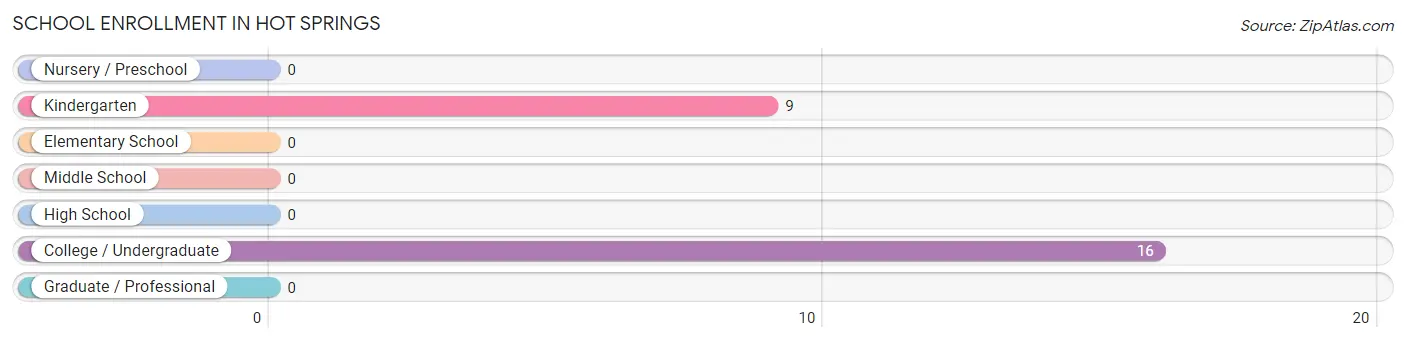
| School Level | # Students | % Students |
| Nursery / Preschool | 0 | 0.0% |
| Kindergarten | 9 | 36.0% |
| Elementary School | 0 | 0.0% |
| Middle School | 0 | 0.0% |
| High School | 0 | 0.0% |
| College / Undergraduate | 16 | 64.0% |
| Graduate / Professional | 0 | 0.0% |
| Total | 25 | 100.0% |
School Enrollment by Age by Funding Source in Hot Springs
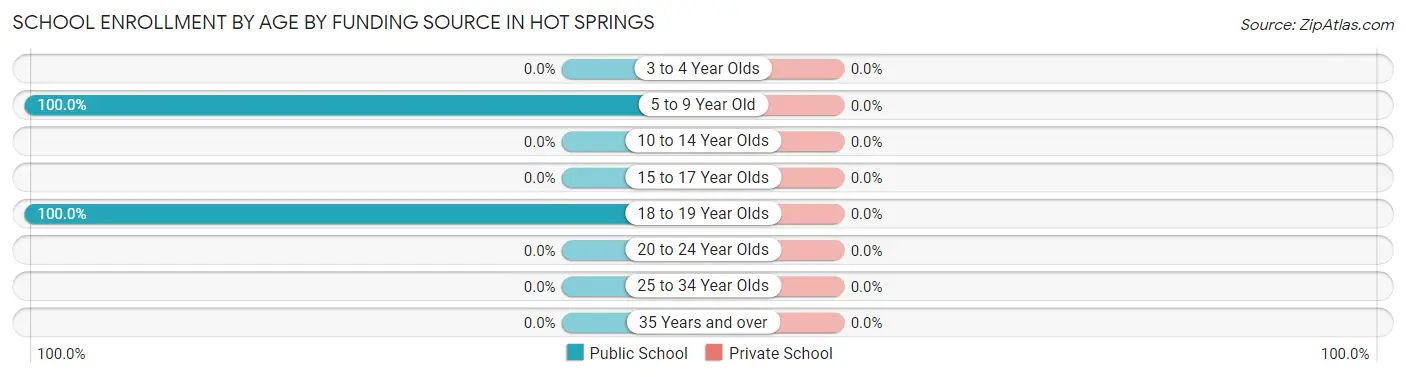
| Age Bracket | Public School | Private School |
| 3 to 4 Year Olds | 0 (0.0%) | 0 (0.0%) |
| 5 to 9 Year Old | 9 (100.0%) | 0 (0.0%) |
| 10 to 14 Year Olds | 0 (0.0%) | 0 (0.0%) |
| 15 to 17 Year Olds | 0 (0.0%) | 0 (0.0%) |
| 18 to 19 Year Olds | 16 (100.0%) | 0 (0.0%) |
| 20 to 24 Year Olds | 0 (0.0%) | 0 (0.0%) |
| 25 to 34 Year Olds | 0 (0.0%) | 0 (0.0%) |
| 35 Years and over | 0 (0.0%) | 0 (0.0%) |
| Total | 25 (100.0%) | 0 (0.0%) |
Educational Attainment by Field of Study in Hot Springs
Business (33 | 61.1%), education (12 | 22.2%), and science & technology (9 | 16.7%) are the most common fields of study among 54 individuals in Hot Springs who have obtained a bachelor's degree or higher.
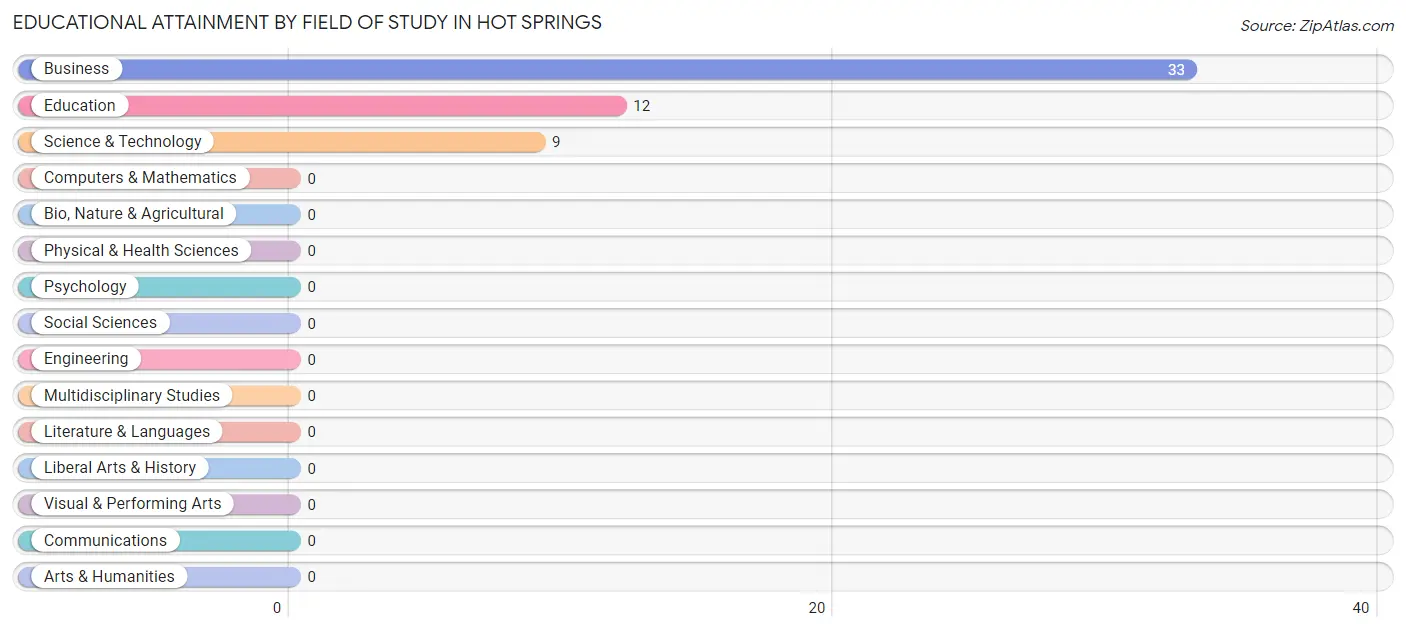
| Field of Study | # Graduates | % Graduates |
| Computers & Mathematics | 0 | 0.0% |
| Bio, Nature & Agricultural | 0 | 0.0% |
| Physical & Health Sciences | 0 | 0.0% |
| Psychology | 0 | 0.0% |
| Social Sciences | 0 | 0.0% |
| Engineering | 0 | 0.0% |
| Multidisciplinary Studies | 0 | 0.0% |
| Science & Technology | 9 | 16.7% |
| Business | 33 | 61.1% |
| Education | 12 | 22.2% |
| Literature & Languages | 0 | 0.0% |
| Liberal Arts & History | 0 | 0.0% |
| Visual & Performing Arts | 0 | 0.0% |
| Communications | 0 | 0.0% |
| Arts & Humanities | 0 | 0.0% |
| Total | 54 | 100.0% |
Transportation & Commute in Hot Springs
Vehicle Availability by Sex in Hot Springs
The most prevalent vehicle ownership categories in Hot Springs are males with 3 vehicles (74, accounting for 44.6%) and females with 3 vehicles (14, making up 134.5%).
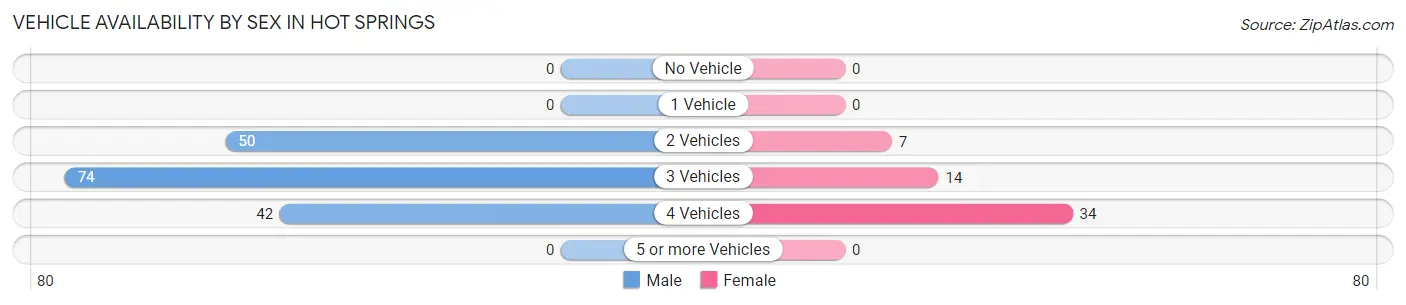
| Vehicles Available | Male | Female |
| No Vehicle | 0 (0.0%) | 0 (0.0%) |
| 1 Vehicle | 0 (0.0%) | 0 (0.0%) |
| 2 Vehicles | 50 (30.1%) | 7 (12.7%) |
| 3 Vehicles | 74 (44.6%) | 14 (25.5%) |
| 4 Vehicles | 42 (25.3%) | 34 (61.8%) |
| 5 or more Vehicles | 0 (0.0%) | 0 (0.0%) |
| Total | 166 (100.0%) | 55 (100.0%) |
Commute Time in Hot Springs
The most frequently occuring commute durations in Hot Springs are 10 to 14 minutes (102 commuters, 44.5%), 5 to 9 minutes (48 commuters, 21.0%), and 90 or more minutes (22 commuters, 9.6%).
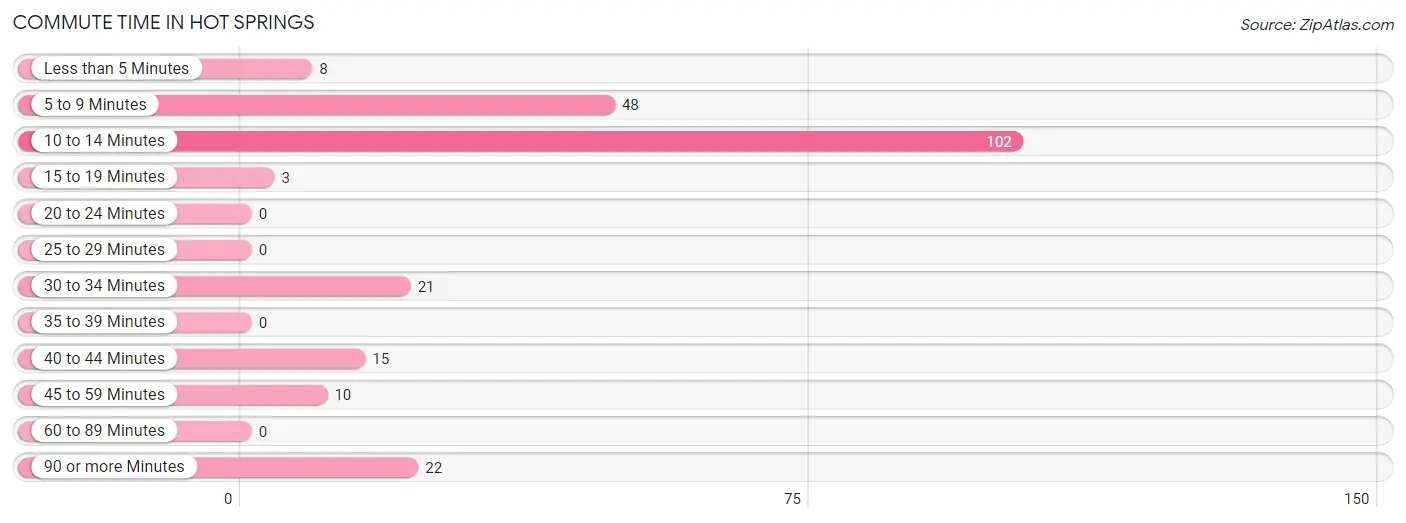
| Commute Time | # Commuters | % Commuters |
| Less than 5 Minutes | 8 | 3.5% |
| 5 to 9 Minutes | 48 | 21.0% |
| 10 to 14 Minutes | 102 | 44.5% |
| 15 to 19 Minutes | 3 | 1.3% |
| 20 to 24 Minutes | 0 | 0.0% |
| 25 to 29 Minutes | 0 | 0.0% |
| 30 to 34 Minutes | 21 | 9.2% |
| 35 to 39 Minutes | 0 | 0.0% |
| 40 to 44 Minutes | 15 | 6.6% |
| 45 to 59 Minutes | 10 | 4.4% |
| 60 to 89 Minutes | 0 | 0.0% |
| 90 or more Minutes | 22 | 9.6% |
Commute Time by Sex in Hot Springs
The most common commute times in Hot Springs are 10 to 14 minutes (85 commuters, 51.2%) for males and 90 or more minutes (22 commuters, 34.9%) for females.
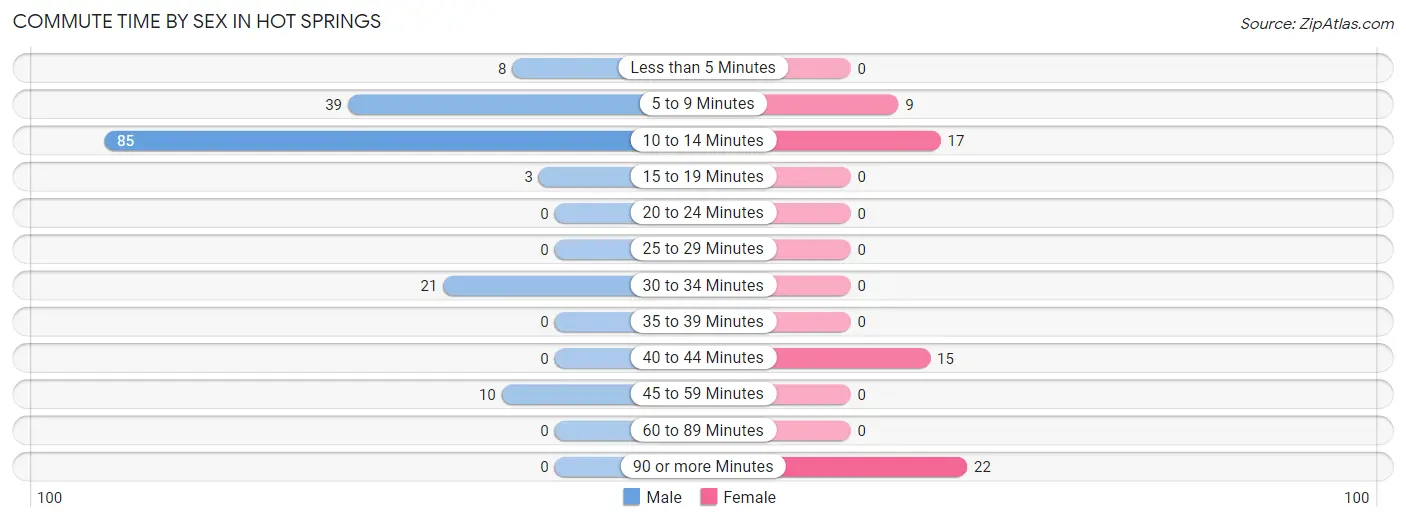
| Commute Time | Male | Female |
| Less than 5 Minutes | 8 (4.8%) | 0 (0.0%) |
| 5 to 9 Minutes | 39 (23.5%) | 9 (14.3%) |
| 10 to 14 Minutes | 85 (51.2%) | 17 (27.0%) |
| 15 to 19 Minutes | 3 (1.8%) | 0 (0.0%) |
| 20 to 24 Minutes | 0 (0.0%) | 0 (0.0%) |
| 25 to 29 Minutes | 0 (0.0%) | 0 (0.0%) |
| 30 to 34 Minutes | 21 (12.7%) | 0 (0.0%) |
| 35 to 39 Minutes | 0 (0.0%) | 0 (0.0%) |
| 40 to 44 Minutes | 0 (0.0%) | 15 (23.8%) |
| 45 to 59 Minutes | 10 (6.0%) | 0 (0.0%) |
| 60 to 89 Minutes | 0 (0.0%) | 0 (0.0%) |
| 90 or more Minutes | 0 (0.0%) | 22 (34.9%) |
Time of Departure to Work by Sex in Hot Springs
The most frequent times of departure to work in Hot Springs are 7:30 AM to 7:59 AM (74, 44.6%) for males and 6:00 AM to 6:29 AM (22, 34.9%) for females.
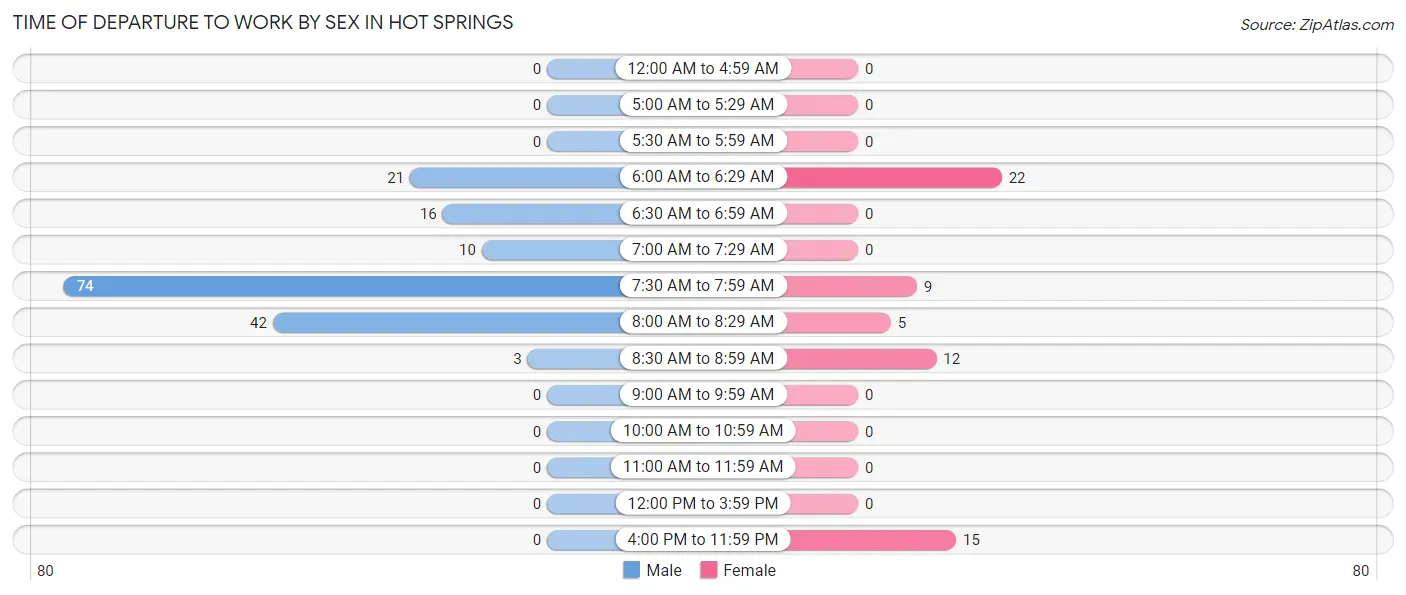
| Time of Departure | Male | Female |
| 12:00 AM to 4:59 AM | 0 (0.0%) | 0 (0.0%) |
| 5:00 AM to 5:29 AM | 0 (0.0%) | 0 (0.0%) |
| 5:30 AM to 5:59 AM | 0 (0.0%) | 0 (0.0%) |
| 6:00 AM to 6:29 AM | 21 (12.7%) | 22 (34.9%) |
| 6:30 AM to 6:59 AM | 16 (9.6%) | 0 (0.0%) |
| 7:00 AM to 7:29 AM | 10 (6.0%) | 0 (0.0%) |
| 7:30 AM to 7:59 AM | 74 (44.6%) | 9 (14.3%) |
| 8:00 AM to 8:29 AM | 42 (25.3%) | 5 (7.9%) |
| 8:30 AM to 8:59 AM | 3 (1.8%) | 12 (19.1%) |
| 9:00 AM to 9:59 AM | 0 (0.0%) | 0 (0.0%) |
| 10:00 AM to 10:59 AM | 0 (0.0%) | 0 (0.0%) |
| 11:00 AM to 11:59 AM | 0 (0.0%) | 0 (0.0%) |
| 12:00 PM to 3:59 PM | 0 (0.0%) | 0 (0.0%) |
| 4:00 PM to 11:59 PM | 0 (0.0%) | 15 (23.8%) |
| Total | 166 (100.0%) | 63 (100.0%) |
Housing Occupancy in Hot Springs
Occupancy by Ownership in Hot Springs
Of the total 203 dwellings in Hot Springs, owner-occupied units account for 136 (67.0%), while renter-occupied units make up 67 (33.0%).
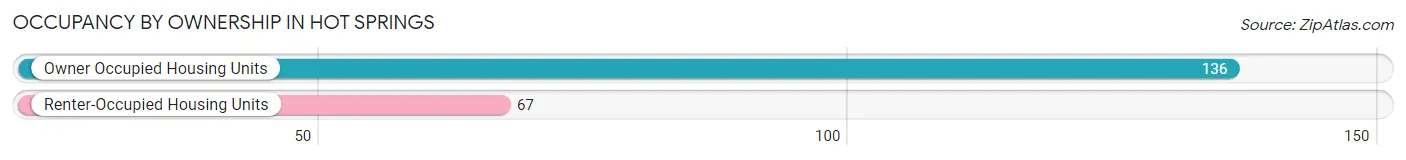
| Occupancy | # Housing Units | % Housing Units |
| Owner Occupied Housing Units | 136 | 67.0% |
| Renter-Occupied Housing Units | 67 | 33.0% |
| Total Occupied Housing Units | 203 | 100.0% |
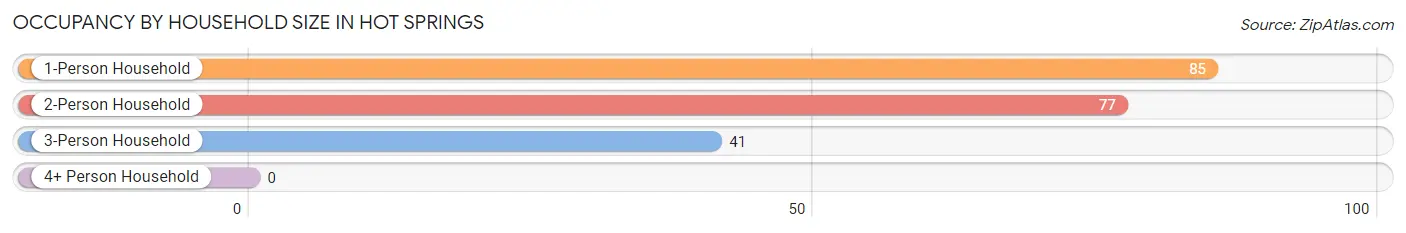
Occupancy by Household Size in Hot Springs
| Household Size | # Housing Units | % Housing Units |
| 1-Person Household | 85 | 41.9% |
| 2-Person Household | 77 | 37.9% |
| 3-Person Household | 41 | 20.2% |
| 4+ Person Household | 0 | 0.0% |
| Total Housing Units | 203 | 100.0% |
Occupancy by Ownership by Household Size in Hot Springs
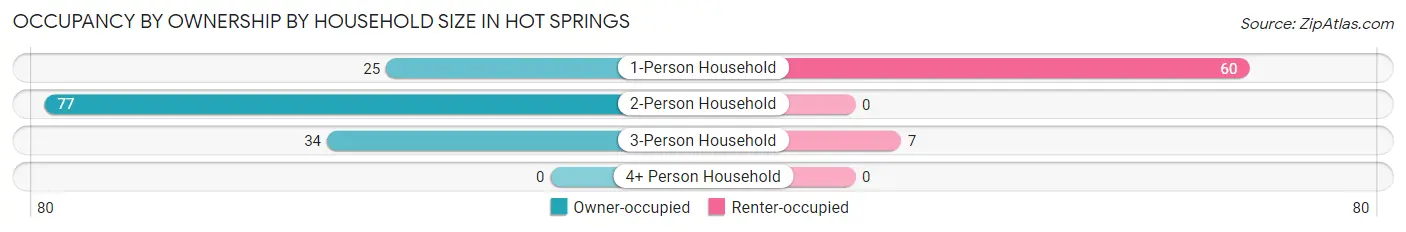
| Household Size | Owner-occupied | Renter-occupied |
| 1-Person Household | 25 (29.4%) | 60 (70.6%) |
| 2-Person Household | 77 (100.0%) | 0 (0.0%) |
| 3-Person Household | 34 (82.9%) | 7 (17.1%) |
| 4+ Person Household | 0 (0.0%) | 0 (0.0%) |
| Total Housing Units | 136 (67.0%) | 67 (33.0%) |
Occupancy by Educational Attainment in Hot Springs
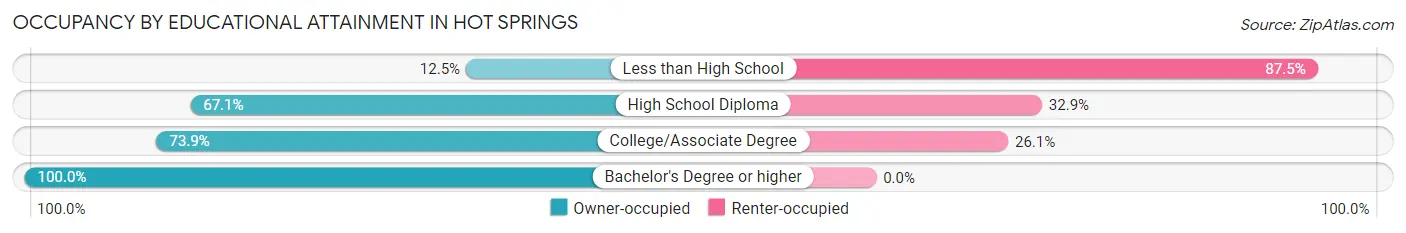
| Household Size | Owner-occupied | Renter-occupied |
| Less than High School | 3 (12.5%) | 21 (87.5%) |
| High School Diploma | 47 (67.1%) | 23 (32.9%) |
| College/Associate Degree | 65 (73.9%) | 23 (26.1%) |
| Bachelor's Degree or higher | 21 (100.0%) | 0 (0.0%) |
Occupancy by Age of Householder in Hot Springs
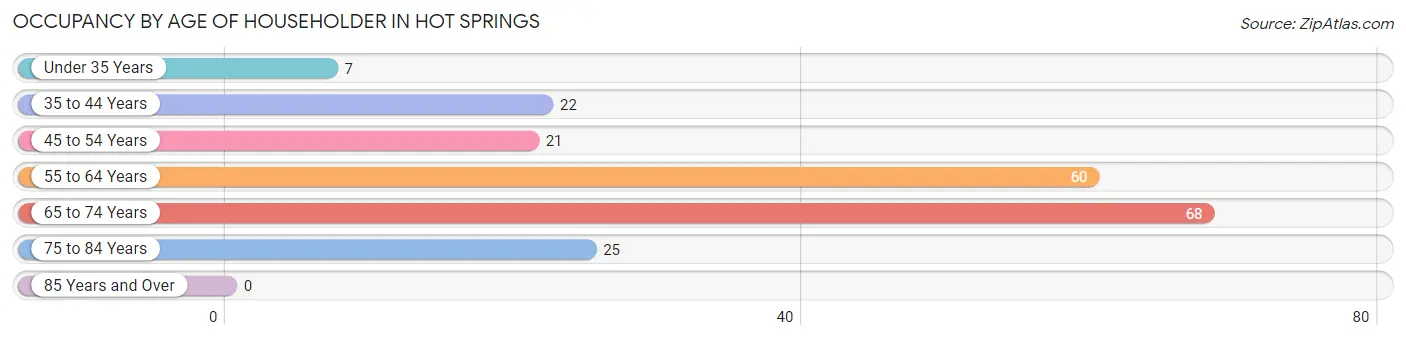
| Age Bracket | # Households | % Households |
| Under 35 Years | 7 | 3.5% |
| 35 to 44 Years | 22 | 10.8% |
| 45 to 54 Years | 21 | 10.3% |
| 55 to 64 Years | 60 | 29.6% |
| 65 to 74 Years | 68 | 33.5% |
| 75 to 84 Years | 25 | 12.3% |
| 85 Years and Over | 0 | 0.0% |
| Total | 203 | 100.0% |
Housing Finances in Hot Springs
Median Income by Occupancy in Hot Springs
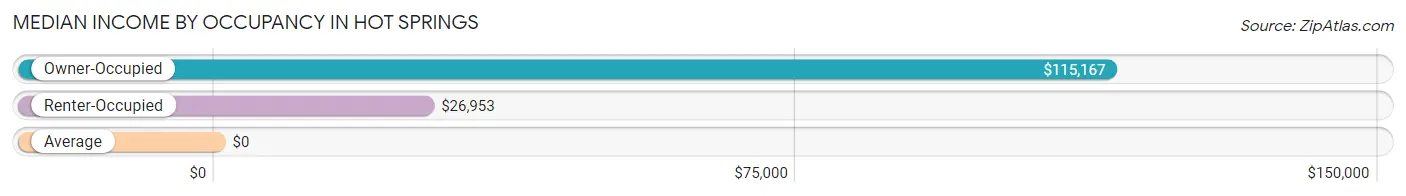
| Occupancy Type | # Households | Median Income |
| Owner-Occupied | 136 (67.0%) | $115,167 |
| Renter-Occupied | 67 (33.0%) | $26,953 |
| Average | 203 (100.0%) | $0 |
Occupancy by Householder Income Bracket in Hot Springs
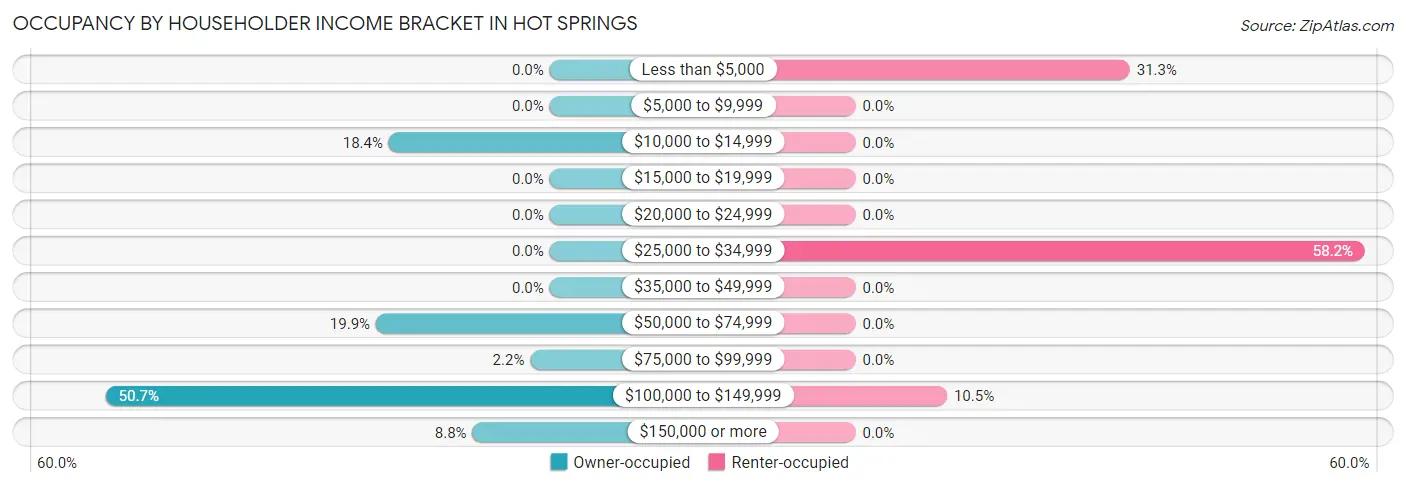
| Income Bracket | Owner-occupied | Renter-occupied |
| Less than $5,000 | 0 (0.0%) | 21 (31.3%) |
| $5,000 to $9,999 | 0 (0.0%) | 0 (0.0%) |
| $10,000 to $14,999 | 25 (18.4%) | 0 (0.0%) |
| $15,000 to $19,999 | 0 (0.0%) | 0 (0.0%) |
| $20,000 to $24,999 | 0 (0.0%) | 0 (0.0%) |
| $25,000 to $34,999 | 0 (0.0%) | 39 (58.2%) |
| $35,000 to $49,999 | 0 (0.0%) | 0 (0.0%) |
| $50,000 to $74,999 | 27 (19.9%) | 0 (0.0%) |
| $75,000 to $99,999 | 3 (2.2%) | 0 (0.0%) |
| $100,000 to $149,999 | 69 (50.7%) | 7 (10.4%) |
| $150,000 or more | 12 (8.8%) | 0 (0.0%) |
| Total | 136 (100.0%) | 67 (100.0%) |
Monthly Housing Cost Tiers in Hot Springs
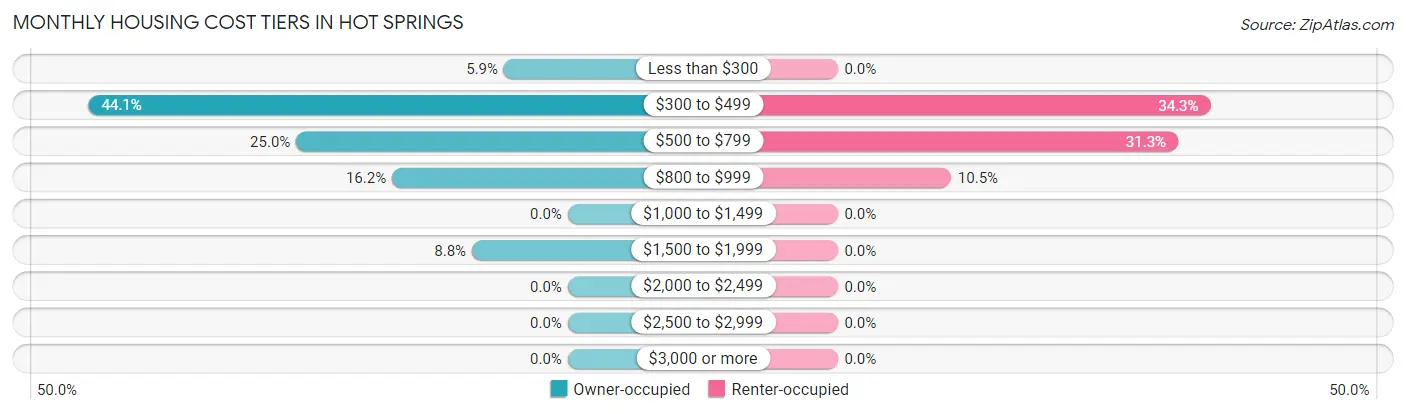
| Monthly Cost | Owner-occupied | Renter-occupied |
| Less than $300 | 8 (5.9%) | 0 (0.0%) |
| $300 to $499 | 60 (44.1%) | 23 (34.3%) |
| $500 to $799 | 34 (25.0%) | 21 (31.3%) |
| $800 to $999 | 22 (16.2%) | 7 (10.4%) |
| $1,000 to $1,499 | 0 (0.0%) | 0 (0.0%) |
| $1,500 to $1,999 | 12 (8.8%) | 0 (0.0%) |
| $2,000 to $2,499 | 0 (0.0%) | 0 (0.0%) |
| $2,500 to $2,999 | 0 (0.0%) | 0 (0.0%) |
| $3,000 or more | 0 (0.0%) | 0 (0.0%) |
| Total | 136 (100.0%) | 67 (100.0%) |
Physical Housing Characteristics in Hot Springs
Housing Structures in Hot Springs
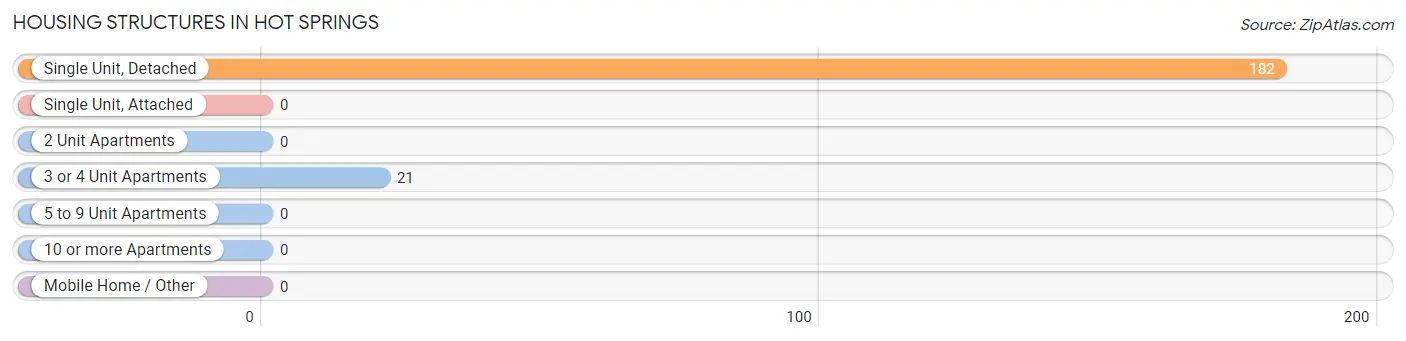
| Structure Type | # Housing Units | % Housing Units |
| Single Unit, Detached | 182 | 89.7% |
| Single Unit, Attached | 0 | 0.0% |
| 2 Unit Apartments | 0 | 0.0% |
| 3 or 4 Unit Apartments | 21 | 10.3% |
| 5 to 9 Unit Apartments | 0 | 0.0% |
| 10 or more Apartments | 0 | 0.0% |
| Mobile Home / Other | 0 | 0.0% |
| Total | 203 | 100.0% |
Housing Structures by Occupancy in Hot Springs
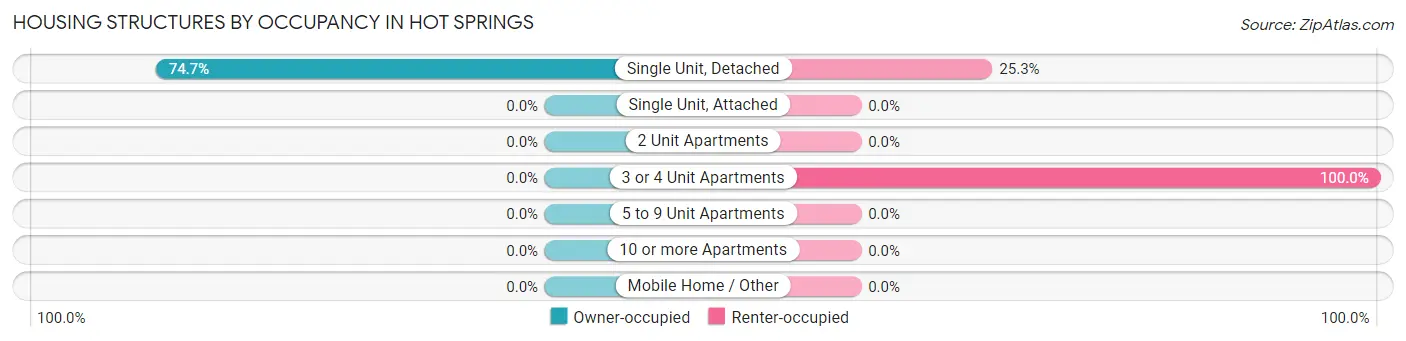
| Structure Type | Owner-occupied | Renter-occupied |
| Single Unit, Detached | 136 (74.7%) | 46 (25.3%) |
| Single Unit, Attached | 0 (0.0%) | 0 (0.0%) |
| 2 Unit Apartments | 0 (0.0%) | 0 (0.0%) |
| 3 or 4 Unit Apartments | 0 (0.0%) | 21 (100.0%) |
| 5 to 9 Unit Apartments | 0 (0.0%) | 0 (0.0%) |
| 10 or more Apartments | 0 (0.0%) | 0 (0.0%) |
| Mobile Home / Other | 0 (0.0%) | 0 (0.0%) |
| Total | 136 (67.0%) | 67 (33.0%) |
Housing Structures by Number of Rooms in Hot Springs
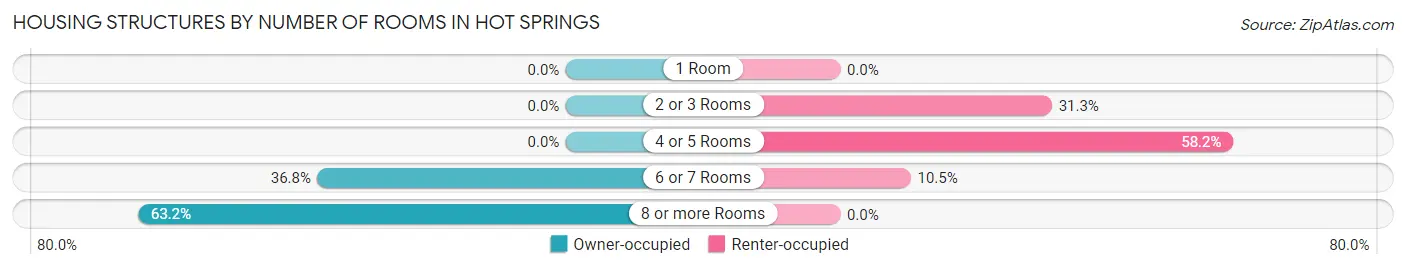
| Number of Rooms | Owner-occupied | Renter-occupied |
| 1 Room | 0 (0.0%) | 0 (0.0%) |
| 2 or 3 Rooms | 0 (0.0%) | 21 (31.3%) |
| 4 or 5 Rooms | 0 (0.0%) | 39 (58.2%) |
| 6 or 7 Rooms | 50 (36.8%) | 7 (10.4%) |
| 8 or more Rooms | 86 (63.2%) | 0 (0.0%) |
| Total | 136 (100.0%) | 67 (100.0%) |
Housing Structure by Heating Type in Hot Springs
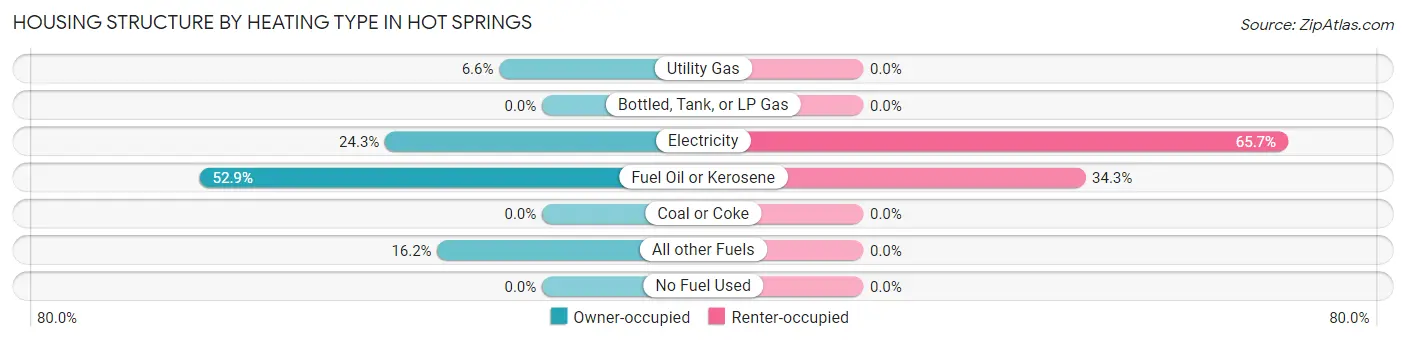
| Heating Type | Owner-occupied | Renter-occupied |
| Utility Gas | 9 (6.6%) | 0 (0.0%) |
| Bottled, Tank, or LP Gas | 0 (0.0%) | 0 (0.0%) |
| Electricity | 33 (24.3%) | 44 (65.7%) |
| Fuel Oil or Kerosene | 72 (52.9%) | 23 (34.3%) |
| Coal or Coke | 0 (0.0%) | 0 (0.0%) |
| All other Fuels | 22 (16.2%) | 0 (0.0%) |
| No Fuel Used | 0 (0.0%) | 0 (0.0%) |
| Total | 136 (100.0%) | 67 (100.0%) |
Household Vehicle Usage in Hot Springs
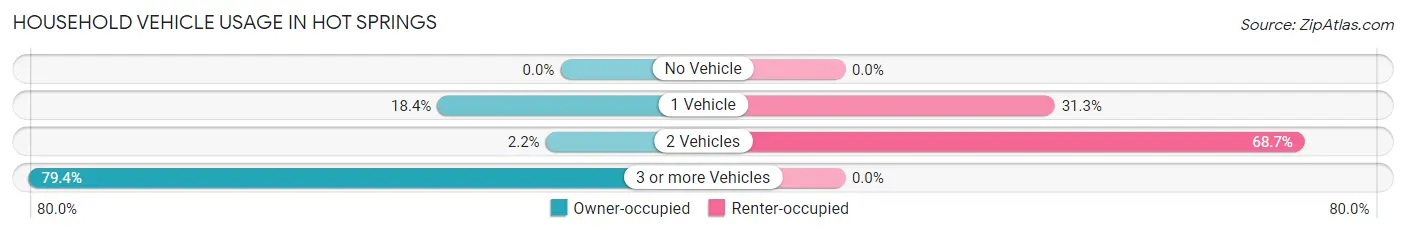
| Vehicles per Household | Owner-occupied | Renter-occupied |
| No Vehicle | 0 (0.0%) | 0 (0.0%) |
| 1 Vehicle | 25 (18.4%) | 21 (31.3%) |
| 2 Vehicles | 3 (2.2%) | 46 (68.7%) |
| 3 or more Vehicles | 108 (79.4%) | 0 (0.0%) |
| Total | 136 (100.0%) | 67 (100.0%) |
Real Estate & Mortgages in Hot Springs
Real Estate and Mortgage Overview in Hot Springs
| Characteristic | Without Mortgage | With Mortgage |
| Housing Units | 102 | 34 |
| Median Property Value | - | - |
| Median Household Income | $115,375 | $12 |
| Monthly Housing Costs | $386 | $0 |
| Real Estate Taxes | $760 | $0 |
Property Value by Mortgage Status in Hot Springs
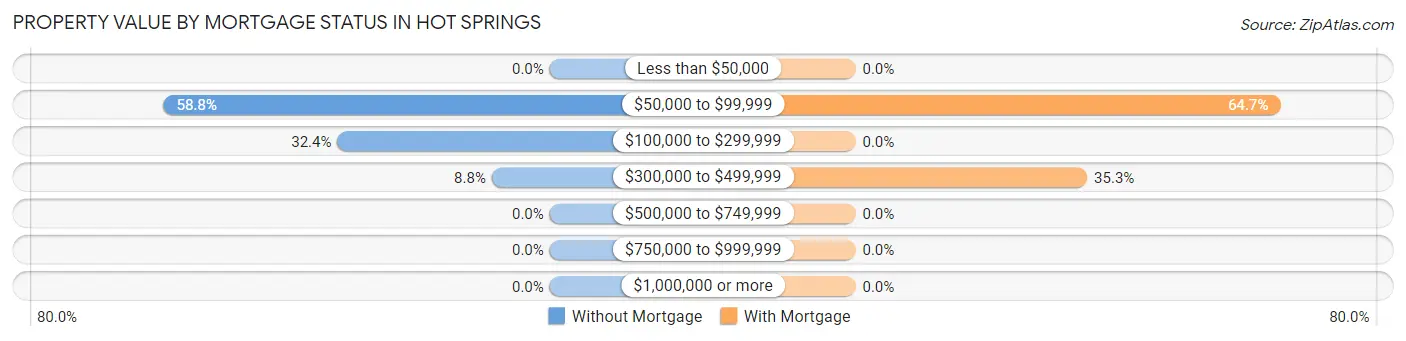
| Property Value | Without Mortgage | With Mortgage |
| Less than $50,000 | 0 (0.0%) | 0 (0.0%) |
| $50,000 to $99,999 | 60 (58.8%) | 22 (64.7%) |
| $100,000 to $299,999 | 33 (32.4%) | 0 (0.0%) |
| $300,000 to $499,999 | 9 (8.8%) | 12 (35.3%) |
| $500,000 to $749,999 | 0 (0.0%) | 0 (0.0%) |
| $750,000 to $999,999 | 0 (0.0%) | 0 (0.0%) |
| $1,000,000 or more | 0 (0.0%) | 0 (0.0%) |
| Total | 102 (100.0%) | 34 (100.0%) |
Household Income by Mortgage Status in Hot Springs
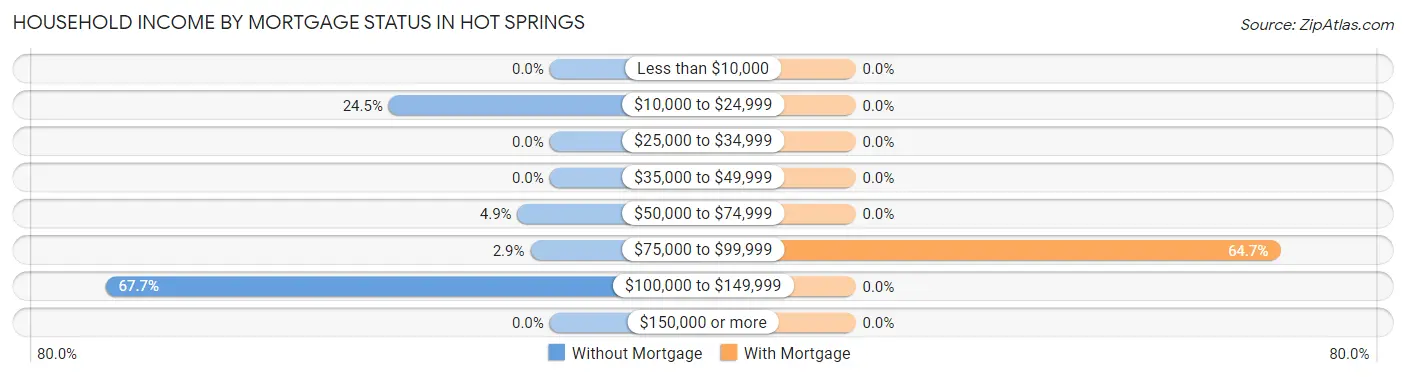
| Household Income | Without Mortgage | With Mortgage |
| Less than $10,000 | 0 (0.0%) | 0 (0.0%) |
| $10,000 to $24,999 | 25 (24.5%) | 0 (0.0%) |
| $25,000 to $34,999 | 0 (0.0%) | 0 (0.0%) |
| $35,000 to $49,999 | 0 (0.0%) | 0 (0.0%) |
| $50,000 to $74,999 | 5 (4.9%) | 0 (0.0%) |
| $75,000 to $99,999 | 3 (2.9%) | 22 (64.7%) |
| $100,000 to $149,999 | 69 (67.6%) | 0 (0.0%) |
| $150,000 or more | 0 (0.0%) | 0 (0.0%) |
| Total | 102 (100.0%) | 34 (100.0%) |
Property Value to Household Income Ratio in Hot Springs
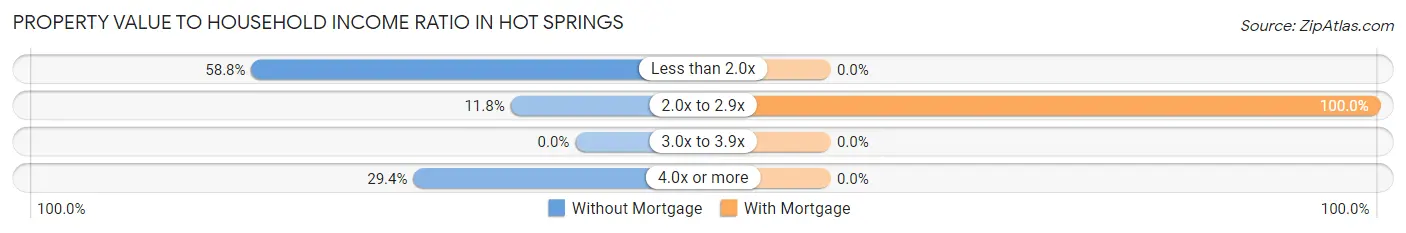
| Value-to-Income Ratio | Without Mortgage | With Mortgage |
| Less than 2.0x | 60 (58.8%) | 0 (0.0%) |
| 2.0x to 2.9x | 12 (11.8%) | 34 (100.0%) |
| 3.0x to 3.9x | 0 (0.0%) | 0 (0.0%) |
| 4.0x or more | 30 (29.4%) | 0 (0.0%) |
| Total | 102 (100.0%) | 34 (100.0%) |
Real Estate Taxes by Mortgage Status in Hot Springs
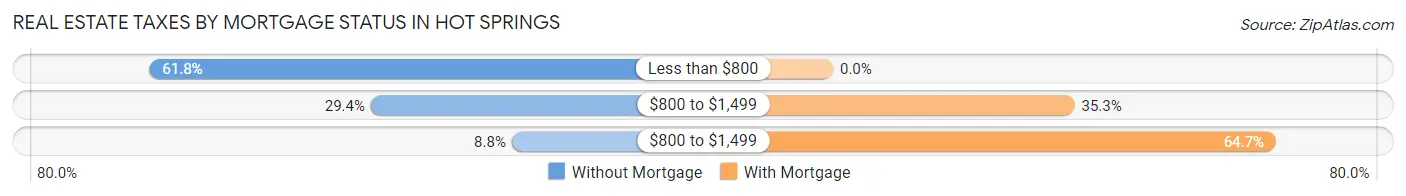
| Property Taxes | Without Mortgage | With Mortgage |
| Less than $800 | 63 (61.8%) | 0 (0.0%) |
| $800 to $1,499 | 30 (29.4%) | 12 (35.3%) |
| $800 to $1,499 | 9 (8.8%) | 22 (64.7%) |
| Total | 102 (100.0%) | 34 (100.0%) |
Health & Disability in Hot Springs
Health Insurance Coverage by Age in Hot Springs
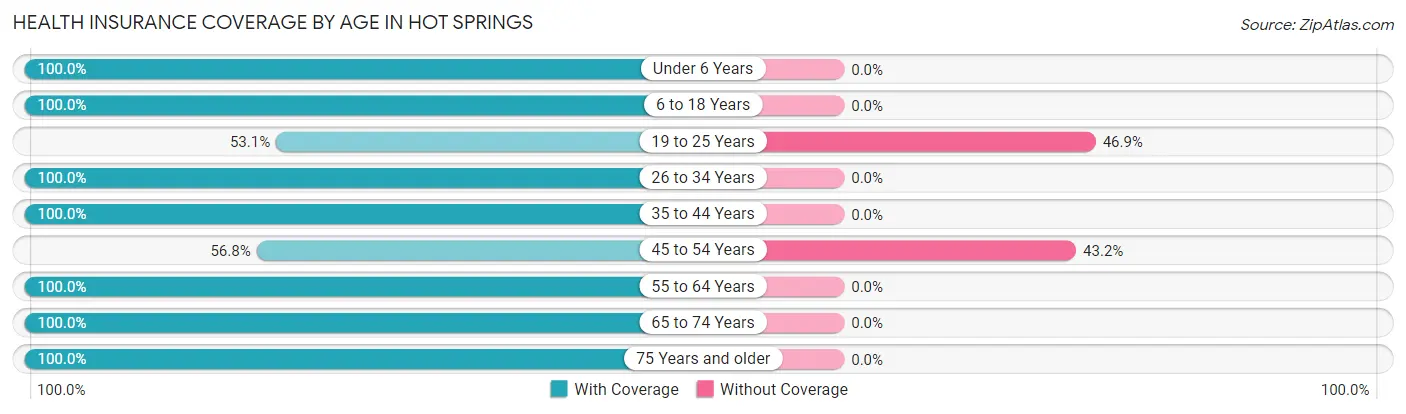
| Age Bracket | With Coverage | Without Coverage |
| Under 6 Years | 9 (100.0%) | 0 (0.0%) |
| 6 to 18 Years | 26 (100.0%) | 0 (0.0%) |
| 19 to 25 Years | 17 (53.1%) | 15 (46.9%) |
| 26 to 34 Years | 7 (100.0%) | 0 (0.0%) |
| 35 to 44 Years | 51 (100.0%) | 0 (0.0%) |
| 45 to 54 Years | 21 (56.8%) | 16 (43.2%) |
| 55 to 64 Years | 113 (100.0%) | 0 (0.0%) |
| 65 to 74 Years | 75 (100.0%) | 0 (0.0%) |
| 75 Years and older | 84 (100.0%) | 0 (0.0%) |
| Total | 403 (92.9%) | 31 (7.1%) |
Health Insurance Coverage by Citizenship Status in Hot Springs
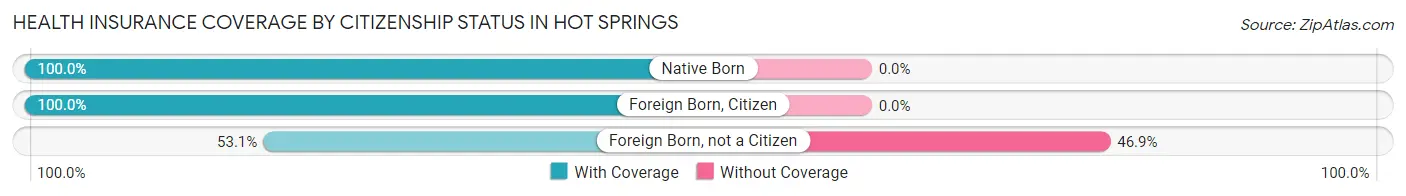
| Citizenship Status | With Coverage | Without Coverage |
| Native Born | 9 (100.0%) | 0 (0.0%) |
| Foreign Born, Citizen | 26 (100.0%) | 0 (0.0%) |
| Foreign Born, not a Citizen | 17 (53.1%) | 15 (46.9%) |
Health Insurance Coverage by Household Income in Hot Springs
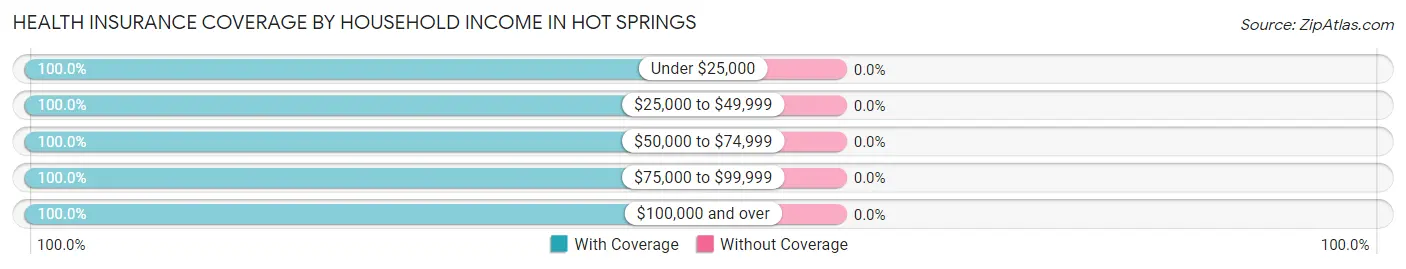
| Household Income | With Coverage | Without Coverage |
| Under $25,000 | 46 (100.0%) | 0 (0.0%) |
| $25,000 to $49,999 | 39 (100.0%) | 0 (0.0%) |
| $50,000 to $74,999 | 62 (100.0%) | 0 (0.0%) |
| $75,000 to $99,999 | 6 (100.0%) | 0 (0.0%) |
| $100,000 and over | 192 (100.0%) | 0 (0.0%) |
Public vs Private Health Insurance Coverage by Age in Hot Springs
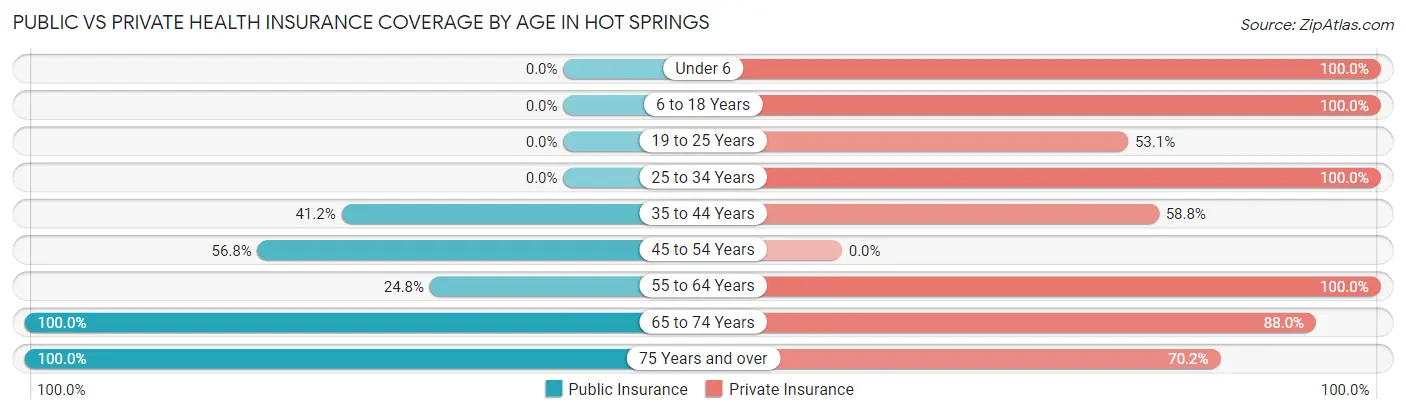
| Age Bracket | Public Insurance | Private Insurance |
| Under 6 | 0 (0.0%) | 9 (100.0%) |
| 6 to 18 Years | 0 (0.0%) | 26 (100.0%) |
| 19 to 25 Years | 0 (0.0%) | 17 (53.1%) |
| 25 to 34 Years | 0 (0.0%) | 7 (100.0%) |
| 35 to 44 Years | 21 (41.2%) | 30 (58.8%) |
| 45 to 54 Years | 21 (56.8%) | 0 (0.0%) |
| 55 to 64 Years | 28 (24.8%) | 113 (100.0%) |
| 65 to 74 Years | 75 (100.0%) | 66 (88.0%) |
| 75 Years and over | 84 (100.0%) | 59 (70.2%) |
| Total | 229 (52.8%) | 327 (75.3%) |
Disability Status by Sex by Age in Hot Springs
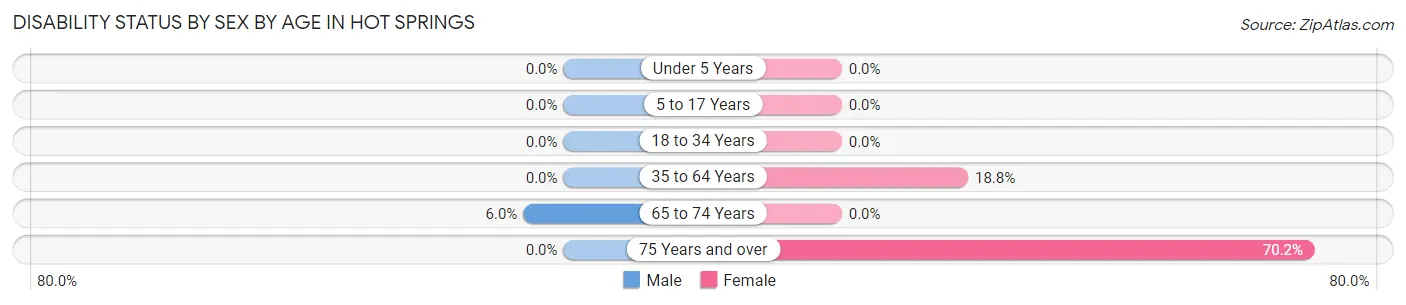
| Age Bracket | Male | Female |
| Under 5 Years | 0 (0.0%) | 0 (0.0%) |
| 5 to 17 Years | 0 (0.0%) | 0 (0.0%) |
| 18 to 34 Years | 0 (0.0%) | 0 (0.0%) |
| 35 to 64 Years | 0 (0.0%) | 12 (18.8%) |
| 65 to 74 Years | 4 (6.0%) | 0 (0.0%) |
| 75 Years and over | 0 (0.0%) | 59 (70.2%) |
Disability Class by Sex by Age in Hot Springs
Disability Class: Hearing Difficulty
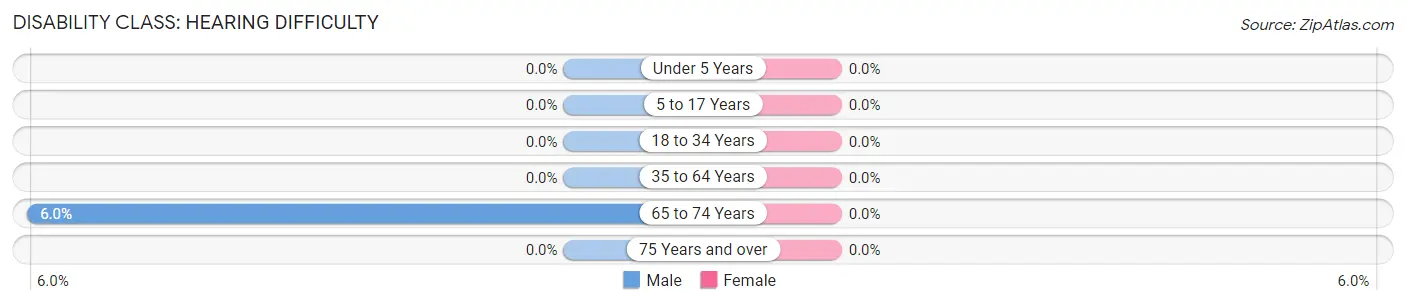
| Age Bracket | Male | Female |
| Under 5 Years | 0 (0.0%) | 0 (0.0%) |
| 5 to 17 Years | 0 (0.0%) | 0 (0.0%) |
| 18 to 34 Years | 0 (0.0%) | 0 (0.0%) |
| 35 to 64 Years | 0 (0.0%) | 0 (0.0%) |
| 65 to 74 Years | 4 (6.0%) | 0 (0.0%) |
| 75 Years and over | 0 (0.0%) | 0 (0.0%) |
Disability Class: Vision Difficulty
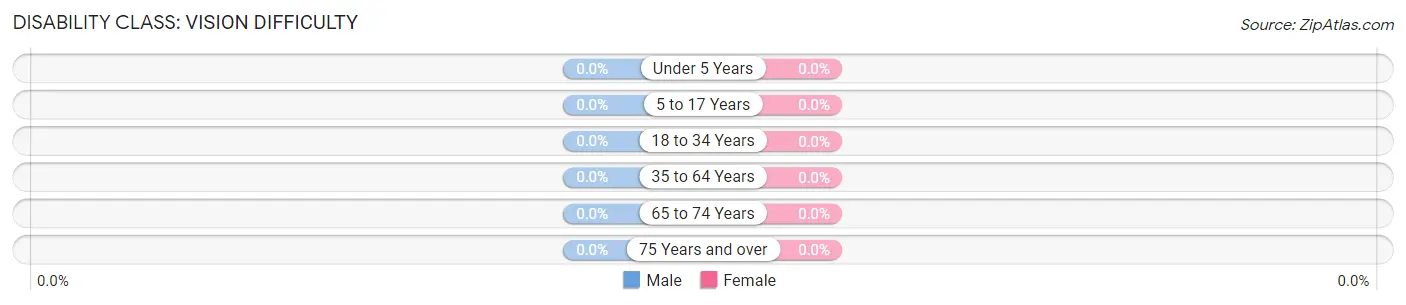
| Age Bracket | Male | Female |
| Under 5 Years | 0 (0.0%) | 0 (0.0%) |
| 5 to 17 Years | 0 (0.0%) | 0 (0.0%) |
| 18 to 34 Years | 0 (0.0%) | 0 (0.0%) |
| 35 to 64 Years | 0 (0.0%) | 0 (0.0%) |
| 65 to 74 Years | 0 (0.0%) | 0 (0.0%) |
| 75 Years and over | 0 (0.0%) | 0 (0.0%) |
Disability Class: Cognitive Difficulty
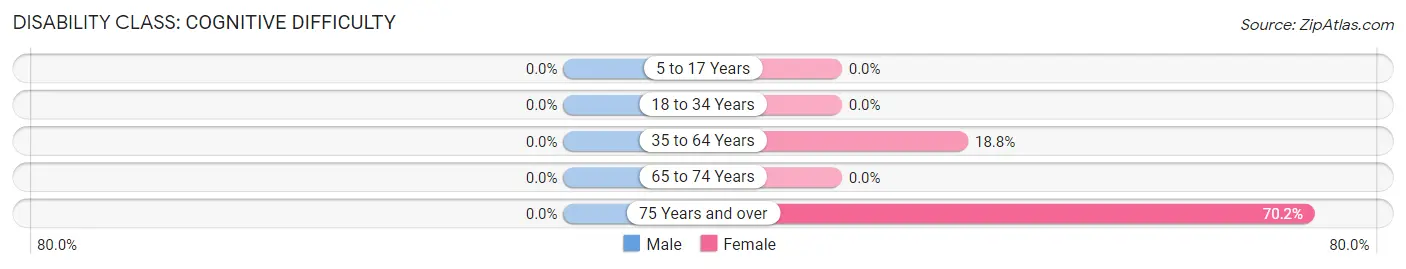
| Age Bracket | Male | Female |
| 5 to 17 Years | 0 (0.0%) | 0 (0.0%) |
| 18 to 34 Years | 0 (0.0%) | 0 (0.0%) |
| 35 to 64 Years | 0 (0.0%) | 12 (18.8%) |
| 65 to 74 Years | 0 (0.0%) | 0 (0.0%) |
| 75 Years and over | 0 (0.0%) | 59 (70.2%) |
Disability Class: Ambulatory Difficulty
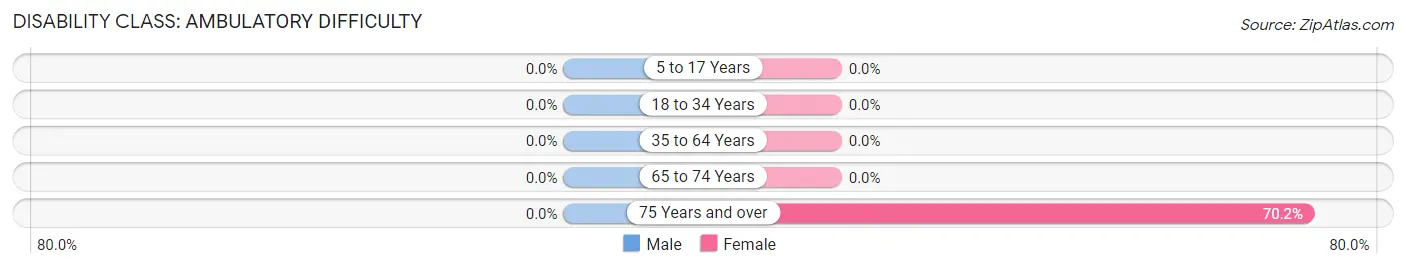
| Age Bracket | Male | Female |
| 5 to 17 Years | 0 (0.0%) | 0 (0.0%) |
| 18 to 34 Years | 0 (0.0%) | 0 (0.0%) |
| 35 to 64 Years | 0 (0.0%) | 0 (0.0%) |
| 65 to 74 Years | 0 (0.0%) | 0 (0.0%) |
| 75 Years and over | 0 (0.0%) | 59 (70.2%) |
Disability Class: Self-Care Difficulty
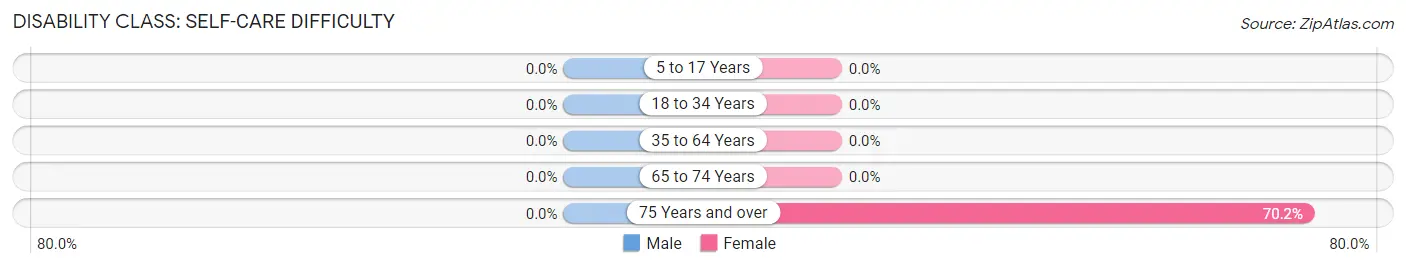
| Age Bracket | Male | Female |
| 5 to 17 Years | 0 (0.0%) | 0 (0.0%) |
| 18 to 34 Years | 0 (0.0%) | 0 (0.0%) |
| 35 to 64 Years | 0 (0.0%) | 0 (0.0%) |
| 65 to 74 Years | 0 (0.0%) | 0 (0.0%) |
| 75 Years and over | 0 (0.0%) | 59 (70.2%) |
Technology Access in Hot Springs
Computing Device Access in Hot Springs
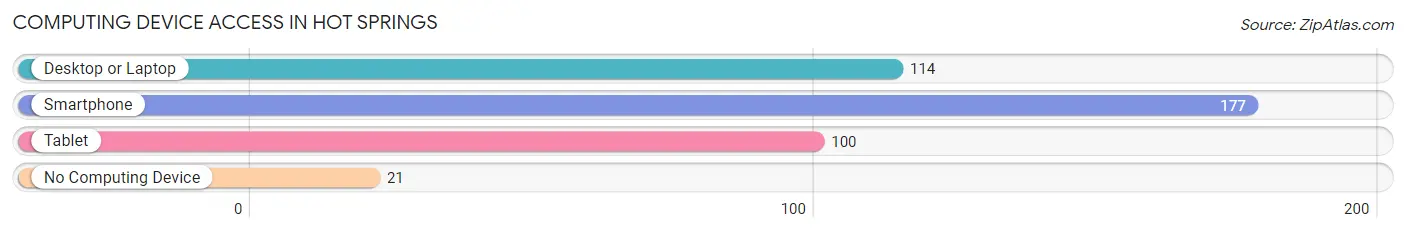
| Device Type | # Households | % Households |
| Desktop or Laptop | 114 | 56.2% |
| Smartphone | 177 | 87.2% |
| Tablet | 100 | 49.3% |
| No Computing Device | 21 | 10.3% |
| Total | 203 | 100.0% |
Internet Access in Hot Springs
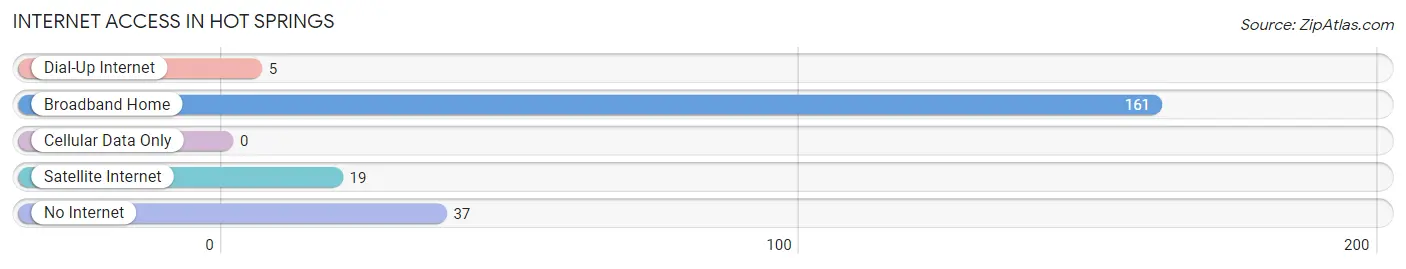
| Internet Type | # Households | % Households |
| Dial-Up Internet | 5 | 2.5% |
| Broadband Home | 161 | 79.3% |
| Cellular Data Only | 0 | 0.0% |
| Satellite Internet | 19 | 9.4% |
| No Internet | 37 | 18.2% |
| Total | 203 | 100.0% |
Hot Springs Summary
Hot Springs, Virginia is a small town located in Bath County, Virginia. It is situated in the Allegheny Mountains, and is the county seat of Bath County. The town is known for its natural hot springs, which have been used for centuries by Native Americans and early settlers for healing and relaxation. Hot Springs is also home to the Homestead Resort, a historic resort that has been in operation since 1766.
History
The area that is now Hot Springs was originally inhabited by the Monacan Indians, who used the hot springs for healing and relaxation. The first European settlers arrived in the area in the late 1700s, and the town of Hot Springs was officially established in 1802. The town was named for the hot springs that were located nearby.
In the early 1800s, the town became a popular destination for travelers seeking to take advantage of the healing properties of the hot springs. The Homestead Resort was established in 1766, and it quickly became a popular destination for wealthy travelers. The resort was destroyed by fire in 1892, but it was rebuilt and is still in operation today.
In the late 1800s, the town became a popular destination for wealthy tourists seeking to take advantage of the healing properties of the hot springs. The town was also home to several mineral springs, which were believed to have healing properties.
Geography
Hot Springs is located in the Allegheny Mountains of Virginia. The town is situated in a valley, surrounded by mountains on all sides. The town is located at an elevation of 1,890 feet, and the surrounding mountains reach heights of up to 4,000 feet. The town is located near the headwaters of the Jackson River, which flows through the town and eventually empties into the James River.
The climate in Hot Springs is temperate, with hot summers and cold winters. The average annual temperature is around 54 degrees Fahrenheit, and the average annual precipitation is around 40 inches.
Economy
The economy of Hot Springs is largely based on tourism. The town is home to the Homestead Resort, which is a popular destination for tourists seeking to take advantage of the healing properties of the hot springs. The town is also home to several other resorts and hotels, as well as restaurants and shops.
The town is also home to several small businesses, including a brewery, a winery, and a distillery. The town is also home to several farms, which produce a variety of crops, including apples, peaches, and hay.
Demographics
As of the 2010 census, the population of Hot Springs was 645. The population is largely white, with a small percentage of African Americans and Native Americans. The median household income is around $35,000, and the median home value is around $150,000. The town is home to several churches, including the Hot Springs United Methodist Church, the Hot Springs Baptist Church, and the Hot Springs Presbyterian Church.
Common Questions
What is Per Capita Income in Hot Springs?
Per Capita income in Hot Springs is $34,245.
What is the Median Family Income in Hot Springs?
Median Family Income in Hot Springs is $115,833.
What is Inequality or Gini Index in Hot Springs?
Inequality or Gini Index in Hot Springs is 0.42.
What is the Total Population of Hot Springs?
Total Population of Hot Springs is 455.
What is the Total Male Population of Hot Springs?
Total Male Population of Hot Springs is 247.
What is the Total Female Population of Hot Springs?
Total Female Population of Hot Springs is 208.
What is the Ratio of Males per 100 Females in Hot Springs?
There are 118.75 Males per 100 Females in Hot Springs.
What is the Ratio of Females per 100 Males in Hot Springs?
There are 84.21 Females per 100 Males in Hot Springs.
What is the Median Population Age in Hot Springs?
Median Population Age in Hot Springs is 58.5 Years.
What is the Average Family Size in Hot Springs
Average Family Size in Hot Springs is 2.0 People.
What is the Average Household Size in Hot Springs
Average Household Size in Hot Springs is 1.7 People.
How Large is the Labor Force in Hot Springs?
There are 255 People in the Labor Forcein in Hot Springs.
What is the Percentage of People in the Labor Force in Hot Springs?
57.2% of People are in the Labor Force in Hot Springs.
What is the Unemployment Rate in Hot Springs?
Unemployment Rate in Hot Springs is 1.2%.