Daleville, VA Map & Demographics
Daleville Map
Daleville Overview
$47,558
PER CAPITA INCOME
$120,714
AVG FAMILY INCOME
$100,363
AVG HOUSEHOLD INCOME
39.6%
WAGE / INCOME GAP [ % ]
60.4¢/ $1
WAGE / INCOME GAP [ $ ]
0.38
INEQUALITY / GINI INDEX
3,169
TOTAL POPULATION
1,614
MALE POPULATION
1,555
FEMALE POPULATION
103.79
MALES / 100 FEMALES
96.34
FEMALES / 100 MALES
51.7
MEDIAN AGE
3.2
AVG FAMILY SIZE
2.5
AVG HOUSEHOLD SIZE
1,369
LABOR FORCE [ PEOPLE ]
49.6%
PERCENT IN LABOR FORCE
8.5%
UNEMPLOYMENT RATE
Daleville Zip Codes
Daleville Area Codes
Income in Daleville
Income Overview in Daleville
Per Capita Income in Daleville is $47,558, while median incomes of families and households are $120,714 and $100,363 respectively.
| Characteristic | Number | Measure |
| Per Capita Income | 3,169 | $47,558 |
| Median Family Income | 810 | $120,714 |
| Mean Family Income | 810 | $144,534 |
| Median Household Income | 1,192 | $100,363 |
| Mean Household Income | 1,192 | $122,082 |
| Income Deficit | 810 | $0 |
| Wage / Income Gap (%) | 3,169 | 39.60% |
| Wage / Income Gap ($) | 3,169 | 60.40¢ per $1 |
| Gini / Inequality Index | 3,169 | 0.38 |
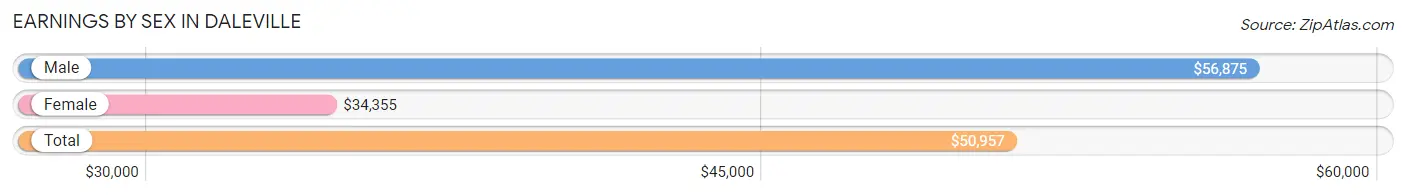
Earnings by Sex in Daleville
Average Earnings in Daleville are $50,957, $56,875 for men and $34,355 for women, a difference of 39.6%.
| Sex | Number | Average Earnings |
| Male | 828 (55.0%) | $56,875 |
| Female | 676 (45.0%) | $34,355 |
| Total | 1,504 (100.0%) | $50,957 |
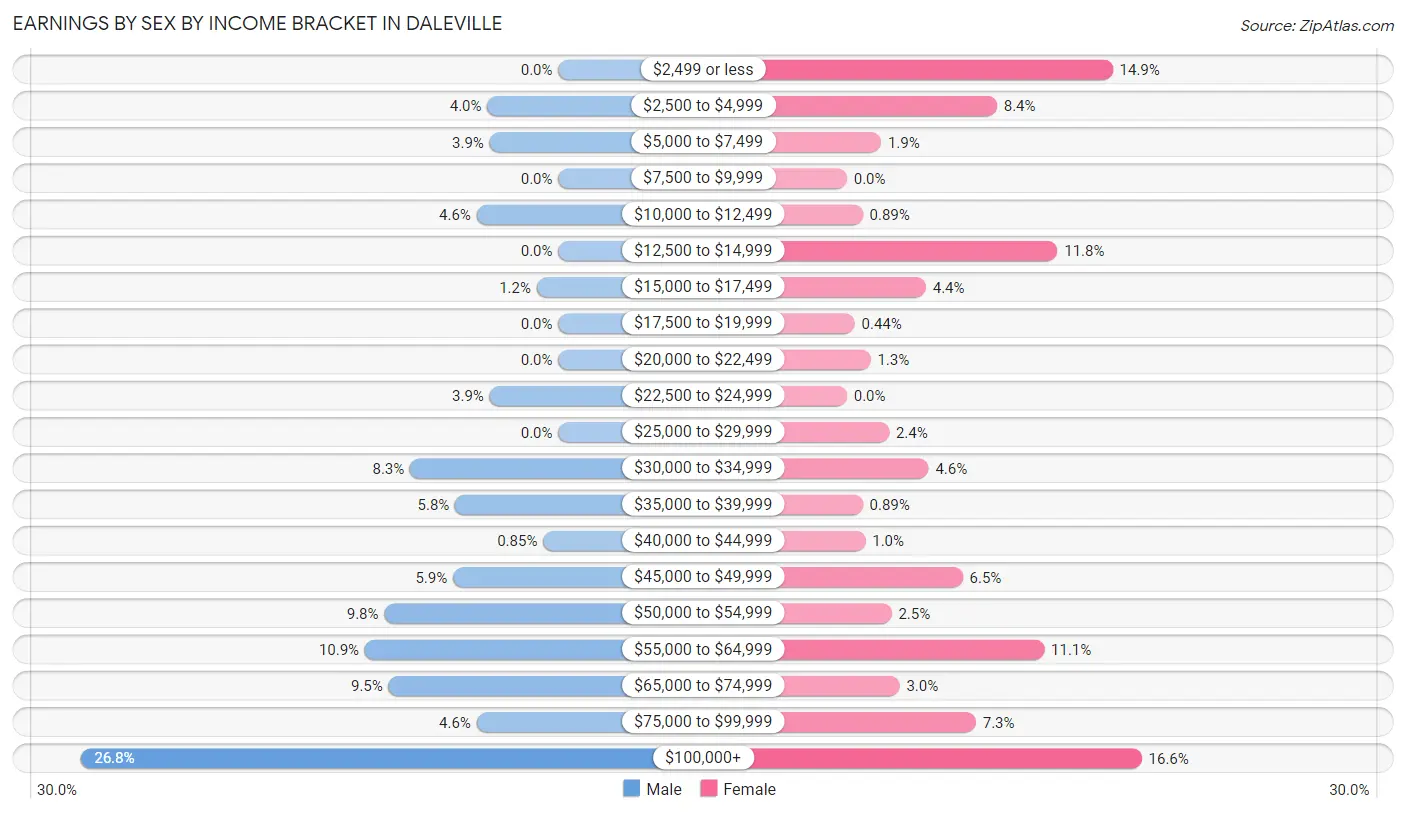
Earnings by Sex by Income Bracket in Daleville
The most common earnings brackets in Daleville are $100,000+ for men (222 | 26.8%) and $100,000+ for women (112 | 16.6%).
| Income | Male | Female |
| $2,499 or less | 0 (0.0%) | 101 (14.9%) |
| $2,500 to $4,999 | 33 (4.0%) | 57 (8.4%) |
| $5,000 to $7,499 | 32 (3.9%) | 13 (1.9%) |
| $7,500 to $9,999 | 0 (0.0%) | 0 (0.0%) |
| $10,000 to $12,499 | 38 (4.6%) | 6 (0.9%) |
| $12,500 to $14,999 | 0 (0.0%) | 80 (11.8%) |
| $15,000 to $17,499 | 10 (1.2%) | 30 (4.4%) |
| $17,500 to $19,999 | 0 (0.0%) | 3 (0.4%) |
| $20,000 to $22,499 | 0 (0.0%) | 9 (1.3%) |
| $22,500 to $24,999 | 32 (3.9%) | 0 (0.0%) |
| $25,000 to $29,999 | 0 (0.0%) | 16 (2.4%) |
| $30,000 to $34,999 | 69 (8.3%) | 31 (4.6%) |
| $35,000 to $39,999 | 48 (5.8%) | 6 (0.9%) |
| $40,000 to $44,999 | 7 (0.9%) | 7 (1.0%) |
| $45,000 to $49,999 | 49 (5.9%) | 44 (6.5%) |
| $50,000 to $54,999 | 81 (9.8%) | 17 (2.5%) |
| $55,000 to $64,999 | 90 (10.9%) | 75 (11.1%) |
| $65,000 to $74,999 | 79 (9.5%) | 20 (3.0%) |
| $75,000 to $99,999 | 38 (4.6%) | 49 (7.2%) |
| $100,000+ | 222 (26.8%) | 112 (16.6%) |
| Total | 828 (100.0%) | 676 (100.0%) |
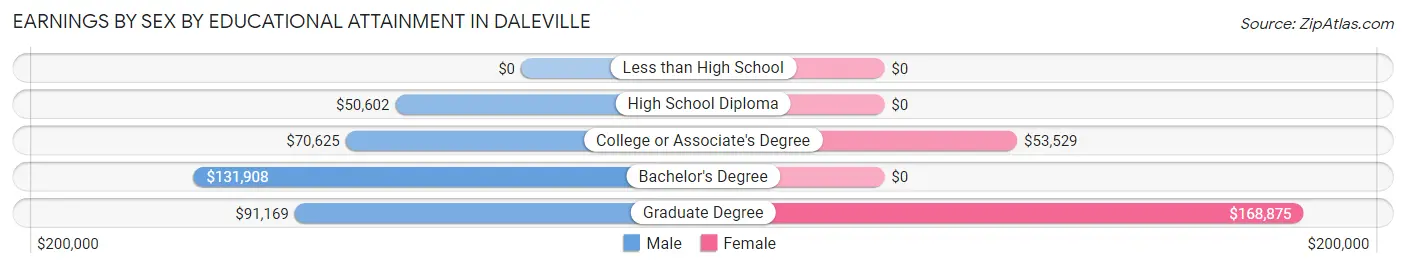
Earnings by Sex by Educational Attainment in Daleville
Average earnings in Daleville are $59,055 for men and $46,307 for women, a difference of 21.6%. Men with an educational attainment of bachelor's degree enjoy the highest average annual earnings of $131,908, while those with high school diploma education earn the least with $50,602. Women with an educational attainment of graduate degree earn the most with the average annual earnings of $168,875, while those with college or associate's degree education have the smallest earnings of $53,529.
| Educational Attainment | Male Income | Female Income |
| Less than High School | - | - |
| High School Diploma | $50,602 | $0 |
| College or Associate's Degree | $70,625 | $53,529 |
| Bachelor's Degree | $131,908 | $0 |
| Graduate Degree | $91,169 | $168,875 |
| Total | $59,055 | $46,307 |
Family Income in Daleville
Family Income Brackets in Daleville
According to the Daleville family income data, there are 227 families falling into the $100,000 to $149,999 income range, which is the most common income bracket and makes up 28.0% of all families.
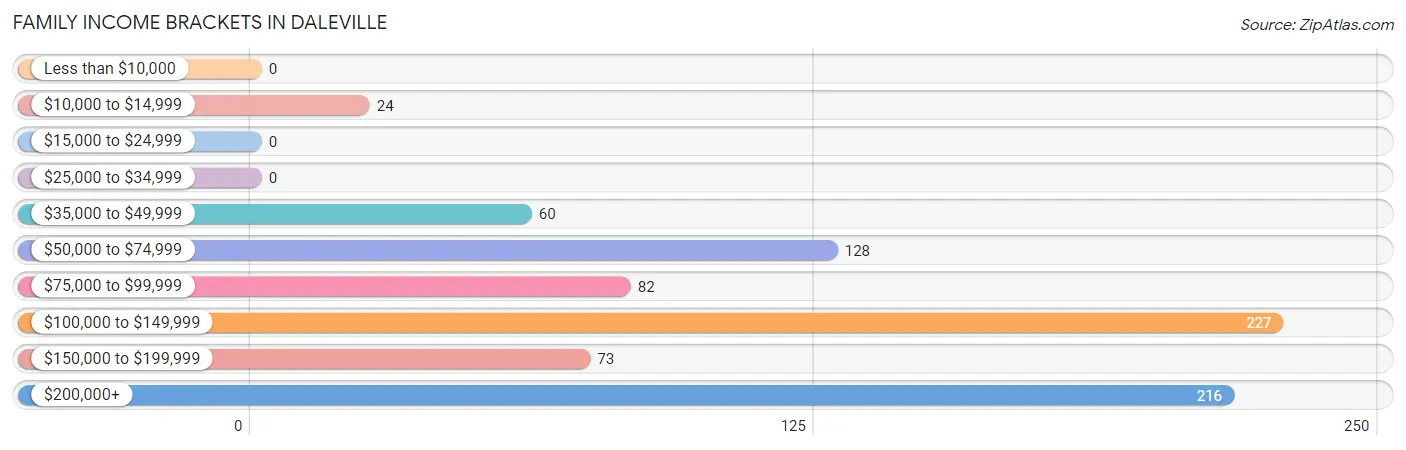
| Income Bracket | # Families | % Families |
| Less than $10,000 | 0 | 0.0% |
| $10,000 to $14,999 | 24 | 3.0% |
| $15,000 to $24,999 | 0 | 0.0% |
| $25,000 to $34,999 | 0 | 0.0% |
| $35,000 to $49,999 | 60 | 7.4% |
| $50,000 to $74,999 | 128 | 15.8% |
| $75,000 to $99,999 | 82 | 10.1% |
| $100,000 to $149,999 | 227 | 28.0% |
| $150,000 to $199,999 | 73 | 9.0% |
| $200,000+ | 216 | 26.7% |
Family Income by Famaliy Size in Daleville
4-person families (110 | 13.6%) account for the highest median family income in Daleville with $207,016 per family, while 4-person families (110 | 13.6%) have the highest median income of $51,754 per family member.
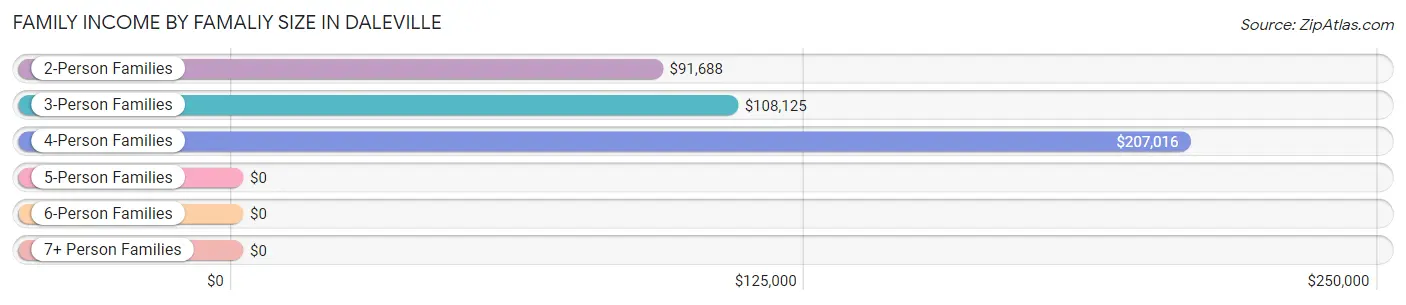
| Income Bracket | # Families | Median Income |
| 2-Person Families | 509 (62.8%) | $91,688 |
| 3-Person Families | 72 (8.9%) | $108,125 |
| 4-Person Families | 110 (13.6%) | $207,016 |
| 5-Person Families | 46 (5.7%) | $0 |
| 6-Person Families | 46 (5.7%) | $0 |
| 7+ Person Families | 27 (3.3%) | $0 |
| Total | 810 (100.0%) | $120,714 |
Family Income by Number of Earners in Daleville
The median family income in Daleville is $120,714, with families comprising 3+ earners (76) having the highest median family income of $206,250, while families with no earners (233) have the lowest median family income of $69,955, accounting for 9.4% and 28.8% of families, respectively.
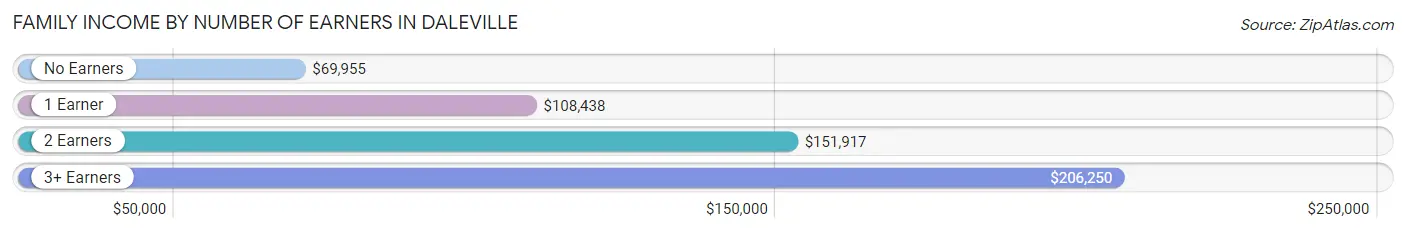
| Number of Earners | # Families | Median Income |
| No Earners | 233 (28.8%) | $69,955 |
| 1 Earner | 162 (20.0%) | $108,438 |
| 2 Earners | 339 (41.8%) | $151,917 |
| 3+ Earners | 76 (9.4%) | $206,250 |
| Total | 810 (100.0%) | $120,714 |
Household Income in Daleville
Household Income Brackets in Daleville
With 273 households falling in the category, the $100,000 to $149,999 income range is the most frequent in Daleville, accounting for 22.9% of all households. In contrast, only 8 households (0.7%) fall into the less than $10,000 income bracket, making it the least populous group.
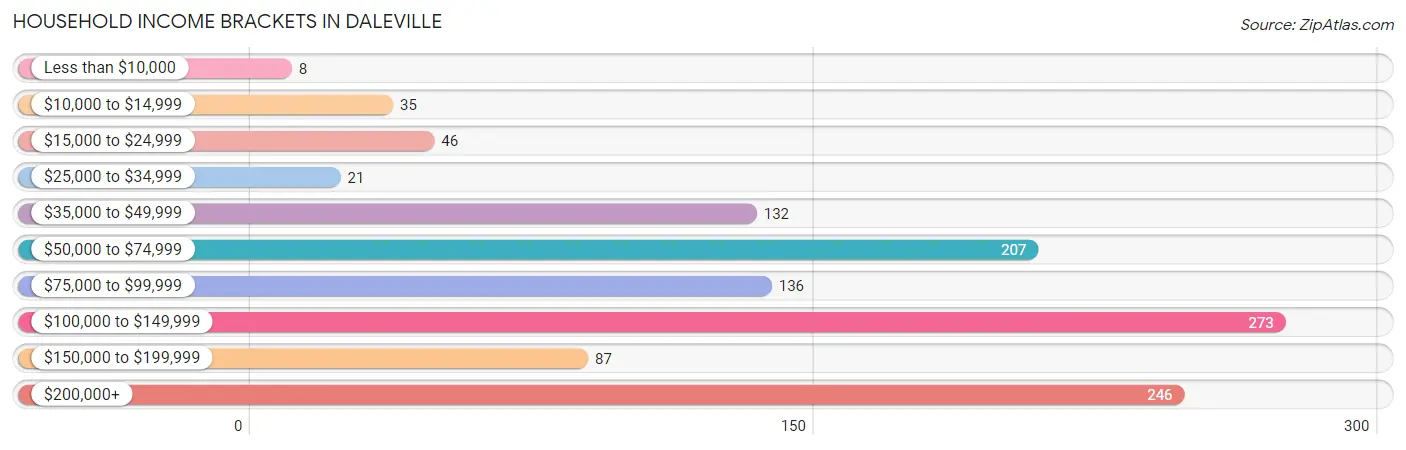
| Income Bracket | # Households | % Households |
| Less than $10,000 | 8 | 0.7% |
| $10,000 to $14,999 | 35 | 2.9% |
| $15,000 to $24,999 | 46 | 3.9% |
| $25,000 to $34,999 | 21 | 1.8% |
| $35,000 to $49,999 | 132 | 11.1% |
| $50,000 to $74,999 | 207 | 17.4% |
| $75,000 to $99,999 | 136 | 11.4% |
| $100,000 to $149,999 | 273 | 22.9% |
| $150,000 to $199,999 | 87 | 7.3% |
| $200,000+ | 246 | 20.6% |
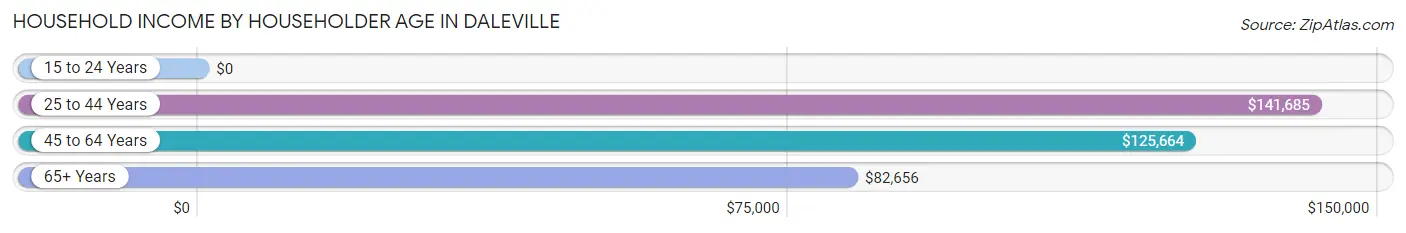
Household Income by Householder Age in Daleville
The median household income in Daleville is $100,363, with the highest median household income of $141,685 found in the 25 to 44 years age bracket for the primary householder. A total of 244 households (20.5%) fall into this category. Meanwhile, the 15 to 24 years age bracket for the primary householder has the lowest median household income of $0, with 16 households (1.3%) in this group.
| Income Bracket | # Households | Median Income |
| 15 to 24 Years | 16 (1.3%) | $0 |
| 25 to 44 Years | 244 (20.5%) | $141,685 |
| 45 to 64 Years | 409 (34.3%) | $125,664 |
| 65+ Years | 523 (43.9%) | $82,656 |
| Total | 1,192 (100.0%) | $100,363 |
Poverty in Daleville
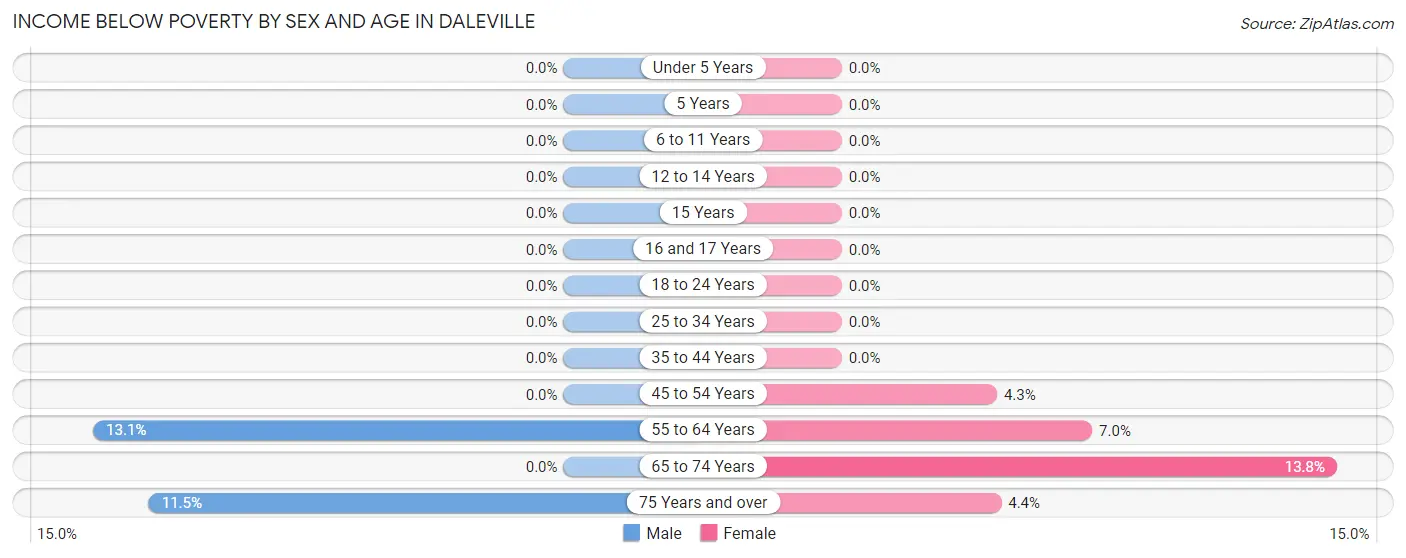
Income Below Poverty by Sex and Age in Daleville
With 3.2% poverty level for males and 4.1% for females among the residents of Daleville, 55 to 64 year old males and 65 to 74 year old females are the most vulnerable to poverty, with 25 males (13.1%) and 27 females (13.8%) in their respective age groups living below the poverty level.
| Age Bracket | Male | Female |
| Under 5 Years | 0 (0.0%) | 0 (0.0%) |
| 5 Years | 0 (0.0%) | 0 (0.0%) |
| 6 to 11 Years | 0 (0.0%) | 0 (0.0%) |
| 12 to 14 Years | 0 (0.0%) | 0 (0.0%) |
| 15 Years | 0 (0.0%) | 0 (0.0%) |
| 16 and 17 Years | 0 (0.0%) | 0 (0.0%) |
| 18 to 24 Years | 0 (0.0%) | 0 (0.0%) |
| 25 to 34 Years | 0 (0.0%) | 0 (0.0%) |
| 35 to 44 Years | 0 (0.0%) | 0 (0.0%) |
| 45 to 54 Years | 0 (0.0%) | 8 (4.3%) |
| 55 to 64 Years | 25 (13.1%) | 14 (7.0%) |
| 65 to 74 Years | 0 (0.0%) | 27 (13.8%) |
| 75 Years and over | 24 (11.5%) | 11 (4.4%) |
| Total | 49 (3.2%) | 60 (4.1%) |
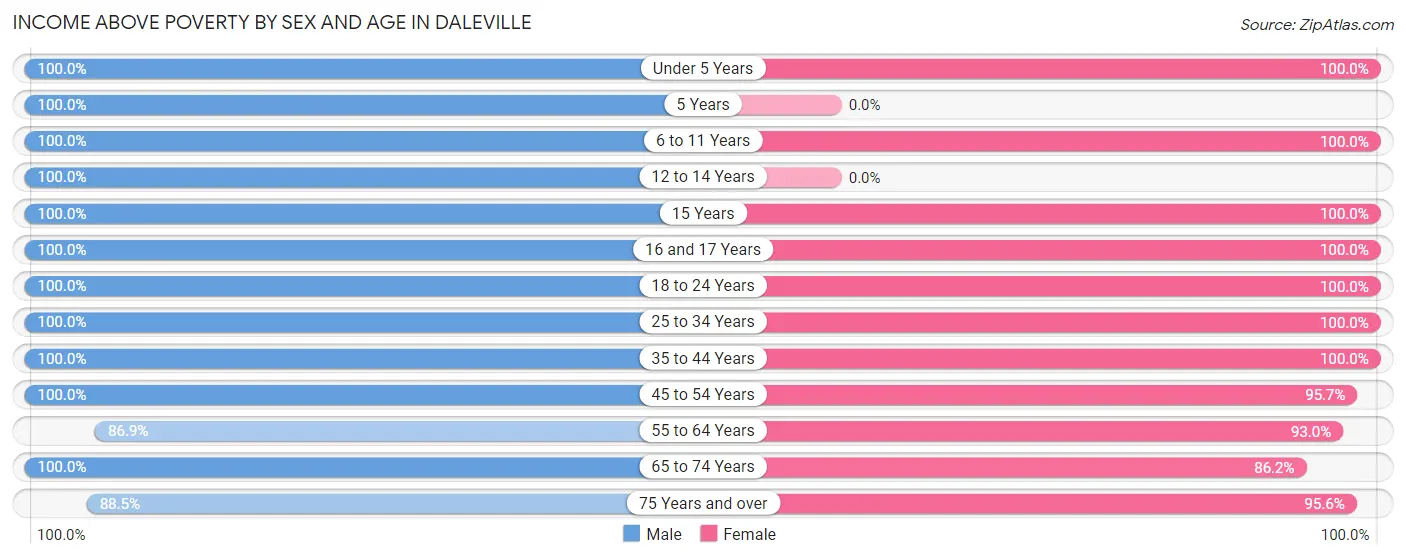
Income Above Poverty by Sex and Age in Daleville
According to the poverty statistics in Daleville, males aged under 5 years and females aged under 5 years are the age groups that are most secure financially, with 100.0% of males and 100.0% of females in these age groups living above the poverty line.
| Age Bracket | Male | Female |
| Under 5 Years | 14 (100.0%) | 59 (100.0%) |
| 5 Years | 46 (100.0%) | 0 (0.0%) |
| 6 to 11 Years | 46 (100.0%) | 101 (100.0%) |
| 12 to 14 Years | 84 (100.0%) | 0 (0.0%) |
| 15 Years | 45 (100.0%) | 14 (100.0%) |
| 16 and 17 Years | 38 (100.0%) | 71 (100.0%) |
| 18 to 24 Years | 93 (100.0%) | 44 (100.0%) |
| 25 to 34 Years | 238 (100.0%) | 188 (100.0%) |
| 35 to 44 Years | 145 (100.0%) | 141 (100.0%) |
| 45 to 54 Years | 203 (100.0%) | 177 (95.7%) |
| 55 to 64 Years | 166 (86.9%) | 187 (93.0%) |
| 65 to 74 Years | 189 (100.0%) | 169 (86.2%) |
| 75 Years and over | 184 (88.5%) | 237 (95.6%) |
| Total | 1,491 (96.8%) | 1,388 (95.9%) |
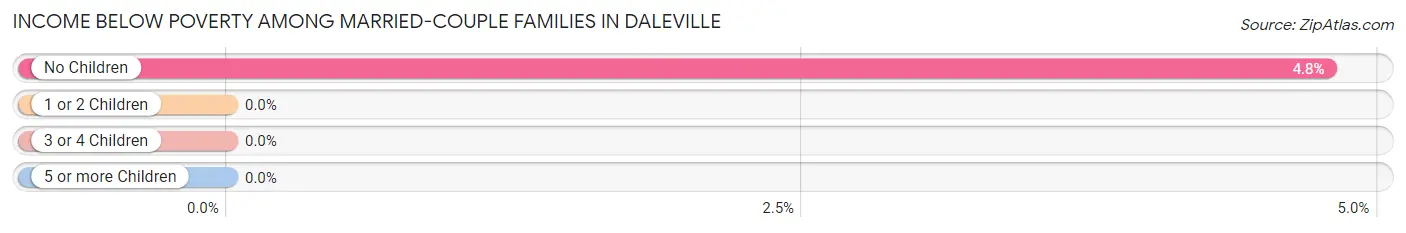
Income Below Poverty Among Married-Couple Families in Daleville
The poverty statistics for married-couple families in Daleville show that 3.4% or 24 of the total 717 families live below the poverty line. Families with no children have the highest poverty rate of 4.8%, comprising of 24 families. On the other hand, families with 1 or 2 children have the lowest poverty rate of 0.0%, which includes 0 families.
| Children | Above Poverty | Below Poverty |
| No Children | 478 (95.2%) | 24 (4.8%) |
| 1 or 2 Children | 145 (100.0%) | 0 (0.0%) |
| 3 or 4 Children | 70 (100.0%) | 0 (0.0%) |
| 5 or more Children | 0 (0.0%) | 0 (0.0%) |
| Total | 693 (96.7%) | 24 (3.4%) |
Income Below Poverty Among Single-Parent Households in Daleville
| Children | Single Father | Single Mother |
| No Children | 0 (0.0%) | 0 (0.0%) |
| 1 or 2 Children | 0 (0.0%) | 0 (0.0%) |
| 3 or 4 Children | 0 (0.0%) | 0 (0.0%) |
| 5 or more Children | 0 (0.0%) | 0 (0.0%) |
| Total | 0 (0.0%) | 0 (0.0%) |
Income Below Poverty Among Married-Couple vs Single-Parent Households in Daleville
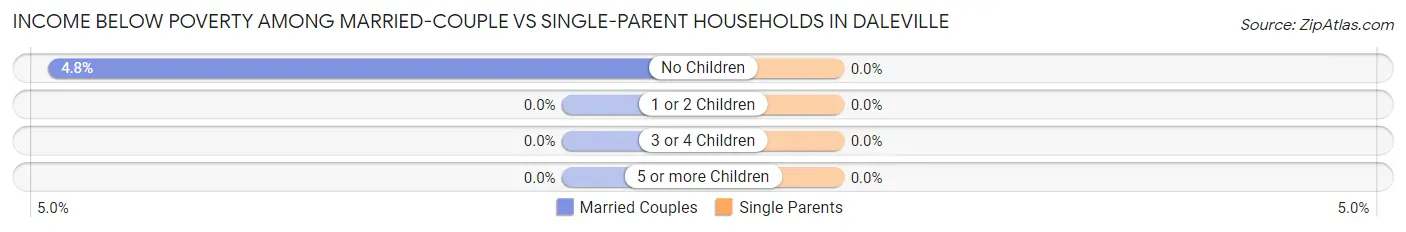
| Children | Married-Couple Families | Single-Parent Households |
| No Children | 24 (4.8%) | 0 (0.0%) |
| 1 or 2 Children | 0 (0.0%) | 0 (0.0%) |
| 3 or 4 Children | 0 (0.0%) | 0 (0.0%) |
| 5 or more Children | 0 (0.0%) | 0 (0.0%) |
| Total | 24 (3.4%) | 0 (0.0%) |
Race in Daleville
The most populous races in Daleville are White / Caucasian (2,823 | 89.1%), Two or more Races (226 | 7.1%), and Black / African American (110 | 3.5%).
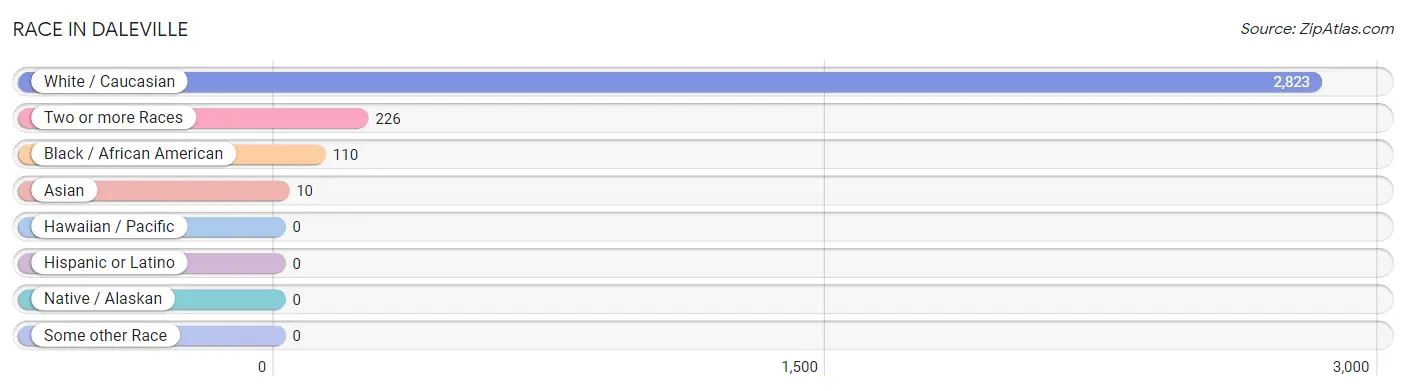
| Race | # Population | % Population |
| Asian | 10 | 0.3% |
| Black / African American | 110 | 3.5% |
| Hawaiian / Pacific | 0 | 0.0% |
| Hispanic or Latino | 0 | 0.0% |
| Native / Alaskan | 0 | 0.0% |
| White / Caucasian | 2,823 | 89.1% |
| Two or more Races | 226 | 7.1% |
| Some other Race | 0 | 0.0% |
| Total | 3,169 | 100.0% |
Ancestry in Daleville
The most populous ancestries reported in Daleville are English (567 | 17.9%), American (447 | 14.1%), Irish (350 | 11.0%), German (283 | 8.9%), and European (123 | 3.9%), together accounting for 55.8% of all Daleville residents.
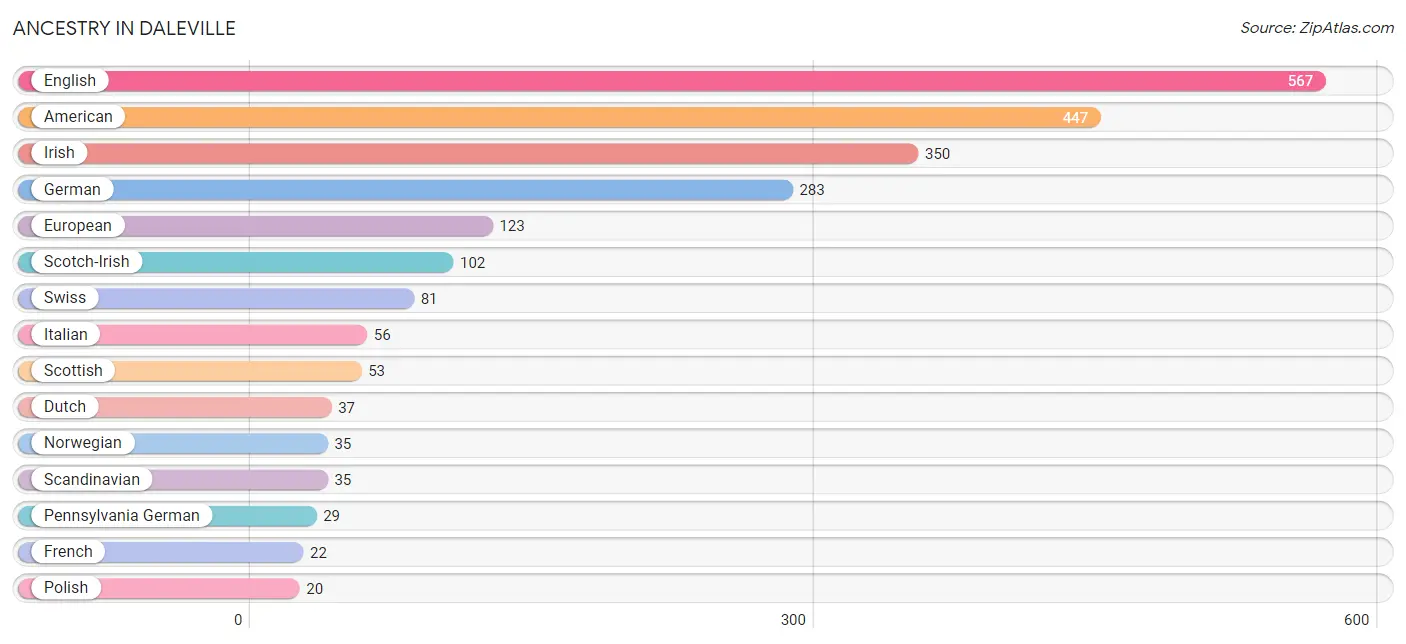
| Ancestry | # Population | % Population |
| American | 447 | 14.1% |
| Blackfeet | 8 | 0.3% |
| Dutch | 37 | 1.2% |
| English | 567 | 17.9% |
| European | 123 | 3.9% |
| French | 22 | 0.7% |
| German | 283 | 8.9% |
| Irish | 350 | 11.0% |
| Italian | 56 | 1.8% |
| Norwegian | 35 | 1.1% |
| Pennsylvania German | 29 | 0.9% |
| Polish | 20 | 0.6% |
| Scandinavian | 35 | 1.1% |
| Scotch-Irish | 102 | 3.2% |
| Scottish | 53 | 1.7% |
| Swiss | 81 | 2.6% |
| Thai | 19 | 0.6% |
| Ukrainian | 16 | 0.5% | View All 18 Rows |
Immigrants in Daleville
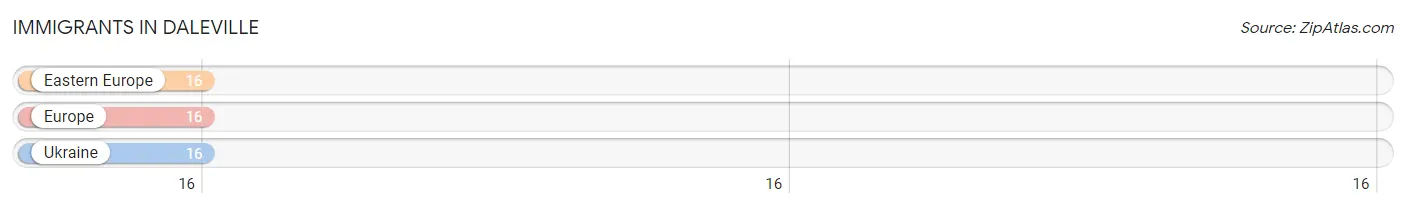
The most numerous immigrant groups reported in Daleville came from Eastern Europe (16 | 0.5%), Europe (16 | 0.5%), and Ukraine (16 | 0.5%), together accounting for 1.5% of all Daleville residents.
| Immigration Origin | # Population | % Population |
| Eastern Europe | 16 | 0.5% |
| Europe | 16 | 0.5% |
| Ukraine | 16 | 0.5% | View All 3 Rows |
Sex and Age in Daleville
Sex and Age in Daleville
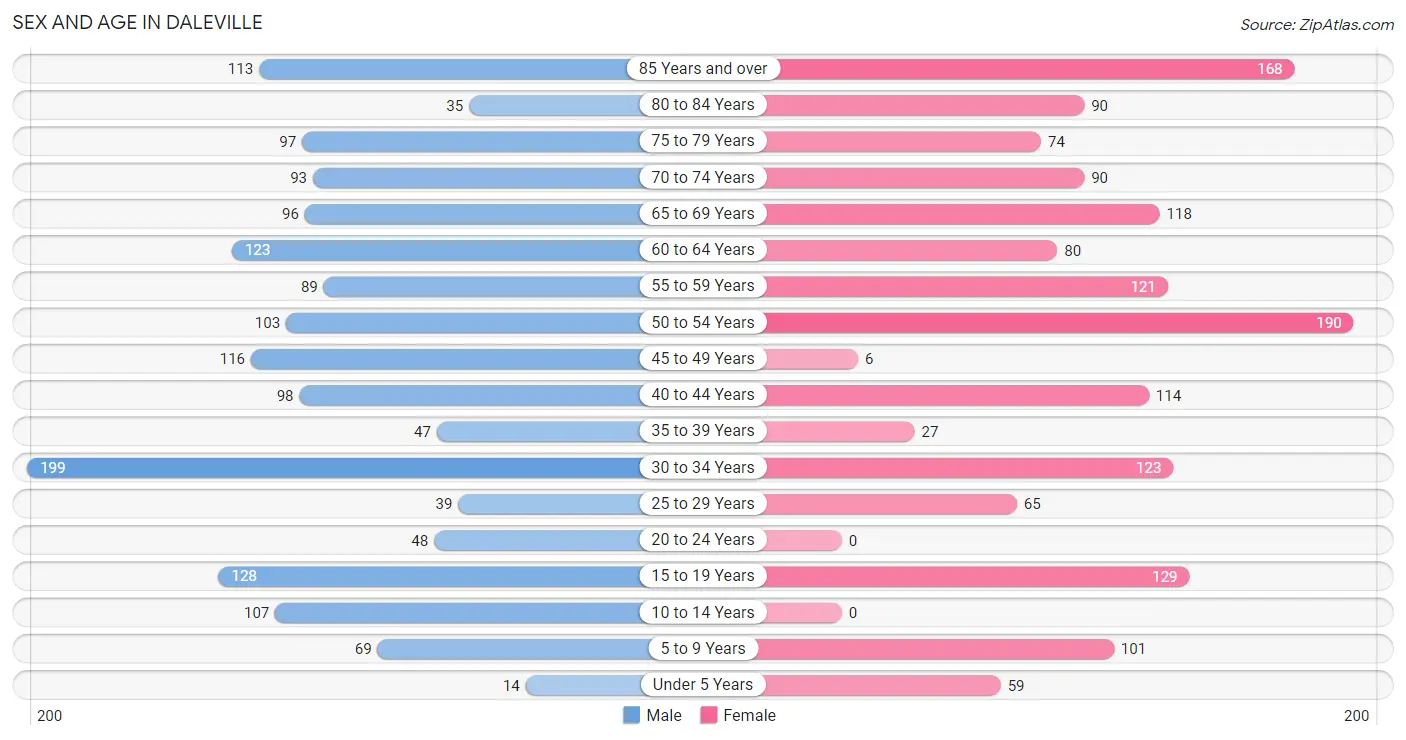
The most populous age groups in Daleville are 30 to 34 Years (199 | 12.3%) for men and 50 to 54 Years (190 | 12.2%) for women.
| Age Bracket | Male | Female |
| Under 5 Years | 14 (0.9%) | 59 (3.8%) |
| 5 to 9 Years | 69 (4.3%) | 101 (6.5%) |
| 10 to 14 Years | 107 (6.6%) | 0 (0.0%) |
| 15 to 19 Years | 128 (7.9%) | 129 (8.3%) |
| 20 to 24 Years | 48 (3.0%) | 0 (0.0%) |
| 25 to 29 Years | 39 (2.4%) | 65 (4.2%) |
| 30 to 34 Years | 199 (12.3%) | 123 (7.9%) |
| 35 to 39 Years | 47 (2.9%) | 27 (1.7%) |
| 40 to 44 Years | 98 (6.1%) | 114 (7.3%) |
| 45 to 49 Years | 116 (7.2%) | 6 (0.4%) |
| 50 to 54 Years | 103 (6.4%) | 190 (12.2%) |
| 55 to 59 Years | 89 (5.5%) | 121 (7.8%) |
| 60 to 64 Years | 123 (7.6%) | 80 (5.1%) |
| 65 to 69 Years | 96 (5.9%) | 118 (7.6%) |
| 70 to 74 Years | 93 (5.8%) | 90 (5.8%) |
| 75 to 79 Years | 97 (6.0%) | 74 (4.8%) |
| 80 to 84 Years | 35 (2.2%) | 90 (5.8%) |
| 85 Years and over | 113 (7.0%) | 168 (10.8%) |
| Total | 1,614 (100.0%) | 1,555 (100.0%) |
Families and Households in Daleville
Median Family Size in Daleville
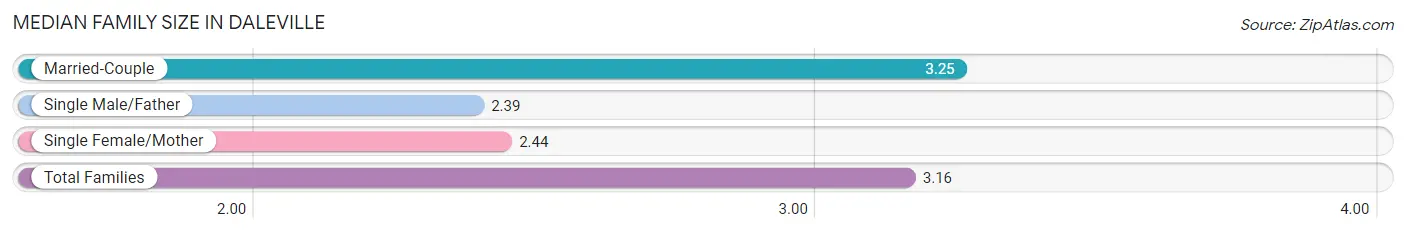
The median family size in Daleville is 3.16 persons per family, with married-couple families (717 | 88.5%) accounting for the largest median family size of 3.25 persons per family. On the other hand, single male/father families (23 | 2.8%) represent the smallest median family size with 2.39 persons per family.
| Family Type | # Families | Family Size |
| Married-Couple | 717 (88.5%) | 3.25 |
| Single Male/Father | 23 (2.8%) | 2.39 |
| Single Female/Mother | 70 (8.6%) | 2.44 |
| Total Families | 810 (100.0%) | 3.16 |
Median Household Size in Daleville
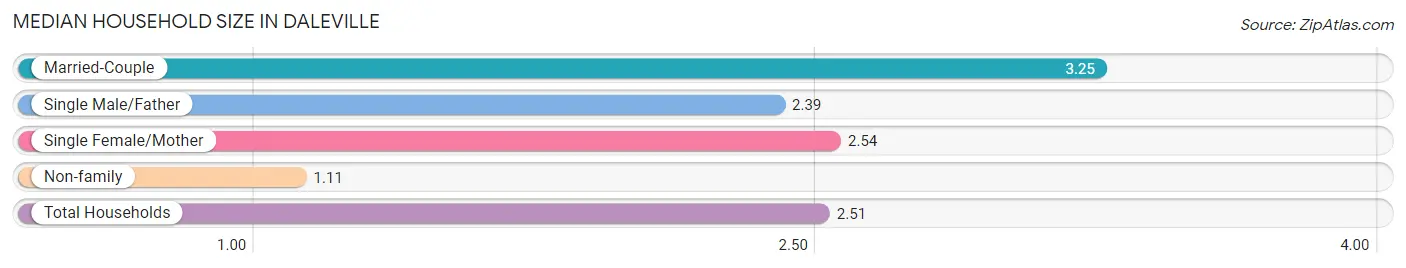
The median household size in Daleville is 2.51 persons per household, with married-couple households (717 | 60.2%) accounting for the largest median household size of 3.25 persons per household. non-family households (382 | 32.1%) represent the smallest median household size with 1.11 persons per household.
| Household Type | # Households | Household Size |
| Married-Couple | 717 (60.2%) | 3.25 |
| Single Male/Father | 23 (1.9%) | 2.39 |
| Single Female/Mother | 70 (5.9%) | 2.54 |
| Non-family | 382 (32.1%) | 1.11 |
| Total Households | 1,192 (100.0%) | 2.51 |
Household Size by Marriage Status in Daleville
Out of a total of 1,192 households in Daleville, 810 (67.9%) are family households, while 382 (32.1%) are nonfamily households. The most numerous type of family households are 2-person households, comprising 503, and the most common type of nonfamily households are 1-person households, comprising 359.
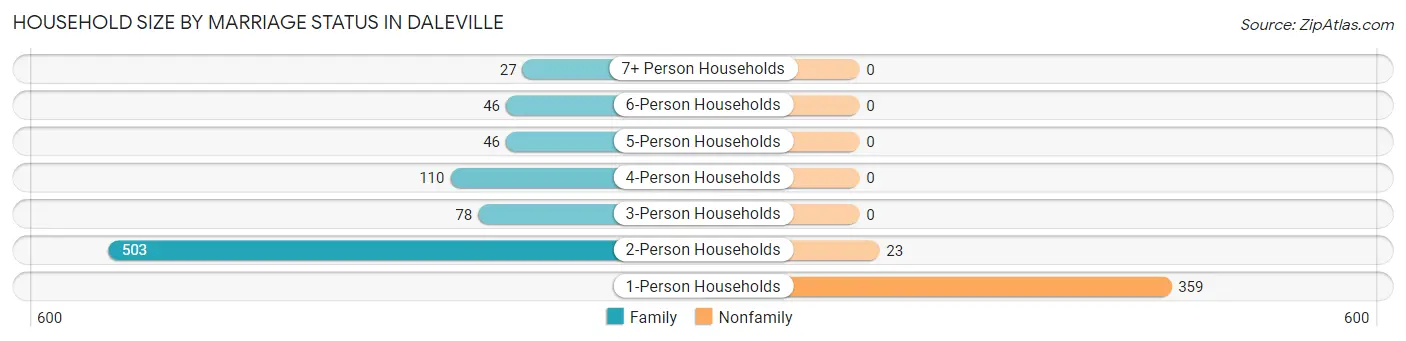
| Household Size | Family Households | Nonfamily Households |
| 1-Person Households | - | 359 (30.1%) |
| 2-Person Households | 503 (42.2%) | 23 (1.9%) |
| 3-Person Households | 78 (6.5%) | 0 (0.0%) |
| 4-Person Households | 110 (9.2%) | 0 (0.0%) |
| 5-Person Households | 46 (3.9%) | 0 (0.0%) |
| 6-Person Households | 46 (3.9%) | 0 (0.0%) |
| 7+ Person Households | 27 (2.3%) | 0 (0.0%) |
| Total | 810 (67.9%) | 382 (32.1%) |
Female Fertility in Daleville
Fertility by Age in Daleville
| Age Bracket | Women with Births | Births / 1,000 Women |
| 15 to 19 years | 0 (0.0%) | 0.0 |
| 20 to 34 years | 0 (0.0%) | 0.0 |
| 35 to 50 years | 0 (0.0%) | 0.0 |
| Total | 0 (0.0%) | 0.0 |
Fertility by Age by Marriage Status in Daleville
| Age Bracket | Married | Unmarried |
| 15 to 19 years | 0 (0.0%) | 0 (0.0%) |
| 20 to 34 years | 0 (0.0%) | 0 (0.0%) |
| 35 to 50 years | 0 (0.0%) | 0 (0.0%) |
| Total | 0 (0.0%) | 0 (0.0%) |
Fertility by Education in Daleville
| Educational Attainment | Women with Births | Births / 1,000 Women |
| Less than High School | 0 (0.0%) | 0.0 |
| High School Diploma | 0 (0.0%) | 0.0 |
| College or Associate's Degree | 0 (0.0%) | 0.0 |
| Bachelor's Degree | 0 (0.0%) | 0.0 |
| Graduate Degree | 0 (0.0%) | 0.0 |
| Total | 0 (0.0%) | 0.0 |
Fertility by Education by Marriage Status in Daleville
| Educational Attainment | Married | Unmarried |
| Less than High School | 0 (0.0%) | 0 (0.0%) |
| High School Diploma | 0 (0.0%) | 0 (0.0%) |
| College or Associate's Degree | 0 (0.0%) | 0 (0.0%) |
| Bachelor's Degree | 0 (0.0%) | 0 (0.0%) |
| Graduate Degree | 0 (0.0%) | 0 (0.0%) |
| Total | 0 (0.0%) | 0 (0.0%) |
Employment Characteristics in Daleville
Employment by Class of Employer in Daleville
Among the 1,206 employed individuals in Daleville, private company employees (861 | 71.4%), not-for-profit organizations (106 | 8.8%), and self-employed (not incorporated) (100 | 8.3%) make up the most common classes of employment.
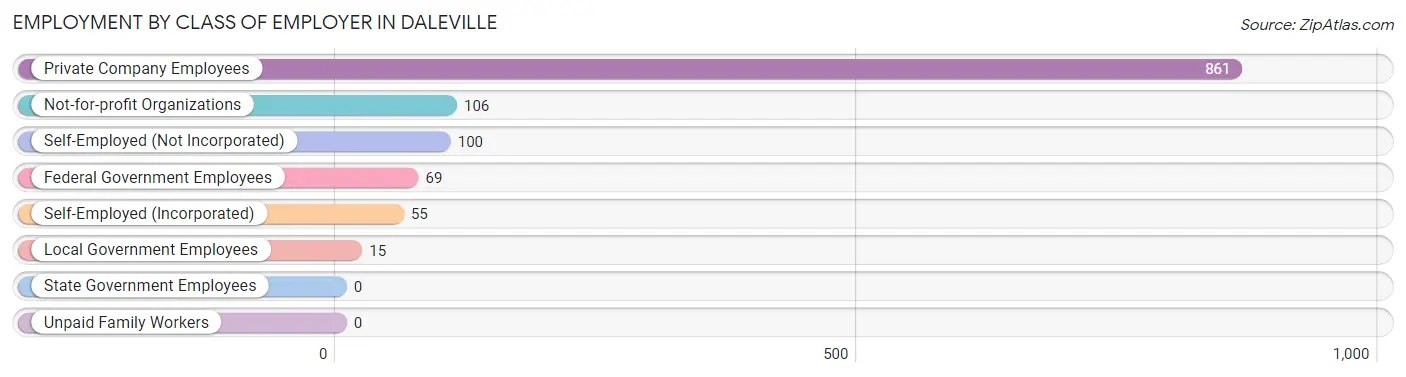
| Employer Class | # Employees | % Employees |
| Private Company Employees | 861 | 71.4% |
| Self-Employed (Incorporated) | 55 | 4.6% |
| Self-Employed (Not Incorporated) | 100 | 8.3% |
| Not-for-profit Organizations | 106 | 8.8% |
| Local Government Employees | 15 | 1.2% |
| State Government Employees | 0 | 0.0% |
| Federal Government Employees | 69 | 5.7% |
| Unpaid Family Workers | 0 | 0.0% |
| Total | 1,206 | 100.0% |
Employment Status by Age in Daleville
According to the labor force statistics for Daleville, out of the total population over 16 years of age (2,760), 49.6% or 1,369 individuals are in the labor force, with 8.5% or 116 of them unemployed. The age group with the highest labor force participation rate is 20 to 24 years, with 100.0% or 48 individuals in the labor force. Within the labor force, the 20 to 24 years age range has the highest percentage of unemployed individuals, with 66.7% or 32 of them being unemployed.
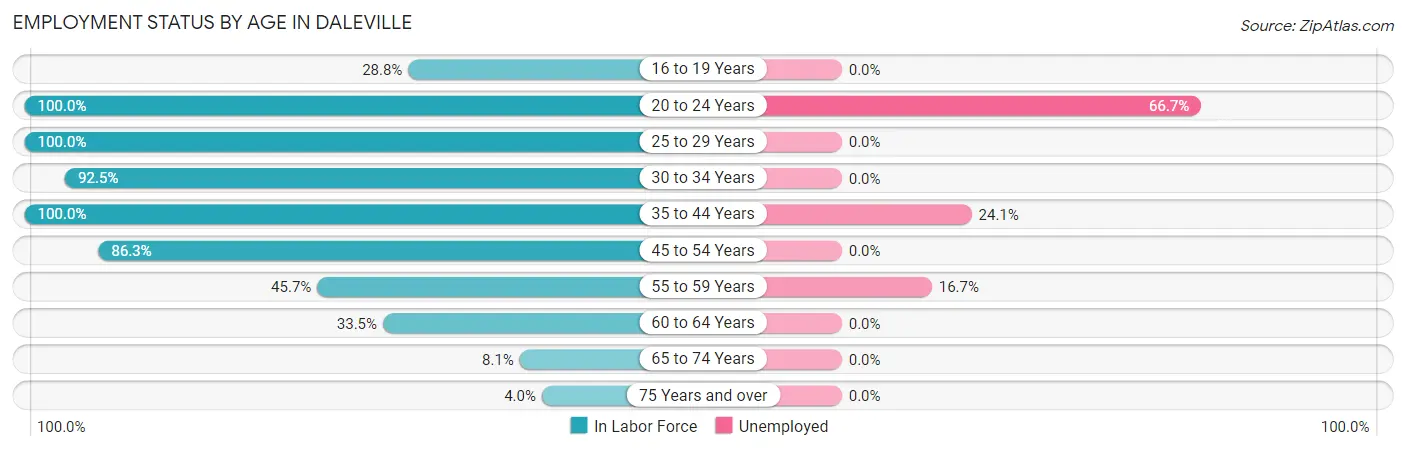
| Age Bracket | In Labor Force | Unemployed |
| 16 to 19 Years | 57 (28.8%) | 0 (0.0%) |
| 20 to 24 Years | 48 (100.0%) | 32 (66.7%) |
| 25 to 29 Years | 104 (100.0%) | 0 (0.0%) |
| 30 to 34 Years | 298 (92.5%) | 0 (0.0%) |
| 35 to 44 Years | 286 (100.0%) | 69 (24.1%) |
| 45 to 54 Years | 358 (86.3%) | 0 (0.0%) |
| 55 to 59 Years | 96 (45.7%) | 16 (16.7%) |
| 60 to 64 Years | 68 (33.5%) | 0 (0.0%) |
| 65 to 74 Years | 32 (8.1%) | 0 (0.0%) |
| 75 Years and over | 23 (4.0%) | 0 (0.0%) |
| Total | 1,369 (49.6%) | 116 (8.5%) |
Employment Status by Educational Attainment in Daleville
According to labor force statistics for Daleville, 78.6% of individuals (1,210) out of the total population between 25 and 64 years of age (1,540) are in the labor force, with 7.0% or 85 of them being unemployed. The group with the highest labor force participation rate are those with the educational attainment of college / associate degree, with 86.3% or 377 individuals in the labor force. Within the labor force, individuals with college / associate degree education have the highest percentage of unemployment, with 14.3% or 54 of them being unemployed.
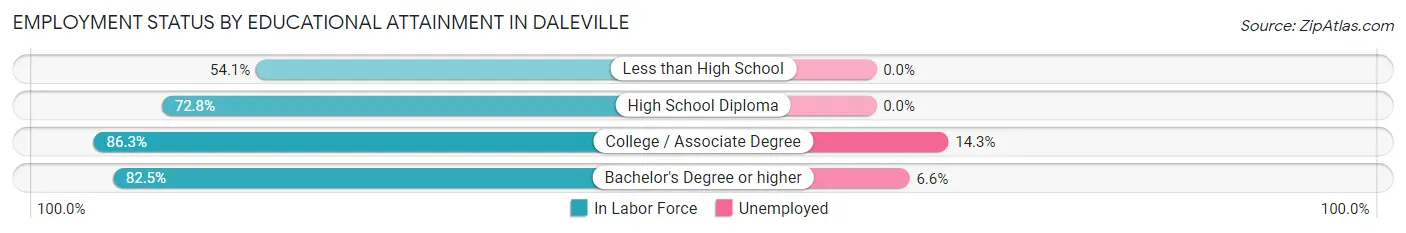
| Educational Attainment | In Labor Force | Unemployed |
| Less than High School | 73 (54.1%) | 0 (0.0%) |
| High School Diploma | 292 (72.8%) | 0 (0.0%) |
| College / Associate Degree | 377 (86.3%) | 62 (14.3%) |
| Bachelor's Degree or higher | 468 (82.5%) | 37 (6.6%) |
| Total | 1,210 (78.6%) | 108 (7.0%) |
Employment Occupations by Sex in Daleville
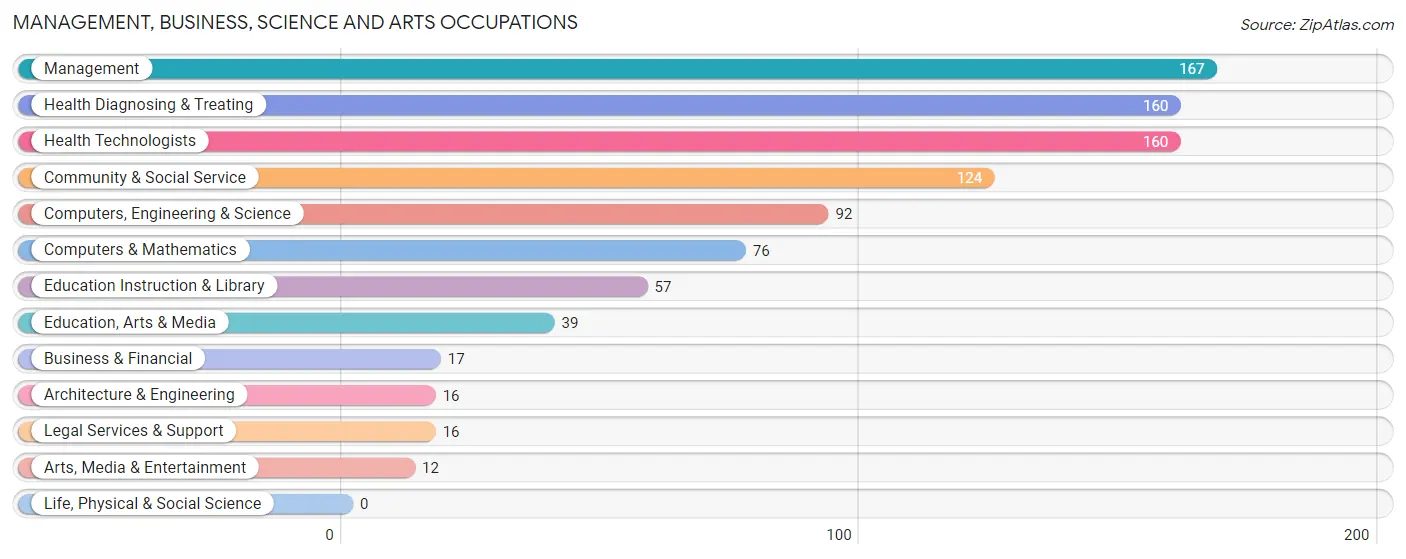
Management, Business, Science and Arts Occupations
The most common Management, Business, Science and Arts occupations in Daleville are Management (167 | 13.3%), Health Diagnosing & Treating (160 | 12.8%), Health Technologists (160 | 12.8%), Community & Social Service (124 | 9.9%), and Computers, Engineering & Science (92 | 7.3%).
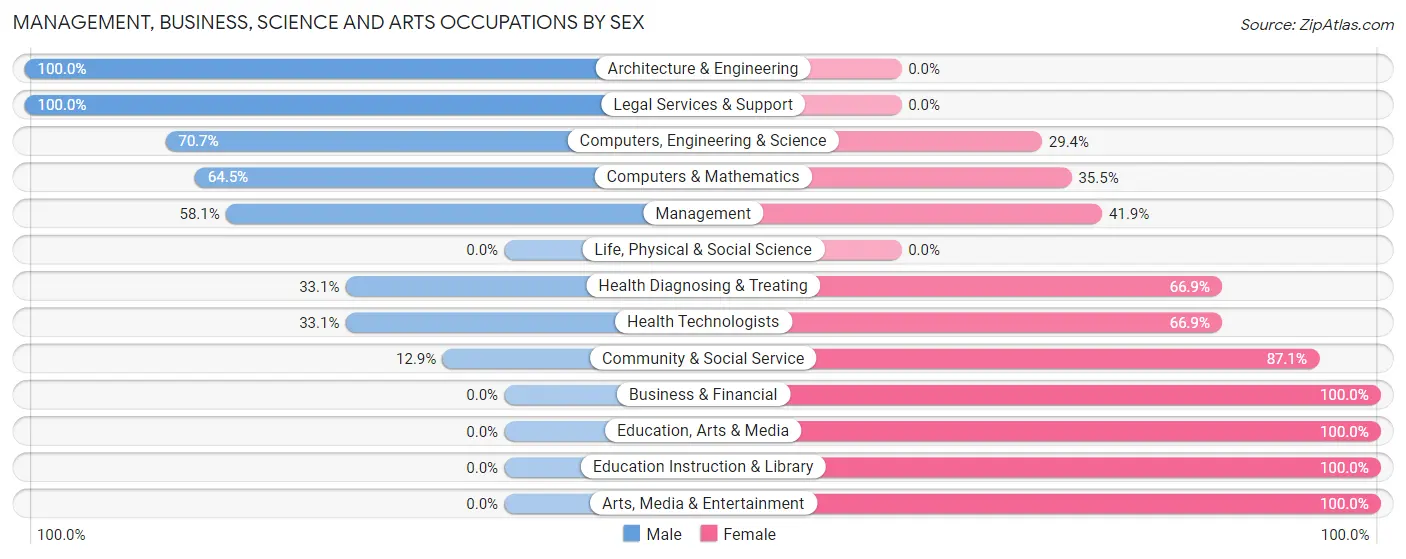
Management, Business, Science and Arts Occupations by Sex
Within the Management, Business, Science and Arts occupations in Daleville, the most male-oriented occupations are Architecture & Engineering (100.0%), Legal Services & Support (100.0%), and Computers, Engineering & Science (70.7%), while the most female-oriented occupations are Business & Financial (100.0%), Education, Arts & Media (100.0%), and Education Instruction & Library (100.0%).
| Occupation | Male | Female |
| Management | 97 (58.1%) | 70 (41.9%) |
| Business & Financial | 0 (0.0%) | 17 (100.0%) |
| Computers, Engineering & Science | 65 (70.7%) | 27 (29.3%) |
| Computers & Mathematics | 49 (64.5%) | 27 (35.5%) |
| Architecture & Engineering | 16 (100.0%) | 0 (0.0%) |
| Life, Physical & Social Science | 0 (0.0%) | 0 (0.0%) |
| Community & Social Service | 16 (12.9%) | 108 (87.1%) |
| Education, Arts & Media | 0 (0.0%) | 39 (100.0%) |
| Legal Services & Support | 16 (100.0%) | 0 (0.0%) |
| Education Instruction & Library | 0 (0.0%) | 57 (100.0%) |
| Arts, Media & Entertainment | 0 (0.0%) | 12 (100.0%) |
| Health Diagnosing & Treating | 53 (33.1%) | 107 (66.9%) |
| Health Technologists | 53 (33.1%) | 107 (66.9%) |
| Total (Category) | 231 (41.2%) | 329 (58.8%) |
| Total (Overall) | 691 (55.1%) | 562 (44.9%) |
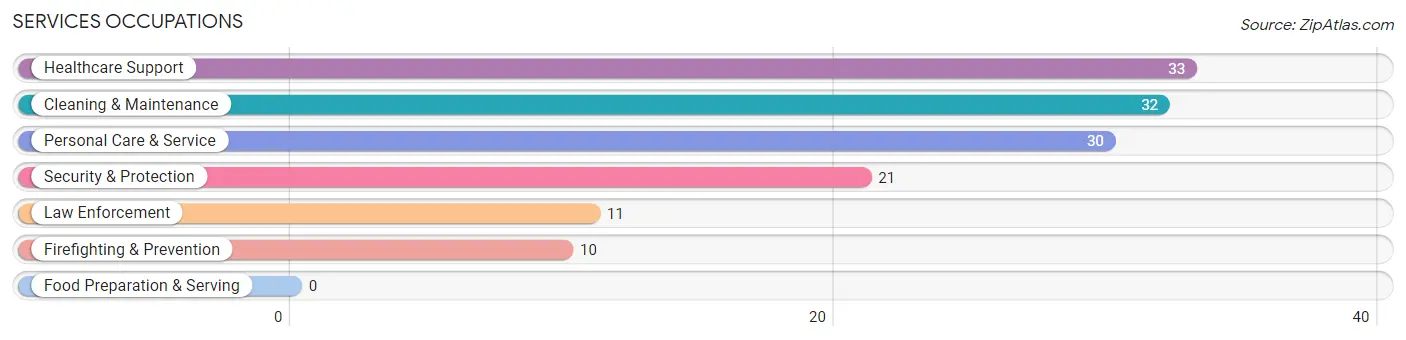
Services Occupations
The most common Services occupations in Daleville are Healthcare Support (33 | 2.6%), Cleaning & Maintenance (32 | 2.5%), Personal Care & Service (30 | 2.4%), Security & Protection (21 | 1.7%), and Law Enforcement (11 | 0.9%).
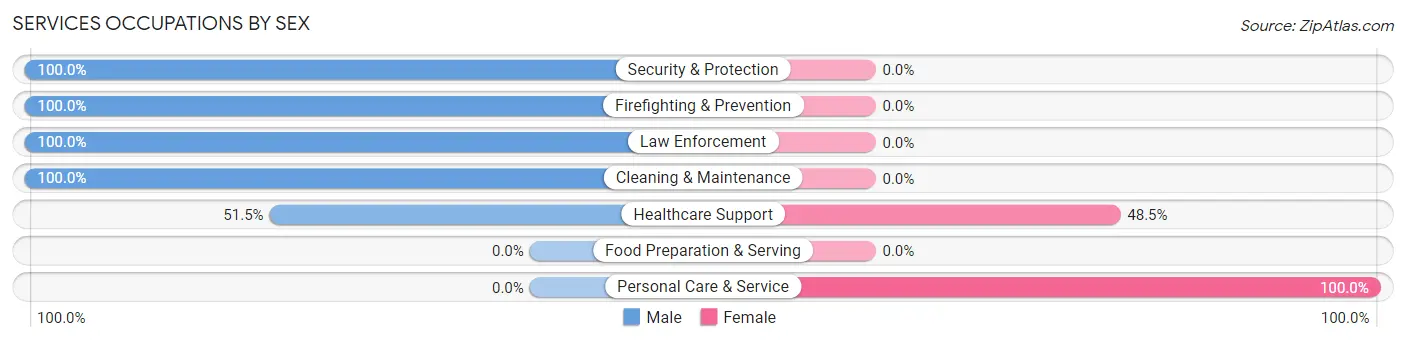
Services Occupations by Sex
Within the Services occupations in Daleville, the most male-oriented occupations are Security & Protection (100.0%), Firefighting & Prevention (100.0%), and Law Enforcement (100.0%), while the most female-oriented occupations are Personal Care & Service (100.0%), and Healthcare Support (48.5%).
| Occupation | Male | Female |
| Healthcare Support | 17 (51.5%) | 16 (48.5%) |
| Security & Protection | 21 (100.0%) | 0 (0.0%) |
| Firefighting & Prevention | 10 (100.0%) | 0 (0.0%) |
| Law Enforcement | 11 (100.0%) | 0 (0.0%) |
| Food Preparation & Serving | 0 (0.0%) | 0 (0.0%) |
| Cleaning & Maintenance | 32 (100.0%) | 0 (0.0%) |
| Personal Care & Service | 0 (0.0%) | 30 (100.0%) |
| Total (Category) | 70 (60.3%) | 46 (39.7%) |
| Total (Overall) | 691 (55.1%) | 562 (44.9%) |
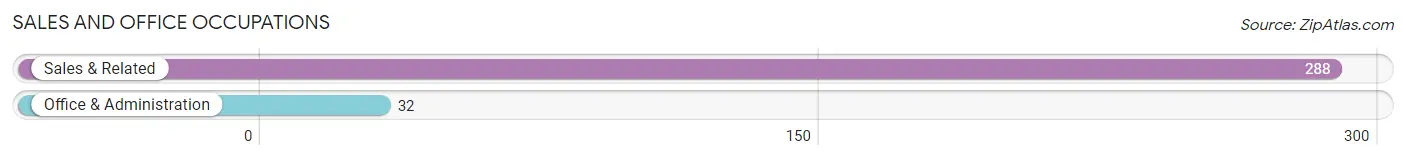
Sales and Office Occupations
The most common Sales and Office occupations in Daleville are Sales & Related (288 | 23.0%), and Office & Administration (32 | 2.5%).
Sales and Office Occupations by Sex
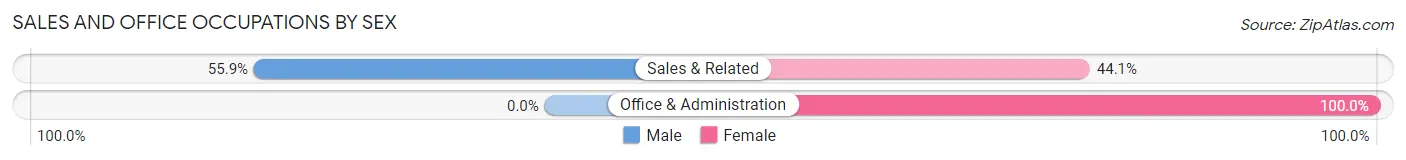
| Occupation | Male | Female |
| Sales & Related | 161 (55.9%) | 127 (44.1%) |
| Office & Administration | 0 (0.0%) | 32 (100.0%) |
| Total (Category) | 161 (50.3%) | 159 (49.7%) |
| Total (Overall) | 691 (55.1%) | 562 (44.9%) |
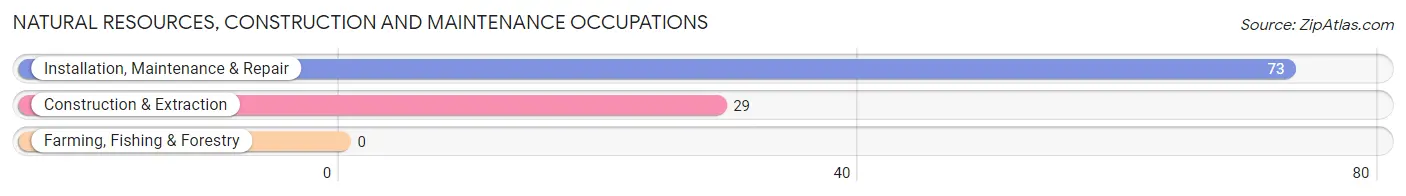
Natural Resources, Construction and Maintenance Occupations
The most common Natural Resources, Construction and Maintenance occupations in Daleville are Installation, Maintenance & Repair (73 | 5.8%), and Construction & Extraction (29 | 2.3%).
Natural Resources, Construction and Maintenance Occupations by Sex
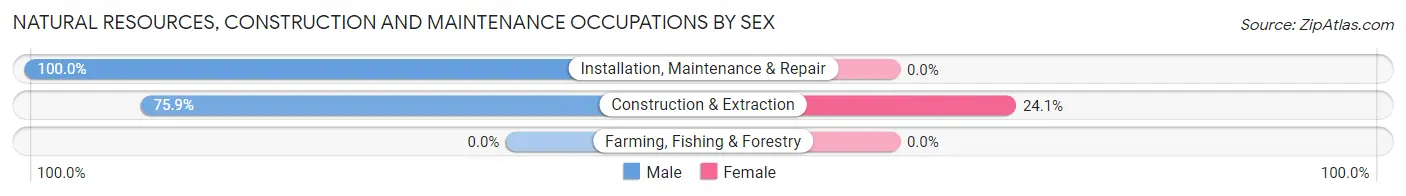
| Occupation | Male | Female |
| Farming, Fishing & Forestry | 0 (0.0%) | 0 (0.0%) |
| Construction & Extraction | 22 (75.9%) | 7 (24.1%) |
| Installation, Maintenance & Repair | 73 (100.0%) | 0 (0.0%) |
| Total (Category) | 95 (93.1%) | 7 (6.9%) |
| Total (Overall) | 691 (55.1%) | 562 (44.9%) |
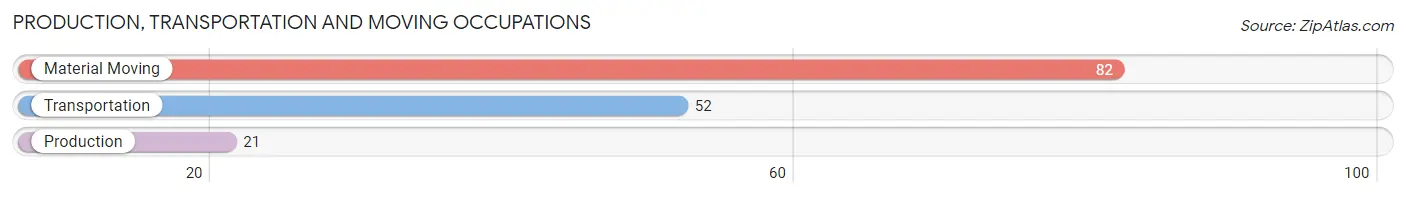
Production, Transportation and Moving Occupations
The most common Production, Transportation and Moving occupations in Daleville are Material Moving (82 | 6.5%), Transportation (52 | 4.2%), and Production (21 | 1.7%).
Production, Transportation and Moving Occupations by Sex
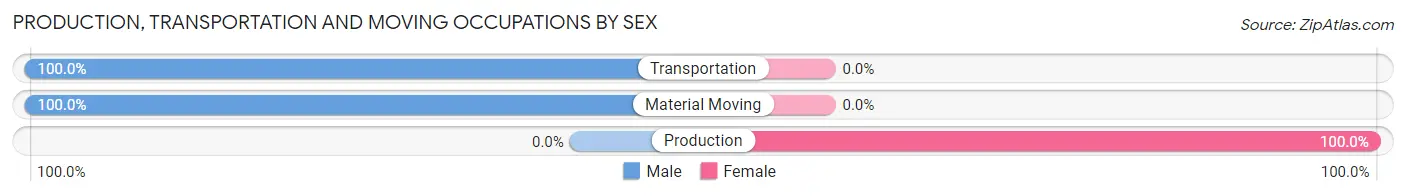
| Occupation | Male | Female |
| Production | 0 (0.0%) | 21 (100.0%) |
| Transportation | 52 (100.0%) | 0 (0.0%) |
| Material Moving | 82 (100.0%) | 0 (0.0%) |
| Total (Category) | 134 (86.5%) | 21 (13.6%) |
| Total (Overall) | 691 (55.1%) | 562 (44.9%) |
Employment Industries by Sex in Daleville
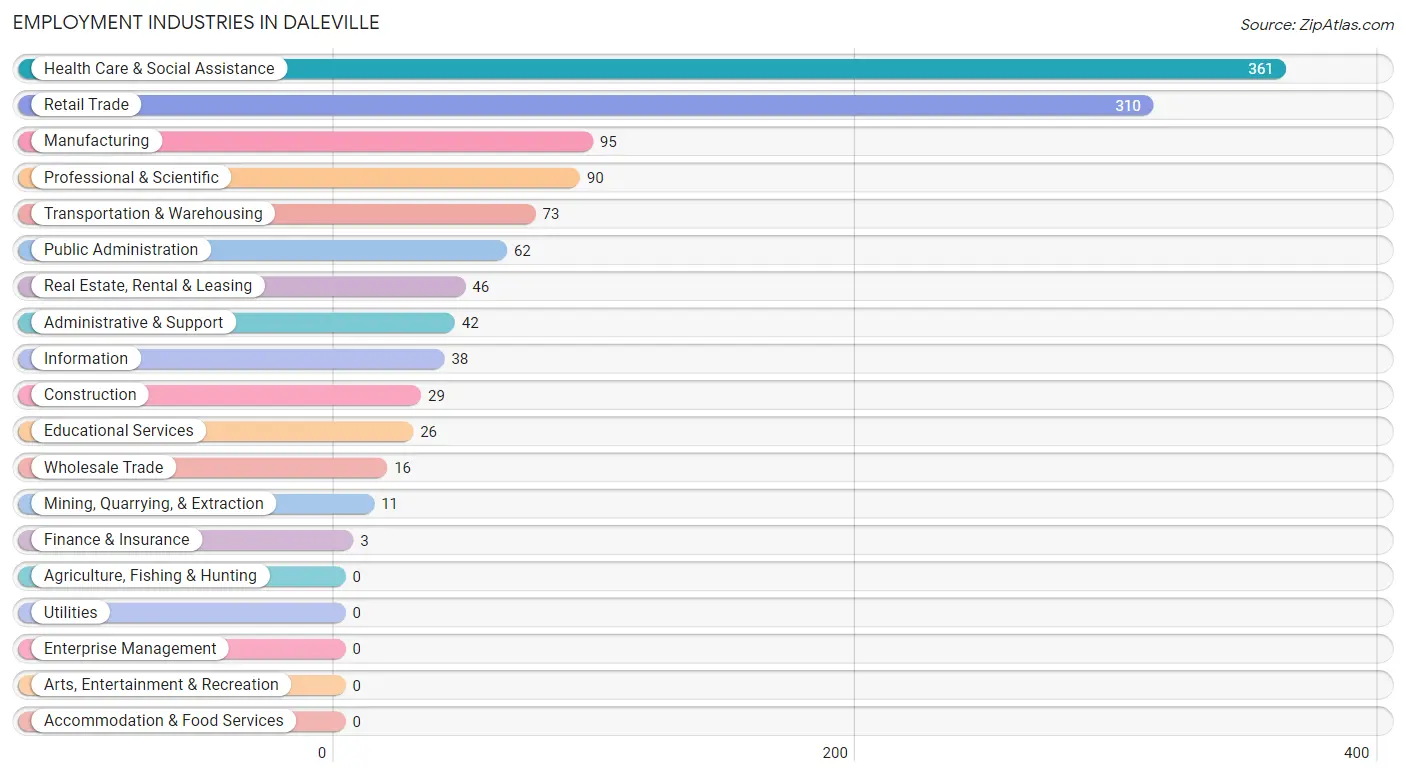
Employment Industries in Daleville
The major employment industries in Daleville include Health Care & Social Assistance (361 | 28.8%), Retail Trade (310 | 24.7%), Manufacturing (95 | 7.6%), Professional & Scientific (90 | 7.2%), and Transportation & Warehousing (73 | 5.8%).
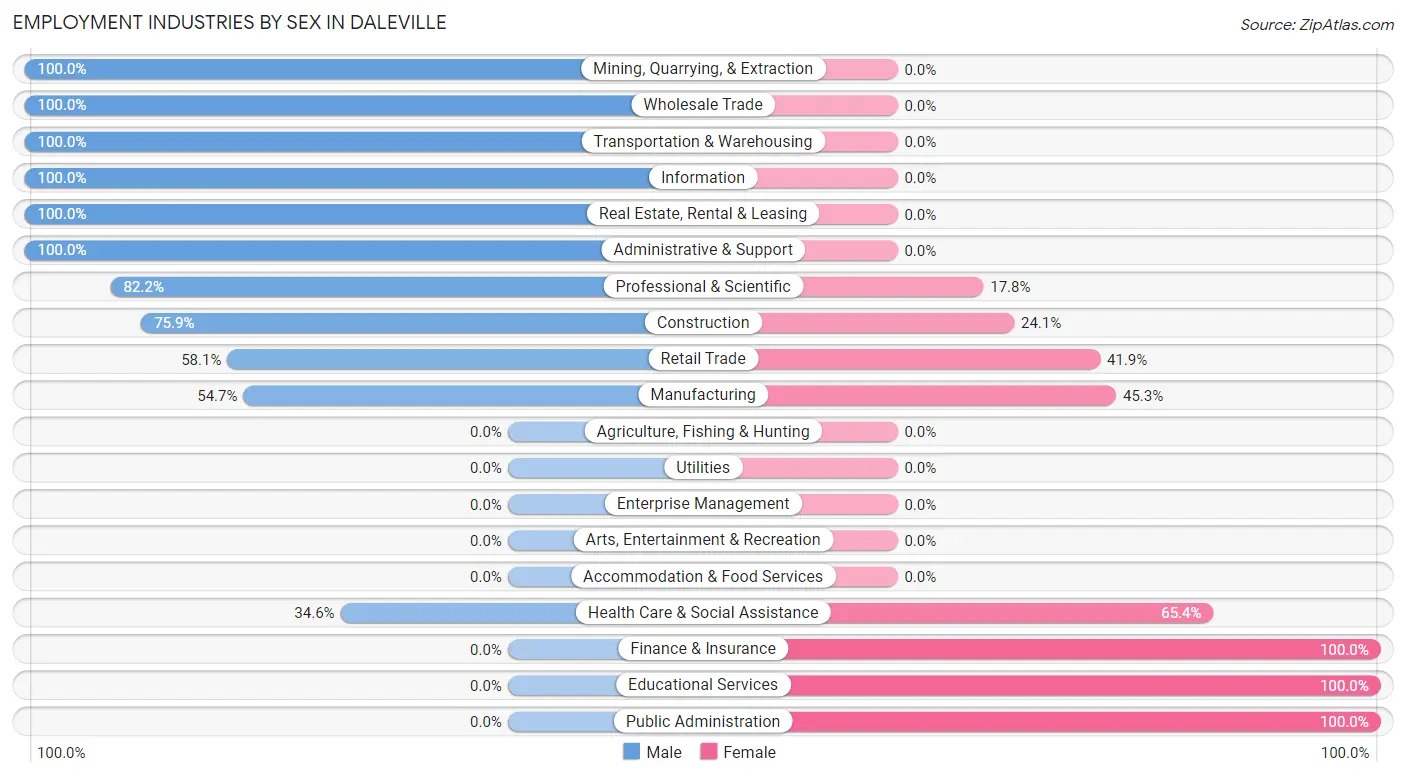
Employment Industries by Sex in Daleville
The Daleville industries that see more men than women are Mining, Quarrying, & Extraction (100.0%), Wholesale Trade (100.0%), and Transportation & Warehousing (100.0%), whereas the industries that tend to have a higher number of women are Finance & Insurance (100.0%), Educational Services (100.0%), and Public Administration (100.0%).
| Industry | Male | Female |
| Agriculture, Fishing & Hunting | 0 (0.0%) | 0 (0.0%) |
| Mining, Quarrying, & Extraction | 11 (100.0%) | 0 (0.0%) |
| Construction | 22 (75.9%) | 7 (24.1%) |
| Manufacturing | 52 (54.7%) | 43 (45.3%) |
| Wholesale Trade | 16 (100.0%) | 0 (0.0%) |
| Retail Trade | 180 (58.1%) | 130 (41.9%) |
| Transportation & Warehousing | 73 (100.0%) | 0 (0.0%) |
| Utilities | 0 (0.0%) | 0 (0.0%) |
| Information | 38 (100.0%) | 0 (0.0%) |
| Finance & Insurance | 0 (0.0%) | 3 (100.0%) |
| Real Estate, Rental & Leasing | 46 (100.0%) | 0 (0.0%) |
| Professional & Scientific | 74 (82.2%) | 16 (17.8%) |
| Enterprise Management | 0 (0.0%) | 0 (0.0%) |
| Administrative & Support | 42 (100.0%) | 0 (0.0%) |
| Educational Services | 0 (0.0%) | 26 (100.0%) |
| Health Care & Social Assistance | 125 (34.6%) | 236 (65.4%) |
| Arts, Entertainment & Recreation | 0 (0.0%) | 0 (0.0%) |
| Accommodation & Food Services | 0 (0.0%) | 0 (0.0%) |
| Public Administration | 0 (0.0%) | 62 (100.0%) |
| Total | 691 (55.1%) | 562 (44.9%) |
Education in Daleville
School Enrollment in Daleville
The most common levels of schooling among the 557 students in Daleville are high school (226 | 40.6%), elementary school (124 | 22.3%), and middle school (116 | 20.8%).
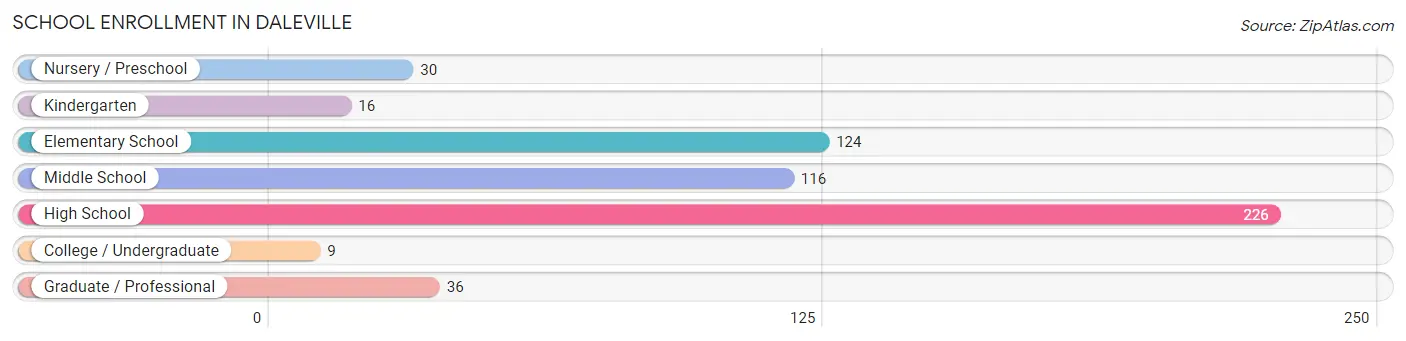
| School Level | # Students | % Students |
| Nursery / Preschool | 30 | 5.4% |
| Kindergarten | 16 | 2.9% |
| Elementary School | 124 | 22.3% |
| Middle School | 116 | 20.8% |
| High School | 226 | 40.6% |
| College / Undergraduate | 9 | 1.6% |
| Graduate / Professional | 36 | 6.5% |
| Total | 557 | 100.0% |
School Enrollment by Age by Funding Source in Daleville
Out of a total of 557 students who are enrolled in schools in Daleville, 98 (17.6%) attend a private institution, while the remaining 459 (82.4%) are enrolled in public schools. The age group of 25 to 34 year olds has the highest likelihood of being enrolled in private schools, with 24 (100.0% in the age bracket) enrolled. Conversely, the age group of 10 to 14 year olds has the lowest likelihood of being enrolled in a private school, with 107 (100.0% in the age bracket) attending a public institution.
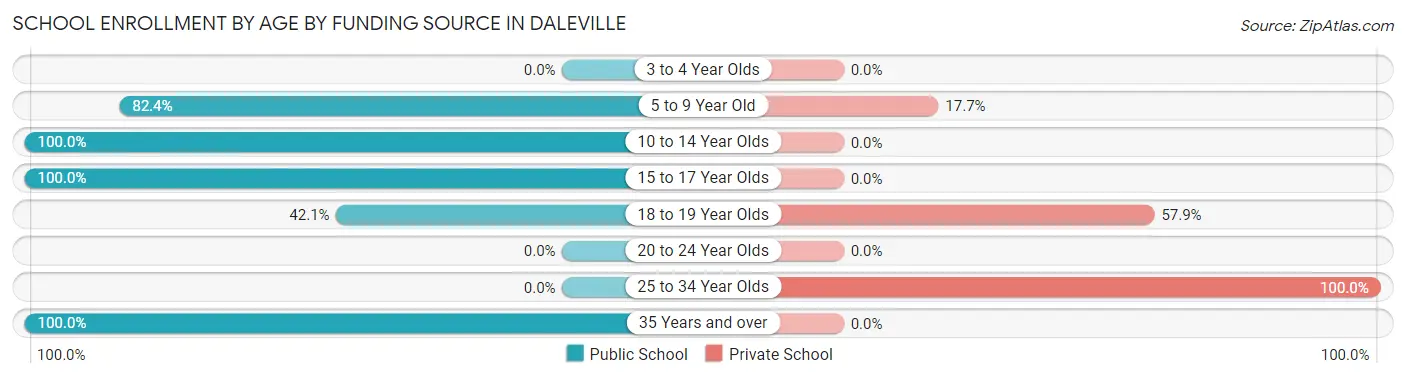
| Age Bracket | Public School | Private School |
| 3 to 4 Year Olds | 0 (0.0%) | 0 (0.0%) |
| 5 to 9 Year Old | 140 (82.4%) | 30 (17.6%) |
| 10 to 14 Year Olds | 107 (100.0%) | 0 (0.0%) |
| 15 to 17 Year Olds | 168 (100.0%) | 0 (0.0%) |
| 18 to 19 Year Olds | 32 (42.1%) | 44 (57.9%) |
| 20 to 24 Year Olds | 0 (0.0%) | 0 (0.0%) |
| 25 to 34 Year Olds | 0 (0.0%) | 24 (100.0%) |
| 35 Years and over | 12 (100.0%) | 0 (0.0%) |
| Total | 459 (82.4%) | 98 (17.6%) |
Educational Attainment by Field of Study in Daleville
Business (231 | 25.2%), education (124 | 13.5%), science & technology (121 | 13.2%), bio, nature & agricultural (98 | 10.7%), and social sciences (95 | 10.4%) are the most common fields of study among 916 individuals in Daleville who have obtained a bachelor's degree or higher.
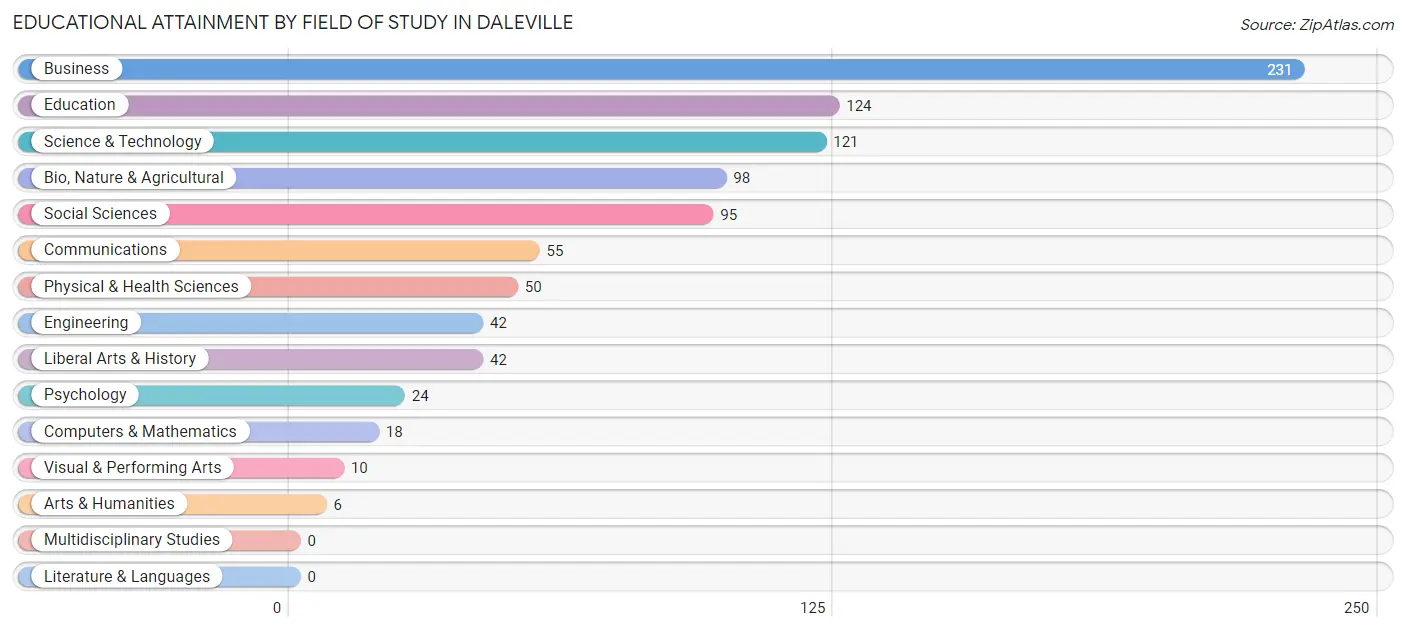
| Field of Study | # Graduates | % Graduates |
| Computers & Mathematics | 18 | 2.0% |
| Bio, Nature & Agricultural | 98 | 10.7% |
| Physical & Health Sciences | 50 | 5.5% |
| Psychology | 24 | 2.6% |
| Social Sciences | 95 | 10.4% |
| Engineering | 42 | 4.6% |
| Multidisciplinary Studies | 0 | 0.0% |
| Science & Technology | 121 | 13.2% |
| Business | 231 | 25.2% |
| Education | 124 | 13.5% |
| Literature & Languages | 0 | 0.0% |
| Liberal Arts & History | 42 | 4.6% |
| Visual & Performing Arts | 10 | 1.1% |
| Communications | 55 | 6.0% |
| Arts & Humanities | 6 | 0.7% |
| Total | 916 | 100.0% |
Transportation & Commute in Daleville
Vehicle Availability by Sex in Daleville
The most prevalent vehicle ownership categories in Daleville are males with 2 vehicles (238, accounting for 36.4%) and females with 2 vehicles (324, making up 43.0%).
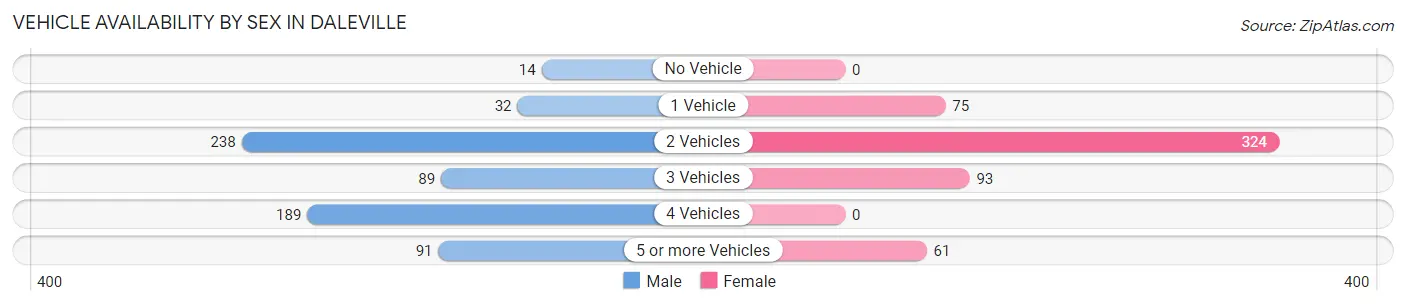
| Vehicles Available | Male | Female |
| No Vehicle | 14 (2.1%) | 0 (0.0%) |
| 1 Vehicle | 32 (4.9%) | 75 (13.6%) |
| 2 Vehicles | 238 (36.4%) | 324 (58.6%) |
| 3 Vehicles | 89 (13.6%) | 93 (16.8%) |
| 4 Vehicles | 189 (28.9%) | 0 (0.0%) |
| 5 or more Vehicles | 91 (13.9%) | 61 (11.0%) |
| Total | 653 (100.0%) | 553 (100.0%) |
Commute Time in Daleville
The most frequently occuring commute durations in Daleville are 10 to 14 minutes (321 commuters, 28.1%), 30 to 34 minutes (259 commuters, 22.7%), and 20 to 24 minutes (173 commuters, 15.1%).
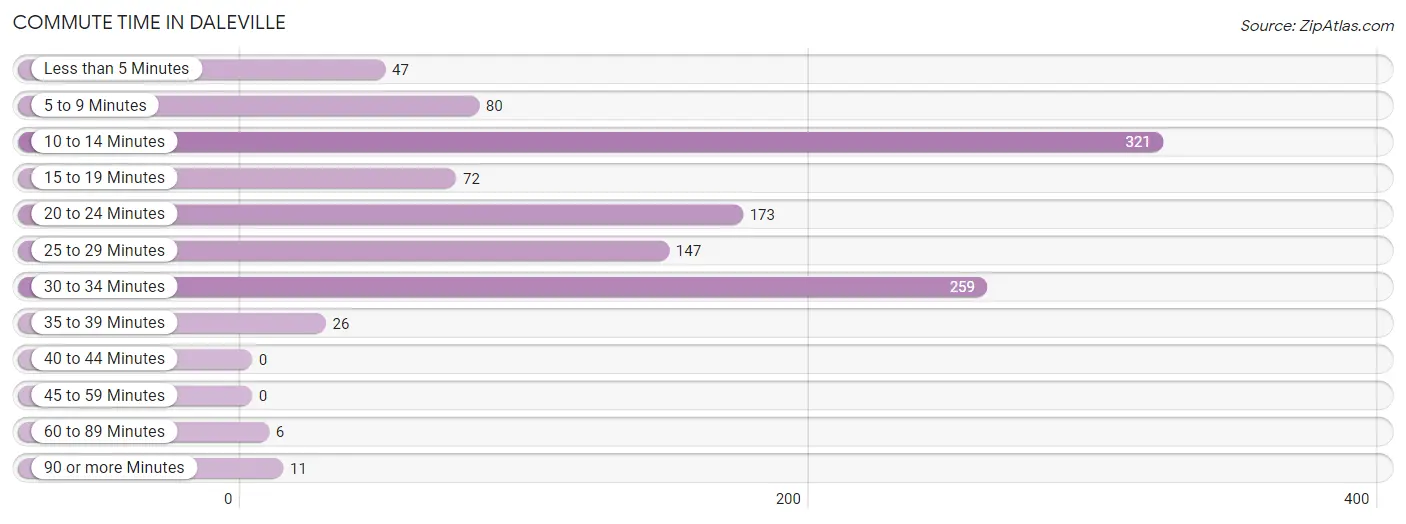
| Commute Time | # Commuters | % Commuters |
| Less than 5 Minutes | 47 | 4.1% |
| 5 to 9 Minutes | 80 | 7.0% |
| 10 to 14 Minutes | 321 | 28.1% |
| 15 to 19 Minutes | 72 | 6.3% |
| 20 to 24 Minutes | 173 | 15.1% |
| 25 to 29 Minutes | 147 | 12.9% |
| 30 to 34 Minutes | 259 | 22.7% |
| 35 to 39 Minutes | 26 | 2.3% |
| 40 to 44 Minutes | 0 | 0.0% |
| 45 to 59 Minutes | 0 | 0.0% |
| 60 to 89 Minutes | 6 | 0.5% |
| 90 or more Minutes | 11 | 1.0% |
Commute Time by Sex in Daleville
The most common commute times in Daleville are 10 to 14 minutes (226 commuters, 35.9%) for males and 30 to 34 minutes (194 commuters, 37.9%) for females.
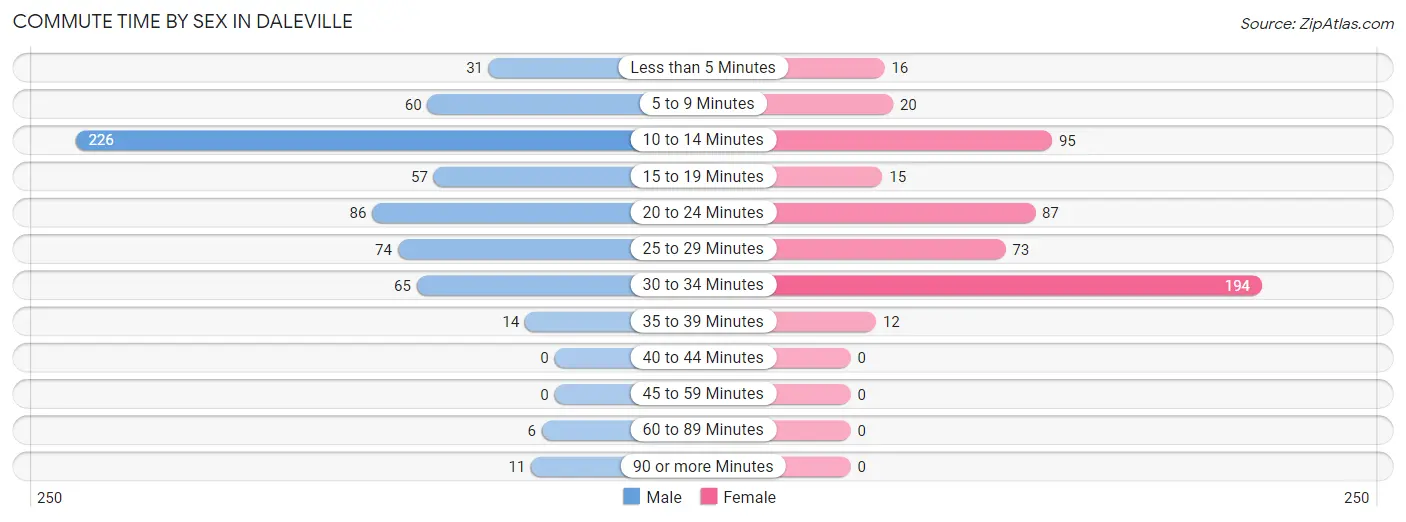
| Commute Time | Male | Female |
| Less than 5 Minutes | 31 (4.9%) | 16 (3.1%) |
| 5 to 9 Minutes | 60 (9.5%) | 20 (3.9%) |
| 10 to 14 Minutes | 226 (35.9%) | 95 (18.5%) |
| 15 to 19 Minutes | 57 (9.0%) | 15 (2.9%) |
| 20 to 24 Minutes | 86 (13.7%) | 87 (17.0%) |
| 25 to 29 Minutes | 74 (11.7%) | 73 (14.3%) |
| 30 to 34 Minutes | 65 (10.3%) | 194 (37.9%) |
| 35 to 39 Minutes | 14 (2.2%) | 12 (2.3%) |
| 40 to 44 Minutes | 0 (0.0%) | 0 (0.0%) |
| 45 to 59 Minutes | 0 (0.0%) | 0 (0.0%) |
| 60 to 89 Minutes | 6 (0.9%) | 0 (0.0%) |
| 90 or more Minutes | 11 (1.8%) | 0 (0.0%) |
Time of Departure to Work by Sex in Daleville
The most frequent times of departure to work in Daleville are 7:30 AM to 7:59 AM (209, 33.2%) for males and 7:30 AM to 7:59 AM (140, 27.3%) for females.
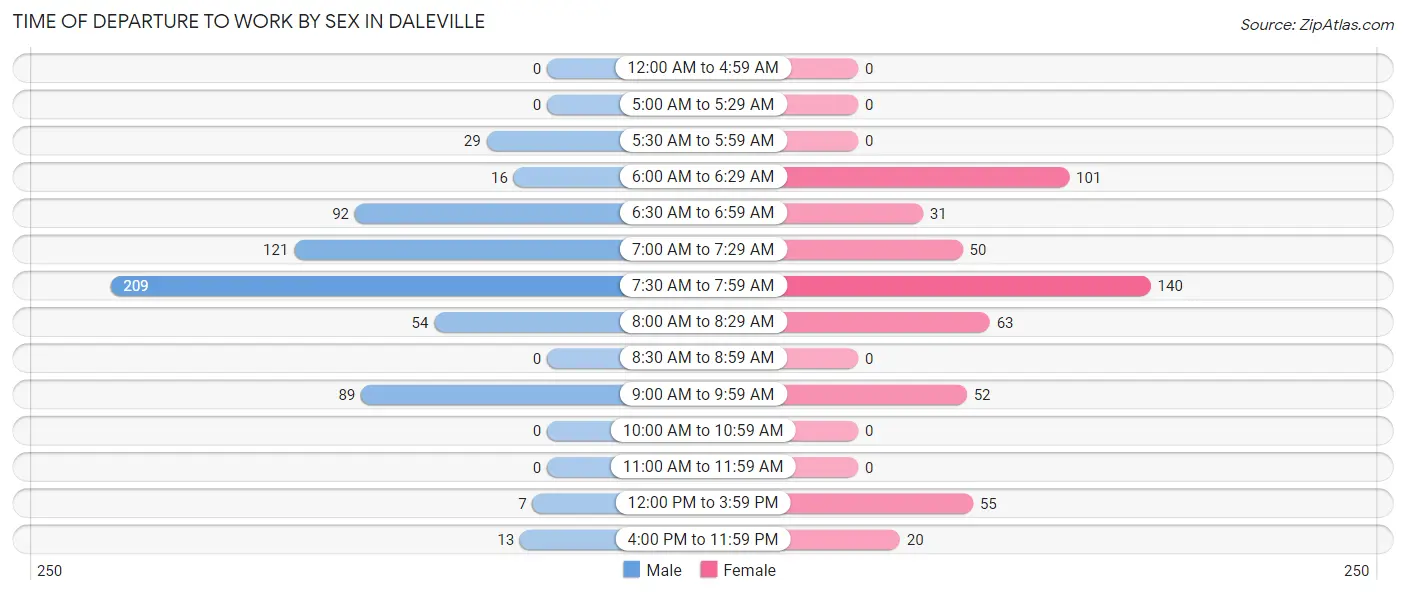
| Time of Departure | Male | Female |
| 12:00 AM to 4:59 AM | 0 (0.0%) | 0 (0.0%) |
| 5:00 AM to 5:29 AM | 0 (0.0%) | 0 (0.0%) |
| 5:30 AM to 5:59 AM | 29 (4.6%) | 0 (0.0%) |
| 6:00 AM to 6:29 AM | 16 (2.5%) | 101 (19.7%) |
| 6:30 AM to 6:59 AM | 92 (14.6%) | 31 (6.0%) |
| 7:00 AM to 7:29 AM | 121 (19.2%) | 50 (9.8%) |
| 7:30 AM to 7:59 AM | 209 (33.2%) | 140 (27.3%) |
| 8:00 AM to 8:29 AM | 54 (8.6%) | 63 (12.3%) |
| 8:30 AM to 8:59 AM | 0 (0.0%) | 0 (0.0%) |
| 9:00 AM to 9:59 AM | 89 (14.1%) | 52 (10.2%) |
| 10:00 AM to 10:59 AM | 0 (0.0%) | 0 (0.0%) |
| 11:00 AM to 11:59 AM | 0 (0.0%) | 0 (0.0%) |
| 12:00 PM to 3:59 PM | 7 (1.1%) | 55 (10.7%) |
| 4:00 PM to 11:59 PM | 13 (2.1%) | 20 (3.9%) |
| Total | 630 (100.0%) | 512 (100.0%) |
Housing Occupancy in Daleville
Occupancy by Ownership in Daleville
Of the total 1,192 dwellings in Daleville, owner-occupied units account for 990 (83.1%), while renter-occupied units make up 202 (17.0%).
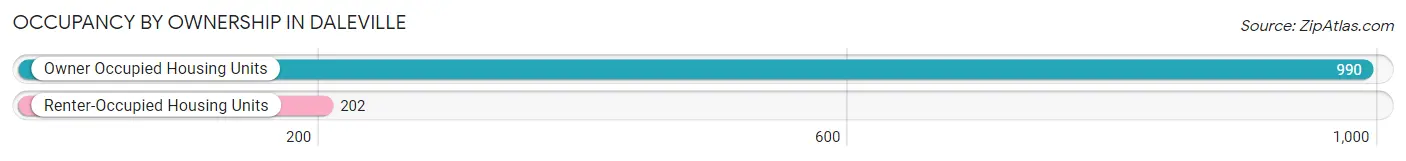
| Occupancy | # Housing Units | % Housing Units |
| Owner Occupied Housing Units | 990 | 83.1% |
| Renter-Occupied Housing Units | 202 | 17.0% |
| Total Occupied Housing Units | 1,192 | 100.0% |
Occupancy by Household Size in Daleville
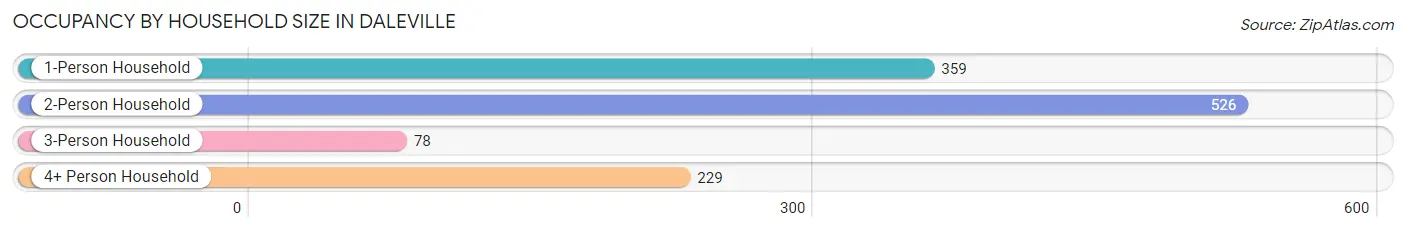
| Household Size | # Housing Units | % Housing Units |
| 1-Person Household | 359 | 30.1% |
| 2-Person Household | 526 | 44.1% |
| 3-Person Household | 78 | 6.5% |
| 4+ Person Household | 229 | 19.2% |
| Total Housing Units | 1,192 | 100.0% |
Occupancy by Ownership by Household Size in Daleville
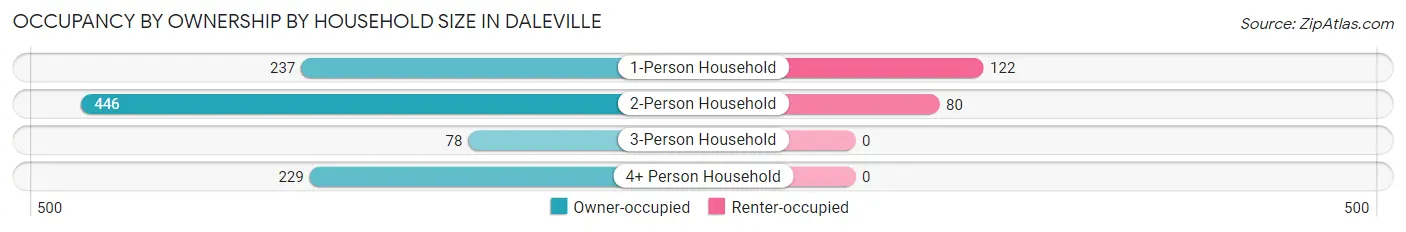
| Household Size | Owner-occupied | Renter-occupied |
| 1-Person Household | 237 (66.0%) | 122 (34.0%) |
| 2-Person Household | 446 (84.8%) | 80 (15.2%) |
| 3-Person Household | 78 (100.0%) | 0 (0.0%) |
| 4+ Person Household | 229 (100.0%) | 0 (0.0%) |
| Total Housing Units | 990 (83.1%) | 202 (17.0%) |
Occupancy by Educational Attainment in Daleville
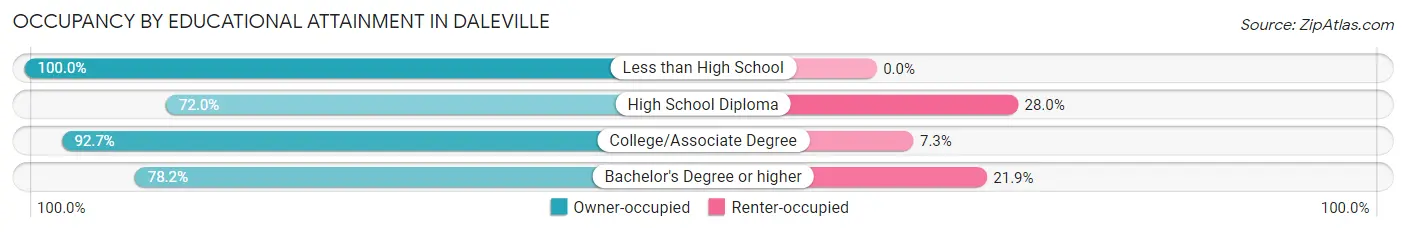
| Household Size | Owner-occupied | Renter-occupied |
| Less than High School | 57 (100.0%) | 0 (0.0%) |
| High School Diploma | 113 (72.0%) | 44 (28.0%) |
| College/Associate Degree | 355 (92.7%) | 28 (7.3%) |
| Bachelor's Degree or higher | 465 (78.1%) | 130 (21.8%) |
Occupancy by Age of Householder in Daleville
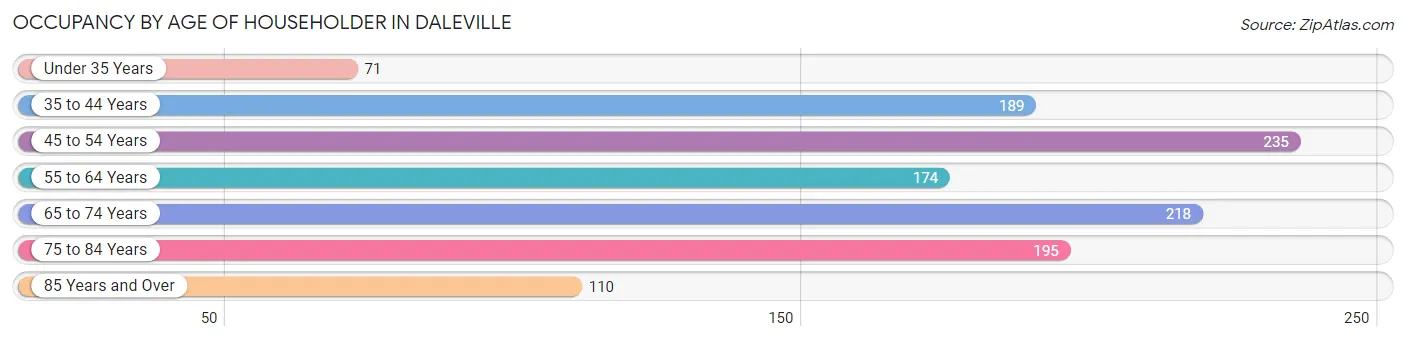
| Age Bracket | # Households | % Households |
| Under 35 Years | 71 | 6.0% |
| 35 to 44 Years | 189 | 15.9% |
| 45 to 54 Years | 235 | 19.7% |
| 55 to 64 Years | 174 | 14.6% |
| 65 to 74 Years | 218 | 18.3% |
| 75 to 84 Years | 195 | 16.4% |
| 85 Years and Over | 110 | 9.2% |
| Total | 1,192 | 100.0% |
Housing Finances in Daleville
Median Income by Occupancy in Daleville
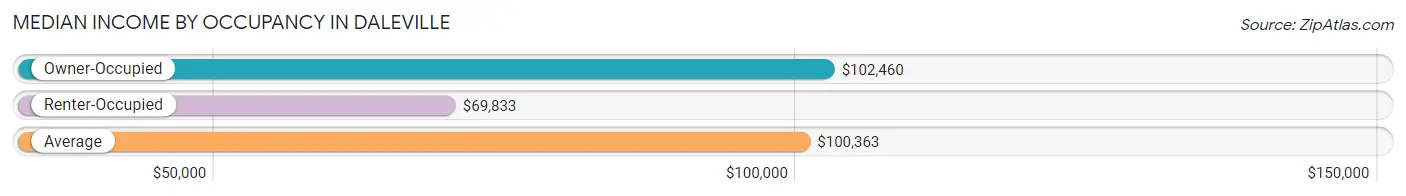
| Occupancy Type | # Households | Median Income |
| Owner-Occupied | 990 (83.1%) | $102,460 |
| Renter-Occupied | 202 (17.0%) | $69,833 |
| Average | 1,192 (100.0%) | $100,363 |
Occupancy by Householder Income Bracket in Daleville
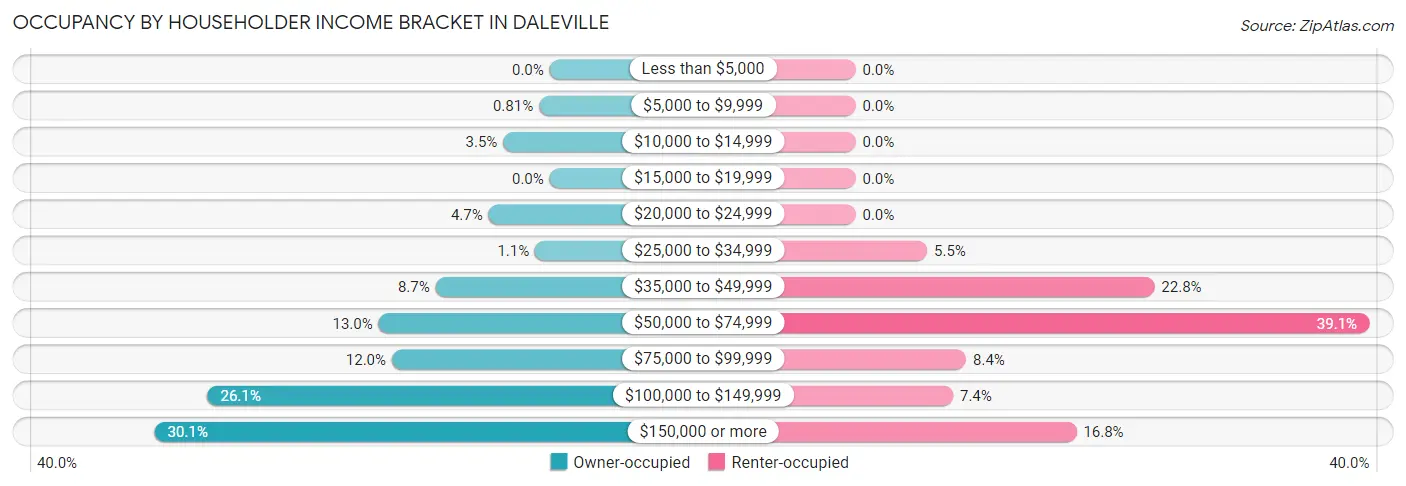
| Income Bracket | Owner-occupied | Renter-occupied |
| Less than $5,000 | 0 (0.0%) | 0 (0.0%) |
| $5,000 to $9,999 | 8 (0.8%) | 0 (0.0%) |
| $10,000 to $14,999 | 35 (3.5%) | 0 (0.0%) |
| $15,000 to $19,999 | 0 (0.0%) | 0 (0.0%) |
| $20,000 to $24,999 | 46 (4.6%) | 0 (0.0%) |
| $25,000 to $34,999 | 11 (1.1%) | 11 (5.4%) |
| $35,000 to $49,999 | 86 (8.7%) | 46 (22.8%) |
| $50,000 to $74,999 | 129 (13.0%) | 79 (39.1%) |
| $75,000 to $99,999 | 119 (12.0%) | 17 (8.4%) |
| $100,000 to $149,999 | 258 (26.1%) | 15 (7.4%) |
| $150,000 or more | 298 (30.1%) | 34 (16.8%) |
| Total | 990 (100.0%) | 202 (100.0%) |
Monthly Housing Cost Tiers in Daleville
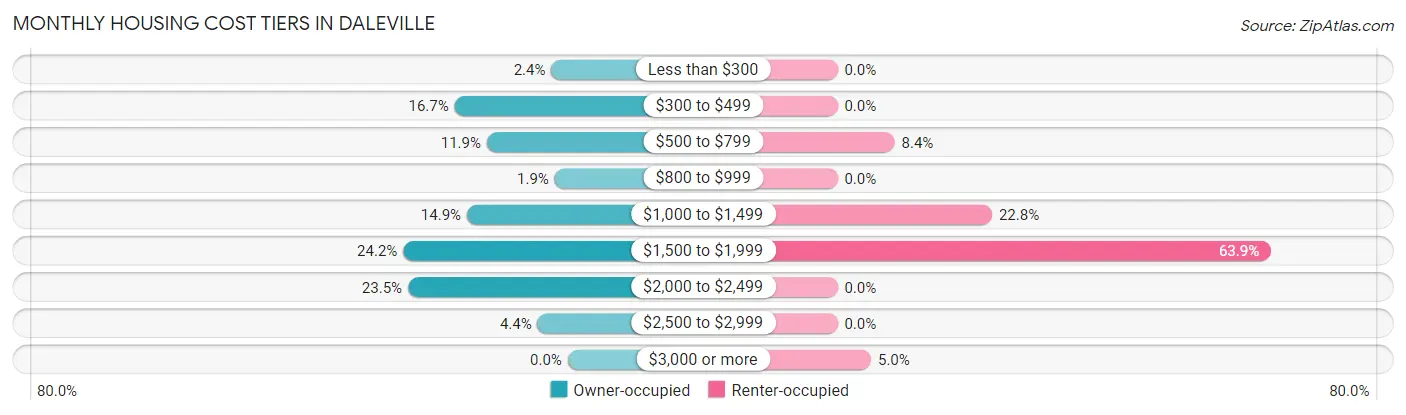
| Monthly Cost | Owner-occupied | Renter-occupied |
| Less than $300 | 24 (2.4%) | 0 (0.0%) |
| $300 to $499 | 165 (16.7%) | 0 (0.0%) |
| $500 to $799 | 118 (11.9%) | 17 (8.4%) |
| $800 to $999 | 19 (1.9%) | 0 (0.0%) |
| $1,000 to $1,499 | 147 (14.8%) | 46 (22.8%) |
| $1,500 to $1,999 | 240 (24.2%) | 129 (63.9%) |
| $2,000 to $2,499 | 233 (23.5%) | 0 (0.0%) |
| $2,500 to $2,999 | 44 (4.4%) | 0 (0.0%) |
| $3,000 or more | 0 (0.0%) | 10 (5.0%) |
| Total | 990 (100.0%) | 202 (100.0%) |
Physical Housing Characteristics in Daleville
Housing Structures in Daleville
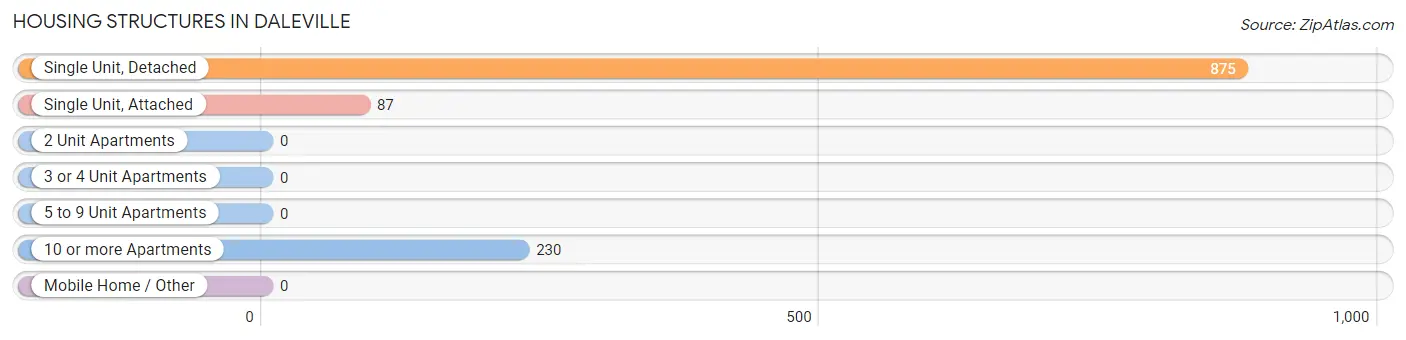
| Structure Type | # Housing Units | % Housing Units |
| Single Unit, Detached | 875 | 73.4% |
| Single Unit, Attached | 87 | 7.3% |
| 2 Unit Apartments | 0 | 0.0% |
| 3 or 4 Unit Apartments | 0 | 0.0% |
| 5 to 9 Unit Apartments | 0 | 0.0% |
| 10 or more Apartments | 230 | 19.3% |
| Mobile Home / Other | 0 | 0.0% |
| Total | 1,192 | 100.0% |
Housing Structures by Occupancy in Daleville
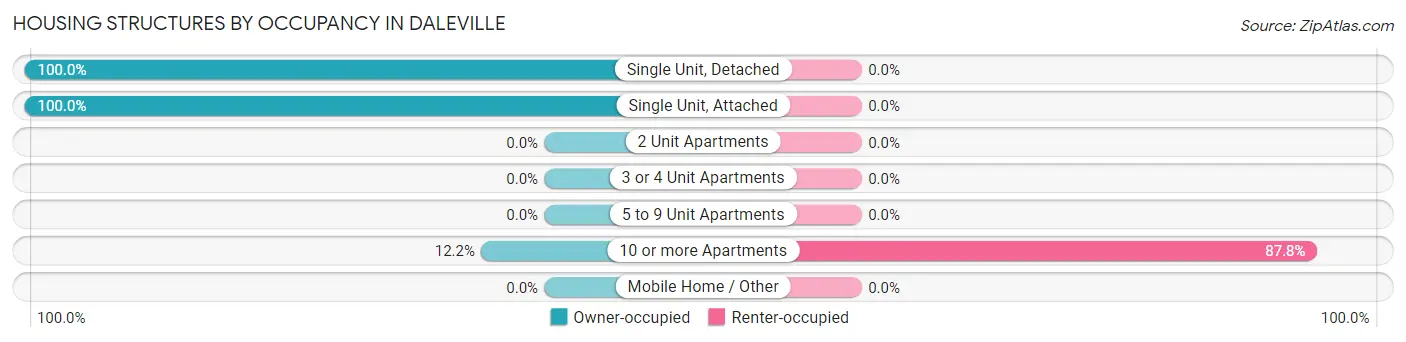
| Structure Type | Owner-occupied | Renter-occupied |
| Single Unit, Detached | 875 (100.0%) | 0 (0.0%) |
| Single Unit, Attached | 87 (100.0%) | 0 (0.0%) |
| 2 Unit Apartments | 0 (0.0%) | 0 (0.0%) |
| 3 or 4 Unit Apartments | 0 (0.0%) | 0 (0.0%) |
| 5 to 9 Unit Apartments | 0 (0.0%) | 0 (0.0%) |
| 10 or more Apartments | 28 (12.2%) | 202 (87.8%) |
| Mobile Home / Other | 0 (0.0%) | 0 (0.0%) |
| Total | 990 (83.1%) | 202 (17.0%) |
Housing Structures by Number of Rooms in Daleville
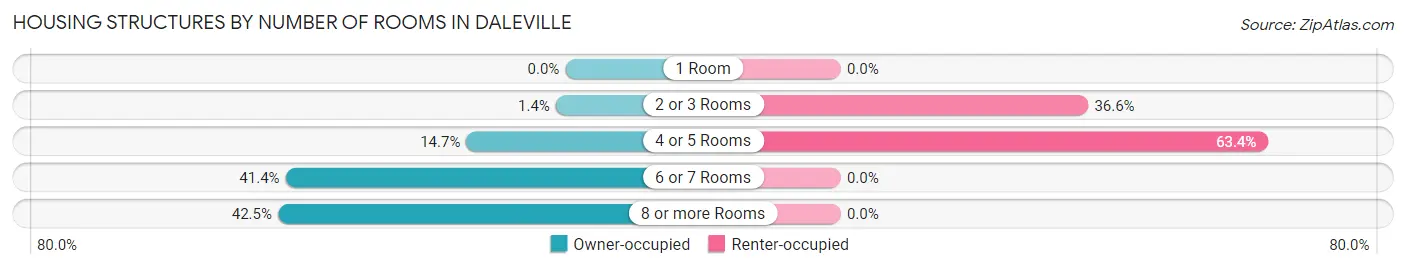
| Number of Rooms | Owner-occupied | Renter-occupied |
| 1 Room | 0 (0.0%) | 0 (0.0%) |
| 2 or 3 Rooms | 14 (1.4%) | 74 (36.6%) |
| 4 or 5 Rooms | 145 (14.6%) | 128 (63.4%) |
| 6 or 7 Rooms | 410 (41.4%) | 0 (0.0%) |
| 8 or more Rooms | 421 (42.5%) | 0 (0.0%) |
| Total | 990 (100.0%) | 202 (100.0%) |
Housing Structure by Heating Type in Daleville
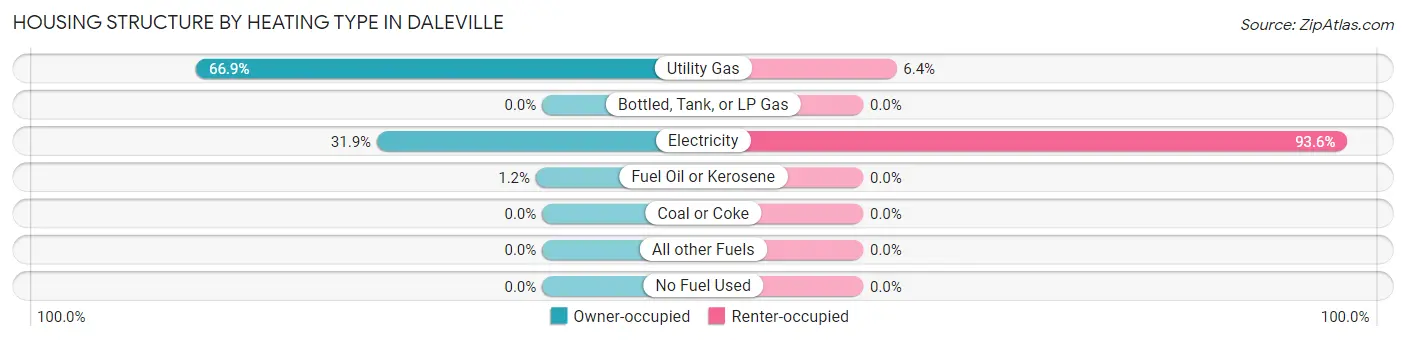
| Heating Type | Owner-occupied | Renter-occupied |
| Utility Gas | 662 (66.9%) | 13 (6.4%) |
| Bottled, Tank, or LP Gas | 0 (0.0%) | 0 (0.0%) |
| Electricity | 316 (31.9%) | 189 (93.6%) |
| Fuel Oil or Kerosene | 12 (1.2%) | 0 (0.0%) |
| Coal or Coke | 0 (0.0%) | 0 (0.0%) |
| All other Fuels | 0 (0.0%) | 0 (0.0%) |
| No Fuel Used | 0 (0.0%) | 0 (0.0%) |
| Total | 990 (100.0%) | 202 (100.0%) |
Household Vehicle Usage in Daleville
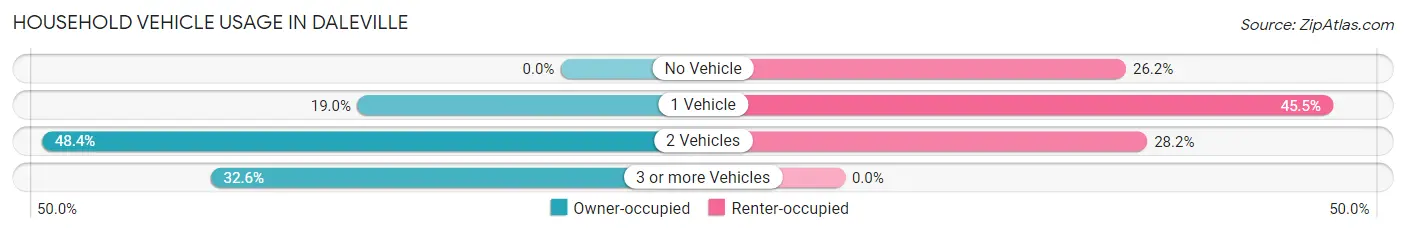
| Vehicles per Household | Owner-occupied | Renter-occupied |
| No Vehicle | 0 (0.0%) | 53 (26.2%) |
| 1 Vehicle | 188 (19.0%) | 92 (45.5%) |
| 2 Vehicles | 479 (48.4%) | 57 (28.2%) |
| 3 or more Vehicles | 323 (32.6%) | 0 (0.0%) |
| Total | 990 (100.0%) | 202 (100.0%) |
Real Estate & Mortgages in Daleville
Real Estate and Mortgage Overview in Daleville
| Characteristic | Without Mortgage | With Mortgage |
| Housing Units | 323 | 667 |
| Median Property Value | $291,700 | $370,300 |
| Median Household Income | $105,458 | $231 |
| Monthly Housing Costs | $477 | $0 |
| Real Estate Taxes | $1,906 | $17 |
Property Value by Mortgage Status in Daleville
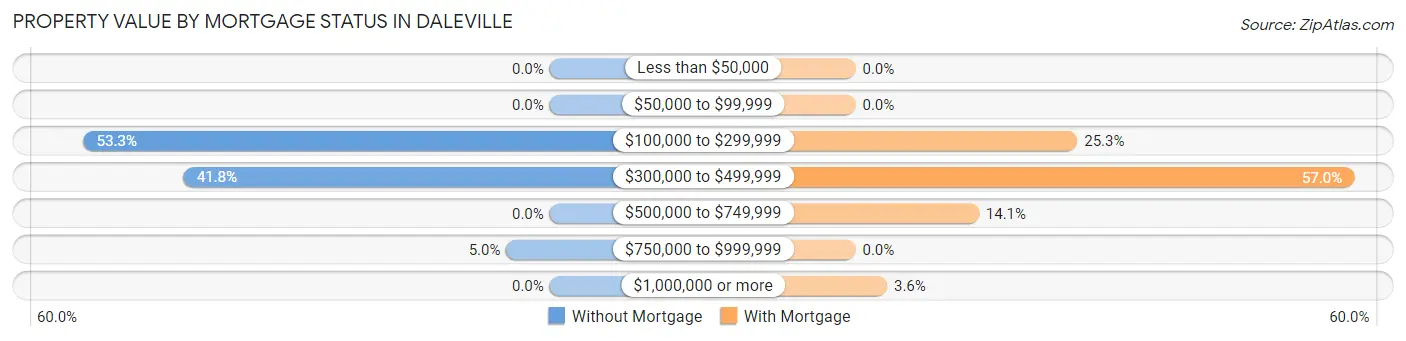
| Property Value | Without Mortgage | With Mortgage |
| Less than $50,000 | 0 (0.0%) | 0 (0.0%) |
| $50,000 to $99,999 | 0 (0.0%) | 0 (0.0%) |
| $100,000 to $299,999 | 172 (53.2%) | 169 (25.3%) |
| $300,000 to $499,999 | 135 (41.8%) | 380 (57.0%) |
| $500,000 to $749,999 | 0 (0.0%) | 94 (14.1%) |
| $750,000 to $999,999 | 16 (5.0%) | 0 (0.0%) |
| $1,000,000 or more | 0 (0.0%) | 24 (3.6%) |
| Total | 323 (100.0%) | 667 (100.0%) |
Household Income by Mortgage Status in Daleville
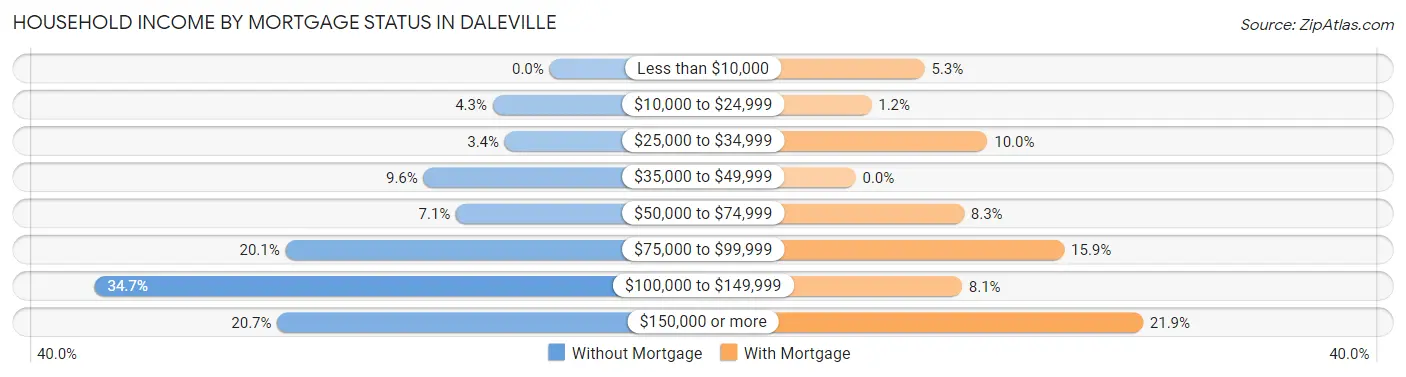
| Household Income | Without Mortgage | With Mortgage |
| Less than $10,000 | 0 (0.0%) | 35 (5.2%) |
| $10,000 to $24,999 | 14 (4.3%) | 8 (1.2%) |
| $25,000 to $34,999 | 11 (3.4%) | 67 (10.0%) |
| $35,000 to $49,999 | 31 (9.6%) | 0 (0.0%) |
| $50,000 to $74,999 | 23 (7.1%) | 55 (8.3%) |
| $75,000 to $99,999 | 65 (20.1%) | 106 (15.9%) |
| $100,000 to $149,999 | 112 (34.7%) | 54 (8.1%) |
| $150,000 or more | 67 (20.7%) | 146 (21.9%) |
| Total | 323 (100.0%) | 667 (100.0%) |
Property Value to Household Income Ratio in Daleville
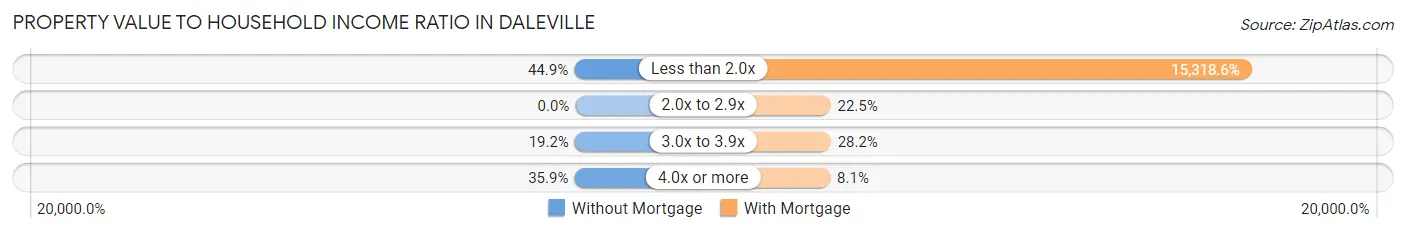
| Value-to-Income Ratio | Without Mortgage | With Mortgage |
| Less than 2.0x | 145 (44.9%) | 102,175 (15,318.6%) |
| 2.0x to 2.9x | 0 (0.0%) | 150 (22.5%) |
| 3.0x to 3.9x | 62 (19.2%) | 188 (28.2%) |
| 4.0x or more | 116 (35.9%) | 54 (8.1%) |
| Total | 323 (100.0%) | 667 (100.0%) |
Real Estate Taxes by Mortgage Status in Daleville
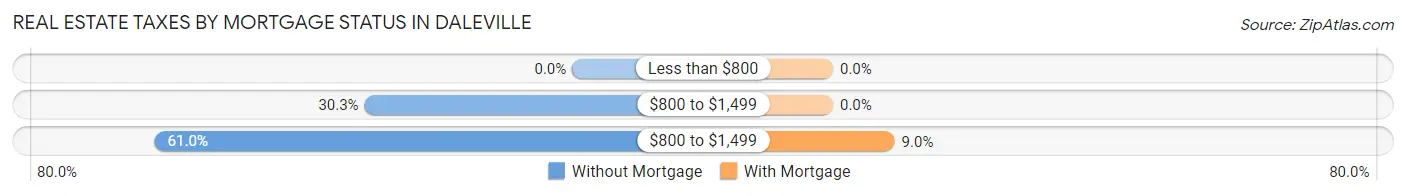
| Property Taxes | Without Mortgage | With Mortgage |
| Less than $800 | 0 (0.0%) | 0 (0.0%) |
| $800 to $1,499 | 98 (30.3%) | 0 (0.0%) |
| $800 to $1,499 | 197 (61.0%) | 60 (9.0%) |
| Total | 323 (100.0%) | 667 (100.0%) |
Health & Disability in Daleville
Health Insurance Coverage by Age in Daleville
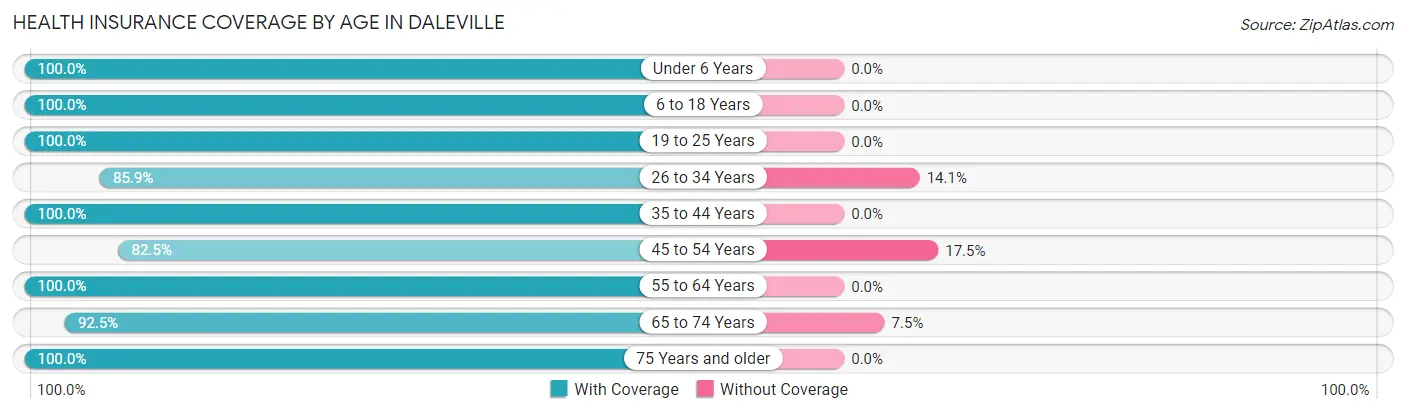
| Age Bracket | With Coverage | Without Coverage |
| Under 6 Years | 119 (100.0%) | 0 (0.0%) |
| 6 to 18 Years | 488 (100.0%) | 0 (0.0%) |
| 19 to 25 Years | 83 (100.0%) | 0 (0.0%) |
| 26 to 34 Years | 336 (85.9%) | 55 (14.1%) |
| 35 to 44 Years | 286 (100.0%) | 0 (0.0%) |
| 45 to 54 Years | 320 (82.5%) | 68 (17.5%) |
| 55 to 64 Years | 392 (100.0%) | 0 (0.0%) |
| 65 to 74 Years | 356 (92.5%) | 29 (7.5%) |
| 75 Years and older | 456 (100.0%) | 0 (0.0%) |
| Total | 2,836 (94.9%) | 152 (5.1%) |
Health Insurance Coverage by Citizenship Status in Daleville
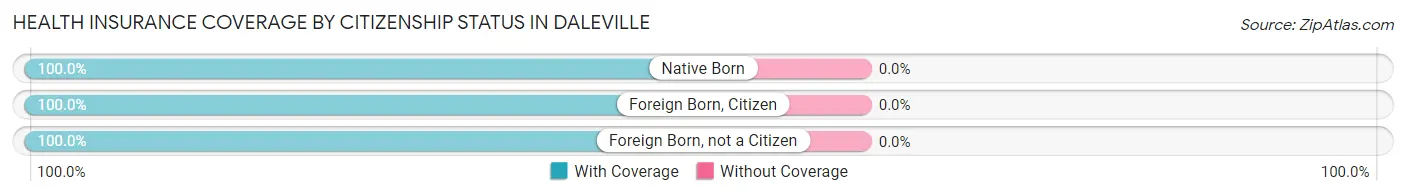
| Citizenship Status | With Coverage | Without Coverage |
| Native Born | 119 (100.0%) | 0 (0.0%) |
| Foreign Born, Citizen | 488 (100.0%) | 0 (0.0%) |
| Foreign Born, not a Citizen | 83 (100.0%) | 0 (0.0%) |
Health Insurance Coverage by Household Income in Daleville
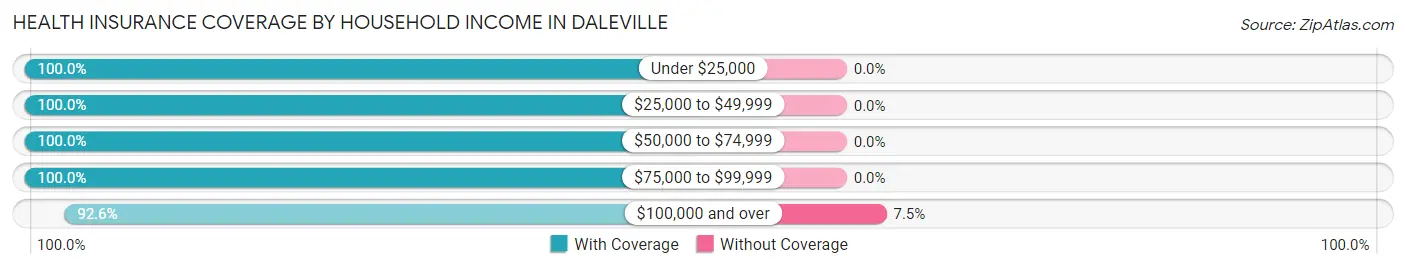
| Household Income | With Coverage | Without Coverage |
| Under $25,000 | 141 (100.0%) | 0 (0.0%) |
| $25,000 to $49,999 | 240 (100.0%) | 0 (0.0%) |
| $50,000 to $74,999 | 338 (100.0%) | 0 (0.0%) |
| $75,000 to $99,999 | 228 (100.0%) | 0 (0.0%) |
| $100,000 and over | 1,889 (92.5%) | 152 (7.4%) |
Public vs Private Health Insurance Coverage by Age in Daleville
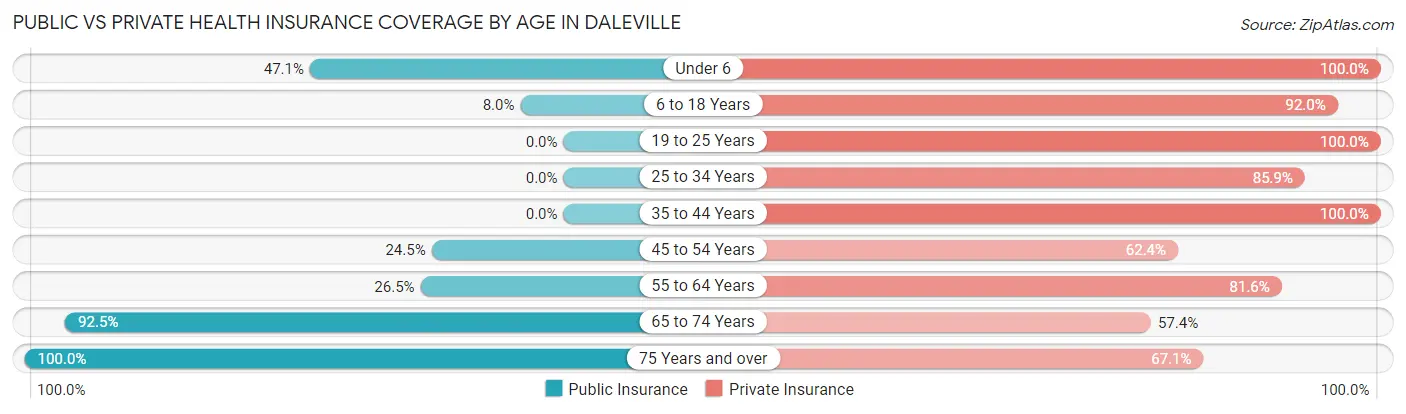
| Age Bracket | Public Insurance | Private Insurance |
| Under 6 | 56 (47.1%) | 119 (100.0%) |
| 6 to 18 Years | 39 (8.0%) | 449 (92.0%) |
| 19 to 25 Years | 0 (0.0%) | 83 (100.0%) |
| 25 to 34 Years | 0 (0.0%) | 336 (85.9%) |
| 35 to 44 Years | 0 (0.0%) | 286 (100.0%) |
| 45 to 54 Years | 95 (24.5%) | 242 (62.4%) |
| 55 to 64 Years | 104 (26.5%) | 320 (81.6%) |
| 65 to 74 Years | 356 (92.5%) | 221 (57.4%) |
| 75 Years and over | 456 (100.0%) | 306 (67.1%) |
| Total | 1,106 (37.0%) | 2,362 (79.0%) |
Disability Status by Sex by Age in Daleville
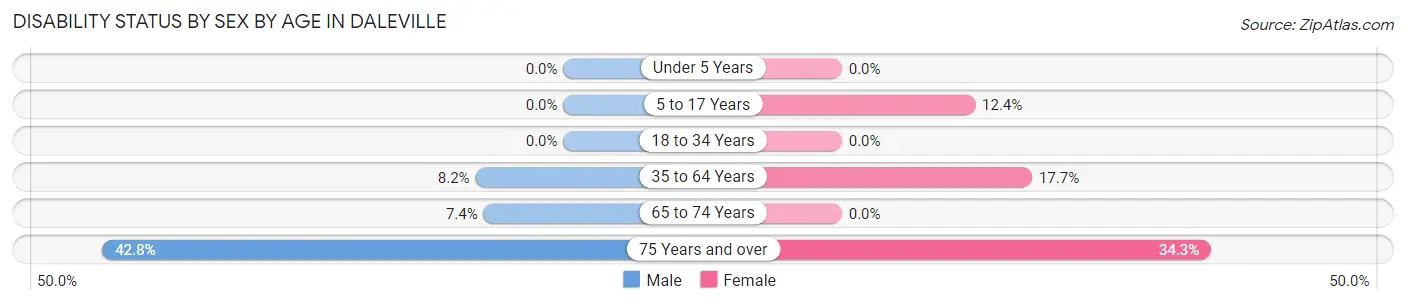
| Age Bracket | Male | Female |
| Under 5 Years | 0 (0.0%) | 0 (0.0%) |
| 5 to 17 Years | 0 (0.0%) | 23 (12.4%) |
| 18 to 34 Years | 0 (0.0%) | 0 (0.0%) |
| 35 to 64 Years | 44 (8.2%) | 93 (17.6%) |
| 65 to 74 Years | 14 (7.4%) | 0 (0.0%) |
| 75 Years and over | 89 (42.8%) | 85 (34.3%) |
Disability Class by Sex by Age in Daleville
Disability Class: Hearing Difficulty
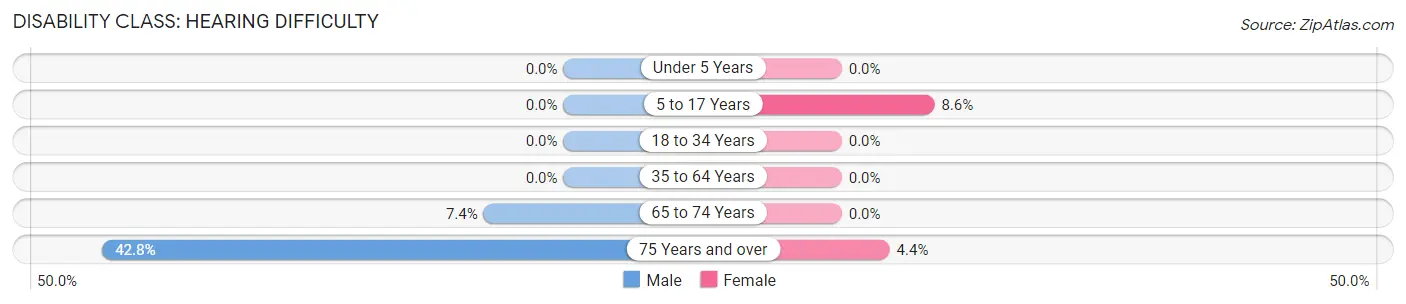
| Age Bracket | Male | Female |
| Under 5 Years | 0 (0.0%) | 0 (0.0%) |
| 5 to 17 Years | 0 (0.0%) | 16 (8.6%) |
| 18 to 34 Years | 0 (0.0%) | 0 (0.0%) |
| 35 to 64 Years | 0 (0.0%) | 0 (0.0%) |
| 65 to 74 Years | 14 (7.4%) | 0 (0.0%) |
| 75 Years and over | 89 (42.8%) | 11 (4.4%) |
Disability Class: Vision Difficulty
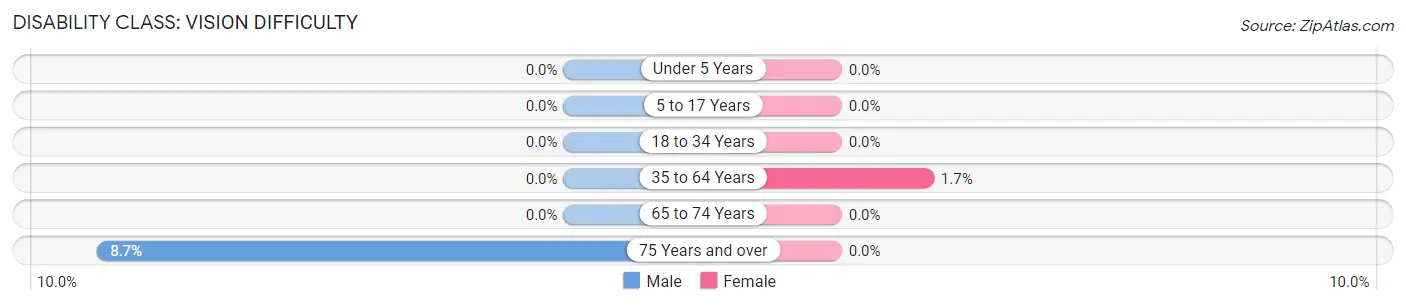
| Age Bracket | Male | Female |
| Under 5 Years | 0 (0.0%) | 0 (0.0%) |
| 5 to 17 Years | 0 (0.0%) | 0 (0.0%) |
| 18 to 34 Years | 0 (0.0%) | 0 (0.0%) |
| 35 to 64 Years | 0 (0.0%) | 9 (1.7%) |
| 65 to 74 Years | 0 (0.0%) | 0 (0.0%) |
| 75 Years and over | 18 (8.6%) | 0 (0.0%) |
Disability Class: Cognitive Difficulty
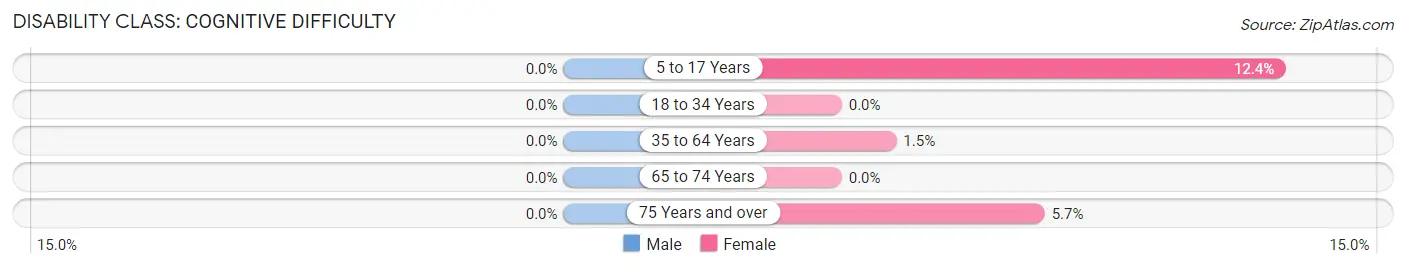
| Age Bracket | Male | Female |
| 5 to 17 Years | 0 (0.0%) | 23 (12.4%) |
| 18 to 34 Years | 0 (0.0%) | 0 (0.0%) |
| 35 to 64 Years | 0 (0.0%) | 8 (1.5%) |
| 65 to 74 Years | 0 (0.0%) | 0 (0.0%) |
| 75 Years and over | 0 (0.0%) | 14 (5.7%) |
Disability Class: Ambulatory Difficulty
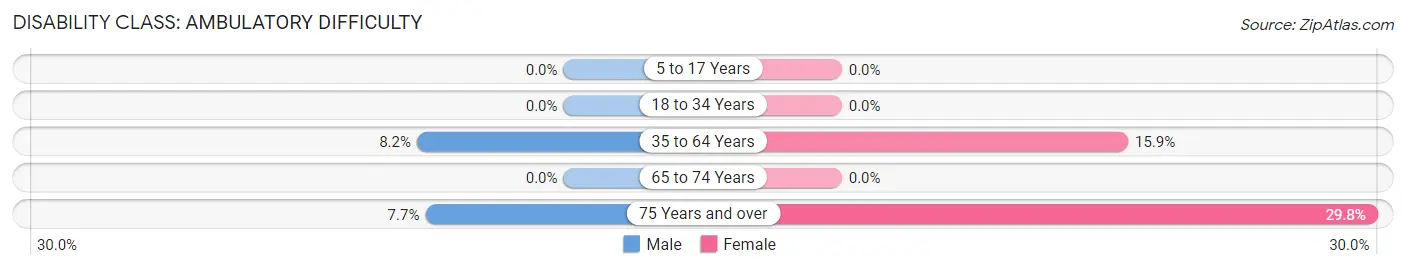
| Age Bracket | Male | Female |
| 5 to 17 Years | 0 (0.0%) | 0 (0.0%) |
| 18 to 34 Years | 0 (0.0%) | 0 (0.0%) |
| 35 to 64 Years | 44 (8.2%) | 84 (15.9%) |
| 65 to 74 Years | 0 (0.0%) | 0 (0.0%) |
| 75 Years and over | 16 (7.7%) | 74 (29.8%) |
Disability Class: Self-Care Difficulty
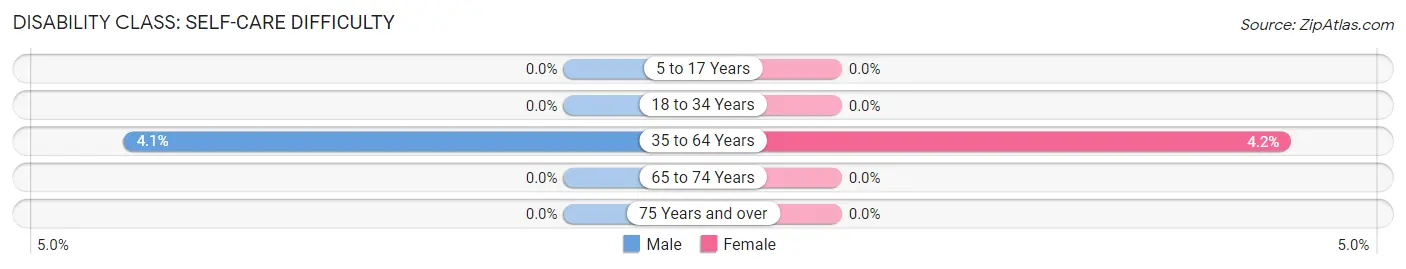
| Age Bracket | Male | Female |
| 5 to 17 Years | 0 (0.0%) | 0 (0.0%) |
| 18 to 34 Years | 0 (0.0%) | 0 (0.0%) |
| 35 to 64 Years | 22 (4.1%) | 22 (4.2%) |
| 65 to 74 Years | 0 (0.0%) | 0 (0.0%) |
| 75 Years and over | 0 (0.0%) | 0 (0.0%) |
Technology Access in Daleville
Computing Device Access in Daleville
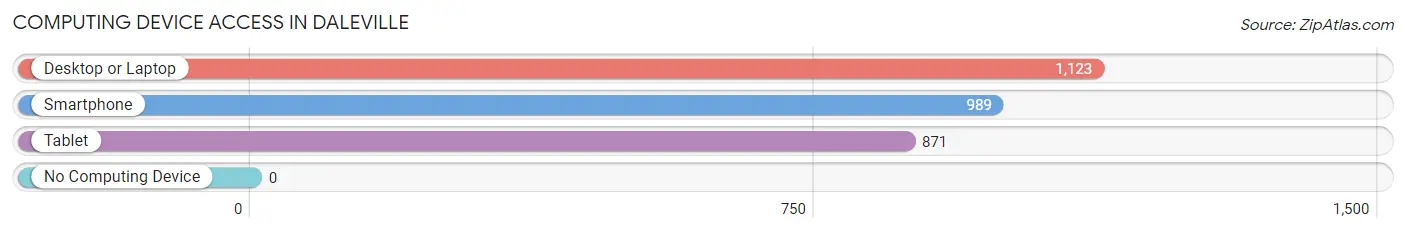
| Device Type | # Households | % Households |
| Desktop or Laptop | 1,123 | 94.2% |
| Smartphone | 989 | 83.0% |
| Tablet | 871 | 73.1% |
| No Computing Device | 0 | 0.0% |
| Total | 1,192 | 100.0% |
Internet Access in Daleville
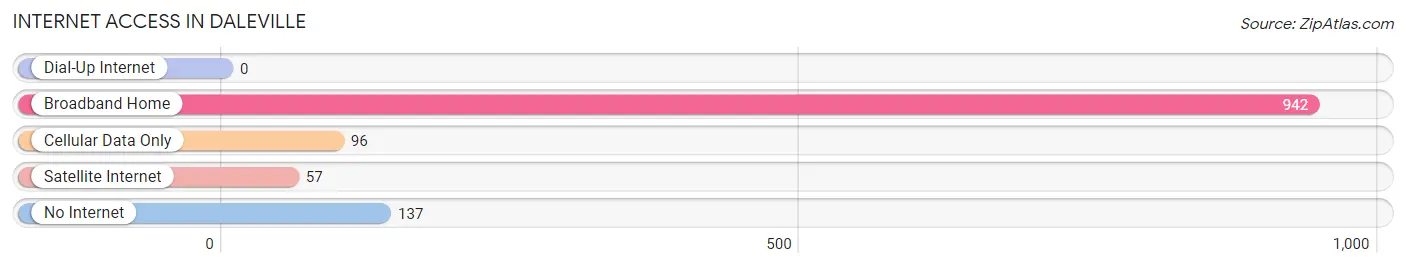
| Internet Type | # Households | % Households |
| Dial-Up Internet | 0 | 0.0% |
| Broadband Home | 942 | 79.0% |
| Cellular Data Only | 96 | 8.1% |
| Satellite Internet | 57 | 4.8% |
| No Internet | 137 | 11.5% |
| Total | 1,192 | 100.0% |
Daleville Summary
Daleville is a small town located in Botetourt County, Virginia. It is situated in the Roanoke Valley, approximately 10 miles east of Roanoke and 15 miles west of Lynchburg. The town was established in 1848 and has a population of approximately 2,000 people.
History
Daleville was founded in 1848 by William Dale, a local landowner. The town was named after him and was originally known as “Dale’s Town”. The town was incorporated in 1872 and was the first town in Botetourt County to be incorporated.
The town was originally a farming community, but in the late 19th century, the railroad came to Daleville and the town began to grow. The railroad brought new businesses and industries to the area, including a sawmill, a gristmill, and a brickyard.
In the early 20th century, Daleville was a thriving community with a variety of businesses, including a bank, a hotel, a movie theater, and a variety of stores. The town also had a school, a post office, and a library.
In the 1950s, Daleville began to decline as the railroad industry declined and businesses began to move away. The town was hit hard by the Great Depression and many of the businesses closed.
In the late 20th century, Daleville began to experience a resurgence. The town was revitalized with the construction of a new shopping center and the opening of a new hospital. The town also began to attract new businesses, including a variety of restaurants and retail stores.
Geography
Daleville is located in the Roanoke Valley in the foothills of the Blue Ridge Mountains. The town is situated at an elevation of 1,400 feet and is surrounded by rolling hills and forests. The town is located approximately 10 miles east of Roanoke and 15 miles west of Lynchburg.
The town is located in the Roanoke River watershed and is bordered by the James River to the east and the Maury River to the west. The town is also located near the Appalachian Trail and is a popular destination for hikers and outdoor enthusiasts.
Economy
Daleville’s economy is largely based on tourism and retail. The town is home to a variety of restaurants, shops, and other businesses. The town is also home to a number of manufacturing companies, including a furniture manufacturer and a plastics manufacturer.
The town is also home to a number of government and military facilities, including the Botetourt County Courthouse, the Botetourt County Sheriff’s Office, and the National Guard Armory.
Demographics
As of the 2010 census, Daleville had a population of 2,000 people. The town is predominantly white (94.2%) and the median household income is $45,000. The town has a low unemployment rate (3.2%) and a high rate of homeownership (83.3%).
Conclusion
Daleville is a small town located in Botetourt County, Virginia. The town was founded in 1848 and has a population of approximately 2,000 people. The town is situated in the Roanoke Valley and is surrounded by rolling hills and forests. The town’s economy is largely based on tourism and retail and the town is home to a variety of government and military facilities. The town is predominantly white and the median household income is $45,000.
Common Questions
What is Per Capita Income in Daleville?
Per Capita income in Daleville is $47,558.
What is the Median Family Income in Daleville?
Median Family Income in Daleville is $120,714.
What is the Median Household income in Daleville?
Median Household Income in Daleville is $100,363.
What is Income or Wage Gap in Daleville?
Income or Wage Gap in Daleville is 39.6%.
Women in Daleville earn 60.4 cents for every dollar earned by a man.
What is Inequality or Gini Index in Daleville?
Inequality or Gini Index in Daleville is 0.38.
What is the Total Population of Daleville?
Total Population of Daleville is 3,169.
What is the Total Male Population of Daleville?
Total Male Population of Daleville is 1,614.
What is the Total Female Population of Daleville?
Total Female Population of Daleville is 1,555.
What is the Ratio of Males per 100 Females in Daleville?
There are 103.79 Males per 100 Females in Daleville.
What is the Ratio of Females per 100 Males in Daleville?
There are 96.34 Females per 100 Males in Daleville.
What is the Median Population Age in Daleville?
Median Population Age in Daleville is 51.7 Years.
What is the Average Family Size in Daleville
Average Family Size in Daleville is 3.2 People.
What is the Average Household Size in Daleville
Average Household Size in Daleville is 2.5 People.
How Large is the Labor Force in Daleville?
There are 1,369 People in the Labor Forcein in Daleville.
What is the Percentage of People in the Labor Force in Daleville?
49.6% of People are in the Labor Force in Daleville.
What is the Unemployment Rate in Daleville?
Unemployment Rate in Daleville is 8.5%.