St Charles, VA Map & Demographics
St Charles Map
St Charles Overview
$16,305
PER CAPITA INCOME
$18,750
AVG HOUSEHOLD INCOME
0.46
INEQUALITY / GINI INDEX
64
TOTAL POPULATION
38
MALE POPULATION
26
FEMALE POPULATION
146.15
MALES / 100 FEMALES
68.42
FEMALES / 100 MALES
50.9
MEDIAN AGE
4.6
AVG FAMILY SIZE
2.3
AVG HOUSEHOLD SIZE
9
LABOR FORCE [ PEOPLE ]
14.5%
PERCENT IN LABOR FORCE
22.2%
UNEMPLOYMENT RATE
Income in St Charles
Income Overview in St Charles
| Characteristic | Number | Measure |
| Per Capita Income | 64 | $16,305 |
| Median Family Income | 10 | $0 |
| Mean Family Income | 10 | $49,310 |
| Median Household Income | 28 | $18,750 |
| Mean Household Income | 28 | $27,550 |
| Income Deficit | 10 | $0 |
| Wage / Income Gap (%) | 64 | 0.00% |
| Wage / Income Gap ($) | 64 | 100.00¢ per $1 |
| Gini / Inequality Index | 64 | 0.46 |
Earnings by Sex in St Charles
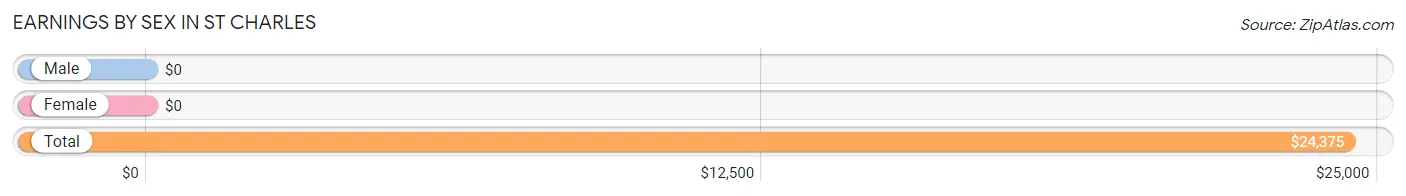
| Sex | Number | Average Earnings |
| Male | 8 (72.7%) | $0 |
| Female | 3 (27.3%) | $0 |
| Total | 11 (100.0%) | $24,375 |
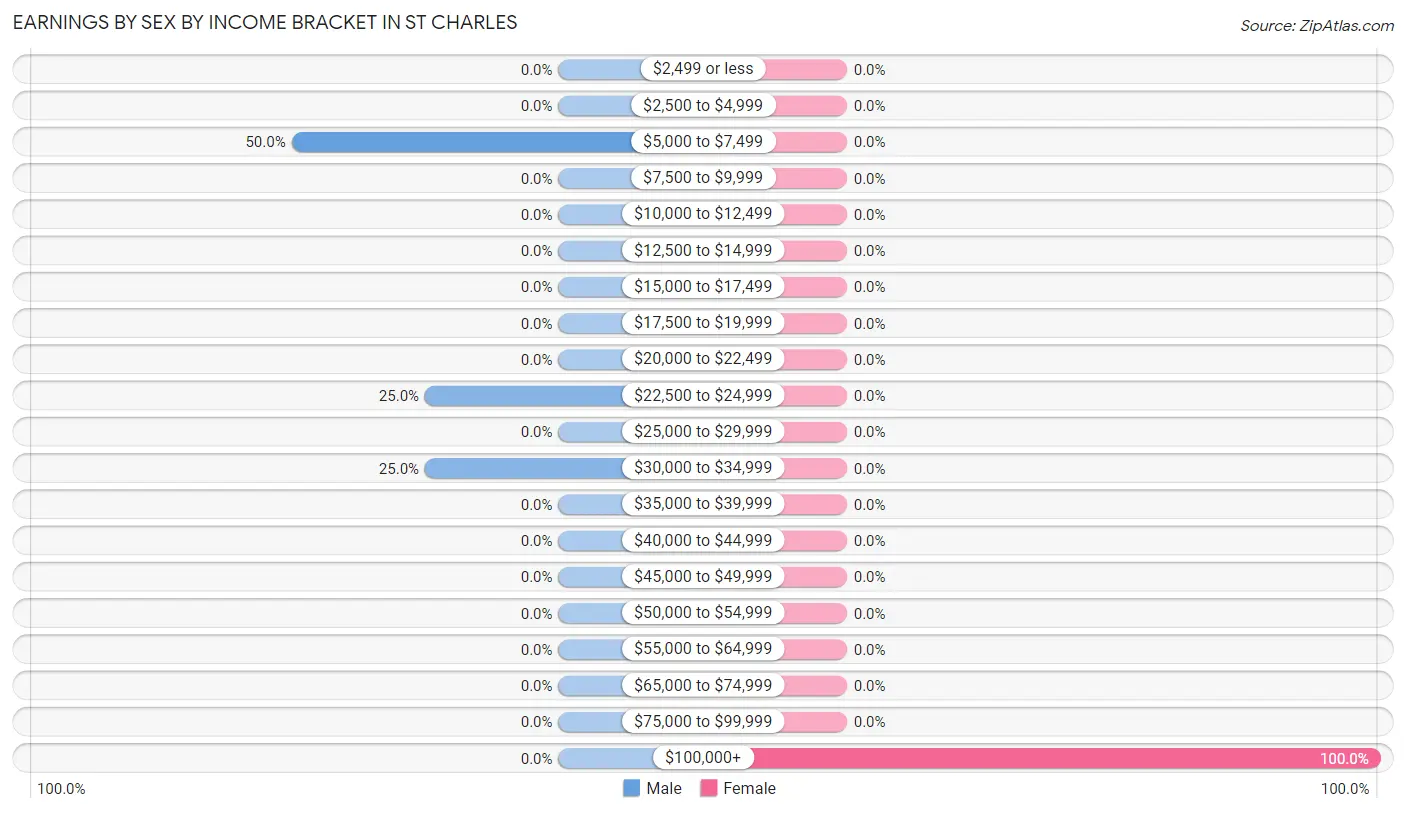
Earnings by Sex by Income Bracket in St Charles
The most common earnings brackets in St Charles are $5,000 to $7,499 for men (4 | 50.0%) and $100,000+ for women (3 | 100.0%).
| Income | Male | Female |
| $2,499 or less | 0 (0.0%) | 0 (0.0%) |
| $2,500 to $4,999 | 0 (0.0%) | 0 (0.0%) |
| $5,000 to $7,499 | 4 (50.0%) | 0 (0.0%) |
| $7,500 to $9,999 | 0 (0.0%) | 0 (0.0%) |
| $10,000 to $12,499 | 0 (0.0%) | 0 (0.0%) |
| $12,500 to $14,999 | 0 (0.0%) | 0 (0.0%) |
| $15,000 to $17,499 | 0 (0.0%) | 0 (0.0%) |
| $17,500 to $19,999 | 0 (0.0%) | 0 (0.0%) |
| $20,000 to $22,499 | 0 (0.0%) | 0 (0.0%) |
| $22,500 to $24,999 | 2 (25.0%) | 0 (0.0%) |
| $25,000 to $29,999 | 0 (0.0%) | 0 (0.0%) |
| $30,000 to $34,999 | 2 (25.0%) | 0 (0.0%) |
| $35,000 to $39,999 | 0 (0.0%) | 0 (0.0%) |
| $40,000 to $44,999 | 0 (0.0%) | 0 (0.0%) |
| $45,000 to $49,999 | 0 (0.0%) | 0 (0.0%) |
| $50,000 to $54,999 | 0 (0.0%) | 0 (0.0%) |
| $55,000 to $64,999 | 0 (0.0%) | 0 (0.0%) |
| $65,000 to $74,999 | 0 (0.0%) | 0 (0.0%) |
| $75,000 to $99,999 | 0 (0.0%) | 0 (0.0%) |
| $100,000+ | 0 (0.0%) | 3 (100.0%) |
| Total | 8 (100.0%) | 3 (100.0%) |
Earnings by Sex by Educational Attainment in St Charles
| Educational Attainment | Male Income | Female Income |
| Less than High School | - | - |
| High School Diploma | - | - |
| College or Associate's Degree | - | - |
| Bachelor's Degree | - | - |
| Graduate Degree | - | - |
| Total | - | - |
Family Income in St Charles
Family Income Brackets in St Charles
According to the St Charles family income data, there are 7 families falling into the $15,000 to $24,999 income range, which is the most common income bracket and makes up 70.0% of all families.
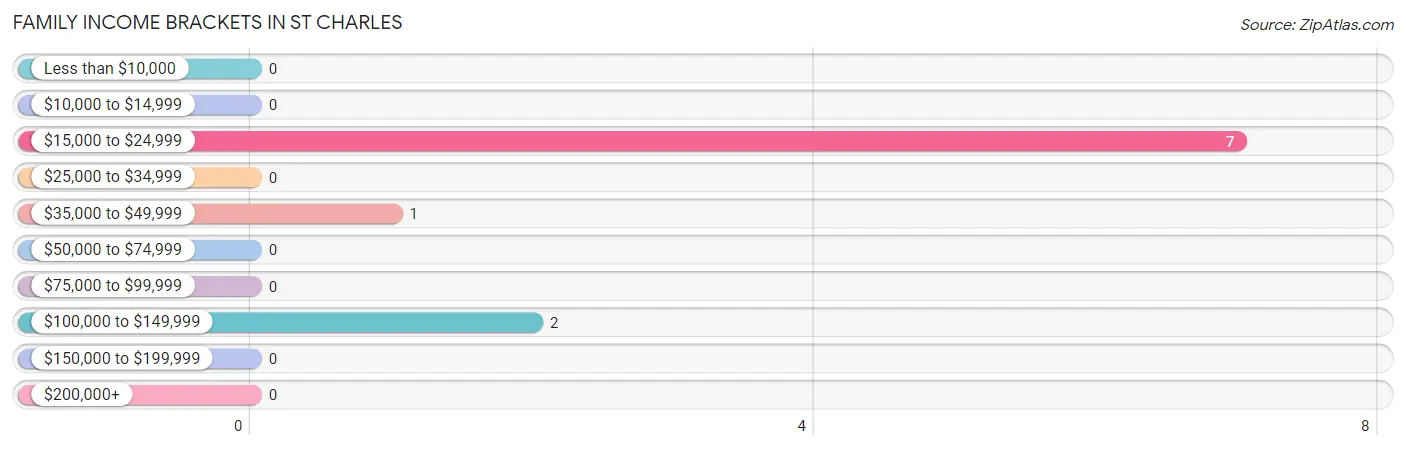
| Income Bracket | # Families | % Families |
| Less than $10,000 | 0 | 0.0% |
| $10,000 to $14,999 | 0 | 0.0% |
| $15,000 to $24,999 | 7 | 70.0% |
| $25,000 to $34,999 | 0 | 0.0% |
| $35,000 to $49,999 | 1 | 10.0% |
| $50,000 to $74,999 | 0 | 0.0% |
| $75,000 to $99,999 | 0 | 0.0% |
| $100,000 to $149,999 | 2 | 20.0% |
| $150,000 to $199,999 | 0 | 0.0% |
| $200,000+ | 0 | 0.0% |
Family Income by Famaliy Size in St Charles
| Income Bracket | # Families | Median Income |
| 2-Person Families | 2 (20.0%) | $0 |
| 3-Person Families | 6 (60.0%) | $0 |
| 4-Person Families | 2 (20.0%) | $0 |
| 5-Person Families | 0 (0.0%) | $0 |
| 6-Person Families | 0 (0.0%) | $0 |
| 7+ Person Families | 0 (0.0%) | $0 |
| Total | 10 (100.0%) | $0 |
Family Income by Number of Earners in St Charles
| Number of Earners | # Families | Median Income |
| No Earners | 6 (60.0%) | $0 |
| 1 Earner | 2 (20.0%) | $0 |
| 2 Earners | 0 (0.0%) | $0 |
| 3+ Earners | 2 (20.0%) | $0 |
| Total | 10 (100.0%) | $0 |
Household Income in St Charles
Household Income Brackets in St Charles
With 13 households falling in the category, the $10,000 to $14,999 income range is the most frequent in St Charles, accounting for 46.4% of all households.
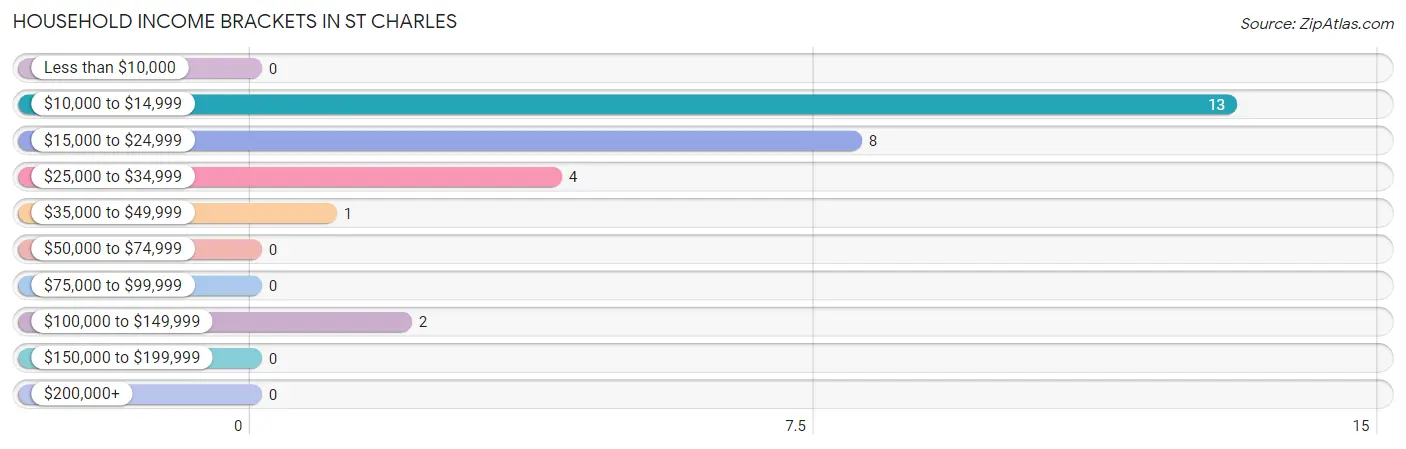
| Income Bracket | # Households | % Households |
| Less than $10,000 | 0 | 0.0% |
| $10,000 to $14,999 | 13 | 46.4% |
| $15,000 to $24,999 | 8 | 28.6% |
| $25,000 to $34,999 | 4 | 14.3% |
| $35,000 to $49,999 | 1 | 3.6% |
| $50,000 to $74,999 | 0 | 0.0% |
| $75,000 to $99,999 | 0 | 0.0% |
| $100,000 to $149,999 | 2 | 7.1% |
| $150,000 to $199,999 | 0 | 0.0% |
| $200,000+ | 0 | 0.0% |
Household Income by Householder Age in St Charles
The median household income in St Charles is $18,750, with the highest median household income of $20,500 found in the 45 to 64 years age bracket for the primary householder. A total of 14 households (50.0%) fall into this category. Meanwhile, the 15 to 24 years age bracket for the primary householder has the lowest median household income of $0, with 2 households (7.1%) in this group.
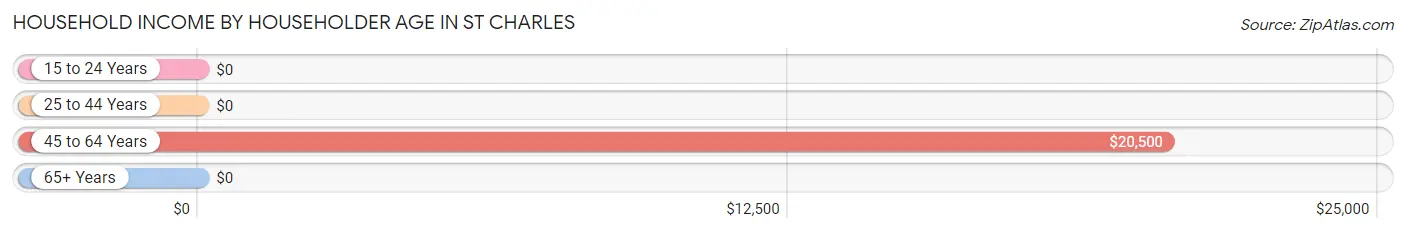
| Income Bracket | # Households | Median Income |
| 15 to 24 Years | 2 (7.1%) | $0 |
| 25 to 44 Years | 0 (0.0%) | $0 |
| 45 to 64 Years | 14 (50.0%) | $20,500 |
| 65+ Years | 12 (42.9%) | $0 |
| Total | 28 (100.0%) | $18,750 |
Poverty in St Charles
Income Below Poverty by Sex and Age in St Charles
With 73.7% poverty level for males and 42.3% for females among the residents of St Charles, 25 to 34 year old males and 55 to 64 year old females are the most vulnerable to poverty, with 11 males (100.0%) and 6 females (66.7%) in their respective age groups living below the poverty level.
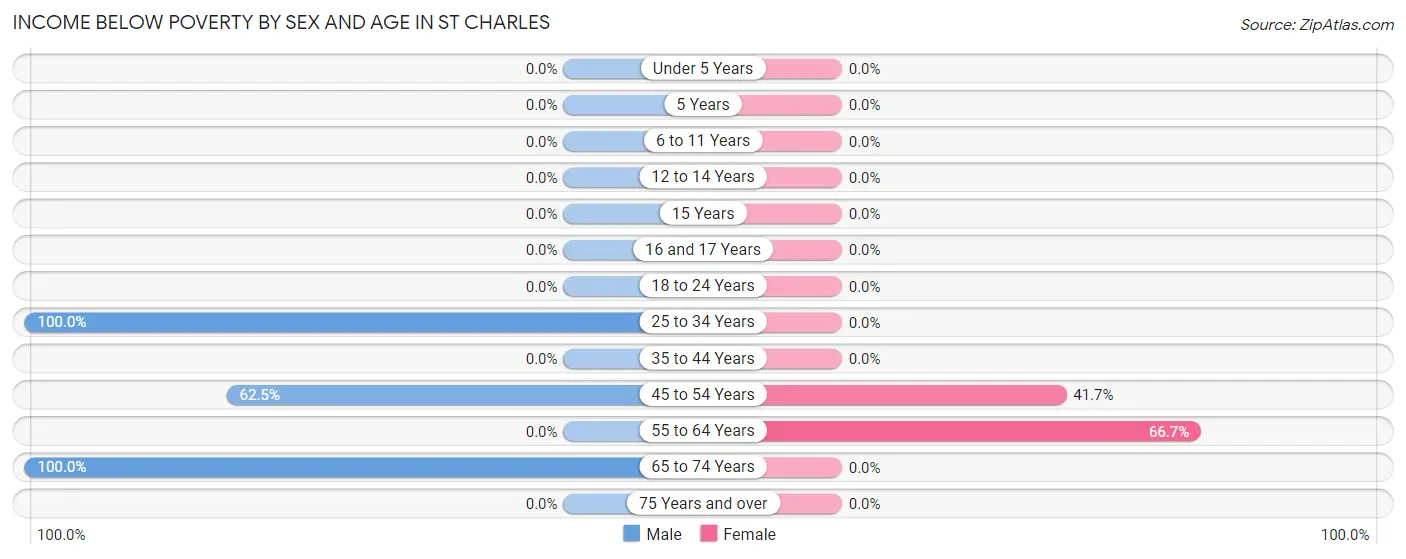
| Age Bracket | Male | Female |
| Under 5 Years | 0 (0.0%) | 0 (0.0%) |
| 5 Years | 0 (0.0%) | 0 (0.0%) |
| 6 to 11 Years | 0 (0.0%) | 0 (0.0%) |
| 12 to 14 Years | 0 (0.0%) | 0 (0.0%) |
| 15 Years | 0 (0.0%) | 0 (0.0%) |
| 16 and 17 Years | 0 (0.0%) | 0 (0.0%) |
| 18 to 24 Years | 0 (0.0%) | 0 (0.0%) |
| 25 to 34 Years | 11 (100.0%) | 0 (0.0%) |
| 35 to 44 Years | 0 (0.0%) | 0 (0.0%) |
| 45 to 54 Years | 10 (62.5%) | 5 (41.7%) |
| 55 to 64 Years | 0 (0.0%) | 6 (66.7%) |
| 65 to 74 Years | 7 (100.0%) | 0 (0.0%) |
| 75 Years and over | 0 (0.0%) | 0 (0.0%) |
| Total | 28 (73.7%) | 11 (42.3%) |
Income Above Poverty by Sex and Age in St Charles
According to the poverty statistics in St Charles, males aged 6 to 11 years and females aged 65 to 74 years are the age groups that are most secure financially, with 100.0% of males and 100.0% of females in these age groups living above the poverty line.
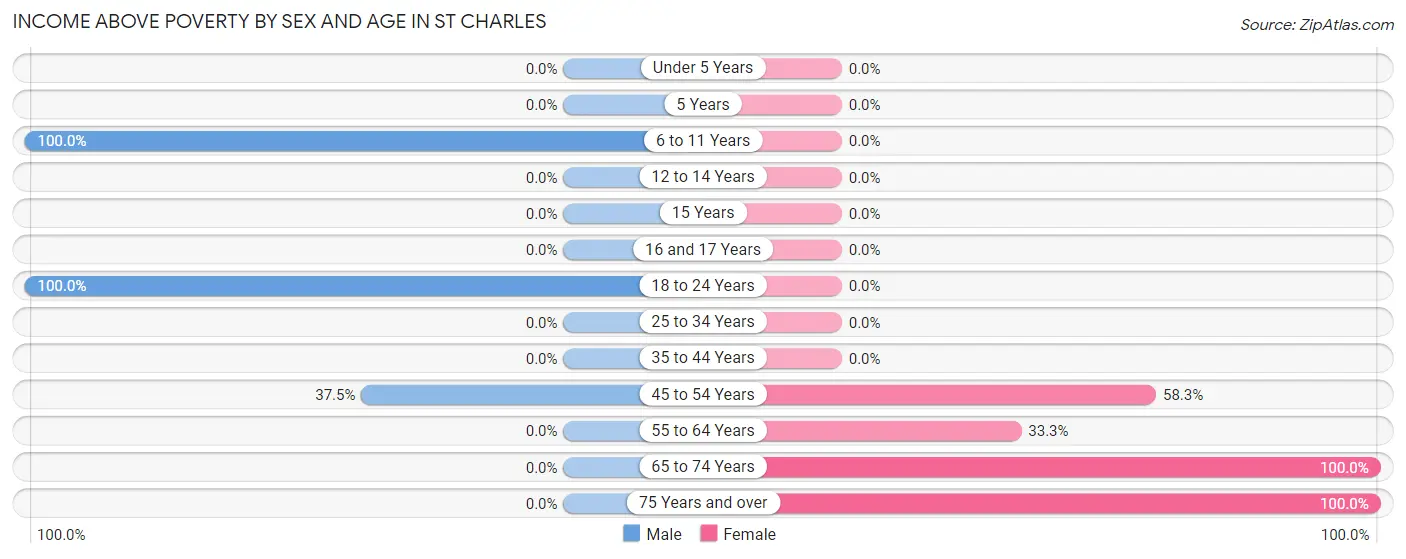
| Age Bracket | Male | Female |
| Under 5 Years | 0 (0.0%) | 0 (0.0%) |
| 5 Years | 0 (0.0%) | 0 (0.0%) |
| 6 to 11 Years | 2 (100.0%) | 0 (0.0%) |
| 12 to 14 Years | 0 (0.0%) | 0 (0.0%) |
| 15 Years | 0 (0.0%) | 0 (0.0%) |
| 16 and 17 Years | 0 (0.0%) | 0 (0.0%) |
| 18 to 24 Years | 2 (100.0%) | 0 (0.0%) |
| 25 to 34 Years | 0 (0.0%) | 0 (0.0%) |
| 35 to 44 Years | 0 (0.0%) | 0 (0.0%) |
| 45 to 54 Years | 6 (37.5%) | 7 (58.3%) |
| 55 to 64 Years | 0 (0.0%) | 3 (33.3%) |
| 65 to 74 Years | 0 (0.0%) | 4 (100.0%) |
| 75 Years and over | 0 (0.0%) | 1 (100.0%) |
| Total | 10 (26.3%) | 15 (57.7%) |
Income Below Poverty Among Married-Couple Families in St Charles
The poverty statistics for married-couple families in St Charles show that 71.4% or 5 of the total 7 families live below the poverty line. Families with no children have the highest poverty rate of 71.4%, comprising of 5 families. On the other hand, families with no children have the lowest poverty rate of 71.4%, which includes 5 families.
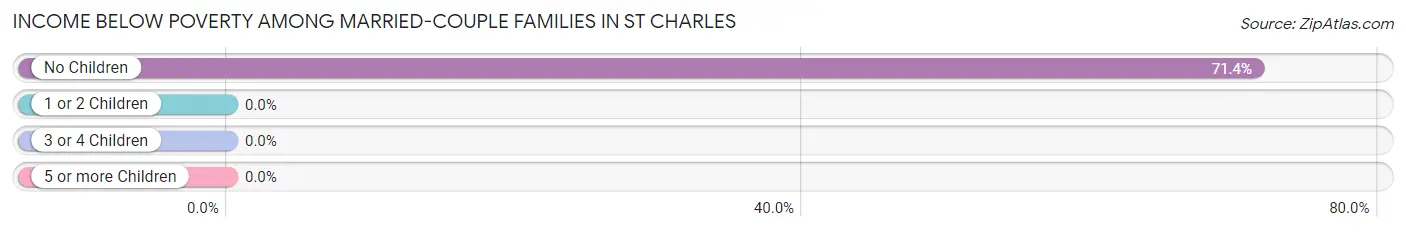
| Children | Above Poverty | Below Poverty |
| No Children | 2 (28.6%) | 5 (71.4%) |
| 1 or 2 Children | 0 (0.0%) | 0 (0.0%) |
| 3 or 4 Children | 0 (0.0%) | 0 (0.0%) |
| 5 or more Children | 0 (0.0%) | 0 (0.0%) |
| Total | 2 (28.6%) | 5 (71.4%) |
Income Below Poverty Among Single-Parent Households in St Charles
| Children | Single Father | Single Mother |
| No Children | 0 (0.0%) | 0 (0.0%) |
| 1 or 2 Children | 0 (0.0%) | 0 (0.0%) |
| 3 or 4 Children | 0 (0.0%) | 0 (0.0%) |
| 5 or more Children | 0 (0.0%) | 0 (0.0%) |
| Total | 0 (0.0%) | 0 (0.0%) |
Income Below Poverty Among Married-Couple vs Single-Parent Households in St Charles
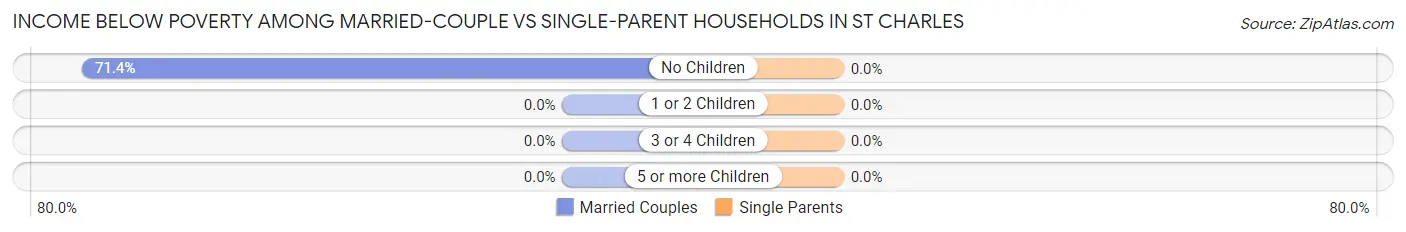
| Children | Married-Couple Families | Single-Parent Households |
| No Children | 5 (71.4%) | 0 (0.0%) |
| 1 or 2 Children | 0 (0.0%) | 0 (0.0%) |
| 3 or 4 Children | 0 (0.0%) | 0 (0.0%) |
| 5 or more Children | 0 (0.0%) | 0 (0.0%) |
| Total | 5 (71.4%) | 0 (0.0%) |
Race in St Charles
The most populous races in St Charles are , and White / Caucasian (64 | 100.0%).
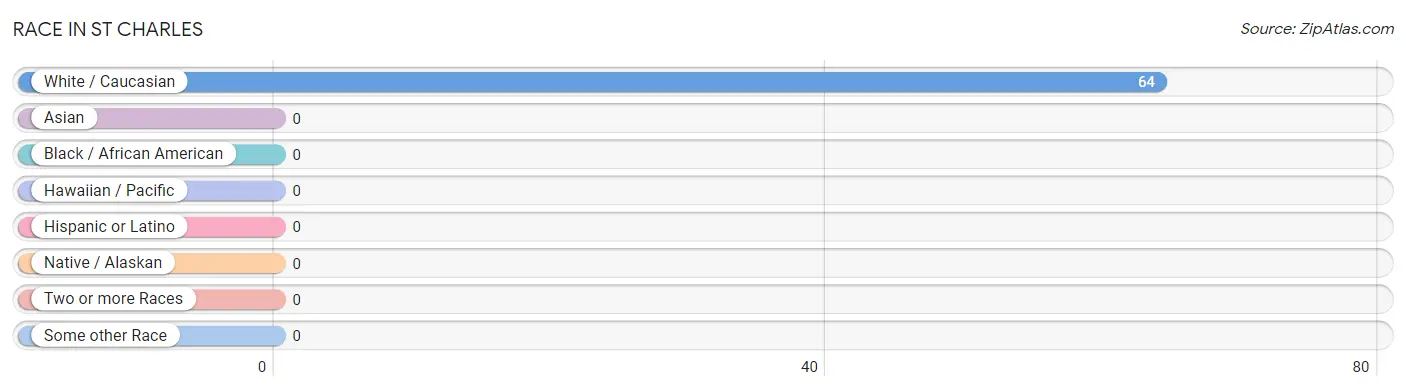
| Race | # Population | % Population |
| Asian | 0 | 0.0% |
| Black / African American | 0 | 0.0% |
| Hawaiian / Pacific | 0 | 0.0% |
| Hispanic or Latino | 0 | 0.0% |
| Native / Alaskan | 0 | 0.0% |
| White / Caucasian | 64 | 100.0% |
| Two or more Races | 0 | 0.0% |
| Some other Race | 0 | 0.0% |
| Total | 64 | 100.0% |
Ancestry in St Charles
The most populous ancestries reported in St Charles are American (40 | 62.5%), Irish (7 | 10.9%), English (6 | 9.4%), and German (2 | 3.1%), together accounting for 85.9% of all St Charles residents.
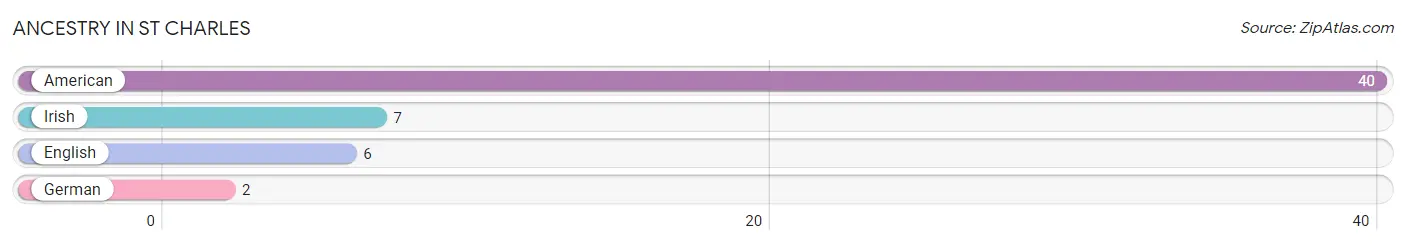
| Ancestry | # Population | % Population |
| American | 40 | 62.5% |
| English | 6 | 9.4% |
| German | 2 | 3.1% |
| Irish | 7 | 10.9% | View All 4 Rows |
Immigrants in St Charles

| Immigration Origin | # Population | % Population | View All 0 Rows |
Sex and Age in St Charles
Sex and Age in St Charles
The most populous age groups in St Charles are 50 to 54 Years (16 | 42.1%) for men and 45 to 49 Years (8 | 30.8%) for women.
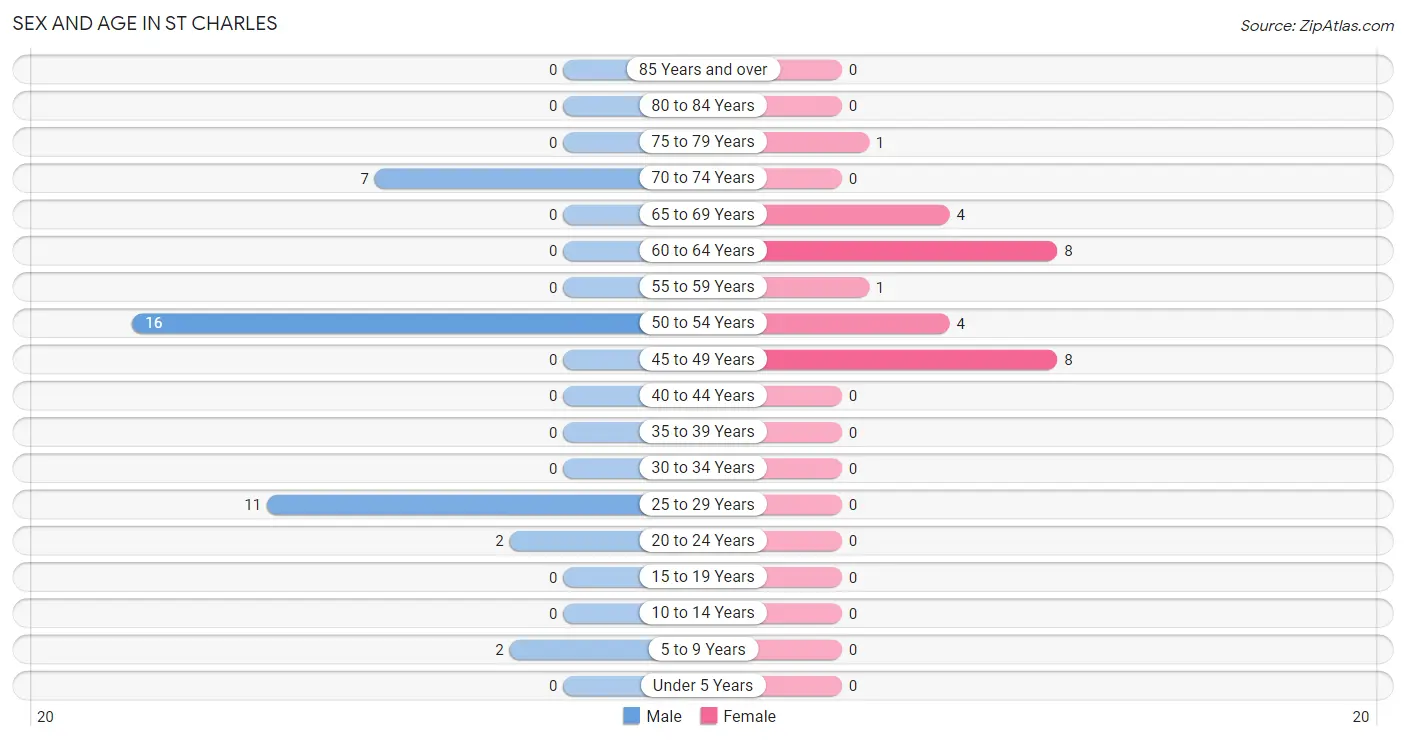
| Age Bracket | Male | Female |
| Under 5 Years | 0 (0.0%) | 0 (0.0%) |
| 5 to 9 Years | 2 (5.3%) | 0 (0.0%) |
| 10 to 14 Years | 0 (0.0%) | 0 (0.0%) |
| 15 to 19 Years | 0 (0.0%) | 0 (0.0%) |
| 20 to 24 Years | 2 (5.3%) | 0 (0.0%) |
| 25 to 29 Years | 11 (28.9%) | 0 (0.0%) |
| 30 to 34 Years | 0 (0.0%) | 0 (0.0%) |
| 35 to 39 Years | 0 (0.0%) | 0 (0.0%) |
| 40 to 44 Years | 0 (0.0%) | 0 (0.0%) |
| 45 to 49 Years | 0 (0.0%) | 8 (30.8%) |
| 50 to 54 Years | 16 (42.1%) | 4 (15.4%) |
| 55 to 59 Years | 0 (0.0%) | 1 (3.8%) |
| 60 to 64 Years | 0 (0.0%) | 8 (30.8%) |
| 65 to 69 Years | 0 (0.0%) | 4 (15.4%) |
| 70 to 74 Years | 7 (18.4%) | 0 (0.0%) |
| 75 to 79 Years | 0 (0.0%) | 1 (3.8%) |
| 80 to 84 Years | 0 (0.0%) | 0 (0.0%) |
| 85 Years and over | 0 (0.0%) | 0 (0.0%) |
| Total | 38 (100.0%) | 26 (100.0%) |
Families and Households in St Charles
Median Family Size in St Charles
The median family size in St Charles is 4.60 persons per family, with single male/father families (2 | 20.0%) accounting for the largest median family size of 5.5 persons per family. On the other hand, married-couple families (7 | 70.0%) represent the smallest median family size with 4.29 persons per family.
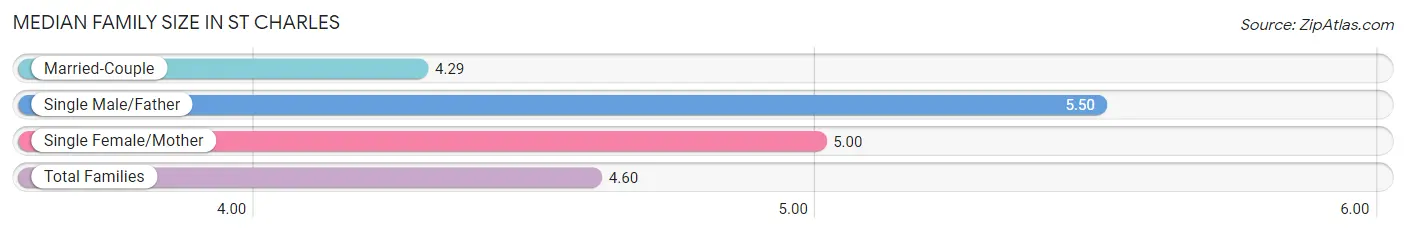
| Family Type | # Families | Family Size |
| Married-Couple | 7 (70.0%) | 4.29 |
| Single Male/Father | 2 (20.0%) | 5.50 |
| Single Female/Mother | 1 (10.0%) | 5.00 |
| Total Families | 10 (100.0%) | 4.60 |
Median Household Size in St Charles
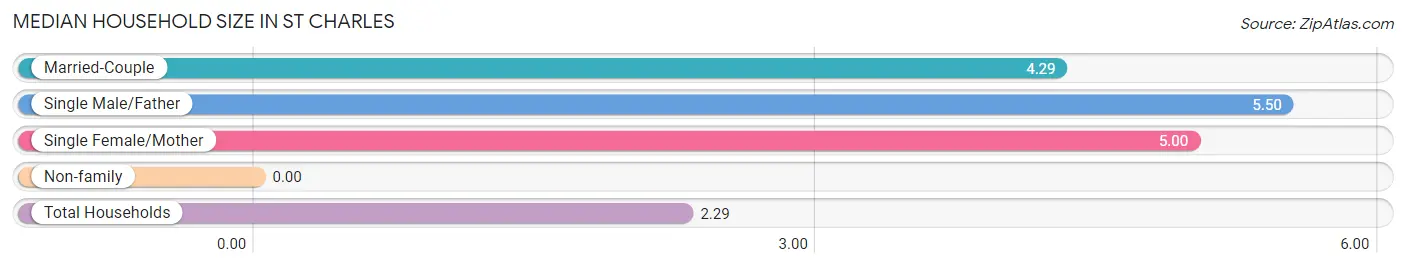
| Household Type | # Households | Household Size |
| Married-Couple | 7 (25.0%) | 4.29 |
| Single Male/Father | 2 (7.1%) | 5.50 |
| Single Female/Mother | 1 (3.6%) | 5.00 |
| Non-family | 18 (64.3%) | - |
| Total Households | 28 (100.0%) | 2.29 |
Household Size by Marriage Status in St Charles
Out of a total of 28 households in St Charles, 10 (35.7%) are family households, while 18 (64.3%) are nonfamily households. The most numerous type of family households are 3-person households, comprising 6, and the most common type of nonfamily households are 1-person households, comprising 18.
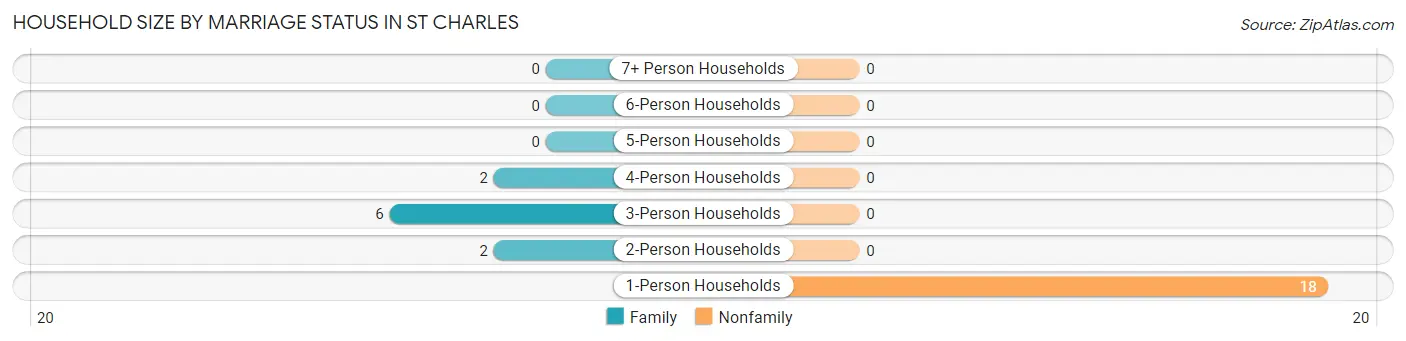
| Household Size | Family Households | Nonfamily Households |
| 1-Person Households | - | 18 (64.3%) |
| 2-Person Households | 2 (7.1%) | 0 (0.0%) |
| 3-Person Households | 6 (21.4%) | 0 (0.0%) |
| 4-Person Households | 2 (7.1%) | 0 (0.0%) |
| 5-Person Households | 0 (0.0%) | 0 (0.0%) |
| 6-Person Households | 0 (0.0%) | 0 (0.0%) |
| 7+ Person Households | 0 (0.0%) | 0 (0.0%) |
| Total | 10 (35.7%) | 18 (64.3%) |
Female Fertility in St Charles
Fertility by Age in St Charles
| Age Bracket | Women with Births | Births / 1,000 Women |
| 15 to 19 years | 0 (0.0%) | 0.0 |
| 20 to 34 years | 0 (0.0%) | 0.0 |
| 35 to 50 years | 0 (0.0%) | 0.0 |
| Total | 0 (0.0%) | 0.0 |
Fertility by Age by Marriage Status in St Charles
| Age Bracket | Married | Unmarried |
| 15 to 19 years | 0 (0.0%) | 0 (0.0%) |
| 20 to 34 years | 0 (0.0%) | 0 (0.0%) |
| 35 to 50 years | 0 (0.0%) | 0 (0.0%) |
| Total | 0 (0.0%) | 0 (0.0%) |
Fertility by Education in St Charles
| Educational Attainment | Women with Births | Births / 1,000 Women |
| Less than High School | 0 (0.0%) | 0.0 |
| High School Diploma | 0 (0.0%) | 0.0 |
| College or Associate's Degree | 0 (0.0%) | 0.0 |
| Bachelor's Degree | 0 (0.0%) | 0.0 |
| Graduate Degree | 0 (0.0%) | 0.0 |
| Total | 0 (0.0%) | 0.0 |
Fertility by Education by Marriage Status in St Charles
| Educational Attainment | Married | Unmarried |
| Less than High School | 0 (0.0%) | 0 (0.0%) |
| High School Diploma | 0 (0.0%) | 0 (0.0%) |
| College or Associate's Degree | 0 (0.0%) | 0 (0.0%) |
| Bachelor's Degree | 0 (0.0%) | 0 (0.0%) |
| Graduate Degree | 0 (0.0%) | 0 (0.0%) |
| Total | 0 (0.0%) | 0 (0.0%) |
Employment Characteristics in St Charles
Employment by Class of Employer in St Charles
Among the 7 employed individuals in St Charles, , and private company employees (7 | 100.0%) make up the most common classes of employment.
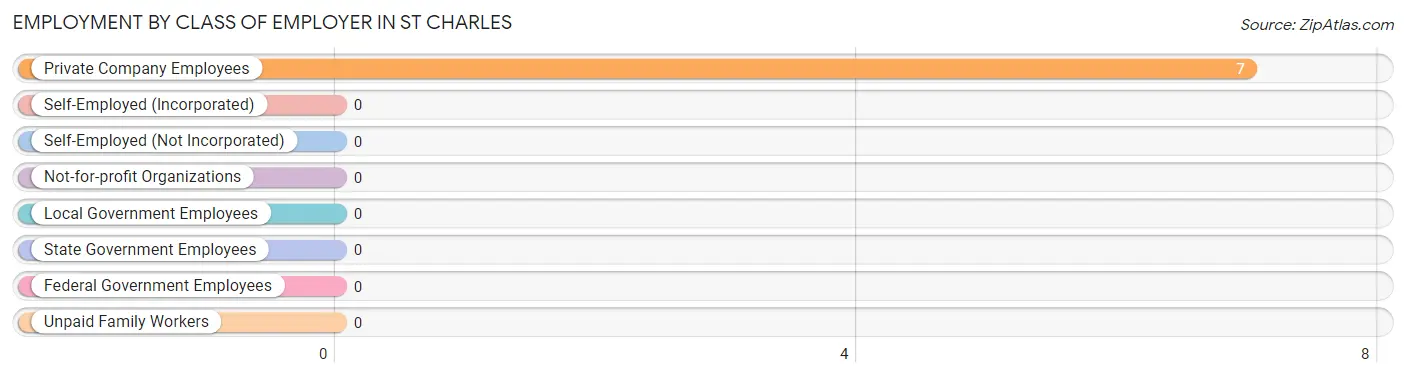
| Employer Class | # Employees | % Employees |
| Private Company Employees | 7 | 100.0% |
| Self-Employed (Incorporated) | 0 | 0.0% |
| Self-Employed (Not Incorporated) | 0 | 0.0% |
| Not-for-profit Organizations | 0 | 0.0% |
| Local Government Employees | 0 | 0.0% |
| State Government Employees | 0 | 0.0% |
| Federal Government Employees | 0 | 0.0% |
| Unpaid Family Workers | 0 | 0.0% |
| Total | 7 | 100.0% |
Employment Status by Age in St Charles
According to the labor force statistics for St Charles, out of the total population over 16 years of age (62), 14.5% or 9 individuals are in the labor force, with 22.2% or 2 of them unemployed. The age group with the highest labor force participation rate is 20 to 24 years, with 100.0% or 2 individuals in the labor force. Within the labor force, the 45 to 54 years age range has the highest percentage of unemployed individuals, with 28.6% or 2 of them being unemployed.
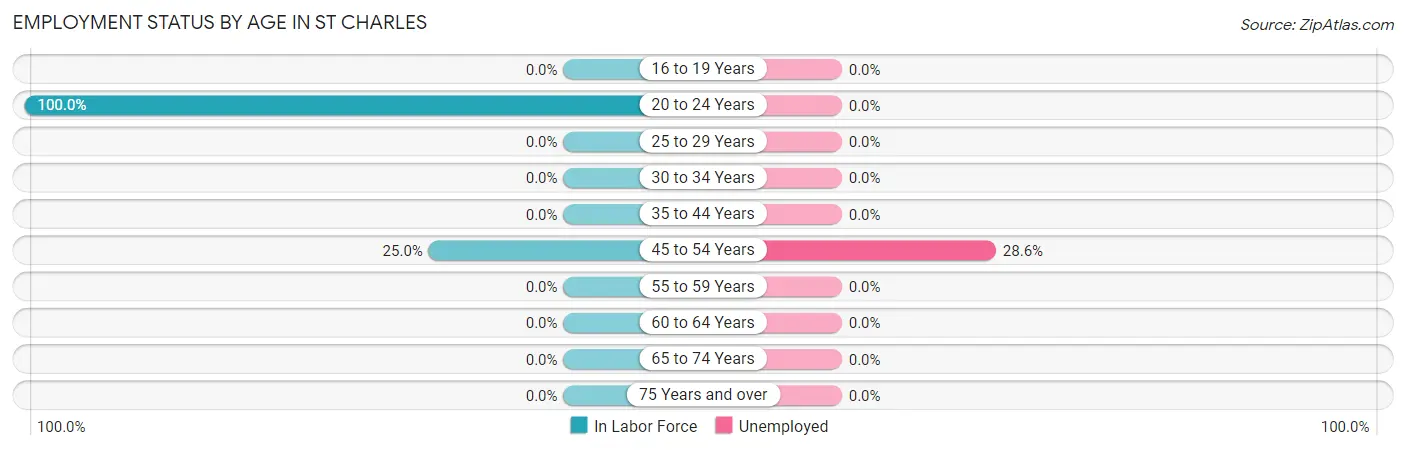
| Age Bracket | In Labor Force | Unemployed |
| 16 to 19 Years | 0 (0.0%) | 0 (0.0%) |
| 20 to 24 Years | 2 (100.0%) | 0 (0.0%) |
| 25 to 29 Years | 0 (0.0%) | 0 (0.0%) |
| 30 to 34 Years | 0 (0.0%) | 0 (0.0%) |
| 35 to 44 Years | 0 (0.0%) | 0 (0.0%) |
| 45 to 54 Years | 7 (25.0%) | 2 (28.6%) |
| 55 to 59 Years | 0 (0.0%) | 0 (0.0%) |
| 60 to 64 Years | 0 (0.0%) | 0 (0.0%) |
| 65 to 74 Years | 0 (0.0%) | 0 (0.0%) |
| 75 Years and over | 0 (0.0%) | 0 (0.0%) |
| Total | 9 (14.5%) | 2 (22.2%) |
Employment Status by Educational Attainment in St Charles
According to labor force statistics for St Charles, 14.6% of individuals (7) out of the total population between 25 and 64 years of age (48) are in the labor force, with 28.6% or 2 of them being unemployed. The group with the highest labor force participation rate are those with the educational attainment of high school diploma, with 58.3% or 7 individuals in the labor force. Within the labor force, individuals with high school diploma education have the highest percentage of unemployment, with 28.6% or 2 of them being unemployed.
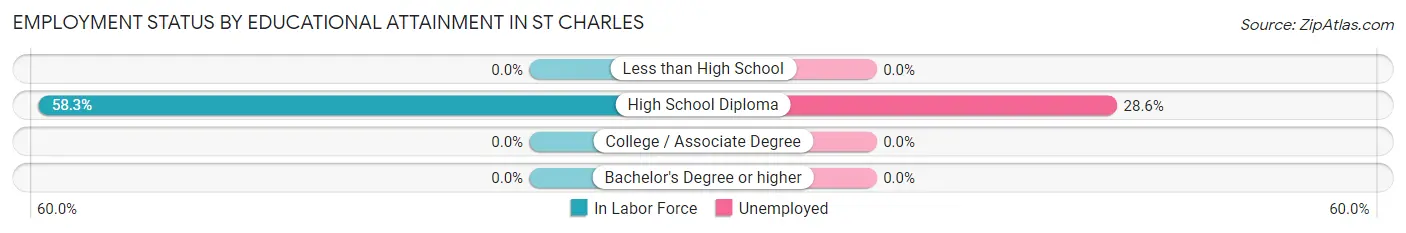
| Educational Attainment | In Labor Force | Unemployed |
| Less than High School | 0 (0.0%) | 0 (0.0%) |
| High School Diploma | 7 (58.3%) | 3 (28.6%) |
| College / Associate Degree | 0 (0.0%) | 0 (0.0%) |
| Bachelor's Degree or higher | 0 (0.0%) | 0 (0.0%) |
| Total | 7 (14.6%) | 14 (28.6%) |
Employment Occupations by Sex in St Charles
Management, Business, Science and Arts Occupations
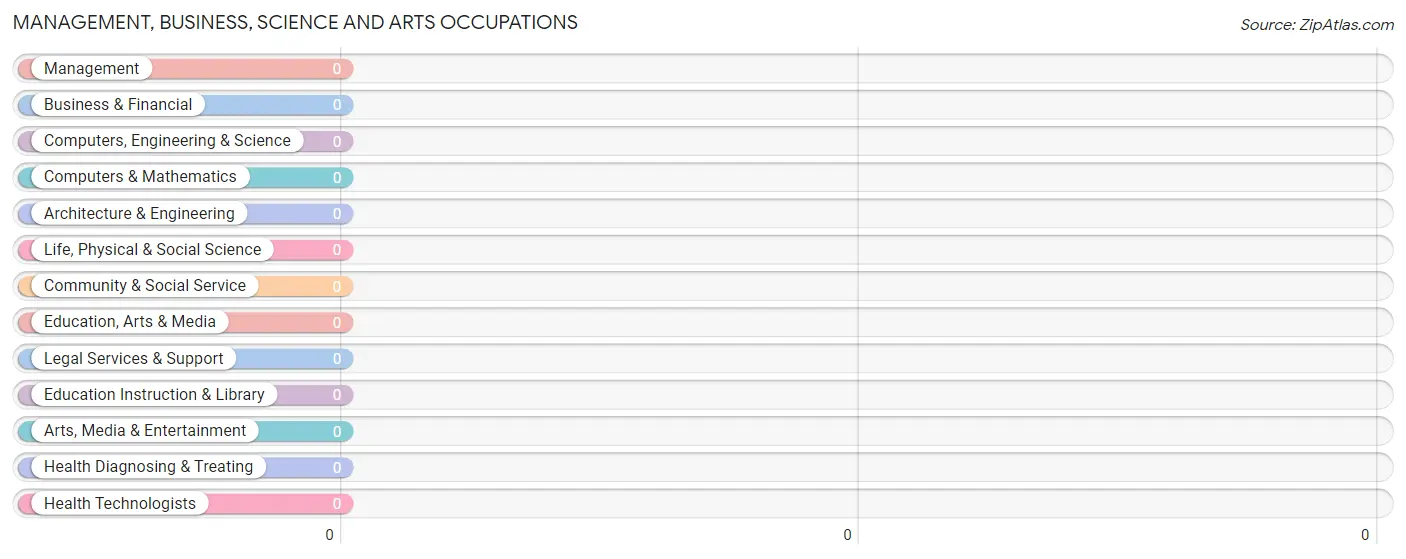
Management, Business, Science and Arts Occupations by Sex
| Occupation | Male | Female |
| Management | 0 (0.0%) | 0 (0.0%) |
| Business & Financial | 0 (0.0%) | 0 (0.0%) |
| Computers, Engineering & Science | 0 (0.0%) | 0 (0.0%) |
| Computers & Mathematics | 0 (0.0%) | 0 (0.0%) |
| Architecture & Engineering | 0 (0.0%) | 0 (0.0%) |
| Life, Physical & Social Science | 0 (0.0%) | 0 (0.0%) |
| Community & Social Service | 0 (0.0%) | 0 (0.0%) |
| Education, Arts & Media | 0 (0.0%) | 0 (0.0%) |
| Legal Services & Support | 0 (0.0%) | 0 (0.0%) |
| Education Instruction & Library | 0 (0.0%) | 0 (0.0%) |
| Arts, Media & Entertainment | 0 (0.0%) | 0 (0.0%) |
| Health Diagnosing & Treating | 0 (0.0%) | 0 (0.0%) |
| Health Technologists | 0 (0.0%) | 0 (0.0%) |
| Total (Category) | 0 (0.0%) | 0 (0.0%) |
| Total (Overall) | 4 (57.1%) | 3 (42.9%) |
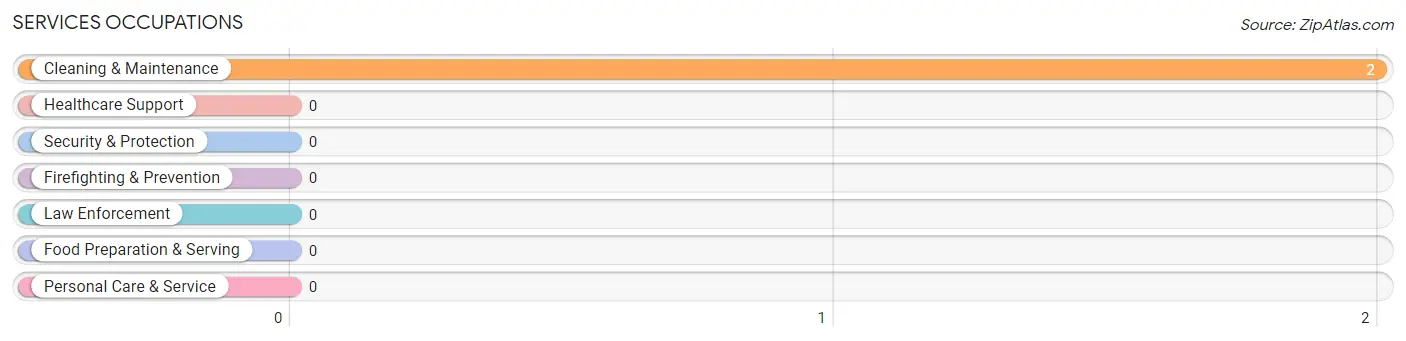
Services Occupations
The most common Services occupations in St Charles are , and Cleaning & Maintenance (2 | 28.6%).
Services Occupations by Sex
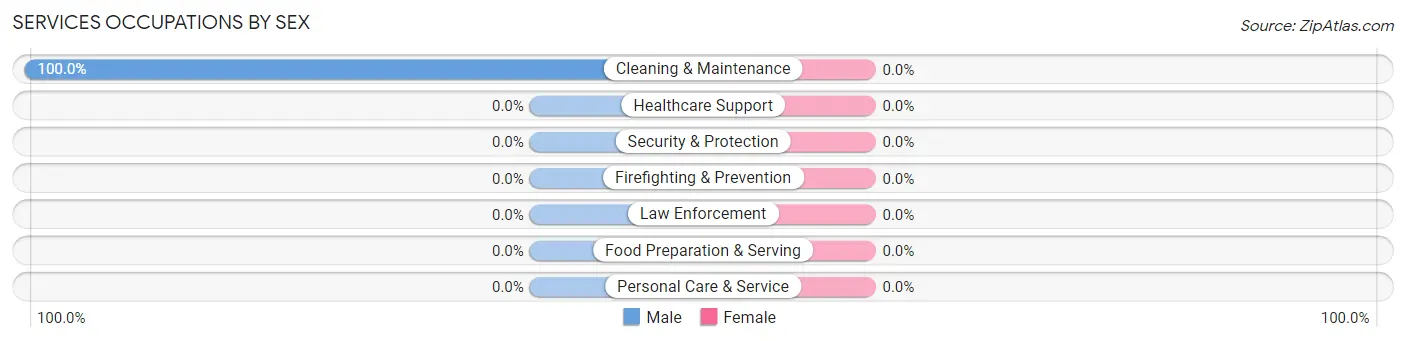
| Occupation | Male | Female |
| Healthcare Support | 0 (0.0%) | 0 (0.0%) |
| Security & Protection | 0 (0.0%) | 0 (0.0%) |
| Firefighting & Prevention | 0 (0.0%) | 0 (0.0%) |
| Law Enforcement | 0 (0.0%) | 0 (0.0%) |
| Food Preparation & Serving | 0 (0.0%) | 0 (0.0%) |
| Cleaning & Maintenance | 2 (100.0%) | 0 (0.0%) |
| Personal Care & Service | 0 (0.0%) | 0 (0.0%) |
| Total (Category) | 2 (100.0%) | 0 (0.0%) |
| Total (Overall) | 4 (57.1%) | 3 (42.9%) |
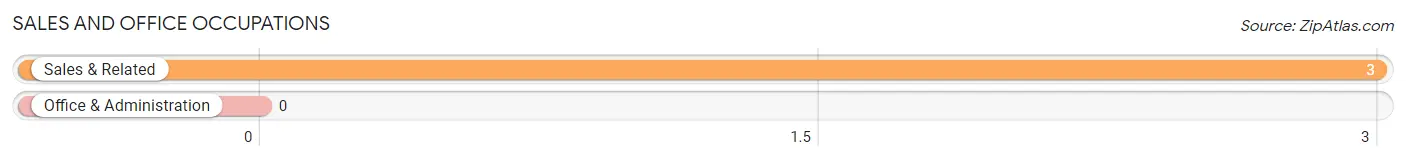
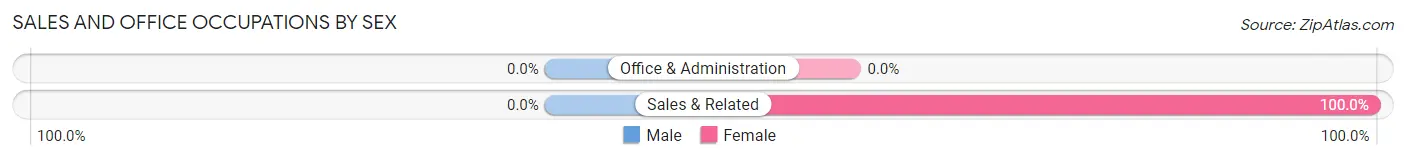
Sales and Office Occupations
The most common Sales and Office occupations in St Charles are , and Sales & Related (3 | 42.9%).
Sales and Office Occupations by Sex
| Occupation | Male | Female |
| Sales & Related | 0 (0.0%) | 3 (100.0%) |
| Office & Administration | 0 (0.0%) | 0 (0.0%) |
| Total (Category) | 0 (0.0%) | 3 (100.0%) |
| Total (Overall) | 4 (57.1%) | 3 (42.9%) |
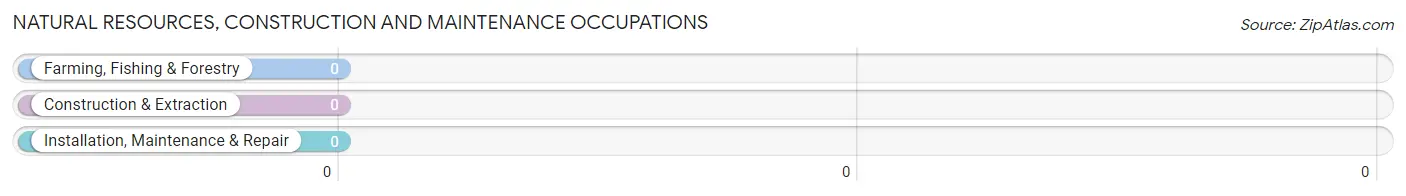
Natural Resources, Construction and Maintenance Occupations
Natural Resources, Construction and Maintenance Occupations by Sex
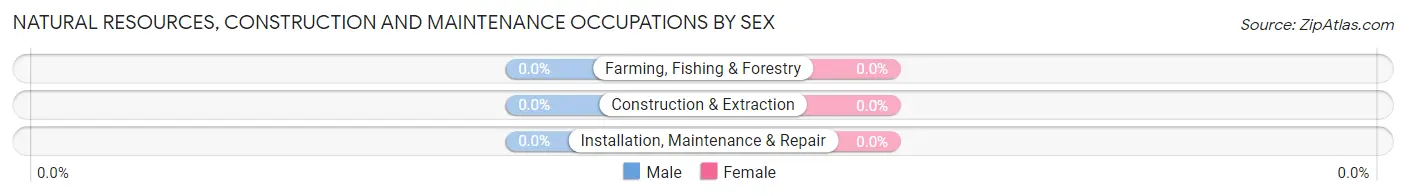
| Occupation | Male | Female |
| Farming, Fishing & Forestry | 0 (0.0%) | 0 (0.0%) |
| Construction & Extraction | 0 (0.0%) | 0 (0.0%) |
| Installation, Maintenance & Repair | 0 (0.0%) | 0 (0.0%) |
| Total (Category) | 0 (0.0%) | 0 (0.0%) |
| Total (Overall) | 4 (57.1%) | 3 (42.9%) |
Production, Transportation and Moving Occupations
The most common Production, Transportation and Moving occupations in St Charles are , and Material Moving (2 | 28.6%).
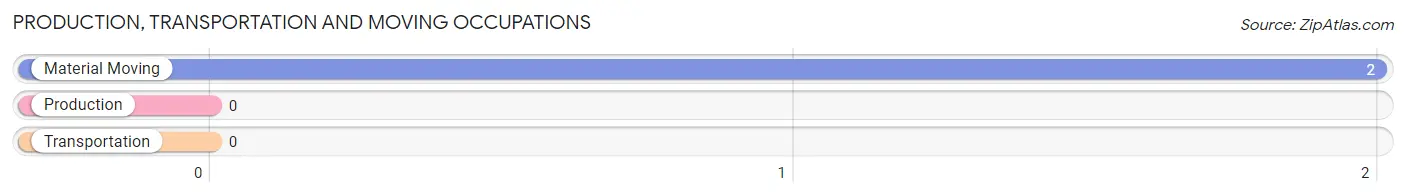
Production, Transportation and Moving Occupations by Sex
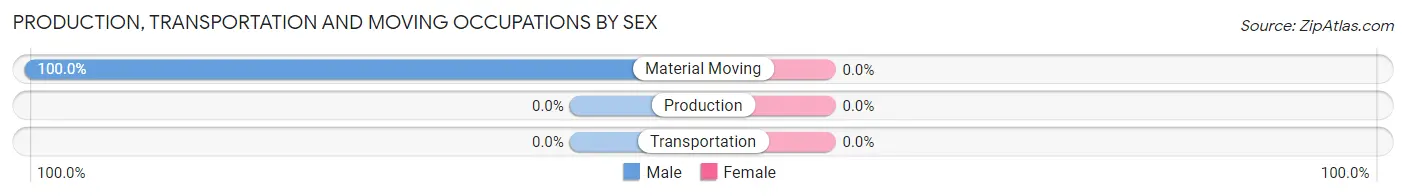
| Occupation | Male | Female |
| Production | 0 (0.0%) | 0 (0.0%) |
| Transportation | 0 (0.0%) | 0 (0.0%) |
| Material Moving | 2 (100.0%) | 0 (0.0%) |
| Total (Category) | 2 (100.0%) | 0 (0.0%) |
| Total (Overall) | 4 (57.1%) | 3 (42.9%) |
Employment Industries by Sex in St Charles
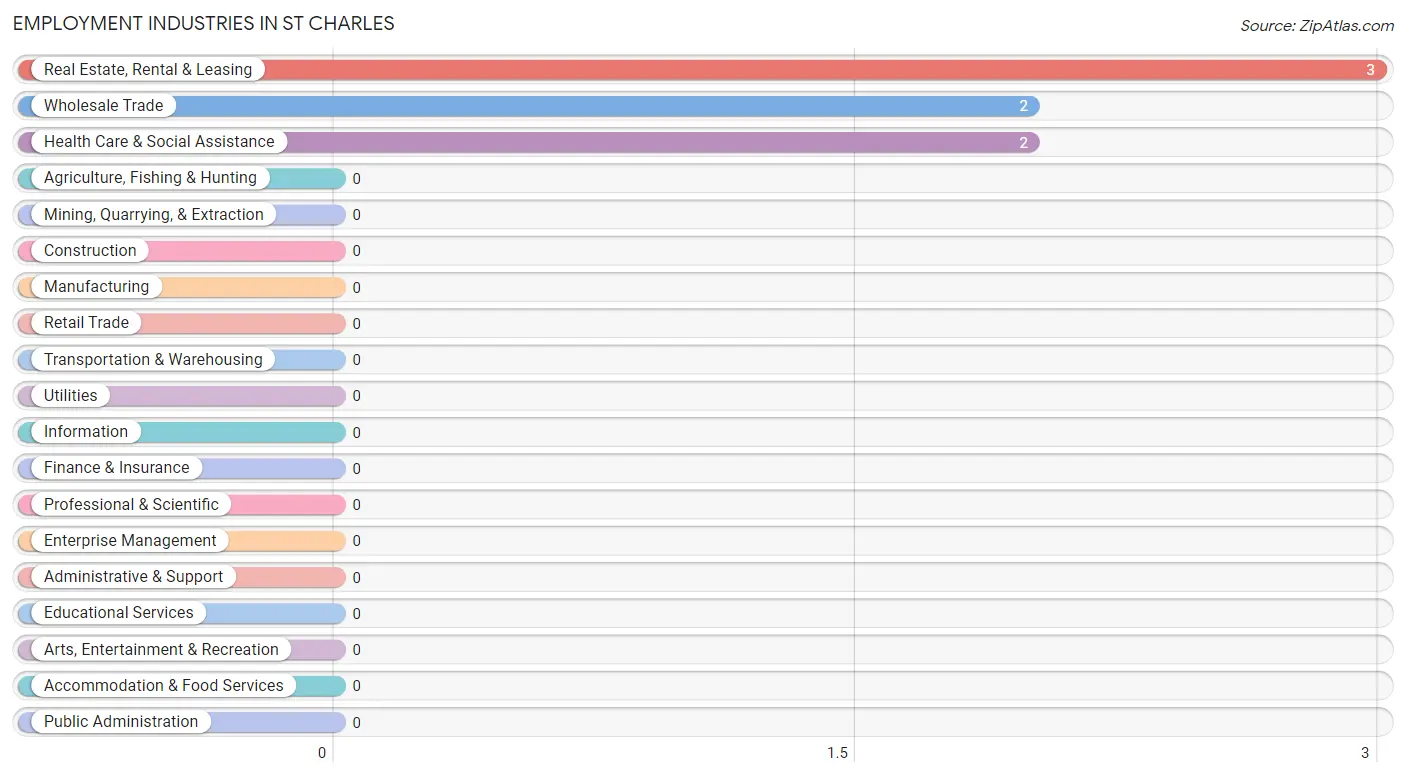
Employment Industries in St Charles
The major employment industries in St Charles include Real Estate, Rental & Leasing (3 | 42.9%), Wholesale Trade (2 | 28.6%), and Health Care & Social Assistance (2 | 28.6%).
Employment Industries by Sex in St Charles
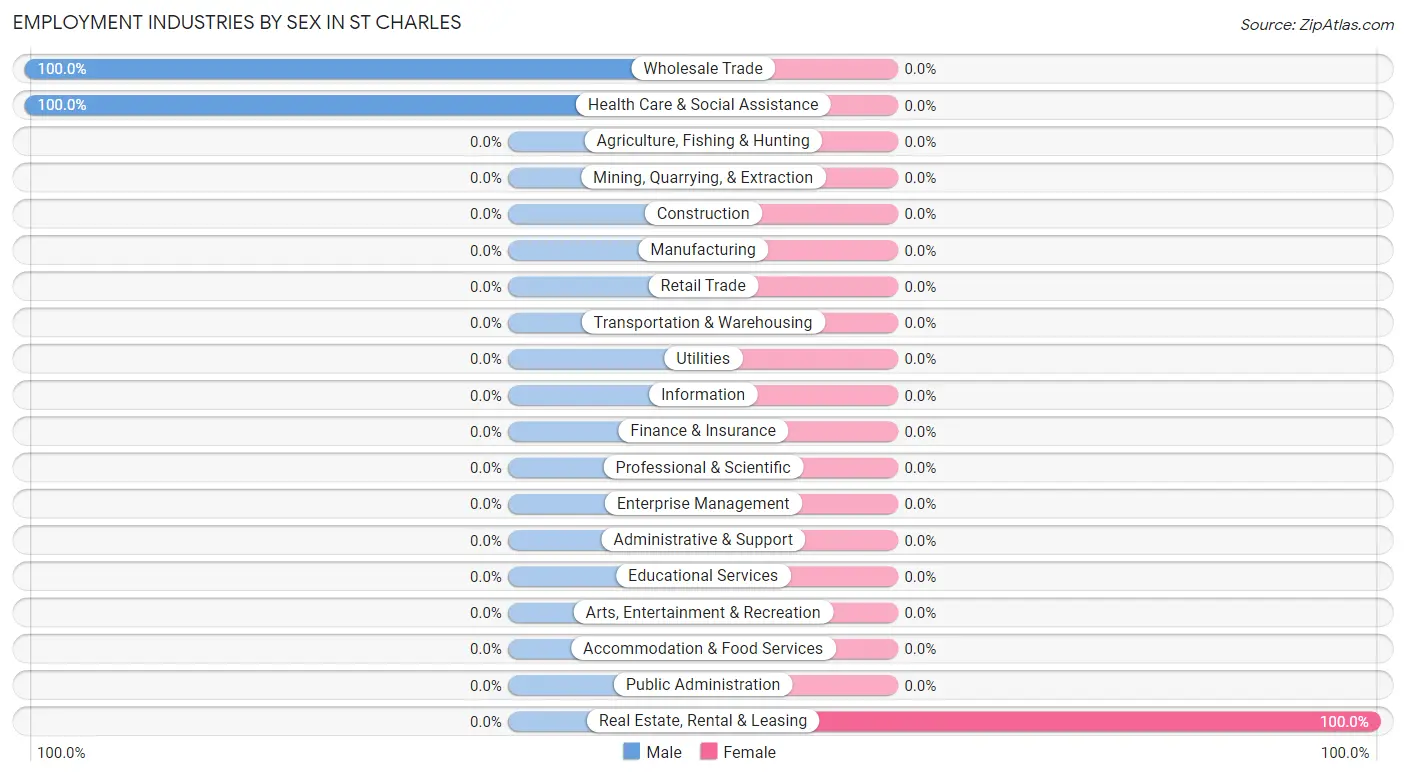
| Industry | Male | Female |
| Agriculture, Fishing & Hunting | 0 (0.0%) | 0 (0.0%) |
| Mining, Quarrying, & Extraction | 0 (0.0%) | 0 (0.0%) |
| Construction | 0 (0.0%) | 0 (0.0%) |
| Manufacturing | 0 (0.0%) | 0 (0.0%) |
| Wholesale Trade | 2 (100.0%) | 0 (0.0%) |
| Retail Trade | 0 (0.0%) | 0 (0.0%) |
| Transportation & Warehousing | 0 (0.0%) | 0 (0.0%) |
| Utilities | 0 (0.0%) | 0 (0.0%) |
| Information | 0 (0.0%) | 0 (0.0%) |
| Finance & Insurance | 0 (0.0%) | 0 (0.0%) |
| Real Estate, Rental & Leasing | 0 (0.0%) | 3 (100.0%) |
| Professional & Scientific | 0 (0.0%) | 0 (0.0%) |
| Enterprise Management | 0 (0.0%) | 0 (0.0%) |
| Administrative & Support | 0 (0.0%) | 0 (0.0%) |
| Educational Services | 0 (0.0%) | 0 (0.0%) |
| Health Care & Social Assistance | 2 (100.0%) | 0 (0.0%) |
| Arts, Entertainment & Recreation | 0 (0.0%) | 0 (0.0%) |
| Accommodation & Food Services | 0 (0.0%) | 0 (0.0%) |
| Public Administration | 0 (0.0%) | 0 (0.0%) |
| Total | 4 (57.1%) | 3 (42.9%) |
Education in St Charles
School Enrollment in St Charles
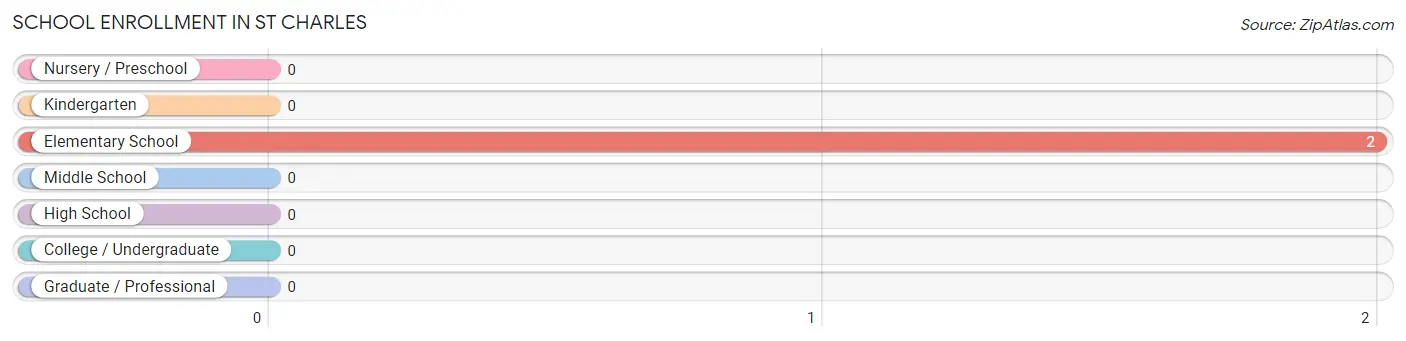
| School Level | # Students | % Students |
| Nursery / Preschool | 0 | 0.0% |
| Kindergarten | 0 | 0.0% |
| Elementary School | 2 | 100.0% |
| Middle School | 0 | 0.0% |
| High School | 0 | 0.0% |
| College / Undergraduate | 0 | 0.0% |
| Graduate / Professional | 0 | 0.0% |
| Total | 2 | 100.0% |
School Enrollment by Age by Funding Source in St Charles
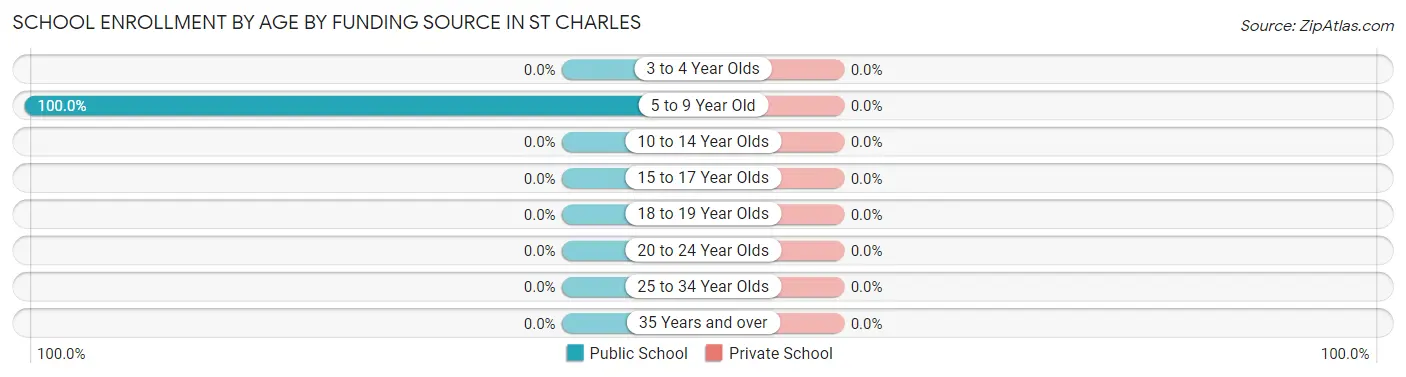
| Age Bracket | Public School | Private School |
| 3 to 4 Year Olds | 0 (0.0%) | 0 (0.0%) |
| 5 to 9 Year Old | 2 (100.0%) | 0 (0.0%) |
| 10 to 14 Year Olds | 0 (0.0%) | 0 (0.0%) |
| 15 to 17 Year Olds | 0 (0.0%) | 0 (0.0%) |
| 18 to 19 Year Olds | 0 (0.0%) | 0 (0.0%) |
| 20 to 24 Year Olds | 0 (0.0%) | 0 (0.0%) |
| 25 to 34 Year Olds | 0 (0.0%) | 0 (0.0%) |
| 35 Years and over | 0 (0.0%) | 0 (0.0%) |
| Total | 2 (100.0%) | 0 (0.0%) |
Educational Attainment by Field of Study in St Charles
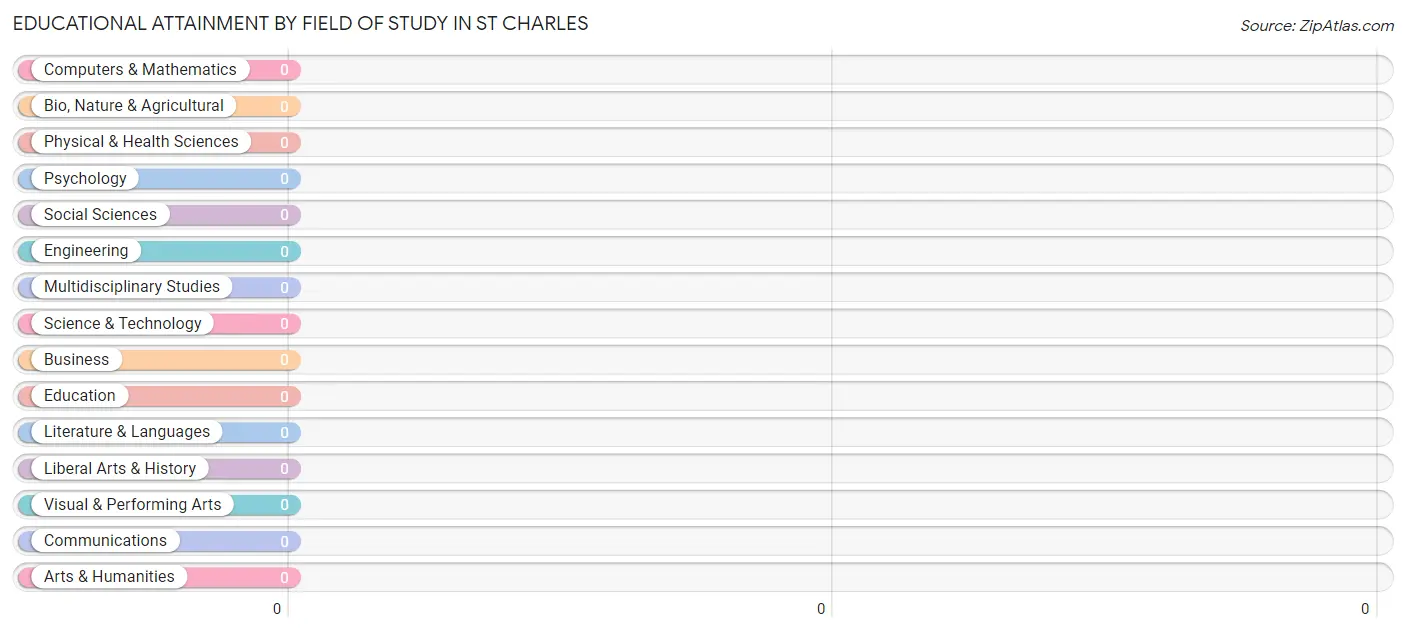
| Field of Study | # Graduates | % Graduates |
| Computers & Mathematics | 0 | 0.0% |
| Bio, Nature & Agricultural | 0 | 0.0% |
| Physical & Health Sciences | 0 | 0.0% |
| Psychology | 0 | 0.0% |
| Social Sciences | 0 | 0.0% |
| Engineering | 0 | 0.0% |
| Multidisciplinary Studies | 0 | 0.0% |
| Science & Technology | 0 | 0.0% |
| Business | 0 | 0.0% |
| Education | 0 | 0.0% |
| Literature & Languages | 0 | 0.0% |
| Liberal Arts & History | 0 | 0.0% |
| Visual & Performing Arts | 0 | 0.0% |
| Communications | 0 | 0.0% |
| Arts & Humanities | 0 | 0.0% |
| Total | 0 | 0.0% |
Transportation & Commute in St Charles
Vehicle Availability by Sex in St Charles
The most prevalent vehicle ownership categories in St Charles are males with 2 vehicles (4, accounting for 100.0%) and females with 2 vehicles (3, making up 133.3%).
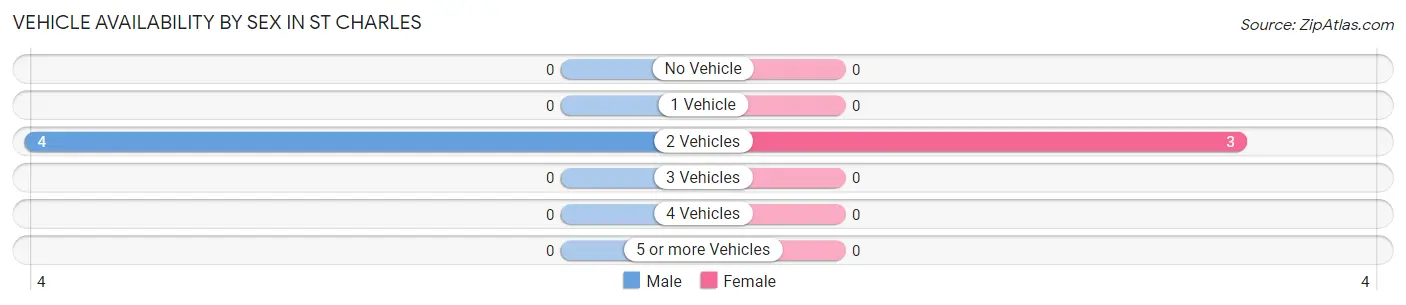
| Vehicles Available | Male | Female |
| No Vehicle | 0 (0.0%) | 0 (0.0%) |
| 1 Vehicle | 0 (0.0%) | 0 (0.0%) |
| 2 Vehicles | 4 (100.0%) | 3 (100.0%) |
| 3 Vehicles | 0 (0.0%) | 0 (0.0%) |
| 4 Vehicles | 0 (0.0%) | 0 (0.0%) |
| 5 or more Vehicles | 0 (0.0%) | 0 (0.0%) |
| Total | 4 (100.0%) | 3 (100.0%) |
Commute Time in St Charles
The most frequently occuring commute durations in St Charles are 40 to 44 minutes (3 commuters, 42.9%), less than 5 minutes (2 commuters, 28.6%), and 20 to 24 minutes (2 commuters, 28.6%).
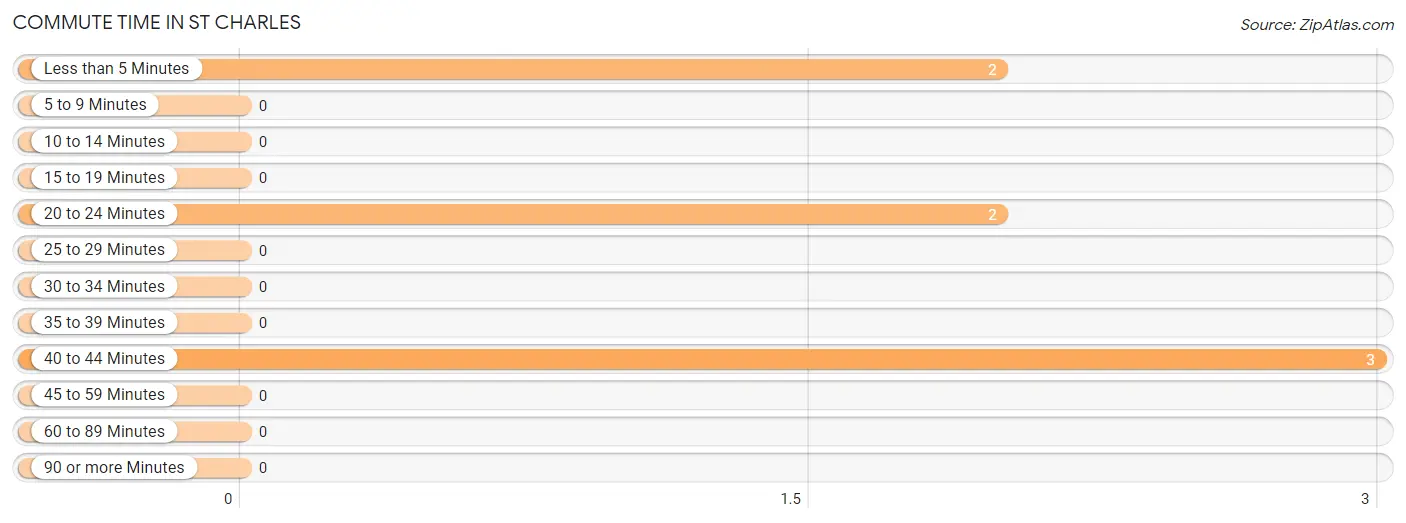
| Commute Time | # Commuters | % Commuters |
| Less than 5 Minutes | 2 | 28.6% |
| 5 to 9 Minutes | 0 | 0.0% |
| 10 to 14 Minutes | 0 | 0.0% |
| 15 to 19 Minutes | 0 | 0.0% |
| 20 to 24 Minutes | 2 | 28.6% |
| 25 to 29 Minutes | 0 | 0.0% |
| 30 to 34 Minutes | 0 | 0.0% |
| 35 to 39 Minutes | 0 | 0.0% |
| 40 to 44 Minutes | 3 | 42.9% |
| 45 to 59 Minutes | 0 | 0.0% |
| 60 to 89 Minutes | 0 | 0.0% |
| 90 or more Minutes | 0 | 0.0% |
Commute Time by Sex in St Charles
The most common commute times in St Charles are less than 5 minutes (2 commuters, 50.0%) for males and 40 to 44 minutes (3 commuters, 100.0%) for females.
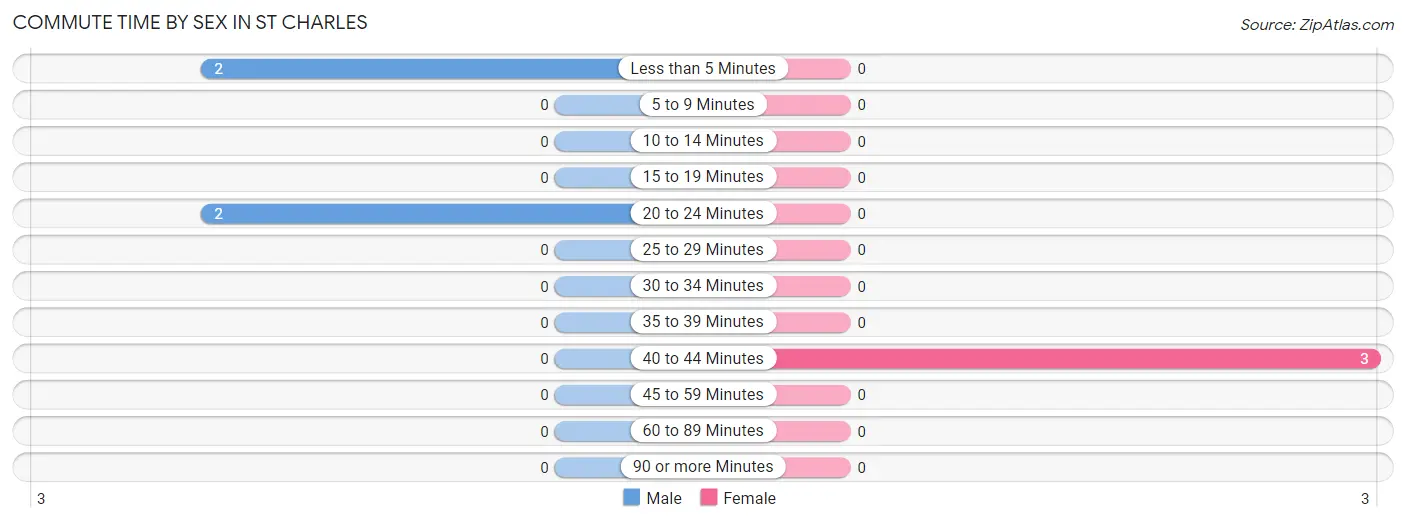
| Commute Time | Male | Female |
| Less than 5 Minutes | 2 (50.0%) | 0 (0.0%) |
| 5 to 9 Minutes | 0 (0.0%) | 0 (0.0%) |
| 10 to 14 Minutes | 0 (0.0%) | 0 (0.0%) |
| 15 to 19 Minutes | 0 (0.0%) | 0 (0.0%) |
| 20 to 24 Minutes | 2 (50.0%) | 0 (0.0%) |
| 25 to 29 Minutes | 0 (0.0%) | 0 (0.0%) |
| 30 to 34 Minutes | 0 (0.0%) | 0 (0.0%) |
| 35 to 39 Minutes | 0 (0.0%) | 0 (0.0%) |
| 40 to 44 Minutes | 0 (0.0%) | 3 (100.0%) |
| 45 to 59 Minutes | 0 (0.0%) | 0 (0.0%) |
| 60 to 89 Minutes | 0 (0.0%) | 0 (0.0%) |
| 90 or more Minutes | 0 (0.0%) | 0 (0.0%) |
Time of Departure to Work by Sex in St Charles
The most frequent times of departure to work in St Charles are 12:00 AM to 4:59 AM (2, 50.0%) for males and 4:00 PM to 11:59 PM (3, 100.0%) for females.
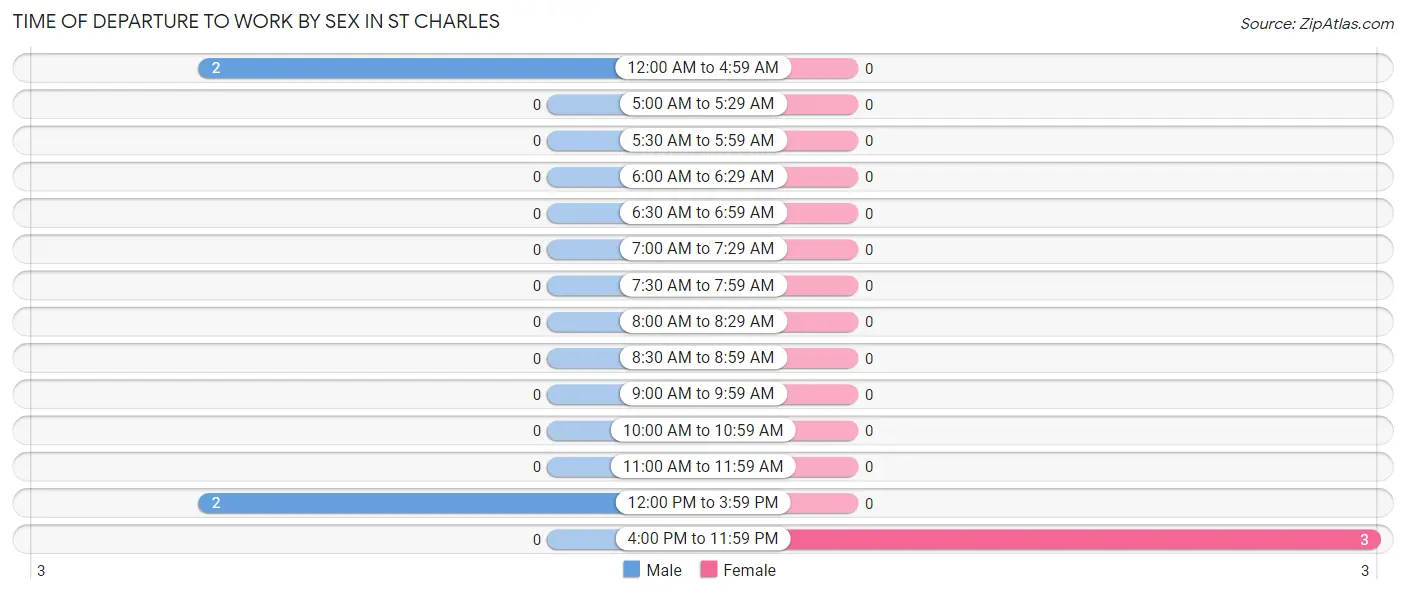
| Time of Departure | Male | Female |
| 12:00 AM to 4:59 AM | 2 (50.0%) | 0 (0.0%) |
| 5:00 AM to 5:29 AM | 0 (0.0%) | 0 (0.0%) |
| 5:30 AM to 5:59 AM | 0 (0.0%) | 0 (0.0%) |
| 6:00 AM to 6:29 AM | 0 (0.0%) | 0 (0.0%) |
| 6:30 AM to 6:59 AM | 0 (0.0%) | 0 (0.0%) |
| 7:00 AM to 7:29 AM | 0 (0.0%) | 0 (0.0%) |
| 7:30 AM to 7:59 AM | 0 (0.0%) | 0 (0.0%) |
| 8:00 AM to 8:29 AM | 0 (0.0%) | 0 (0.0%) |
| 8:30 AM to 8:59 AM | 0 (0.0%) | 0 (0.0%) |
| 9:00 AM to 9:59 AM | 0 (0.0%) | 0 (0.0%) |
| 10:00 AM to 10:59 AM | 0 (0.0%) | 0 (0.0%) |
| 11:00 AM to 11:59 AM | 0 (0.0%) | 0 (0.0%) |
| 12:00 PM to 3:59 PM | 2 (50.0%) | 0 (0.0%) |
| 4:00 PM to 11:59 PM | 0 (0.0%) | 3 (100.0%) |
| Total | 4 (100.0%) | 3 (100.0%) |
Housing Occupancy in St Charles
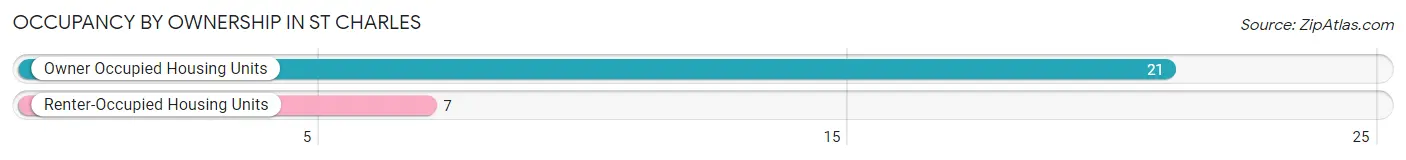
Occupancy by Ownership in St Charles
Of the total 28 dwellings in St Charles, owner-occupied units account for 21 (75.0%), while renter-occupied units make up 7 (25.0%).
| Occupancy | # Housing Units | % Housing Units |
| Owner Occupied Housing Units | 21 | 75.0% |
| Renter-Occupied Housing Units | 7 | 25.0% |
| Total Occupied Housing Units | 28 | 100.0% |
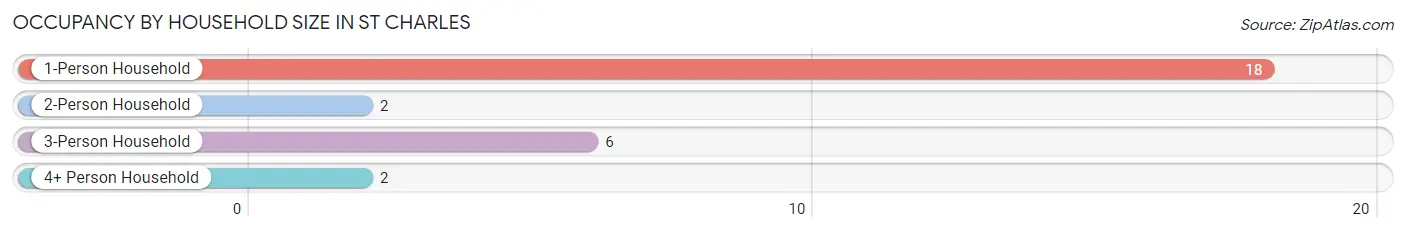
Occupancy by Household Size in St Charles
| Household Size | # Housing Units | % Housing Units |
| 1-Person Household | 18 | 64.3% |
| 2-Person Household | 2 | 7.1% |
| 3-Person Household | 6 | 21.4% |
| 4+ Person Household | 2 | 7.1% |
| Total Housing Units | 28 | 100.0% |
Occupancy by Ownership by Household Size in St Charles
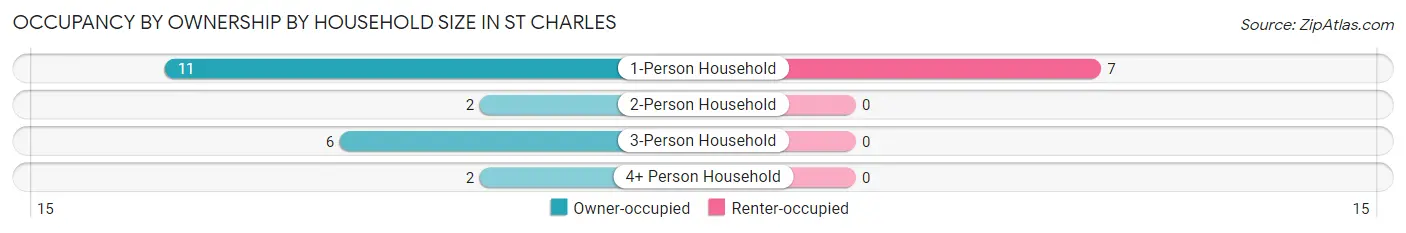
| Household Size | Owner-occupied | Renter-occupied |
| 1-Person Household | 11 (61.1%) | 7 (38.9%) |
| 2-Person Household | 2 (100.0%) | 0 (0.0%) |
| 3-Person Household | 6 (100.0%) | 0 (0.0%) |
| 4+ Person Household | 2 (100.0%) | 0 (0.0%) |
| Total Housing Units | 21 (75.0%) | 7 (25.0%) |
Occupancy by Educational Attainment in St Charles
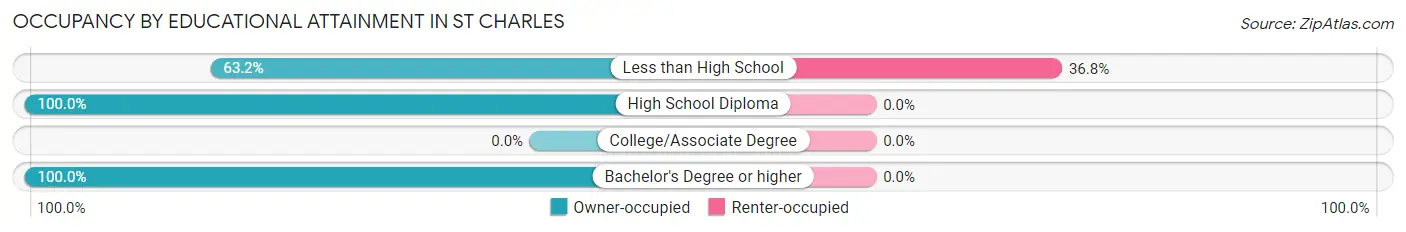
| Household Size | Owner-occupied | Renter-occupied |
| Less than High School | 12 (63.2%) | 7 (36.8%) |
| High School Diploma | 7 (100.0%) | 0 (0.0%) |
| College/Associate Degree | 0 (0.0%) | 0 (0.0%) |
| Bachelor's Degree or higher | 2 (100.0%) | 0 (0.0%) |
Occupancy by Age of Householder in St Charles
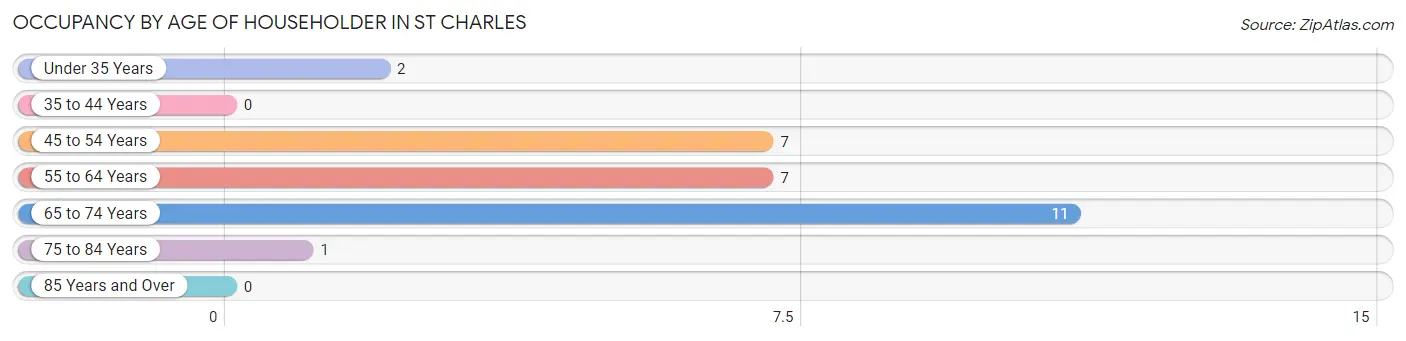
| Age Bracket | # Households | % Households |
| Under 35 Years | 2 | 7.1% |
| 35 to 44 Years | 0 | 0.0% |
| 45 to 54 Years | 7 | 25.0% |
| 55 to 64 Years | 7 | 25.0% |
| 65 to 74 Years | 11 | 39.3% |
| 75 to 84 Years | 1 | 3.6% |
| 85 Years and Over | 0 | 0.0% |
| Total | 28 | 100.0% |
Housing Finances in St Charles
Median Income by Occupancy in St Charles
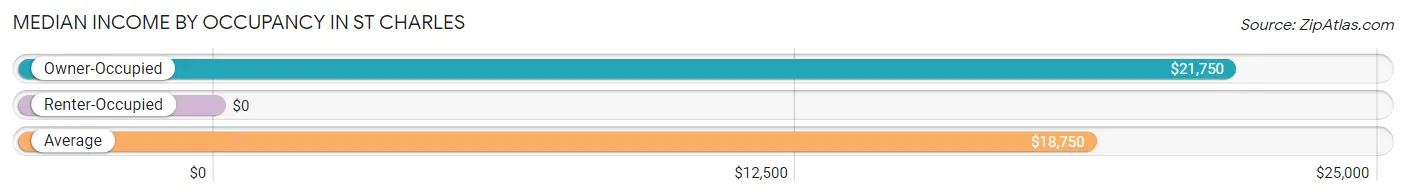
| Occupancy Type | # Households | Median Income |
| Owner-Occupied | 21 (75.0%) | $21,750 |
| Renter-Occupied | 7 (25.0%) | $0 |
| Average | 28 (100.0%) | $18,750 |
Occupancy by Householder Income Bracket in St Charles
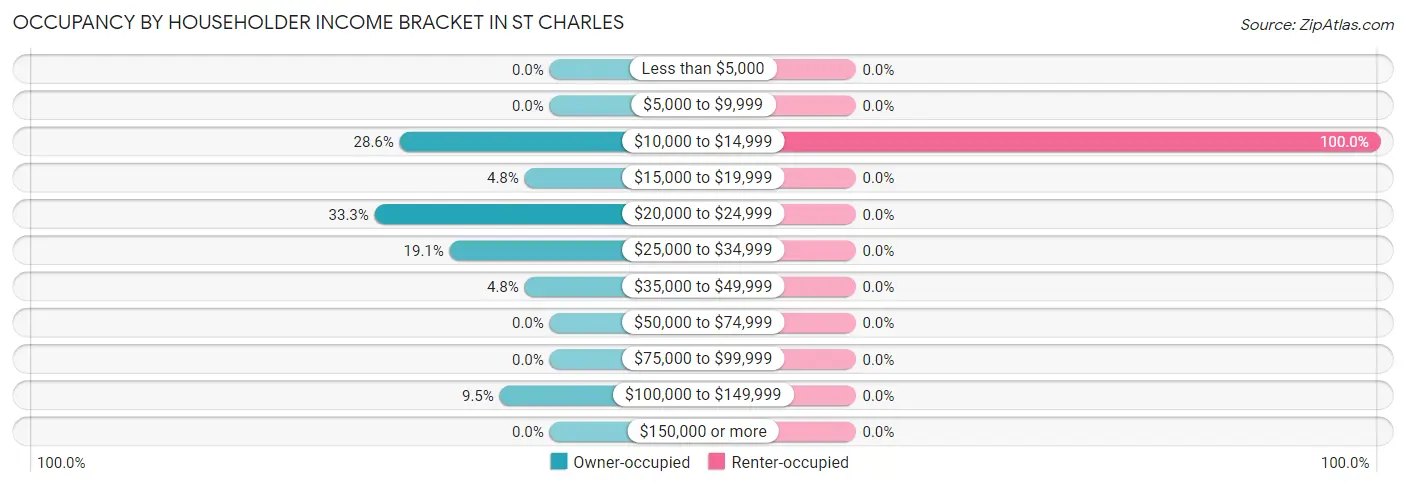
| Income Bracket | Owner-occupied | Renter-occupied |
| Less than $5,000 | 0 (0.0%) | 0 (0.0%) |
| $5,000 to $9,999 | 0 (0.0%) | 0 (0.0%) |
| $10,000 to $14,999 | 6 (28.6%) | 7 (100.0%) |
| $15,000 to $19,999 | 1 (4.8%) | 0 (0.0%) |
| $20,000 to $24,999 | 7 (33.3%) | 0 (0.0%) |
| $25,000 to $34,999 | 4 (19.1%) | 0 (0.0%) |
| $35,000 to $49,999 | 1 (4.8%) | 0 (0.0%) |
| $50,000 to $74,999 | 0 (0.0%) | 0 (0.0%) |
| $75,000 to $99,999 | 0 (0.0%) | 0 (0.0%) |
| $100,000 to $149,999 | 2 (9.5%) | 0 (0.0%) |
| $150,000 or more | 0 (0.0%) | 0 (0.0%) |
| Total | 21 (100.0%) | 7 (100.0%) |
Monthly Housing Cost Tiers in St Charles
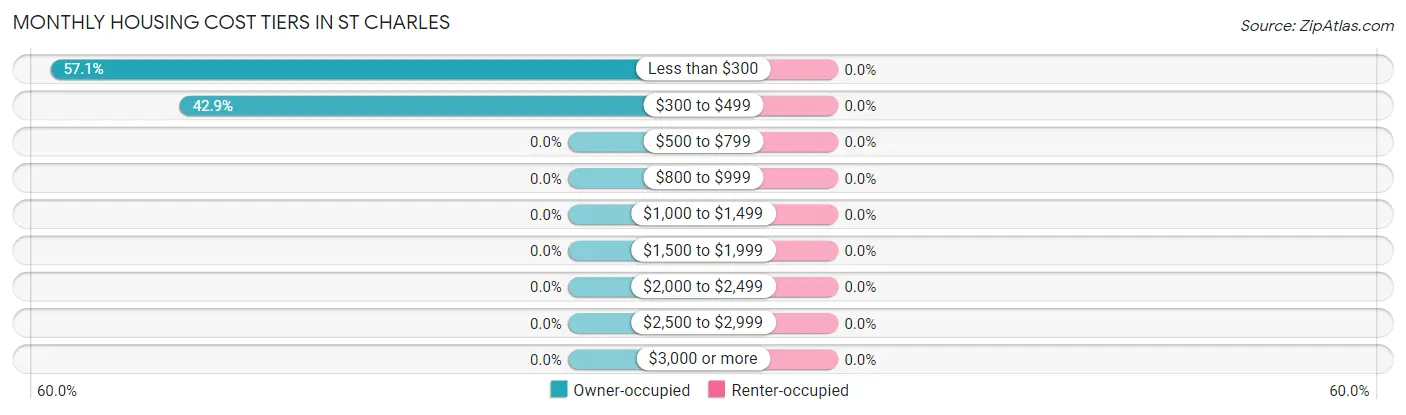
| Monthly Cost | Owner-occupied | Renter-occupied |
| Less than $300 | 12 (57.1%) | 0 (0.0%) |
| $300 to $499 | 9 (42.9%) | 0 (0.0%) |
| $500 to $799 | 0 (0.0%) | 0 (0.0%) |
| $800 to $999 | 0 (0.0%) | 0 (0.0%) |
| $1,000 to $1,499 | 0 (0.0%) | 0 (0.0%) |
| $1,500 to $1,999 | 0 (0.0%) | 0 (0.0%) |
| $2,000 to $2,499 | 0 (0.0%) | 0 (0.0%) |
| $2,500 to $2,999 | 0 (0.0%) | 0 (0.0%) |
| $3,000 or more | 0 (0.0%) | 0 (0.0%) |
| Total | 21 (100.0%) | 7 (100.0%) |
Physical Housing Characteristics in St Charles
Housing Structures in St Charles
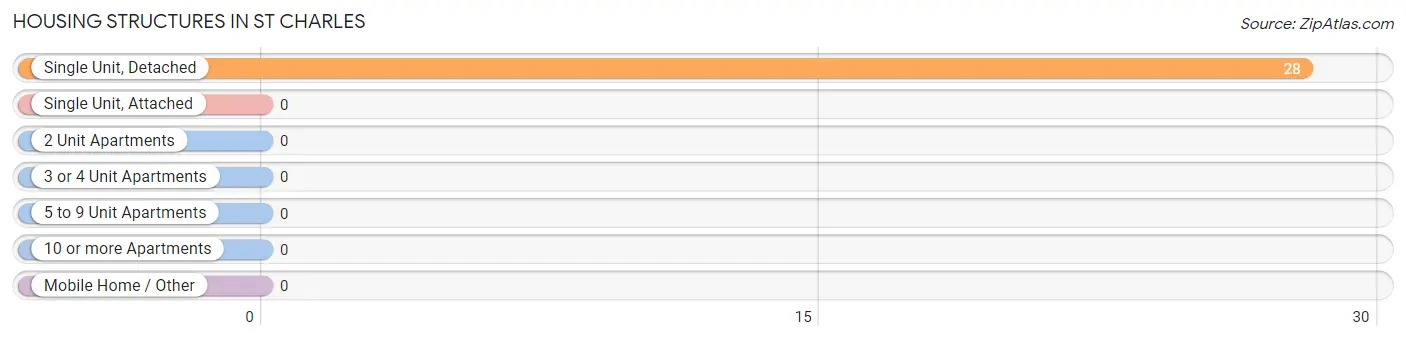
| Structure Type | # Housing Units | % Housing Units |
| Single Unit, Detached | 28 | 100.0% |
| Single Unit, Attached | 0 | 0.0% |
| 2 Unit Apartments | 0 | 0.0% |
| 3 or 4 Unit Apartments | 0 | 0.0% |
| 5 to 9 Unit Apartments | 0 | 0.0% |
| 10 or more Apartments | 0 | 0.0% |
| Mobile Home / Other | 0 | 0.0% |
| Total | 28 | 100.0% |
Housing Structures by Occupancy in St Charles
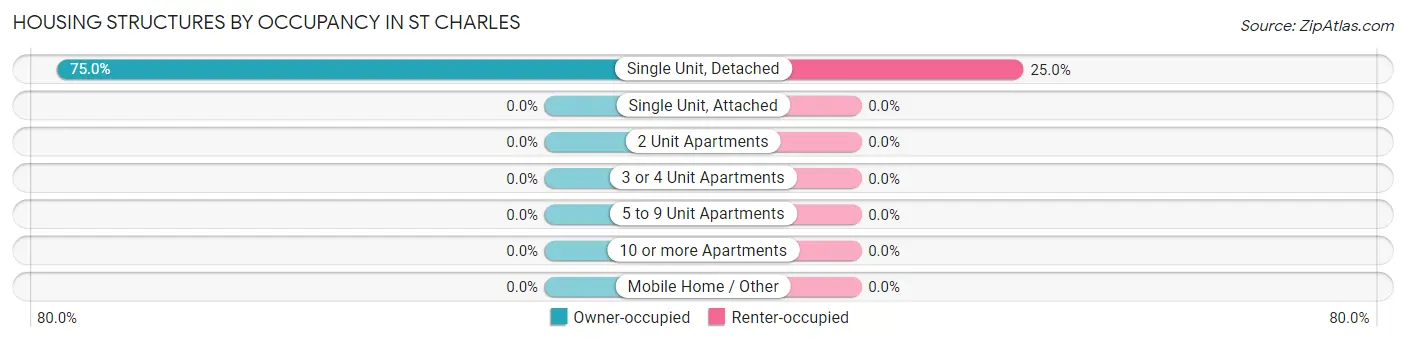
| Structure Type | Owner-occupied | Renter-occupied |
| Single Unit, Detached | 21 (75.0%) | 7 (25.0%) |
| Single Unit, Attached | 0 (0.0%) | 0 (0.0%) |
| 2 Unit Apartments | 0 (0.0%) | 0 (0.0%) |
| 3 or 4 Unit Apartments | 0 (0.0%) | 0 (0.0%) |
| 5 to 9 Unit Apartments | 0 (0.0%) | 0 (0.0%) |
| 10 or more Apartments | 0 (0.0%) | 0 (0.0%) |
| Mobile Home / Other | 0 (0.0%) | 0 (0.0%) |
| Total | 21 (75.0%) | 7 (25.0%) |
Housing Structures by Number of Rooms in St Charles
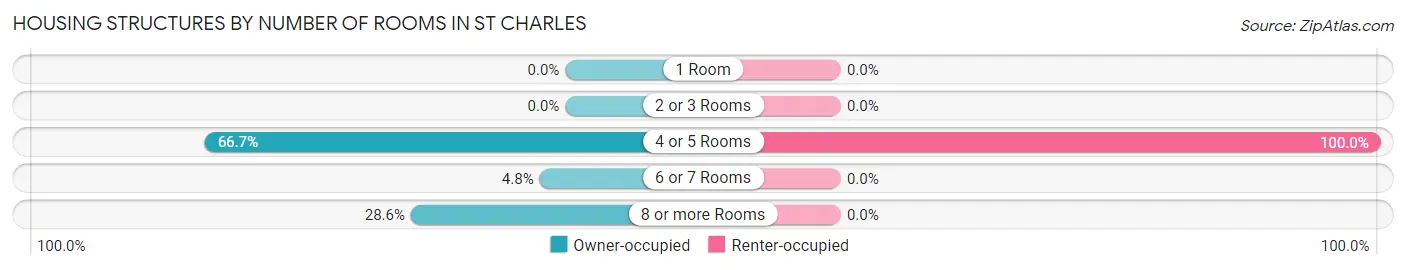
| Number of Rooms | Owner-occupied | Renter-occupied |
| 1 Room | 0 (0.0%) | 0 (0.0%) |
| 2 or 3 Rooms | 0 (0.0%) | 0 (0.0%) |
| 4 or 5 Rooms | 14 (66.7%) | 7 (100.0%) |
| 6 or 7 Rooms | 1 (4.8%) | 0 (0.0%) |
| 8 or more Rooms | 6 (28.6%) | 0 (0.0%) |
| Total | 21 (100.0%) | 7 (100.0%) |
Housing Structure by Heating Type in St Charles
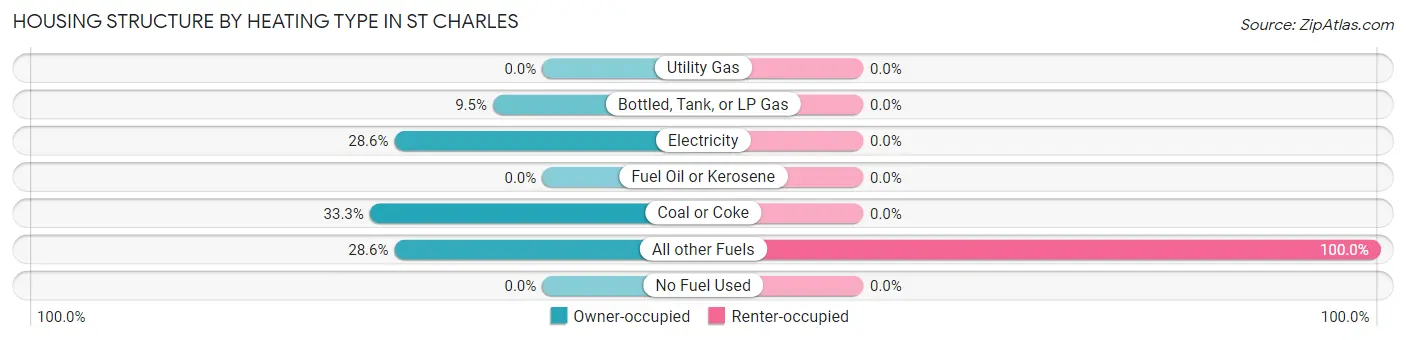
| Heating Type | Owner-occupied | Renter-occupied |
| Utility Gas | 0 (0.0%) | 0 (0.0%) |
| Bottled, Tank, or LP Gas | 2 (9.5%) | 0 (0.0%) |
| Electricity | 6 (28.6%) | 0 (0.0%) |
| Fuel Oil or Kerosene | 0 (0.0%) | 0 (0.0%) |
| Coal or Coke | 7 (33.3%) | 0 (0.0%) |
| All other Fuels | 6 (28.6%) | 7 (100.0%) |
| No Fuel Used | 0 (0.0%) | 0 (0.0%) |
| Total | 21 (100.0%) | 7 (100.0%) |
Household Vehicle Usage in St Charles
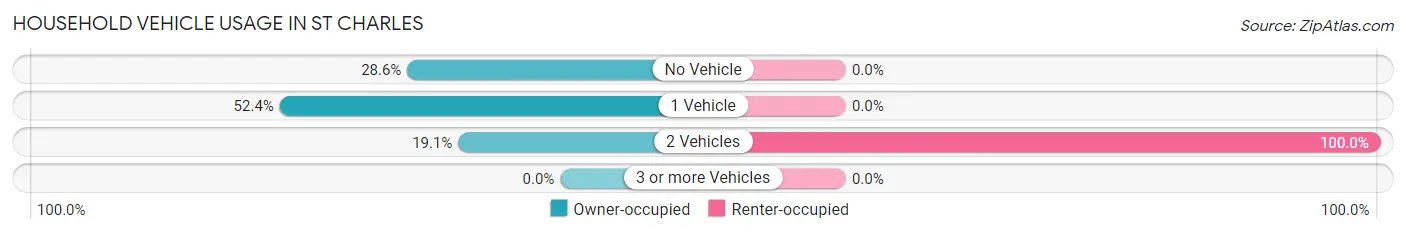
| Vehicles per Household | Owner-occupied | Renter-occupied |
| No Vehicle | 6 (28.6%) | 0 (0.0%) |
| 1 Vehicle | 11 (52.4%) | 0 (0.0%) |
| 2 Vehicles | 4 (19.1%) | 7 (100.0%) |
| 3 or more Vehicles | 0 (0.0%) | 0 (0.0%) |
| Total | 21 (100.0%) | 7 (100.0%) |
Real Estate & Mortgages in St Charles
Real Estate and Mortgage Overview in St Charles
| Characteristic | Without Mortgage | With Mortgage |
| Housing Units | 21 | 0 |
| Median Property Value | $14,600 | $0 |
| Median Household Income | $21,750 | $0 |
| Monthly Housing Costs | $285 | $0 |
| Real Estate Taxes | $199 | $0 |
Property Value by Mortgage Status in St Charles
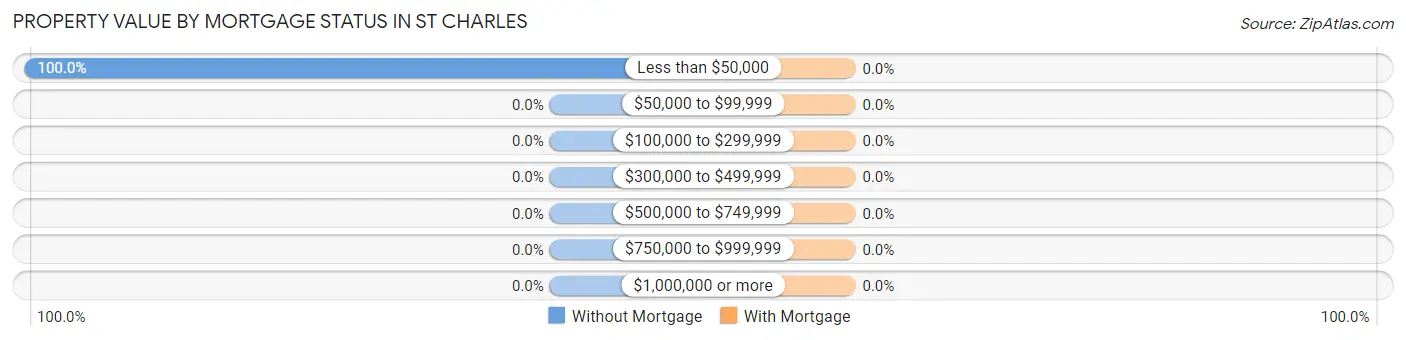
| Property Value | Without Mortgage | With Mortgage |
| Less than $50,000 | 21 (100.0%) | 0 (0.0%) |
| $50,000 to $99,999 | 0 (0.0%) | 0 (0.0%) |
| $100,000 to $299,999 | 0 (0.0%) | 0 (0.0%) |
| $300,000 to $499,999 | 0 (0.0%) | 0 (0.0%) |
| $500,000 to $749,999 | 0 (0.0%) | 0 (0.0%) |
| $750,000 to $999,999 | 0 (0.0%) | 0 (0.0%) |
| $1,000,000 or more | 0 (0.0%) | 0 (0.0%) |
| Total | 21 (100.0%) | 0 (0.0%) |
Household Income by Mortgage Status in St Charles
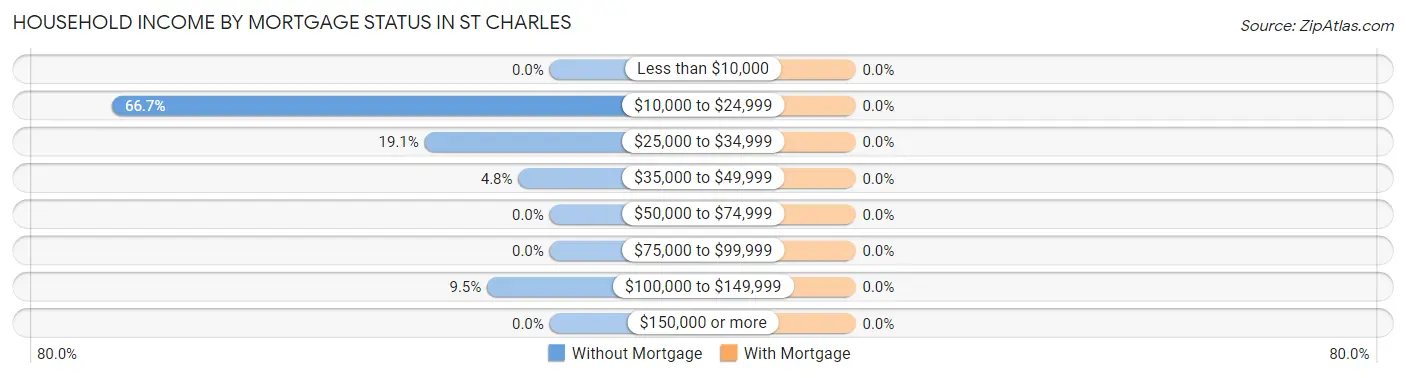
| Household Income | Without Mortgage | With Mortgage |
| Less than $10,000 | 0 (0.0%) | 0 (0.0%) |
| $10,000 to $24,999 | 14 (66.7%) | 0 (0.0%) |
| $25,000 to $34,999 | 4 (19.1%) | 0 (0.0%) |
| $35,000 to $49,999 | 1 (4.8%) | 0 (0.0%) |
| $50,000 to $74,999 | 0 (0.0%) | 0 (0.0%) |
| $75,000 to $99,999 | 0 (0.0%) | 0 (0.0%) |
| $100,000 to $149,999 | 2 (9.5%) | 0 (0.0%) |
| $150,000 or more | 0 (0.0%) | 0 (0.0%) |
| Total | 21 (100.0%) | 0 (0.0%) |
Property Value to Household Income Ratio in St Charles
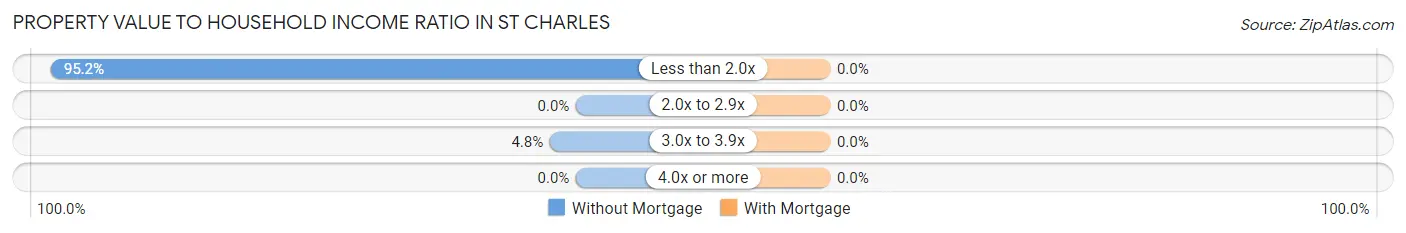
| Value-to-Income Ratio | Without Mortgage | With Mortgage |
| Less than 2.0x | 20 (95.2%) | 0 (0.0%) |
| 2.0x to 2.9x | 0 (0.0%) | 0 (0.0%) |
| 3.0x to 3.9x | 1 (4.8%) | 0 (0.0%) |
| 4.0x or more | 0 (0.0%) | 0 (0.0%) |
| Total | 21 (100.0%) | 0 (0.0%) |
Real Estate Taxes by Mortgage Status in St Charles
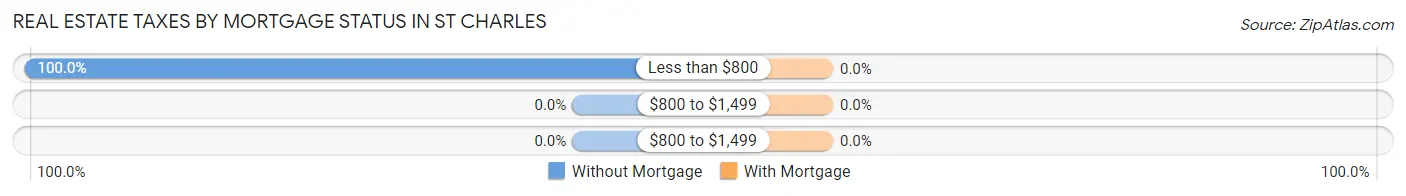
| Property Taxes | Without Mortgage | With Mortgage |
| Less than $800 | 21 (100.0%) | 0 (0.0%) |
| $800 to $1,499 | 0 (0.0%) | 0 (0.0%) |
| $800 to $1,499 | 0 (0.0%) | 0 (0.0%) |
| Total | 21 (100.0%) | 0 (0.0%) |
Health & Disability in St Charles
Health Insurance Coverage by Age in St Charles
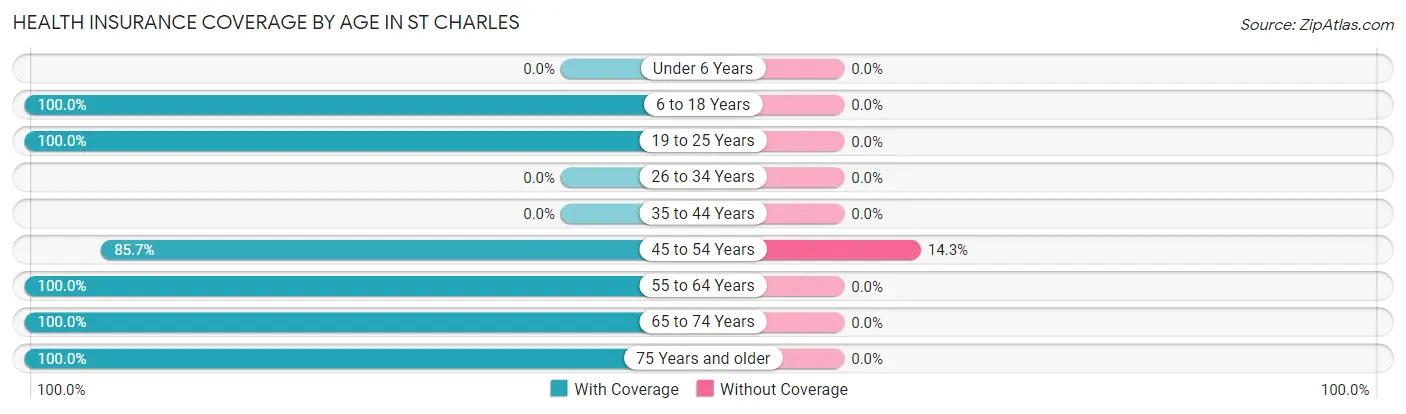
| Age Bracket | With Coverage | Without Coverage |
| Under 6 Years | 0 (0.0%) | 0 (0.0%) |
| 6 to 18 Years | 2 (100.0%) | 0 (0.0%) |
| 19 to 25 Years | 13 (100.0%) | 0 (0.0%) |
| 26 to 34 Years | 0 (0.0%) | 0 (0.0%) |
| 35 to 44 Years | 0 (0.0%) | 0 (0.0%) |
| 45 to 54 Years | 24 (85.7%) | 4 (14.3%) |
| 55 to 64 Years | 9 (100.0%) | 0 (0.0%) |
| 65 to 74 Years | 11 (100.0%) | 0 (0.0%) |
| 75 Years and older | 1 (100.0%) | 0 (0.0%) |
| Total | 60 (93.8%) | 4 (6.2%) |
Health Insurance Coverage by Citizenship Status in St Charles
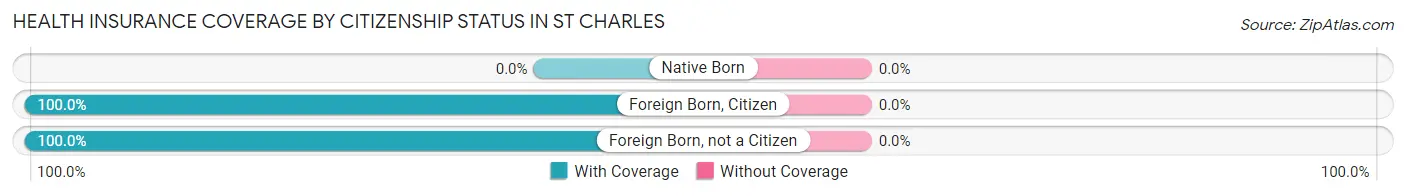
| Citizenship Status | With Coverage | Without Coverage |
| Native Born | 0 (0.0%) | 0 (0.0%) |
| Foreign Born, Citizen | 2 (100.0%) | 0 (0.0%) |
| Foreign Born, not a Citizen | 13 (100.0%) | 0 (0.0%) |
Health Insurance Coverage by Household Income in St Charles
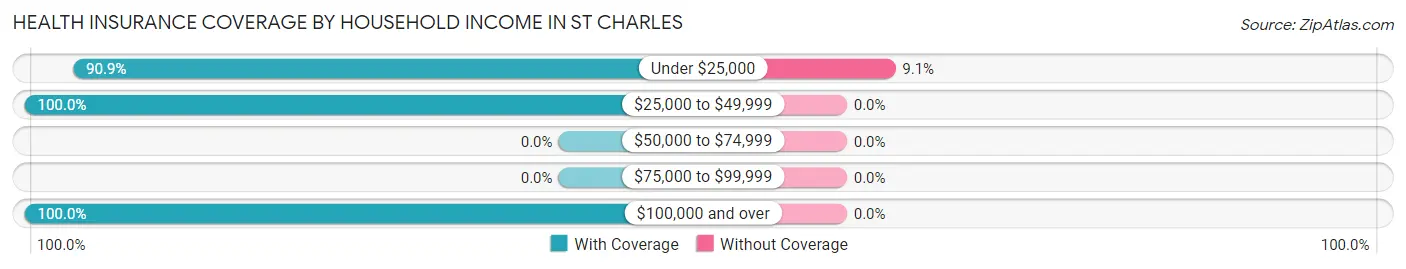
| Household Income | With Coverage | Without Coverage |
| Under $25,000 | 40 (90.9%) | 4 (9.1%) |
| $25,000 to $49,999 | 9 (100.0%) | 0 (0.0%) |
| $50,000 to $74,999 | 0 (0.0%) | 0 (0.0%) |
| $75,000 to $99,999 | 0 (0.0%) | 0 (0.0%) |
| $100,000 and over | 11 (100.0%) | 0 (0.0%) |
Public vs Private Health Insurance Coverage by Age in St Charles
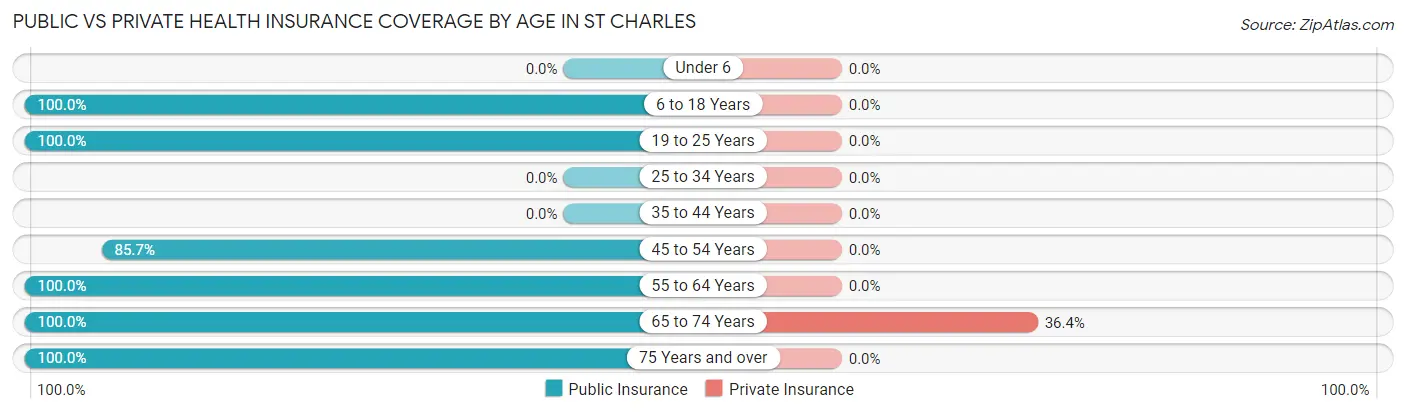
| Age Bracket | Public Insurance | Private Insurance |
| Under 6 | 0 (0.0%) | 0 (0.0%) |
| 6 to 18 Years | 2 (100.0%) | 0 (0.0%) |
| 19 to 25 Years | 13 (100.0%) | 0 (0.0%) |
| 25 to 34 Years | 0 (0.0%) | 0 (0.0%) |
| 35 to 44 Years | 0 (0.0%) | 0 (0.0%) |
| 45 to 54 Years | 24 (85.7%) | 0 (0.0%) |
| 55 to 64 Years | 9 (100.0%) | 0 (0.0%) |
| 65 to 74 Years | 11 (100.0%) | 4 (36.4%) |
| 75 Years and over | 1 (100.0%) | 0 (0.0%) |
| Total | 60 (93.8%) | 4 (6.2%) |
Disability Status by Sex by Age in St Charles
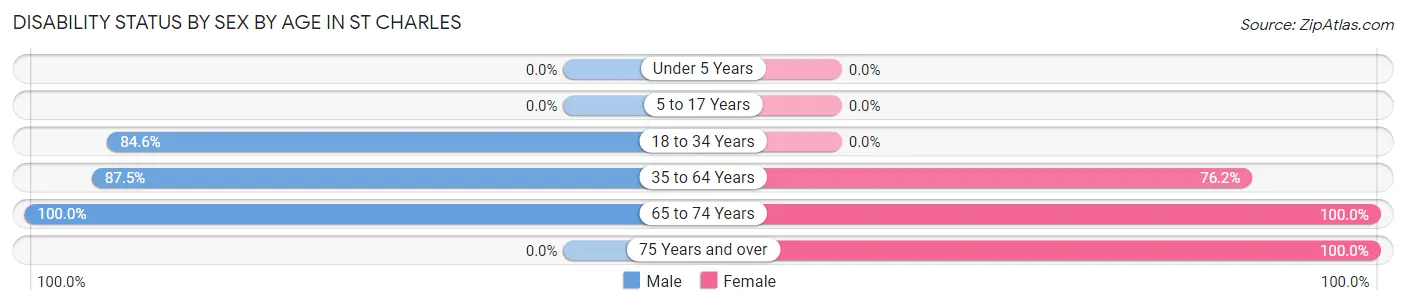
| Age Bracket | Male | Female |
| Under 5 Years | 0 (0.0%) | 0 (0.0%) |
| 5 to 17 Years | 0 (0.0%) | 0 (0.0%) |
| 18 to 34 Years | 11 (84.6%) | 0 (0.0%) |
| 35 to 64 Years | 14 (87.5%) | 16 (76.2%) |
| 65 to 74 Years | 7 (100.0%) | 4 (100.0%) |
| 75 Years and over | 0 (0.0%) | 1 (100.0%) |
Disability Class by Sex by Age in St Charles
Disability Class: Hearing Difficulty
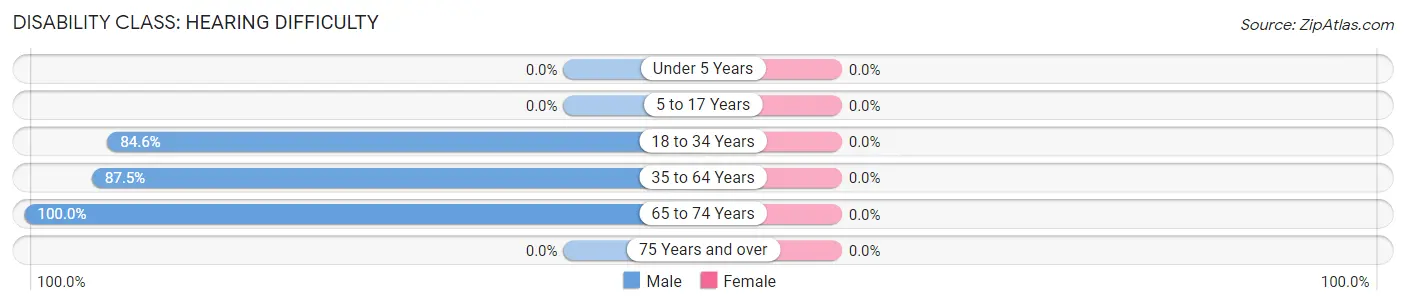
| Age Bracket | Male | Female |
| Under 5 Years | 0 (0.0%) | 0 (0.0%) |
| 5 to 17 Years | 0 (0.0%) | 0 (0.0%) |
| 18 to 34 Years | 11 (84.6%) | 0 (0.0%) |
| 35 to 64 Years | 14 (87.5%) | 0 (0.0%) |
| 65 to 74 Years | 7 (100.0%) | 0 (0.0%) |
| 75 Years and over | 0 (0.0%) | 0 (0.0%) |
Disability Class: Vision Difficulty
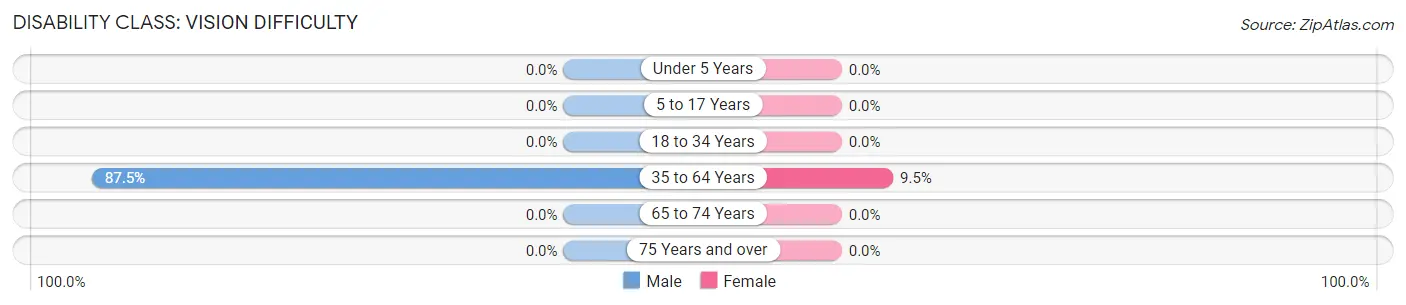
| Age Bracket | Male | Female |
| Under 5 Years | 0 (0.0%) | 0 (0.0%) |
| 5 to 17 Years | 0 (0.0%) | 0 (0.0%) |
| 18 to 34 Years | 0 (0.0%) | 0 (0.0%) |
| 35 to 64 Years | 14 (87.5%) | 2 (9.5%) |
| 65 to 74 Years | 0 (0.0%) | 0 (0.0%) |
| 75 Years and over | 0 (0.0%) | 0 (0.0%) |
Disability Class: Cognitive Difficulty
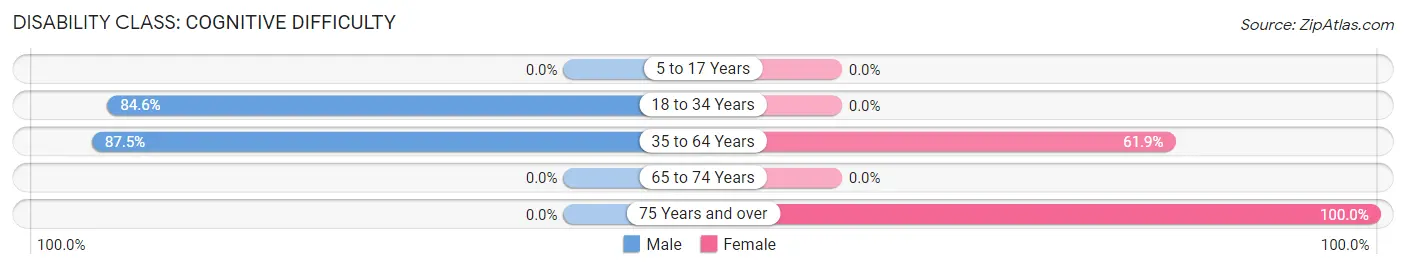
| Age Bracket | Male | Female |
| 5 to 17 Years | 0 (0.0%) | 0 (0.0%) |
| 18 to 34 Years | 11 (84.6%) | 0 (0.0%) |
| 35 to 64 Years | 14 (87.5%) | 13 (61.9%) |
| 65 to 74 Years | 0 (0.0%) | 0 (0.0%) |
| 75 Years and over | 0 (0.0%) | 1 (100.0%) |
Disability Class: Ambulatory Difficulty
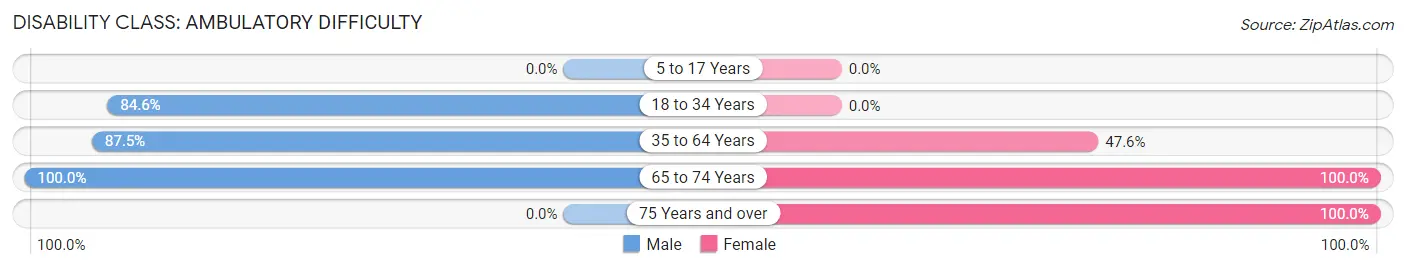
| Age Bracket | Male | Female |
| 5 to 17 Years | 0 (0.0%) | 0 (0.0%) |
| 18 to 34 Years | 11 (84.6%) | 0 (0.0%) |
| 35 to 64 Years | 14 (87.5%) | 10 (47.6%) |
| 65 to 74 Years | 7 (100.0%) | 4 (100.0%) |
| 75 Years and over | 0 (0.0%) | 1 (100.0%) |
Disability Class: Self-Care Difficulty
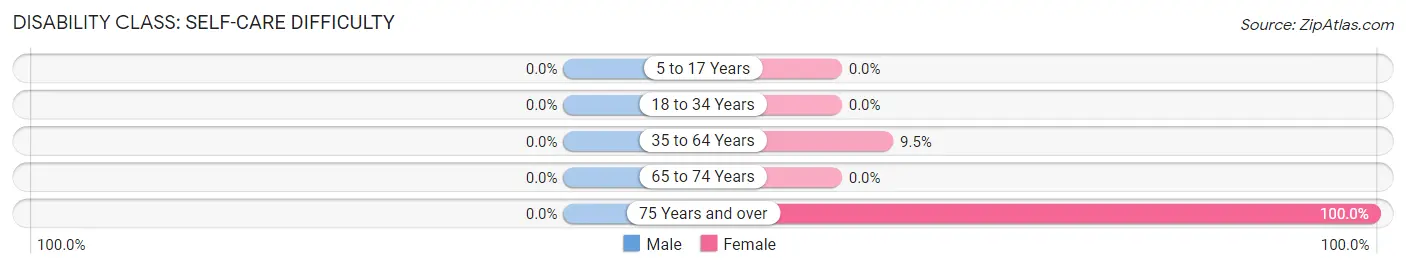
| Age Bracket | Male | Female |
| 5 to 17 Years | 0 (0.0%) | 0 (0.0%) |
| 18 to 34 Years | 0 (0.0%) | 0 (0.0%) |
| 35 to 64 Years | 0 (0.0%) | 2 (9.5%) |
| 65 to 74 Years | 0 (0.0%) | 0 (0.0%) |
| 75 Years and over | 0 (0.0%) | 1 (100.0%) |
Technology Access in St Charles
Computing Device Access in St Charles
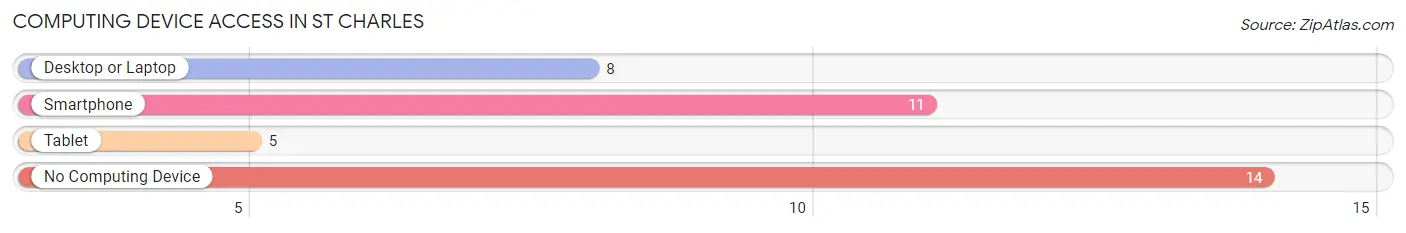
| Device Type | # Households | % Households |
| Desktop or Laptop | 8 | 28.6% |
| Smartphone | 11 | 39.3% |
| Tablet | 5 | 17.9% |
| No Computing Device | 14 | 50.0% |
| Total | 28 | 100.0% |
Internet Access in St Charles
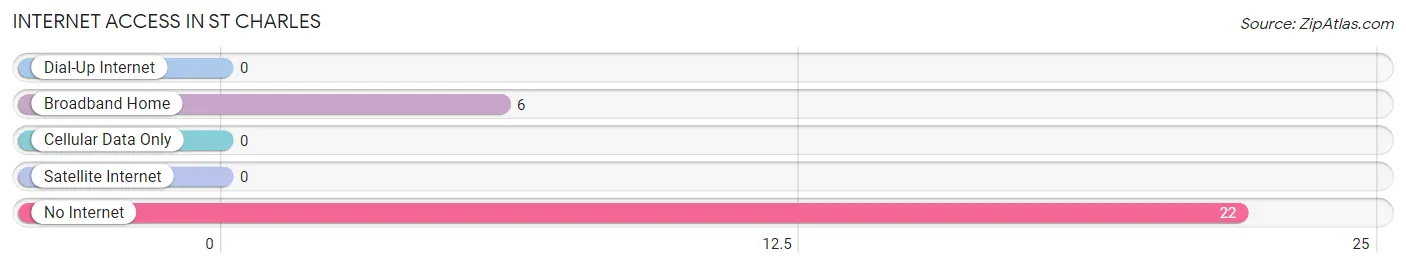
| Internet Type | # Households | % Households |
| Dial-Up Internet | 0 | 0.0% |
| Broadband Home | 6 | 21.4% |
| Cellular Data Only | 0 | 0.0% |
| Satellite Internet | 0 | 0.0% |
| No Internet | 22 | 78.6% |
| Total | 28 | 100.0% |
St Charles Summary
St. Charles is a small town located in the state of Virginia, in the United States. It is situated in the northern part of the state, in the Shenandoah Valley region. The town is located in the county of Augusta, and is part of the Staunton-Waynesboro Metropolitan Statistical Area. The population of St. Charles was estimated to be 1,845 in 2019.
History
St. Charles was founded in 1745 by a group of German settlers. The town was originally known as “New Germantown”, and was later renamed St. Charles in honor of Charles II of England. The town was incorporated in 1802, and was the first town in Augusta County to be incorporated.
The town was an important stop on the Staunton-Parkersburg Turnpike, which was a major transportation route in the 19th century. The turnpike connected Staunton, Virginia to Parkersburg, West Virginia. The town was also an important stop on the Virginia Central Railroad, which connected Richmond to the Shenandoah Valley.
Geography
St. Charles is located in the northern part of the state of Virginia, in the Shenandoah Valley region. The town is situated in the county of Augusta, and is part of the Staunton-Waynesboro Metropolitan Statistical Area. The town is located at the intersection of US Route 11 and US Route 340.
The town is situated in a valley, surrounded by the Blue Ridge Mountains to the east and the Allegheny Mountains to the west. The town is located at an elevation of 1,068 feet (326 meters). The climate in St. Charles is humid subtropical, with hot summers and cold winters.
Economy
The economy of St. Charles is largely based on agriculture and tourism. The town is home to several farms, which produce a variety of crops, including corn, soybeans, wheat, and hay. The town is also home to several wineries, which produce a variety of wines.
The town is also a popular tourist destination, due to its proximity to the Shenandoah National Park and the George Washington National Forest. The town is home to several bed and breakfasts, as well as several restaurants and shops.
Demographics
The population of St. Charles was estimated to be 1,845 in 2019. The town has a population density of 545 people per square mile (210 people per square kilometer). The median age of the population is 44.7 years, and the median household income is $45,945.
The racial makeup of the town is 94.2% White, 2.2% African American, 0.7% Asian, 0.3% Native American, and 2.6% from other races. The town has a large Hispanic population, with 8.3% of the population being of Hispanic or Latino origin.
The town is served by the Augusta County Public Schools system. The town is home to one elementary school, one middle school, and one high school. The town is also home to a branch of the Blue Ridge Community College.
Common Questions
What is Per Capita Income in St Charles?
Per Capita income in St Charles is $16,305.
What is the Median Household income in St Charles?
Median Household Income in St Charles is $18,750.
What is Inequality or Gini Index in St Charles?
Inequality or Gini Index in St Charles is 0.46.
What is the Total Population of St Charles?
Total Population of St Charles is 64.
What is the Total Male Population of St Charles?
Total Male Population of St Charles is 38.
What is the Total Female Population of St Charles?
Total Female Population of St Charles is 26.
What is the Ratio of Males per 100 Females in St Charles?
There are 146.15 Males per 100 Females in St Charles.
What is the Ratio of Females per 100 Males in St Charles?
There are 68.42 Females per 100 Males in St Charles.
What is the Median Population Age in St Charles?
Median Population Age in St Charles is 50.9 Years.
What is the Average Family Size in St Charles
Average Family Size in St Charles is 4.6 People.
What is the Average Household Size in St Charles
Average Household Size in St Charles is 2.3 People.
How Large is the Labor Force in St Charles?
There are 9 People in the Labor Forcein in St Charles.
What is the Percentage of People in the Labor Force in St Charles?
14.5% of People are in the Labor Force in St Charles.
What is the Unemployment Rate in St Charles?
Unemployment Rate in St Charles is 22.2%.