Farmville, VA Map & Demographics
Farmville Map
Farmville Overview
$19,935
PER CAPITA INCOME
$56,722
AVG FAMILY INCOME
$39,233
AVG HOUSEHOLD INCOME
51.3%
WAGE / INCOME GAP [ % ]
48.7¢/ $1
WAGE / INCOME GAP [ $ ]
0.48
INEQUALITY / GINI INDEX
7,647
TOTAL POPULATION
3,246
MALE POPULATION
4,401
FEMALE POPULATION
73.76
MALES / 100 FEMALES
135.58
FEMALES / 100 MALES
24.4
MEDIAN AGE
2.6
AVG FAMILY SIZE
1.9
AVG HOUSEHOLD SIZE
2,648
LABOR FORCE [ PEOPLE ]
37.2%
PERCENT IN LABOR FORCE
3.2%
UNEMPLOYMENT RATE
Farmville Area Codes
Income in Farmville
Income Overview in Farmville
Per Capita Income in Farmville is $19,935, while median incomes of families and households are $56,722 and $39,233 respectively.
| Characteristic | Number | Measure |
| Per Capita Income | 7,647 | $19,935 |
| Median Family Income | 1,070 | $56,722 |
| Mean Family Income | 1,070 | $80,662 |
| Median Household Income | 2,561 | $39,233 |
| Mean Household Income | 2,561 | $55,378 |
| Income Deficit | 1,070 | $0 |
| Wage / Income Gap (%) | 7,647 | 51.26% |
| Wage / Income Gap ($) | 7,647 | 48.74¢ per $1 |
| Gini / Inequality Index | 7,647 | 0.48 |
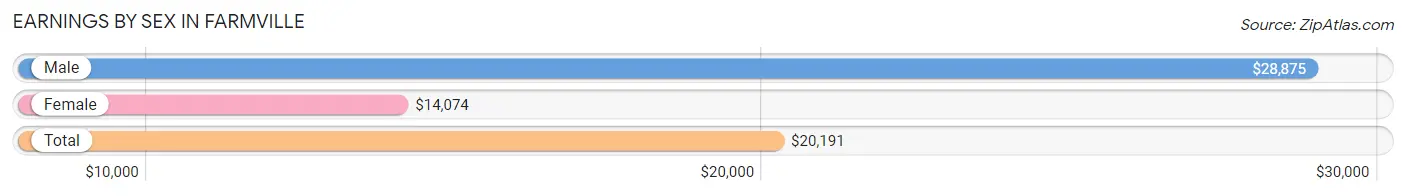
Earnings by Sex in Farmville
Average Earnings in Farmville are $20,191, $28,875 for men and $14,074 for women, a difference of 51.3%.
| Sex | Number | Average Earnings |
| Male | 1,538 (44.7%) | $28,875 |
| Female | 1,904 (55.3%) | $14,074 |
| Total | 3,442 (100.0%) | $20,191 |
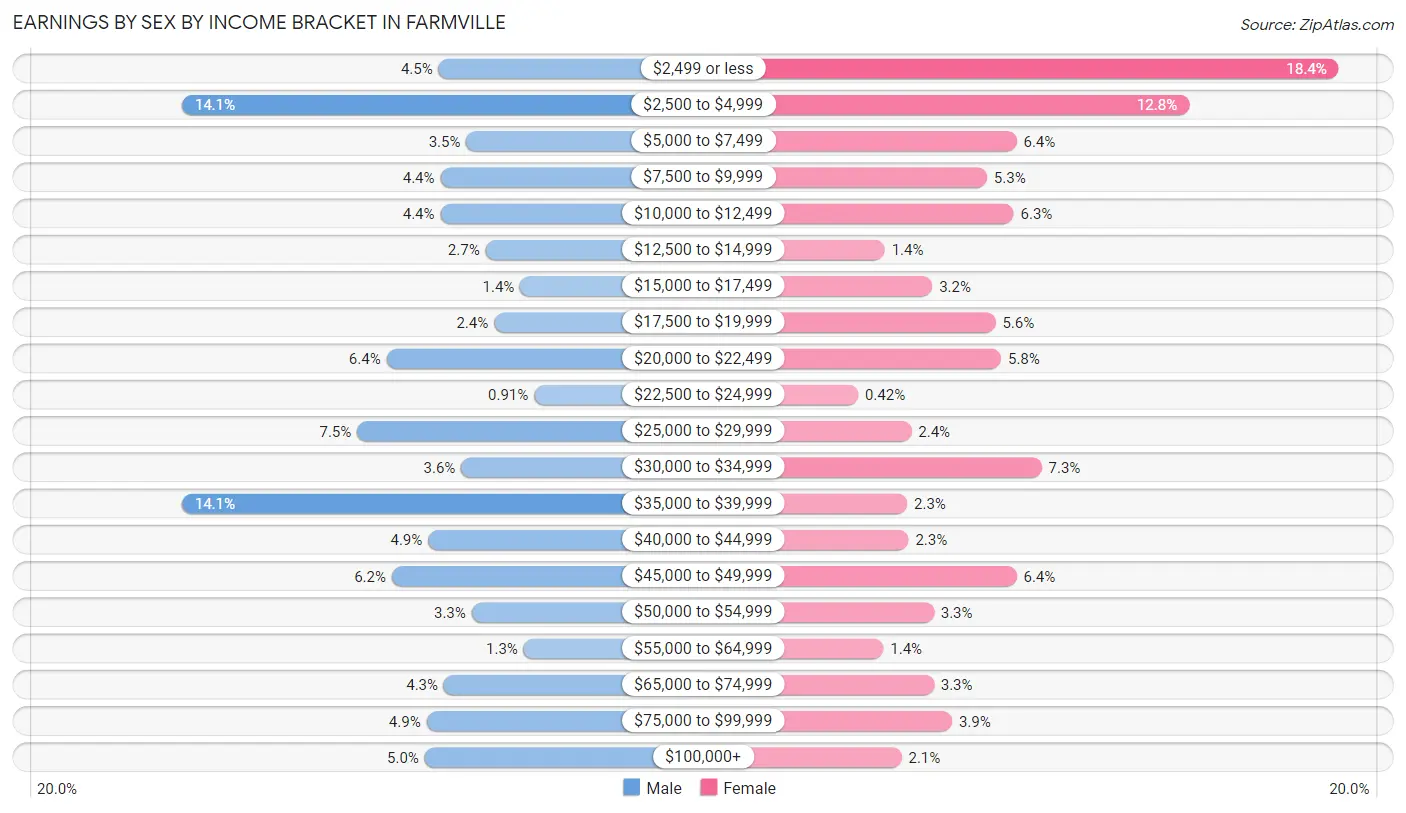
Earnings by Sex by Income Bracket in Farmville
The most common earnings brackets in Farmville are $2,500 to $4,999 for men (217 | 14.1%) and $2,499 or less for women (351 | 18.4%).
| Income | Male | Female |
| $2,499 or less | 69 (4.5%) | 351 (18.4%) |
| $2,500 to $4,999 | 217 (14.1%) | 244 (12.8%) |
| $5,000 to $7,499 | 53 (3.5%) | 121 (6.4%) |
| $7,500 to $9,999 | 68 (4.4%) | 100 (5.2%) |
| $10,000 to $12,499 | 68 (4.4%) | 119 (6.2%) |
| $12,500 to $14,999 | 42 (2.7%) | 27 (1.4%) |
| $15,000 to $17,499 | 22 (1.4%) | 61 (3.2%) |
| $17,500 to $19,999 | 37 (2.4%) | 106 (5.6%) |
| $20,000 to $22,499 | 99 (6.4%) | 110 (5.8%) |
| $22,500 to $24,999 | 14 (0.9%) | 8 (0.4%) |
| $25,000 to $29,999 | 116 (7.5%) | 46 (2.4%) |
| $30,000 to $34,999 | 56 (3.6%) | 139 (7.3%) |
| $35,000 to $39,999 | 217 (14.1%) | 43 (2.3%) |
| $40,000 to $44,999 | 75 (4.9%) | 44 (2.3%) |
| $45,000 to $49,999 | 96 (6.2%) | 121 (6.4%) |
| $50,000 to $54,999 | 50 (3.3%) | 62 (3.3%) |
| $55,000 to $64,999 | 20 (1.3%) | 26 (1.4%) |
| $65,000 to $74,999 | 66 (4.3%) | 62 (3.3%) |
| $75,000 to $99,999 | 76 (4.9%) | 75 (3.9%) |
| $100,000+ | 77 (5.0%) | 39 (2.1%) |
| Total | 1,538 (100.0%) | 1,904 (100.0%) |
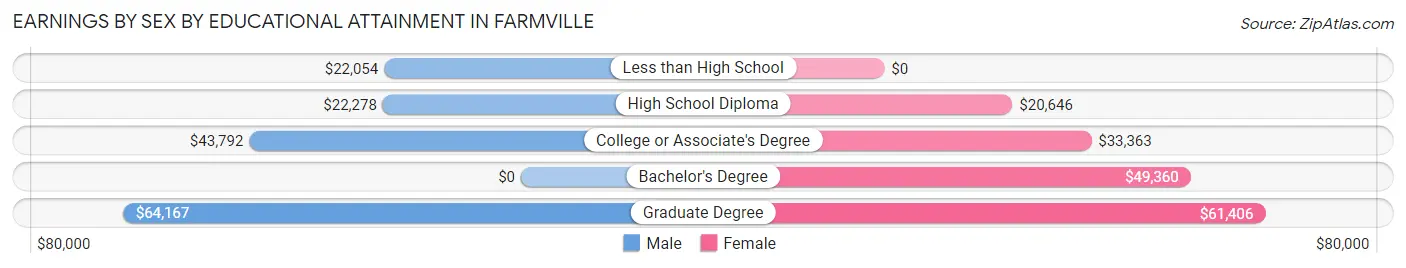
Earnings by Sex by Educational Attainment in Farmville
Average earnings in Farmville are $41,080 for men and $34,254 for women, a difference of 16.6%. Men with an educational attainment of graduate degree enjoy the highest average annual earnings of $64,167, while those with less than high school education earn the least with $22,054. Women with an educational attainment of graduate degree earn the most with the average annual earnings of $61,406, while those with high school diploma education have the smallest earnings of $20,646.
| Educational Attainment | Male Income | Female Income |
| Less than High School | $22,054 | $0 |
| High School Diploma | $22,278 | $20,646 |
| College or Associate's Degree | $43,792 | $33,363 |
| Bachelor's Degree | - | - |
| Graduate Degree | $64,167 | $61,406 |
| Total | $41,080 | $34,254 |
Family Income in Farmville
Family Income Brackets in Farmville
According to the Farmville family income data, there are 300 families falling into the $35,000 to $49,999 income range, which is the most common income bracket and makes up 28.0% of all families. Conversely, the less than $10,000 income bracket is the least frequent group with only 5 families (0.5%) belonging to this category.
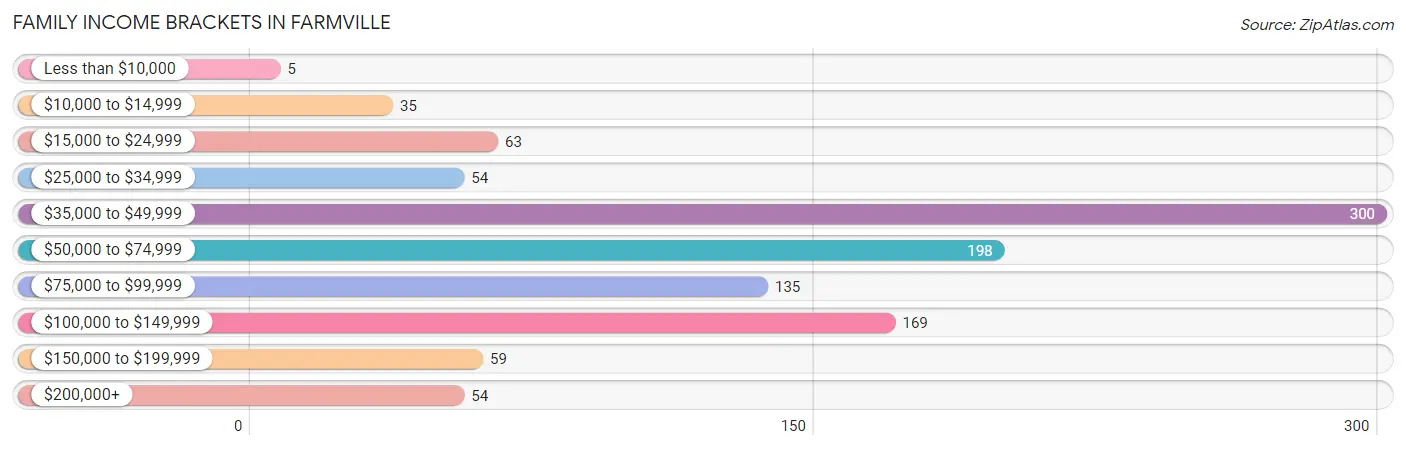
| Income Bracket | # Families | % Families |
| Less than $10,000 | 5 | 0.5% |
| $10,000 to $14,999 | 35 | 3.3% |
| $15,000 to $24,999 | 63 | 5.9% |
| $25,000 to $34,999 | 54 | 5.0% |
| $35,000 to $49,999 | 300 | 28.0% |
| $50,000 to $74,999 | 198 | 18.5% |
| $75,000 to $99,999 | 135 | 12.6% |
| $100,000 to $149,999 | 169 | 15.8% |
| $150,000 to $199,999 | 59 | 5.5% |
| $200,000+ | 54 | 5.0% |
Family Income by Famaliy Size in Farmville
5-person families (31 | 2.9%) account for the highest median family income in Farmville with $205,625 per family, while 5-person families (31 | 2.9%) have the highest median income of $41,125 per family member.
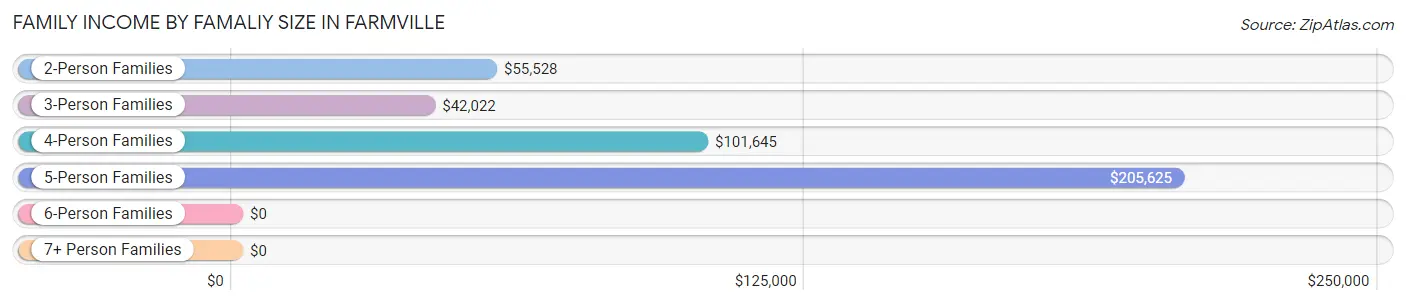
| Income Bracket | # Families | Median Income |
| 2-Person Families | 681 (63.6%) | $55,528 |
| 3-Person Families | 221 (20.6%) | $42,022 |
| 4-Person Families | 137 (12.8%) | $101,645 |
| 5-Person Families | 31 (2.9%) | $205,625 |
| 6-Person Families | 0 (0.0%) | $0 |
| 7+ Person Families | 0 (0.0%) | $0 |
| Total | 1,070 (100.0%) | $56,722 |
Family Income by Number of Earners in Farmville
The median family income in Farmville is $56,722, with families comprising 3+ earners (25) having the highest median family income of $206,375, while families with 1 earner (468) have the lowest median family income of $39,471, accounting for 2.3% and 43.7% of families, respectively.
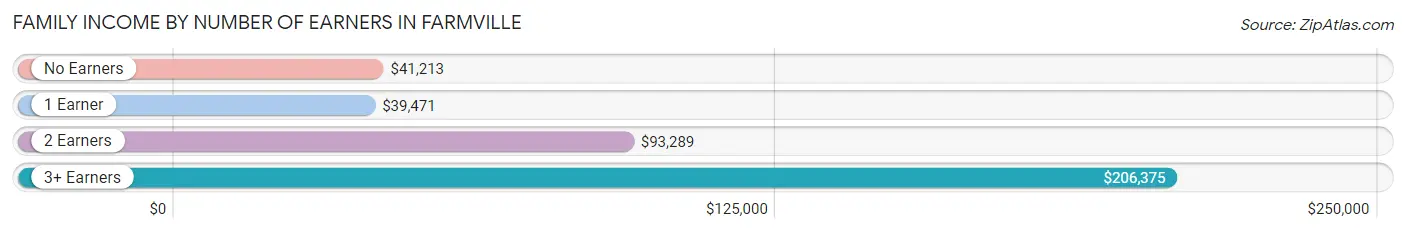
| Number of Earners | # Families | Median Income |
| No Earners | 207 (19.4%) | $41,213 |
| 1 Earner | 468 (43.7%) | $39,471 |
| 2 Earners | 370 (34.6%) | $93,289 |
| 3+ Earners | 25 (2.3%) | $206,375 |
| Total | 1,070 (100.0%) | $56,722 |
Household Income in Farmville
Household Income Brackets in Farmville
With 699 households falling in the category, the $35,000 to $49,999 income range is the most frequent in Farmville, accounting for 27.3% of all households. In contrast, only 59 households (2.3%) fall into the $200,000+ income bracket, making it the least populous group.
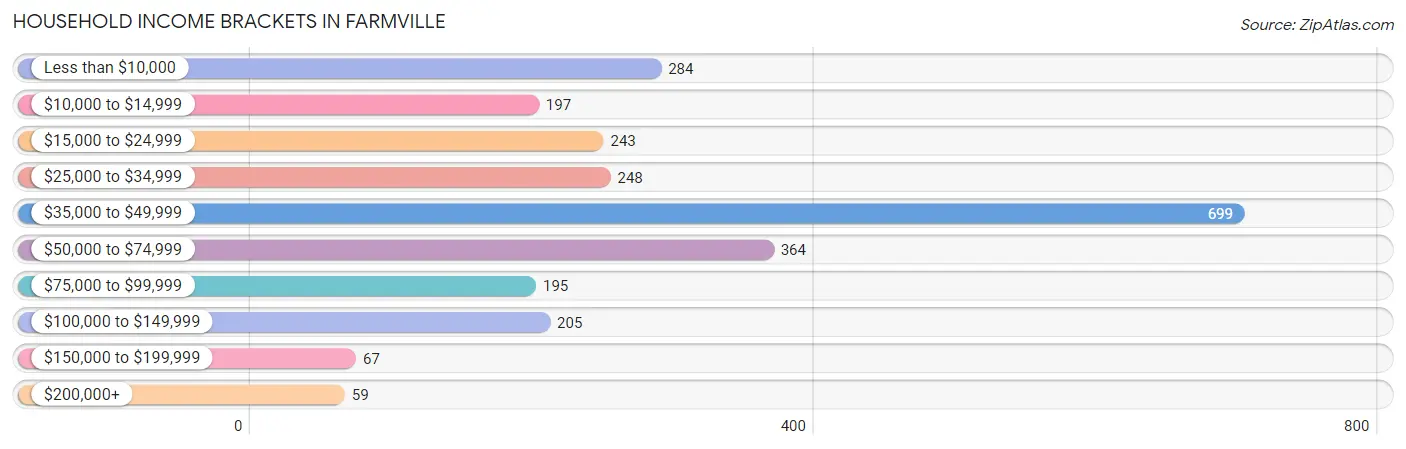
| Income Bracket | # Households | % Households |
| Less than $10,000 | 284 | 11.1% |
| $10,000 to $14,999 | 197 | 7.7% |
| $15,000 to $24,999 | 243 | 9.5% |
| $25,000 to $34,999 | 248 | 9.7% |
| $35,000 to $49,999 | 699 | 27.3% |
| $50,000 to $74,999 | 364 | 14.2% |
| $75,000 to $99,999 | 195 | 7.6% |
| $100,000 to $149,999 | 205 | 8.0% |
| $150,000 to $199,999 | 67 | 2.6% |
| $200,000+ | 59 | 2.3% |
Household Income by Householder Age in Farmville
The median household income in Farmville is $39,233, with the highest median household income of $46,104 found in the 25 to 44 years age bracket for the primary householder. A total of 618 households (24.1%) fall into this category. Meanwhile, the 45 to 64 years age bracket for the primary householder has the lowest median household income of $0, with 624 households (24.4%) in this group.
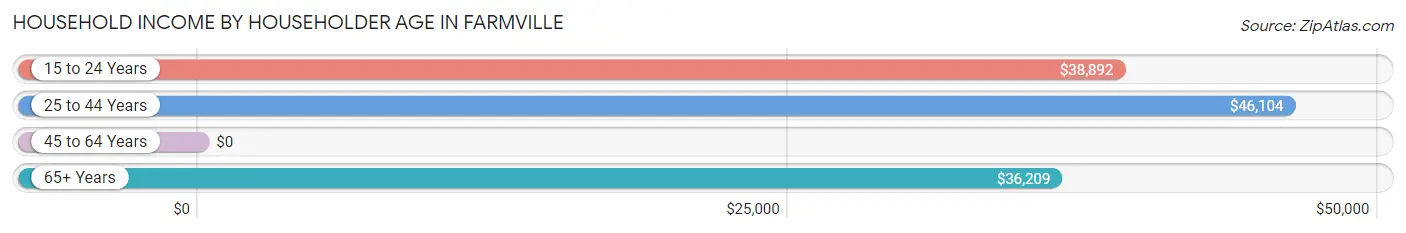
| Income Bracket | # Households | Median Income |
| 15 to 24 Years | 502 (19.6%) | $38,892 |
| 25 to 44 Years | 618 (24.1%) | $46,104 |
| 45 to 64 Years | 624 (24.4%) | $0 |
| 65+ Years | 817 (31.9%) | $36,209 |
| Total | 2,561 (100.0%) | $39,233 |
Poverty in Farmville
Income Below Poverty by Sex and Age in Farmville
With 17.2% poverty level for males and 20.2% for females among the residents of Farmville, 65 to 74 year old males and 18 to 24 year old females are the most vulnerable to poverty, with 51 males (23.9%) and 217 females (54.7%) in their respective age groups living below the poverty level.
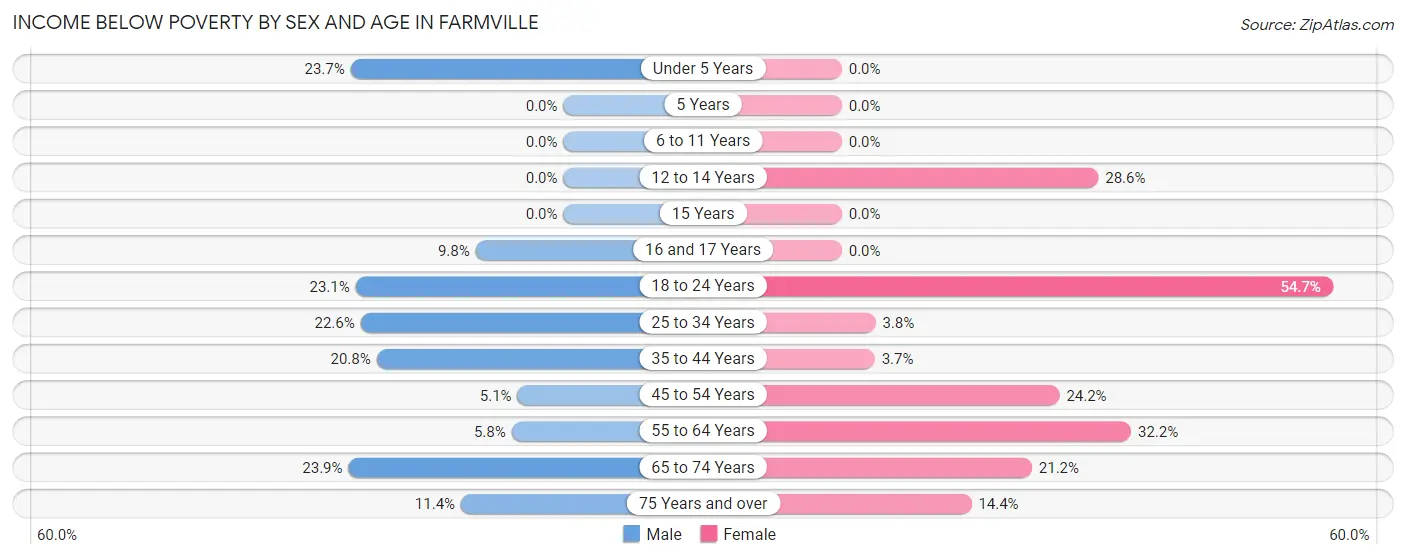
| Age Bracket | Male | Female |
| Under 5 Years | 32 (23.7%) | 0 (0.0%) |
| 5 Years | 0 (0.0%) | 0 (0.0%) |
| 6 to 11 Years | 0 (0.0%) | 0 (0.0%) |
| 12 to 14 Years | 0 (0.0%) | 14 (28.6%) |
| 15 Years | 0 (0.0%) | 0 (0.0%) |
| 16 and 17 Years | 9 (9.8%) | 0 (0.0%) |
| 18 to 24 Years | 115 (23.1%) | 217 (54.7%) |
| 25 to 34 Years | 68 (22.6%) | 19 (3.7%) |
| 35 to 44 Years | 26 (20.8%) | 9 (3.7%) |
| 45 to 54 Years | 7 (5.1%) | 72 (24.2%) |
| 55 to 64 Years | 12 (5.8%) | 86 (32.2%) |
| 65 to 74 Years | 51 (23.9%) | 65 (21.2%) |
| 75 Years and over | 21 (11.4%) | 68 (14.4%) |
| Total | 341 (17.2%) | 550 (20.2%) |
Income Above Poverty by Sex and Age in Farmville
According to the poverty statistics in Farmville, males aged 6 to 11 years and females aged under 5 years are the age groups that are most secure financially, with 100.0% of males and 100.0% of females in these age groups living above the poverty line.
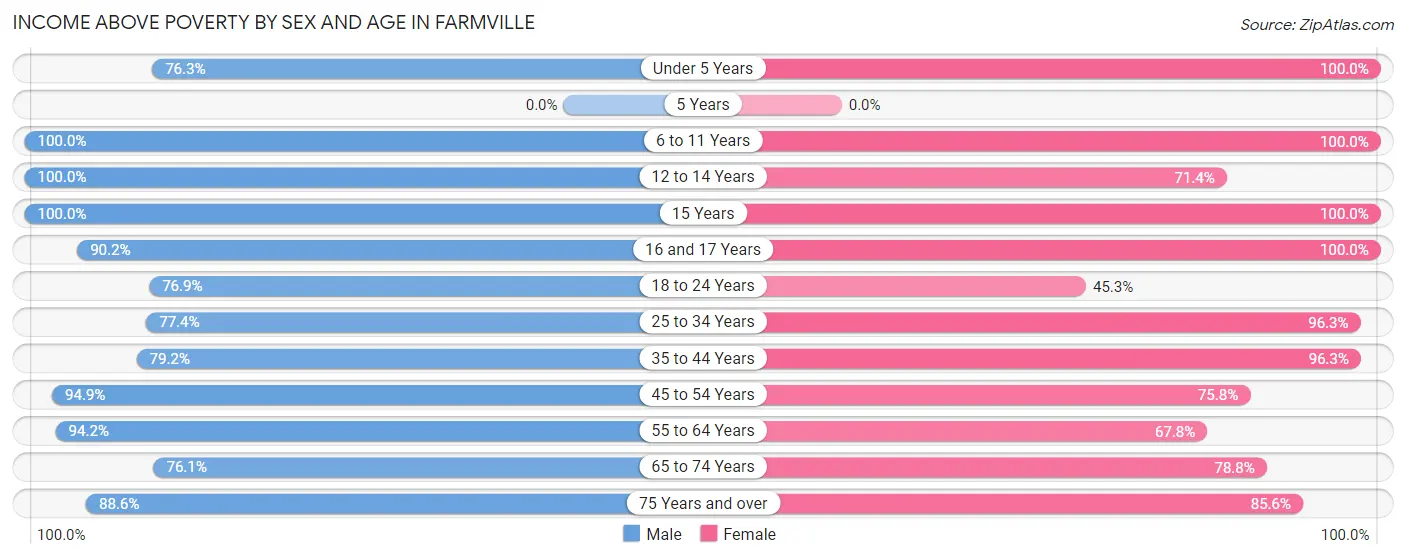
| Age Bracket | Male | Female |
| Under 5 Years | 103 (76.3%) | 65 (100.0%) |
| 5 Years | 0 (0.0%) | 0 (0.0%) |
| 6 to 11 Years | 41 (100.0%) | 99 (100.0%) |
| 12 to 14 Years | 42 (100.0%) | 35 (71.4%) |
| 15 Years | 10 (100.0%) | 15 (100.0%) |
| 16 and 17 Years | 83 (90.2%) | 11 (100.0%) |
| 18 to 24 Years | 382 (76.9%) | 180 (45.3%) |
| 25 to 34 Years | 233 (77.4%) | 488 (96.3%) |
| 35 to 44 Years | 99 (79.2%) | 236 (96.3%) |
| 45 to 54 Years | 130 (94.9%) | 225 (75.8%) |
| 55 to 64 Years | 196 (94.2%) | 181 (67.8%) |
| 65 to 74 Years | 162 (76.1%) | 242 (78.8%) |
| 75 Years and over | 163 (88.6%) | 403 (85.6%) |
| Total | 1,644 (82.8%) | 2,180 (79.8%) |
Income Below Poverty Among Married-Couple Families in Farmville
The poverty statistics for married-couple families in Farmville show that 6.1% or 41 of the total 668 families live below the poverty line. Families with no children have the highest poverty rate of 8.4%, comprising of 41 families. On the other hand, families with 1 or 2 children have the lowest poverty rate of 0.0%, which includes 0 families.
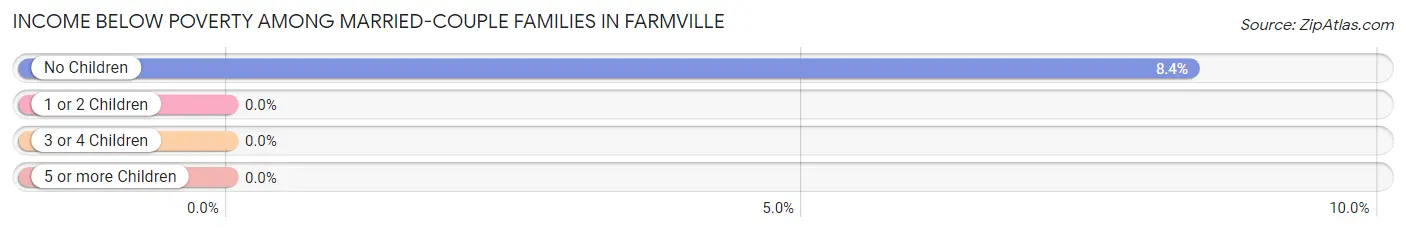
| Children | Above Poverty | Below Poverty |
| No Children | 449 (91.6%) | 41 (8.4%) |
| 1 or 2 Children | 178 (100.0%) | 0 (0.0%) |
| 3 or 4 Children | 0 (0.0%) | 0 (0.0%) |
| 5 or more Children | 0 (0.0%) | 0 (0.0%) |
| Total | 627 (93.9%) | 41 (6.1%) |
Income Below Poverty Among Single-Parent Households in Farmville
According to the poverty data in Farmville, 2.9% or 5 single-father households and 8.8% or 20 single-mother households are living below the poverty line. Among single-father households, those with 1 or 2 children have the highest poverty rate, with 5 households (100.0%) experiencing poverty. Likewise, among single-mother households, those with 1 or 2 children have the highest poverty rate, with 20 households (11.4%) falling below the poverty line.
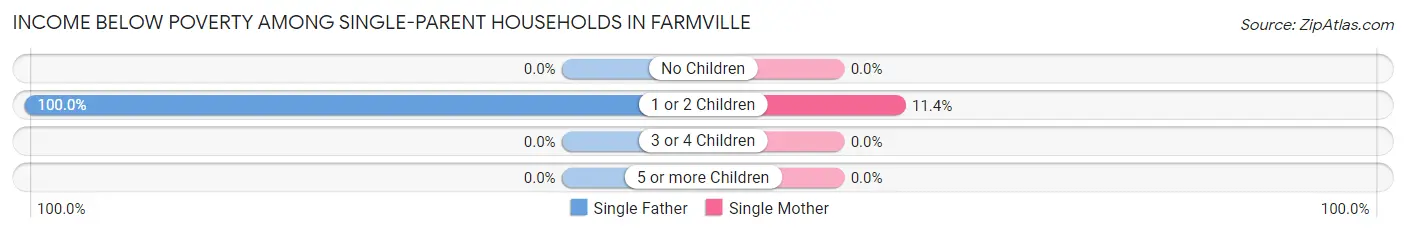
| Children | Single Father | Single Mother |
| No Children | 0 (0.0%) | 0 (0.0%) |
| 1 or 2 Children | 5 (100.0%) | 20 (11.4%) |
| 3 or 4 Children | 0 (0.0%) | 0 (0.0%) |
| 5 or more Children | 0 (0.0%) | 0 (0.0%) |
| Total | 5 (2.9%) | 20 (8.8%) |
Income Below Poverty Among Married-Couple vs Single-Parent Households in Farmville
The poverty data for Farmville shows that 41 of the married-couple family households (6.1%) and 25 of the single-parent households (6.2%) are living below the poverty level. Within the married-couple family households, those with no children have the highest poverty rate, with 41 households (8.4%) falling below the poverty line. Among the single-parent households, those with 1 or 2 children have the highest poverty rate, with 25 household (13.9%) living below poverty.
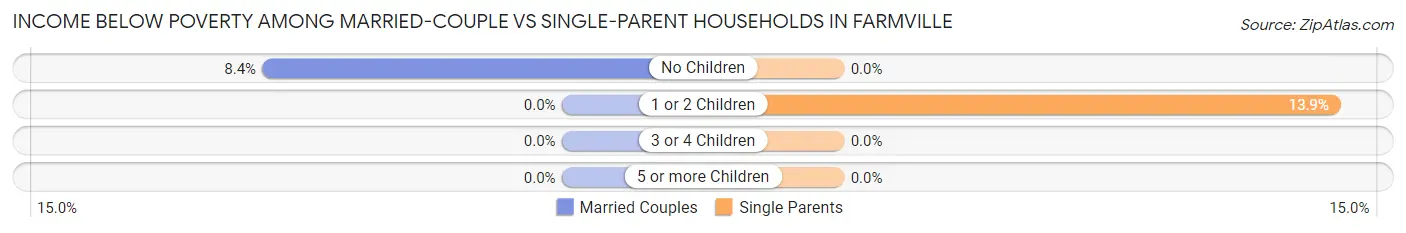
| Children | Married-Couple Families | Single-Parent Households |
| No Children | 41 (8.4%) | 0 (0.0%) |
| 1 or 2 Children | 0 (0.0%) | 25 (13.9%) |
| 3 or 4 Children | 0 (0.0%) | 0 (0.0%) |
| 5 or more Children | 0 (0.0%) | 0 (0.0%) |
| Total | 41 (6.1%) | 25 (6.2%) |
Race in Farmville
The most populous races in Farmville are White / Caucasian (4,966 | 64.9%), Black / African American (1,954 | 25.6%), and Hispanic or Latino (370 | 4.8%).
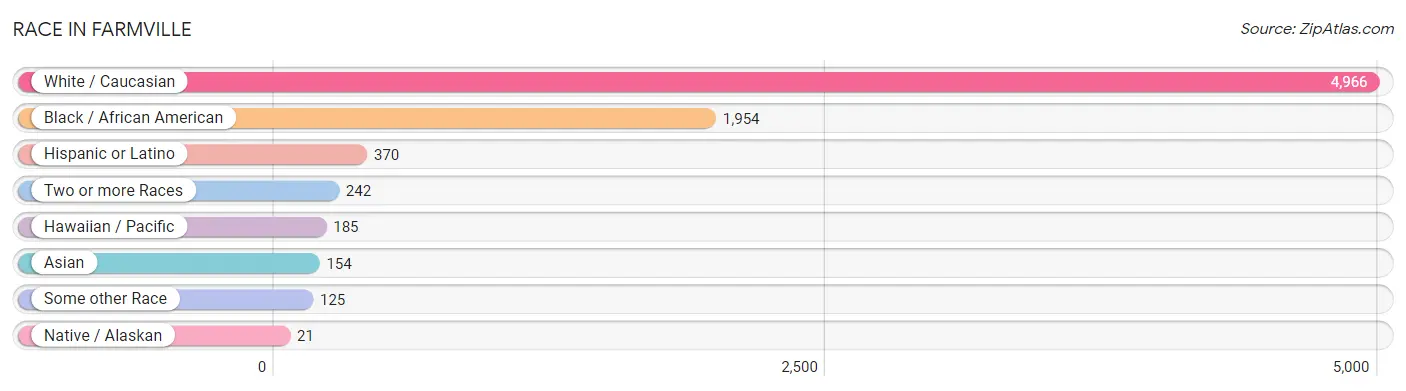
| Race | # Population | % Population |
| Asian | 154 | 2.0% |
| Black / African American | 1,954 | 25.6% |
| Hawaiian / Pacific | 185 | 2.4% |
| Hispanic or Latino | 370 | 4.8% |
| Native / Alaskan | 21 | 0.3% |
| White / Caucasian | 4,966 | 64.9% |
| Two or more Races | 242 | 3.2% |
| Some other Race | 125 | 1.6% |
| Total | 7,647 | 100.0% |
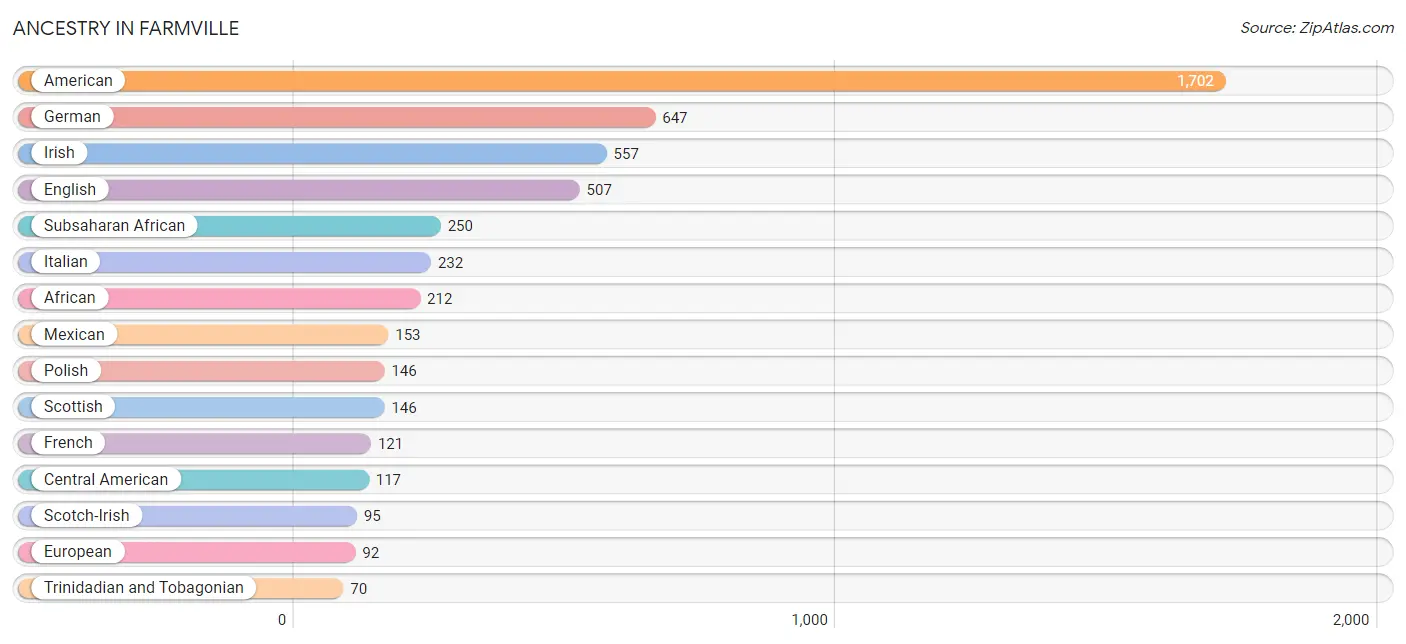
Ancestry in Farmville
The most populous ancestries reported in Farmville are American (1,702 | 22.3%), German (647 | 8.5%), Irish (557 | 7.3%), English (507 | 6.6%), and Subsaharan African (250 | 3.3%), together accounting for 47.9% of all Farmville residents.
| Ancestry | # Population | % Population |
| African | 212 | 2.8% |
| American | 1,702 | 22.3% |
| Arab | 41 | 0.5% |
| Austrian | 6 | 0.1% |
| Bhutanese | 30 | 0.4% |
| Brazilian | 11 | 0.1% |
| British | 36 | 0.5% |
| Burmese | 22 | 0.3% |
| Canadian | 7 | 0.1% |
| Central American | 117 | 1.5% |
| Croatian | 12 | 0.2% |
| Czech | 6 | 0.1% |
| Eastern European | 16 | 0.2% |
| English | 507 | 6.6% |
| Ethiopian | 12 | 0.2% |
| European | 92 | 1.2% |
| French | 121 | 1.6% |
| French Canadian | 5 | 0.1% |
| German | 647 | 8.5% |
| Greek | 18 | 0.2% |
| Guatemalan | 52 | 0.7% |
| Honduran | 23 | 0.3% |
| Hungarian | 39 | 0.5% |
| Indian (Asian) | 20 | 0.3% |
| Irish | 557 | 7.3% |
| Italian | 232 | 3.0% |
| Jamaican | 42 | 0.5% |
| Korean | 66 | 0.9% |
| Lebanese | 30 | 0.4% |
| Mexican | 153 | 2.0% |
| Nigerian | 26 | 0.3% |
| Norwegian | 22 | 0.3% |
| Pakistani | 6 | 0.1% |
| Polish | 146 | 1.9% |
| Puerto Rican | 40 | 0.5% |
| Romanian | 5 | 0.1% |
| Russian | 25 | 0.3% |
| Salvadoran | 42 | 0.5% |
| Scotch-Irish | 95 | 1.2% |
| Scottish | 146 | 1.9% |
| Slovak | 9 | 0.1% |
| Spaniard | 4 | 0.1% |
| Subsaharan African | 250 | 3.3% |
| Swedish | 46 | 0.6% |
| Thai | 7 | 0.1% |
| Trinidadian and Tobagonian | 70 | 0.9% |
| Ukrainian | 8 | 0.1% |
| Welsh | 5 | 0.1% |
| West Indian | 23 | 0.3% | View All 49 Rows |
Immigrants in Farmville
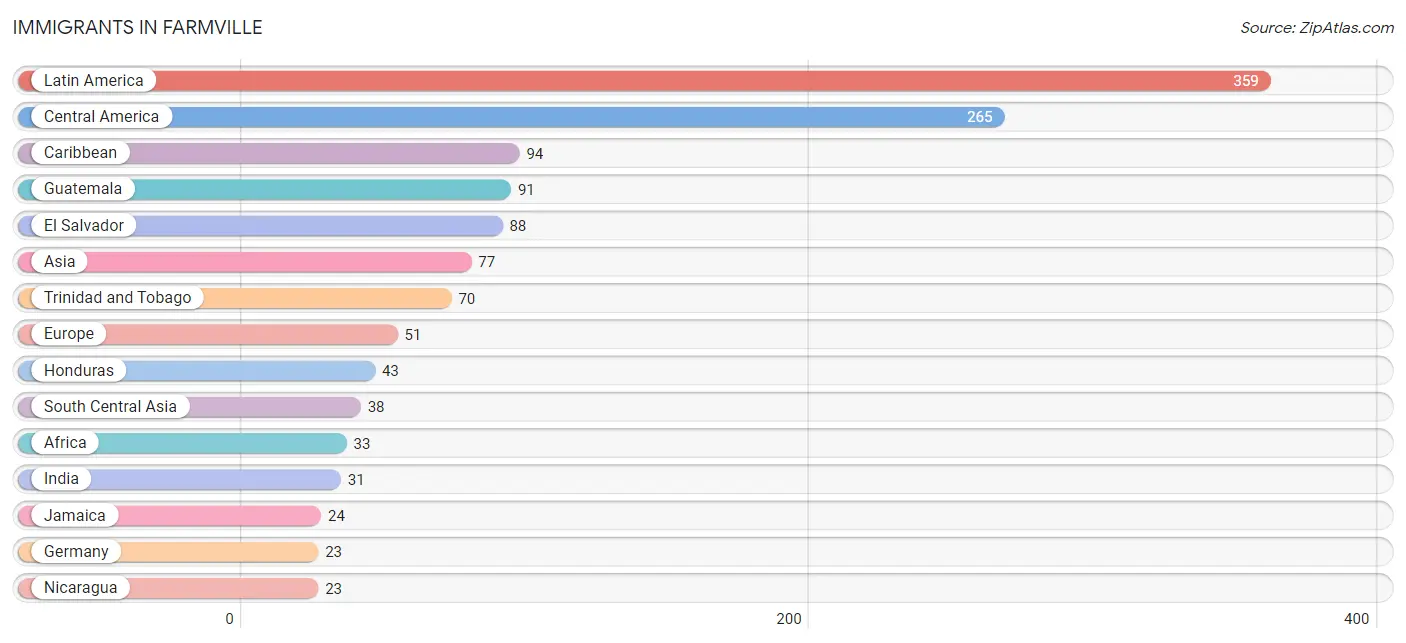
The most numerous immigrant groups reported in Farmville came from Latin America (359 | 4.7%), Central America (265 | 3.5%), Caribbean (94 | 1.2%), Guatemala (91 | 1.2%), and El Salvador (88 | 1.1%), together accounting for 11.7% of all Farmville residents.
| Immigration Origin | # Population | % Population |
| Africa | 33 | 0.4% |
| Asia | 77 | 1.0% |
| Canada | 7 | 0.1% |
| Caribbean | 94 | 1.2% |
| Central America | 265 | 3.5% |
| China | 15 | 0.2% |
| Eastern Africa | 12 | 0.2% |
| Eastern Asia | 15 | 0.2% |
| Eastern Europe | 18 | 0.2% |
| El Salvador | 88 | 1.1% |
| Ethiopia | 12 | 0.2% |
| Europe | 51 | 0.7% |
| Germany | 23 | 0.3% |
| Guatemala | 91 | 1.2% |
| Honduras | 43 | 0.6% |
| India | 31 | 0.4% |
| Ireland | 10 | 0.1% |
| Jamaica | 24 | 0.3% |
| Kazakhstan | 7 | 0.1% |
| Latin America | 359 | 4.7% |
| Lebanon | 11 | 0.1% |
| Mexico | 20 | 0.3% |
| Nicaragua | 23 | 0.3% |
| Nigeria | 10 | 0.1% |
| Northern Africa | 11 | 0.1% |
| Northern Europe | 10 | 0.1% |
| Philippines | 13 | 0.2% |
| Russia | 10 | 0.1% |
| South Central Asia | 38 | 0.5% |
| South Eastern Asia | 13 | 0.2% |
| Trinidad and Tobago | 70 | 0.9% |
| Ukraine | 8 | 0.1% |
| Western Africa | 10 | 0.1% |
| Western Asia | 11 | 0.1% |
| Western Europe | 23 | 0.3% | View All 35 Rows |
Sex and Age in Farmville
Sex and Age in Farmville
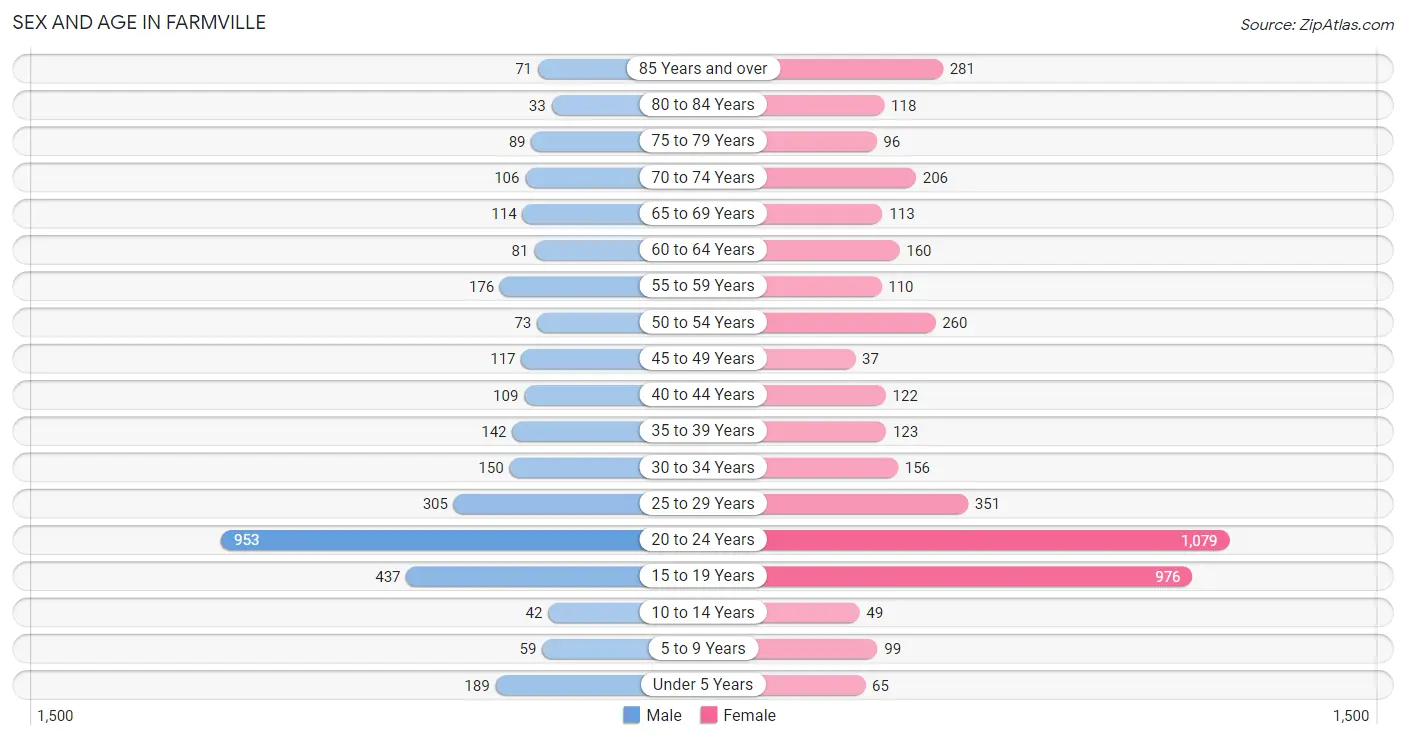
The most populous age groups in Farmville are 20 to 24 Years (953 | 29.4%) for men and 20 to 24 Years (1,079 | 24.5%) for women.
| Age Bracket | Male | Female |
| Under 5 Years | 189 (5.8%) | 65 (1.5%) |
| 5 to 9 Years | 59 (1.8%) | 99 (2.2%) |
| 10 to 14 Years | 42 (1.3%) | 49 (1.1%) |
| 15 to 19 Years | 437 (13.5%) | 976 (22.2%) |
| 20 to 24 Years | 953 (29.4%) | 1,079 (24.5%) |
| 25 to 29 Years | 305 (9.4%) | 351 (8.0%) |
| 30 to 34 Years | 150 (4.6%) | 156 (3.5%) |
| 35 to 39 Years | 142 (4.4%) | 123 (2.8%) |
| 40 to 44 Years | 109 (3.4%) | 122 (2.8%) |
| 45 to 49 Years | 117 (3.6%) | 37 (0.8%) |
| 50 to 54 Years | 73 (2.2%) | 260 (5.9%) |
| 55 to 59 Years | 176 (5.4%) | 110 (2.5%) |
| 60 to 64 Years | 81 (2.5%) | 160 (3.6%) |
| 65 to 69 Years | 114 (3.5%) | 113 (2.6%) |
| 70 to 74 Years | 106 (3.3%) | 206 (4.7%) |
| 75 to 79 Years | 89 (2.7%) | 96 (2.2%) |
| 80 to 84 Years | 33 (1.0%) | 118 (2.7%) |
| 85 Years and over | 71 (2.2%) | 281 (6.4%) |
| Total | 3,246 (100.0%) | 4,401 (100.0%) |
Families and Households in Farmville
Median Family Size in Farmville
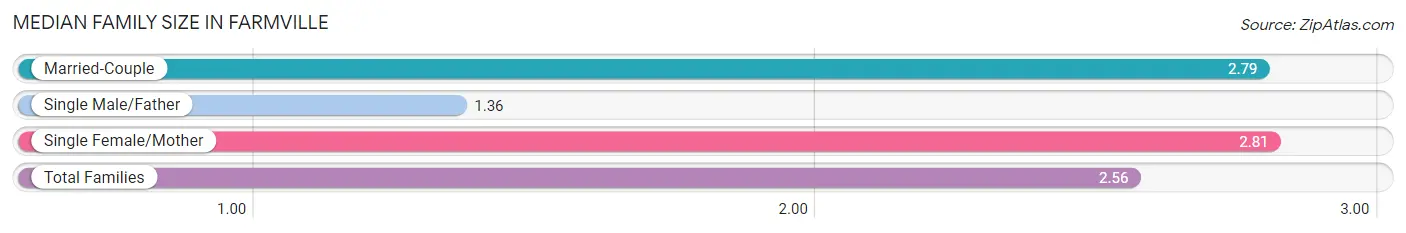
The median family size in Farmville is 2.56 persons per family, with single female/mother families (227 | 21.2%) accounting for the largest median family size of 2.81 persons per family. On the other hand, single male/father families (175 | 16.4%) represent the smallest median family size with 1.36 persons per family.
| Family Type | # Families | Family Size |
| Married-Couple | 668 (62.4%) | 2.79 |
| Single Male/Father | 175 (16.4%) | 1.36 |
| Single Female/Mother | 227 (21.2%) | 2.81 |
| Total Families | 1,070 (100.0%) | 2.56 |
Median Household Size in Farmville
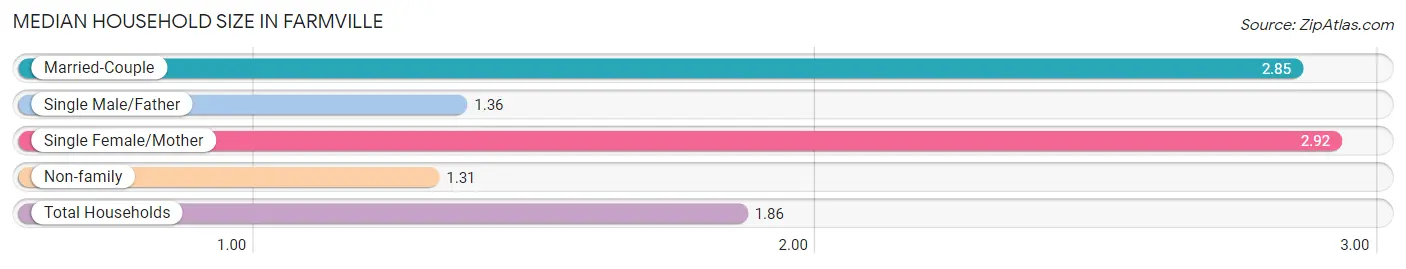
The median household size in Farmville is 1.86 persons per household, with single female/mother households (227 | 8.9%) accounting for the largest median household size of 2.92 persons per household. non-family households (1,491 | 58.2%) represent the smallest median household size with 1.31 persons per household.
| Household Type | # Households | Household Size |
| Married-Couple | 668 (26.1%) | 2.85 |
| Single Male/Father | 175 (6.8%) | 1.36 |
| Single Female/Mother | 227 (8.9%) | 2.92 |
| Non-family | 1,491 (58.2%) | 1.31 |
| Total Households | 2,561 (100.0%) | 1.86 |
Household Size by Marriage Status in Farmville
Out of a total of 2,561 households in Farmville, 1,070 (41.8%) are family households, while 1,491 (58.2%) are nonfamily households. The most numerous type of family households are 2-person households, comprising 649, and the most common type of nonfamily households are 1-person households, comprising 1,114.
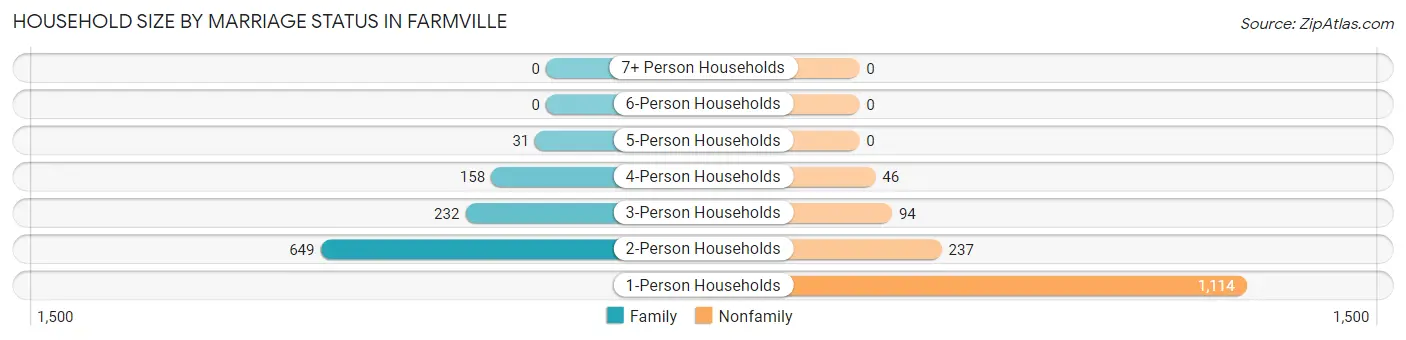
| Household Size | Family Households | Nonfamily Households |
| 1-Person Households | - | 1,114 (43.5%) |
| 2-Person Households | 649 (25.3%) | 237 (9.2%) |
| 3-Person Households | 232 (9.1%) | 94 (3.7%) |
| 4-Person Households | 158 (6.2%) | 46 (1.8%) |
| 5-Person Households | 31 (1.2%) | 0 (0.0%) |
| 6-Person Households | 0 (0.0%) | 0 (0.0%) |
| 7+ Person Households | 0 (0.0%) | 0 (0.0%) |
| Total | 1,070 (41.8%) | 1,491 (58.2%) |
Female Fertility in Farmville
Fertility by Age in Farmville
Average fertility rate in Farmville is 11.0 births per 1,000 women. Women in the age bracket of 20 to 34 years have the highest fertility rate with 20.0 births per 1,000 women. Women in the age bracket of 20 to 34 years acount for 100.0% of all women with births.
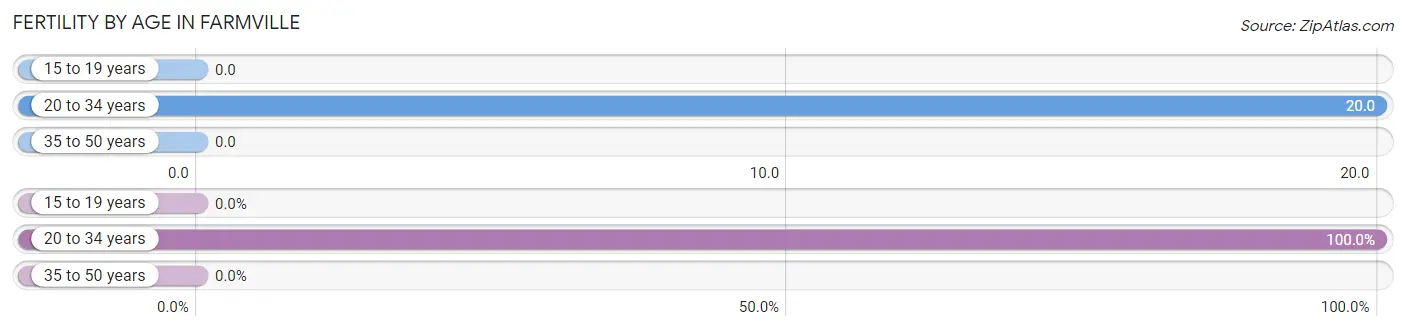
| Age Bracket | Women with Births | Births / 1,000 Women |
| 15 to 19 years | 0 (0.0%) | 0.0 |
| 20 to 34 years | 32 (100.0%) | 20.0 |
| 35 to 50 years | 0 (0.0%) | 0.0 |
| Total | 32 (100.0%) | 11.0 |
Fertility by Age by Marriage Status in Farmville
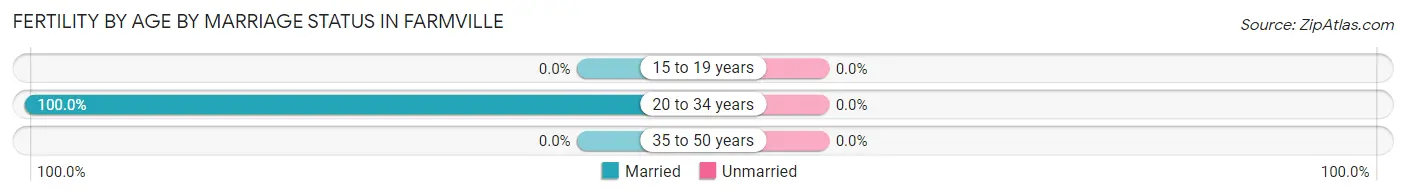
| Age Bracket | Married | Unmarried |
| 15 to 19 years | 0 (0.0%) | 0 (0.0%) |
| 20 to 34 years | 32 (100.0%) | 0 (0.0%) |
| 35 to 50 years | 0 (0.0%) | 0 (0.0%) |
| Total | 32 (100.0%) | 0 (0.0%) |
Fertility by Education in Farmville
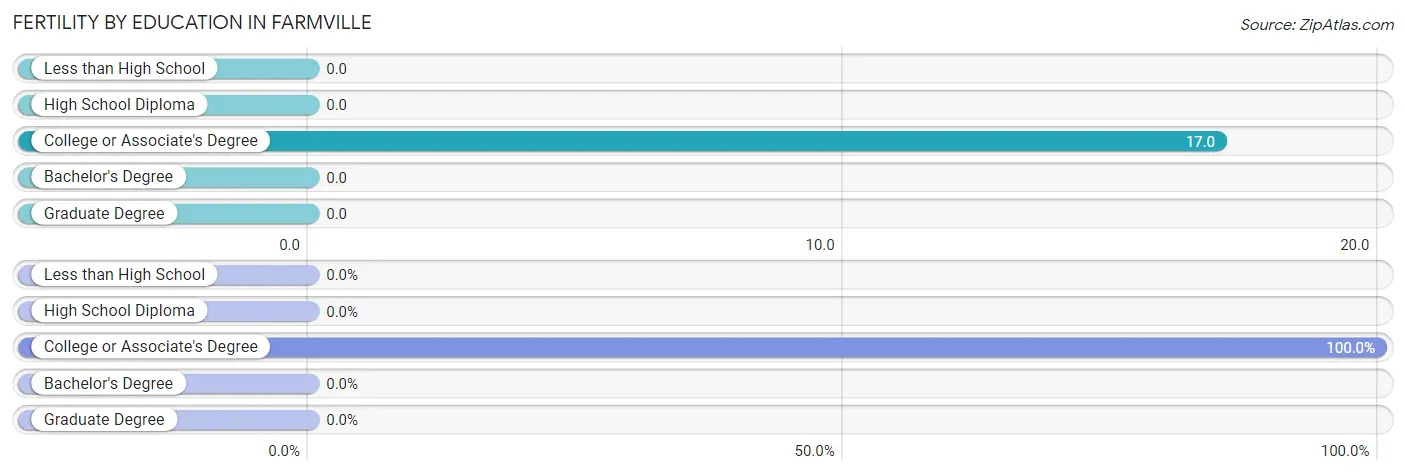
| Educational Attainment | Women with Births | Births / 1,000 Women |
| Less than High School | 0 (0.0%) | 0.0 |
| High School Diploma | 0 (0.0%) | 0.0 |
| College or Associate's Degree | 32 (100.0%) | 17.0 |
| Bachelor's Degree | 0 (0.0%) | 0.0 |
| Graduate Degree | 0 (0.0%) | 0.0 |
| Total | 32 (100.0%) | 11.0 |
Fertility by Education by Marriage Status in Farmville
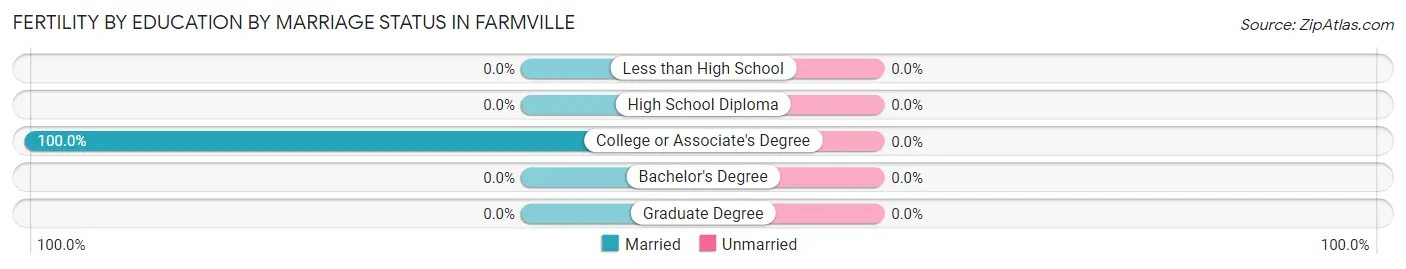
| Educational Attainment | Married | Unmarried |
| Less than High School | 0 (0.0%) | 0 (0.0%) |
| High School Diploma | 0 (0.0%) | 0 (0.0%) |
| College or Associate's Degree | 32 (100.0%) | 0 (0.0%) |
| Bachelor's Degree | 0 (0.0%) | 0 (0.0%) |
| Graduate Degree | 0 (0.0%) | 0 (0.0%) |
| Total | 32 (100.0%) | 0 (0.0%) |
Employment Characteristics in Farmville
Employment by Class of Employer in Farmville
Among the 2,458 employed individuals in Farmville, private company employees (1,303 | 53.0%), state government employees (608 | 24.7%), and not-for-profit organizations (237 | 9.6%) make up the most common classes of employment.
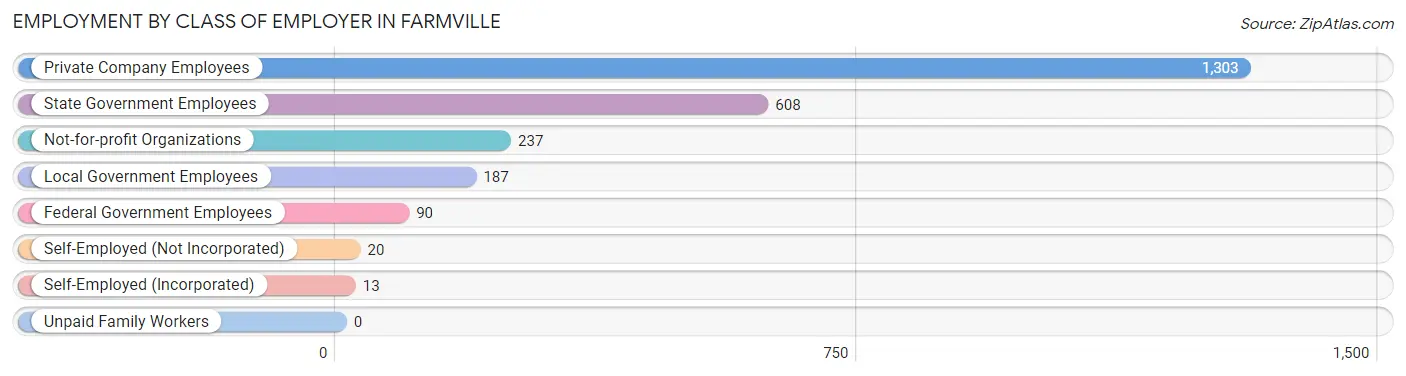
| Employer Class | # Employees | % Employees |
| Private Company Employees | 1,303 | 53.0% |
| Self-Employed (Incorporated) | 13 | 0.5% |
| Self-Employed (Not Incorporated) | 20 | 0.8% |
| Not-for-profit Organizations | 237 | 9.6% |
| Local Government Employees | 187 | 7.6% |
| State Government Employees | 608 | 24.7% |
| Federal Government Employees | 90 | 3.7% |
| Unpaid Family Workers | 0 | 0.0% |
| Total | 2,458 | 100.0% |
Employment Status by Age in Farmville
According to the labor force statistics for Farmville, out of the total population over 16 years of age (7,119), 37.2% or 2,648 individuals are in the labor force, with 3.2% or 85 of them unemployed. The age group with the highest labor force participation rate is 25 to 29 years, with 75.2% or 493 individuals in the labor force. Within the labor force, the 65 to 74 years age range has the highest percentage of unemployed individuals, with 32.7% or 35 of them being unemployed.
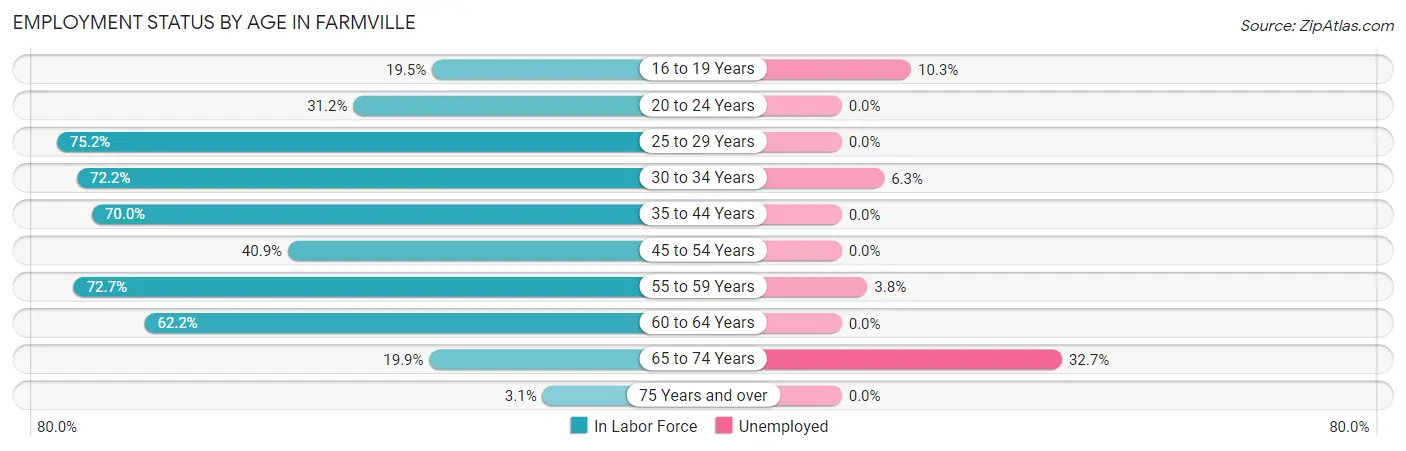
| Age Bracket | In Labor Force | Unemployed |
| 16 to 19 Years | 271 (19.5%) | 28 (10.3%) |
| 20 to 24 Years | 634 (31.2%) | 0 (0.0%) |
| 25 to 29 Years | 493 (75.2%) | 0 (0.0%) |
| 30 to 34 Years | 221 (72.2%) | 14 (6.3%) |
| 35 to 44 Years | 347 (70.0%) | 0 (0.0%) |
| 45 to 54 Years | 199 (40.9%) | 0 (0.0%) |
| 55 to 59 Years | 208 (72.7%) | 8 (3.8%) |
| 60 to 64 Years | 150 (62.2%) | 0 (0.0%) |
| 65 to 74 Years | 107 (19.9%) | 35 (32.7%) |
| 75 Years and over | 21 (3.1%) | 0 (0.0%) |
| Total | 2,648 (37.2%) | 85 (3.2%) |
Employment Status by Educational Attainment in Farmville
According to labor force statistics for Farmville, 65.5% of individuals (1,619) out of the total population between 25 and 64 years of age (2,472) are in the labor force, with 1.4% or 23 of them being unemployed. The group with the highest labor force participation rate are those with the educational attainment of bachelor's degree or higher, with 85.7% or 617 individuals in the labor force. Within the labor force, individuals with less than high school education have the highest percentage of unemployment, with 48.3% or 14 of them being unemployed.
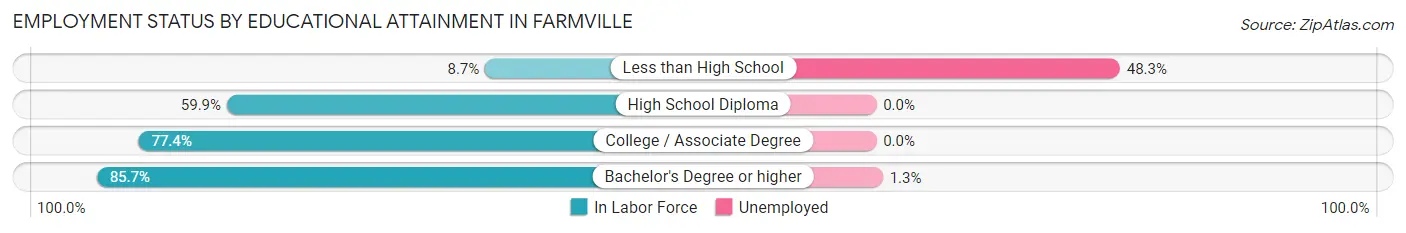
| Educational Attainment | In Labor Force | Unemployed |
| Less than High School | 29 (8.7%) | 160 (48.3%) |
| High School Diploma | 437 (59.9%) | 0 (0.0%) |
| College / Associate Degree | 535 (77.4%) | 0 (0.0%) |
| Bachelor's Degree or higher | 617 (85.7%) | 9 (1.3%) |
| Total | 1,619 (65.5%) | 35 (1.4%) |
Employment Occupations by Sex in Farmville
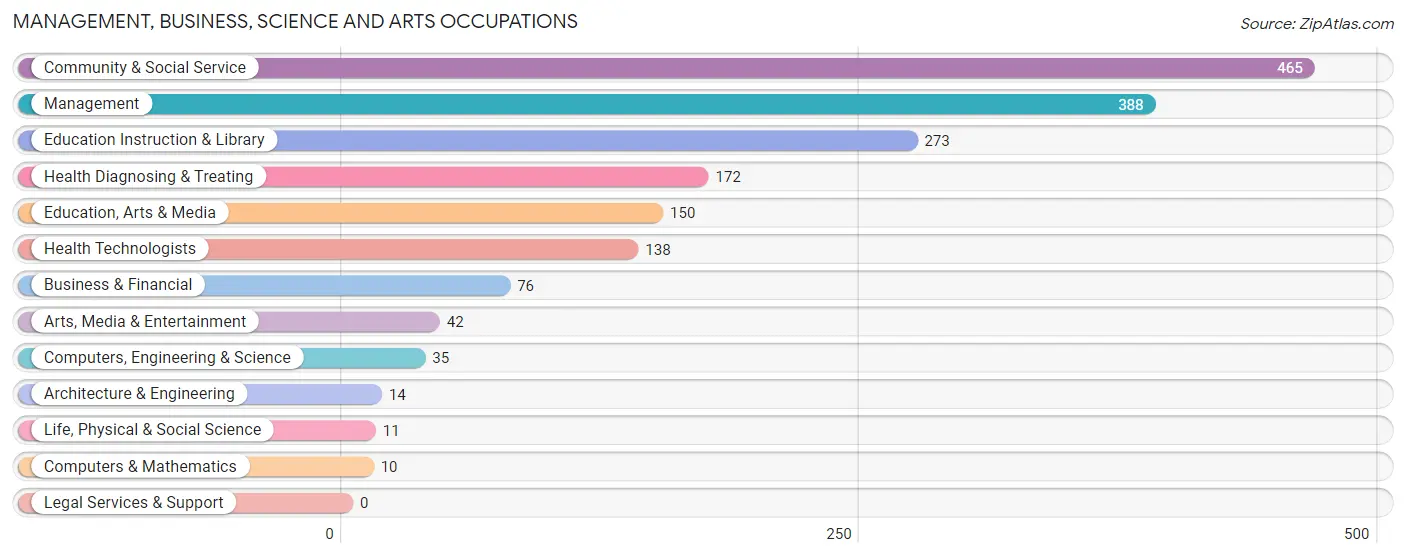
Management, Business, Science and Arts Occupations
The most common Management, Business, Science and Arts occupations in Farmville are Community & Social Service (465 | 18.1%), Management (388 | 15.1%), Education Instruction & Library (273 | 10.6%), Health Diagnosing & Treating (172 | 6.7%), and Education, Arts & Media (150 | 5.9%).
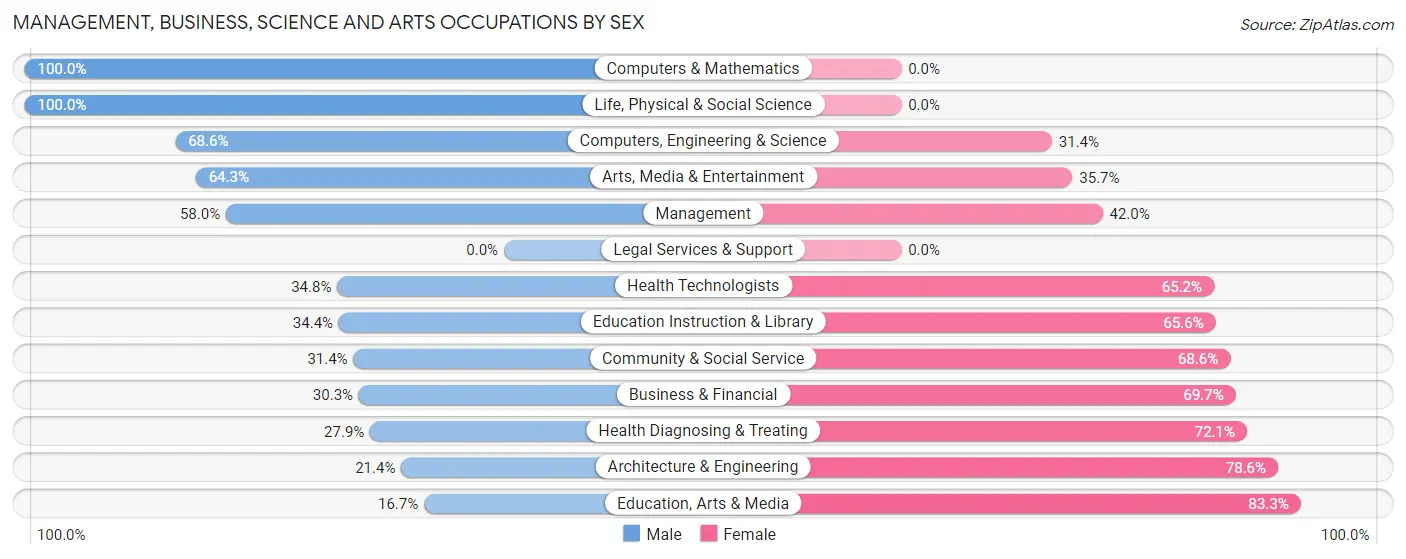
Management, Business, Science and Arts Occupations by Sex
Within the Management, Business, Science and Arts occupations in Farmville, the most male-oriented occupations are Computers & Mathematics (100.0%), Life, Physical & Social Science (100.0%), and Computers, Engineering & Science (68.6%), while the most female-oriented occupations are Education, Arts & Media (83.3%), Architecture & Engineering (78.6%), and Health Diagnosing & Treating (72.1%).
| Occupation | Male | Female |
| Management | 225 (58.0%) | 163 (42.0%) |
| Business & Financial | 23 (30.3%) | 53 (69.7%) |
| Computers, Engineering & Science | 24 (68.6%) | 11 (31.4%) |
| Computers & Mathematics | 10 (100.0%) | 0 (0.0%) |
| Architecture & Engineering | 3 (21.4%) | 11 (78.6%) |
| Life, Physical & Social Science | 11 (100.0%) | 0 (0.0%) |
| Community & Social Service | 146 (31.4%) | 319 (68.6%) |
| Education, Arts & Media | 25 (16.7%) | 125 (83.3%) |
| Legal Services & Support | 0 (0.0%) | 0 (0.0%) |
| Education Instruction & Library | 94 (34.4%) | 179 (65.6%) |
| Arts, Media & Entertainment | 27 (64.3%) | 15 (35.7%) |
| Health Diagnosing & Treating | 48 (27.9%) | 124 (72.1%) |
| Health Technologists | 48 (34.8%) | 90 (65.2%) |
| Total (Category) | 466 (41.0%) | 670 (59.0%) |
| Total (Overall) | 1,206 (47.0%) | 1,360 (53.0%) |
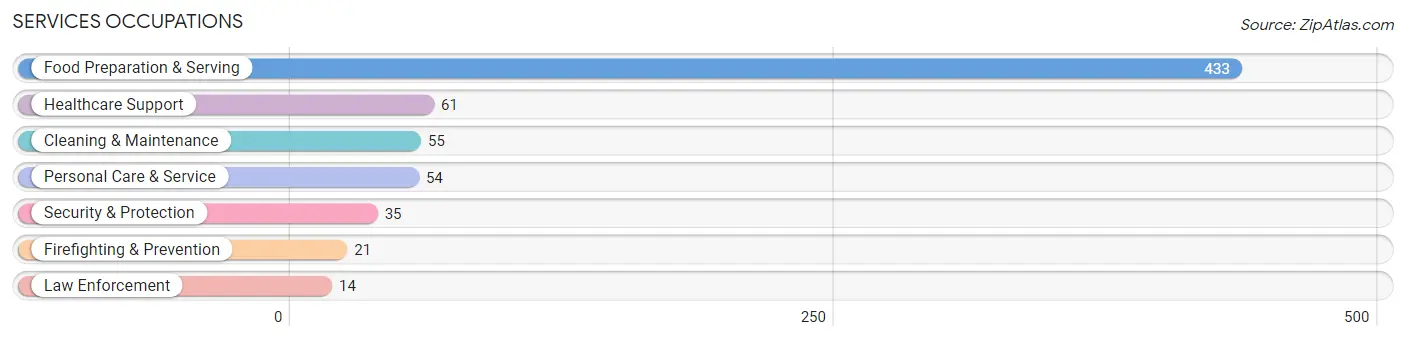
Services Occupations
The most common Services occupations in Farmville are Food Preparation & Serving (433 | 16.9%), Healthcare Support (61 | 2.4%), Cleaning & Maintenance (55 | 2.1%), Personal Care & Service (54 | 2.1%), and Security & Protection (35 | 1.4%).
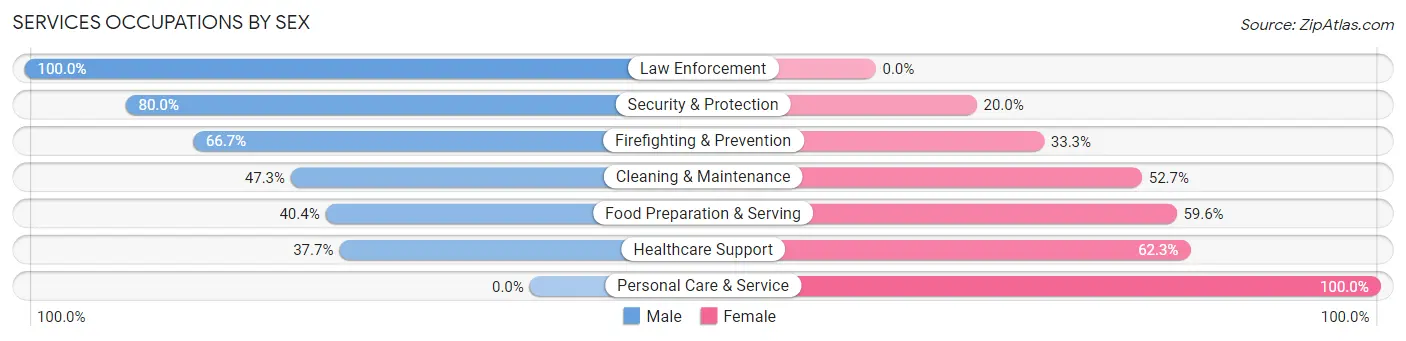
Services Occupations by Sex
Within the Services occupations in Farmville, the most male-oriented occupations are Law Enforcement (100.0%), Security & Protection (80.0%), and Firefighting & Prevention (66.7%), while the most female-oriented occupations are Personal Care & Service (100.0%), Healthcare Support (62.3%), and Food Preparation & Serving (59.6%).
| Occupation | Male | Female |
| Healthcare Support | 23 (37.7%) | 38 (62.3%) |
| Security & Protection | 28 (80.0%) | 7 (20.0%) |
| Firefighting & Prevention | 14 (66.7%) | 7 (33.3%) |
| Law Enforcement | 14 (100.0%) | 0 (0.0%) |
| Food Preparation & Serving | 175 (40.4%) | 258 (59.6%) |
| Cleaning & Maintenance | 26 (47.3%) | 29 (52.7%) |
| Personal Care & Service | 0 (0.0%) | 54 (100.0%) |
| Total (Category) | 252 (39.5%) | 386 (60.5%) |
| Total (Overall) | 1,206 (47.0%) | 1,360 (53.0%) |
Sales and Office Occupations
The most common Sales and Office occupations in Farmville are Sales & Related (270 | 10.5%), and Office & Administration (182 | 7.1%).

Sales and Office Occupations by Sex

| Occupation | Male | Female |
| Sales & Related | 167 (61.9%) | 103 (38.2%) |
| Office & Administration | 58 (31.9%) | 124 (68.1%) |
| Total (Category) | 225 (49.8%) | 227 (50.2%) |
| Total (Overall) | 1,206 (47.0%) | 1,360 (53.0%) |
Natural Resources, Construction and Maintenance Occupations
The most common Natural Resources, Construction and Maintenance occupations in Farmville are Installation, Maintenance & Repair (106 | 4.1%), and Construction & Extraction (45 | 1.8%).

Natural Resources, Construction and Maintenance Occupations by Sex

| Occupation | Male | Female |
| Farming, Fishing & Forestry | 0 (0.0%) | 0 (0.0%) |
| Construction & Extraction | 45 (100.0%) | 0 (0.0%) |
| Installation, Maintenance & Repair | 95 (89.6%) | 11 (10.4%) |
| Total (Category) | 140 (92.7%) | 11 (7.3%) |
| Total (Overall) | 1,206 (47.0%) | 1,360 (53.0%) |
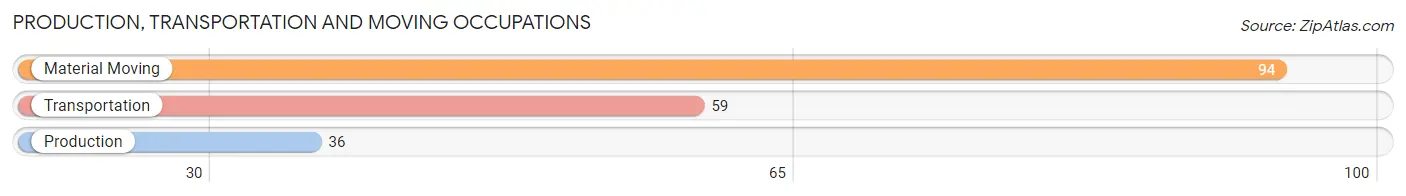
Production, Transportation and Moving Occupations
The most common Production, Transportation and Moving occupations in Farmville are Material Moving (94 | 3.7%), Transportation (59 | 2.3%), and Production (36 | 1.4%).
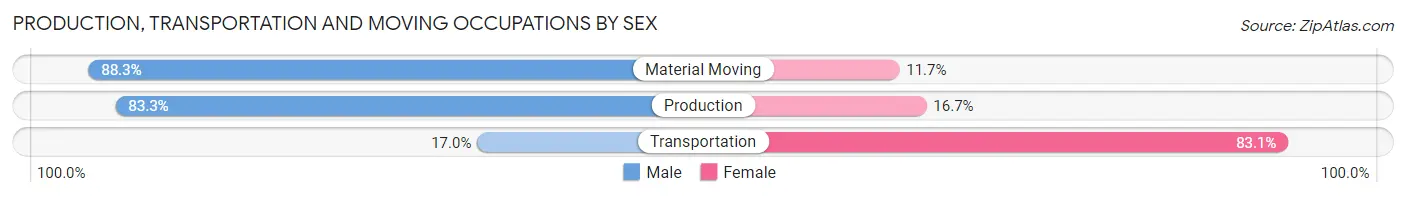
Production, Transportation and Moving Occupations by Sex
| Occupation | Male | Female |
| Production | 30 (83.3%) | 6 (16.7%) |
| Transportation | 10 (17.0%) | 49 (83.1%) |
| Material Moving | 83 (88.3%) | 11 (11.7%) |
| Total (Category) | 123 (65.1%) | 66 (34.9%) |
| Total (Overall) | 1,206 (47.0%) | 1,360 (53.0%) |
Employment Industries by Sex in Farmville
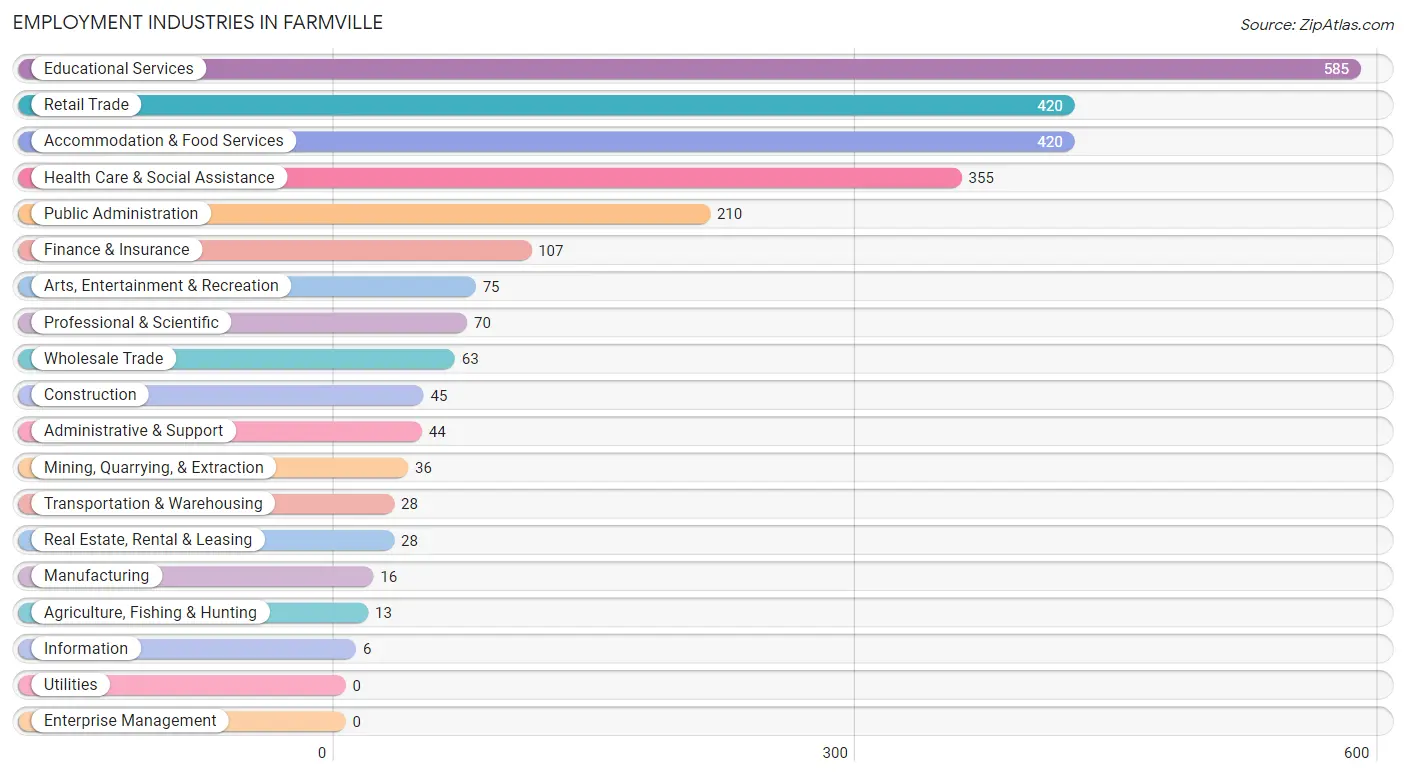
Employment Industries in Farmville
The major employment industries in Farmville include Educational Services (585 | 22.8%), Retail Trade (420 | 16.4%), Accommodation & Food Services (420 | 16.4%), Health Care & Social Assistance (355 | 13.8%), and Public Administration (210 | 8.2%).
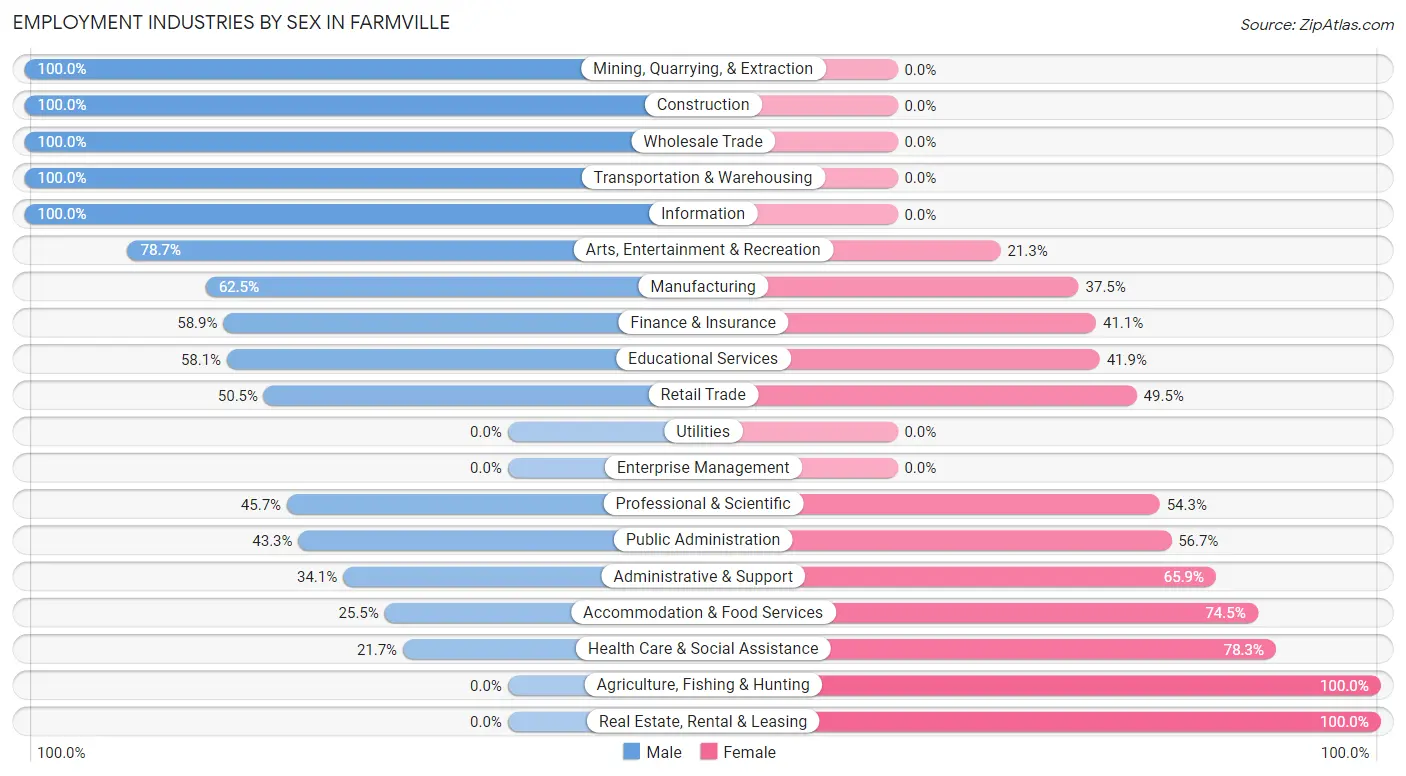
Employment Industries by Sex in Farmville
The Farmville industries that see more men than women are Mining, Quarrying, & Extraction (100.0%), Construction (100.0%), and Wholesale Trade (100.0%), whereas the industries that tend to have a higher number of women are Agriculture, Fishing & Hunting (100.0%), Real Estate, Rental & Leasing (100.0%), and Health Care & Social Assistance (78.3%).
| Industry | Male | Female |
| Agriculture, Fishing & Hunting | 0 (0.0%) | 13 (100.0%) |
| Mining, Quarrying, & Extraction | 36 (100.0%) | 0 (0.0%) |
| Construction | 45 (100.0%) | 0 (0.0%) |
| Manufacturing | 10 (62.5%) | 6 (37.5%) |
| Wholesale Trade | 63 (100.0%) | 0 (0.0%) |
| Retail Trade | 212 (50.5%) | 208 (49.5%) |
| Transportation & Warehousing | 28 (100.0%) | 0 (0.0%) |
| Utilities | 0 (0.0%) | 0 (0.0%) |
| Information | 6 (100.0%) | 0 (0.0%) |
| Finance & Insurance | 63 (58.9%) | 44 (41.1%) |
| Real Estate, Rental & Leasing | 0 (0.0%) | 28 (100.0%) |
| Professional & Scientific | 32 (45.7%) | 38 (54.3%) |
| Enterprise Management | 0 (0.0%) | 0 (0.0%) |
| Administrative & Support | 15 (34.1%) | 29 (65.9%) |
| Educational Services | 340 (58.1%) | 245 (41.9%) |
| Health Care & Social Assistance | 77 (21.7%) | 278 (78.3%) |
| Arts, Entertainment & Recreation | 59 (78.7%) | 16 (21.3%) |
| Accommodation & Food Services | 107 (25.5%) | 313 (74.5%) |
| Public Administration | 91 (43.3%) | 119 (56.7%) |
| Total | 1,206 (47.0%) | 1,360 (53.0%) |
Education in Farmville
School Enrollment in Farmville
The most common levels of schooling among the 3,207 students in Farmville are college / undergraduate (2,697 | 84.1%), high school (183 | 5.7%), and elementary school (127 | 4.0%).
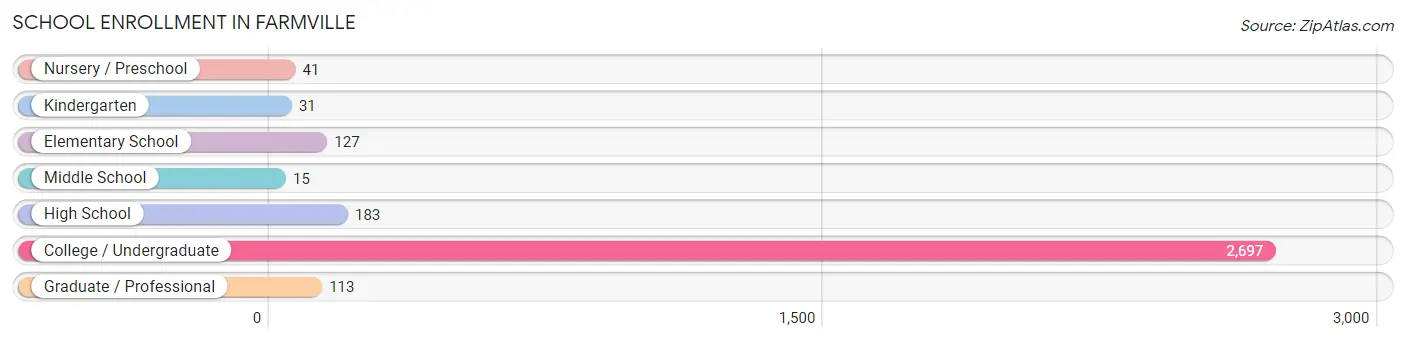
| School Level | # Students | % Students |
| Nursery / Preschool | 41 | 1.3% |
| Kindergarten | 31 | 1.0% |
| Elementary School | 127 | 4.0% |
| Middle School | 15 | 0.5% |
| High School | 183 | 5.7% |
| College / Undergraduate | 2,697 | 84.1% |
| Graduate / Professional | 113 | 3.5% |
| Total | 3,207 | 100.0% |
School Enrollment by Age by Funding Source in Farmville
Out of a total of 3,207 students who are enrolled in schools in Farmville, 487 (15.2%) attend a private institution, while the remaining 2,720 (84.8%) are enrolled in public schools. The age group of 15 to 17 year olds has the highest likelihood of being enrolled in private schools, with 83 (69.8% in the age bracket) enrolled. Conversely, the age group of 10 to 14 year olds has the lowest likelihood of being enrolled in a private school, with 79 (100.0% in the age bracket) attending a public institution.
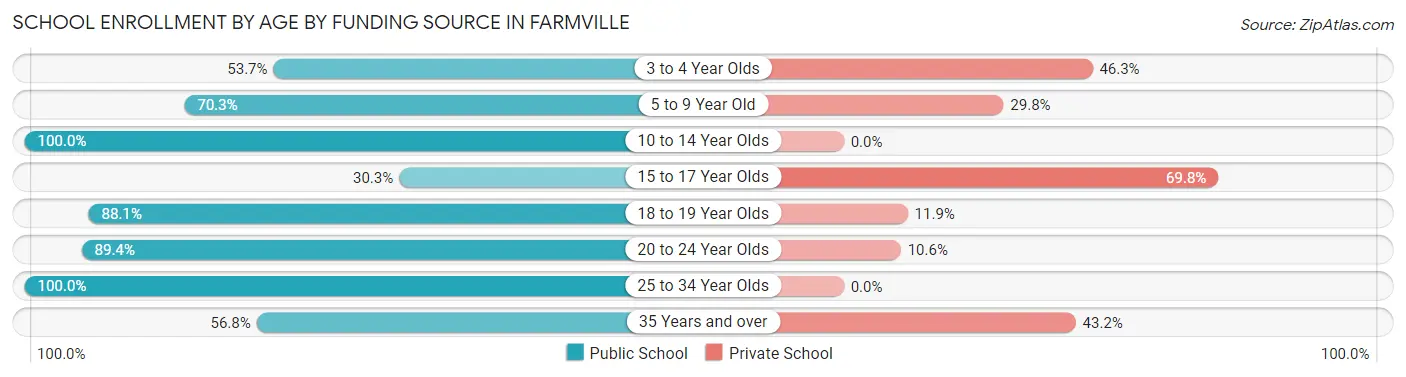
| Age Bracket | Public School | Private School |
| 3 to 4 Year Olds | 22 (53.7%) | 19 (46.3%) |
| 5 to 9 Year Old | 111 (70.3%) | 47 (29.7%) |
| 10 to 14 Year Olds | 79 (100.0%) | 0 (0.0%) |
| 15 to 17 Year Olds | 36 (30.2%) | 83 (69.8%) |
| 18 to 19 Year Olds | 1,086 (88.1%) | 147 (11.9%) |
| 20 to 24 Year Olds | 1,328 (89.4%) | 158 (10.6%) |
| 25 to 34 Year Olds | 10 (100.0%) | 0 (0.0%) |
| 35 Years and over | 46 (56.8%) | 35 (43.2%) |
| Total | 2,720 (84.8%) | 487 (15.2%) |
Educational Attainment by Field of Study in Farmville
Education (205 | 17.7%), science & technology (189 | 16.3%), business (163 | 14.1%), bio, nature & agricultural (150 | 12.9%), and arts & humanities (97 | 8.4%) are the most common fields of study among 1,159 individuals in Farmville who have obtained a bachelor's degree or higher.
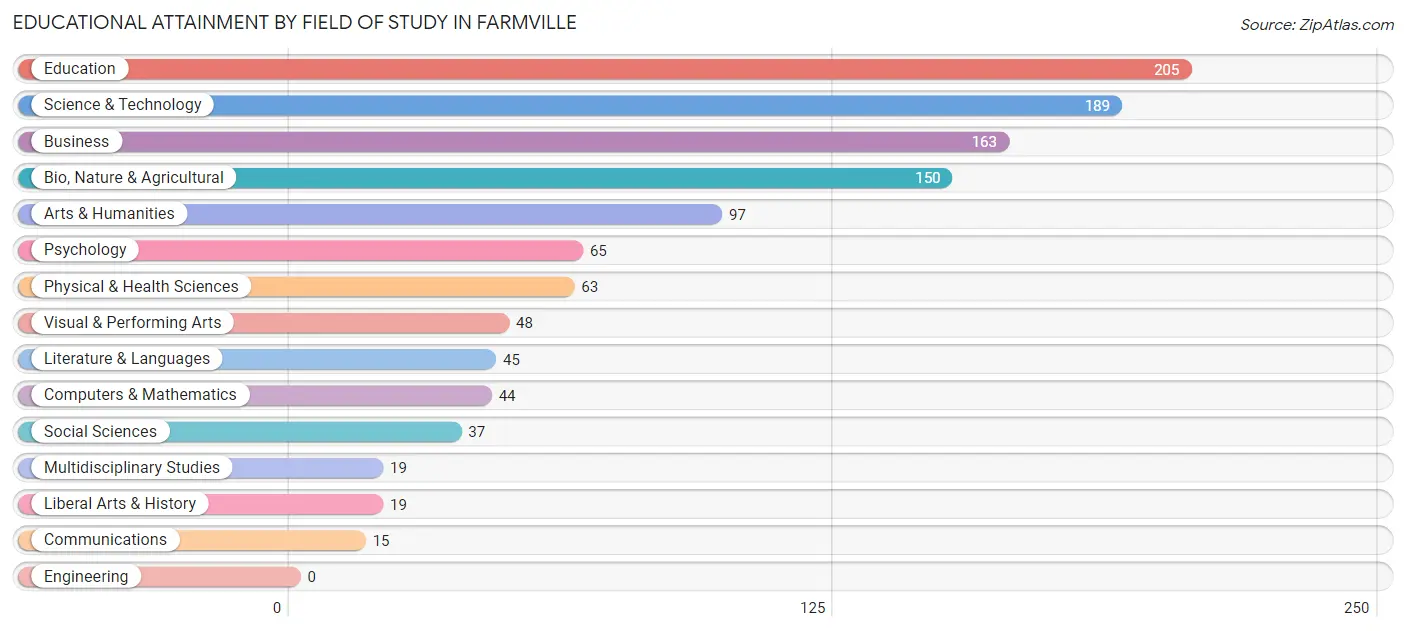
| Field of Study | # Graduates | % Graduates |
| Computers & Mathematics | 44 | 3.8% |
| Bio, Nature & Agricultural | 150 | 12.9% |
| Physical & Health Sciences | 63 | 5.4% |
| Psychology | 65 | 5.6% |
| Social Sciences | 37 | 3.2% |
| Engineering | 0 | 0.0% |
| Multidisciplinary Studies | 19 | 1.6% |
| Science & Technology | 189 | 16.3% |
| Business | 163 | 14.1% |
| Education | 205 | 17.7% |
| Literature & Languages | 45 | 3.9% |
| Liberal Arts & History | 19 | 1.6% |
| Visual & Performing Arts | 48 | 4.1% |
| Communications | 15 | 1.3% |
| Arts & Humanities | 97 | 8.4% |
| Total | 1,159 | 100.0% |
Transportation & Commute in Farmville
Vehicle Availability by Sex in Farmville
The most prevalent vehicle ownership categories in Farmville are males with 2 vehicles (429, accounting for 41.2%) and females with 2 vehicles (299, making up 37.0%).
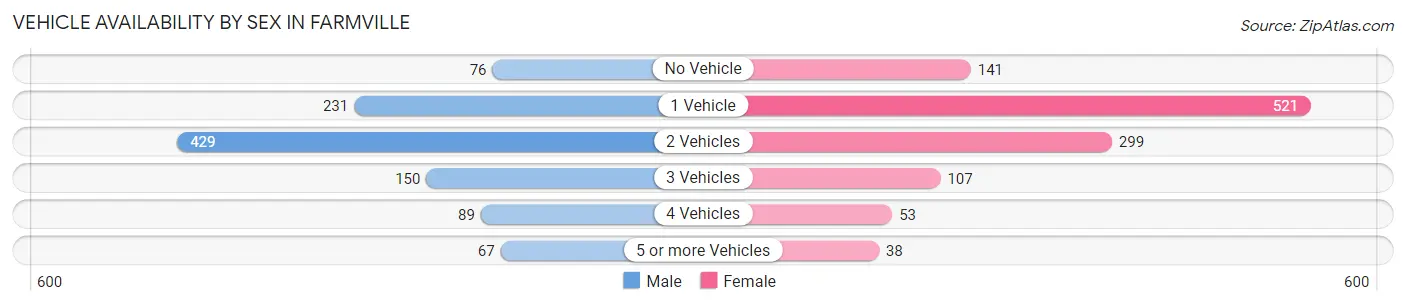
| Vehicles Available | Male | Female |
| No Vehicle | 76 (7.3%) | 141 (12.2%) |
| 1 Vehicle | 231 (22.2%) | 521 (45.0%) |
| 2 Vehicles | 429 (41.2%) | 299 (25.8%) |
| 3 Vehicles | 150 (14.4%) | 107 (9.2%) |
| 4 Vehicles | 89 (8.5%) | 53 (4.6%) |
| 5 or more Vehicles | 67 (6.4%) | 38 (3.3%) |
| Total | 1,042 (100.0%) | 1,159 (100.0%) |
Commute Time in Farmville
The most frequently occuring commute durations in Farmville are 5 to 9 minutes (680 commuters, 29.4%), 10 to 14 minutes (491 commuters, 21.2%), and 15 to 19 minutes (205 commuters, 8.8%).
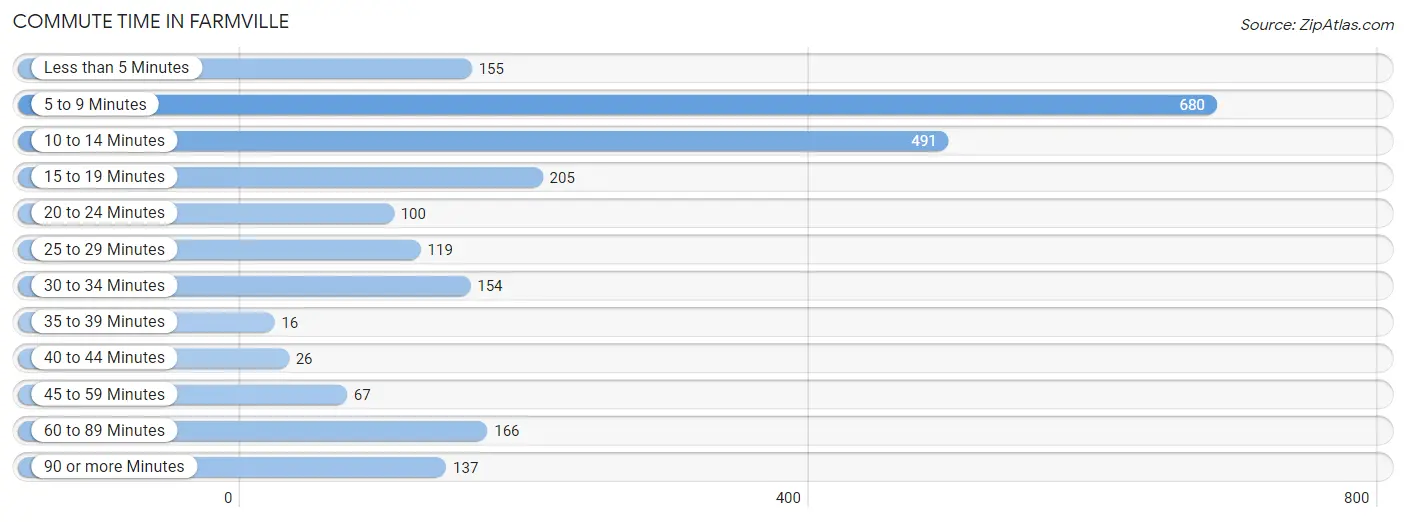
| Commute Time | # Commuters | % Commuters |
| Less than 5 Minutes | 155 | 6.7% |
| 5 to 9 Minutes | 680 | 29.4% |
| 10 to 14 Minutes | 491 | 21.2% |
| 15 to 19 Minutes | 205 | 8.8% |
| 20 to 24 Minutes | 100 | 4.3% |
| 25 to 29 Minutes | 119 | 5.1% |
| 30 to 34 Minutes | 154 | 6.7% |
| 35 to 39 Minutes | 16 | 0.7% |
| 40 to 44 Minutes | 26 | 1.1% |
| 45 to 59 Minutes | 67 | 2.9% |
| 60 to 89 Minutes | 166 | 7.2% |
| 90 or more Minutes | 137 | 5.9% |
Commute Time by Sex in Farmville
The most common commute times in Farmville are 5 to 9 minutes (372 commuters, 32.6%) for males and 10 to 14 minutes (331 commuters, 28.1%) for females.
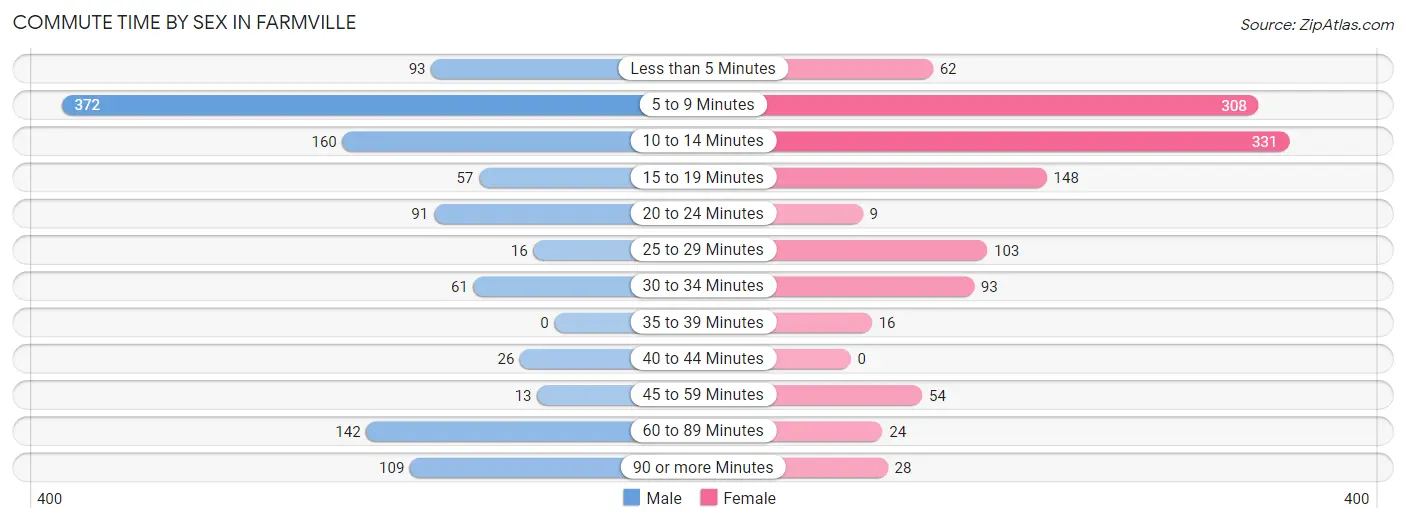
| Commute Time | Male | Female |
| Less than 5 Minutes | 93 (8.2%) | 62 (5.3%) |
| 5 to 9 Minutes | 372 (32.6%) | 308 (26.2%) |
| 10 to 14 Minutes | 160 (14.0%) | 331 (28.1%) |
| 15 to 19 Minutes | 57 (5.0%) | 148 (12.6%) |
| 20 to 24 Minutes | 91 (8.0%) | 9 (0.8%) |
| 25 to 29 Minutes | 16 (1.4%) | 103 (8.8%) |
| 30 to 34 Minutes | 61 (5.3%) | 93 (7.9%) |
| 35 to 39 Minutes | 0 (0.0%) | 16 (1.4%) |
| 40 to 44 Minutes | 26 (2.3%) | 0 (0.0%) |
| 45 to 59 Minutes | 13 (1.1%) | 54 (4.6%) |
| 60 to 89 Minutes | 142 (12.5%) | 24 (2.0%) |
| 90 or more Minutes | 109 (9.6%) | 28 (2.4%) |
Time of Departure to Work by Sex in Farmville
The most frequent times of departure to work in Farmville are 9:00 AM to 9:59 AM (328, 28.8%) for males and 10:00 AM to 10:59 AM (195, 16.6%) for females.
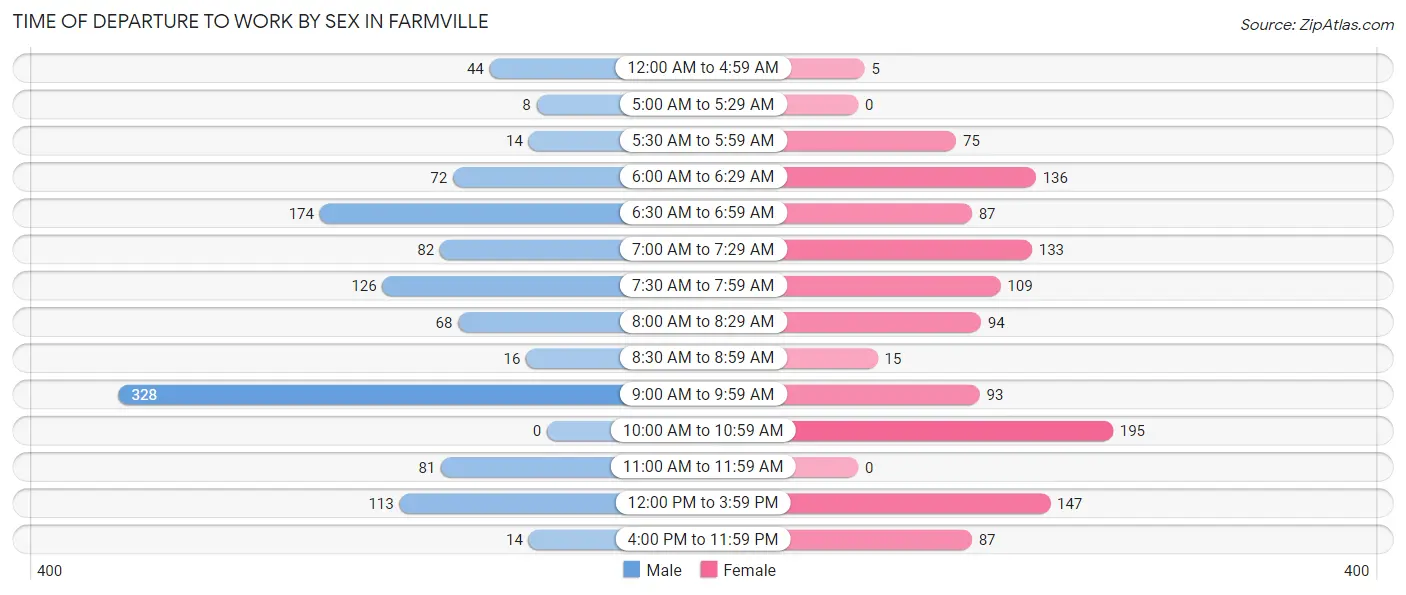
| Time of Departure | Male | Female |
| 12:00 AM to 4:59 AM | 44 (3.9%) | 5 (0.4%) |
| 5:00 AM to 5:29 AM | 8 (0.7%) | 0 (0.0%) |
| 5:30 AM to 5:59 AM | 14 (1.2%) | 75 (6.4%) |
| 6:00 AM to 6:29 AM | 72 (6.3%) | 136 (11.6%) |
| 6:30 AM to 6:59 AM | 174 (15.3%) | 87 (7.4%) |
| 7:00 AM to 7:29 AM | 82 (7.2%) | 133 (11.3%) |
| 7:30 AM to 7:59 AM | 126 (11.1%) | 109 (9.3%) |
| 8:00 AM to 8:29 AM | 68 (6.0%) | 94 (8.0%) |
| 8:30 AM to 8:59 AM | 16 (1.4%) | 15 (1.3%) |
| 9:00 AM to 9:59 AM | 328 (28.8%) | 93 (7.9%) |
| 10:00 AM to 10:59 AM | 0 (0.0%) | 195 (16.6%) |
| 11:00 AM to 11:59 AM | 81 (7.1%) | 0 (0.0%) |
| 12:00 PM to 3:59 PM | 113 (9.9%) | 147 (12.5%) |
| 4:00 PM to 11:59 PM | 14 (1.2%) | 87 (7.4%) |
| Total | 1,140 (100.0%) | 1,176 (100.0%) |
Housing Occupancy in Farmville
Occupancy by Ownership in Farmville
Of the total 2,561 dwellings in Farmville, owner-occupied units account for 856 (33.4%), while renter-occupied units make up 1,705 (66.6%).
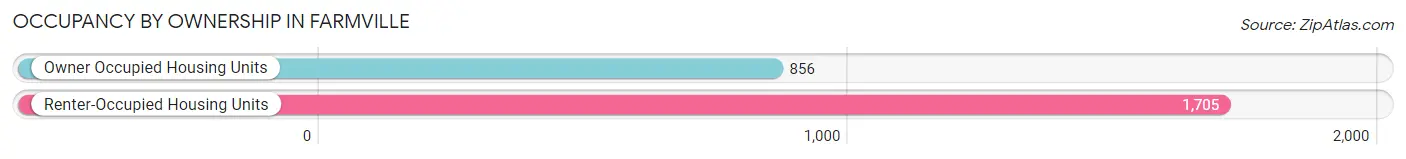
| Occupancy | # Housing Units | % Housing Units |
| Owner Occupied Housing Units | 856 | 33.4% |
| Renter-Occupied Housing Units | 1,705 | 66.6% |
| Total Occupied Housing Units | 2,561 | 100.0% |
Occupancy by Household Size in Farmville
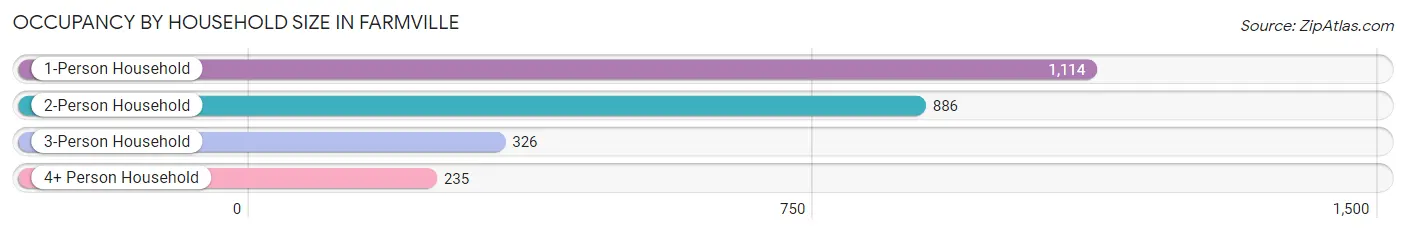
| Household Size | # Housing Units | % Housing Units |
| 1-Person Household | 1,114 | 43.5% |
| 2-Person Household | 886 | 34.6% |
| 3-Person Household | 326 | 12.7% |
| 4+ Person Household | 235 | 9.2% |
| Total Housing Units | 2,561 | 100.0% |
Occupancy by Ownership by Household Size in Farmville
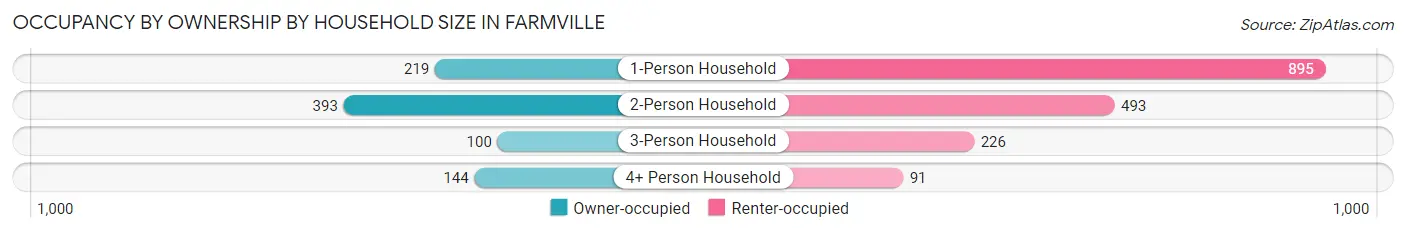
| Household Size | Owner-occupied | Renter-occupied |
| 1-Person Household | 219 (19.7%) | 895 (80.3%) |
| 2-Person Household | 393 (44.4%) | 493 (55.6%) |
| 3-Person Household | 100 (30.7%) | 226 (69.3%) |
| 4+ Person Household | 144 (61.3%) | 91 (38.7%) |
| Total Housing Units | 856 (33.4%) | 1,705 (66.6%) |
Occupancy by Educational Attainment in Farmville
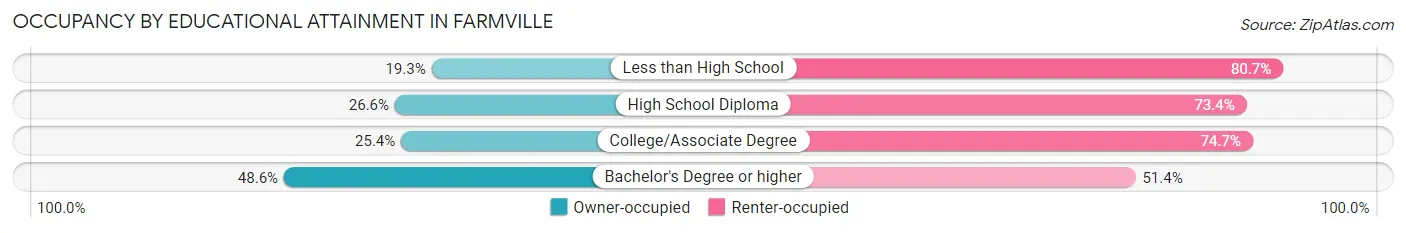
| Household Size | Owner-occupied | Renter-occupied |
| Less than High School | 29 (19.3%) | 121 (80.7%) |
| High School Diploma | 217 (26.6%) | 599 (73.4%) |
| College/Associate Degree | 180 (25.4%) | 530 (74.7%) |
| Bachelor's Degree or higher | 430 (48.6%) | 455 (51.4%) |
Occupancy by Age of Householder in Farmville
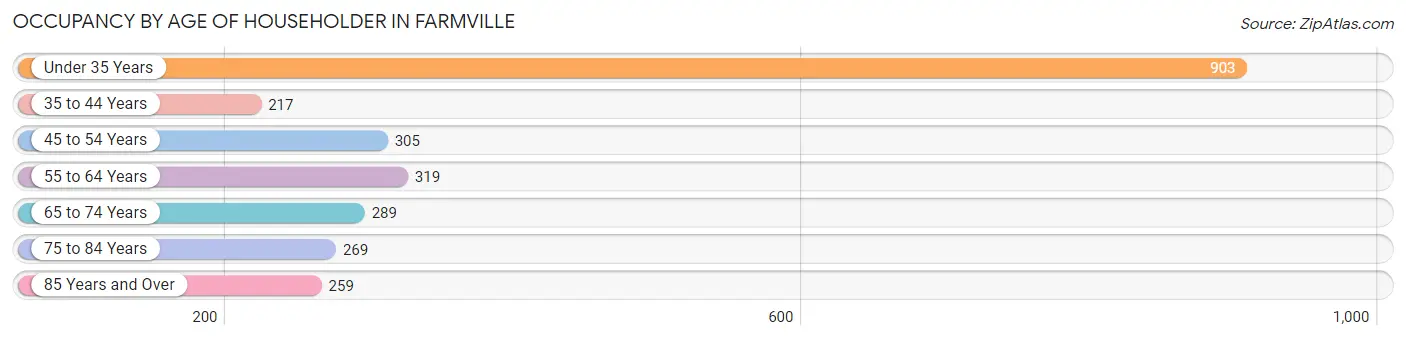
| Age Bracket | # Households | % Households |
| Under 35 Years | 903 | 35.3% |
| 35 to 44 Years | 217 | 8.5% |
| 45 to 54 Years | 305 | 11.9% |
| 55 to 64 Years | 319 | 12.5% |
| 65 to 74 Years | 289 | 11.3% |
| 75 to 84 Years | 269 | 10.5% |
| 85 Years and Over | 259 | 10.1% |
| Total | 2,561 | 100.0% |
Housing Finances in Farmville
Median Income by Occupancy in Farmville
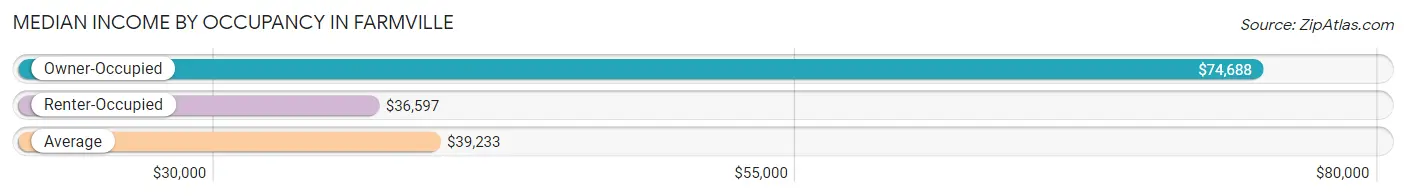
| Occupancy Type | # Households | Median Income |
| Owner-Occupied | 856 (33.4%) | $74,688 |
| Renter-Occupied | 1,705 (66.6%) | $36,597 |
| Average | 2,561 (100.0%) | $39,233 |
Occupancy by Householder Income Bracket in Farmville
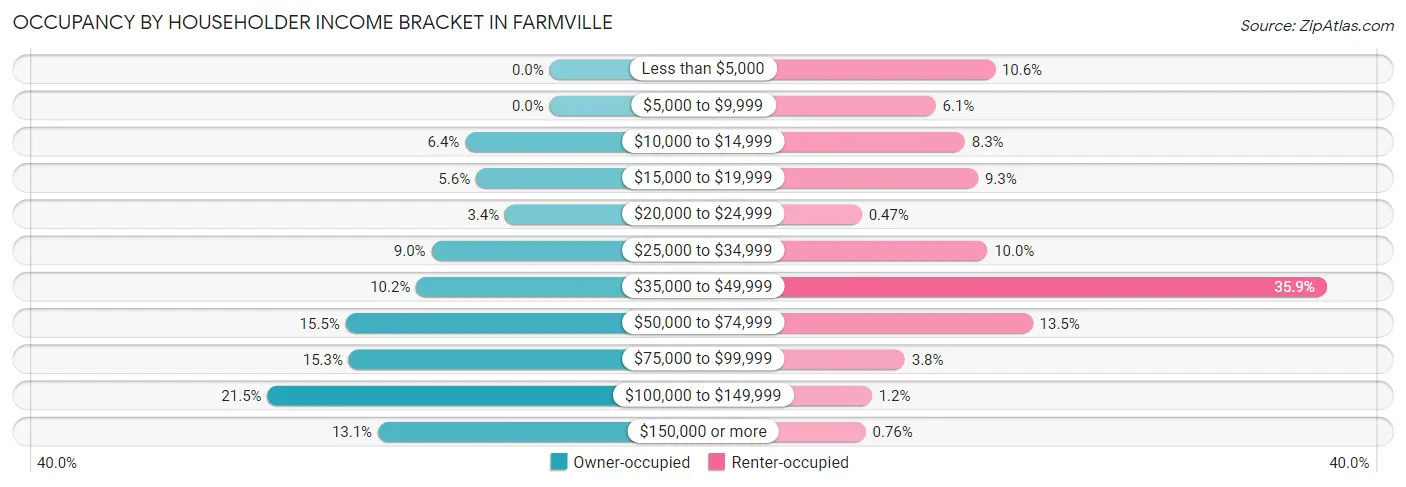
| Income Bracket | Owner-occupied | Renter-occupied |
| Less than $5,000 | 0 (0.0%) | 181 (10.6%) |
| $5,000 to $9,999 | 0 (0.0%) | 104 (6.1%) |
| $10,000 to $14,999 | 55 (6.4%) | 142 (8.3%) |
| $15,000 to $19,999 | 48 (5.6%) | 159 (9.3%) |
| $20,000 to $24,999 | 29 (3.4%) | 8 (0.5%) |
| $25,000 to $34,999 | 77 (9.0%) | 171 (10.0%) |
| $35,000 to $49,999 | 87 (10.2%) | 612 (35.9%) |
| $50,000 to $74,999 | 133 (15.5%) | 230 (13.5%) |
| $75,000 to $99,999 | 131 (15.3%) | 64 (3.7%) |
| $100,000 to $149,999 | 184 (21.5%) | 21 (1.2%) |
| $150,000 or more | 112 (13.1%) | 13 (0.8%) |
| Total | 856 (100.0%) | 1,705 (100.0%) |
Monthly Housing Cost Tiers in Farmville
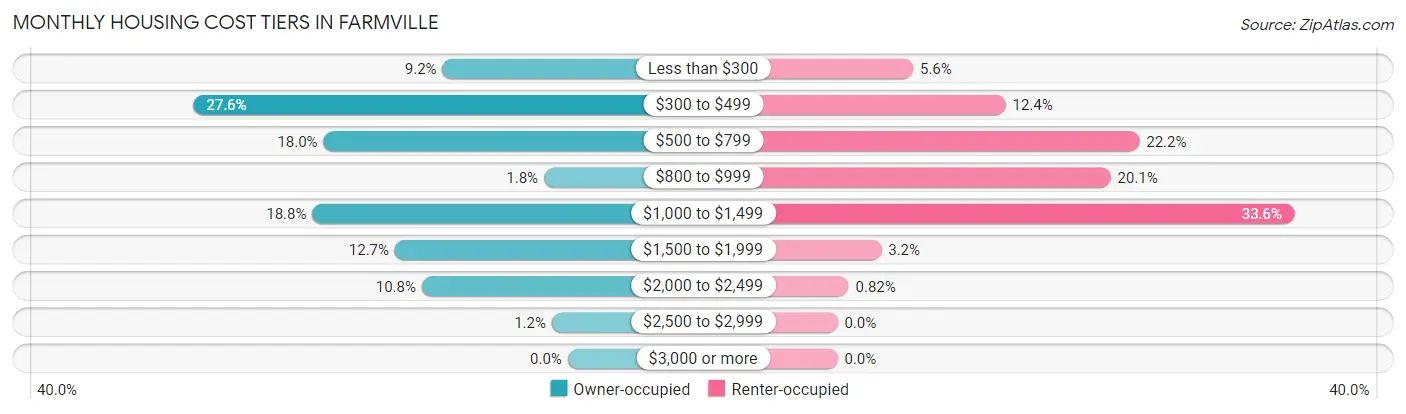
| Monthly Cost | Owner-occupied | Renter-occupied |
| Less than $300 | 79 (9.2%) | 95 (5.6%) |
| $300 to $499 | 236 (27.6%) | 211 (12.4%) |
| $500 to $799 | 154 (18.0%) | 379 (22.2%) |
| $800 to $999 | 15 (1.8%) | 343 (20.1%) |
| $1,000 to $1,499 | 161 (18.8%) | 573 (33.6%) |
| $1,500 to $1,999 | 109 (12.7%) | 55 (3.2%) |
| $2,000 to $2,499 | 92 (10.7%) | 14 (0.8%) |
| $2,500 to $2,999 | 10 (1.2%) | 0 (0.0%) |
| $3,000 or more | 0 (0.0%) | 0 (0.0%) |
| Total | 856 (100.0%) | 1,705 (100.0%) |
Physical Housing Characteristics in Farmville
Housing Structures in Farmville
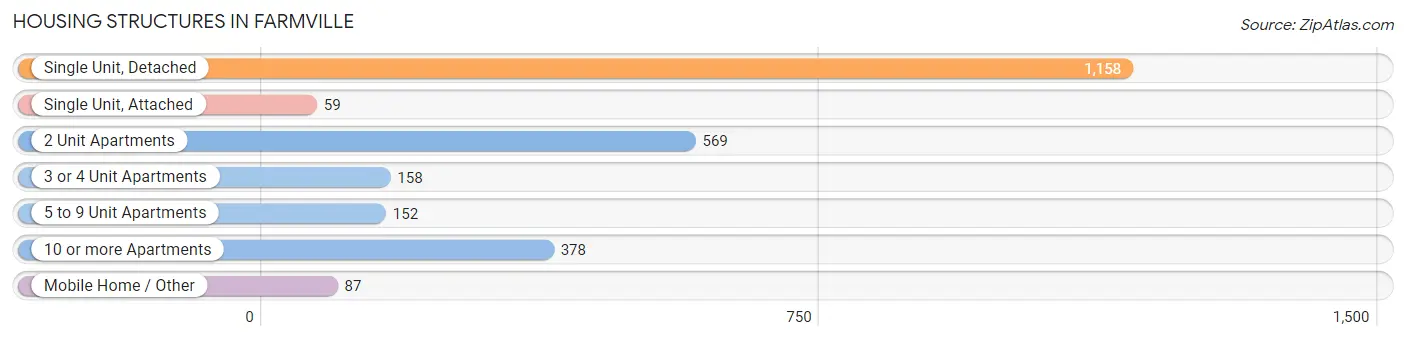
| Structure Type | # Housing Units | % Housing Units |
| Single Unit, Detached | 1,158 | 45.2% |
| Single Unit, Attached | 59 | 2.3% |
| 2 Unit Apartments | 569 | 22.2% |
| 3 or 4 Unit Apartments | 158 | 6.2% |
| 5 to 9 Unit Apartments | 152 | 5.9% |
| 10 or more Apartments | 378 | 14.8% |
| Mobile Home / Other | 87 | 3.4% |
| Total | 2,561 | 100.0% |
Housing Structures by Occupancy in Farmville
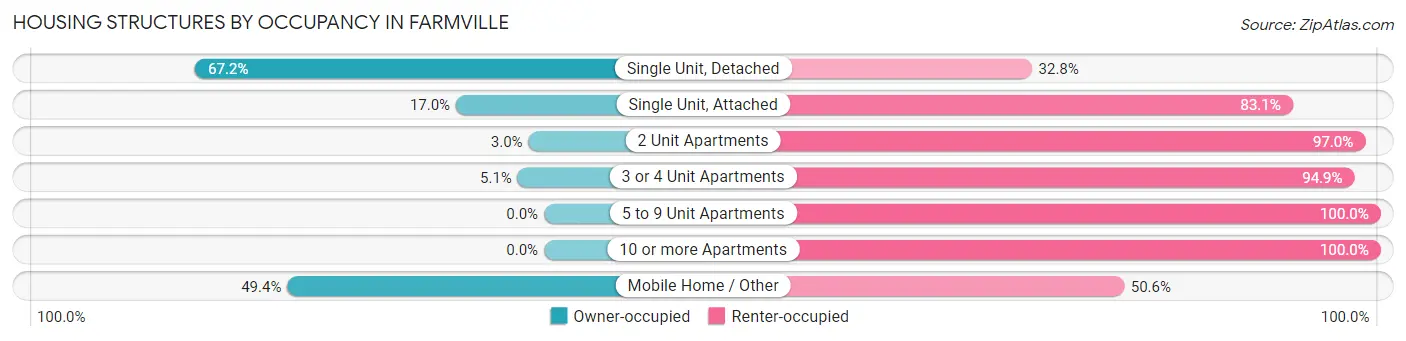
| Structure Type | Owner-occupied | Renter-occupied |
| Single Unit, Detached | 778 (67.2%) | 380 (32.8%) |
| Single Unit, Attached | 10 (17.0%) | 49 (83.1%) |
| 2 Unit Apartments | 17 (3.0%) | 552 (97.0%) |
| 3 or 4 Unit Apartments | 8 (5.1%) | 150 (94.9%) |
| 5 to 9 Unit Apartments | 0 (0.0%) | 152 (100.0%) |
| 10 or more Apartments | 0 (0.0%) | 378 (100.0%) |
| Mobile Home / Other | 43 (49.4%) | 44 (50.6%) |
| Total | 856 (33.4%) | 1,705 (66.6%) |
Housing Structures by Number of Rooms in Farmville
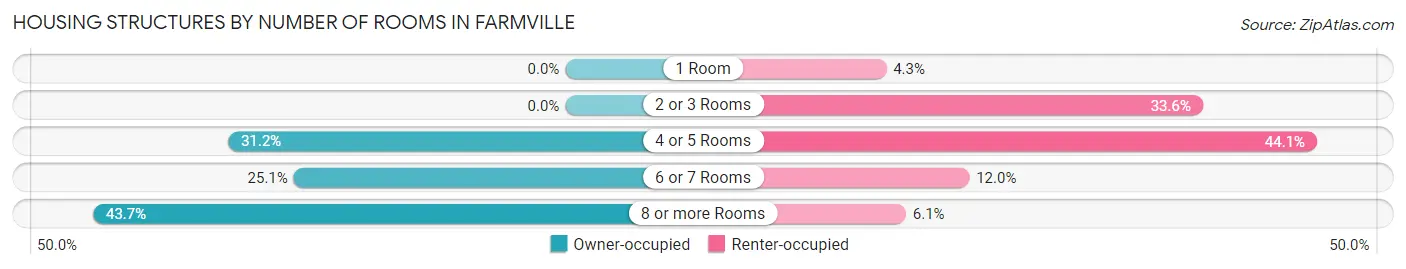
| Number of Rooms | Owner-occupied | Renter-occupied |
| 1 Room | 0 (0.0%) | 73 (4.3%) |
| 2 or 3 Rooms | 0 (0.0%) | 572 (33.6%) |
| 4 or 5 Rooms | 267 (31.2%) | 752 (44.1%) |
| 6 or 7 Rooms | 215 (25.1%) | 204 (12.0%) |
| 8 or more Rooms | 374 (43.7%) | 104 (6.1%) |
| Total | 856 (100.0%) | 1,705 (100.0%) |
Housing Structure by Heating Type in Farmville
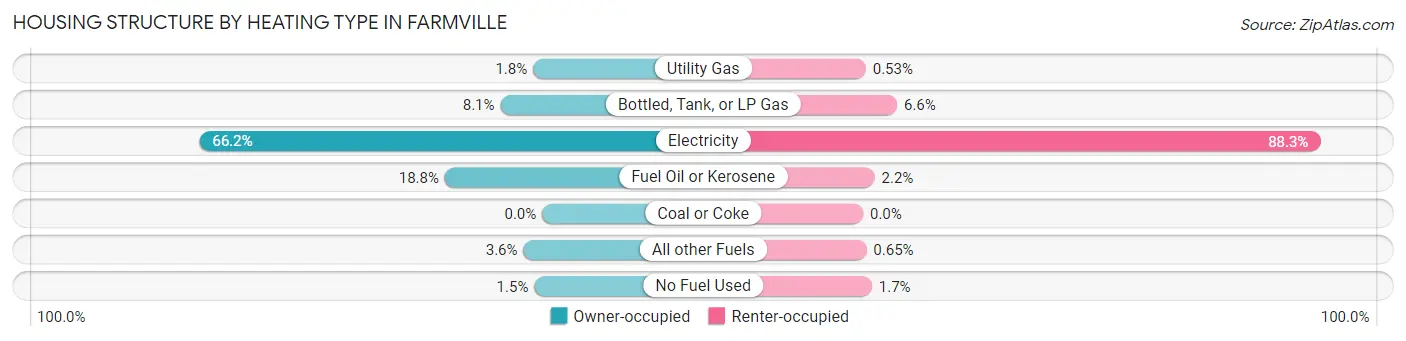
| Heating Type | Owner-occupied | Renter-occupied |
| Utility Gas | 15 (1.8%) | 9 (0.5%) |
| Bottled, Tank, or LP Gas | 69 (8.1%) | 112 (6.6%) |
| Electricity | 567 (66.2%) | 1,506 (88.3%) |
| Fuel Oil or Kerosene | 161 (18.8%) | 38 (2.2%) |
| Coal or Coke | 0 (0.0%) | 0 (0.0%) |
| All other Fuels | 31 (3.6%) | 11 (0.6%) |
| No Fuel Used | 13 (1.5%) | 29 (1.7%) |
| Total | 856 (100.0%) | 1,705 (100.0%) |
Household Vehicle Usage in Farmville
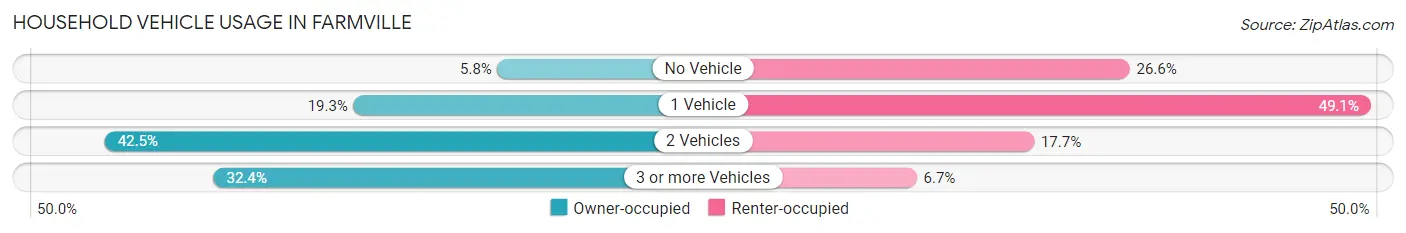
| Vehicles per Household | Owner-occupied | Renter-occupied |
| No Vehicle | 50 (5.8%) | 453 (26.6%) |
| 1 Vehicle | 165 (19.3%) | 837 (49.1%) |
| 2 Vehicles | 364 (42.5%) | 301 (17.6%) |
| 3 or more Vehicles | 277 (32.4%) | 114 (6.7%) |
| Total | 856 (100.0%) | 1,705 (100.0%) |
Real Estate & Mortgages in Farmville
Real Estate and Mortgage Overview in Farmville
| Characteristic | Without Mortgage | With Mortgage |
| Housing Units | 466 | 390 |
| Median Property Value | $208,900 | $262,500 |
| Median Household Income | $55,962 | $81 |
| Monthly Housing Costs | $447 | $0 |
| Real Estate Taxes | $796 | $36 |
Property Value by Mortgage Status in Farmville
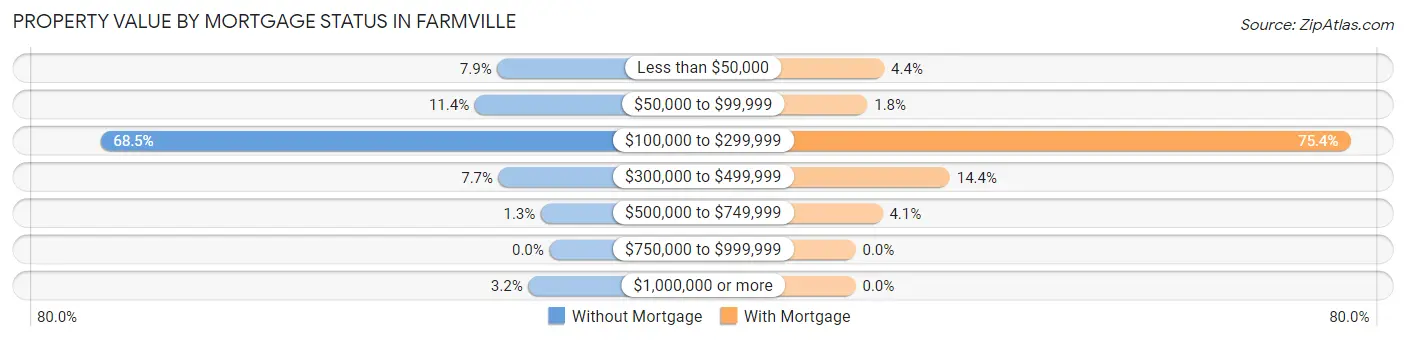
| Property Value | Without Mortgage | With Mortgage |
| Less than $50,000 | 37 (7.9%) | 17 (4.4%) |
| $50,000 to $99,999 | 53 (11.4%) | 7 (1.8%) |
| $100,000 to $299,999 | 319 (68.4%) | 294 (75.4%) |
| $300,000 to $499,999 | 36 (7.7%) | 56 (14.4%) |
| $500,000 to $749,999 | 6 (1.3%) | 16 (4.1%) |
| $750,000 to $999,999 | 0 (0.0%) | 0 (0.0%) |
| $1,000,000 or more | 15 (3.2%) | 0 (0.0%) |
| Total | 466 (100.0%) | 390 (100.0%) |
Household Income by Mortgage Status in Farmville
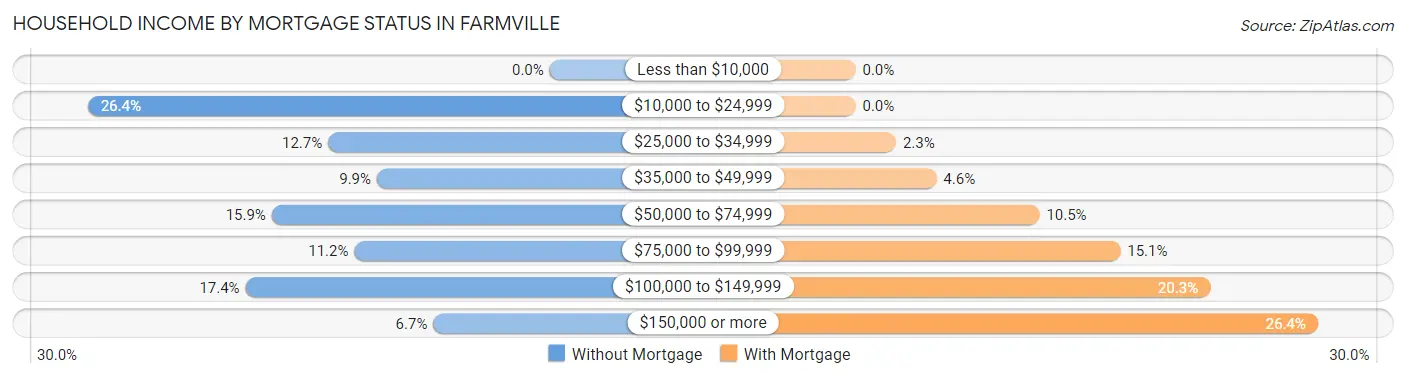
| Household Income | Without Mortgage | With Mortgage |
| Less than $10,000 | 0 (0.0%) | 0 (0.0%) |
| $10,000 to $24,999 | 123 (26.4%) | 0 (0.0%) |
| $25,000 to $34,999 | 59 (12.7%) | 9 (2.3%) |
| $35,000 to $49,999 | 46 (9.9%) | 18 (4.6%) |
| $50,000 to $74,999 | 74 (15.9%) | 41 (10.5%) |
| $75,000 to $99,999 | 52 (11.2%) | 59 (15.1%) |
| $100,000 to $149,999 | 81 (17.4%) | 79 (20.3%) |
| $150,000 or more | 31 (6.7%) | 103 (26.4%) |
| Total | 466 (100.0%) | 390 (100.0%) |
Property Value to Household Income Ratio in Farmville
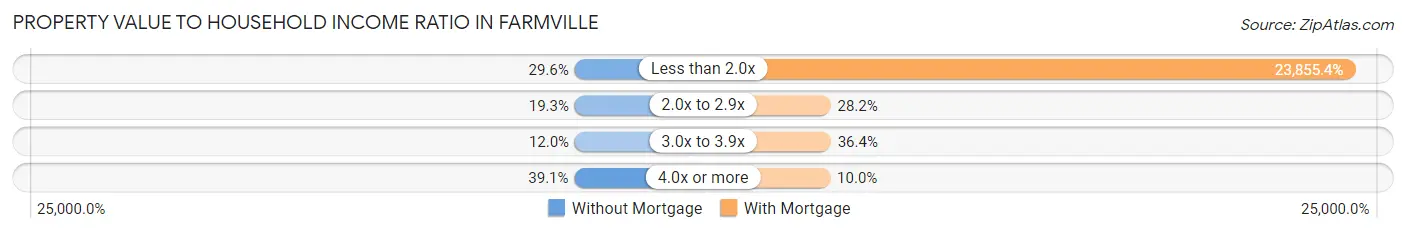
| Value-to-Income Ratio | Without Mortgage | With Mortgage |
| Less than 2.0x | 138 (29.6%) | 93,036 (23,855.4%) |
| 2.0x to 2.9x | 90 (19.3%) | 110 (28.2%) |
| 3.0x to 3.9x | 56 (12.0%) | 142 (36.4%) |
| 4.0x or more | 182 (39.1%) | 39 (10.0%) |
| Total | 466 (100.0%) | 390 (100.0%) |
Real Estate Taxes by Mortgage Status in Farmville
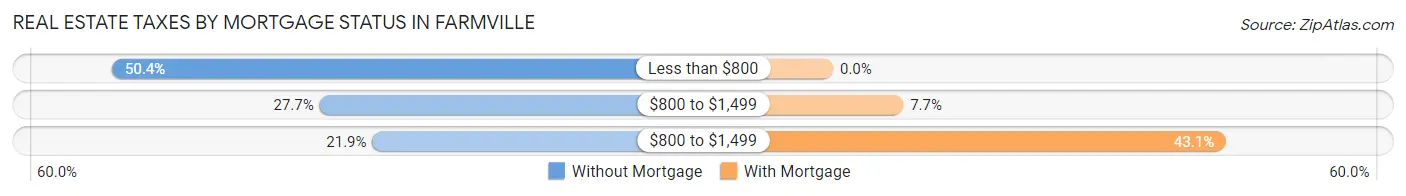
| Property Taxes | Without Mortgage | With Mortgage |
| Less than $800 | 235 (50.4%) | 0 (0.0%) |
| $800 to $1,499 | 129 (27.7%) | 30 (7.7%) |
| $800 to $1,499 | 102 (21.9%) | 168 (43.1%) |
| Total | 466 (100.0%) | 390 (100.0%) |
Health & Disability in Farmville
Health Insurance Coverage by Age in Farmville
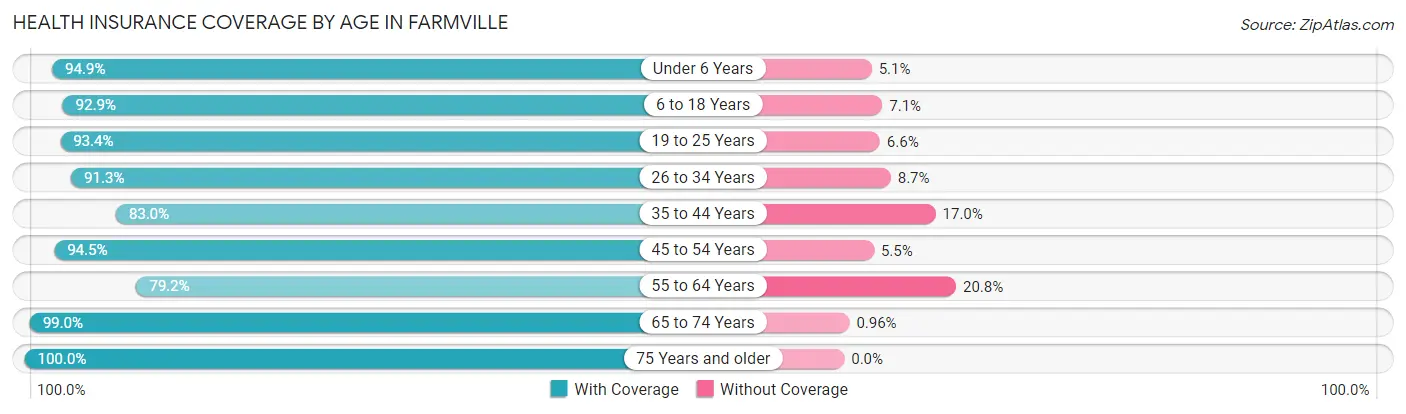
| Age Bracket | With Coverage | Without Coverage |
| Under 6 Years | 241 (94.9%) | 13 (5.1%) |
| 6 to 18 Years | 863 (92.9%) | 66 (7.1%) |
| 19 to 25 Years | 2,518 (93.4%) | 179 (6.6%) |
| 26 to 34 Years | 664 (91.3%) | 63 (8.7%) |
| 35 to 44 Years | 307 (83.0%) | 63 (17.0%) |
| 45 to 54 Years | 410 (94.5%) | 24 (5.5%) |
| 55 to 64 Years | 376 (79.2%) | 99 (20.8%) |
| 65 to 74 Years | 515 (99.0%) | 5 (1.0%) |
| 75 Years and older | 655 (100.0%) | 0 (0.0%) |
| Total | 6,549 (92.7%) | 512 (7.2%) |
Health Insurance Coverage by Citizenship Status in Farmville
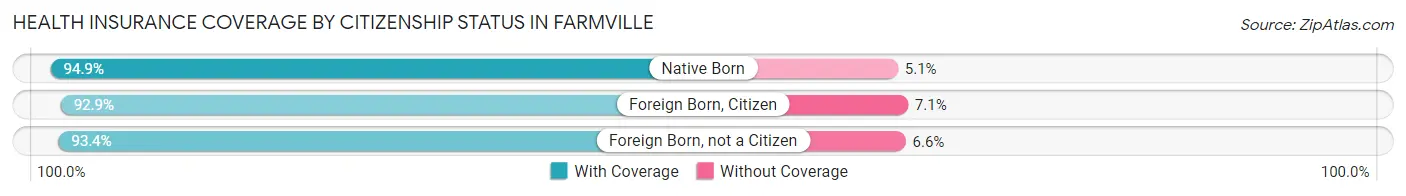
| Citizenship Status | With Coverage | Without Coverage |
| Native Born | 241 (94.9%) | 13 (5.1%) |
| Foreign Born, Citizen | 863 (92.9%) | 66 (7.1%) |
| Foreign Born, not a Citizen | 2,518 (93.4%) | 179 (6.6%) |
Health Insurance Coverage by Household Income in Farmville
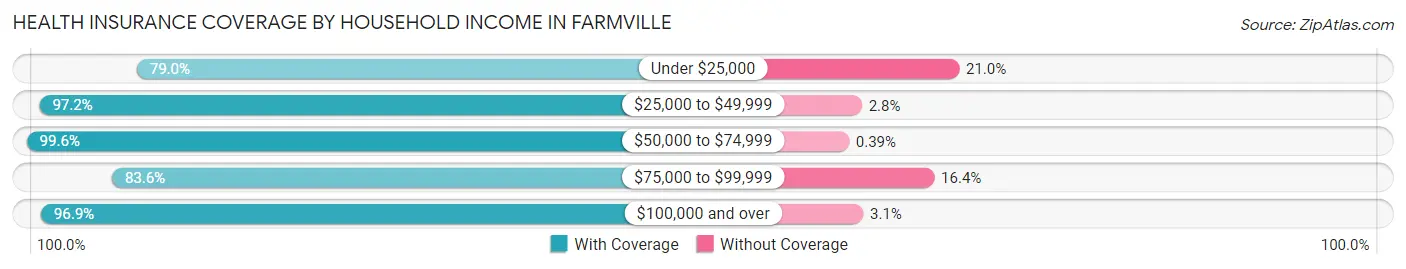
| Household Income | With Coverage | Without Coverage |
| Under $25,000 | 766 (79.0%) | 204 (21.0%) |
| $25,000 to $49,999 | 1,567 (97.2%) | 45 (2.8%) |
| $50,000 to $74,999 | 768 (99.6%) | 3 (0.4%) |
| $75,000 to $99,999 | 332 (83.6%) | 65 (16.4%) |
| $100,000 and over | 983 (96.9%) | 31 (3.1%) |
Public vs Private Health Insurance Coverage by Age in Farmville
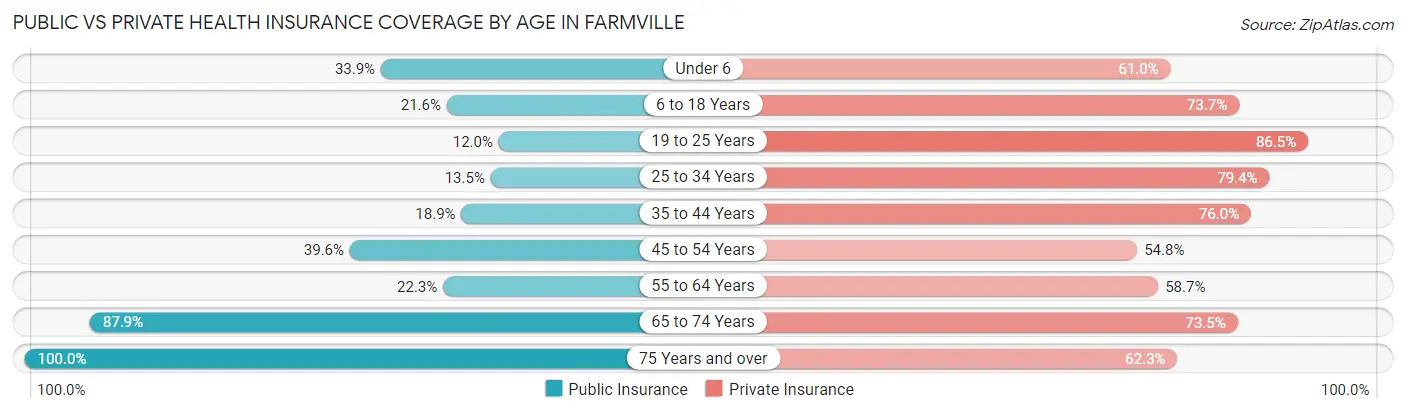
| Age Bracket | Public Insurance | Private Insurance |
| Under 6 | 86 (33.9%) | 155 (61.0%) |
| 6 to 18 Years | 201 (21.6%) | 685 (73.7%) |
| 19 to 25 Years | 323 (12.0%) | 2,334 (86.5%) |
| 25 to 34 Years | 98 (13.5%) | 577 (79.4%) |
| 35 to 44 Years | 70 (18.9%) | 281 (75.9%) |
| 45 to 54 Years | 172 (39.6%) | 238 (54.8%) |
| 55 to 64 Years | 106 (22.3%) | 279 (58.7%) |
| 65 to 74 Years | 457 (87.9%) | 382 (73.5%) |
| 75 Years and over | 655 (100.0%) | 408 (62.3%) |
| Total | 2,168 (30.7%) | 5,339 (75.6%) |
Disability Status by Sex by Age in Farmville
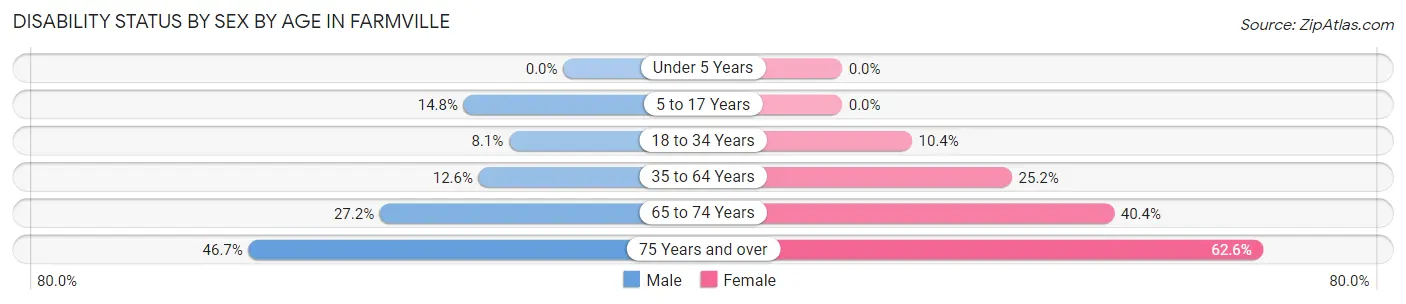
| Age Bracket | Male | Female |
| Under 5 Years | 0 (0.0%) | 0 (0.0%) |
| 5 to 17 Years | 30 (14.8%) | 0 (0.0%) |
| 18 to 34 Years | 116 (8.1%) | 263 (10.4%) |
| 35 to 64 Years | 59 (12.6%) | 204 (25.2%) |
| 65 to 74 Years | 58 (27.2%) | 124 (40.4%) |
| 75 Years and over | 86 (46.7%) | 295 (62.6%) |
Disability Class by Sex by Age in Farmville
Disability Class: Hearing Difficulty
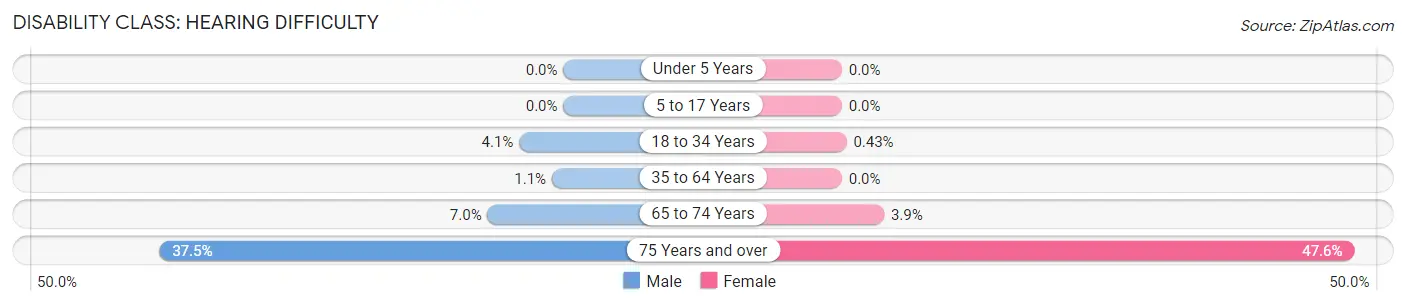
| Age Bracket | Male | Female |
| Under 5 Years | 0 (0.0%) | 0 (0.0%) |
| 5 to 17 Years | 0 (0.0%) | 0 (0.0%) |
| 18 to 34 Years | 59 (4.1%) | 11 (0.4%) |
| 35 to 64 Years | 5 (1.1%) | 0 (0.0%) |
| 65 to 74 Years | 15 (7.0%) | 12 (3.9%) |
| 75 Years and over | 69 (37.5%) | 224 (47.6%) |
Disability Class: Vision Difficulty
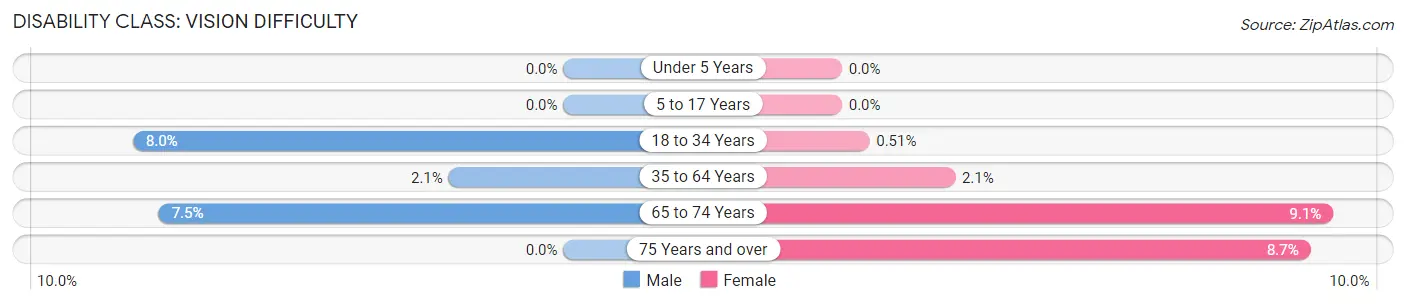
| Age Bracket | Male | Female |
| Under 5 Years | 0 (0.0%) | 0 (0.0%) |
| 5 to 17 Years | 0 (0.0%) | 0 (0.0%) |
| 18 to 34 Years | 115 (8.0%) | 13 (0.5%) |
| 35 to 64 Years | 10 (2.1%) | 17 (2.1%) |
| 65 to 74 Years | 16 (7.5%) | 28 (9.1%) |
| 75 Years and over | 0 (0.0%) | 41 (8.7%) |
Disability Class: Cognitive Difficulty
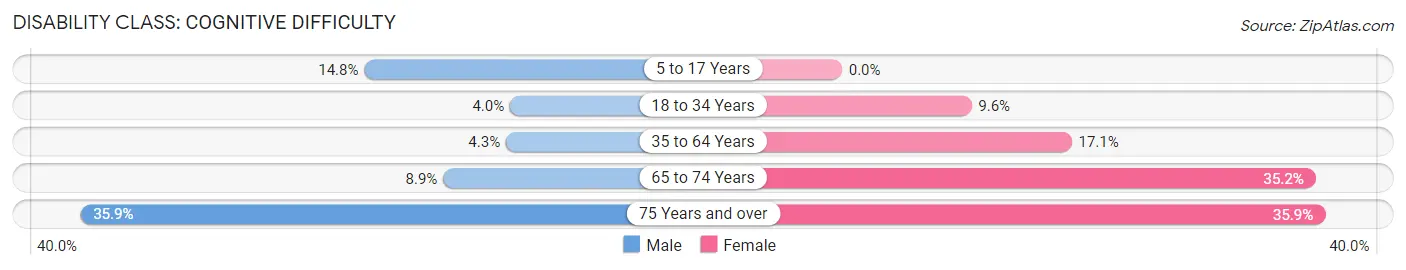
| Age Bracket | Male | Female |
| 5 to 17 Years | 30 (14.8%) | 0 (0.0%) |
| 18 to 34 Years | 57 (4.0%) | 244 (9.6%) |
| 35 to 64 Years | 20 (4.3%) | 138 (17.1%) |
| 65 to 74 Years | 19 (8.9%) | 108 (35.2%) |
| 75 Years and over | 66 (35.9%) | 169 (35.9%) |
Disability Class: Ambulatory Difficulty
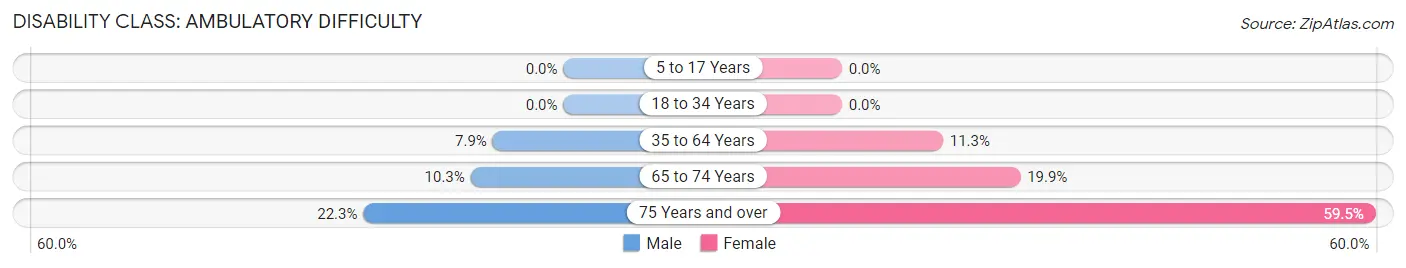
| Age Bracket | Male | Female |
| 5 to 17 Years | 0 (0.0%) | 0 (0.0%) |
| 18 to 34 Years | 0 (0.0%) | 0 (0.0%) |
| 35 to 64 Years | 37 (7.9%) | 91 (11.3%) |
| 65 to 74 Years | 22 (10.3%) | 61 (19.9%) |
| 75 Years and over | 41 (22.3%) | 280 (59.5%) |
Disability Class: Self-Care Difficulty
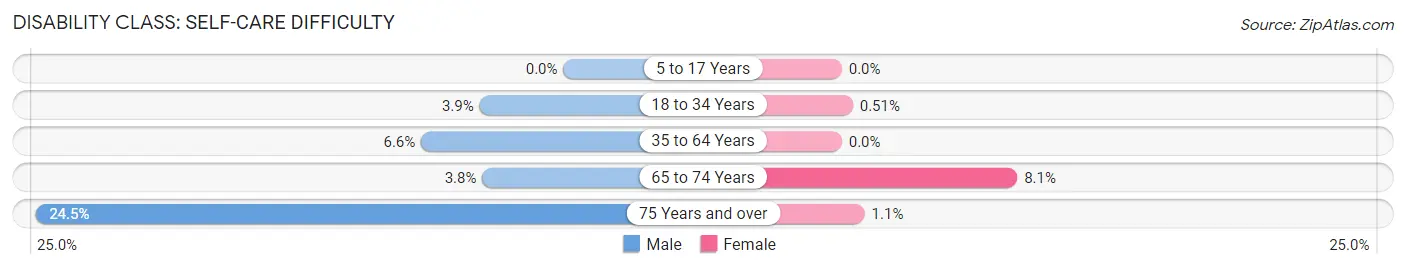
| Age Bracket | Male | Female |
| 5 to 17 Years | 0 (0.0%) | 0 (0.0%) |
| 18 to 34 Years | 56 (3.9%) | 13 (0.5%) |
| 35 to 64 Years | 31 (6.6%) | 0 (0.0%) |
| 65 to 74 Years | 8 (3.8%) | 25 (8.1%) |
| 75 Years and over | 45 (24.5%) | 5 (1.1%) |
Technology Access in Farmville
Computing Device Access in Farmville
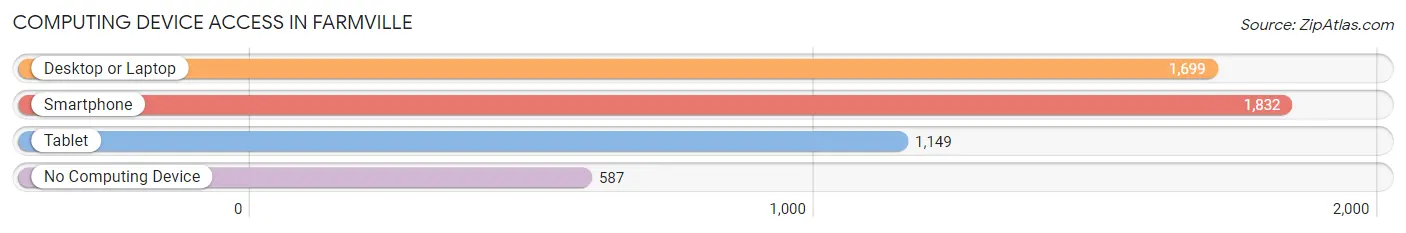
| Device Type | # Households | % Households |
| Desktop or Laptop | 1,699 | 66.3% |
| Smartphone | 1,832 | 71.5% |
| Tablet | 1,149 | 44.9% |
| No Computing Device | 587 | 22.9% |
| Total | 2,561 | 100.0% |
Internet Access in Farmville
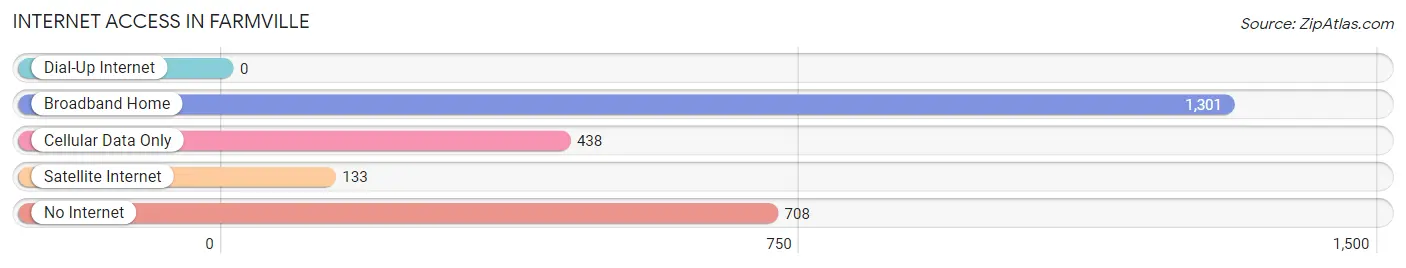
| Internet Type | # Households | % Households |
| Dial-Up Internet | 0 | 0.0% |
| Broadband Home | 1,301 | 50.8% |
| Cellular Data Only | 438 | 17.1% |
| Satellite Internet | 133 | 5.2% |
| No Internet | 708 | 27.7% |
| Total | 2,561 | 100.0% |
Farmville Summary
History
The town of Farmville, Virginia is located in the heart of Prince Edward County, and is the county seat. It is situated on the Appomattox River, and is part of the larger Richmond-Petersburg metropolitan area. The town was founded in 1798, and was originally known as “The Village of Farmville”. It was named after the nearby plantation of William Farmar, who was a prominent local landowner.
The town was an important stop on the Southside Railroad, which connected Petersburg to Lynchburg. This railroad was a major factor in the town’s growth and development. The town was also the site of the Battle of Farmville, which was a major battle in the American Civil War. The town was also the site of the first public school for African Americans in the state of Virginia.
The town has a rich history of education, and is home to several institutions of higher learning, including Longwood University, Hampden-Sydney College, and the University of Lynchburg. The town is also home to several historic sites, including the Robert Russa Moton Museum, which is dedicated to the history of African American education in the area.
Geography
Farmville is located in the Piedmont region of Virginia, and is situated on the Appomattox River. The town is located in the foothills of the Blue Ridge Mountains, and is surrounded by rolling hills and farmland. The town is located approximately 50 miles southwest of Richmond, and is part of the larger Richmond-Petersburg metropolitan area.
The town has a humid subtropical climate, with hot, humid summers and mild winters. The average annual temperature is around 60 degrees Fahrenheit, and the average annual precipitation is around 40 inches.
Economy
The economy of Farmville is largely based on agriculture and education. The town is home to several large farms, and is a major producer of tobacco, corn, soybeans, and other crops. The town is also home to several educational institutions, including Longwood University, Hampden-Sydney College, and the University of Lynchburg.
The town is also home to several large employers, including the Farmville Regional Medical Center, the Farmville Regional Airport, and the Farmville Regional Airport Authority. The town is also home to several small businesses, including restaurants, retail stores, and other services.
Demographics
As of the 2010 census, the population of Farmville was 8,216. The racial makeup of the town was 79.3% White, 17.2% African American, 0.4% Native American, 0.7% Asian, 0.1% Pacific Islander, and 2.3% from other races. The median household income was $35,945, and the median family income was $45,945. The per capita income was $19,945.
The town is home to several churches, including the Farmville United Methodist Church, the Farmville Baptist Church, and the Farmville Presbyterian Church. The town is also home to several schools, including Longwood University, Hampden-Sydney College, and the University of Lynchburg. The town is also home to several parks, including the Farmville Town Park, the Farmville Regional Airport, and the Farmville Regional Airport Authority.
Common Questions
What is Per Capita Income in Farmville?
Per Capita income in Farmville is $19,935.
What is the Median Family Income in Farmville?
Median Family Income in Farmville is $56,722.
What is the Median Household income in Farmville?
Median Household Income in Farmville is $39,233.
What is Income or Wage Gap in Farmville?
Income or Wage Gap in Farmville is 51.3%.
Women in Farmville earn 48.7 cents for every dollar earned by a man.
What is Inequality or Gini Index in Farmville?
Inequality or Gini Index in Farmville is 0.48.
What is the Total Population of Farmville?
Total Population of Farmville is 7,647.
What is the Total Male Population of Farmville?
Total Male Population of Farmville is 3,246.
What is the Total Female Population of Farmville?
Total Female Population of Farmville is 4,401.
What is the Ratio of Males per 100 Females in Farmville?
There are 73.76 Males per 100 Females in Farmville.
What is the Ratio of Females per 100 Males in Farmville?
There are 135.58 Females per 100 Males in Farmville.
What is the Median Population Age in Farmville?
Median Population Age in Farmville is 24.4 Years.
What is the Average Family Size in Farmville
Average Family Size in Farmville is 2.6 People.
What is the Average Household Size in Farmville
Average Household Size in Farmville is 1.9 People.
How Large is the Labor Force in Farmville?
There are 2,648 People in the Labor Forcein in Farmville.
What is the Percentage of People in the Labor Force in Farmville?
37.2% of People are in the Labor Force in Farmville.
What is the Unemployment Rate in Farmville?
Unemployment Rate in Farmville is 3.2%.