Collinsville, VA Map & Demographics
Collinsville Map
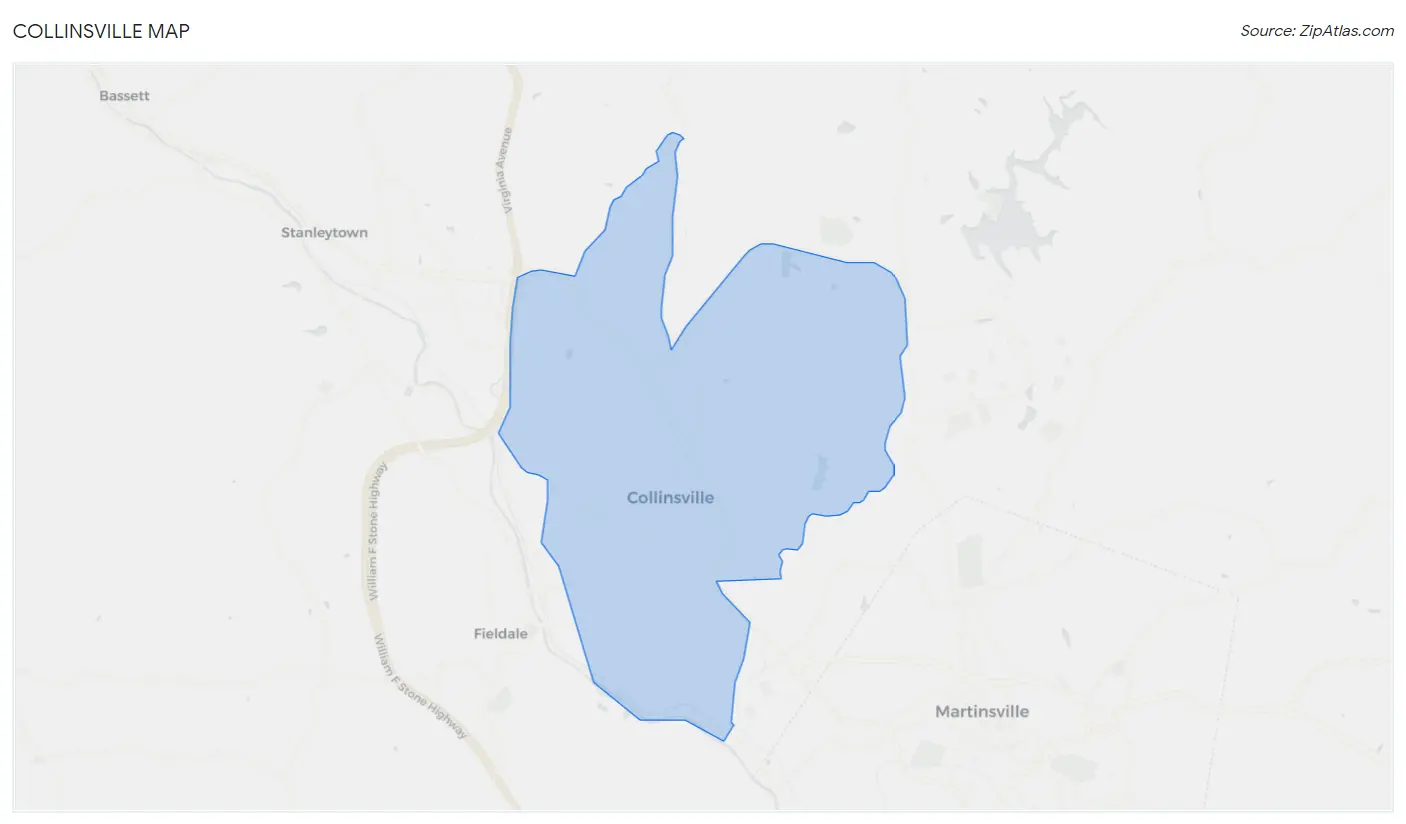
Collinsville Overview
$23,483
PER CAPITA INCOME
$62,661
AVG FAMILY INCOME
$45,914
AVG HOUSEHOLD INCOME
24.3%
WAGE / INCOME GAP [ % ]
75.7¢/ $1
WAGE / INCOME GAP [ $ ]
$10,510
FAMILY INCOME DEFICIT
0.40
INEQUALITY / GINI INDEX
7,640
TOTAL POPULATION
3,548
MALE POPULATION
4,092
FEMALE POPULATION
86.71
MALES / 100 FEMALES
115.33
FEMALES / 100 MALES
39.7
MEDIAN AGE
3.2
AVG FAMILY SIZE
2.5
AVG HOUSEHOLD SIZE
3,721
LABOR FORCE [ PEOPLE ]
62.3%
PERCENT IN LABOR FORCE
6.8%
UNEMPLOYMENT RATE
Collinsville Zip Codes
Collinsville Area Codes
Income in Collinsville
Income Overview in Collinsville
Per Capita Income in Collinsville is $23,483, while median incomes of families and households are $62,661 and $45,914 respectively.
| Characteristic | Number | Measure |
| Per Capita Income | 7,640 | $23,483 |
| Median Family Income | 1,826 | $62,661 |
| Mean Family Income | 1,826 | $69,553 |
| Median Household Income | 3,079 | $45,914 |
| Mean Household Income | 3,079 | $54,856 |
| Income Deficit | 1,826 | $10,510 |
| Wage / Income Gap (%) | 7,640 | 24.25% |
| Wage / Income Gap ($) | 7,640 | 75.75¢ per $1 |
| Gini / Inequality Index | 7,640 | 0.40 |
Earnings by Sex in Collinsville
Average Earnings in Collinsville are $27,520, $31,729 for men and $24,034 for women, a difference of 24.2%.
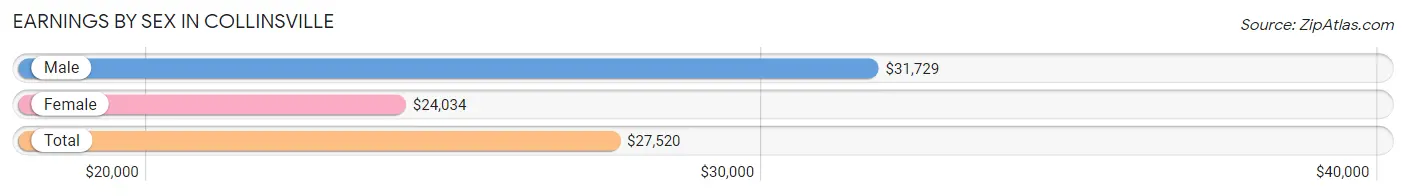
| Sex | Number | Average Earnings |
| Male | 1,803 (47.9%) | $31,729 |
| Female | 1,960 (52.1%) | $24,034 |
| Total | 3,763 (100.0%) | $27,520 |
Earnings by Sex by Income Bracket in Collinsville
The most common earnings brackets in Collinsville are $45,000 to $49,999 for men (233 | 12.9%) and $40,000 to $44,999 for women (255 | 13.0%).
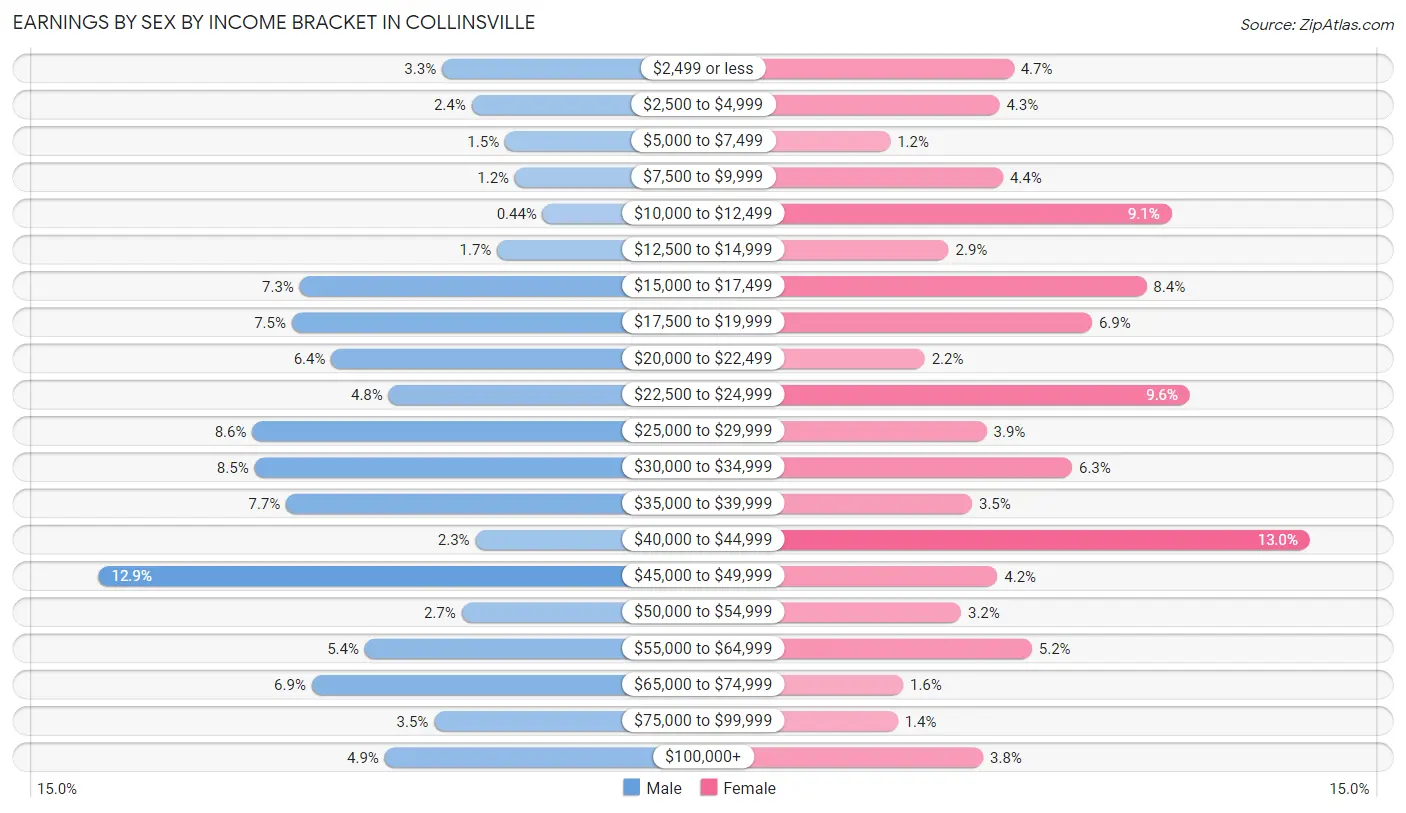
| Income | Male | Female |
| $2,499 or less | 59 (3.3%) | 92 (4.7%) |
| $2,500 to $4,999 | 44 (2.4%) | 84 (4.3%) |
| $5,000 to $7,499 | 27 (1.5%) | 24 (1.2%) |
| $7,500 to $9,999 | 22 (1.2%) | 86 (4.4%) |
| $10,000 to $12,499 | 8 (0.4%) | 179 (9.1%) |
| $12,500 to $14,999 | 31 (1.7%) | 56 (2.9%) |
| $15,000 to $17,499 | 131 (7.3%) | 165 (8.4%) |
| $17,500 to $19,999 | 135 (7.5%) | 135 (6.9%) |
| $20,000 to $22,499 | 115 (6.4%) | 43 (2.2%) |
| $22,500 to $24,999 | 86 (4.8%) | 189 (9.6%) |
| $25,000 to $29,999 | 155 (8.6%) | 77 (3.9%) |
| $30,000 to $34,999 | 154 (8.5%) | 124 (6.3%) |
| $35,000 to $39,999 | 138 (7.6%) | 69 (3.5%) |
| $40,000 to $44,999 | 42 (2.3%) | 255 (13.0%) |
| $45,000 to $49,999 | 233 (12.9%) | 83 (4.2%) |
| $50,000 to $54,999 | 49 (2.7%) | 63 (3.2%) |
| $55,000 to $64,999 | 98 (5.4%) | 102 (5.2%) |
| $65,000 to $74,999 | 125 (6.9%) | 31 (1.6%) |
| $75,000 to $99,999 | 63 (3.5%) | 28 (1.4%) |
| $100,000+ | 88 (4.9%) | 75 (3.8%) |
| Total | 1,803 (100.0%) | 1,960 (100.0%) |
Earnings by Sex by Educational Attainment in Collinsville
Average earnings in Collinsville are $36,754 for men and $27,108 for women, a difference of 26.2%. Men with an educational attainment of graduate degree enjoy the highest average annual earnings of $49,163, while those with less than high school education earn the least with $19,757. Women with an educational attainment of bachelor's degree earn the most with the average annual earnings of $42,500, while those with less than high school education have the smallest earnings of $13,125.
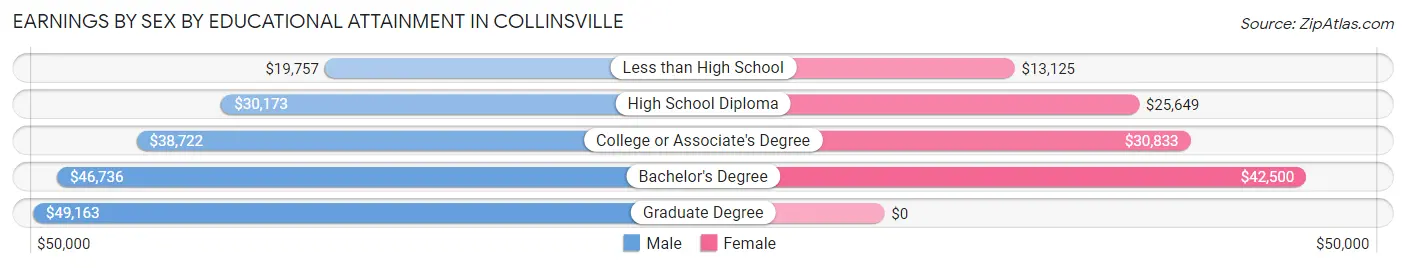
| Educational Attainment | Male Income | Female Income |
| Less than High School | $19,757 | $13,125 |
| High School Diploma | $30,173 | $25,649 |
| College or Associate's Degree | $38,722 | $30,833 |
| Bachelor's Degree | $46,736 | $42,500 |
| Graduate Degree | $49,163 | $0 |
| Total | $36,754 | $27,108 |
Family Income in Collinsville
Family Income Brackets in Collinsville
According to the Collinsville family income data, there are 519 families falling into the $50,000 to $74,999 income range, which is the most common income bracket and makes up 28.4% of all families. Conversely, the $15,000 to $24,999 income bracket is the least frequent group with only 29 families (1.6%) belonging to this category.
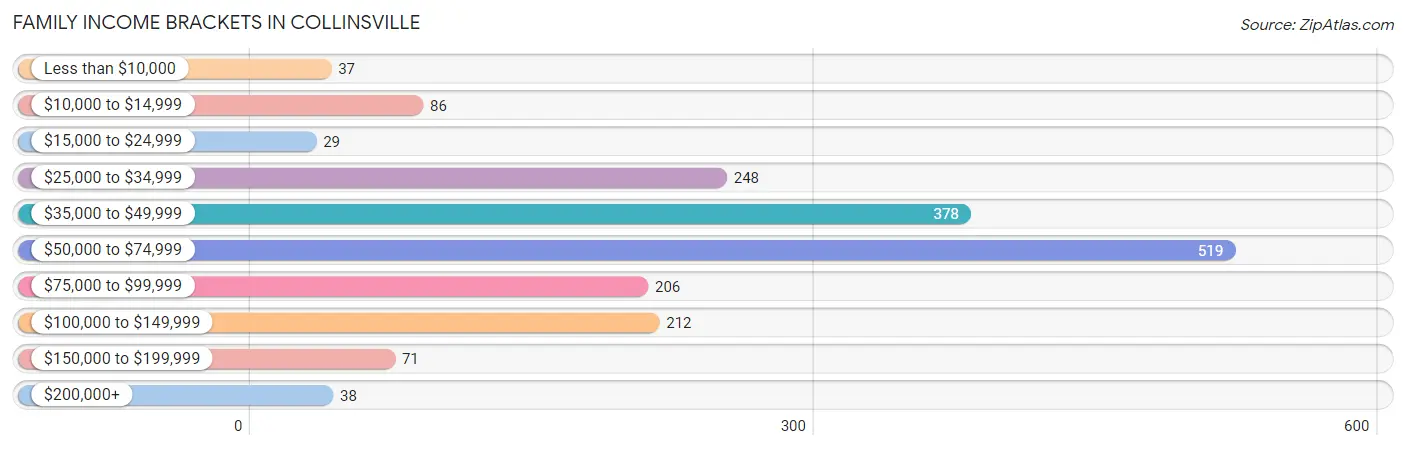
| Income Bracket | # Families | % Families |
| Less than $10,000 | 37 | 2.0% |
| $10,000 to $14,999 | 86 | 4.7% |
| $15,000 to $24,999 | 29 | 1.6% |
| $25,000 to $34,999 | 248 | 13.6% |
| $35,000 to $49,999 | 378 | 20.7% |
| $50,000 to $74,999 | 519 | 28.4% |
| $75,000 to $99,999 | 206 | 11.3% |
| $100,000 to $149,999 | 212 | 11.6% |
| $150,000 to $199,999 | 71 | 3.9% |
| $200,000+ | 38 | 2.1% |
Family Income by Famaliy Size in Collinsville
6-person families (97 | 5.3%) account for the highest median family income in Collinsville with $105,568 per family, while 2-person families (883 | 48.4%) have the highest median income of $23,958 per family member.
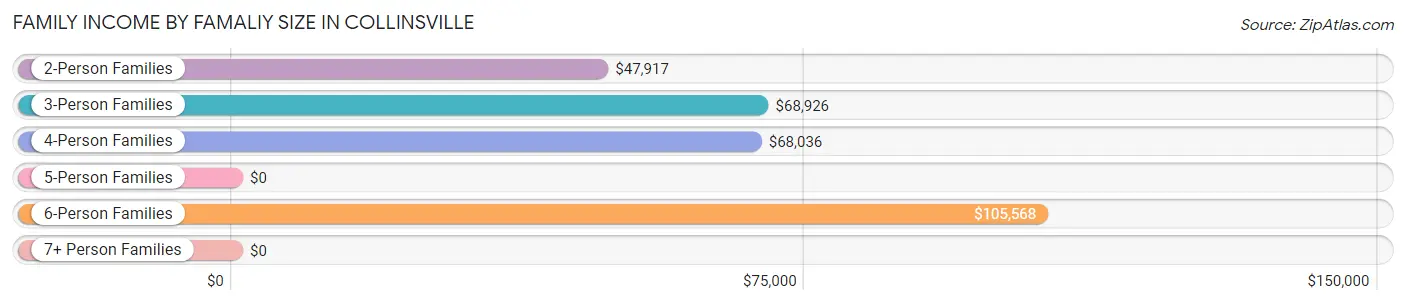
| Income Bracket | # Families | Median Income |
| 2-Person Families | 883 (48.4%) | $47,917 |
| 3-Person Families | 675 (37.0%) | $68,926 |
| 4-Person Families | 100 (5.5%) | $68,036 |
| 5-Person Families | 38 (2.1%) | $0 |
| 6-Person Families | 97 (5.3%) | $105,568 |
| 7+ Person Families | 33 (1.8%) | $0 |
| Total | 1,826 (100.0%) | $62,661 |
Family Income by Number of Earners in Collinsville
The median family income in Collinsville is $62,661, with families comprising 3+ earners (156) having the highest median family income of $106,591, while families with no earners (387) have the lowest median family income of $39,448, accounting for 8.5% and 21.2% of families, respectively.
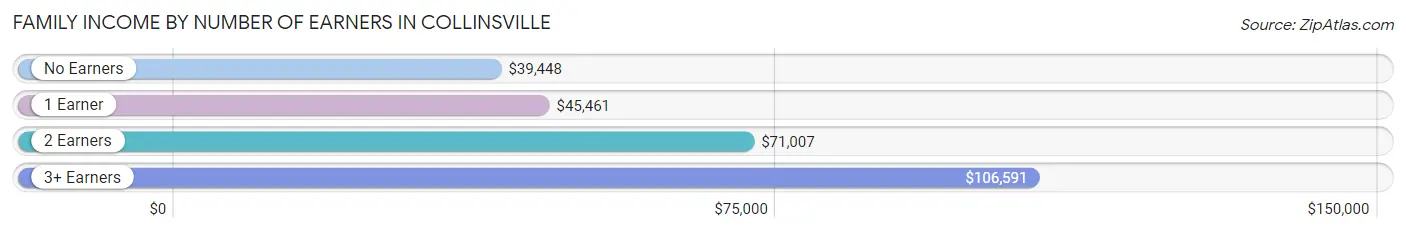
| Number of Earners | # Families | Median Income |
| No Earners | 387 (21.2%) | $39,448 |
| 1 Earner | 509 (27.9%) | $45,461 |
| 2 Earners | 774 (42.4%) | $71,007 |
| 3+ Earners | 156 (8.5%) | $106,591 |
| Total | 1,826 (100.0%) | $62,661 |
Household Income in Collinsville
Household Income Brackets in Collinsville
With 739 households falling in the category, the $50,000 to $74,999 income range is the most frequent in Collinsville, accounting for 24.0% of all households. In contrast, only 40 households (1.3%) fall into the $200,000+ income bracket, making it the least populous group.
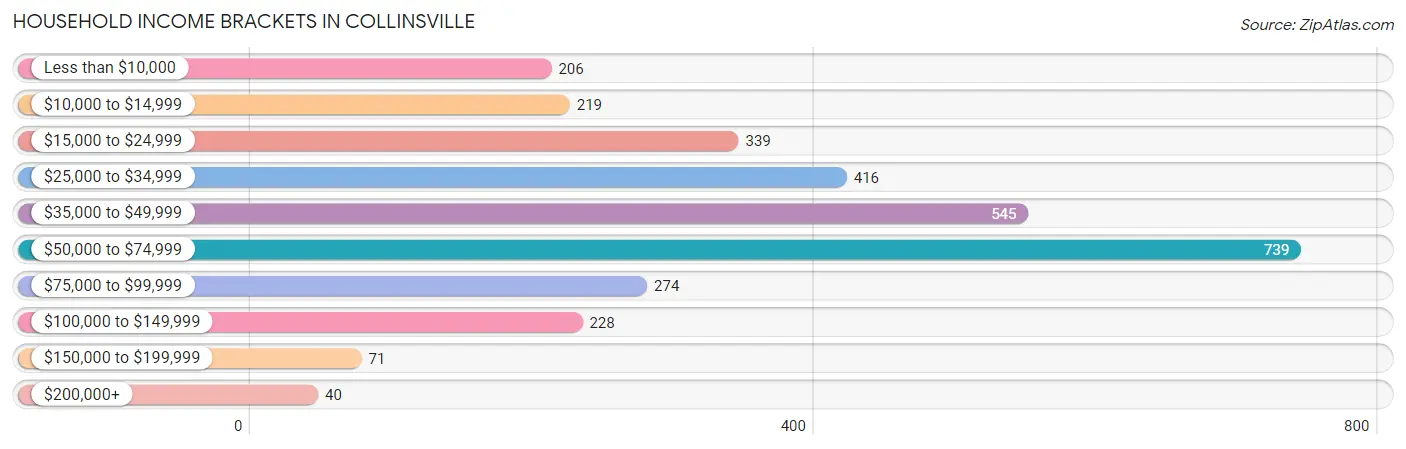
| Income Bracket | # Households | % Households |
| Less than $10,000 | 206 | 6.7% |
| $10,000 to $14,999 | 219 | 7.1% |
| $15,000 to $24,999 | 339 | 11.0% |
| $25,000 to $34,999 | 416 | 13.5% |
| $35,000 to $49,999 | 545 | 17.7% |
| $50,000 to $74,999 | 739 | 24.0% |
| $75,000 to $99,999 | 274 | 8.9% |
| $100,000 to $149,999 | 228 | 7.4% |
| $150,000 to $199,999 | 71 | 2.3% |
| $200,000+ | 40 | 1.3% |
Household Income by Householder Age in Collinsville
The median household income in Collinsville is $45,914, with the highest median household income of $58,694 found in the 45 to 64 years age bracket for the primary householder. A total of 1,181 households (38.4%) fall into this category. Meanwhile, the 65+ years age bracket for the primary householder has the lowest median household income of $31,992, with 838 households (27.2%) in this group.
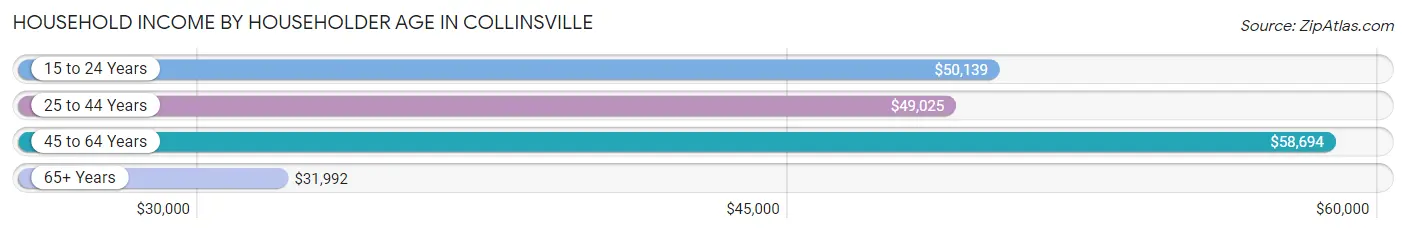
| Income Bracket | # Households | Median Income |
| 15 to 24 Years | 139 (4.5%) | $50,139 |
| 25 to 44 Years | 921 (29.9%) | $49,025 |
| 45 to 64 Years | 1,181 (38.4%) | $58,694 |
| 65+ Years | 838 (27.2%) | $31,992 |
| Total | 3,079 (100.0%) | $45,914 |
Poverty in Collinsville
Income Below Poverty by Sex and Age in Collinsville
With 11.0% poverty level for males and 16.2% for females among the residents of Collinsville, under 5 year old males and under 5 year old females are the most vulnerable to poverty, with 95 males (57.2%) and 67 females (35.4%) in their respective age groups living below the poverty level.
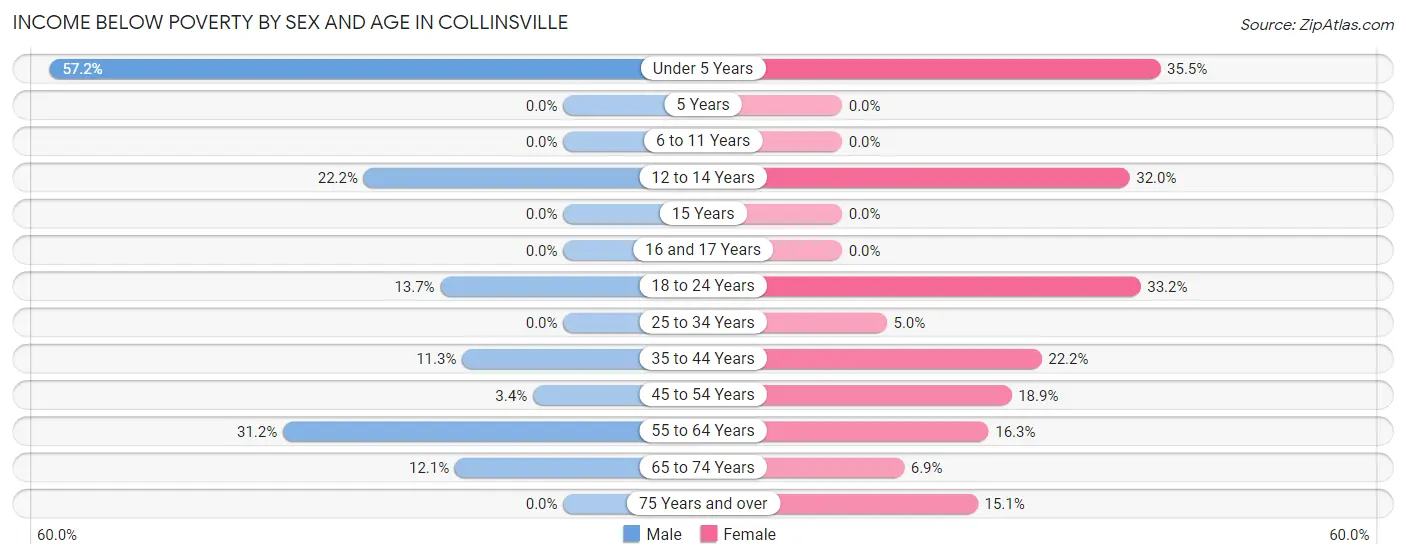
| Age Bracket | Male | Female |
| Under 5 Years | 95 (57.2%) | 67 (35.4%) |
| 5 Years | 0 (0.0%) | 0 (0.0%) |
| 6 to 11 Years | 0 (0.0%) | 0 (0.0%) |
| 12 to 14 Years | 22 (22.2%) | 65 (32.0%) |
| 15 Years | 0 (0.0%) | 0 (0.0%) |
| 16 and 17 Years | 0 (0.0%) | 0 (0.0%) |
| 18 to 24 Years | 49 (13.7%) | 124 (33.2%) |
| 25 to 34 Years | 0 (0.0%) | 21 (5.0%) |
| 35 to 44 Years | 50 (11.3%) | 114 (22.2%) |
| 45 to 54 Years | 18 (3.4%) | 114 (18.9%) |
| 55 to 64 Years | 118 (31.2%) | 63 (16.3%) |
| 65 to 74 Years | 34 (12.1%) | 26 (6.9%) |
| 75 Years and over | 0 (0.0%) | 62 (15.1%) |
| Total | 386 (11.0%) | 656 (16.2%) |
Income Above Poverty by Sex and Age in Collinsville
According to the poverty statistics in Collinsville, males aged 5 years and females aged 6 to 11 years are the age groups that are most secure financially, with 100.0% of males and 100.0% of females in these age groups living above the poverty line.
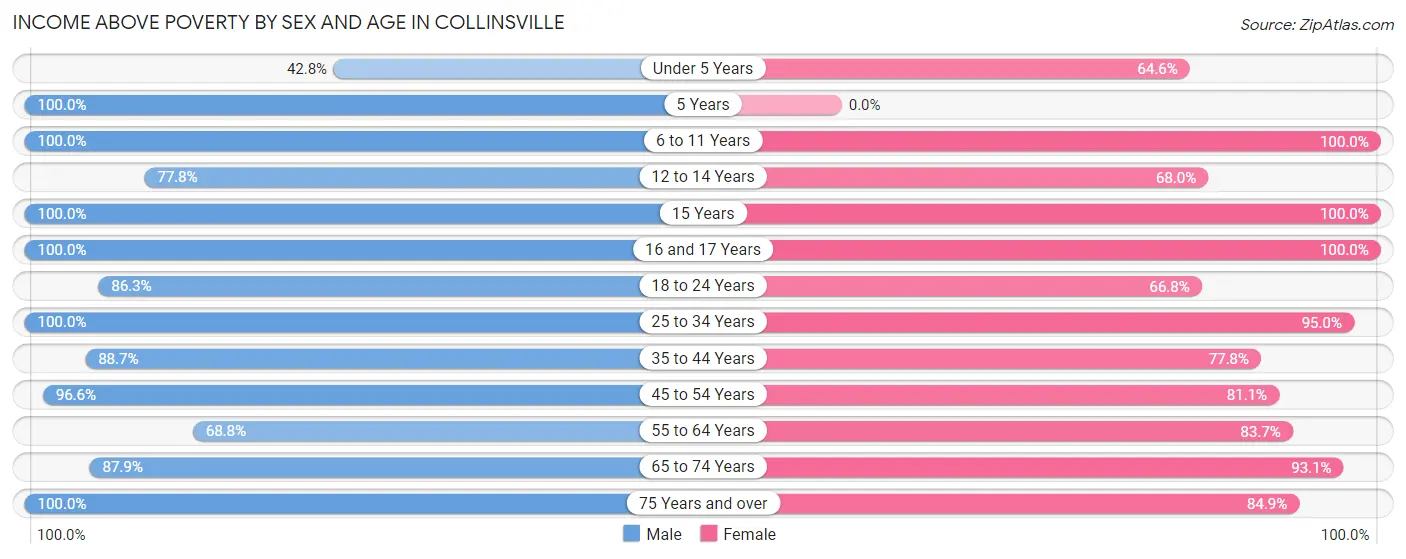
| Age Bracket | Male | Female |
| Under 5 Years | 71 (42.8%) | 122 (64.5%) |
| 5 Years | 45 (100.0%) | 0 (0.0%) |
| 6 to 11 Years | 459 (100.0%) | 226 (100.0%) |
| 12 to 14 Years | 77 (77.8%) | 138 (68.0%) |
| 15 Years | 16 (100.0%) | 246 (100.0%) |
| 16 and 17 Years | 100 (100.0%) | 91 (100.0%) |
| 18 to 24 Years | 309 (86.3%) | 249 (66.8%) |
| 25 to 34 Years | 405 (100.0%) | 401 (95.0%) |
| 35 to 44 Years | 394 (88.7%) | 399 (77.8%) |
| 45 to 54 Years | 515 (96.6%) | 490 (81.1%) |
| 55 to 64 Years | 260 (68.8%) | 323 (83.7%) |
| 65 to 74 Years | 248 (87.9%) | 351 (93.1%) |
| 75 Years and over | 240 (100.0%) | 348 (84.9%) |
| Total | 3,139 (89.0%) | 3,384 (83.8%) |
Income Below Poverty Among Married-Couple Families in Collinsville
The poverty statistics for married-couple families in Collinsville show that 3.4% or 43 of the total 1,253 families live below the poverty line. Families with 3 or 4 children have the highest poverty rate of 18.9%, comprising of 14 families. On the other hand, families with 1 or 2 children have the lowest poverty rate of 0.0%, which includes 0 families.
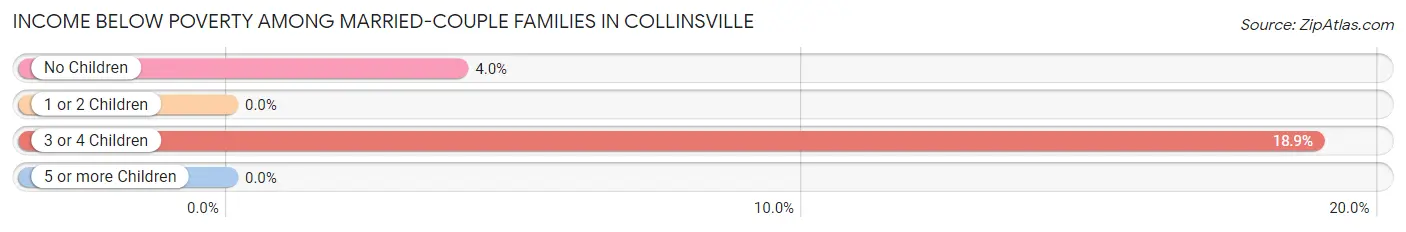
| Children | Above Poverty | Below Poverty |
| No Children | 695 (96.0%) | 29 (4.0%) |
| 1 or 2 Children | 422 (100.0%) | 0 (0.0%) |
| 3 or 4 Children | 60 (81.1%) | 14 (18.9%) |
| 5 or more Children | 33 (100.0%) | 0 (0.0%) |
| Total | 1,210 (96.6%) | 43 (3.4%) |
Income Below Poverty Among Single-Parent Households in Collinsville
| Children | Single Father | Single Mother |
| No Children | 0 (0.0%) | 30 (18.5%) |
| 1 or 2 Children | 0 (0.0%) | 56 (36.1%) |
| 3 or 4 Children | 0 (0.0%) | 16 (100.0%) |
| 5 or more Children | 0 (0.0%) | 0 (0.0%) |
| Total | 0 (0.0%) | 102 (30.6%) |
Income Below Poverty Among Married-Couple vs Single-Parent Households in Collinsville
The poverty data for Collinsville shows that 43 of the married-couple family households (3.4%) and 102 of the single-parent households (17.8%) are living below the poverty level. Within the married-couple family households, those with 3 or 4 children have the highest poverty rate, with 14 households (18.9%) falling below the poverty line. Among the single-parent households, those with 3 or 4 children have the highest poverty rate, with 16 household (100.0%) living below poverty.
| Children | Married-Couple Families | Single-Parent Households |
| No Children | 29 (4.0%) | 30 (12.9%) |
| 1 or 2 Children | 0 (0.0%) | 56 (17.2%) |
| 3 or 4 Children | 14 (18.9%) | 16 (100.0%) |
| 5 or more Children | 0 (0.0%) | 0 (0.0%) |
| Total | 43 (3.4%) | 102 (17.8%) |
Race in Collinsville
The most populous races in Collinsville are White / Caucasian (5,526 | 72.3%), Black / African American (1,299 | 17.0%), and Hispanic or Latino (706 | 9.2%).
| Race | # Population | % Population |
| Asian | 129 | 1.7% |
| Black / African American | 1,299 | 17.0% |
| Hawaiian / Pacific | 0 | 0.0% |
| Hispanic or Latino | 706 | 9.2% |
| Native / Alaskan | 0 | 0.0% |
| White / Caucasian | 5,526 | 72.3% |
| Two or more Races | 447 | 5.9% |
| Some other Race | 239 | 3.1% |
| Total | 7,640 | 100.0% |
Ancestry in Collinsville
The most populous ancestries reported in Collinsville are American (1,566 | 20.5%), English (919 | 12.0%), Irish (645 | 8.4%), German (410 | 5.4%), and Mexican (389 | 5.1%), together accounting for 51.4% of all Collinsville residents.
| Ancestry | # Population | % Population |
| American | 1,566 | 20.5% |
| Arab | 87 | 1.1% |
| British | 74 | 1.0% |
| Central American | 270 | 3.5% |
| Cherokee | 22 | 0.3% |
| Dutch | 26 | 0.3% |
| Egyptian | 87 | 1.1% |
| English | 919 | 12.0% |
| European | 76 | 1.0% |
| French | 115 | 1.5% |
| German | 410 | 5.4% |
| Greek | 10 | 0.1% |
| Guatemalan | 139 | 1.8% |
| Honduran | 121 | 1.6% |
| Irish | 645 | 8.4% |
| Italian | 217 | 2.8% |
| Mexican | 389 | 5.1% |
| Norwegian | 17 | 0.2% |
| Polish | 18 | 0.2% |
| Puerto Rican | 18 | 0.2% |
| Salvadoran | 10 | 0.1% |
| Scotch-Irish | 105 | 1.4% |
| Scottish | 105 | 1.4% |
| Subsaharan African | 22 | 0.3% |
| Swiss | 1 | 0.0% |
| Thai | 129 | 1.7% |
| Ukrainian | 6 | 0.1% |
| Welsh | 18 | 0.2% | View All 28 Rows |
Immigrants in Collinsville
The most numerous immigrant groups reported in Collinsville came from Latin America (236 | 3.1%), Central America (219 | 2.9%), Mexico (152 | 2.0%), Europe (67 | 0.9%), and Italy (67 | 0.9%), together accounting for 9.7% of all Collinsville residents.
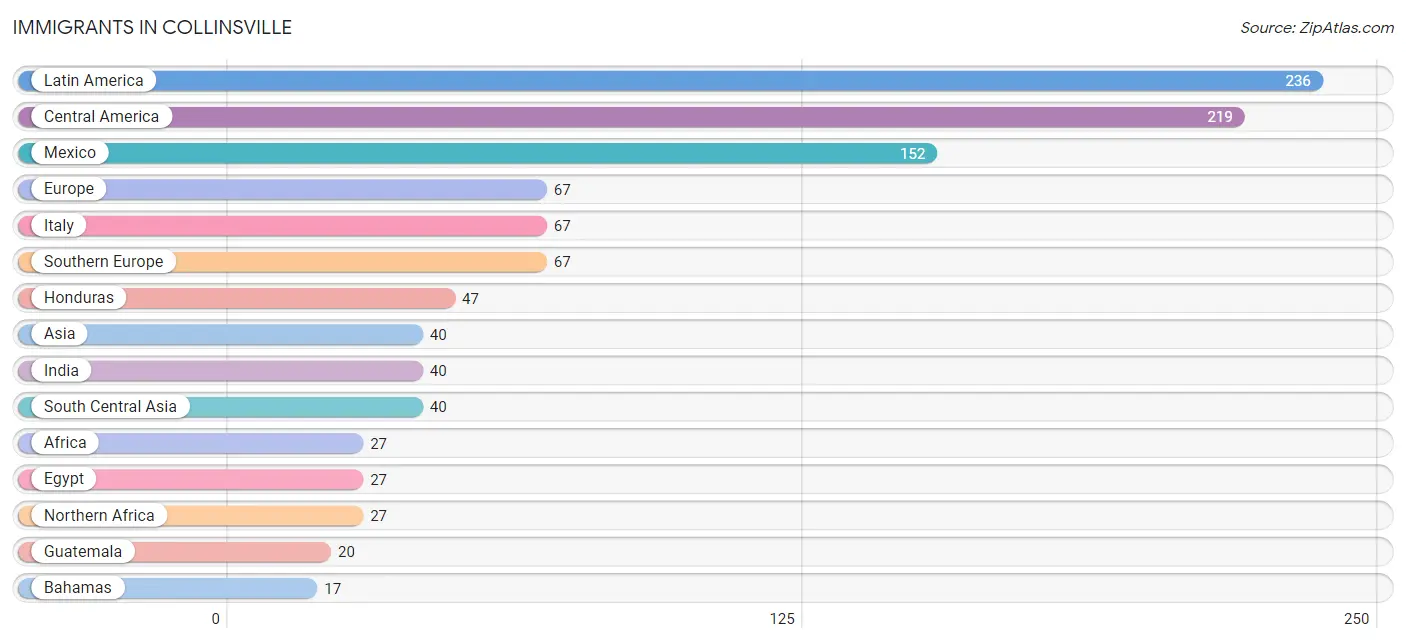
| Immigration Origin | # Population | % Population |
| Africa | 27 | 0.4% |
| Asia | 40 | 0.5% |
| Bahamas | 17 | 0.2% |
| Caribbean | 17 | 0.2% |
| Central America | 219 | 2.9% |
| Egypt | 27 | 0.4% |
| Europe | 67 | 0.9% |
| Guatemala | 20 | 0.3% |
| Honduras | 47 | 0.6% |
| India | 40 | 0.5% |
| Italy | 67 | 0.9% |
| Latin America | 236 | 3.1% |
| Mexico | 152 | 2.0% |
| Northern Africa | 27 | 0.4% |
| South Central Asia | 40 | 0.5% |
| Southern Europe | 67 | 0.9% | View All 16 Rows |
Sex and Age in Collinsville
Sex and Age in Collinsville
The most populous age groups in Collinsville are 45 to 49 Years (356 | 10.0%) for men and 15 to 19 Years (431 | 10.5%) for women.
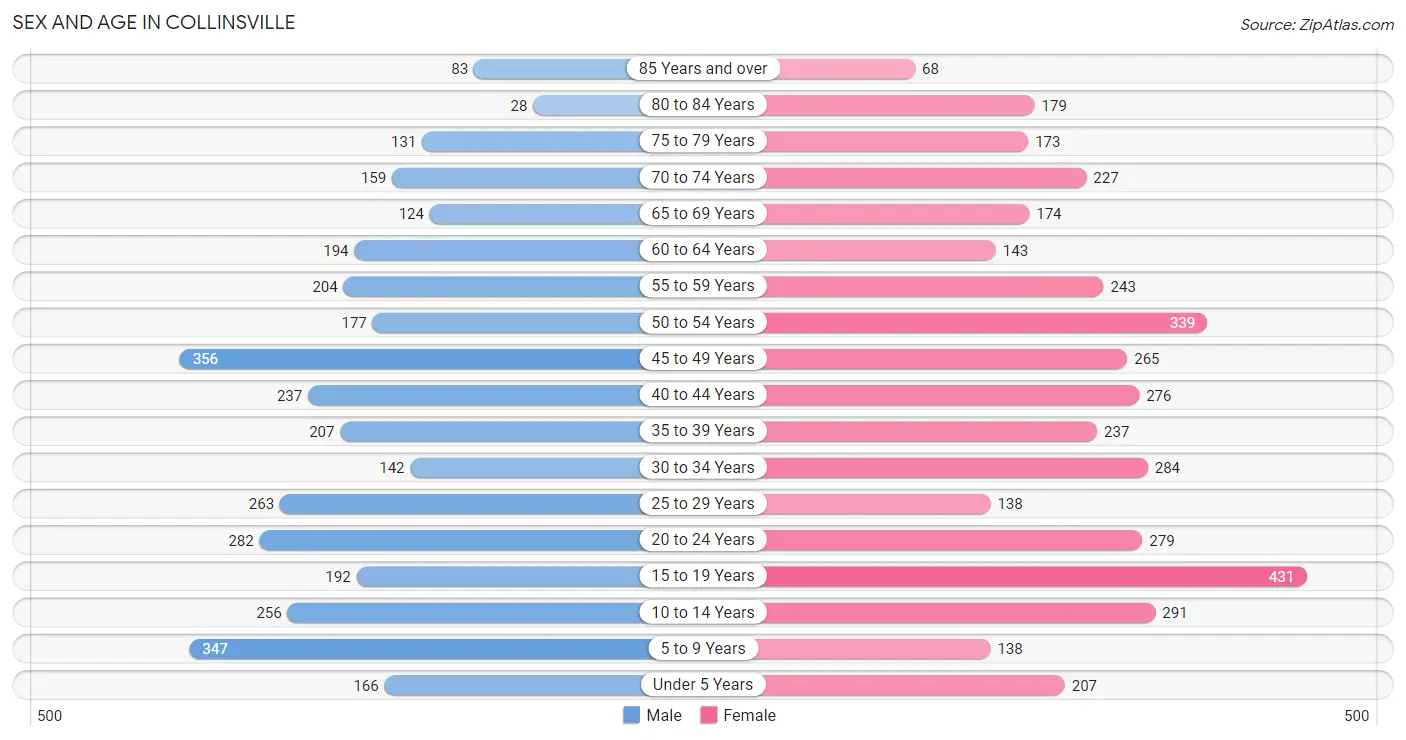
| Age Bracket | Male | Female |
| Under 5 Years | 166 (4.7%) | 207 (5.1%) |
| 5 to 9 Years | 347 (9.8%) | 138 (3.4%) |
| 10 to 14 Years | 256 (7.2%) | 291 (7.1%) |
| 15 to 19 Years | 192 (5.4%) | 431 (10.5%) |
| 20 to 24 Years | 282 (8.0%) | 279 (6.8%) |
| 25 to 29 Years | 263 (7.4%) | 138 (3.4%) |
| 30 to 34 Years | 142 (4.0%) | 284 (6.9%) |
| 35 to 39 Years | 207 (5.8%) | 237 (5.8%) |
| 40 to 44 Years | 237 (6.7%) | 276 (6.7%) |
| 45 to 49 Years | 356 (10.0%) | 265 (6.5%) |
| 50 to 54 Years | 177 (5.0%) | 339 (8.3%) |
| 55 to 59 Years | 204 (5.8%) | 243 (5.9%) |
| 60 to 64 Years | 194 (5.5%) | 143 (3.5%) |
| 65 to 69 Years | 124 (3.5%) | 174 (4.3%) |
| 70 to 74 Years | 159 (4.5%) | 227 (5.6%) |
| 75 to 79 Years | 131 (3.7%) | 173 (4.2%) |
| 80 to 84 Years | 28 (0.8%) | 179 (4.4%) |
| 85 Years and over | 83 (2.3%) | 68 (1.7%) |
| Total | 3,548 (100.0%) | 4,092 (100.0%) |
Families and Households in Collinsville
Median Family Size in Collinsville
The median family size in Collinsville is 3.23 persons per family, with single female/mother families (333 | 18.2%) accounting for the largest median family size of 3.53 persons per family. On the other hand, single male/father families (240 | 13.1%) represent the smallest median family size with 2.90 persons per family.
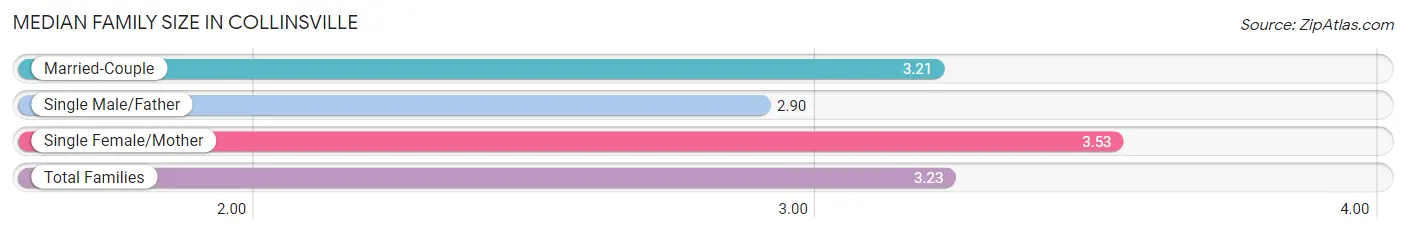
| Family Type | # Families | Family Size |
| Married-Couple | 1,253 (68.6%) | 3.21 |
| Single Male/Father | 240 (13.1%) | 2.90 |
| Single Female/Mother | 333 (18.2%) | 3.53 |
| Total Families | 1,826 (100.0%) | 3.23 |
Median Household Size in Collinsville
The median household size in Collinsville is 2.46 persons per household, with single female/mother households (333 | 10.8%) accounting for the largest median household size of 3.66 persons per household. non-family households (1,253 | 40.7%) represent the smallest median household size with 1.20 persons per household.
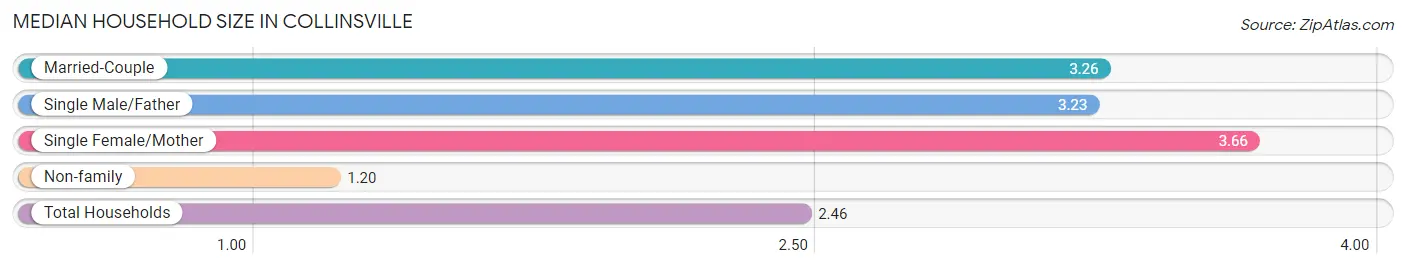
| Household Type | # Households | Household Size |
| Married-Couple | 1,253 (40.7%) | 3.26 |
| Single Male/Father | 240 (7.8%) | 3.23 |
| Single Female/Mother | 333 (10.8%) | 3.66 |
| Non-family | 1,253 (40.7%) | 1.20 |
| Total Households | 3,079 (100.0%) | 2.46 |
Household Size by Marriage Status in Collinsville
Out of a total of 3,079 households in Collinsville, 1,826 (59.3%) are family households, while 1,253 (40.7%) are nonfamily households. The most numerous type of family households are 2-person households, comprising 862, and the most common type of nonfamily households are 1-person households, comprising 1,077.
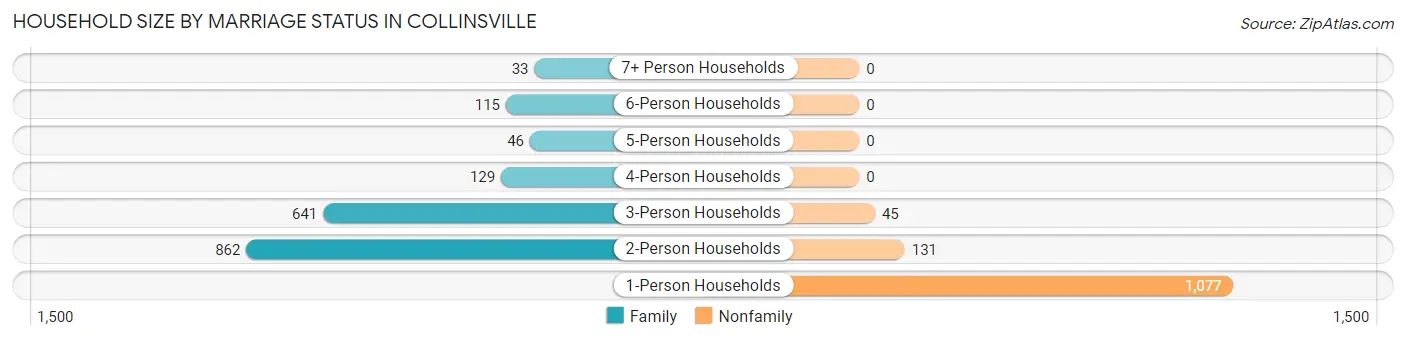
| Household Size | Family Households | Nonfamily Households |
| 1-Person Households | - | 1,077 (35.0%) |
| 2-Person Households | 862 (28.0%) | 131 (4.3%) |
| 3-Person Households | 641 (20.8%) | 45 (1.5%) |
| 4-Person Households | 129 (4.2%) | 0 (0.0%) |
| 5-Person Households | 46 (1.5%) | 0 (0.0%) |
| 6-Person Households | 115 (3.7%) | 0 (0.0%) |
| 7+ Person Households | 33 (1.1%) | 0 (0.0%) |
| Total | 1,826 (59.3%) | 1,253 (40.7%) |
Female Fertility in Collinsville
Fertility by Age in Collinsville
Average fertility rate in Collinsville is 42.0 births per 1,000 women. Women in the age bracket of 20 to 34 years have the highest fertility rate with 114.0 births per 1,000 women. Women in the age bracket of 20 to 34 years acount for 100.0% of all women with births.
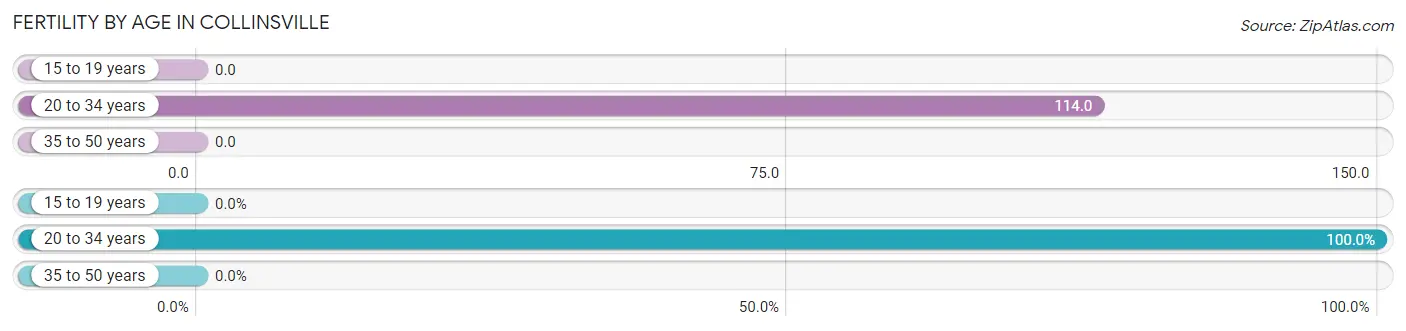
| Age Bracket | Women with Births | Births / 1,000 Women |
| 15 to 19 years | 0 (0.0%) | 0.0 |
| 20 to 34 years | 80 (100.0%) | 114.0 |
| 35 to 50 years | 0 (0.0%) | 0.0 |
| Total | 80 (100.0%) | 42.0 |
Fertility by Age by Marriage Status in Collinsville
28.7% of women with births (80) in Collinsville are married. The highest percentage of unmarried women with births falls into 20 to 34 years age bracket with 71.3% of them unmarried at the time of birth, while the lowest percentage of unmarried women with births belong to 20 to 34 years age bracket with 71.3% of them unmarried.
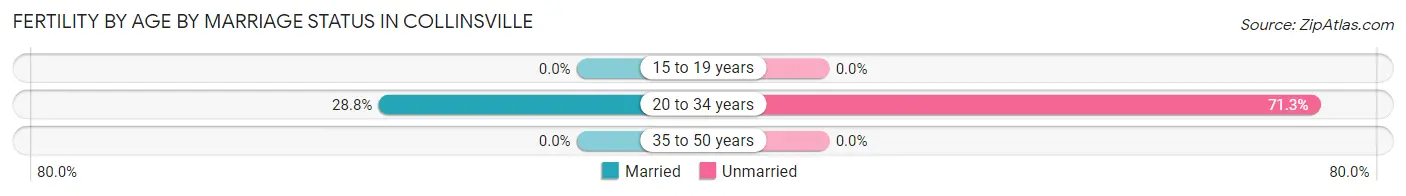
| Age Bracket | Married | Unmarried |
| 15 to 19 years | 0 (0.0%) | 0 (0.0%) |
| 20 to 34 years | 23 (28.7%) | 57 (71.3%) |
| 35 to 50 years | 0 (0.0%) | 0 (0.0%) |
| Total | 23 (28.7%) | 57 (71.3%) |
Fertility by Education in Collinsville
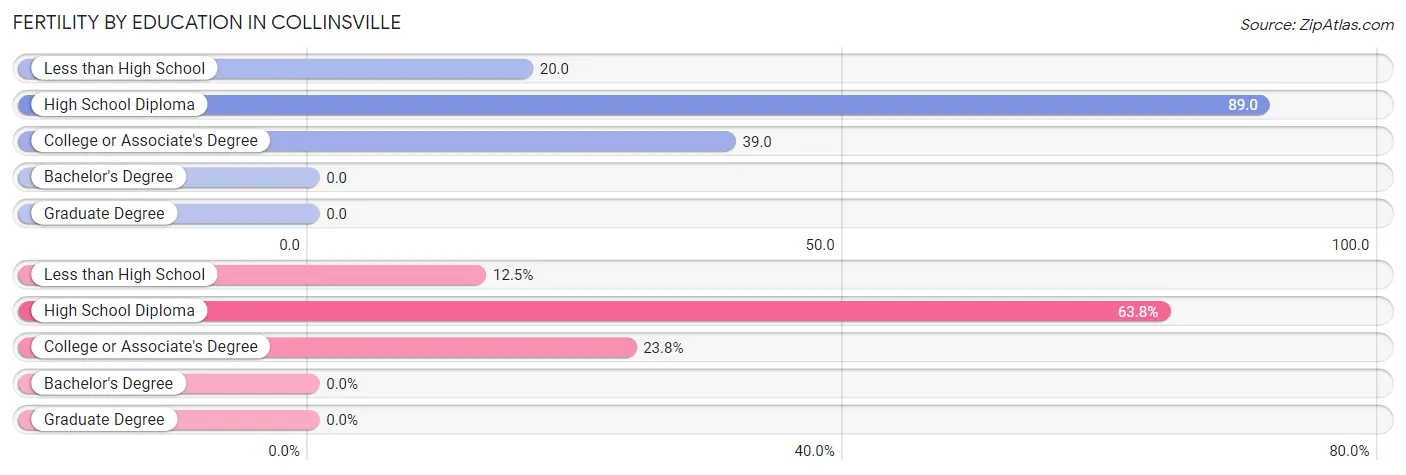
| Educational Attainment | Women with Births | Births / 1,000 Women |
| Less than High School | 10 (12.5%) | 20.0 |
| High School Diploma | 51 (63.7%) | 89.0 |
| College or Associate's Degree | 19 (23.7%) | 39.0 |
| Bachelor's Degree | 0 (0.0%) | 0.0 |
| Graduate Degree | 0 (0.0%) | 0.0 |
| Total | 80 (100.0%) | 42.0 |
Fertility by Education by Marriage Status in Collinsville
71.3% of women with births in Collinsville are unmarried. Women with the educational attainment of less than high school are most likely to be married with 100.0% of them married at childbirth, while women with the educational attainment of high school diploma are least likely to be married with 100.0% of them unmarried at childbirth.
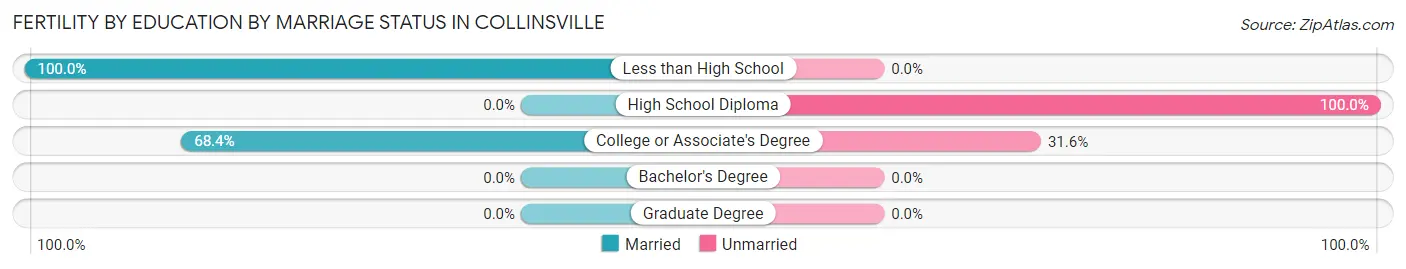
| Educational Attainment | Married | Unmarried |
| Less than High School | 10 (100.0%) | 0 (0.0%) |
| High School Diploma | 0 (0.0%) | 51 (100.0%) |
| College or Associate's Degree | 13 (68.4%) | 6 (31.6%) |
| Bachelor's Degree | 0 (0.0%) | 0 (0.0%) |
| Graduate Degree | 0 (0.0%) | 0 (0.0%) |
| Total | 23 (28.7%) | 57 (71.3%) |
Employment Characteristics in Collinsville
Employment by Class of Employer in Collinsville
Among the 3,346 employed individuals in Collinsville, private company employees (2,314 | 69.2%), not-for-profit organizations (391 | 11.7%), and local government employees (262 | 7.8%) make up the most common classes of employment.
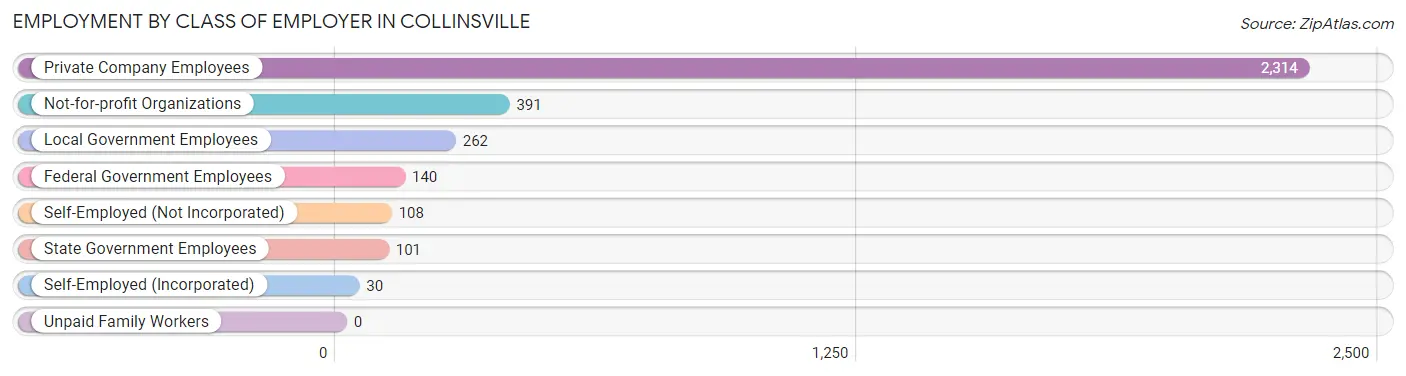
| Employer Class | # Employees | % Employees |
| Private Company Employees | 2,314 | 69.2% |
| Self-Employed (Incorporated) | 30 | 0.9% |
| Self-Employed (Not Incorporated) | 108 | 3.2% |
| Not-for-profit Organizations | 391 | 11.7% |
| Local Government Employees | 262 | 7.8% |
| State Government Employees | 101 | 3.0% |
| Federal Government Employees | 140 | 4.2% |
| Unpaid Family Workers | 0 | 0.0% |
| Total | 3,346 | 100.0% |
Employment Status by Age in Collinsville
According to the labor force statistics for Collinsville, out of the total population over 16 years of age (5,973), 62.3% or 3,721 individuals are in the labor force, with 6.8% or 253 of them unemployed. The age group with the highest labor force participation rate is 35 to 44 years, with 92.5% or 885 individuals in the labor force. Within the labor force, the 65 to 74 years age range has the highest percentage of unemployed individuals, with 12.6% or 15 of them being unemployed.
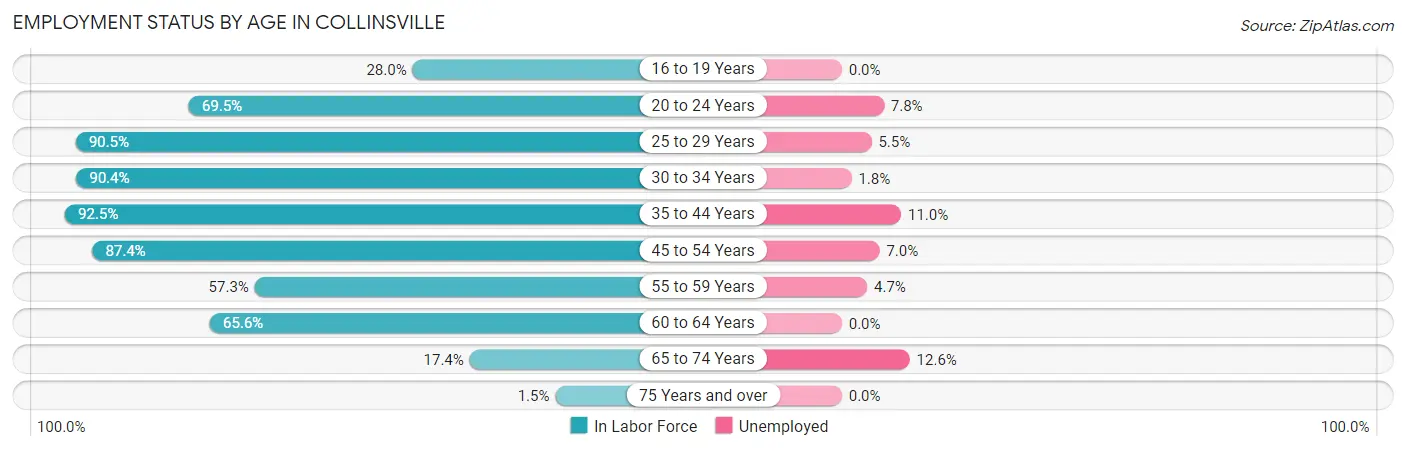
| Age Bracket | In Labor Force | Unemployed |
| 16 to 19 Years | 101 (28.0%) | 0 (0.0%) |
| 20 to 24 Years | 390 (69.5%) | 30 (7.8%) |
| 25 to 29 Years | 363 (90.5%) | 20 (5.5%) |
| 30 to 34 Years | 385 (90.4%) | 7 (1.8%) |
| 35 to 44 Years | 885 (92.5%) | 97 (11.0%) |
| 45 to 54 Years | 994 (87.4%) | 70 (7.0%) |
| 55 to 59 Years | 256 (57.3%) | 12 (4.7%) |
| 60 to 64 Years | 221 (65.6%) | 0 (0.0%) |
| 65 to 74 Years | 119 (17.4%) | 15 (12.6%) |
| 75 Years and over | 10 (1.5%) | 0 (0.0%) |
| Total | 3,721 (62.3%) | 253 (6.8%) |
Employment Status by Educational Attainment in Collinsville
According to labor force statistics for Collinsville, 83.8% of individuals (3,105) out of the total population between 25 and 64 years of age (3,705) are in the labor force, with 6.7% or 208 of them being unemployed. The group with the highest labor force participation rate are those with the educational attainment of bachelor's degree or higher, with 94.2% or 1,000 individuals in the labor force. Within the labor force, individuals with less than high school education have the highest percentage of unemployment, with 24.6% or 79 of them being unemployed.
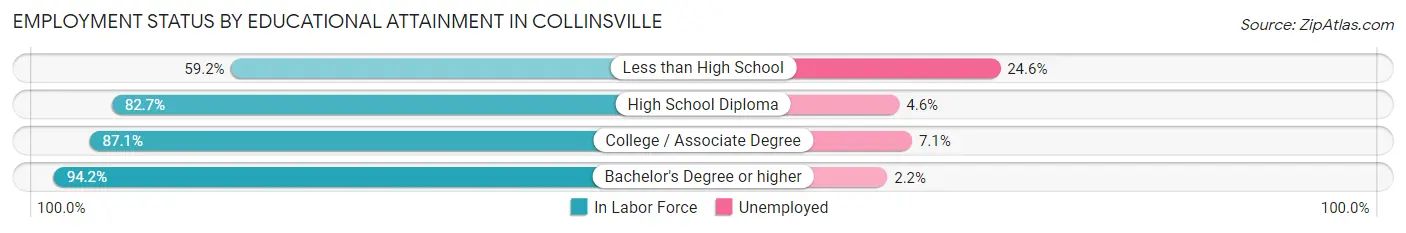
| Educational Attainment | In Labor Force | Unemployed |
| Less than High School | 321 (59.2%) | 133 (24.6%) |
| High School Diploma | 896 (82.7%) | 50 (4.6%) |
| College / Associate Degree | 886 (87.1%) | 72 (7.1%) |
| Bachelor's Degree or higher | 1,000 (94.2%) | 23 (2.2%) |
| Total | 3,105 (83.8%) | 248 (6.7%) |
Employment Occupations by Sex in Collinsville
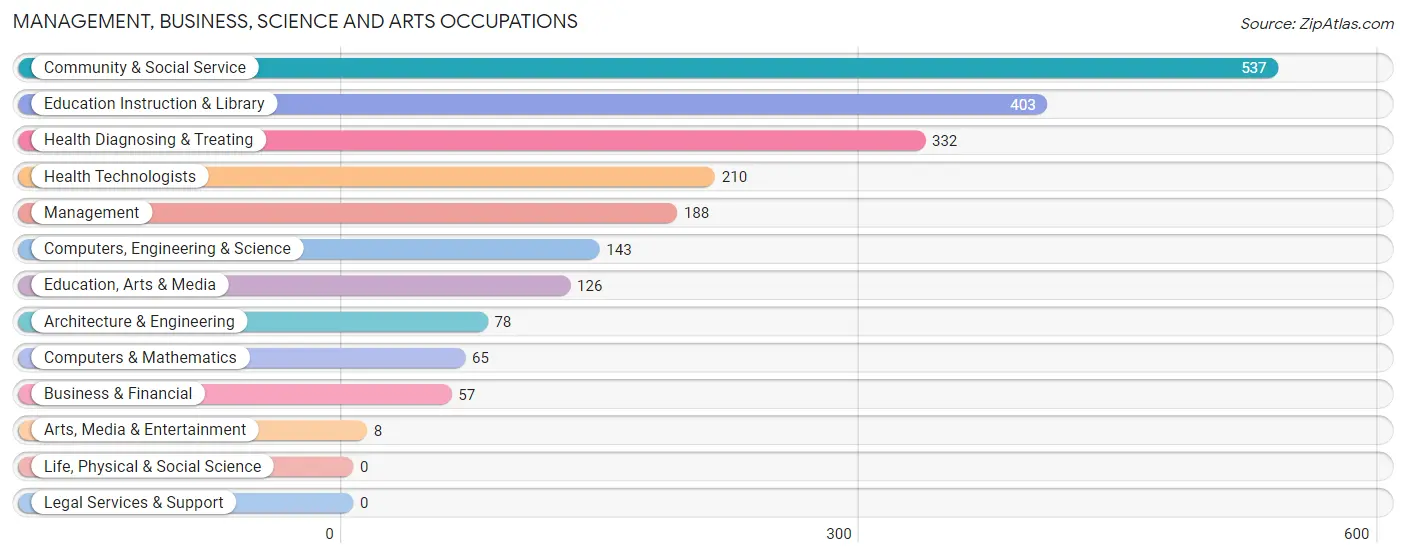
Management, Business, Science and Arts Occupations
The most common Management, Business, Science and Arts occupations in Collinsville are Community & Social Service (537 | 16.0%), Education Instruction & Library (403 | 12.0%), Health Diagnosing & Treating (332 | 9.9%), Health Technologists (210 | 6.3%), and Management (188 | 5.6%).
Management, Business, Science and Arts Occupations by Sex
Within the Management, Business, Science and Arts occupations in Collinsville, the most male-oriented occupations are Architecture & Engineering (100.0%), Education, Arts & Media (88.9%), and Computers, Engineering & Science (77.6%), while the most female-oriented occupations are Business & Financial (100.0%), Arts, Media & Entertainment (100.0%), and Health Technologists (100.0%).
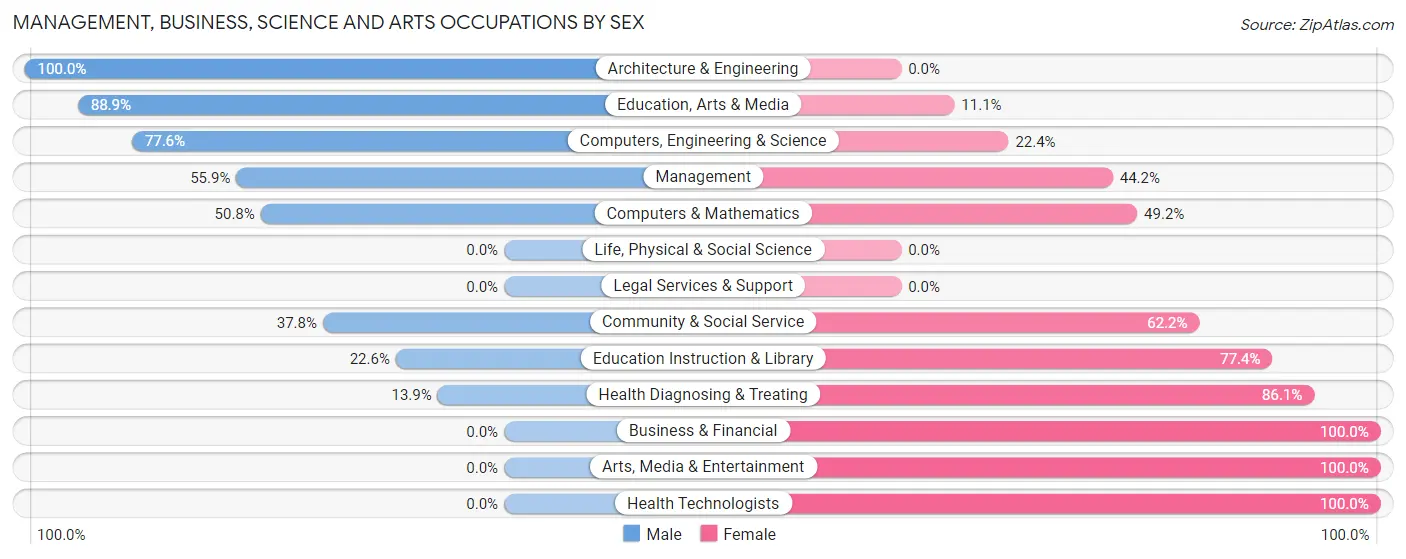
| Occupation | Male | Female |
| Management | 105 (55.8%) | 83 (44.2%) |
| Business & Financial | 0 (0.0%) | 57 (100.0%) |
| Computers, Engineering & Science | 111 (77.6%) | 32 (22.4%) |
| Computers & Mathematics | 33 (50.8%) | 32 (49.2%) |
| Architecture & Engineering | 78 (100.0%) | 0 (0.0%) |
| Life, Physical & Social Science | 0 (0.0%) | 0 (0.0%) |
| Community & Social Service | 203 (37.8%) | 334 (62.2%) |
| Education, Arts & Media | 112 (88.9%) | 14 (11.1%) |
| Legal Services & Support | 0 (0.0%) | 0 (0.0%) |
| Education Instruction & Library | 91 (22.6%) | 312 (77.4%) |
| Arts, Media & Entertainment | 0 (0.0%) | 8 (100.0%) |
| Health Diagnosing & Treating | 46 (13.9%) | 286 (86.1%) |
| Health Technologists | 0 (0.0%) | 210 (100.0%) |
| Total (Category) | 465 (37.0%) | 792 (63.0%) |
| Total (Overall) | 1,591 (47.5%) | 1,756 (52.5%) |
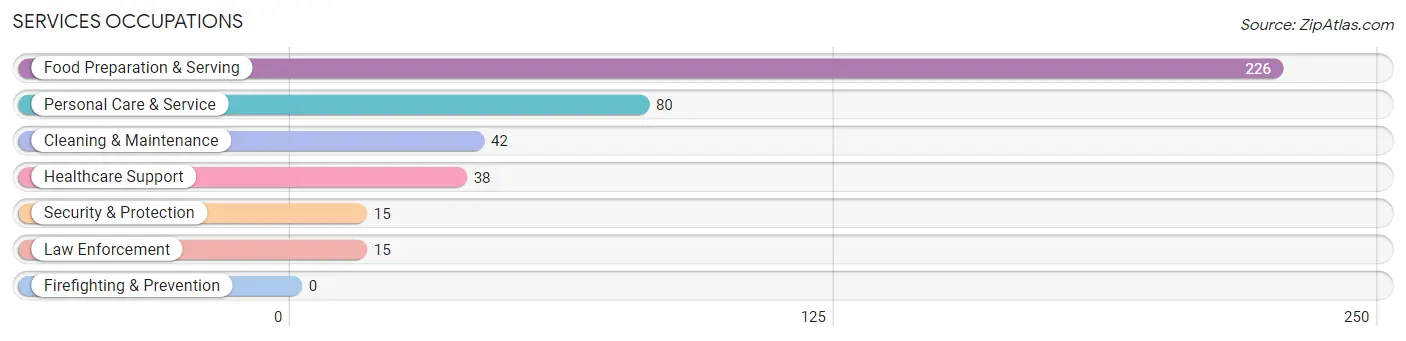
Services Occupations
The most common Services occupations in Collinsville are Food Preparation & Serving (226 | 6.8%), Personal Care & Service (80 | 2.4%), Cleaning & Maintenance (42 | 1.3%), Healthcare Support (38 | 1.1%), and Security & Protection (15 | 0.4%).
Services Occupations by Sex
Within the Services occupations in Collinsville, the most male-oriented occupations are Security & Protection (100.0%), Law Enforcement (100.0%), and Cleaning & Maintenance (76.2%), while the most female-oriented occupations are Healthcare Support (100.0%), Food Preparation & Serving (82.3%), and Personal Care & Service (68.8%).
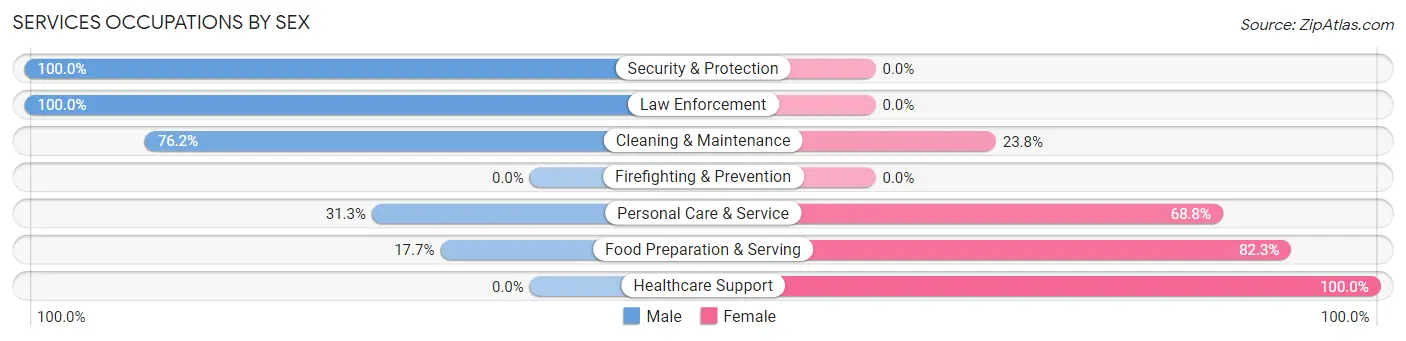
| Occupation | Male | Female |
| Healthcare Support | 0 (0.0%) | 38 (100.0%) |
| Security & Protection | 15 (100.0%) | 0 (0.0%) |
| Firefighting & Prevention | 0 (0.0%) | 0 (0.0%) |
| Law Enforcement | 15 (100.0%) | 0 (0.0%) |
| Food Preparation & Serving | 40 (17.7%) | 186 (82.3%) |
| Cleaning & Maintenance | 32 (76.2%) | 10 (23.8%) |
| Personal Care & Service | 25 (31.2%) | 55 (68.8%) |
| Total (Category) | 112 (27.9%) | 289 (72.1%) |
| Total (Overall) | 1,591 (47.5%) | 1,756 (52.5%) |
Sales and Office Occupations
The most common Sales and Office occupations in Collinsville are Office & Administration (460 | 13.7%), and Sales & Related (350 | 10.5%).
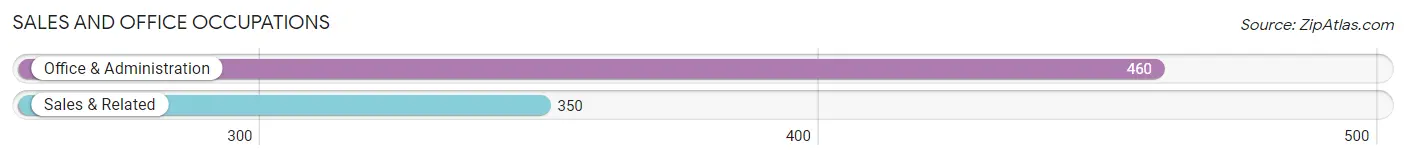
Sales and Office Occupations by Sex
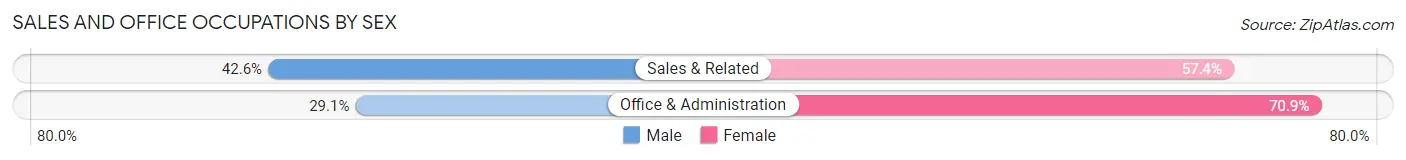
| Occupation | Male | Female |
| Sales & Related | 149 (42.6%) | 201 (57.4%) |
| Office & Administration | 134 (29.1%) | 326 (70.9%) |
| Total (Category) | 283 (34.9%) | 527 (65.1%) |
| Total (Overall) | 1,591 (47.5%) | 1,756 (52.5%) |
Natural Resources, Construction and Maintenance Occupations
The most common Natural Resources, Construction and Maintenance occupations in Collinsville are Construction & Extraction (175 | 5.2%), and Installation, Maintenance & Repair (113 | 3.4%).
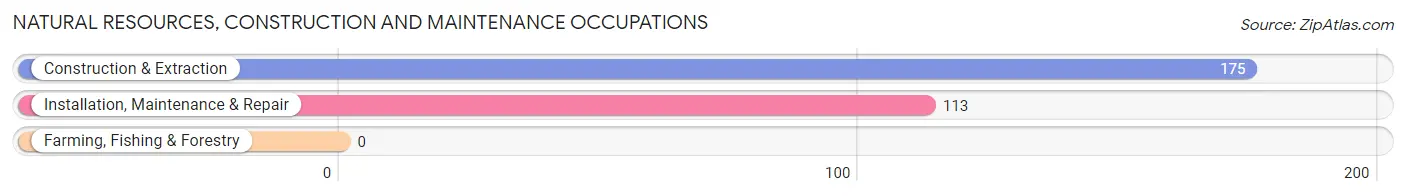
Natural Resources, Construction and Maintenance Occupations by Sex
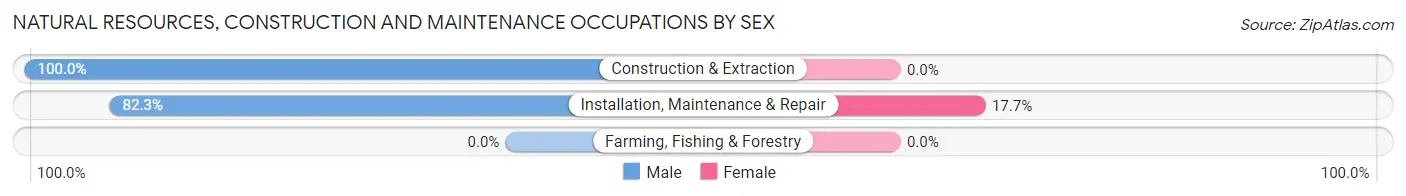
| Occupation | Male | Female |
| Farming, Fishing & Forestry | 0 (0.0%) | 0 (0.0%) |
| Construction & Extraction | 175 (100.0%) | 0 (0.0%) |
| Installation, Maintenance & Repair | 93 (82.3%) | 20 (17.7%) |
| Total (Category) | 268 (93.1%) | 20 (6.9%) |
| Total (Overall) | 1,591 (47.5%) | 1,756 (52.5%) |
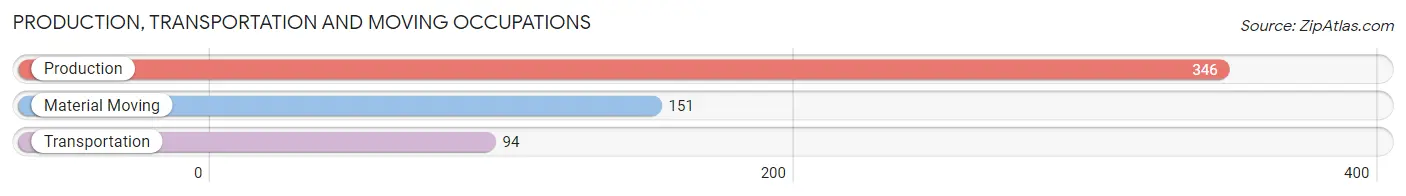
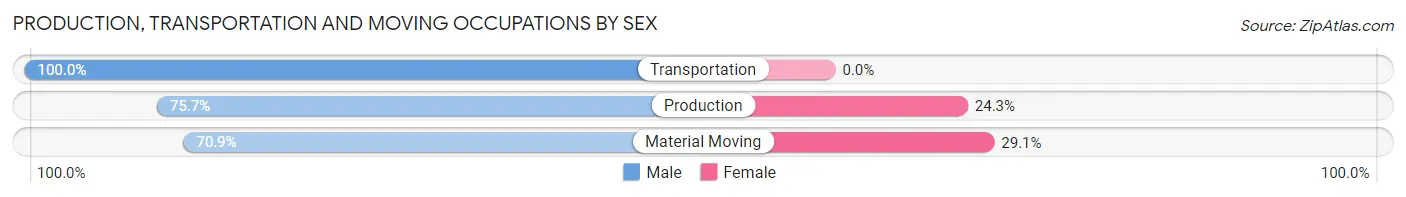
Production, Transportation and Moving Occupations
The most common Production, Transportation and Moving occupations in Collinsville are Production (346 | 10.3%), Material Moving (151 | 4.5%), and Transportation (94 | 2.8%).
Production, Transportation and Moving Occupations by Sex
| Occupation | Male | Female |
| Production | 262 (75.7%) | 84 (24.3%) |
| Transportation | 94 (100.0%) | 0 (0.0%) |
| Material Moving | 107 (70.9%) | 44 (29.1%) |
| Total (Category) | 463 (78.3%) | 128 (21.7%) |
| Total (Overall) | 1,591 (47.5%) | 1,756 (52.5%) |
Employment Industries by Sex in Collinsville
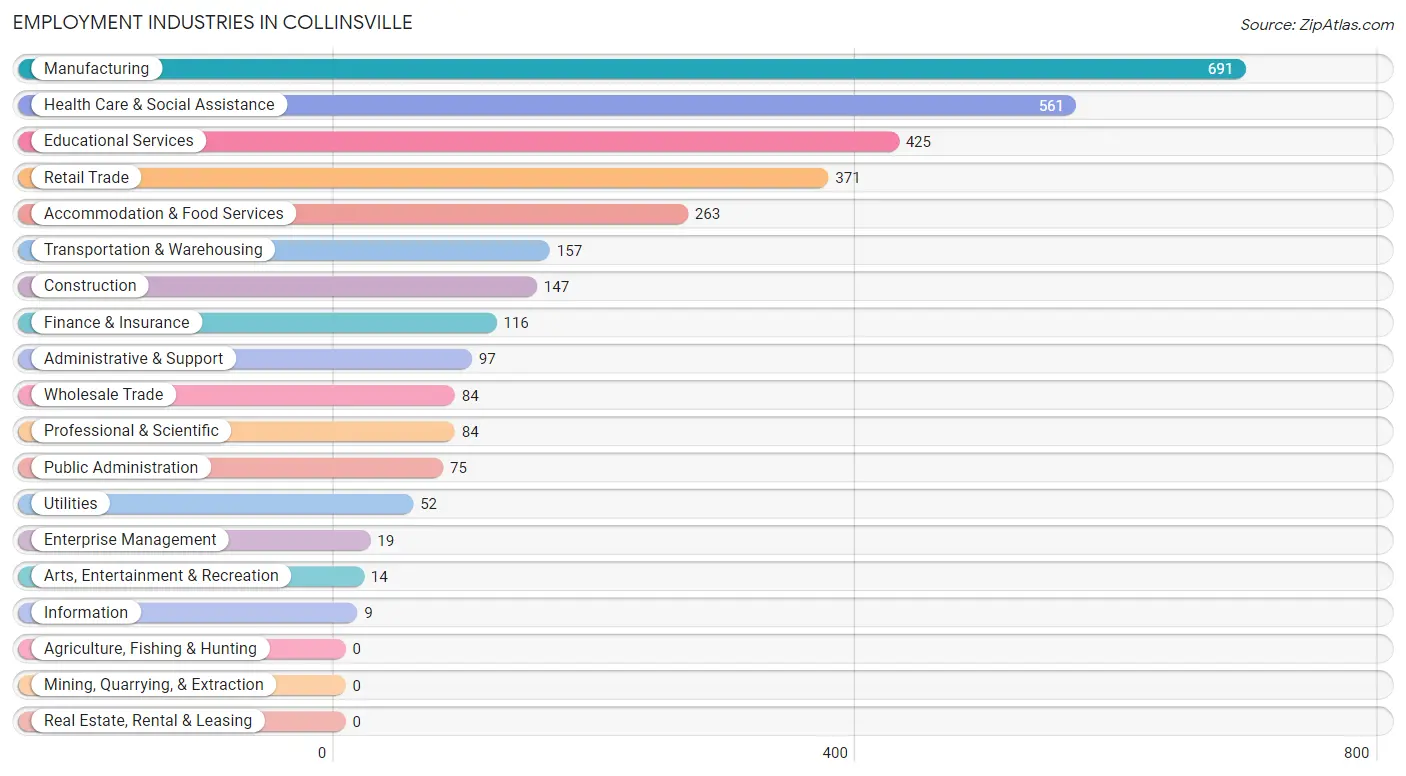
Employment Industries in Collinsville
The major employment industries in Collinsville include Manufacturing (691 | 20.6%), Health Care & Social Assistance (561 | 16.8%), Educational Services (425 | 12.7%), Retail Trade (371 | 11.1%), and Accommodation & Food Services (263 | 7.9%).
Employment Industries by Sex in Collinsville
The Collinsville industries that see more men than women are Construction (100.0%), Utilities (100.0%), and Manufacturing (73.8%), whereas the industries that tend to have a higher number of women are Information (100.0%), Enterprise Management (100.0%), and Arts, Entertainment & Recreation (100.0%).
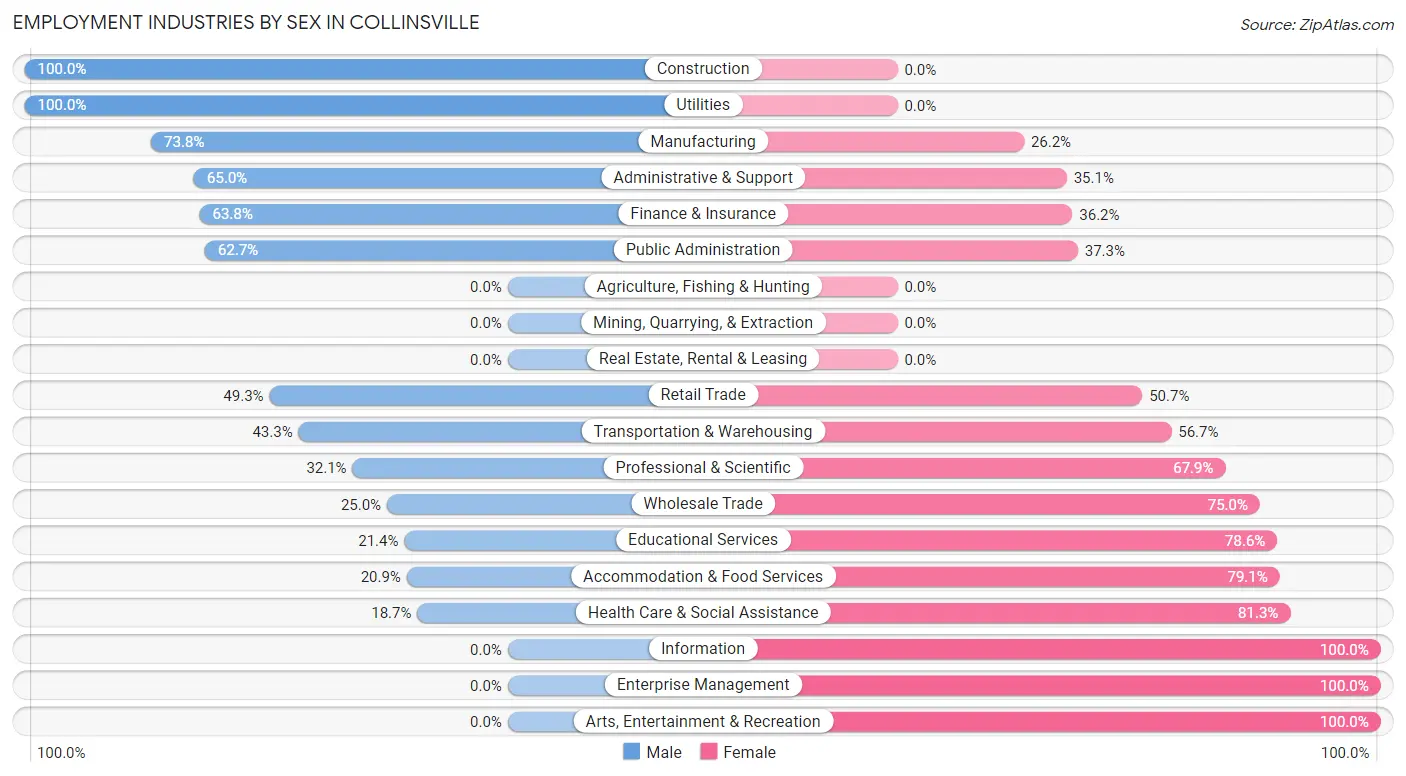
| Industry | Male | Female |
| Agriculture, Fishing & Hunting | 0 (0.0%) | 0 (0.0%) |
| Mining, Quarrying, & Extraction | 0 (0.0%) | 0 (0.0%) |
| Construction | 147 (100.0%) | 0 (0.0%) |
| Manufacturing | 510 (73.8%) | 181 (26.2%) |
| Wholesale Trade | 21 (25.0%) | 63 (75.0%) |
| Retail Trade | 183 (49.3%) | 188 (50.7%) |
| Transportation & Warehousing | 68 (43.3%) | 89 (56.7%) |
| Utilities | 52 (100.0%) | 0 (0.0%) |
| Information | 0 (0.0%) | 9 (100.0%) |
| Finance & Insurance | 74 (63.8%) | 42 (36.2%) |
| Real Estate, Rental & Leasing | 0 (0.0%) | 0 (0.0%) |
| Professional & Scientific | 27 (32.1%) | 57 (67.9%) |
| Enterprise Management | 0 (0.0%) | 19 (100.0%) |
| Administrative & Support | 63 (64.9%) | 34 (35.0%) |
| Educational Services | 91 (21.4%) | 334 (78.6%) |
| Health Care & Social Assistance | 105 (18.7%) | 456 (81.3%) |
| Arts, Entertainment & Recreation | 0 (0.0%) | 14 (100.0%) |
| Accommodation & Food Services | 55 (20.9%) | 208 (79.1%) |
| Public Administration | 47 (62.7%) | 28 (37.3%) |
| Total | 1,591 (47.5%) | 1,756 (52.5%) |
Education in Collinsville
School Enrollment in Collinsville
The most common levels of schooling among the 2,127 students in Collinsville are high school (611 | 28.7%), elementary school (496 | 23.3%), and college / undergraduate (435 | 20.4%).
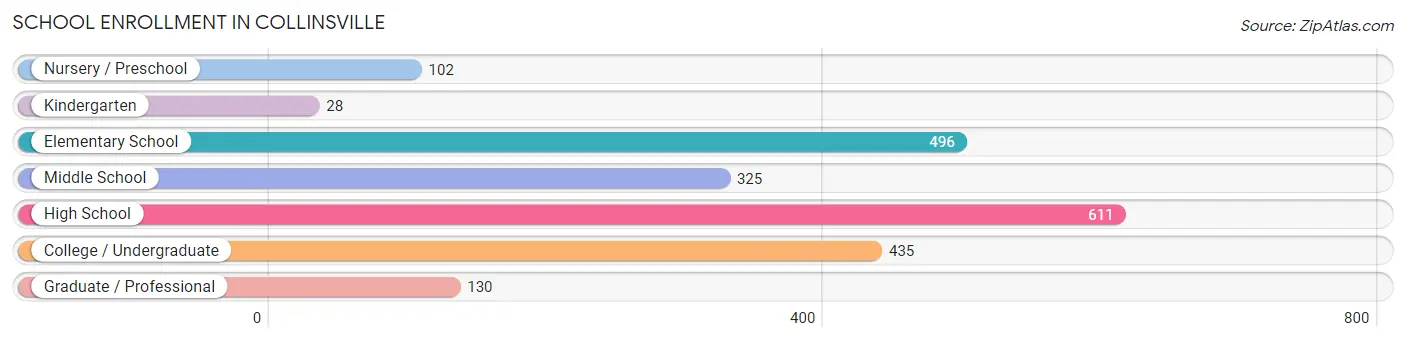
| School Level | # Students | % Students |
| Nursery / Preschool | 102 | 4.8% |
| Kindergarten | 28 | 1.3% |
| Elementary School | 496 | 23.3% |
| Middle School | 325 | 15.3% |
| High School | 611 | 28.7% |
| College / Undergraduate | 435 | 20.4% |
| Graduate / Professional | 130 | 6.1% |
| Total | 2,127 | 100.0% |
School Enrollment by Age by Funding Source in Collinsville
Out of a total of 2,127 students who are enrolled in schools in Collinsville, 347 (16.3%) attend a private institution, while the remaining 1,780 (83.7%) are enrolled in public schools. The age group of 20 to 24 year olds has the highest likelihood of being enrolled in private schools, with 70 (83.3% in the age bracket) enrolled. Conversely, the age group of 3 to 4 year olds has the lowest likelihood of being enrolled in a private school, with 86 (100.0% in the age bracket) attending a public institution.
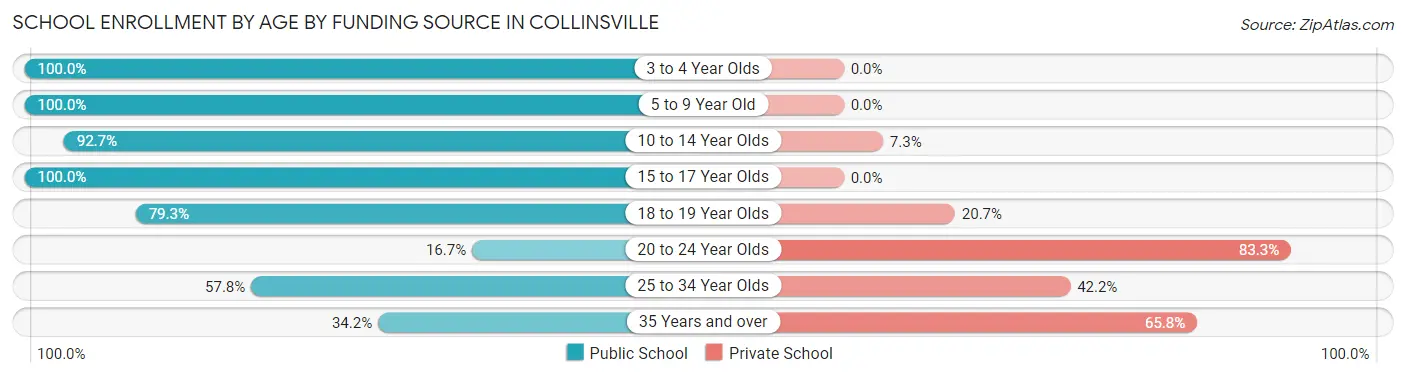
| Age Bracket | Public School | Private School |
| 3 to 4 Year Olds | 86 (100.0%) | 0 (0.0%) |
| 5 to 9 Year Old | 456 (100.0%) | 0 (0.0%) |
| 10 to 14 Year Olds | 482 (92.7%) | 38 (7.3%) |
| 15 to 17 Year Olds | 453 (100.0%) | 0 (0.0%) |
| 18 to 19 Year Olds | 111 (79.3%) | 29 (20.7%) |
| 20 to 24 Year Olds | 14 (16.7%) | 70 (83.3%) |
| 25 to 34 Year Olds | 111 (57.8%) | 81 (42.2%) |
| 35 Years and over | 67 (34.2%) | 129 (65.8%) |
| Total | 1,780 (83.7%) | 347 (16.3%) |
Educational Attainment by Field of Study in Collinsville
Education (324 | 22.6%), business (279 | 19.5%), science & technology (269 | 18.8%), arts & humanities (140 | 9.8%), and liberal arts & history (120 | 8.4%) are the most common fields of study among 1,432 individuals in Collinsville who have obtained a bachelor's degree or higher.
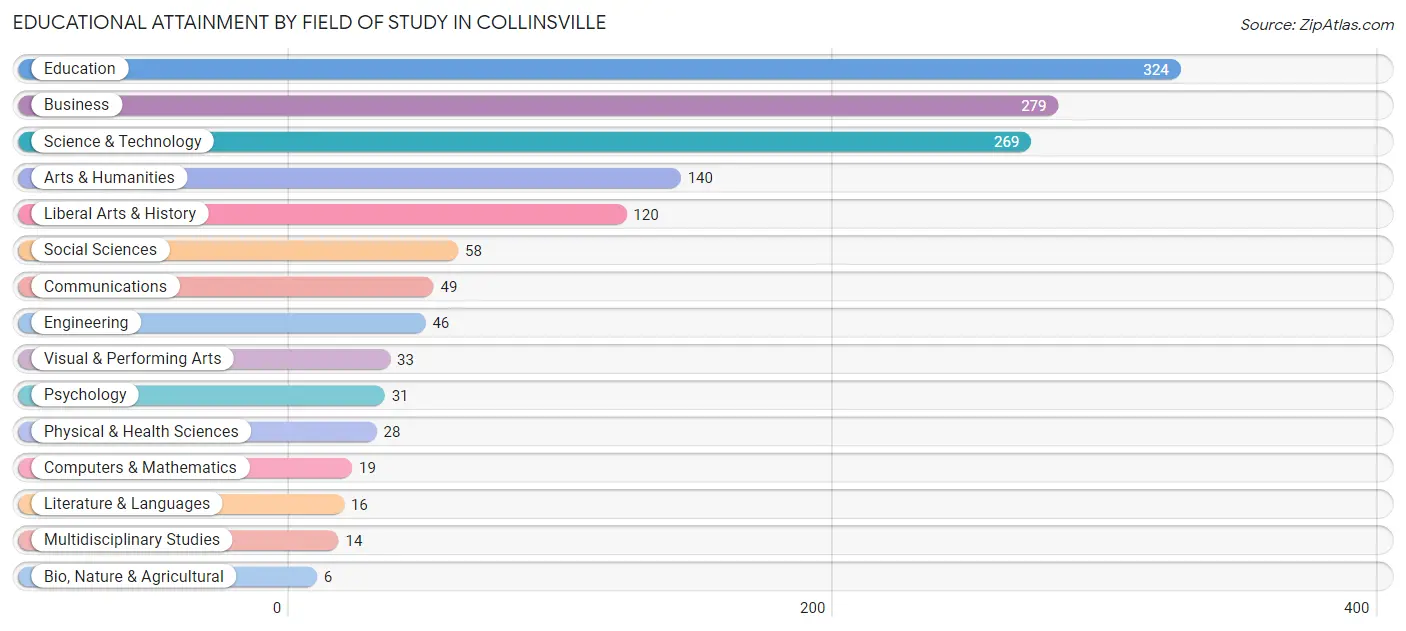
| Field of Study | # Graduates | % Graduates |
| Computers & Mathematics | 19 | 1.3% |
| Bio, Nature & Agricultural | 6 | 0.4% |
| Physical & Health Sciences | 28 | 2.0% |
| Psychology | 31 | 2.2% |
| Social Sciences | 58 | 4.1% |
| Engineering | 46 | 3.2% |
| Multidisciplinary Studies | 14 | 1.0% |
| Science & Technology | 269 | 18.8% |
| Business | 279 | 19.5% |
| Education | 324 | 22.6% |
| Literature & Languages | 16 | 1.1% |
| Liberal Arts & History | 120 | 8.4% |
| Visual & Performing Arts | 33 | 2.3% |
| Communications | 49 | 3.4% |
| Arts & Humanities | 140 | 9.8% |
| Total | 1,432 | 100.0% |
Transportation & Commute in Collinsville
Vehicle Availability by Sex in Collinsville
The most prevalent vehicle ownership categories in Collinsville are males with 3 vehicles (586, accounting for 37.5%) and females with 3 vehicles (657, making up 32.9%).
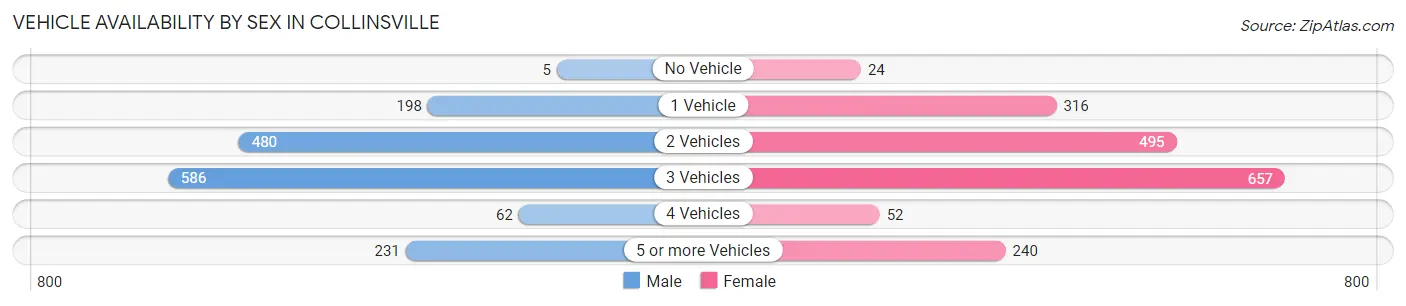
| Vehicles Available | Male | Female |
| No Vehicle | 5 (0.3%) | 24 (1.3%) |
| 1 Vehicle | 198 (12.7%) | 316 (17.7%) |
| 2 Vehicles | 480 (30.7%) | 495 (27.8%) |
| 3 Vehicles | 586 (37.5%) | 657 (36.8%) |
| 4 Vehicles | 62 (4.0%) | 52 (2.9%) |
| 5 or more Vehicles | 231 (14.8%) | 240 (13.5%) |
| Total | 1,562 (100.0%) | 1,784 (100.0%) |
Commute Time in Collinsville
The most frequently occuring commute durations in Collinsville are 15 to 19 minutes (1,033 commuters, 31.7%), 10 to 14 minutes (610 commuters, 18.7%), and 5 to 9 minutes (426 commuters, 13.1%).
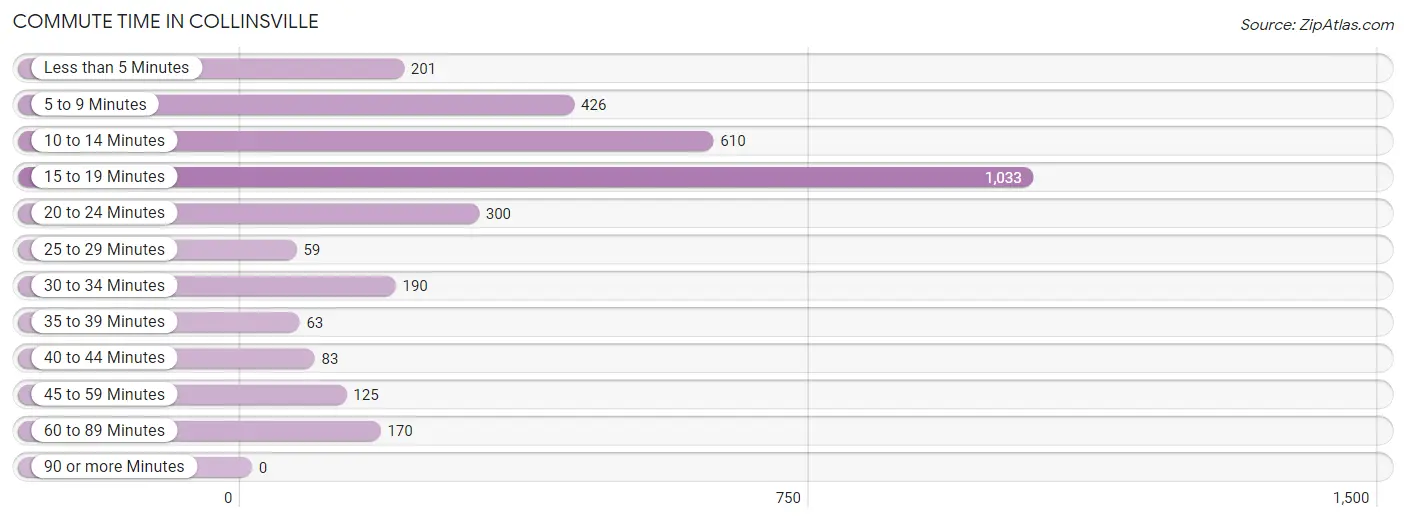
| Commute Time | # Commuters | % Commuters |
| Less than 5 Minutes | 201 | 6.2% |
| 5 to 9 Minutes | 426 | 13.1% |
| 10 to 14 Minutes | 610 | 18.7% |
| 15 to 19 Minutes | 1,033 | 31.7% |
| 20 to 24 Minutes | 300 | 9.2% |
| 25 to 29 Minutes | 59 | 1.8% |
| 30 to 34 Minutes | 190 | 5.8% |
| 35 to 39 Minutes | 63 | 1.9% |
| 40 to 44 Minutes | 83 | 2.5% |
| 45 to 59 Minutes | 125 | 3.8% |
| 60 to 89 Minutes | 170 | 5.2% |
| 90 or more Minutes | 0 | 0.0% |
Commute Time by Sex in Collinsville
The most common commute times in Collinsville are 15 to 19 minutes (324 commuters, 21.6%) for males and 15 to 19 minutes (709 commuters, 40.3%) for females.
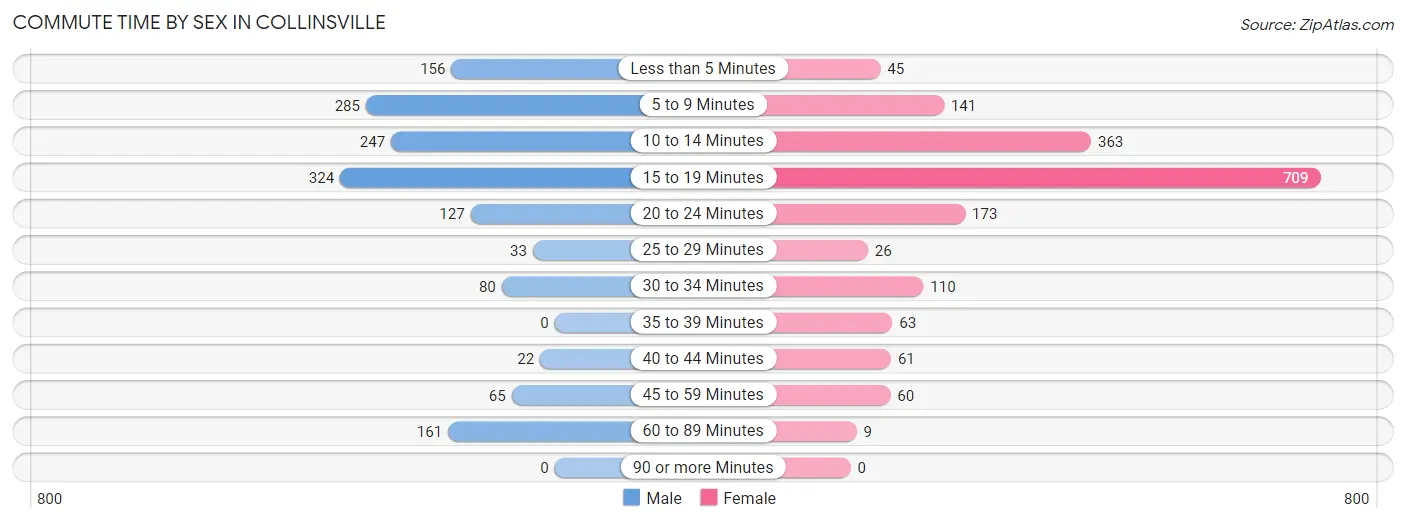
| Commute Time | Male | Female |
| Less than 5 Minutes | 156 (10.4%) | 45 (2.6%) |
| 5 to 9 Minutes | 285 (19.0%) | 141 (8.0%) |
| 10 to 14 Minutes | 247 (16.5%) | 363 (20.6%) |
| 15 to 19 Minutes | 324 (21.6%) | 709 (40.3%) |
| 20 to 24 Minutes | 127 (8.5%) | 173 (9.8%) |
| 25 to 29 Minutes | 33 (2.2%) | 26 (1.5%) |
| 30 to 34 Minutes | 80 (5.3%) | 110 (6.2%) |
| 35 to 39 Minutes | 0 (0.0%) | 63 (3.6%) |
| 40 to 44 Minutes | 22 (1.5%) | 61 (3.5%) |
| 45 to 59 Minutes | 65 (4.3%) | 60 (3.4%) |
| 60 to 89 Minutes | 161 (10.7%) | 9 (0.5%) |
| 90 or more Minutes | 0 (0.0%) | 0 (0.0%) |
Time of Departure to Work by Sex in Collinsville
The most frequent times of departure to work in Collinsville are 7:30 AM to 7:59 AM (284, 18.9%) for males and 6:30 AM to 6:59 AM (428, 24.3%) for females.
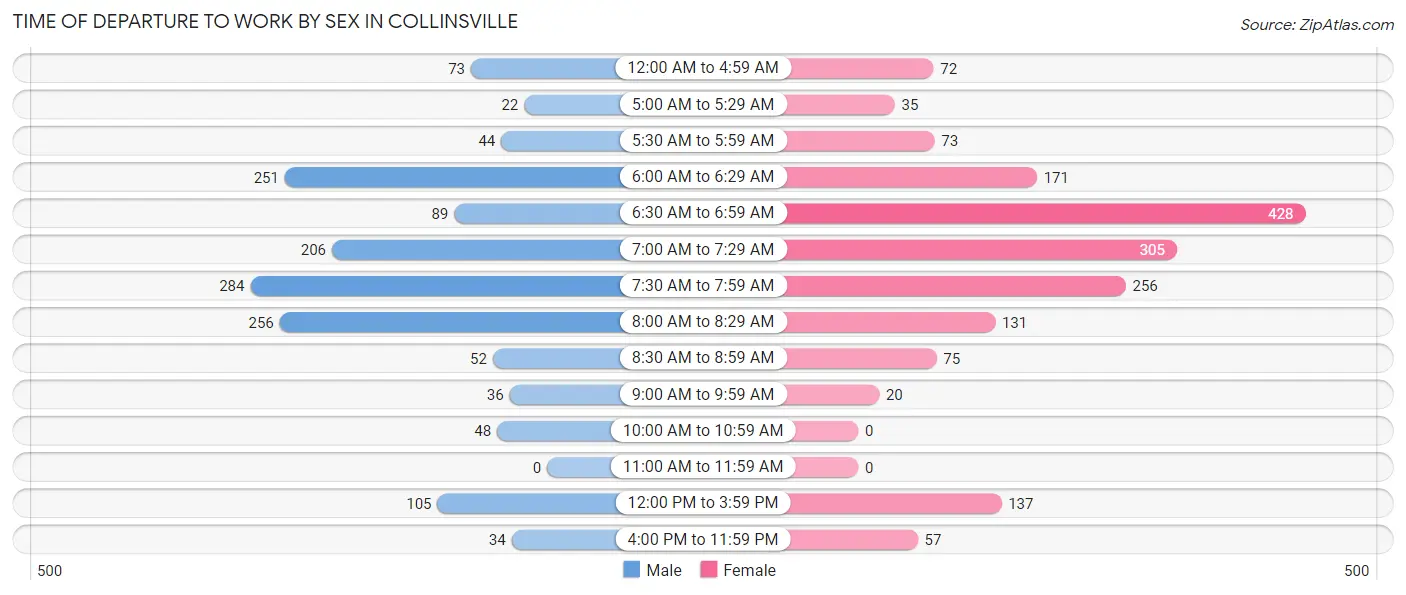
| Time of Departure | Male | Female |
| 12:00 AM to 4:59 AM | 73 (4.9%) | 72 (4.1%) |
| 5:00 AM to 5:29 AM | 22 (1.5%) | 35 (2.0%) |
| 5:30 AM to 5:59 AM | 44 (2.9%) | 73 (4.2%) |
| 6:00 AM to 6:29 AM | 251 (16.7%) | 171 (9.7%) |
| 6:30 AM to 6:59 AM | 89 (5.9%) | 428 (24.3%) |
| 7:00 AM to 7:29 AM | 206 (13.7%) | 305 (17.3%) |
| 7:30 AM to 7:59 AM | 284 (18.9%) | 256 (14.5%) |
| 8:00 AM to 8:29 AM | 256 (17.1%) | 131 (7.4%) |
| 8:30 AM to 8:59 AM | 52 (3.5%) | 75 (4.3%) |
| 9:00 AM to 9:59 AM | 36 (2.4%) | 20 (1.1%) |
| 10:00 AM to 10:59 AM | 48 (3.2%) | 0 (0.0%) |
| 11:00 AM to 11:59 AM | 0 (0.0%) | 0 (0.0%) |
| 12:00 PM to 3:59 PM | 105 (7.0%) | 137 (7.8%) |
| 4:00 PM to 11:59 PM | 34 (2.3%) | 57 (3.2%) |
| Total | 1,500 (100.0%) | 1,760 (100.0%) |
Housing Occupancy in Collinsville
Occupancy by Ownership in Collinsville
Of the total 3,079 dwellings in Collinsville, owner-occupied units account for 1,732 (56.2%), while renter-occupied units make up 1,347 (43.8%).
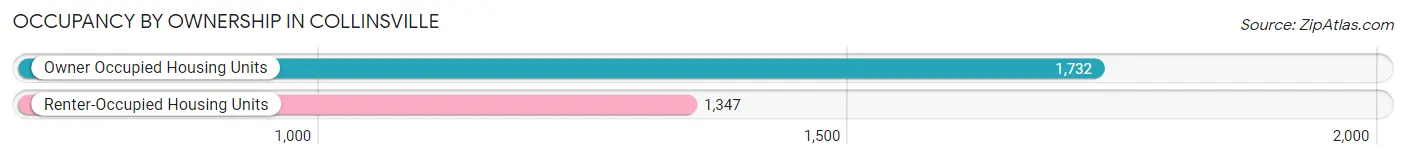
| Occupancy | # Housing Units | % Housing Units |
| Owner Occupied Housing Units | 1,732 | 56.2% |
| Renter-Occupied Housing Units | 1,347 | 43.8% |
| Total Occupied Housing Units | 3,079 | 100.0% |
Occupancy by Household Size in Collinsville
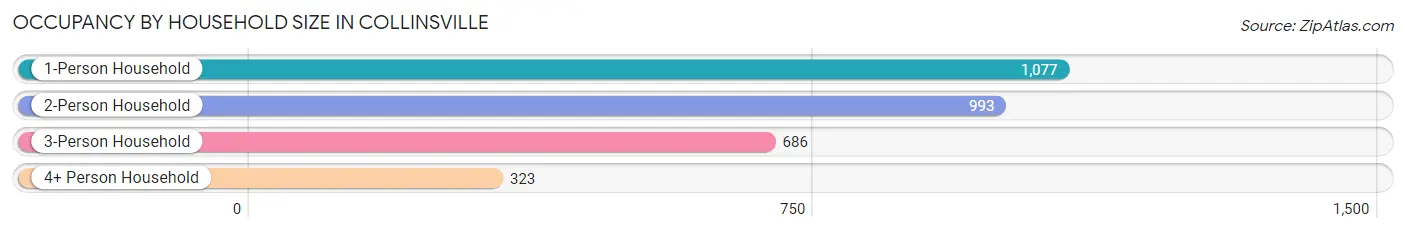
| Household Size | # Housing Units | % Housing Units |
| 1-Person Household | 1,077 | 35.0% |
| 2-Person Household | 993 | 32.3% |
| 3-Person Household | 686 | 22.3% |
| 4+ Person Household | 323 | 10.5% |
| Total Housing Units | 3,079 | 100.0% |
Occupancy by Ownership by Household Size in Collinsville
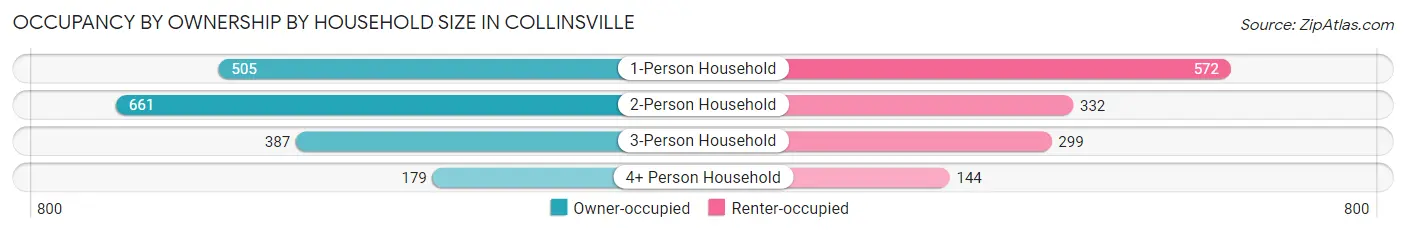
| Household Size | Owner-occupied | Renter-occupied |
| 1-Person Household | 505 (46.9%) | 572 (53.1%) |
| 2-Person Household | 661 (66.6%) | 332 (33.4%) |
| 3-Person Household | 387 (56.4%) | 299 (43.6%) |
| 4+ Person Household | 179 (55.4%) | 144 (44.6%) |
| Total Housing Units | 1,732 (56.2%) | 1,347 (43.8%) |
Occupancy by Educational Attainment in Collinsville
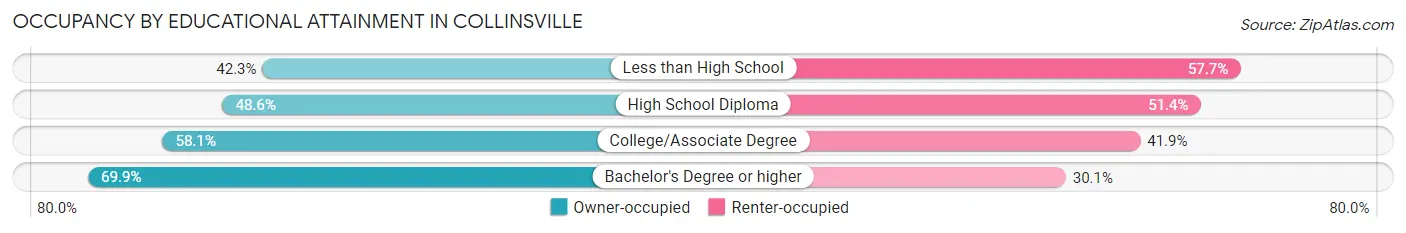
| Household Size | Owner-occupied | Renter-occupied |
| Less than High School | 214 (42.3%) | 292 (57.7%) |
| High School Diploma | 433 (48.6%) | 458 (51.4%) |
| College/Associate Degree | 448 (58.1%) | 323 (41.9%) |
| Bachelor's Degree or higher | 637 (69.9%) | 274 (30.1%) |
Occupancy by Age of Householder in Collinsville
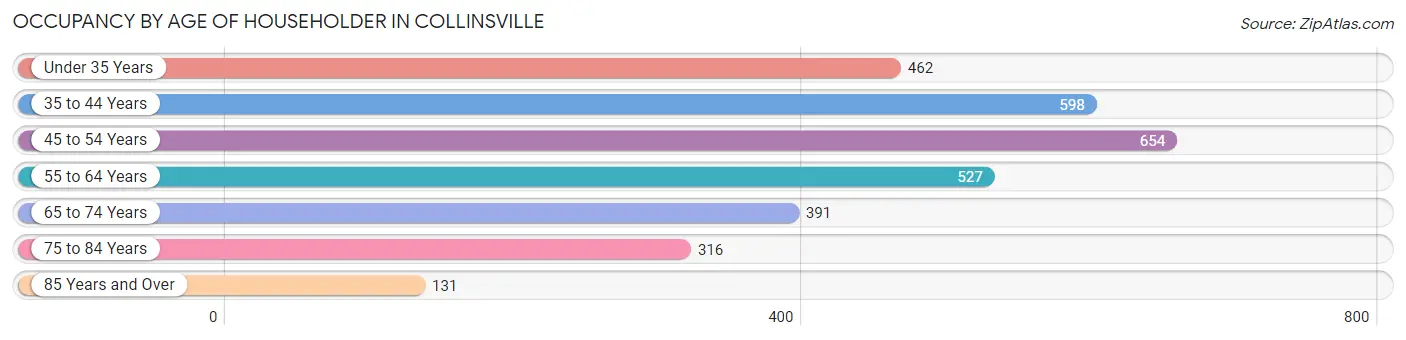
| Age Bracket | # Households | % Households |
| Under 35 Years | 462 | 15.0% |
| 35 to 44 Years | 598 | 19.4% |
| 45 to 54 Years | 654 | 21.2% |
| 55 to 64 Years | 527 | 17.1% |
| 65 to 74 Years | 391 | 12.7% |
| 75 to 84 Years | 316 | 10.3% |
| 85 Years and Over | 131 | 4.3% |
| Total | 3,079 | 100.0% |
Housing Finances in Collinsville
Median Income by Occupancy in Collinsville
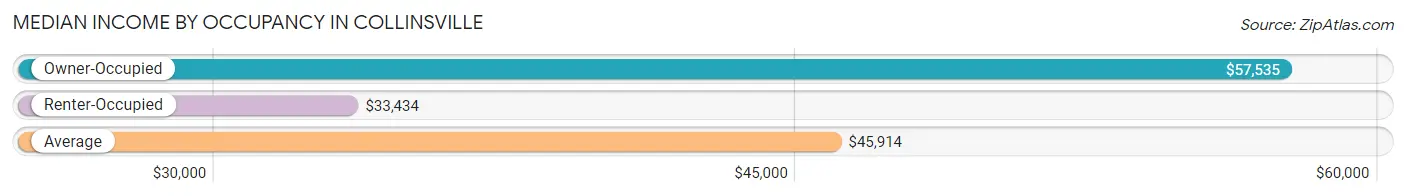
| Occupancy Type | # Households | Median Income |
| Owner-Occupied | 1,732 (56.2%) | $57,535 |
| Renter-Occupied | 1,347 (43.8%) | $33,434 |
| Average | 3,079 (100.0%) | $45,914 |
Occupancy by Householder Income Bracket in Collinsville
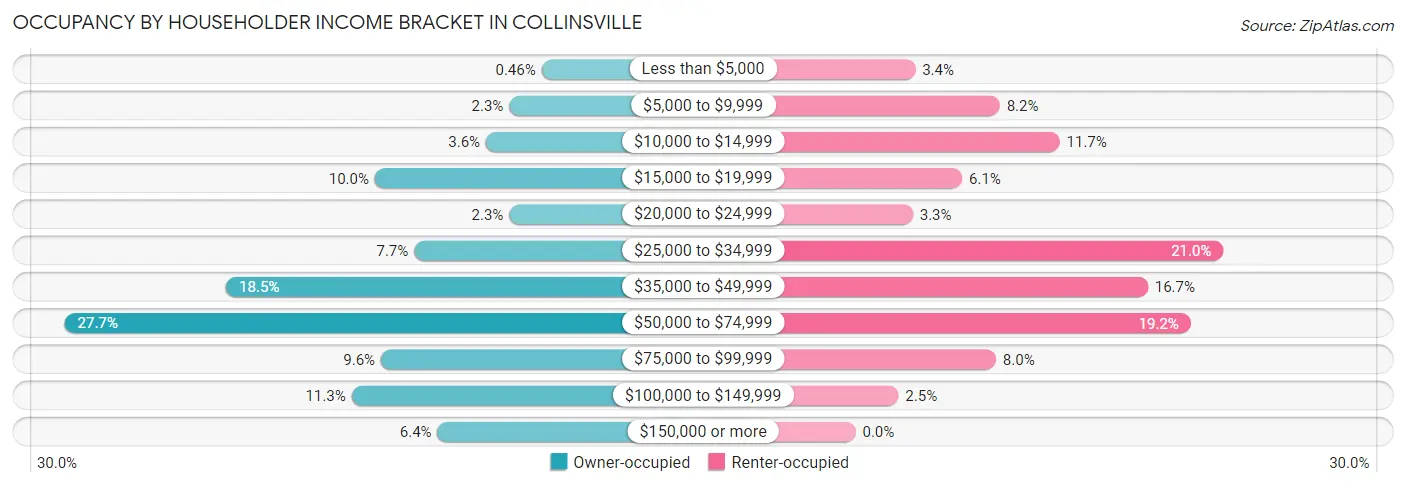
| Income Bracket | Owner-occupied | Renter-occupied |
| Less than $5,000 | 8 (0.5%) | 46 (3.4%) |
| $5,000 to $9,999 | 40 (2.3%) | 111 (8.2%) |
| $10,000 to $14,999 | 63 (3.6%) | 157 (11.7%) |
| $15,000 to $19,999 | 173 (10.0%) | 82 (6.1%) |
| $20,000 to $24,999 | 40 (2.3%) | 44 (3.3%) |
| $25,000 to $34,999 | 134 (7.7%) | 283 (21.0%) |
| $35,000 to $49,999 | 320 (18.5%) | 225 (16.7%) |
| $50,000 to $74,999 | 480 (27.7%) | 258 (19.2%) |
| $75,000 to $99,999 | 167 (9.6%) | 108 (8.0%) |
| $100,000 to $149,999 | 196 (11.3%) | 33 (2.5%) |
| $150,000 or more | 111 (6.4%) | 0 (0.0%) |
| Total | 1,732 (100.0%) | 1,347 (100.0%) |
Monthly Housing Cost Tiers in Collinsville
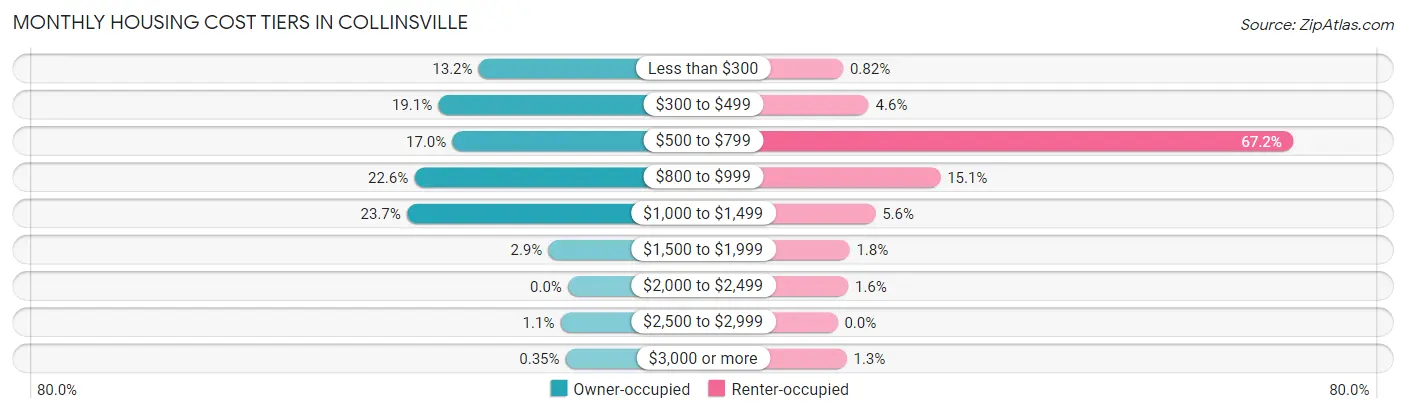
| Monthly Cost | Owner-occupied | Renter-occupied |
| Less than $300 | 228 (13.2%) | 11 (0.8%) |
| $300 to $499 | 331 (19.1%) | 62 (4.6%) |
| $500 to $799 | 295 (17.0%) | 905 (67.2%) |
| $800 to $999 | 392 (22.6%) | 204 (15.1%) |
| $1,000 to $1,499 | 411 (23.7%) | 75 (5.6%) |
| $1,500 to $1,999 | 50 (2.9%) | 24 (1.8%) |
| $2,000 to $2,499 | 0 (0.0%) | 21 (1.6%) |
| $2,500 to $2,999 | 19 (1.1%) | 0 (0.0%) |
| $3,000 or more | 6 (0.4%) | 18 (1.3%) |
| Total | 1,732 (100.0%) | 1,347 (100.0%) |
Physical Housing Characteristics in Collinsville
Housing Structures in Collinsville
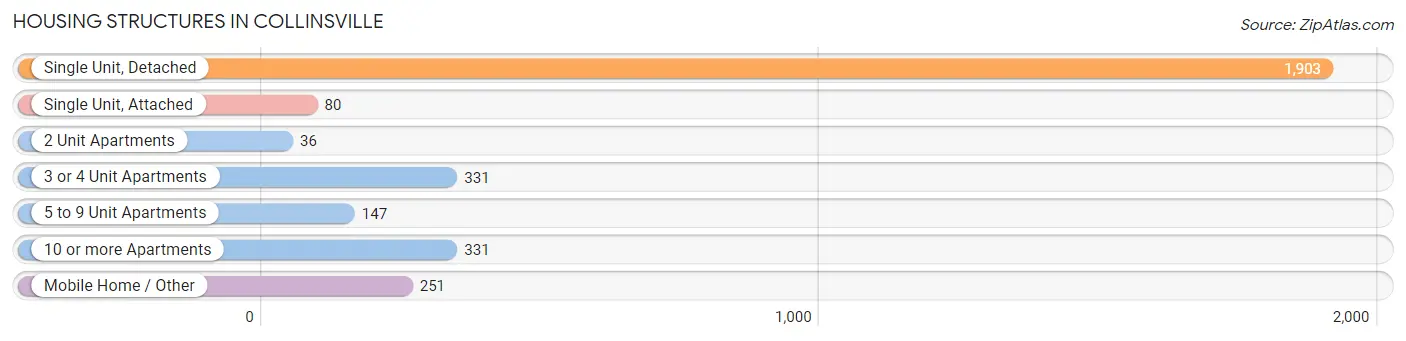
| Structure Type | # Housing Units | % Housing Units |
| Single Unit, Detached | 1,903 | 61.8% |
| Single Unit, Attached | 80 | 2.6% |
| 2 Unit Apartments | 36 | 1.2% |
| 3 or 4 Unit Apartments | 331 | 10.7% |
| 5 to 9 Unit Apartments | 147 | 4.8% |
| 10 or more Apartments | 331 | 10.7% |
| Mobile Home / Other | 251 | 8.2% |
| Total | 3,079 | 100.0% |
Housing Structures by Occupancy in Collinsville
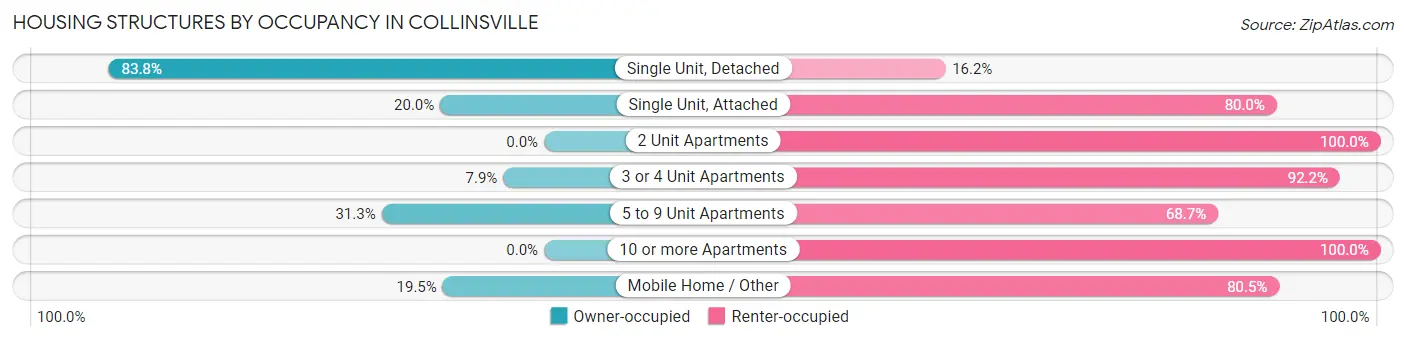
| Structure Type | Owner-occupied | Renter-occupied |
| Single Unit, Detached | 1,595 (83.8%) | 308 (16.2%) |
| Single Unit, Attached | 16 (20.0%) | 64 (80.0%) |
| 2 Unit Apartments | 0 (0.0%) | 36 (100.0%) |
| 3 or 4 Unit Apartments | 26 (7.9%) | 305 (92.1%) |
| 5 to 9 Unit Apartments | 46 (31.3%) | 101 (68.7%) |
| 10 or more Apartments | 0 (0.0%) | 331 (100.0%) |
| Mobile Home / Other | 49 (19.5%) | 202 (80.5%) |
| Total | 1,732 (56.2%) | 1,347 (43.8%) |
Housing Structures by Number of Rooms in Collinsville
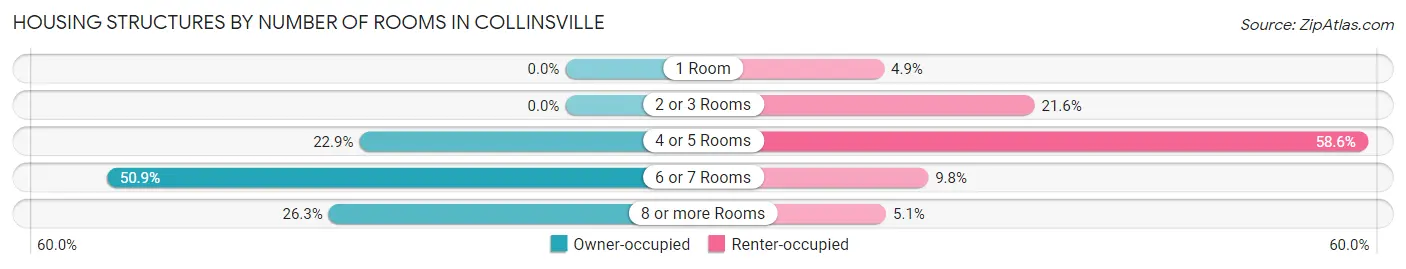
| Number of Rooms | Owner-occupied | Renter-occupied |
| 1 Room | 0 (0.0%) | 66 (4.9%) |
| 2 or 3 Rooms | 0 (0.0%) | 291 (21.6%) |
| 4 or 5 Rooms | 396 (22.9%) | 789 (58.6%) |
| 6 or 7 Rooms | 881 (50.9%) | 132 (9.8%) |
| 8 or more Rooms | 455 (26.3%) | 69 (5.1%) |
| Total | 1,732 (100.0%) | 1,347 (100.0%) |
Housing Structure by Heating Type in Collinsville
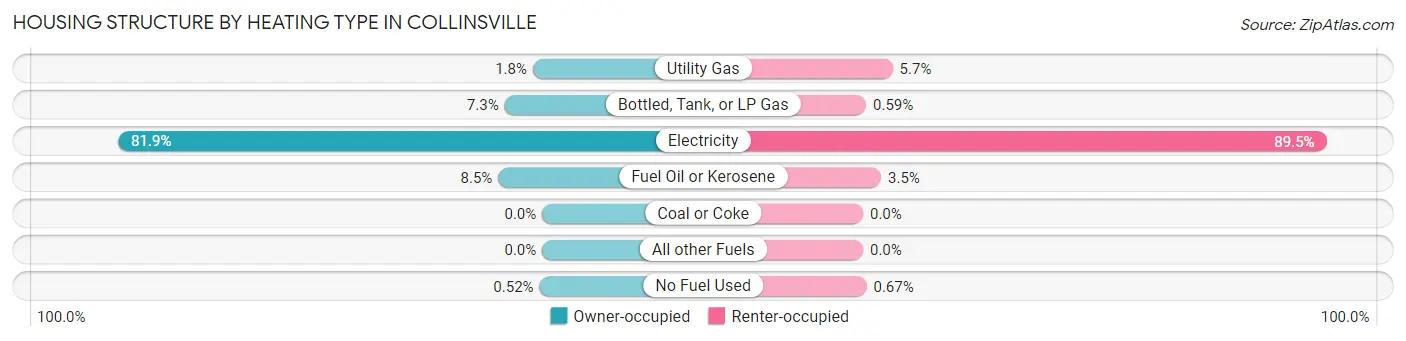
| Heating Type | Owner-occupied | Renter-occupied |
| Utility Gas | 31 (1.8%) | 77 (5.7%) |
| Bottled, Tank, or LP Gas | 126 (7.3%) | 8 (0.6%) |
| Electricity | 1,419 (81.9%) | 1,206 (89.5%) |
| Fuel Oil or Kerosene | 147 (8.5%) | 47 (3.5%) |
| Coal or Coke | 0 (0.0%) | 0 (0.0%) |
| All other Fuels | 0 (0.0%) | 0 (0.0%) |
| No Fuel Used | 9 (0.5%) | 9 (0.7%) |
| Total | 1,732 (100.0%) | 1,347 (100.0%) |
Household Vehicle Usage in Collinsville
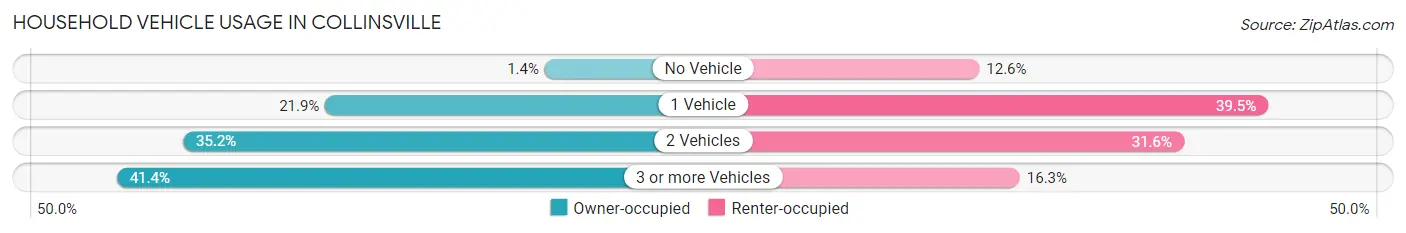
| Vehicles per Household | Owner-occupied | Renter-occupied |
| No Vehicle | 25 (1.4%) | 169 (12.6%) |
| 1 Vehicle | 380 (21.9%) | 532 (39.5%) |
| 2 Vehicles | 610 (35.2%) | 426 (31.6%) |
| 3 or more Vehicles | 717 (41.4%) | 220 (16.3%) |
| Total | 1,732 (100.0%) | 1,347 (100.0%) |
Real Estate & Mortgages in Collinsville
Real Estate and Mortgage Overview in Collinsville
| Characteristic | Without Mortgage | With Mortgage |
| Housing Units | 741 | 991 |
| Median Property Value | $99,000 | $150,400 |
| Median Household Income | $33,708 | $37 |
| Monthly Housing Costs | $347 | $6 |
| Real Estate Taxes | $587 | $55 |
Property Value by Mortgage Status in Collinsville
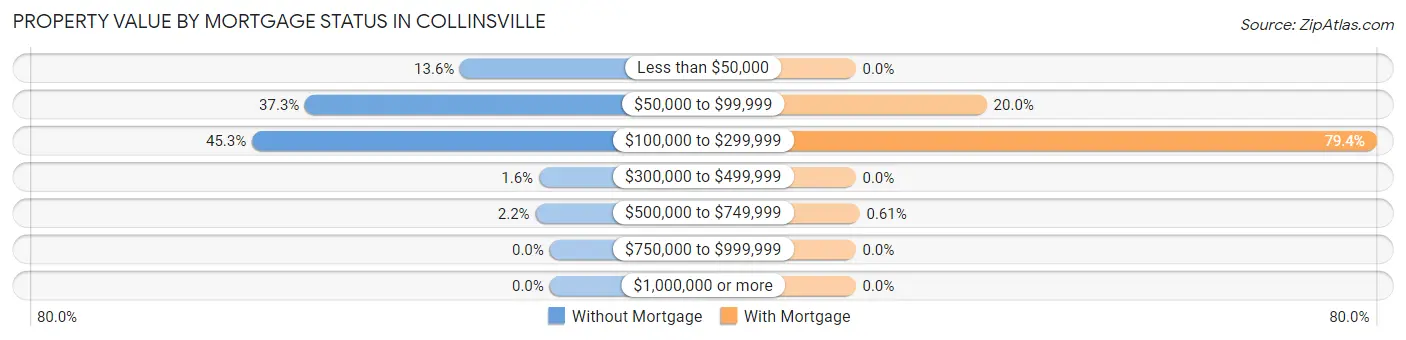
| Property Value | Without Mortgage | With Mortgage |
| Less than $50,000 | 101 (13.6%) | 0 (0.0%) |
| $50,000 to $99,999 | 276 (37.2%) | 198 (20.0%) |
| $100,000 to $299,999 | 336 (45.3%) | 787 (79.4%) |
| $300,000 to $499,999 | 12 (1.6%) | 0 (0.0%) |
| $500,000 to $749,999 | 16 (2.2%) | 6 (0.6%) |
| $750,000 to $999,999 | 0 (0.0%) | 0 (0.0%) |
| $1,000,000 or more | 0 (0.0%) | 0 (0.0%) |
| Total | 741 (100.0%) | 991 (100.0%) |
Household Income by Mortgage Status in Collinsville
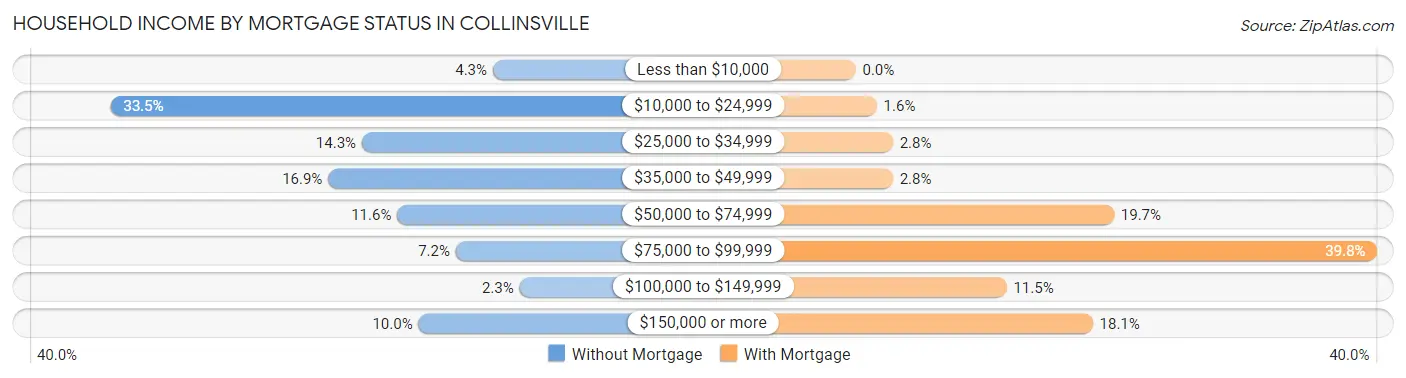
| Household Income | Without Mortgage | With Mortgage |
| Less than $10,000 | 32 (4.3%) | 0 (0.0%) |
| $10,000 to $24,999 | 248 (33.5%) | 16 (1.6%) |
| $25,000 to $34,999 | 106 (14.3%) | 28 (2.8%) |
| $35,000 to $49,999 | 125 (16.9%) | 28 (2.8%) |
| $50,000 to $74,999 | 86 (11.6%) | 195 (19.7%) |
| $75,000 to $99,999 | 53 (7.1%) | 394 (39.8%) |
| $100,000 to $149,999 | 17 (2.3%) | 114 (11.5%) |
| $150,000 or more | 74 (10.0%) | 179 (18.1%) |
| Total | 741 (100.0%) | 991 (100.0%) |
Property Value to Household Income Ratio in Collinsville
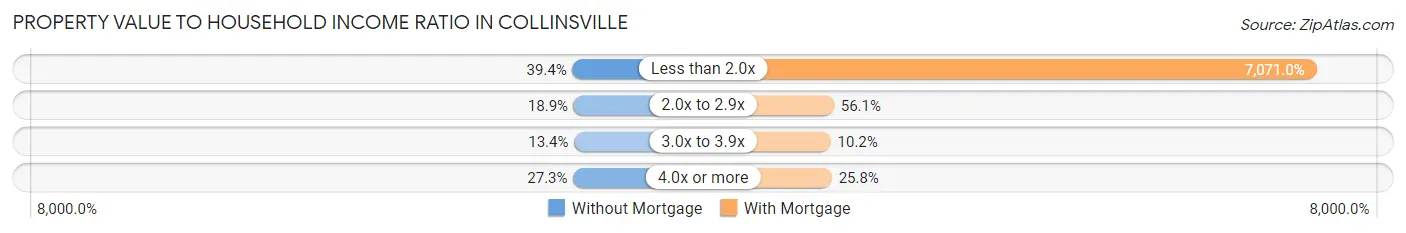
| Value-to-Income Ratio | Without Mortgage | With Mortgage |
| Less than 2.0x | 292 (39.4%) | 70,074 (7,071.0%) |
| 2.0x to 2.9x | 140 (18.9%) | 556 (56.1%) |
| 3.0x to 3.9x | 99 (13.4%) | 101 (10.2%) |
| 4.0x or more | 202 (27.3%) | 256 (25.8%) |
| Total | 741 (100.0%) | 991 (100.0%) |
Real Estate Taxes by Mortgage Status in Collinsville
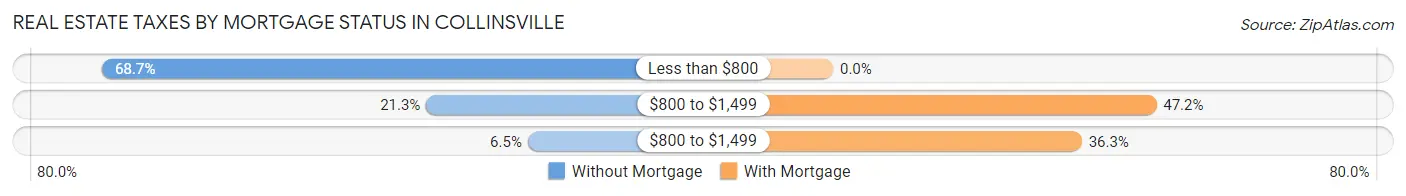
| Property Taxes | Without Mortgage | With Mortgage |
| Less than $800 | 509 (68.7%) | 0 (0.0%) |
| $800 to $1,499 | 158 (21.3%) | 468 (47.2%) |
| $800 to $1,499 | 48 (6.5%) | 360 (36.3%) |
| Total | 741 (100.0%) | 991 (100.0%) |
Health & Disability in Collinsville
Health Insurance Coverage by Age in Collinsville
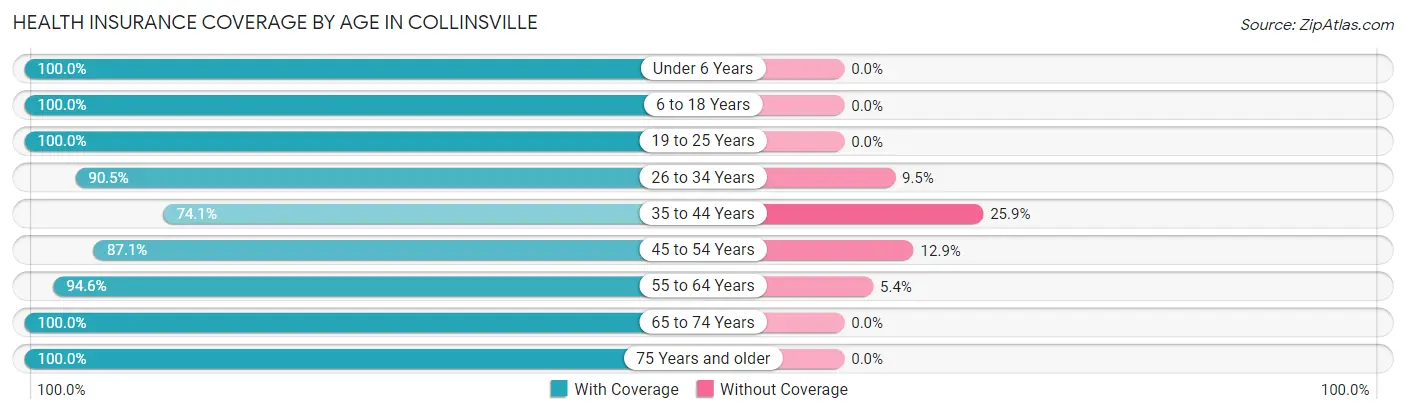
| Age Bracket | With Coverage | Without Coverage |
| Under 6 Years | 418 (100.0%) | 0 (0.0%) |
| 6 to 18 Years | 1,496 (100.0%) | 0 (0.0%) |
| 19 to 25 Years | 649 (100.0%) | 0 (0.0%) |
| 26 to 34 Years | 651 (90.5%) | 68 (9.5%) |
| 35 to 44 Years | 709 (74.1%) | 248 (25.9%) |
| 45 to 54 Years | 990 (87.1%) | 147 (12.9%) |
| 55 to 64 Years | 723 (94.6%) | 41 (5.4%) |
| 65 to 74 Years | 659 (100.0%) | 0 (0.0%) |
| 75 Years and older | 650 (100.0%) | 0 (0.0%) |
| Total | 6,945 (93.2%) | 504 (6.8%) |
Health Insurance Coverage by Citizenship Status in Collinsville
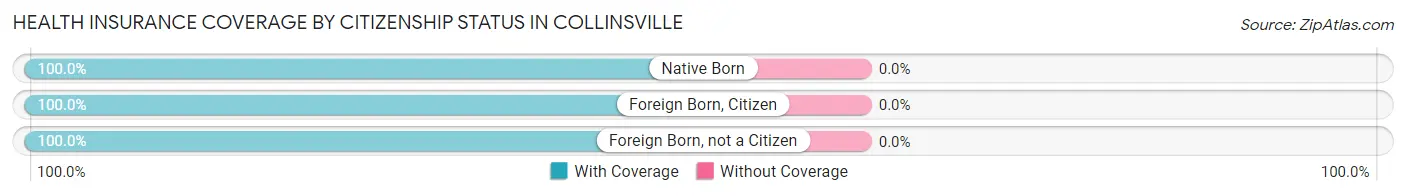
| Citizenship Status | With Coverage | Without Coverage |
| Native Born | 418 (100.0%) | 0 (0.0%) |
| Foreign Born, Citizen | 1,496 (100.0%) | 0 (0.0%) |
| Foreign Born, not a Citizen | 649 (100.0%) | 0 (0.0%) |
Health Insurance Coverage by Household Income in Collinsville
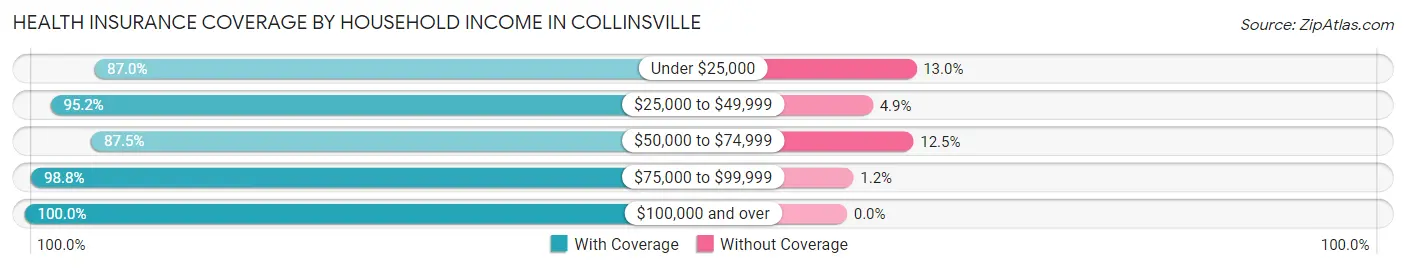
| Household Income | With Coverage | Without Coverage |
| Under $25,000 | 903 (87.0%) | 135 (13.0%) |
| $25,000 to $49,999 | 2,176 (95.2%) | 111 (4.9%) |
| $50,000 to $74,999 | 1,736 (87.5%) | 247 (12.5%) |
| $75,000 to $99,999 | 884 (98.8%) | 11 (1.2%) |
| $100,000 and over | 1,245 (100.0%) | 0 (0.0%) |
Public vs Private Health Insurance Coverage by Age in Collinsville
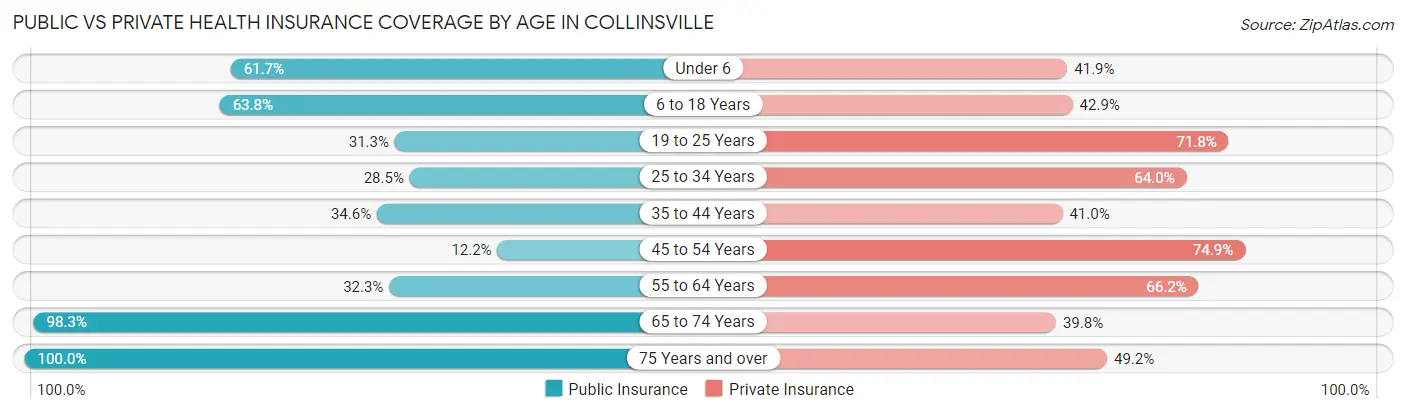
| Age Bracket | Public Insurance | Private Insurance |
| Under 6 | 258 (61.7%) | 175 (41.9%) |
| 6 to 18 Years | 954 (63.8%) | 641 (42.8%) |
| 19 to 25 Years | 203 (31.3%) | 466 (71.8%) |
| 25 to 34 Years | 205 (28.5%) | 460 (64.0%) |
| 35 to 44 Years | 331 (34.6%) | 392 (41.0%) |
| 45 to 54 Years | 139 (12.2%) | 851 (74.9%) |
| 55 to 64 Years | 247 (32.3%) | 506 (66.2%) |
| 65 to 74 Years | 648 (98.3%) | 262 (39.8%) |
| 75 Years and over | 650 (100.0%) | 320 (49.2%) |
| Total | 3,635 (48.8%) | 4,073 (54.7%) |
Disability Status by Sex by Age in Collinsville
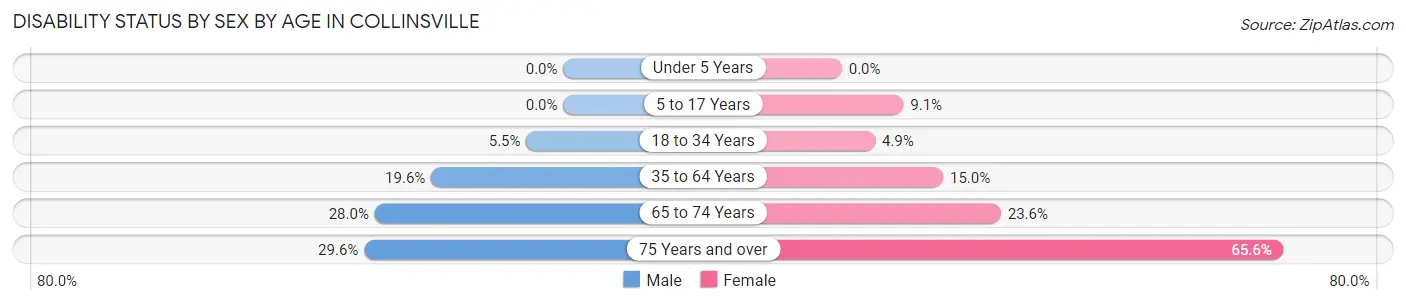
| Age Bracket | Male | Female |
| Under 5 Years | 0 (0.0%) | 0 (0.0%) |
| 5 to 17 Years | 0 (0.0%) | 70 (9.1%) |
| 18 to 34 Years | 37 (5.5%) | 37 (4.9%) |
| 35 to 64 Years | 266 (19.6%) | 226 (15.0%) |
| 65 to 74 Years | 79 (28.0%) | 89 (23.6%) |
| 75 Years and over | 71 (29.6%) | 269 (65.6%) |
Disability Class by Sex by Age in Collinsville
Disability Class: Hearing Difficulty
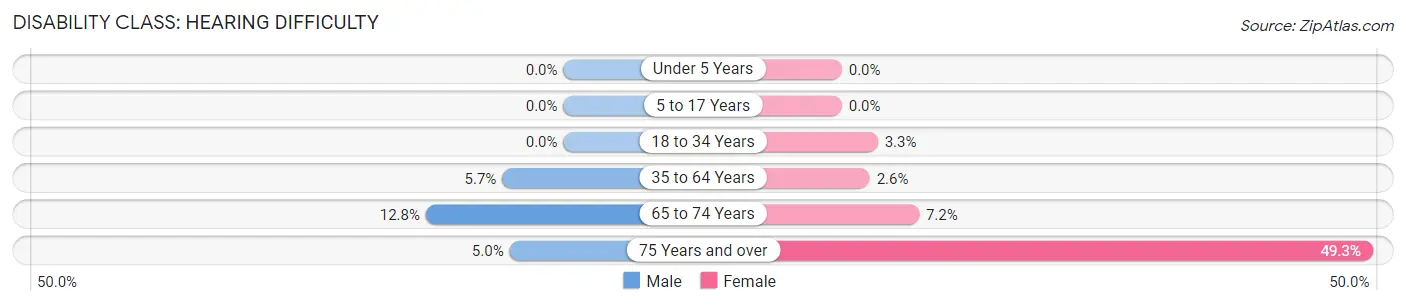
| Age Bracket | Male | Female |
| Under 5 Years | 0 (0.0%) | 0 (0.0%) |
| 5 to 17 Years | 0 (0.0%) | 0 (0.0%) |
| 18 to 34 Years | 0 (0.0%) | 25 (3.3%) |
| 35 to 64 Years | 77 (5.7%) | 39 (2.6%) |
| 65 to 74 Years | 36 (12.8%) | 27 (7.2%) |
| 75 Years and over | 12 (5.0%) | 202 (49.3%) |
Disability Class: Vision Difficulty
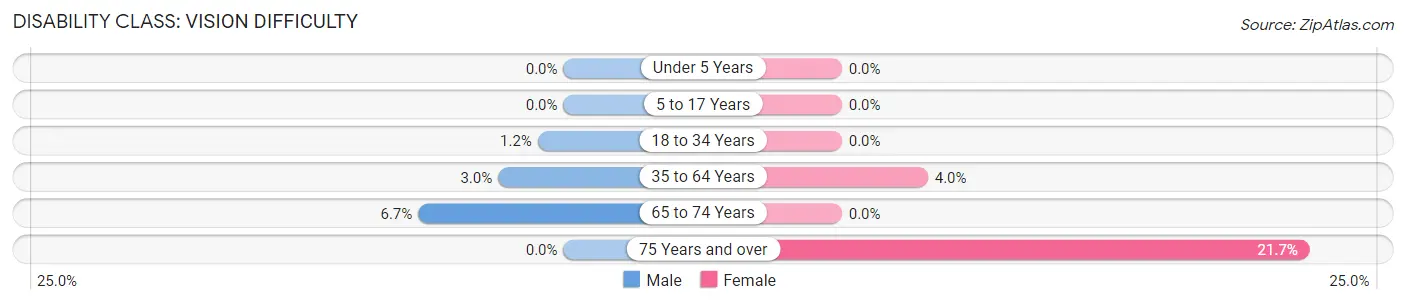
| Age Bracket | Male | Female |
| Under 5 Years | 0 (0.0%) | 0 (0.0%) |
| 5 to 17 Years | 0 (0.0%) | 0 (0.0%) |
| 18 to 34 Years | 8 (1.2%) | 0 (0.0%) |
| 35 to 64 Years | 41 (3.0%) | 60 (4.0%) |
| 65 to 74 Years | 19 (6.7%) | 0 (0.0%) |
| 75 Years and over | 0 (0.0%) | 89 (21.7%) |
Disability Class: Cognitive Difficulty
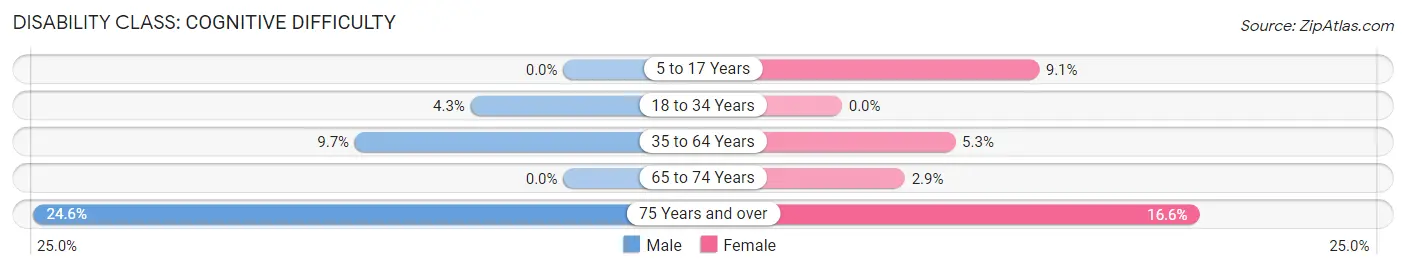
| Age Bracket | Male | Female |
| 5 to 17 Years | 0 (0.0%) | 70 (9.1%) |
| 18 to 34 Years | 29 (4.3%) | 0 (0.0%) |
| 35 to 64 Years | 131 (9.7%) | 79 (5.3%) |
| 65 to 74 Years | 0 (0.0%) | 11 (2.9%) |
| 75 Years and over | 59 (24.6%) | 68 (16.6%) |
Disability Class: Ambulatory Difficulty
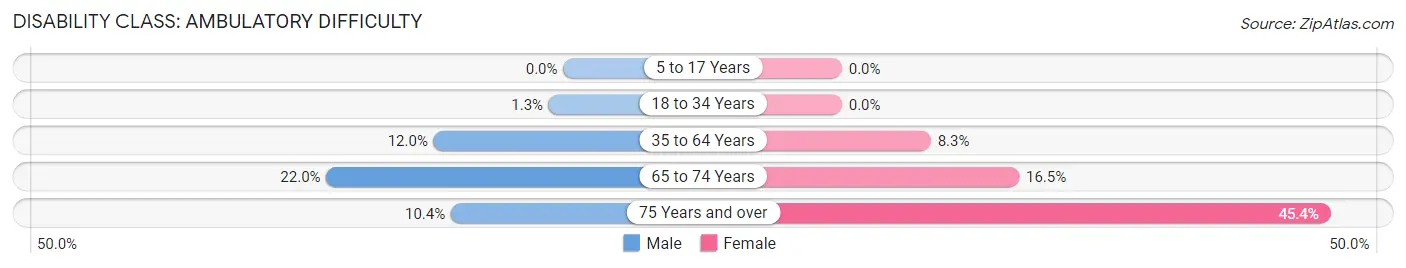
| Age Bracket | Male | Female |
| 5 to 17 Years | 0 (0.0%) | 0 (0.0%) |
| 18 to 34 Years | 9 (1.3%) | 0 (0.0%) |
| 35 to 64 Years | 163 (12.0%) | 124 (8.3%) |
| 65 to 74 Years | 62 (22.0%) | 62 (16.5%) |
| 75 Years and over | 25 (10.4%) | 186 (45.4%) |
Disability Class: Self-Care Difficulty
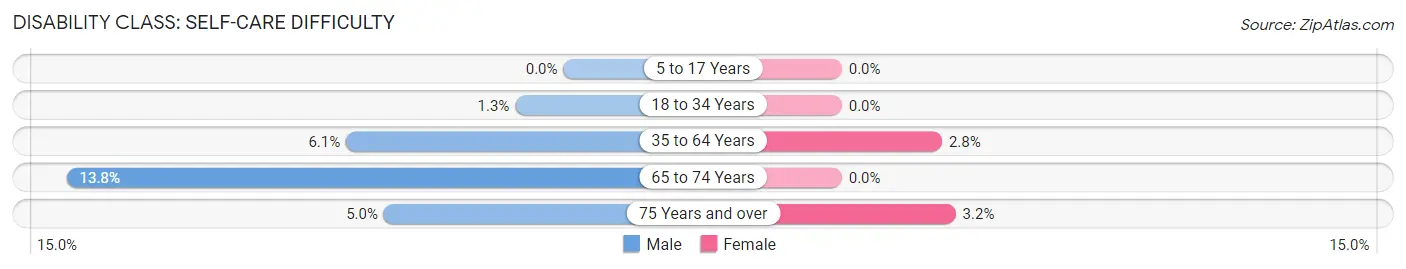
| Age Bracket | Male | Female |
| 5 to 17 Years | 0 (0.0%) | 0 (0.0%) |
| 18 to 34 Years | 9 (1.3%) | 0 (0.0%) |
| 35 to 64 Years | 82 (6.0%) | 42 (2.8%) |
| 65 to 74 Years | 39 (13.8%) | 0 (0.0%) |
| 75 Years and over | 12 (5.0%) | 13 (3.2%) |
Technology Access in Collinsville
Computing Device Access in Collinsville
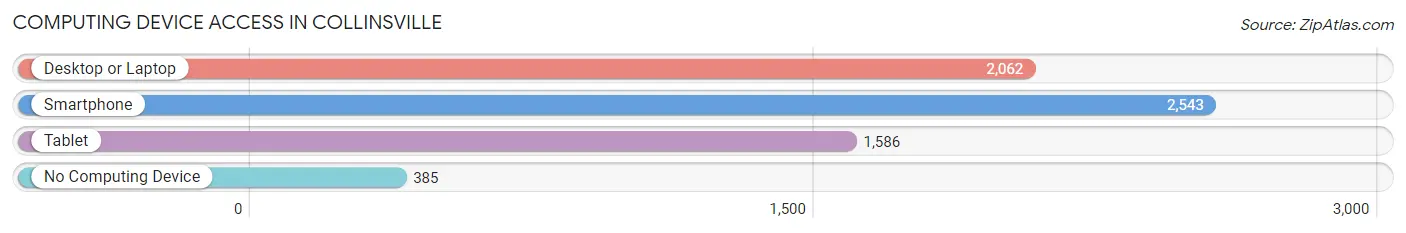
| Device Type | # Households | % Households |
| Desktop or Laptop | 2,062 | 67.0% |
| Smartphone | 2,543 | 82.6% |
| Tablet | 1,586 | 51.5% |
| No Computing Device | 385 | 12.5% |
| Total | 3,079 | 100.0% |
Internet Access in Collinsville
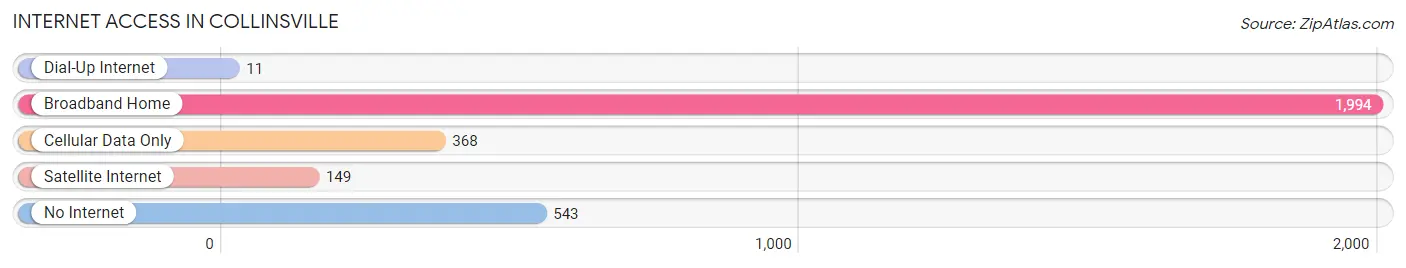
| Internet Type | # Households | % Households |
| Dial-Up Internet | 11 | 0.4% |
| Broadband Home | 1,994 | 64.8% |
| Cellular Data Only | 368 | 11.9% |
| Satellite Internet | 149 | 4.8% |
| No Internet | 543 | 17.6% |
| Total | 3,079 | 100.0% |
Collinsville Summary
History
The town of Collinsville, Virginia is located in the western part of Henry County, Virginia. It is situated on the banks of the Smith River, which is a tributary of the Dan River. The town was founded in 1836 by William Collins, who was a local farmer and businessman. He named the town after himself and it quickly grew into a thriving community.
The town was an important stop on the Virginia and Tennessee Railroad, which connected the town to the larger cities of Lynchburg and Danville. This allowed the town to become a major hub for trade and commerce. The railroad also allowed the town to become a major center for the production of tobacco, which was a major crop in the area.
The town was also home to several factories, including a cotton mill, a furniture factory, and a canning factory. These factories provided employment for many of the town’s residents.
The town was also home to several churches, including the First Baptist Church, the Methodist Episcopal Church, and the Presbyterian Church. These churches provided spiritual guidance and support to the town’s residents.
The town was also home to several schools, including the Collinsville Academy, which was founded in 1845. This school provided education to the town’s children and was the first school in the area to offer a high school education.
The town was also home to several businesses, including a general store, a blacksmith shop, and a hotel. These businesses provided goods and services to the town’s residents.
The town was also home to several fraternal organizations, including the Odd Fellows, the Masons, and the Knights of Pythias. These organizations provided social and recreational activities for the town’s residents.
The town was also home to several newspapers, including the Collinsville Gazette and the Collinsville Times. These newspapers provided news and information to the town’s residents.
The town was also home to several banks, including the Bank of Collinsville and the First National Bank of Collinsville. These banks provided financial services to the town’s residents.
The town was also home to several parks, including the Collinsville Park and the Collinsville Recreation Center. These parks provided recreational activities for the town’s residents.
The town was also home to several cemeteries, including the Collinsville Cemetery and the Old Collinsville Cemetery. These cemeteries provided burial grounds for the town’s residents.
Geography
Collinsville is located in the western part of Henry County, Virginia. It is situated on the banks of the Smith River, which is a tributary of the Dan River. The town is located at an elevation of 845 feet above sea level.
The town is located in a hilly region of the state, with the surrounding area being mostly forested. The town is located in a temperate climate, with hot summers and cold winters. The average annual temperature is around 60 degrees Fahrenheit.
The town is located near several major highways, including Interstate 81, US Route 58, and US Route 29. These highways provide access to the larger cities of Lynchburg and Danville.
Economy
The economy of Collinsville is largely based on agriculture and manufacturing. The town is home to several farms, which produce a variety of crops, including tobacco, corn, soybeans, and hay. The town is also home to several factories, which produce a variety of products, including furniture, textiles, and canned goods.
The town is also home to several businesses, including restaurants, retail stores, and service providers. These businesses provide goods and services to the town’s residents and visitors.
Demographics
As of the 2010 census, the population of Collinsville was 1,845. The town has a population density of 1,072 people per square mile. The median age of the town’s residents is 39.7 years.
The town is predominantly white, with 92.3% of the population being white. The town is also home to a small African American population, with 4.3% of the population being African American. The town is also home to a small Hispanic population, with 1.7% of the population being Hispanic.
The town has a median household income of $41,944. The town’s poverty rate is 15.3%. The town’s unemployment rate is 5.2%.
Common Questions
What is Per Capita Income in Collinsville?
Per Capita income in Collinsville is $23,483.
What is the Median Family Income in Collinsville?
Median Family Income in Collinsville is $62,661.
What is the Median Household income in Collinsville?
Median Household Income in Collinsville is $45,914.
What is Income or Wage Gap in Collinsville?
Income or Wage Gap in Collinsville is 24.3%.
Women in Collinsville earn 75.7 cents for every dollar earned by a man.
What is Family Income Deficit in Collinsville?
Family Income Deficit in Collinsville is $10,510.
Families that are below poverty line in Collinsville earn $10,510 less on average than the poverty threshold level.
What is Inequality or Gini Index in Collinsville?
Inequality or Gini Index in Collinsville is 0.40.
What is the Total Population of Collinsville?
Total Population of Collinsville is 7,640.
What is the Total Male Population of Collinsville?
Total Male Population of Collinsville is 3,548.
What is the Total Female Population of Collinsville?
Total Female Population of Collinsville is 4,092.
What is the Ratio of Males per 100 Females in Collinsville?
There are 86.71 Males per 100 Females in Collinsville.
What is the Ratio of Females per 100 Males in Collinsville?
There are 115.33 Females per 100 Males in Collinsville.
What is the Median Population Age in Collinsville?
Median Population Age in Collinsville is 39.7 Years.
What is the Average Family Size in Collinsville
Average Family Size in Collinsville is 3.2 People.
What is the Average Household Size in Collinsville
Average Household Size in Collinsville is 2.5 People.
How Large is the Labor Force in Collinsville?
There are 3,721 People in the Labor Forcein in Collinsville.
What is the Percentage of People in the Labor Force in Collinsville?
62.3% of People are in the Labor Force in Collinsville.
What is the Unemployment Rate in Collinsville?
Unemployment Rate in Collinsville is 6.8%.