Lynchburg, VA Map & Demographics
Lynchburg Map
Lynchburg Overview
$28,478
PER CAPITA INCOME
$71,392
AVG FAMILY INCOME
$56,243
AVG HOUSEHOLD INCOME
28.4%
WAGE / INCOME GAP [ % ]
71.6¢/ $1
WAGE / INCOME GAP [ $ ]
$11,024
FAMILY INCOME DEFICIT
0.45
INEQUALITY / GINI INDEX
79,166
TOTAL POPULATION
36,991
MALE POPULATION
42,175
FEMALE POPULATION
87.71
MALES / 100 FEMALES
114.01
FEMALES / 100 MALES
28.4
MEDIAN AGE
3.0
AVG FAMILY SIZE
2.4
AVG HOUSEHOLD SIZE
38,961
LABOR FORCE [ PEOPLE ]
59.3%
PERCENT IN LABOR FORCE
5.4%
UNEMPLOYMENT RATE
Lynchburg Area Codes
Income in Lynchburg
Income Overview in Lynchburg
Per Capita Income in Lynchburg is $28,478, while median incomes of families and households are $71,392 and $56,243 respectively.
| Characteristic | Number | Measure |
| Per Capita Income | 79,166 | $28,478 |
| Median Family Income | 16,731 | $71,392 |
| Mean Family Income | 16,731 | $89,943 |
| Median Household Income | 28,910 | $56,243 |
| Mean Household Income | 28,910 | $74,955 |
| Income Deficit | 16,731 | $11,024 |
| Wage / Income Gap (%) | 79,166 | 28.37% |
| Wage / Income Gap ($) | 79,166 | 71.63¢ per $1 |
| Gini / Inequality Index | 79,166 | 0.45 |
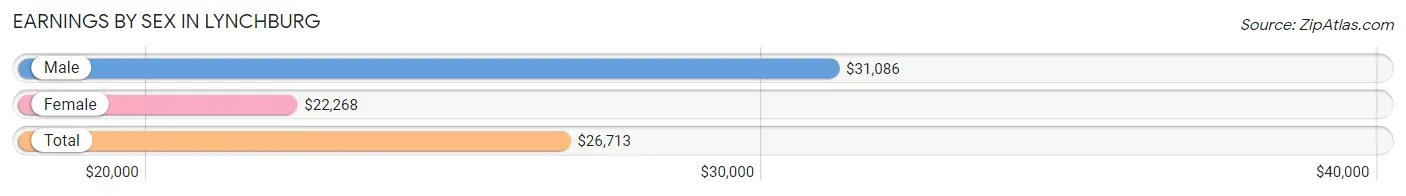
Earnings by Sex in Lynchburg
Average Earnings in Lynchburg are $26,713, $31,086 for men and $22,268 for women, a difference of 28.4%.
| Sex | Number | Average Earnings |
| Male | 21,365 (49.1%) | $31,086 |
| Female | 22,130 (50.9%) | $22,268 |
| Total | 43,495 (100.0%) | $26,713 |
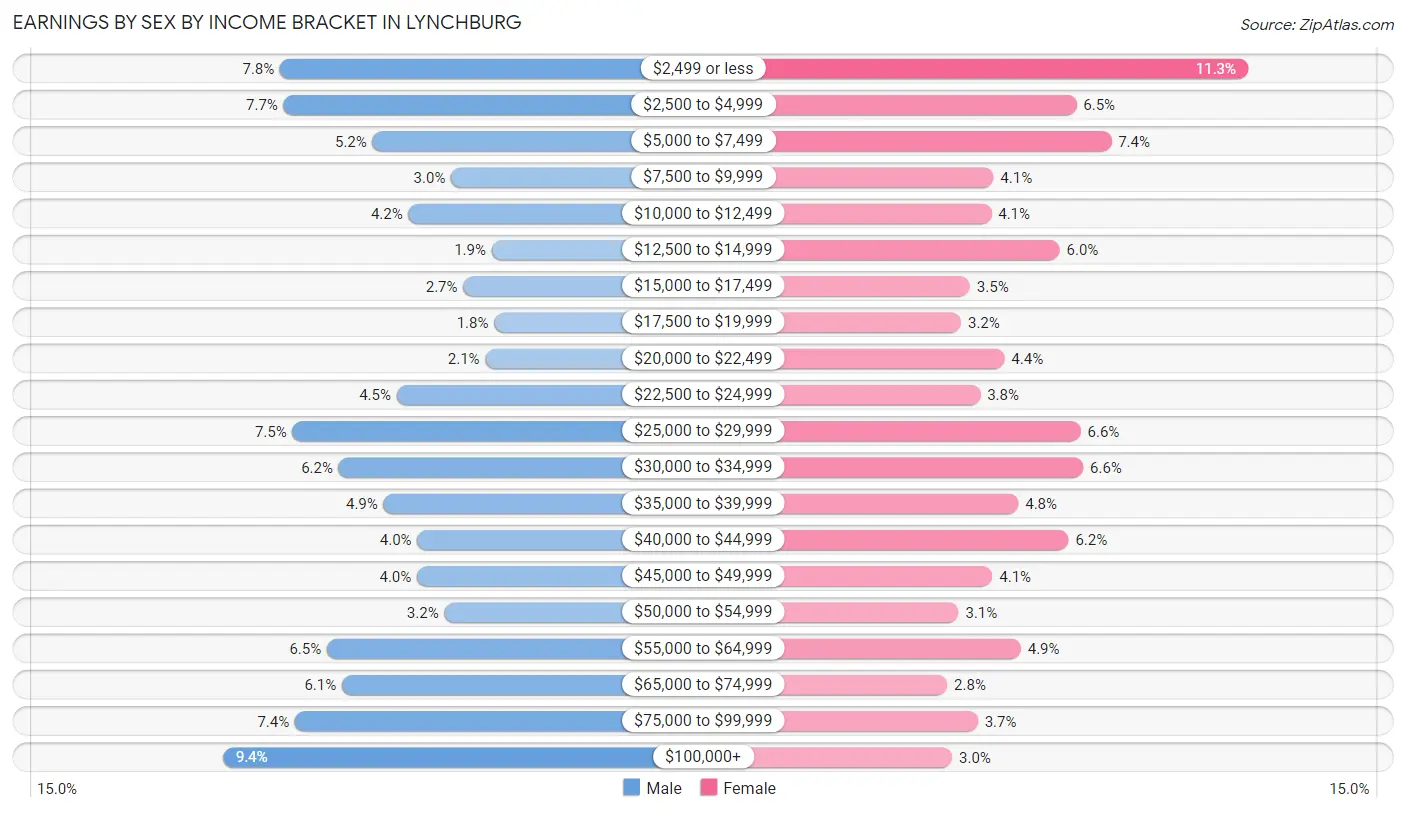
Earnings by Sex by Income Bracket in Lynchburg
The most common earnings brackets in Lynchburg are $100,000+ for men (2,014 | 9.4%) and $2,499 or less for women (2,495 | 11.3%).
| Income | Male | Female |
| $2,499 or less | 1,671 (7.8%) | 2,495 (11.3%) |
| $2,500 to $4,999 | 1,650 (7.7%) | 1,428 (6.5%) |
| $5,000 to $7,499 | 1,116 (5.2%) | 1,645 (7.4%) |
| $7,500 to $9,999 | 644 (3.0%) | 911 (4.1%) |
| $10,000 to $12,499 | 899 (4.2%) | 898 (4.1%) |
| $12,500 to $14,999 | 400 (1.9%) | 1,323 (6.0%) |
| $15,000 to $17,499 | 571 (2.7%) | 765 (3.5%) |
| $17,500 to $19,999 | 385 (1.8%) | 710 (3.2%) |
| $20,000 to $22,499 | 438 (2.1%) | 981 (4.4%) |
| $22,500 to $24,999 | 969 (4.5%) | 829 (3.7%) |
| $25,000 to $29,999 | 1,595 (7.5%) | 1,455 (6.6%) |
| $30,000 to $34,999 | 1,318 (6.2%) | 1,470 (6.6%) |
| $35,000 to $39,999 | 1,049 (4.9%) | 1,067 (4.8%) |
| $40,000 to $44,999 | 846 (4.0%) | 1,378 (6.2%) |
| $45,000 to $49,999 | 849 (4.0%) | 906 (4.1%) |
| $50,000 to $54,999 | 684 (3.2%) | 695 (3.1%) |
| $55,000 to $64,999 | 1,388 (6.5%) | 1,082 (4.9%) |
| $65,000 to $74,999 | 1,299 (6.1%) | 623 (2.8%) |
| $75,000 to $99,999 | 1,580 (7.4%) | 815 (3.7%) |
| $100,000+ | 2,014 (9.4%) | 654 (3.0%) |
| Total | 21,365 (100.0%) | 22,130 (100.0%) |
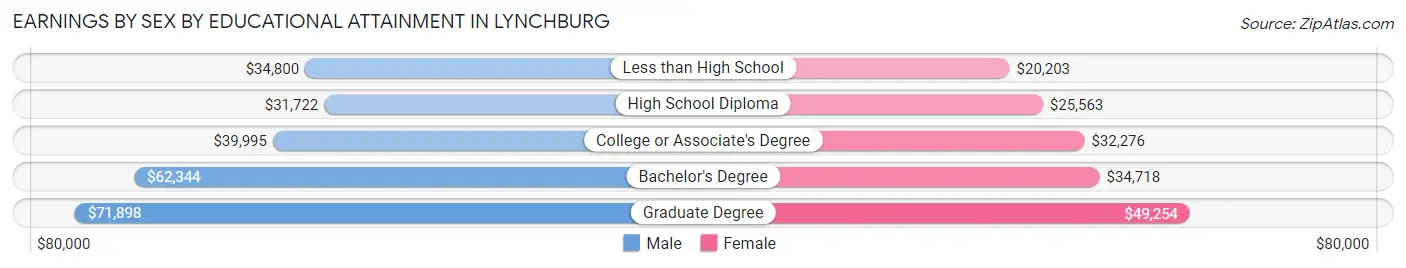
Earnings by Sex by Educational Attainment in Lynchburg
Average earnings in Lynchburg are $46,696 for men and $32,929 for women, a difference of 29.5%. Men with an educational attainment of graduate degree enjoy the highest average annual earnings of $71,898, while those with high school diploma education earn the least with $31,722. Women with an educational attainment of graduate degree earn the most with the average annual earnings of $49,254, while those with less than high school education have the smallest earnings of $20,203.
| Educational Attainment | Male Income | Female Income |
| Less than High School | $34,800 | $20,203 |
| High School Diploma | $31,722 | $25,563 |
| College or Associate's Degree | $39,995 | $32,276 |
| Bachelor's Degree | $62,344 | $34,718 |
| Graduate Degree | $71,898 | $49,254 |
| Total | $46,696 | $32,929 |
Family Income in Lynchburg
Family Income Brackets in Lynchburg
According to the Lynchburg family income data, there are 3,196 families falling into the $100,000 to $149,999 income range, which is the most common income bracket and makes up 19.1% of all families. Conversely, the $10,000 to $14,999 income bracket is the least frequent group with only 301 families (1.8%) belonging to this category.
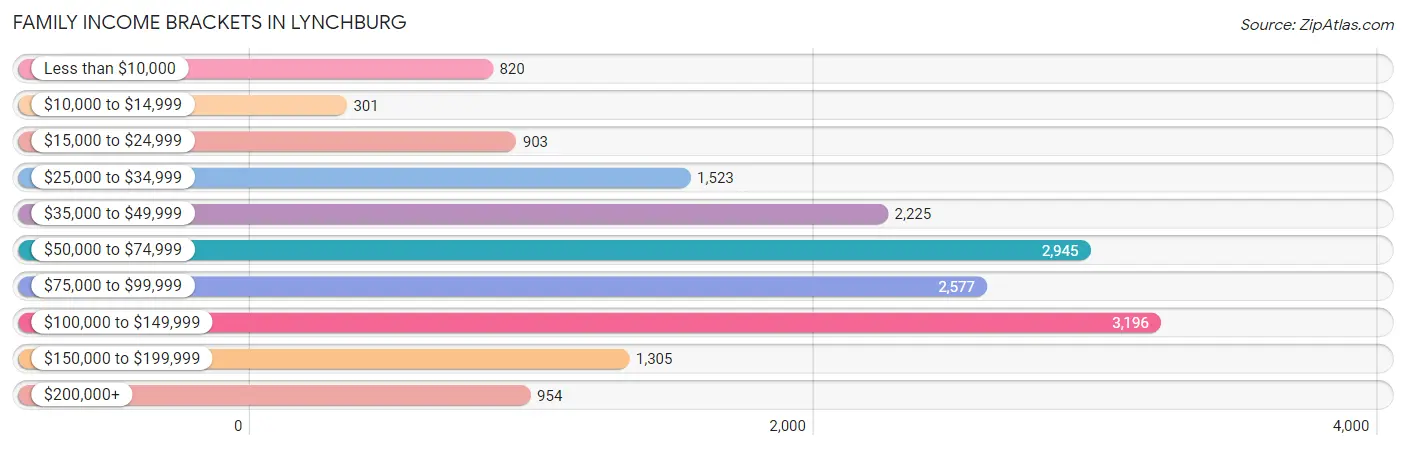
| Income Bracket | # Families | % Families |
| Less than $10,000 | 820 | 4.9% |
| $10,000 to $14,999 | 301 | 1.8% |
| $15,000 to $24,999 | 903 | 5.4% |
| $25,000 to $34,999 | 1,523 | 9.1% |
| $35,000 to $49,999 | 2,225 | 13.3% |
| $50,000 to $74,999 | 2,945 | 17.6% |
| $75,000 to $99,999 | 2,577 | 15.4% |
| $100,000 to $149,999 | 3,196 | 19.1% |
| $150,000 to $199,999 | 1,305 | 7.8% |
| $200,000+ | 954 | 5.7% |
Family Income by Famaliy Size in Lynchburg
6-person families (525 | 3.1%) account for the highest median family income in Lynchburg with $115,597 per family, while 2-person families (9,348 | 55.9%) have the highest median income of $32,772 per family member.
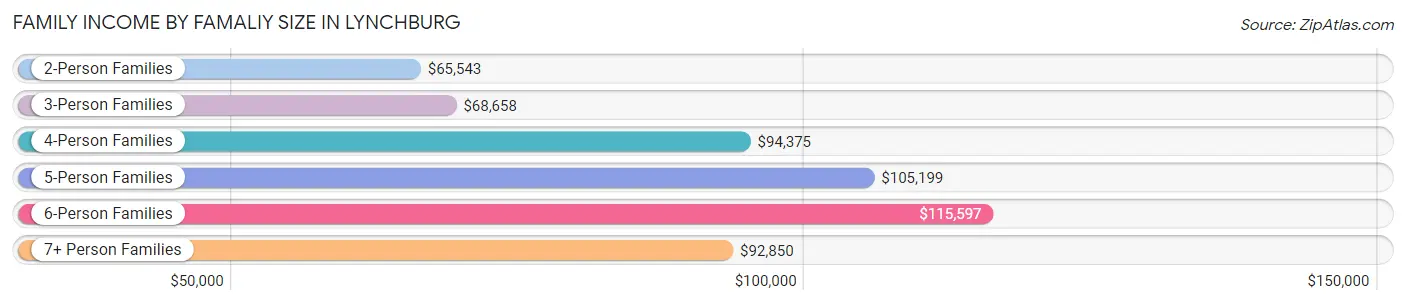
| Income Bracket | # Families | Median Income |
| 2-Person Families | 9,348 (55.9%) | $65,543 |
| 3-Person Families | 3,599 (21.5%) | $68,658 |
| 4-Person Families | 1,947 (11.6%) | $94,375 |
| 5-Person Families | 957 (5.7%) | $105,199 |
| 6-Person Families | 525 (3.1%) | $115,597 |
| 7+ Person Families | 355 (2.1%) | $92,850 |
| Total | 16,731 (100.0%) | $71,392 |
Family Income by Number of Earners in Lynchburg
The median family income in Lynchburg is $71,392, with families comprising 3+ earners (1,303) having the highest median family income of $123,542, while families with no earners (2,790) have the lowest median family income of $37,625, accounting for 7.8% and 16.7% of families, respectively.
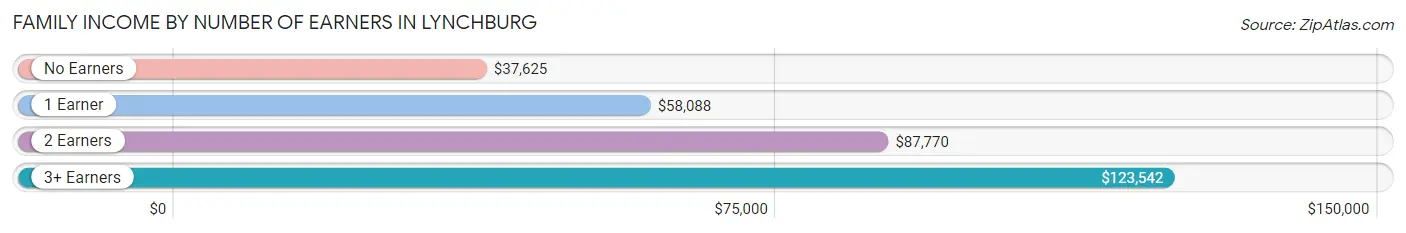
| Number of Earners | # Families | Median Income |
| No Earners | 2,790 (16.7%) | $37,625 |
| 1 Earner | 6,296 (37.6%) | $58,088 |
| 2 Earners | 6,342 (37.9%) | $87,770 |
| 3+ Earners | 1,303 (7.8%) | $123,542 |
| Total | 16,731 (100.0%) | $71,392 |
Household Income in Lynchburg
Household Income Brackets in Lynchburg
With 5,204 households falling in the category, the $50,000 to $74,999 income range is the most frequent in Lynchburg, accounting for 18.0% of all households. In contrast, only 1,127 households (3.9%) fall into the $200,000+ income bracket, making it the least populous group.
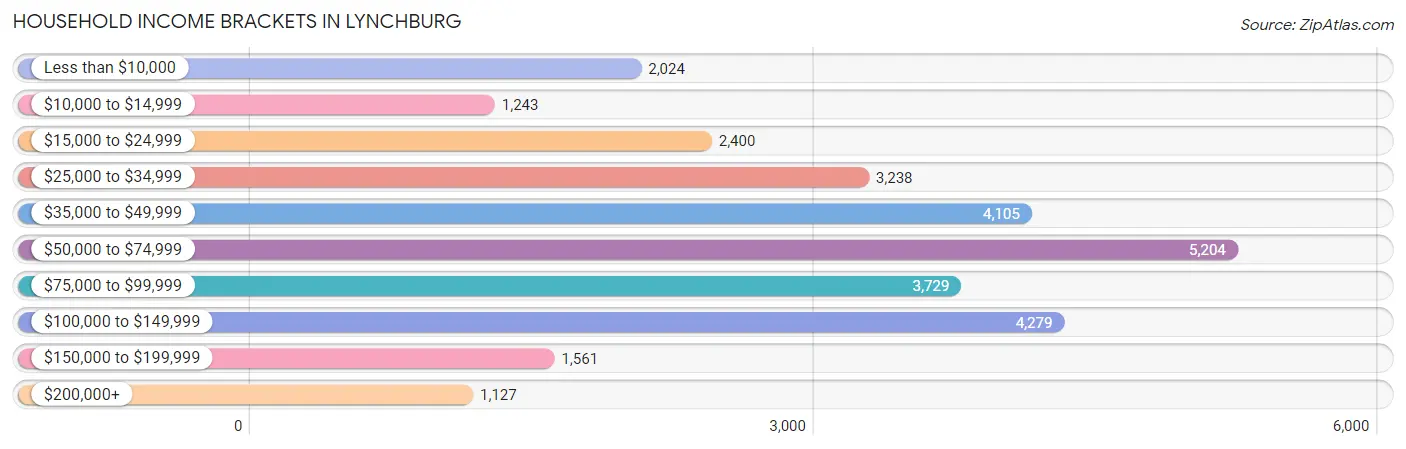
| Income Bracket | # Households | % Households |
| Less than $10,000 | 2,024 | 7.0% |
| $10,000 to $14,999 | 1,243 | 4.3% |
| $15,000 to $24,999 | 2,400 | 8.3% |
| $25,000 to $34,999 | 3,238 | 11.2% |
| $35,000 to $49,999 | 4,105 | 14.2% |
| $50,000 to $74,999 | 5,204 | 18.0% |
| $75,000 to $99,999 | 3,729 | 12.9% |
| $100,000 to $149,999 | 4,279 | 14.8% |
| $150,000 to $199,999 | 1,561 | 5.4% |
| $200,000+ | 1,127 | 3.9% |
Household Income by Householder Age in Lynchburg
The median household income in Lynchburg is $56,243, with the highest median household income of $70,560 found in the 45 to 64 years age bracket for the primary householder. A total of 8,842 households (30.6%) fall into this category. Meanwhile, the 15 to 24 years age bracket for the primary householder has the lowest median household income of $41,793, with 3,783 households (13.1%) in this group.
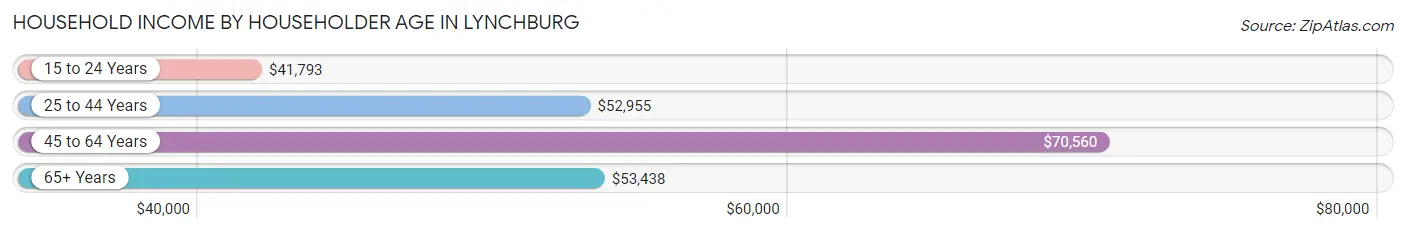
| Income Bracket | # Households | Median Income |
| 15 to 24 Years | 3,783 (13.1%) | $41,793 |
| 25 to 44 Years | 9,324 (32.3%) | $52,955 |
| 45 to 64 Years | 8,842 (30.6%) | $70,560 |
| 65+ Years | 6,961 (24.1%) | $53,438 |
| Total | 28,910 (100.0%) | $56,243 |
Poverty in Lynchburg
Income Below Poverty by Sex and Age in Lynchburg
With 16.3% poverty level for males and 18.7% for females among the residents of Lynchburg, 5 year old males and 15 year old females are the most vulnerable to poverty, with 124 males (32.3%) and 187 females (39.7%) in their respective age groups living below the poverty level.
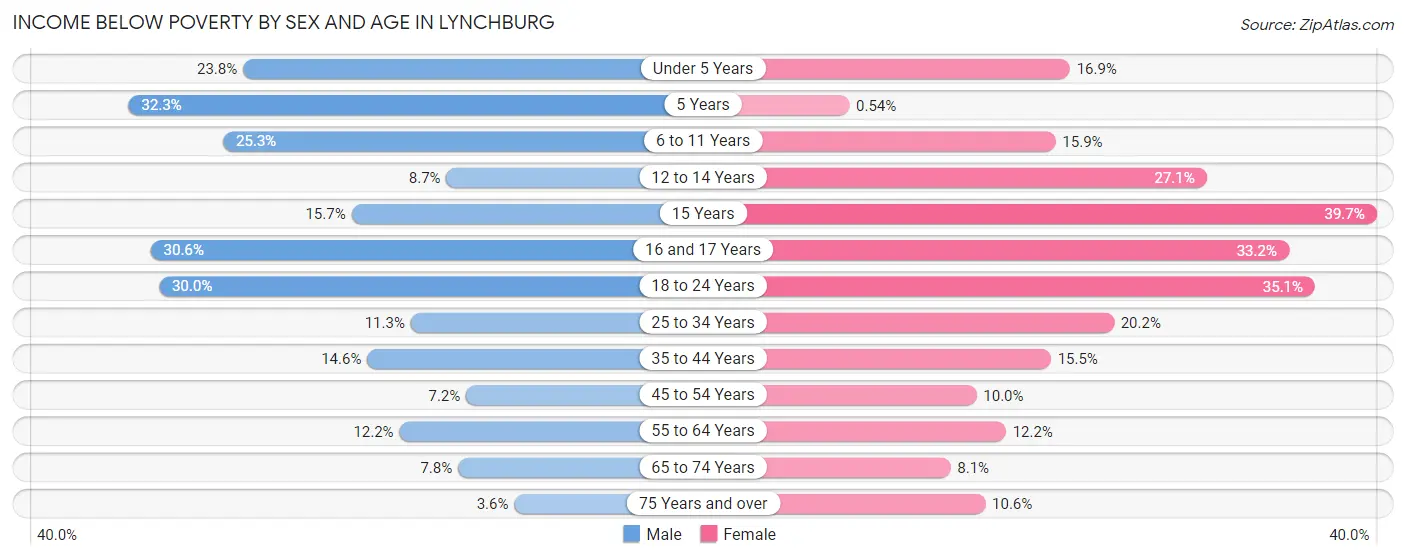
| Age Bracket | Male | Female |
| Under 5 Years | 563 (23.8%) | 373 (16.9%) |
| 5 Years | 124 (32.3%) | 1 (0.5%) |
| 6 to 11 Years | 608 (25.3%) | 379 (15.9%) |
| 12 to 14 Years | 98 (8.7%) | 361 (27.1%) |
| 15 Years | 59 (15.7%) | 187 (39.7%) |
| 16 and 17 Years | 246 (30.6%) | 214 (33.2%) |
| 18 to 24 Years | 1,512 (30.0%) | 2,159 (35.1%) |
| 25 to 34 Years | 632 (11.3%) | 1,124 (20.2%) |
| 35 to 44 Years | 477 (14.6%) | 593 (15.5%) |
| 45 to 54 Years | 217 (7.2%) | 352 (10.0%) |
| 55 to 64 Years | 426 (12.2%) | 511 (12.2%) |
| 65 to 74 Years | 202 (7.8%) | 259 (8.1%) |
| 75 Years and over | 63 (3.6%) | 293 (10.6%) |
| Total | 5,227 (16.3%) | 6,806 (18.7%) |
Income Above Poverty by Sex and Age in Lynchburg
According to the poverty statistics in Lynchburg, males aged 75 years and over and females aged 5 years are the age groups that are most secure financially, with 96.4% of males and 99.5% of females in these age groups living above the poverty line.
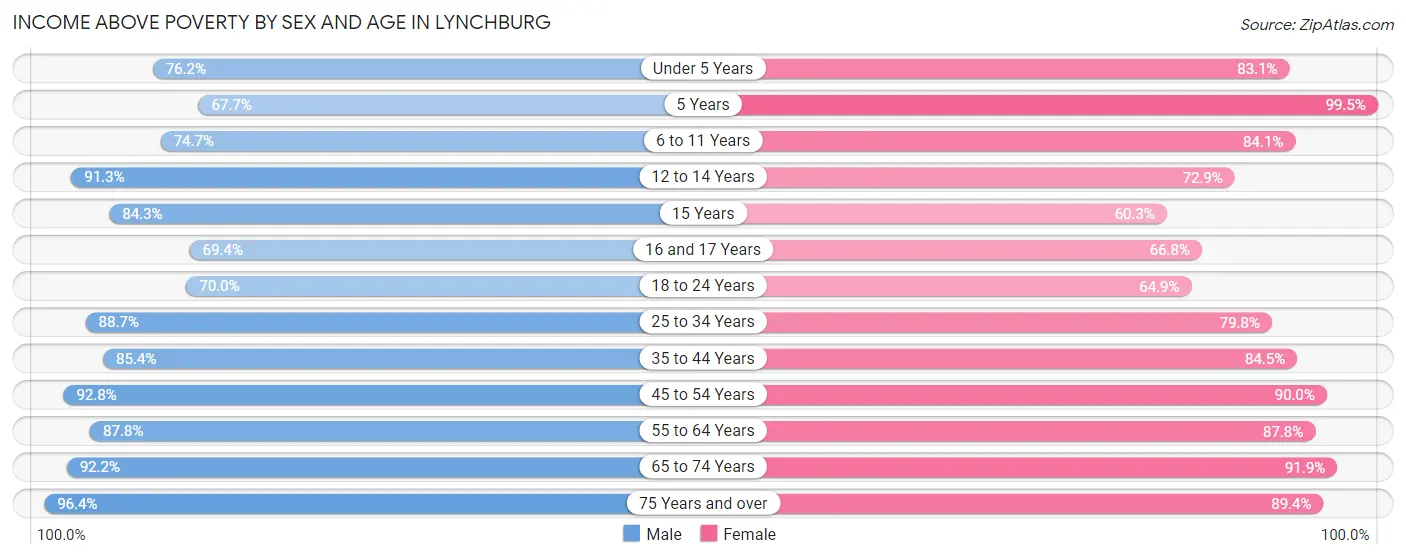
| Age Bracket | Male | Female |
| Under 5 Years | 1,805 (76.2%) | 1,831 (83.1%) |
| 5 Years | 260 (67.7%) | 184 (99.5%) |
| 6 to 11 Years | 1,798 (74.7%) | 2,010 (84.1%) |
| 12 to 14 Years | 1,031 (91.3%) | 972 (72.9%) |
| 15 Years | 316 (84.3%) | 284 (60.3%) |
| 16 and 17 Years | 557 (69.4%) | 431 (66.8%) |
| 18 to 24 Years | 3,525 (70.0%) | 3,989 (64.9%) |
| 25 to 34 Years | 4,945 (88.7%) | 4,443 (79.8%) |
| 35 to 44 Years | 2,798 (85.4%) | 3,231 (84.5%) |
| 45 to 54 Years | 2,789 (92.8%) | 3,170 (90.0%) |
| 55 to 64 Years | 3,074 (87.8%) | 3,688 (87.8%) |
| 65 to 74 Years | 2,382 (92.2%) | 2,956 (91.9%) |
| 75 Years and over | 1,667 (96.4%) | 2,462 (89.4%) |
| Total | 26,947 (83.8%) | 29,651 (81.3%) |
Income Below Poverty Among Married-Couple Families in Lynchburg
The poverty statistics for married-couple families in Lynchburg show that 3.2% or 355 of the total 10,999 families live below the poverty line. Families with 5 or more children have the highest poverty rate of 17.8%, comprising of 35 families. On the other hand, families with 1 or 2 children have the lowest poverty rate of 1.6%, which includes 46 families.
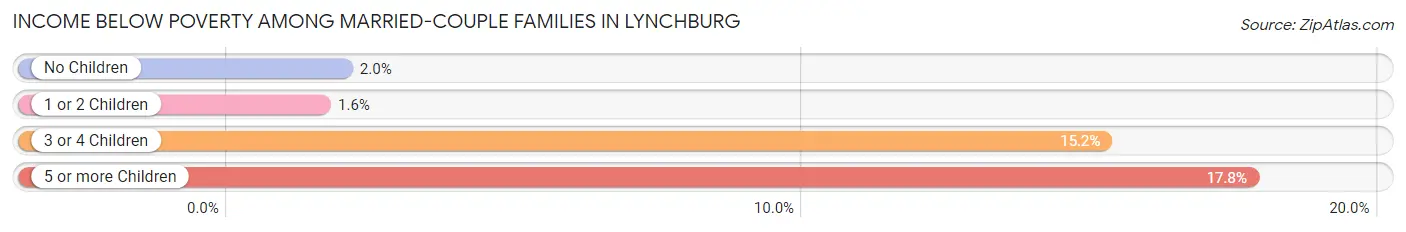
| Children | Above Poverty | Below Poverty |
| No Children | 6,957 (98.0%) | 142 (2.0%) |
| 1 or 2 Children | 2,790 (98.4%) | 46 (1.6%) |
| 3 or 4 Children | 735 (84.8%) | 132 (15.2%) |
| 5 or more Children | 162 (82.2%) | 35 (17.8%) |
| Total | 10,644 (96.8%) | 355 (3.2%) |
Income Below Poverty Among Single-Parent Households in Lynchburg
According to the poverty data in Lynchburg, 15.4% or 164 single-father households and 29.0% or 1,352 single-mother households are living below the poverty line. Among single-father households, those with 3 or 4 children have the highest poverty rate, with 37 households (43.5%) experiencing poverty. Likewise, among single-mother households, those with 3 or 4 children have the highest poverty rate, with 221 households (47.1%) falling below the poverty line.
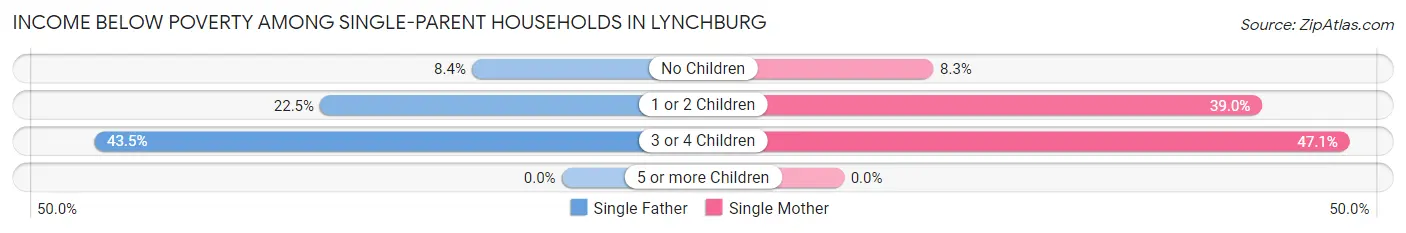
| Children | Single Father | Single Mother |
| No Children | 55 (8.4%) | 136 (8.3%) |
| 1 or 2 Children | 72 (22.5%) | 995 (39.0%) |
| 3 or 4 Children | 37 (43.5%) | 221 (47.1%) |
| 5 or more Children | 0 (0.0%) | 0 (0.0%) |
| Total | 164 (15.4%) | 1,352 (29.0%) |
Income Below Poverty Among Married-Couple vs Single-Parent Households in Lynchburg
The poverty data for Lynchburg shows that 355 of the married-couple family households (3.2%) and 1,516 of the single-parent households (26.5%) are living below the poverty level. Within the married-couple family households, those with 5 or more children have the highest poverty rate, with 35 households (17.8%) falling below the poverty line. Among the single-parent households, those with 3 or 4 children have the highest poverty rate, with 258 household (46.6%) living below poverty.
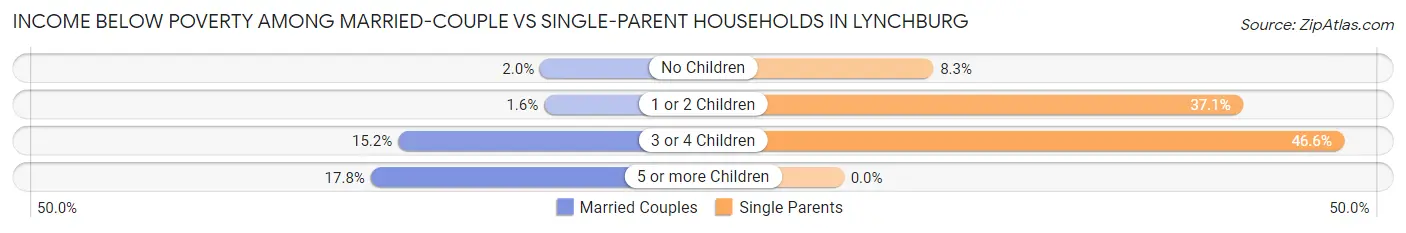
| Children | Married-Couple Families | Single-Parent Households |
| No Children | 142 (2.0%) | 191 (8.3%) |
| 1 or 2 Children | 46 (1.6%) | 1,067 (37.1%) |
| 3 or 4 Children | 132 (15.2%) | 258 (46.6%) |
| 5 or more Children | 35 (17.8%) | 0 (0.0%) |
| Total | 355 (3.2%) | 1,516 (26.5%) |
Race in Lynchburg
The most populous races in Lynchburg are White / Caucasian (49,660 | 62.7%), Black / African American (21,824 | 27.6%), and Two or more Races (3,937 | 5.0%).
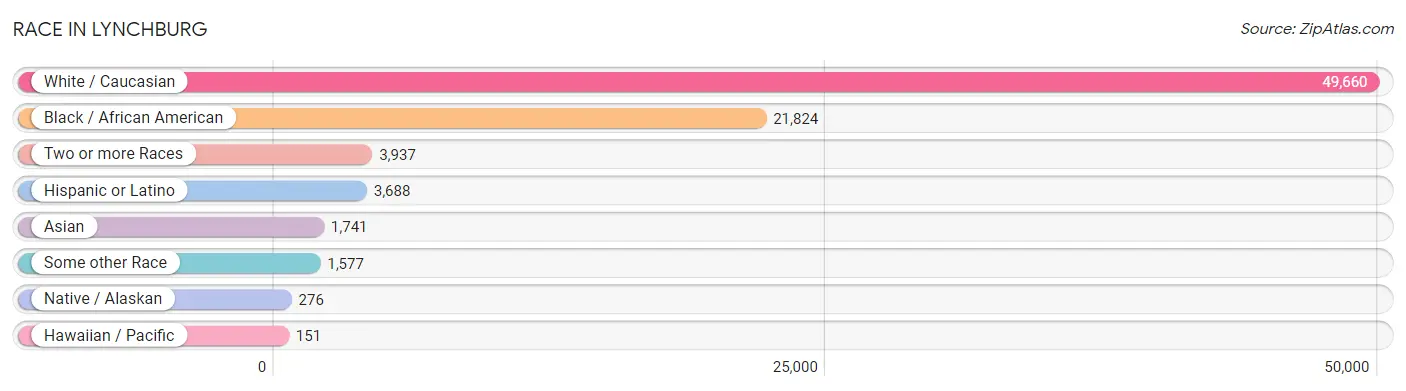
| Race | # Population | % Population |
| Asian | 1,741 | 2.2% |
| Black / African American | 21,824 | 27.6% |
| Hawaiian / Pacific | 151 | 0.2% |
| Hispanic or Latino | 3,688 | 4.7% |
| Native / Alaskan | 276 | 0.4% |
| White / Caucasian | 49,660 | 62.7% |
| Two or more Races | 3,937 | 5.0% |
| Some other Race | 1,577 | 2.0% |
| Total | 79,166 | 100.0% |
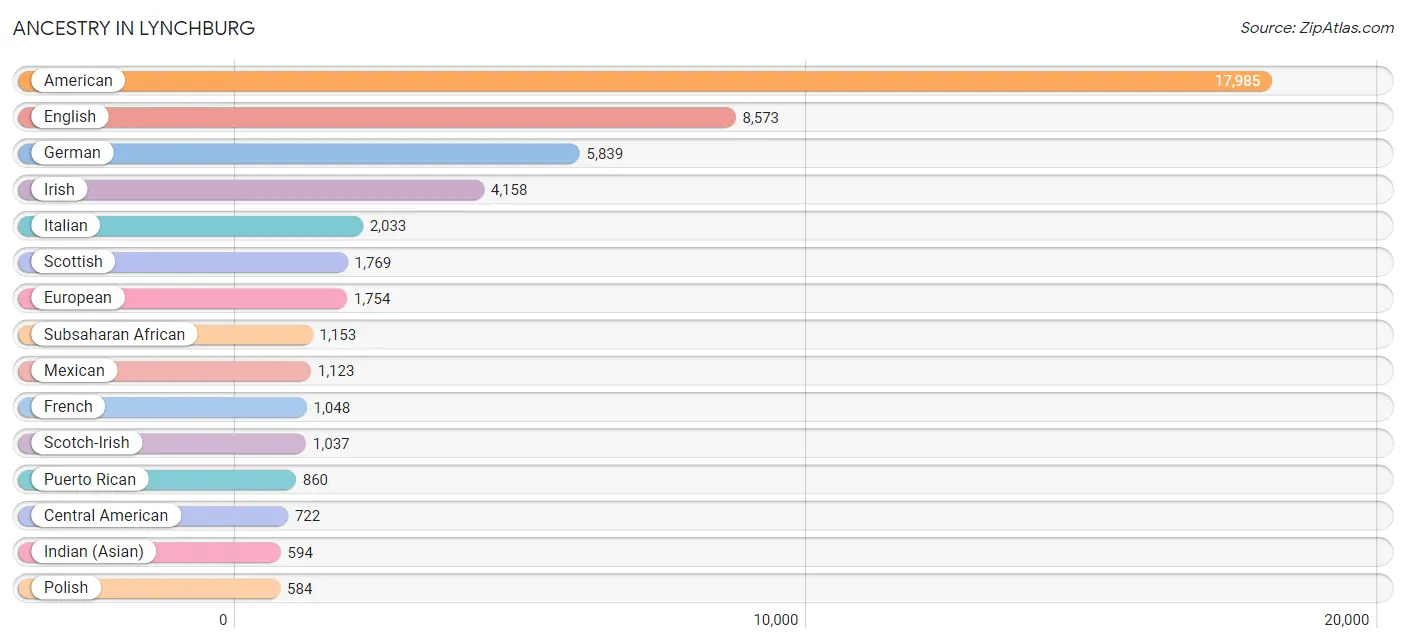
Ancestry in Lynchburg
The most populous ancestries reported in Lynchburg are American (17,985 | 22.7%), English (8,573 | 10.8%), German (5,839 | 7.4%), Irish (4,158 | 5.2%), and Italian (2,033 | 2.6%), together accounting for 48.7% of all Lynchburg residents.
| Ancestry | # Population | % Population |
| Afghan | 3 | 0.0% |
| African | 479 | 0.6% |
| Albanian | 4 | 0.0% |
| American | 17,985 | 22.7% |
| Arab | 268 | 0.3% |
| Armenian | 13 | 0.0% |
| Australian | 25 | 0.0% |
| Austrian | 68 | 0.1% |
| Belgian | 57 | 0.1% |
| Bhutanese | 228 | 0.3% |
| Blackfeet | 22 | 0.0% |
| Brazilian | 208 | 0.3% |
| British | 458 | 0.6% |
| Burmese | 484 | 0.6% |
| Cajun | 46 | 0.1% |
| Canadian | 60 | 0.1% |
| Central American | 722 | 0.9% |
| Central American Indian | 91 | 0.1% |
| Cherokee | 330 | 0.4% |
| Chickasaw | 5 | 0.0% |
| Chilean | 6 | 0.0% |
| Colombian | 39 | 0.1% |
| Costa Rican | 28 | 0.0% |
| Creek | 20 | 0.0% |
| Croatian | 16 | 0.0% |
| Cuban | 44 | 0.1% |
| Cypriot | 64 | 0.1% |
| Czech | 115 | 0.2% |
| Czechoslovakian | 16 | 0.0% |
| Danish | 120 | 0.2% |
| Dominican | 54 | 0.1% |
| Dutch | 508 | 0.6% |
| Eastern European | 109 | 0.1% |
| Ecuadorian | 17 | 0.0% |
| Egyptian | 20 | 0.0% |
| English | 8,573 | 10.8% |
| Ethiopian | 22 | 0.0% |
| European | 1,754 | 2.2% |
| Filipino | 66 | 0.1% |
| Finnish | 125 | 0.2% |
| French | 1,048 | 1.3% |
| French Canadian | 131 | 0.2% |
| German | 5,839 | 7.4% |
| Ghanaian | 67 | 0.1% |
| Greek | 170 | 0.2% |
| Guatemalan | 201 | 0.3% |
| Guyanese | 12 | 0.0% |
| Haitian | 27 | 0.0% |
| Honduran | 137 | 0.2% |
| Hungarian | 136 | 0.2% |
| Indian (Asian) | 594 | 0.7% |
| Indonesian | 2 | 0.0% |
| Iranian | 35 | 0.0% |
| Irish | 4,158 | 5.2% |
| Iroquois | 7 | 0.0% |
| Israeli | 82 | 0.1% |
| Italian | 2,033 | 2.6% |
| Jamaican | 71 | 0.1% |
| Japanese | 2 | 0.0% |
| Kenyan | 101 | 0.1% |
| Korean | 251 | 0.3% |
| Latvian | 14 | 0.0% |
| Lebanese | 184 | 0.2% |
| Lithuanian | 26 | 0.0% |
| Lumbee | 2 | 0.0% |
| Maltese | 12 | 0.0% |
| Mexican | 1,123 | 1.4% |
| Mexican American Indian | 197 | 0.3% |
| Native Hawaiian | 144 | 0.2% |
| Nicaraguan | 26 | 0.0% |
| Nigerian | 282 | 0.4% |
| Northern European | 134 | 0.2% |
| Norwegian | 427 | 0.5% |
| Ottawa | 8 | 0.0% |
| Pakistani | 303 | 0.4% |
| Palestinian | 14 | 0.0% |
| Panamanian | 64 | 0.1% |
| Pennsylvania German | 20 | 0.0% |
| Peruvian | 53 | 0.1% |
| Polish | 584 | 0.7% |
| Portuguese | 476 | 0.6% |
| Potawatomi | 4 | 0.0% |
| Puerto Rican | 860 | 1.1% |
| Puget Sound Salish | 35 | 0.0% |
| Romanian | 69 | 0.1% |
| Russian | 210 | 0.3% |
| Salvadoran | 266 | 0.3% |
| Scandinavian | 94 | 0.1% |
| Scotch-Irish | 1,037 | 1.3% |
| Scottish | 1,769 | 2.2% |
| Serbian | 4 | 0.0% |
| Sierra Leonean | 4 | 0.0% |
| Sioux | 48 | 0.1% |
| Slovak | 67 | 0.1% |
| South American | 508 | 0.6% |
| South American Indian | 19 | 0.0% |
| Spaniard | 33 | 0.0% |
| Spanish | 126 | 0.2% |
| Sri Lankan | 309 | 0.4% |
| Subsaharan African | 1,153 | 1.5% |
| Sudanese | 9 | 0.0% |
| Swedish | 373 | 0.5% |
| Swiss | 111 | 0.1% |
| Syrian | 49 | 0.1% |
| Thai | 308 | 0.4% |
| Tongan | 4 | 0.0% |
| Trinidadian and Tobagonian | 31 | 0.0% |
| Ukrainian | 101 | 0.1% |
| Uruguayan | 61 | 0.1% |
| Venezuelan | 328 | 0.4% |
| Vietnamese | 6 | 0.0% |
| Welsh | 560 | 0.7% |
| Yugoslavian | 30 | 0.0% |
| Zimbabwean | 3 | 0.0% | View All 114 Rows |
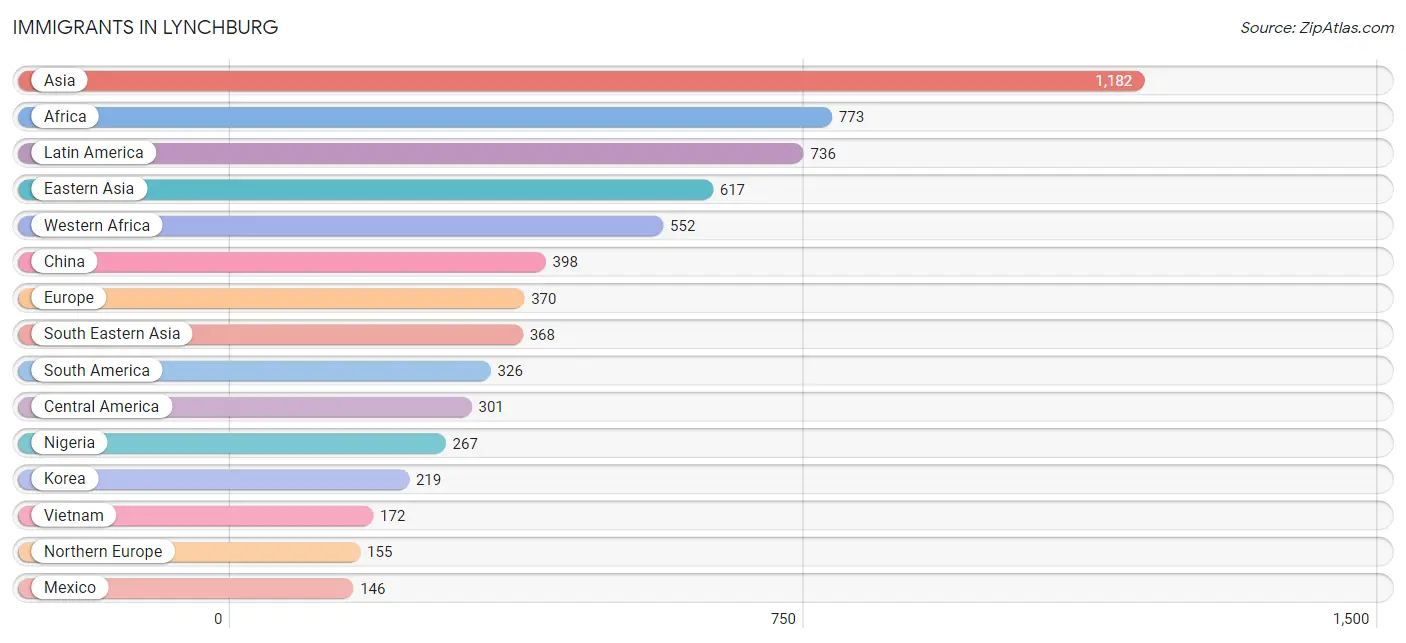
Immigrants in Lynchburg
The most numerous immigrant groups reported in Lynchburg came from Asia (1,182 | 1.5%), Africa (773 | 1.0%), Latin America (736 | 0.9%), Eastern Asia (617 | 0.8%), and Western Africa (552 | 0.7%), together accounting for 4.9% of all Lynchburg residents.
| Immigration Origin | # Population | % Population |
| Africa | 773 | 1.0% |
| Asia | 1,182 | 1.5% |
| Austria | 11 | 0.0% |
| Bangladesh | 7 | 0.0% |
| Brazil | 108 | 0.1% |
| Bulgaria | 6 | 0.0% |
| Canada | 105 | 0.1% |
| Caribbean | 109 | 0.1% |
| Central America | 301 | 0.4% |
| China | 398 | 0.5% |
| Colombia | 36 | 0.1% |
| Congo | 8 | 0.0% |
| Costa Rica | 28 | 0.0% |
| Denmark | 44 | 0.1% |
| Eastern Africa | 48 | 0.1% |
| Eastern Asia | 617 | 0.8% |
| Eastern Europe | 57 | 0.1% |
| Ecuador | 17 | 0.0% |
| Egypt | 12 | 0.0% |
| El Salvador | 56 | 0.1% |
| England | 23 | 0.0% |
| Ethiopia | 16 | 0.0% |
| Europe | 370 | 0.5% |
| Fiji | 136 | 0.2% |
| France | 8 | 0.0% |
| Germany | 77 | 0.1% |
| Ghana | 51 | 0.1% |
| Greece | 16 | 0.0% |
| Guatemala | 30 | 0.0% |
| Guyana | 11 | 0.0% |
| Haiti | 15 | 0.0% |
| Hungary | 3 | 0.0% |
| India | 89 | 0.1% |
| Israel | 11 | 0.0% |
| Italy | 9 | 0.0% |
| Jamaica | 66 | 0.1% |
| Kenya | 14 | 0.0% |
| Korea | 219 | 0.3% |
| Latin America | 736 | 0.9% |
| Lebanon | 29 | 0.0% |
| Mexico | 146 | 0.2% |
| Middle Africa | 23 | 0.0% |
| Netherlands | 15 | 0.0% |
| Nigeria | 267 | 0.3% |
| Northern Africa | 12 | 0.0% |
| Northern Europe | 155 | 0.2% |
| Oceania | 136 | 0.2% |
| Panama | 41 | 0.1% |
| Peru | 29 | 0.0% |
| Philippines | 67 | 0.1% |
| Romania | 30 | 0.0% |
| Russia | 5 | 0.0% |
| Sierra Leone | 50 | 0.1% |
| South Africa | 9 | 0.0% |
| South America | 326 | 0.4% |
| South Central Asia | 96 | 0.1% |
| South Eastern Asia | 368 | 0.5% |
| Southern Europe | 47 | 0.1% |
| Spain | 22 | 0.0% |
| Sweden | 9 | 0.0% |
| Syria | 26 | 0.0% |
| Taiwan | 99 | 0.1% |
| Thailand | 129 | 0.2% |
| Trinidad and Tobago | 15 | 0.0% |
| Uganda | 6 | 0.0% |
| Ukraine | 13 | 0.0% |
| Uruguay | 61 | 0.1% |
| Venezuela | 64 | 0.1% |
| Vietnam | 172 | 0.2% |
| Western Africa | 552 | 0.7% |
| Western Asia | 87 | 0.1% |
| Western Europe | 111 | 0.1% |
| Zimbabwe | 3 | 0.0% | View All 73 Rows |
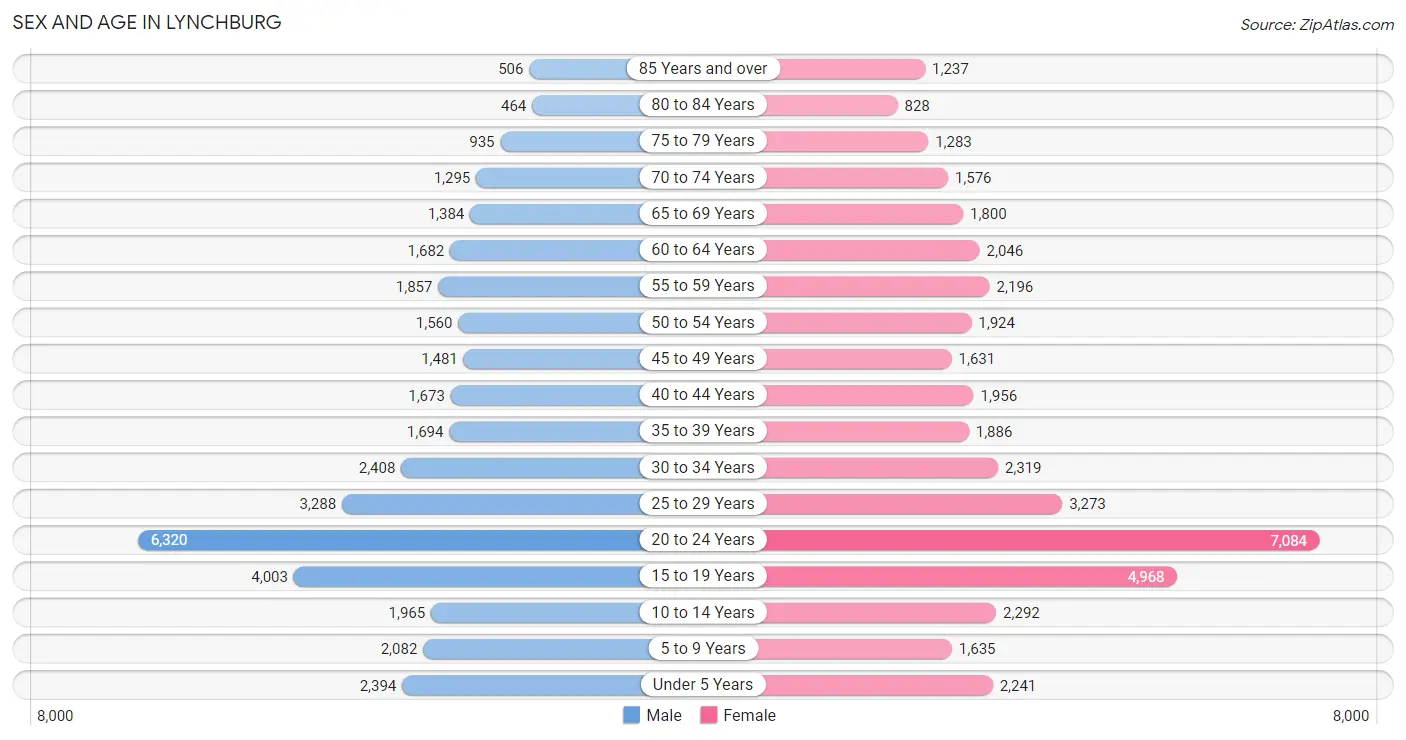
Sex and Age in Lynchburg
Sex and Age in Lynchburg
The most populous age groups in Lynchburg are 20 to 24 Years (6,320 | 17.1%) for men and 20 to 24 Years (7,084 | 16.8%) for women.
| Age Bracket | Male | Female |
| Under 5 Years | 2,394 (6.5%) | 2,241 (5.3%) |
| 5 to 9 Years | 2,082 (5.6%) | 1,635 (3.9%) |
| 10 to 14 Years | 1,965 (5.3%) | 2,292 (5.4%) |
| 15 to 19 Years | 4,003 (10.8%) | 4,968 (11.8%) |
| 20 to 24 Years | 6,320 (17.1%) | 7,084 (16.8%) |
| 25 to 29 Years | 3,288 (8.9%) | 3,273 (7.8%) |
| 30 to 34 Years | 2,408 (6.5%) | 2,319 (5.5%) |
| 35 to 39 Years | 1,694 (4.6%) | 1,886 (4.5%) |
| 40 to 44 Years | 1,673 (4.5%) | 1,956 (4.6%) |
| 45 to 49 Years | 1,481 (4.0%) | 1,631 (3.9%) |
| 50 to 54 Years | 1,560 (4.2%) | 1,924 (4.6%) |
| 55 to 59 Years | 1,857 (5.0%) | 2,196 (5.2%) |
| 60 to 64 Years | 1,682 (4.5%) | 2,046 (4.9%) |
| 65 to 69 Years | 1,384 (3.7%) | 1,800 (4.3%) |
| 70 to 74 Years | 1,295 (3.5%) | 1,576 (3.7%) |
| 75 to 79 Years | 935 (2.5%) | 1,283 (3.0%) |
| 80 to 84 Years | 464 (1.3%) | 828 (2.0%) |
| 85 Years and over | 506 (1.4%) | 1,237 (2.9%) |
| Total | 36,991 (100.0%) | 42,175 (100.0%) |
Families and Households in Lynchburg
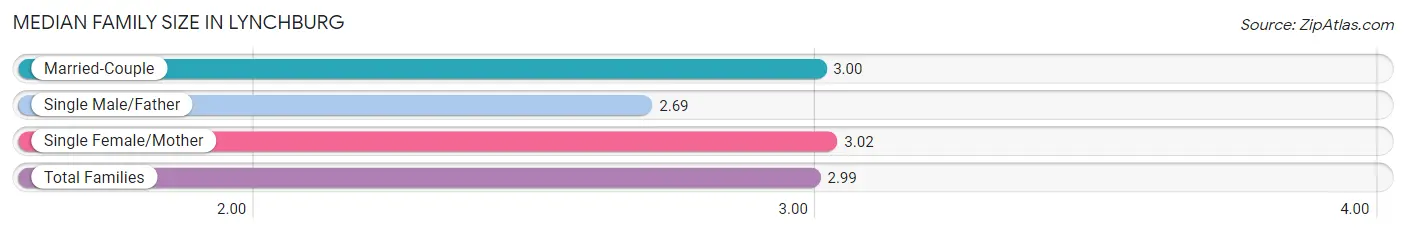
Median Family Size in Lynchburg
The median family size in Lynchburg is 2.99 persons per family, with single female/mother families (4,669 | 27.9%) accounting for the largest median family size of 3.02 persons per family. On the other hand, single male/father families (1,063 | 6.4%) represent the smallest median family size with 2.69 persons per family.
| Family Type | # Families | Family Size |
| Married-Couple | 10,999 (65.7%) | 3.00 |
| Single Male/Father | 1,063 (6.4%) | 2.69 |
| Single Female/Mother | 4,669 (27.9%) | 3.02 |
| Total Families | 16,731 (100.0%) | 2.99 |
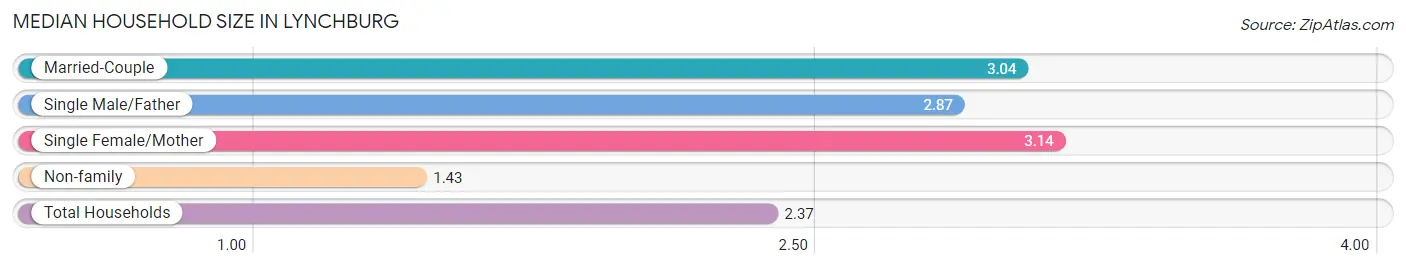
Median Household Size in Lynchburg
The median household size in Lynchburg is 2.37 persons per household, with single female/mother households (4,669 | 16.2%) accounting for the largest median household size of 3.14 persons per household. non-family households (12,179 | 42.1%) represent the smallest median household size with 1.43 persons per household.
| Household Type | # Households | Household Size |
| Married-Couple | 10,999 (38.1%) | 3.04 |
| Single Male/Father | 1,063 (3.7%) | 2.87 |
| Single Female/Mother | 4,669 (16.2%) | 3.14 |
| Non-family | 12,179 (42.1%) | 1.43 |
| Total Households | 28,910 (100.0%) | 2.37 |
Household Size by Marriage Status in Lynchburg
Out of a total of 28,910 households in Lynchburg, 16,731 (57.9%) are family households, while 12,179 (42.1%) are nonfamily households. The most numerous type of family households are 2-person households, comprising 8,926, and the most common type of nonfamily households are 1-person households, comprising 8,785.
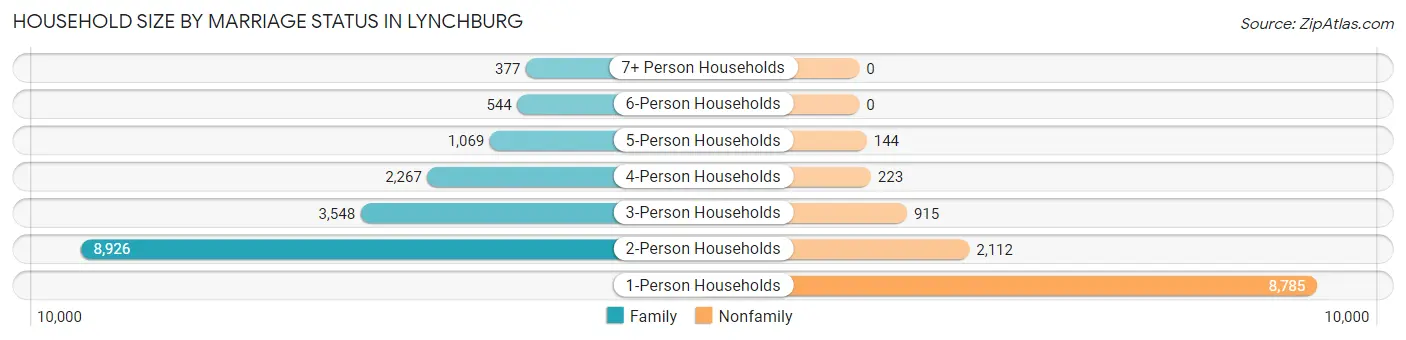
| Household Size | Family Households | Nonfamily Households |
| 1-Person Households | - | 8,785 (30.4%) |
| 2-Person Households | 8,926 (30.9%) | 2,112 (7.3%) |
| 3-Person Households | 3,548 (12.3%) | 915 (3.2%) |
| 4-Person Households | 2,267 (7.8%) | 223 (0.8%) |
| 5-Person Households | 1,069 (3.7%) | 144 (0.5%) |
| 6-Person Households | 544 (1.9%) | 0 (0.0%) |
| 7+ Person Households | 377 (1.3%) | 0 (0.0%) |
| Total | 16,731 (57.9%) | 12,179 (42.1%) |
Female Fertility in Lynchburg
Fertility by Age in Lynchburg
Average fertility rate in Lynchburg is 46.0 births per 1,000 women. Women in the age bracket of 20 to 34 years have the highest fertility rate with 64.0 births per 1,000 women. Women in the age bracket of 20 to 34 years acount for 74.3% of all women with births.
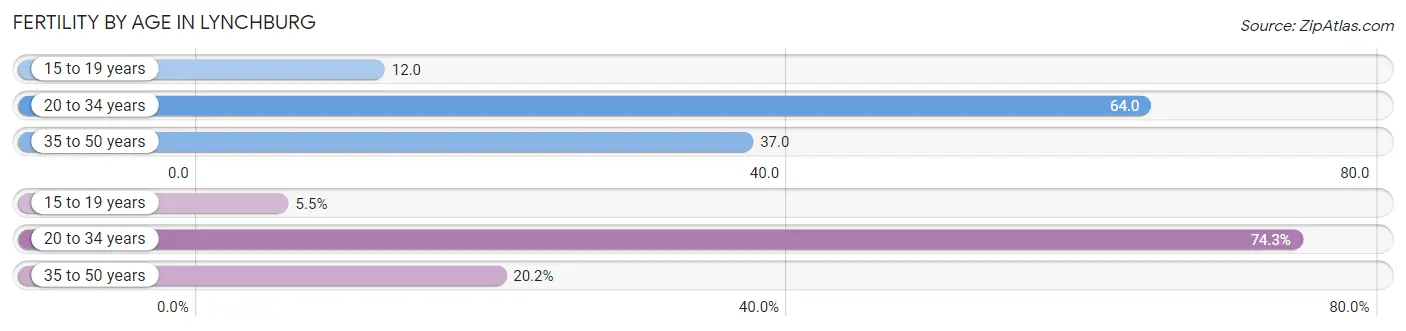
| Age Bracket | Women with Births | Births / 1,000 Women |
| 15 to 19 years | 60 (5.5%) | 12.0 |
| 20 to 34 years | 815 (74.3%) | 64.0 |
| 35 to 50 years | 222 (20.2%) | 37.0 |
| Total | 1,097 (100.0%) | 46.0 |
Fertility by Age by Marriage Status in Lynchburg
58.8% of women with births (1,097) in Lynchburg are married. The highest percentage of unmarried women with births falls into 15 to 19 years age bracket with 78.3% of them unmarried at the time of birth, while the lowest percentage of unmarried women with births belong to 35 to 50 years age bracket with 19.4% of them unmarried.
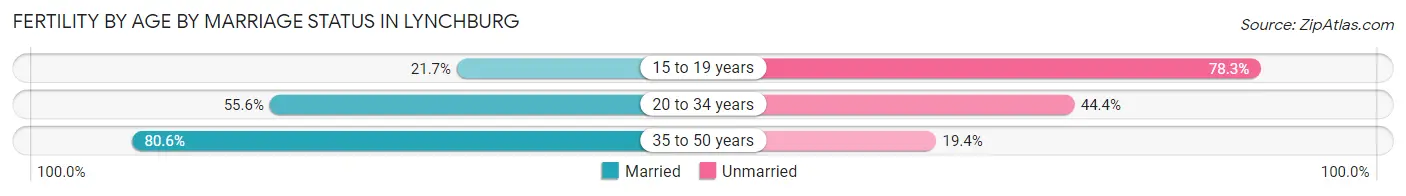
| Age Bracket | Married | Unmarried |
| 15 to 19 years | 13 (21.7%) | 47 (78.3%) |
| 20 to 34 years | 453 (55.6%) | 362 (44.4%) |
| 35 to 50 years | 179 (80.6%) | 43 (19.4%) |
| Total | 645 (58.8%) | 452 (41.2%) |
Fertility by Education in Lynchburg
Average fertility rate in Lynchburg is 46.0 births per 1,000 women. Women with the education attainment of graduate degree have the highest fertility rate of 71.0 births per 1,000 women, while women with the education attainment of less than high school have the lowest fertility at 33.0 births per 1,000 women. Women with the education attainment of college or associate's degree represent 30.3% of all women with births.
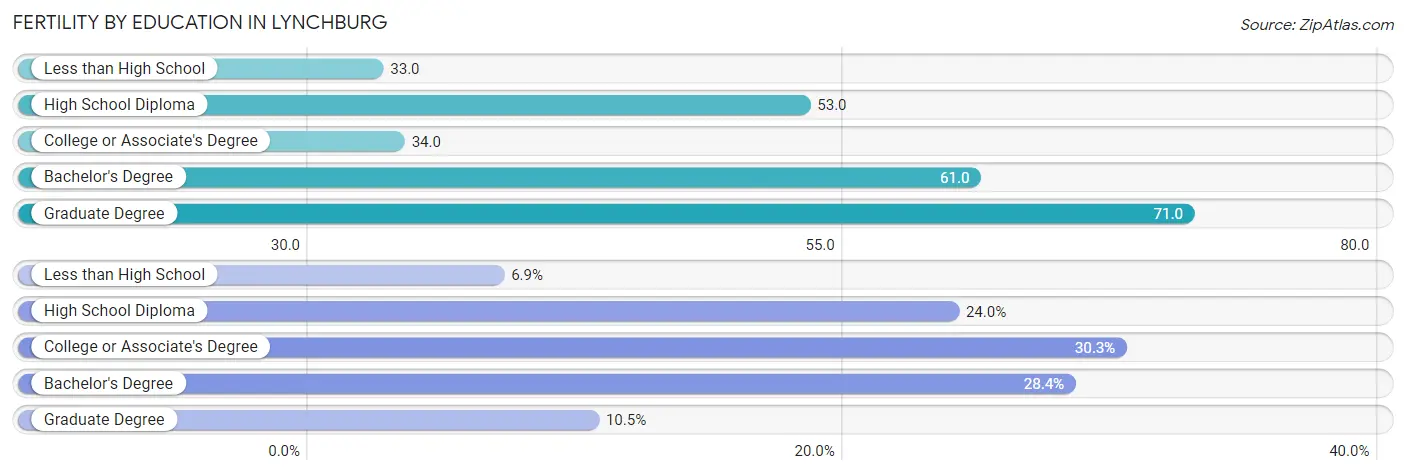
| Educational Attainment | Women with Births | Births / 1,000 Women |
| Less than High School | 76 (6.9%) | 33.0 |
| High School Diploma | 263 (24.0%) | 53.0 |
| College or Associate's Degree | 332 (30.3%) | 34.0 |
| Bachelor's Degree | 311 (28.3%) | 61.0 |
| Graduate Degree | 115 (10.5%) | 71.0 |
| Total | 1,097 (100.0%) | 46.0 |
Fertility by Education by Marriage Status in Lynchburg
41.2% of women with births in Lynchburg are unmarried. Women with the educational attainment of bachelor's degree are most likely to be married with 100.0% of them married at childbirth, while women with the educational attainment of high school diploma are least likely to be married with 87.5% of them unmarried at childbirth.
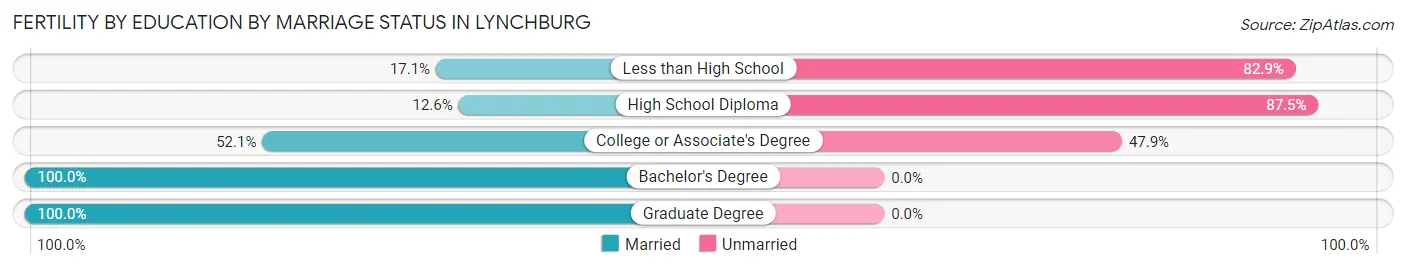
| Educational Attainment | Married | Unmarried |
| Less than High School | 13 (17.1%) | 63 (82.9%) |
| High School Diploma | 33 (12.6%) | 230 (87.5%) |
| College or Associate's Degree | 173 (52.1%) | 159 (47.9%) |
| Bachelor's Degree | 311 (100.0%) | 0 (0.0%) |
| Graduate Degree | 115 (100.0%) | 0 (0.0%) |
| Total | 645 (58.8%) | 452 (41.2%) |
Employment Characteristics in Lynchburg
Employment by Class of Employer in Lynchburg
Among the 36,027 employed individuals in Lynchburg, private company employees (23,323 | 64.7%), not-for-profit organizations (5,799 | 16.1%), and local government employees (1,980 | 5.5%) make up the most common classes of employment.
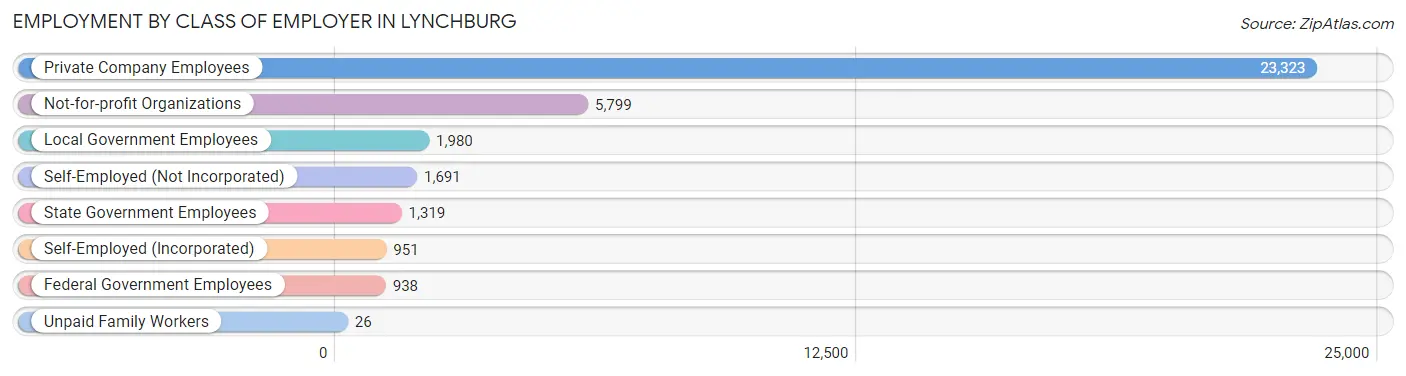
| Employer Class | # Employees | % Employees |
| Private Company Employees | 23,323 | 64.7% |
| Self-Employed (Incorporated) | 951 | 2.6% |
| Self-Employed (Not Incorporated) | 1,691 | 4.7% |
| Not-for-profit Organizations | 5,799 | 16.1% |
| Local Government Employees | 1,980 | 5.5% |
| State Government Employees | 1,319 | 3.7% |
| Federal Government Employees | 938 | 2.6% |
| Unpaid Family Workers | 26 | 0.1% |
| Total | 36,027 | 100.0% |
Employment Status by Age in Lynchburg
According to the labor force statistics for Lynchburg, out of the total population over 16 years of age (65,701), 59.3% or 38,961 individuals are in the labor force, with 5.4% or 2,104 of them unemployed. The age group with the highest labor force participation rate is 30 to 34 years, with 87.5% or 4,136 individuals in the labor force. Within the labor force, the 16 to 19 years age range has the highest percentage of unemployed individuals, with 8.3% or 226 of them being unemployed.
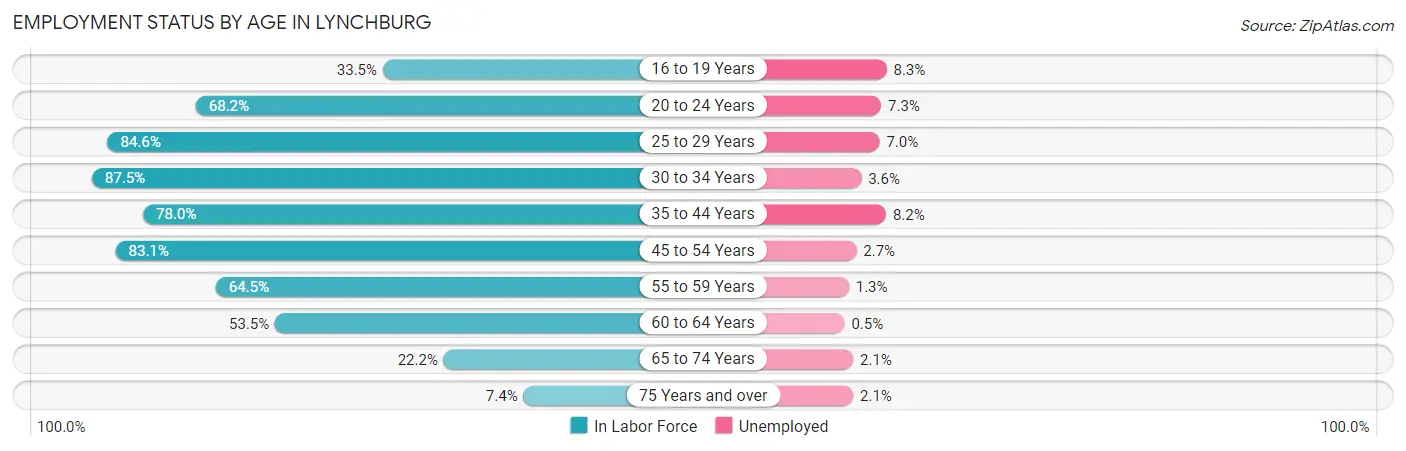
| Age Bracket | In Labor Force | Unemployed |
| 16 to 19 Years | 2,719 (33.5%) | 226 (8.3%) |
| 20 to 24 Years | 9,142 (68.2%) | 667 (7.3%) |
| 25 to 29 Years | 5,551 (84.6%) | 389 (7.0%) |
| 30 to 34 Years | 4,136 (87.5%) | 149 (3.6%) |
| 35 to 44 Years | 5,623 (78.0%) | 461 (8.2%) |
| 45 to 54 Years | 5,481 (83.1%) | 148 (2.7%) |
| 55 to 59 Years | 2,614 (64.5%) | 34 (1.3%) |
| 60 to 64 Years | 1,994 (53.5%) | 10 (0.5%) |
| 65 to 74 Years | 1,344 (22.2%) | 28 (2.1%) |
| 75 Years and over | 389 (7.4%) | 8 (2.1%) |
| Total | 38,961 (59.3%) | 2,104 (5.4%) |
Employment Status by Educational Attainment in Lynchburg
According to labor force statistics for Lynchburg, 77.2% of individuals (25,379) out of the total population between 25 and 64 years of age (32,874) are in the labor force, with 4.7% or 1,193 of them being unemployed. The group with the highest labor force participation rate are those with the educational attainment of bachelor's degree or higher, with 85.3% or 10,919 individuals in the labor force. Within the labor force, individuals with high school diploma education have the highest percentage of unemployment, with 9.0% or 470 of them being unemployed.
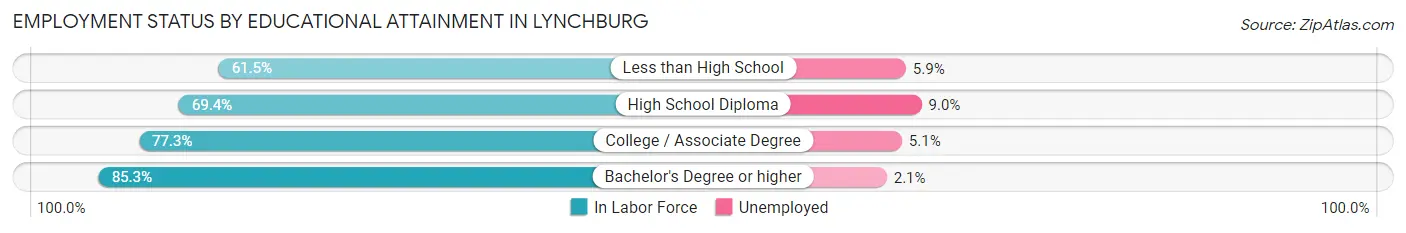
| Educational Attainment | In Labor Force | Unemployed |
| Less than High School | 1,760 (61.5%) | 169 (5.9%) |
| High School Diploma | 5,223 (69.4%) | 677 (9.0%) |
| College / Associate Degree | 7,487 (77.3%) | 494 (5.1%) |
| Bachelor's Degree or higher | 10,919 (85.3%) | 269 (2.1%) |
| Total | 25,379 (77.2%) | 1,545 (4.7%) |
Employment Occupations by Sex in Lynchburg
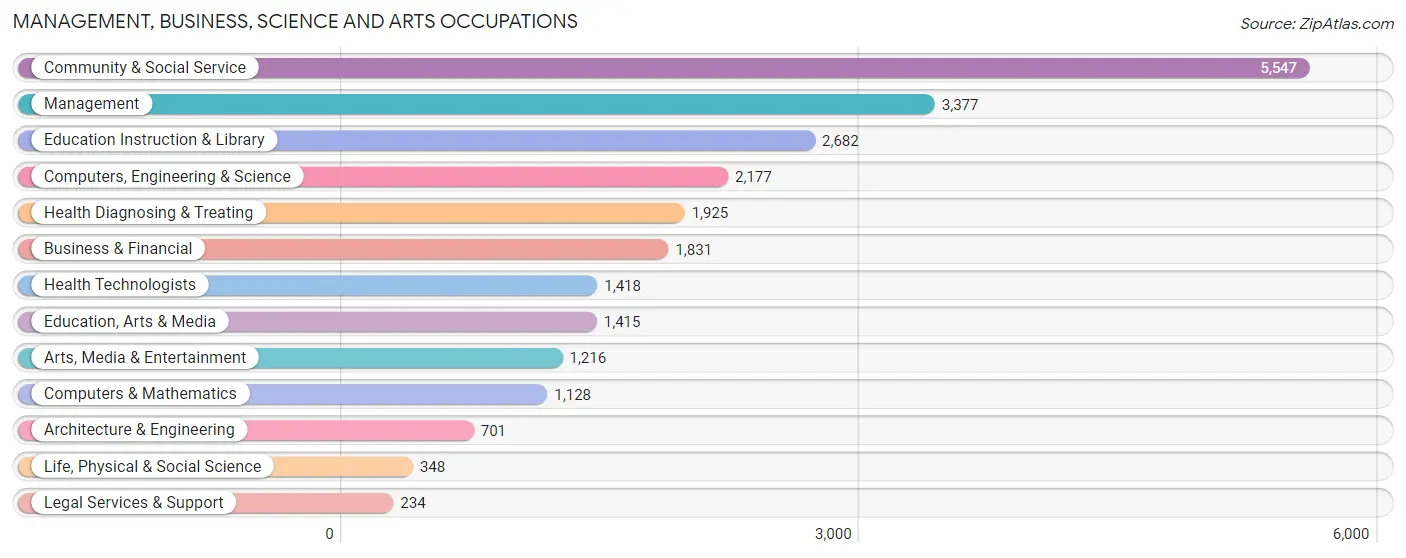
Management, Business, Science and Arts Occupations
The most common Management, Business, Science and Arts occupations in Lynchburg are Community & Social Service (5,547 | 15.2%), Management (3,377 | 9.2%), Education Instruction & Library (2,682 | 7.3%), Computers, Engineering & Science (2,177 | 6.0%), and Health Diagnosing & Treating (1,925 | 5.3%).
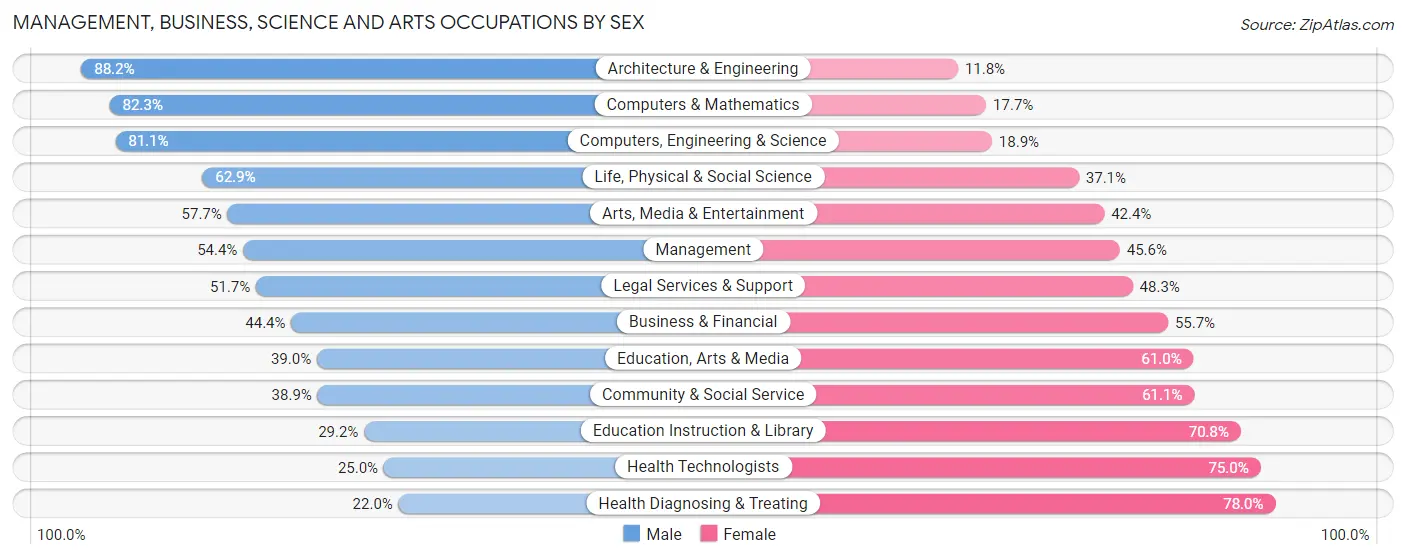
Management, Business, Science and Arts Occupations by Sex
Within the Management, Business, Science and Arts occupations in Lynchburg, the most male-oriented occupations are Architecture & Engineering (88.2%), Computers & Mathematics (82.3%), and Computers, Engineering & Science (81.1%), while the most female-oriented occupations are Health Diagnosing & Treating (78.0%), Health Technologists (75.0%), and Education Instruction & Library (70.8%).
| Occupation | Male | Female |
| Management | 1,837 (54.4%) | 1,540 (45.6%) |
| Business & Financial | 812 (44.4%) | 1,019 (55.6%) |
| Computers, Engineering & Science | 1,765 (81.1%) | 412 (18.9%) |
| Computers & Mathematics | 928 (82.3%) | 200 (17.7%) |
| Architecture & Engineering | 618 (88.2%) | 83 (11.8%) |
| Life, Physical & Social Science | 219 (62.9%) | 129 (37.1%) |
| Community & Social Service | 2,156 (38.9%) | 3,391 (61.1%) |
| Education, Arts & Media | 552 (39.0%) | 863 (61.0%) |
| Legal Services & Support | 121 (51.7%) | 113 (48.3%) |
| Education Instruction & Library | 782 (29.2%) | 1,900 (70.8%) |
| Arts, Media & Entertainment | 701 (57.7%) | 515 (42.3%) |
| Health Diagnosing & Treating | 423 (22.0%) | 1,502 (78.0%) |
| Health Technologists | 355 (25.0%) | 1,063 (75.0%) |
| Total (Category) | 6,993 (47.1%) | 7,864 (52.9%) |
| Total (Overall) | 18,012 (49.3%) | 18,538 (50.7%) |
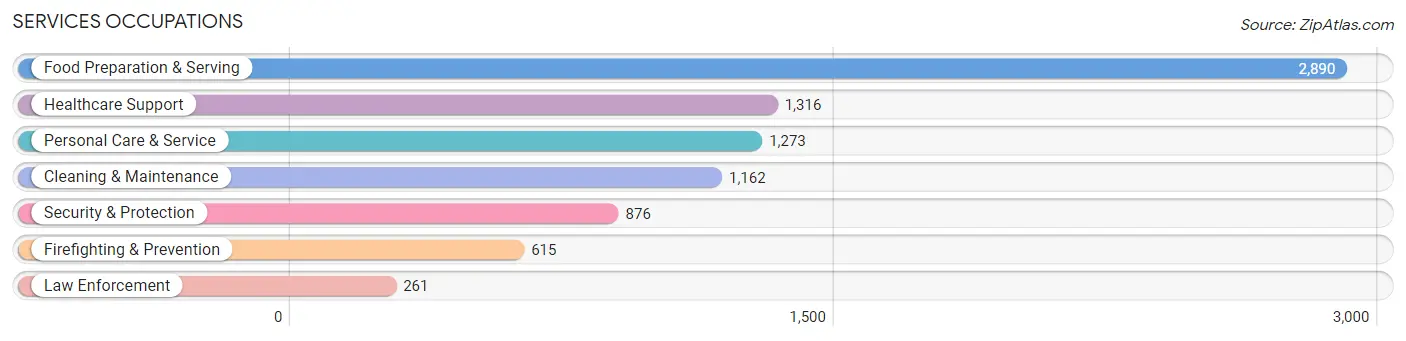
Services Occupations
The most common Services occupations in Lynchburg are Food Preparation & Serving (2,890 | 7.9%), Healthcare Support (1,316 | 3.6%), Personal Care & Service (1,273 | 3.5%), Cleaning & Maintenance (1,162 | 3.2%), and Security & Protection (876 | 2.4%).
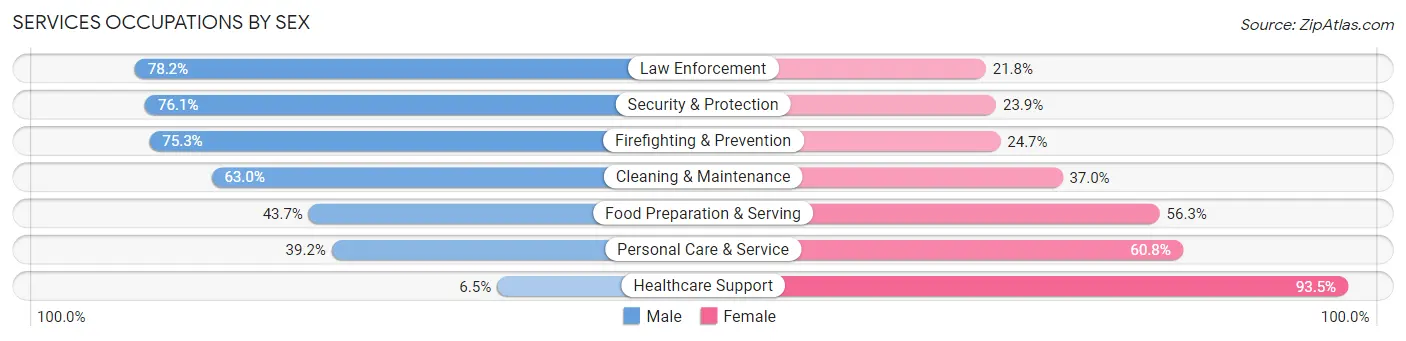
Services Occupations by Sex
Within the Services occupations in Lynchburg, the most male-oriented occupations are Law Enforcement (78.2%), Security & Protection (76.1%), and Firefighting & Prevention (75.3%), while the most female-oriented occupations are Healthcare Support (93.5%), Personal Care & Service (60.8%), and Food Preparation & Serving (56.3%).
| Occupation | Male | Female |
| Healthcare Support | 85 (6.5%) | 1,231 (93.5%) |
| Security & Protection | 667 (76.1%) | 209 (23.9%) |
| Firefighting & Prevention | 463 (75.3%) | 152 (24.7%) |
| Law Enforcement | 204 (78.2%) | 57 (21.8%) |
| Food Preparation & Serving | 1,264 (43.7%) | 1,626 (56.3%) |
| Cleaning & Maintenance | 732 (63.0%) | 430 (37.0%) |
| Personal Care & Service | 499 (39.2%) | 774 (60.8%) |
| Total (Category) | 3,247 (43.2%) | 4,270 (56.8%) |
| Total (Overall) | 18,012 (49.3%) | 18,538 (50.7%) |
Sales and Office Occupations
The most common Sales and Office occupations in Lynchburg are Office & Administration (4,003 | 11.0%), and Sales & Related (3,287 | 9.0%).

Sales and Office Occupations by Sex
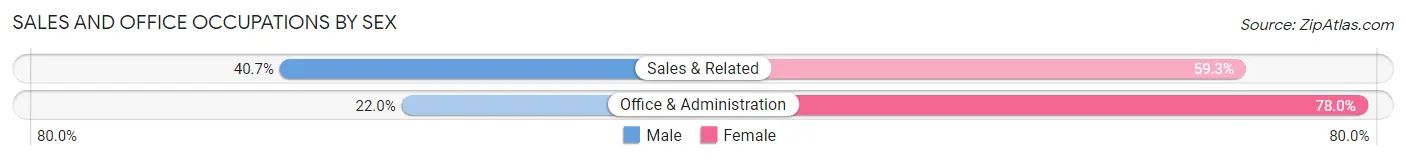
| Occupation | Male | Female |
| Sales & Related | 1,339 (40.7%) | 1,948 (59.3%) |
| Office & Administration | 881 (22.0%) | 3,122 (78.0%) |
| Total (Category) | 2,220 (30.4%) | 5,070 (69.6%) |
| Total (Overall) | 18,012 (49.3%) | 18,538 (50.7%) |
Natural Resources, Construction and Maintenance Occupations
The most common Natural Resources, Construction and Maintenance occupations in Lynchburg are Construction & Extraction (1,264 | 3.5%), Installation, Maintenance & Repair (682 | 1.9%), and Farming, Fishing & Forestry (148 | 0.4%).

Natural Resources, Construction and Maintenance Occupations by Sex
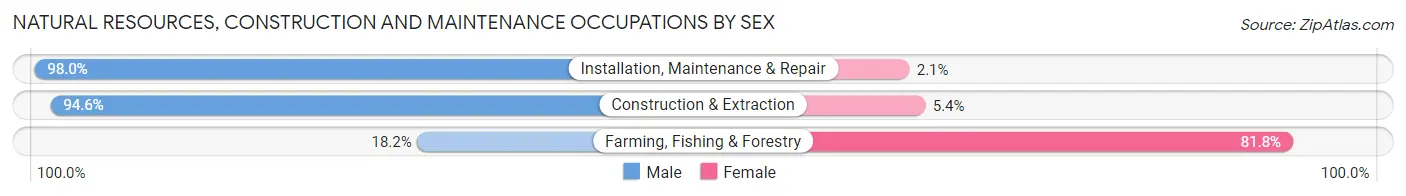
| Occupation | Male | Female |
| Farming, Fishing & Forestry | 27 (18.2%) | 121 (81.8%) |
| Construction & Extraction | 1,196 (94.6%) | 68 (5.4%) |
| Installation, Maintenance & Repair | 668 (98.0%) | 14 (2.1%) |
| Total (Category) | 1,891 (90.3%) | 203 (9.7%) |
| Total (Overall) | 18,012 (49.3%) | 18,538 (50.7%) |
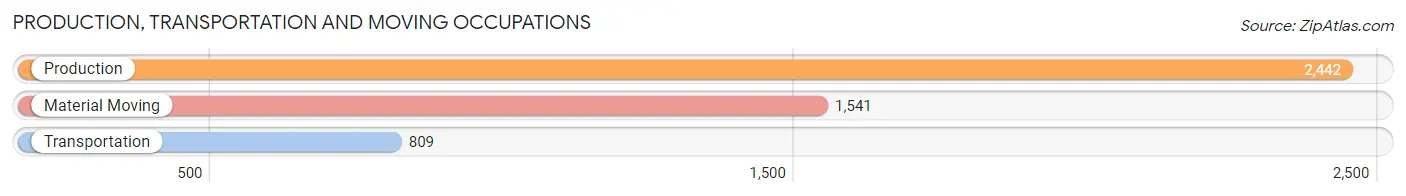
Production, Transportation and Moving Occupations
The most common Production, Transportation and Moving occupations in Lynchburg are Production (2,442 | 6.7%), Material Moving (1,541 | 4.2%), and Transportation (809 | 2.2%).
Production, Transportation and Moving Occupations by Sex
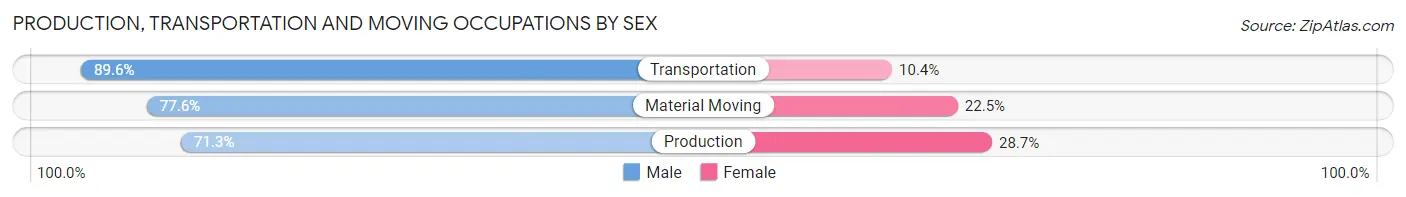
| Occupation | Male | Female |
| Production | 1,741 (71.3%) | 701 (28.7%) |
| Transportation | 725 (89.6%) | 84 (10.4%) |
| Material Moving | 1,195 (77.5%) | 346 (22.5%) |
| Total (Category) | 3,661 (76.4%) | 1,131 (23.6%) |
| Total (Overall) | 18,012 (49.3%) | 18,538 (50.7%) |
Employment Industries by Sex in Lynchburg
Employment Industries in Lynchburg
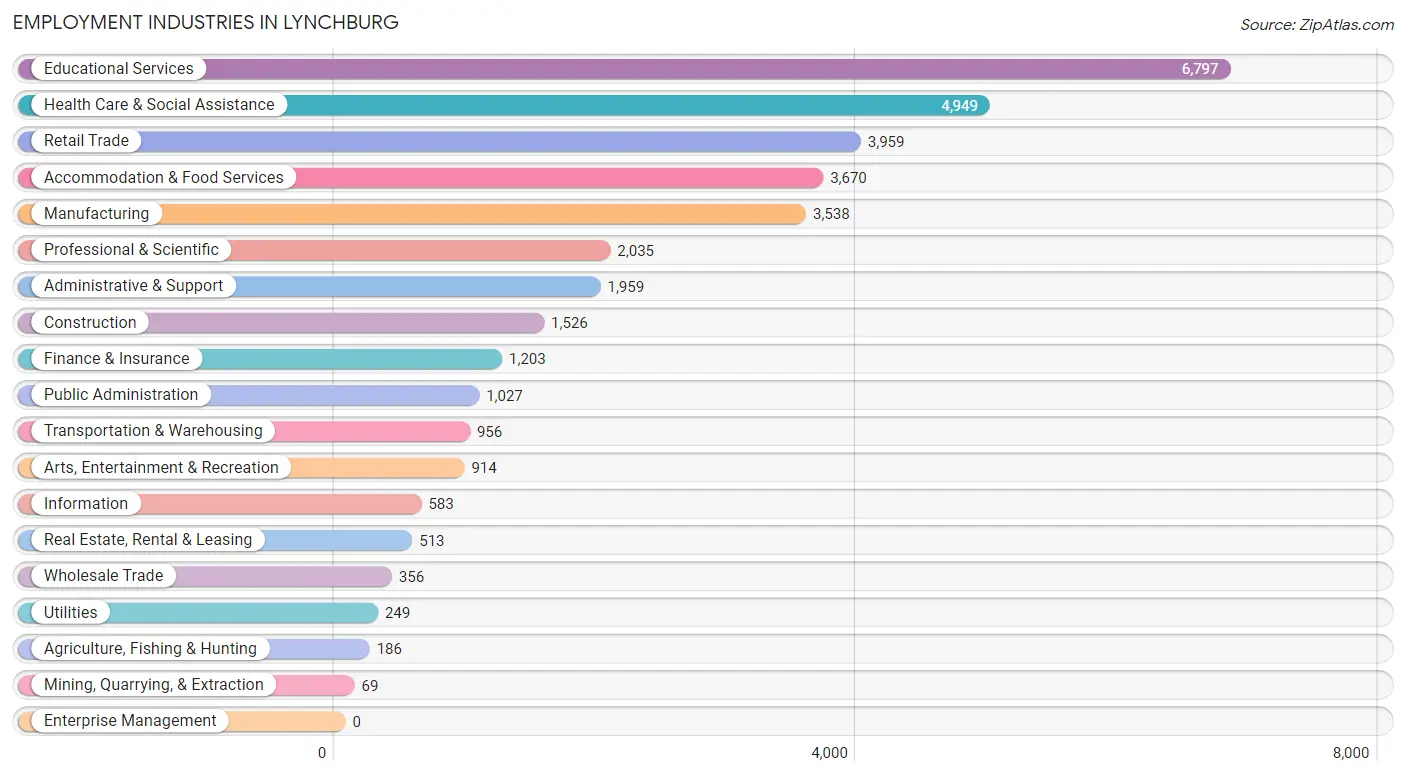
The major employment industries in Lynchburg include Educational Services (6,797 | 18.6%), Health Care & Social Assistance (4,949 | 13.5%), Retail Trade (3,959 | 10.8%), Accommodation & Food Services (3,670 | 10.0%), and Manufacturing (3,538 | 9.7%).
Employment Industries by Sex in Lynchburg
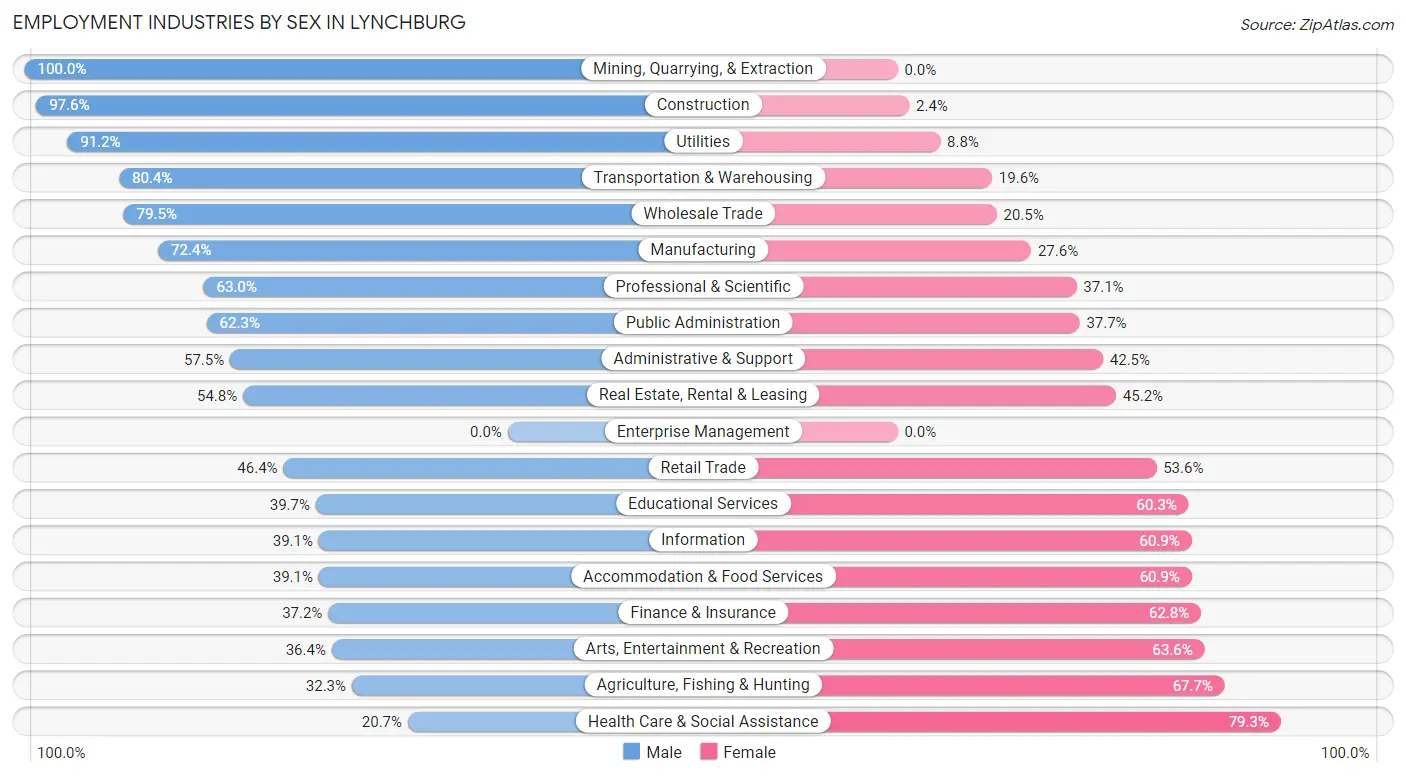
The Lynchburg industries that see more men than women are Mining, Quarrying, & Extraction (100.0%), Construction (97.6%), and Utilities (91.2%), whereas the industries that tend to have a higher number of women are Health Care & Social Assistance (79.3%), Agriculture, Fishing & Hunting (67.7%), and Arts, Entertainment & Recreation (63.6%).
| Industry | Male | Female |
| Agriculture, Fishing & Hunting | 60 (32.3%) | 126 (67.7%) |
| Mining, Quarrying, & Extraction | 69 (100.0%) | 0 (0.0%) |
| Construction | 1,489 (97.6%) | 37 (2.4%) |
| Manufacturing | 2,560 (72.4%) | 978 (27.6%) |
| Wholesale Trade | 283 (79.5%) | 73 (20.5%) |
| Retail Trade | 1,838 (46.4%) | 2,121 (53.6%) |
| Transportation & Warehousing | 769 (80.4%) | 187 (19.6%) |
| Utilities | 227 (91.2%) | 22 (8.8%) |
| Information | 228 (39.1%) | 355 (60.9%) |
| Finance & Insurance | 447 (37.2%) | 756 (62.8%) |
| Real Estate, Rental & Leasing | 281 (54.8%) | 232 (45.2%) |
| Professional & Scientific | 1,281 (62.9%) | 754 (37.0%) |
| Enterprise Management | 0 (0.0%) | 0 (0.0%) |
| Administrative & Support | 1,126 (57.5%) | 833 (42.5%) |
| Educational Services | 2,700 (39.7%) | 4,097 (60.3%) |
| Health Care & Social Assistance | 1,023 (20.7%) | 3,926 (79.3%) |
| Arts, Entertainment & Recreation | 333 (36.4%) | 581 (63.6%) |
| Accommodation & Food Services | 1,435 (39.1%) | 2,235 (60.9%) |
| Public Administration | 640 (62.3%) | 387 (37.7%) |
| Total | 18,012 (49.3%) | 18,538 (50.7%) |
Education in Lynchburg
School Enrollment in Lynchburg
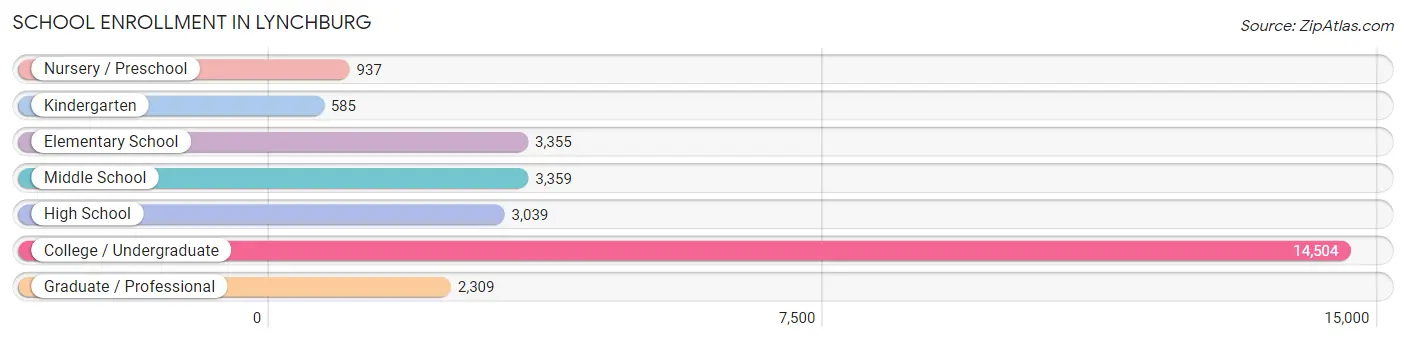
The most common levels of schooling among the 28,088 students in Lynchburg are college / undergraduate (14,504 | 51.6%), middle school (3,359 | 12.0%), and elementary school (3,355 | 11.9%).
| School Level | # Students | % Students |
| Nursery / Preschool | 937 | 3.3% |
| Kindergarten | 585 | 2.1% |
| Elementary School | 3,355 | 11.9% |
| Middle School | 3,359 | 12.0% |
| High School | 3,039 | 10.8% |
| College / Undergraduate | 14,504 | 51.6% |
| Graduate / Professional | 2,309 | 8.2% |
| Total | 28,088 | 100.0% |
School Enrollment by Age by Funding Source in Lynchburg
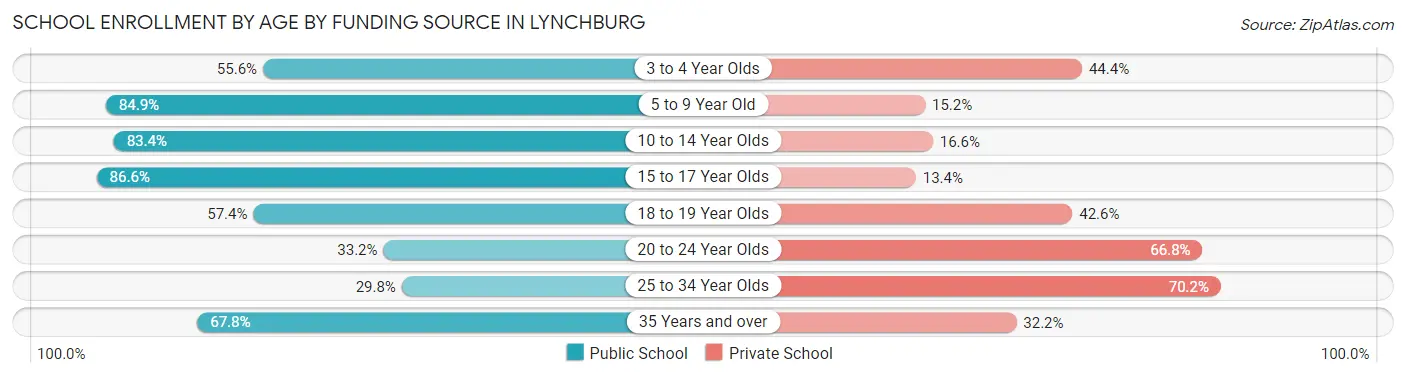
Out of a total of 28,088 students who are enrolled in schools in Lynchburg, 11,685 (41.6%) attend a private institution, while the remaining 16,403 (58.4%) are enrolled in public schools. The age group of 25 to 34 year olds has the highest likelihood of being enrolled in private schools, with 1,303 (70.2% in the age bracket) enrolled. Conversely, the age group of 15 to 17 year olds has the lowest likelihood of being enrolled in a private school, with 2,056 (86.6% in the age bracket) attending a public institution.
| Age Bracket | Public School | Private School |
| 3 to 4 Year Olds | 461 (55.6%) | 368 (44.4%) |
| 5 to 9 Year Old | 3,025 (84.9%) | 540 (15.1%) |
| 10 to 14 Year Olds | 3,516 (83.4%) | 700 (16.6%) |
| 15 to 17 Year Olds | 2,056 (86.6%) | 319 (13.4%) |
| 18 to 19 Year Olds | 3,454 (57.4%) | 2,562 (42.6%) |
| 20 to 24 Year Olds | 2,806 (33.2%) | 5,652 (66.8%) |
| 25 to 34 Year Olds | 552 (29.8%) | 1,303 (70.2%) |
| 35 Years and over | 525 (67.8%) | 249 (32.2%) |
| Total | 16,403 (58.4%) | 11,685 (41.6%) |
Educational Attainment by Field of Study in Lynchburg
Business (2,721 | 15.0%), education (2,094 | 11.5%), science & technology (1,864 | 10.2%), social sciences (1,337 | 7.4%), and literature & languages (1,327 | 7.3%) are the most common fields of study among 18,178 individuals in Lynchburg who have obtained a bachelor's degree or higher.
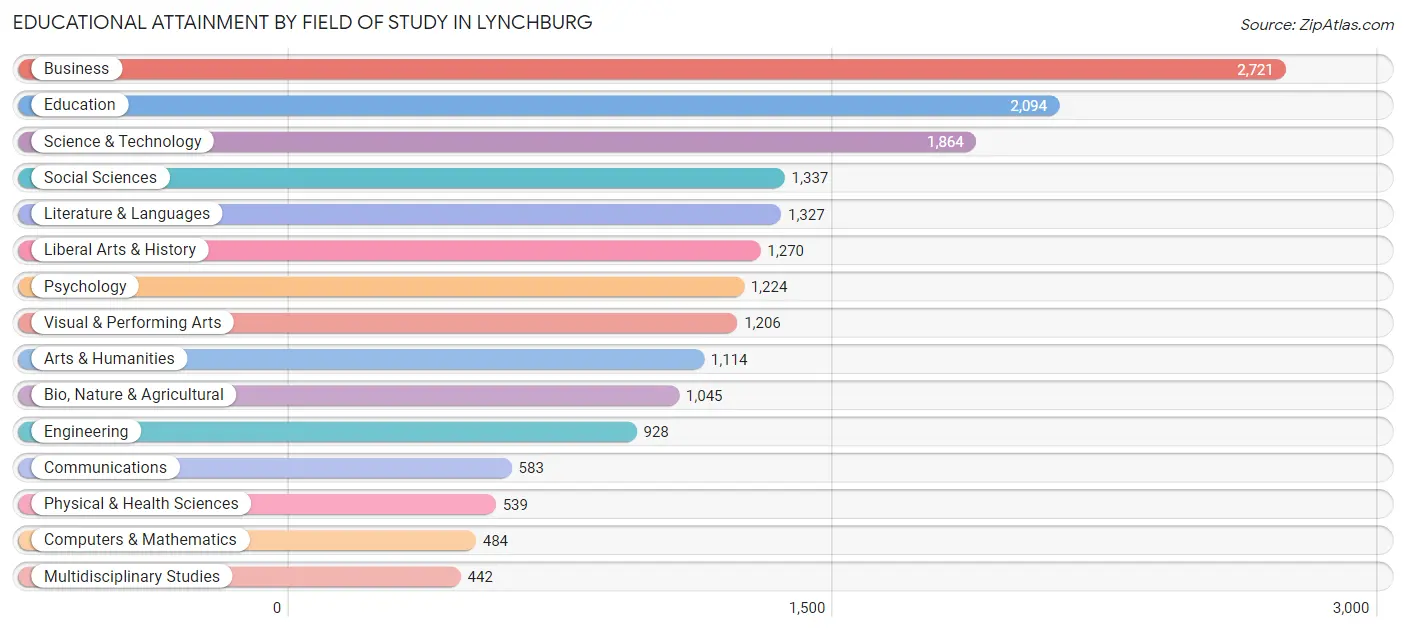
| Field of Study | # Graduates | % Graduates |
| Computers & Mathematics | 484 | 2.7% |
| Bio, Nature & Agricultural | 1,045 | 5.8% |
| Physical & Health Sciences | 539 | 3.0% |
| Psychology | 1,224 | 6.7% |
| Social Sciences | 1,337 | 7.4% |
| Engineering | 928 | 5.1% |
| Multidisciplinary Studies | 442 | 2.4% |
| Science & Technology | 1,864 | 10.2% |
| Business | 2,721 | 15.0% |
| Education | 2,094 | 11.5% |
| Literature & Languages | 1,327 | 7.3% |
| Liberal Arts & History | 1,270 | 7.0% |
| Visual & Performing Arts | 1,206 | 6.6% |
| Communications | 583 | 3.2% |
| Arts & Humanities | 1,114 | 6.1% |
| Total | 18,178 | 100.0% |
Transportation & Commute in Lynchburg
Vehicle Availability by Sex in Lynchburg
The most prevalent vehicle ownership categories in Lynchburg are males with 2 vehicles (7,886, accounting for 47.5%) and females with 2 vehicles (6,752, making up 46.9%).
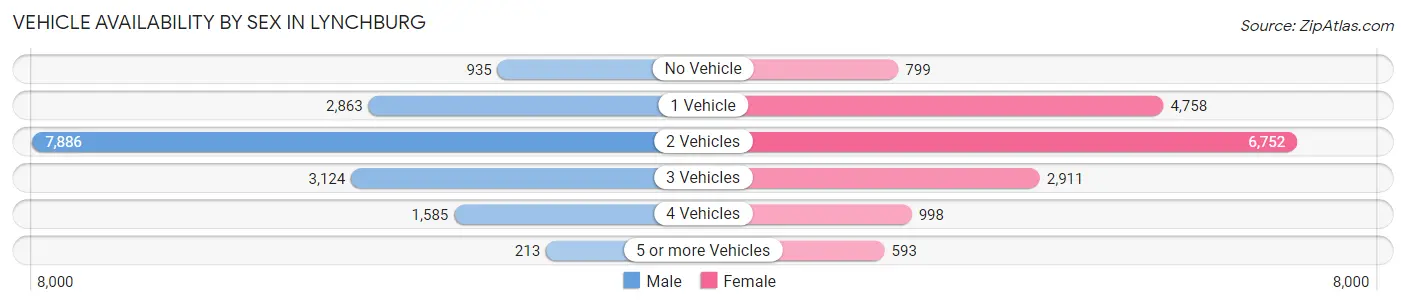
| Vehicles Available | Male | Female |
| No Vehicle | 935 (5.6%) | 799 (4.8%) |
| 1 Vehicle | 2,863 (17.2%) | 4,758 (28.3%) |
| 2 Vehicles | 7,886 (47.5%) | 6,752 (40.2%) |
| 3 Vehicles | 3,124 (18.8%) | 2,911 (17.3%) |
| 4 Vehicles | 1,585 (9.5%) | 998 (5.9%) |
| 5 or more Vehicles | 213 (1.3%) | 593 (3.5%) |
| Total | 16,606 (100.0%) | 16,811 (100.0%) |
Commute Time in Lynchburg
The most frequently occuring commute durations in Lynchburg are 10 to 14 minutes (8,922 commuters, 27.4%), 15 to 19 minutes (7,317 commuters, 22.5%), and 5 to 9 minutes (5,549 commuters, 17.1%).
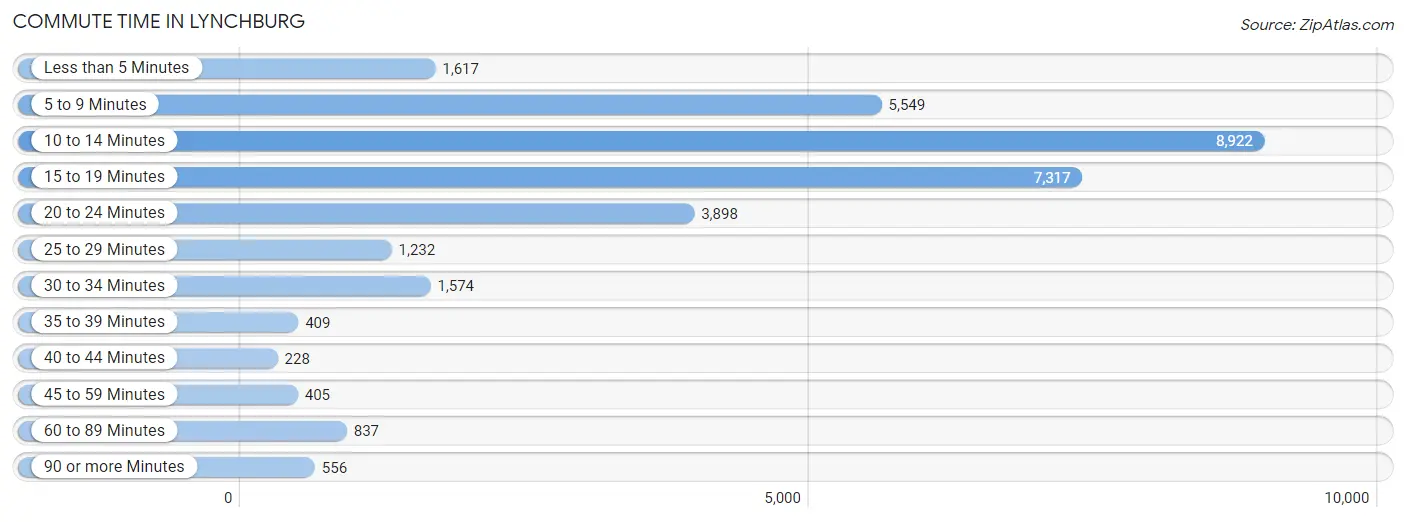
| Commute Time | # Commuters | % Commuters |
| Less than 5 Minutes | 1,617 | 5.0% |
| 5 to 9 Minutes | 5,549 | 17.1% |
| 10 to 14 Minutes | 8,922 | 27.4% |
| 15 to 19 Minutes | 7,317 | 22.5% |
| 20 to 24 Minutes | 3,898 | 12.0% |
| 25 to 29 Minutes | 1,232 | 3.8% |
| 30 to 34 Minutes | 1,574 | 4.8% |
| 35 to 39 Minutes | 409 | 1.3% |
| 40 to 44 Minutes | 228 | 0.7% |
| 45 to 59 Minutes | 405 | 1.2% |
| 60 to 89 Minutes | 837 | 2.6% |
| 90 or more Minutes | 556 | 1.7% |
Commute Time by Sex in Lynchburg
The most common commute times in Lynchburg are 10 to 14 minutes (4,164 commuters, 25.7%) for males and 10 to 14 minutes (4,758 commuters, 29.1%) for females.
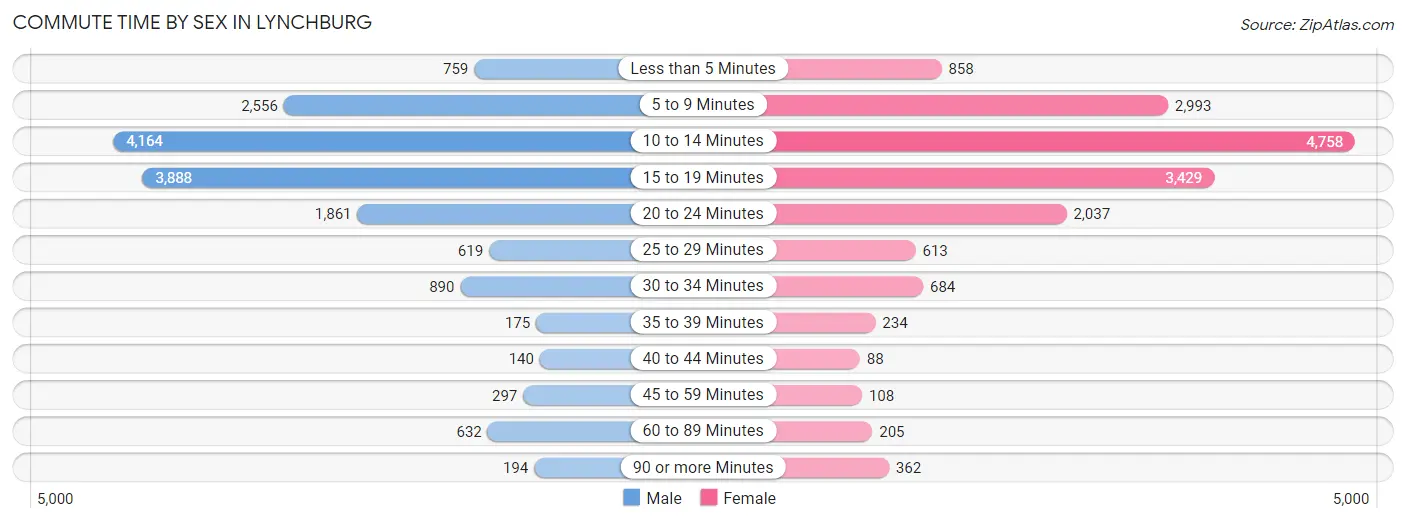
| Commute Time | Male | Female |
| Less than 5 Minutes | 759 (4.7%) | 858 (5.2%) |
| 5 to 9 Minutes | 2,556 (15.8%) | 2,993 (18.3%) |
| 10 to 14 Minutes | 4,164 (25.7%) | 4,758 (29.1%) |
| 15 to 19 Minutes | 3,888 (24.0%) | 3,429 (20.9%) |
| 20 to 24 Minutes | 1,861 (11.5%) | 2,037 (12.4%) |
| 25 to 29 Minutes | 619 (3.8%) | 613 (3.7%) |
| 30 to 34 Minutes | 890 (5.5%) | 684 (4.2%) |
| 35 to 39 Minutes | 175 (1.1%) | 234 (1.4%) |
| 40 to 44 Minutes | 140 (0.9%) | 88 (0.5%) |
| 45 to 59 Minutes | 297 (1.8%) | 108 (0.7%) |
| 60 to 89 Minutes | 632 (3.9%) | 205 (1.3%) |
| 90 or more Minutes | 194 (1.2%) | 362 (2.2%) |
Time of Departure to Work by Sex in Lynchburg
The most frequent times of departure to work in Lynchburg are 8:00 AM to 8:29 AM (2,214, 13.7%) for males and 7:30 AM to 7:59 AM (2,747, 16.8%) for females.
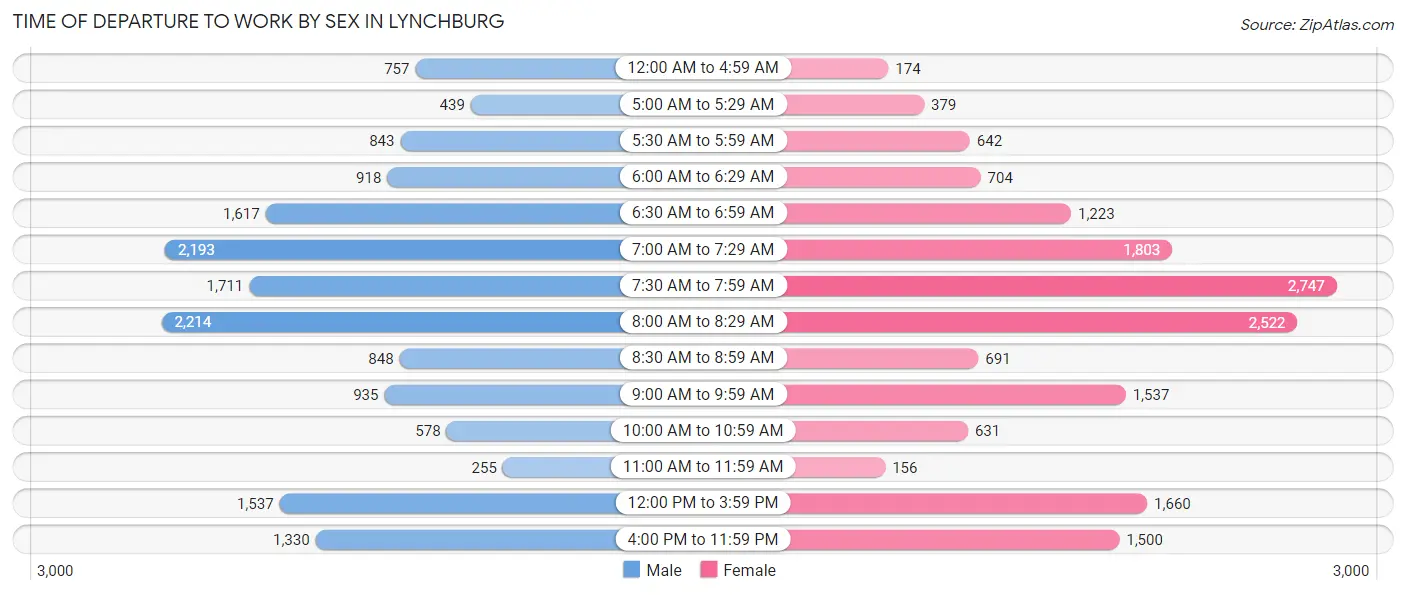
| Time of Departure | Male | Female |
| 12:00 AM to 4:59 AM | 757 (4.7%) | 174 (1.1%) |
| 5:00 AM to 5:29 AM | 439 (2.7%) | 379 (2.3%) |
| 5:30 AM to 5:59 AM | 843 (5.2%) | 642 (3.9%) |
| 6:00 AM to 6:29 AM | 918 (5.7%) | 704 (4.3%) |
| 6:30 AM to 6:59 AM | 1,617 (10.0%) | 1,223 (7.5%) |
| 7:00 AM to 7:29 AM | 2,193 (13.6%) | 1,803 (11.0%) |
| 7:30 AM to 7:59 AM | 1,711 (10.6%) | 2,747 (16.8%) |
| 8:00 AM to 8:29 AM | 2,214 (13.7%) | 2,522 (15.4%) |
| 8:30 AM to 8:59 AM | 848 (5.2%) | 691 (4.2%) |
| 9:00 AM to 9:59 AM | 935 (5.8%) | 1,537 (9.4%) |
| 10:00 AM to 10:59 AM | 578 (3.6%) | 631 (3.8%) |
| 11:00 AM to 11:59 AM | 255 (1.6%) | 156 (0.9%) |
| 12:00 PM to 3:59 PM | 1,537 (9.5%) | 1,660 (10.1%) |
| 4:00 PM to 11:59 PM | 1,330 (8.2%) | 1,500 (9.2%) |
| Total | 16,175 (100.0%) | 16,369 (100.0%) |
Housing Occupancy in Lynchburg
Occupancy by Ownership in Lynchburg
Of the total 28,910 dwellings in Lynchburg, owner-occupied units account for 14,084 (48.7%), while renter-occupied units make up 14,826 (51.3%).
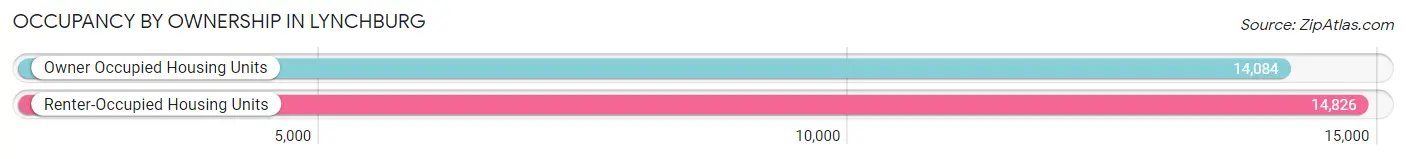
| Occupancy | # Housing Units | % Housing Units |
| Owner Occupied Housing Units | 14,084 | 48.7% |
| Renter-Occupied Housing Units | 14,826 | 51.3% |
| Total Occupied Housing Units | 28,910 | 100.0% |
Occupancy by Household Size in Lynchburg
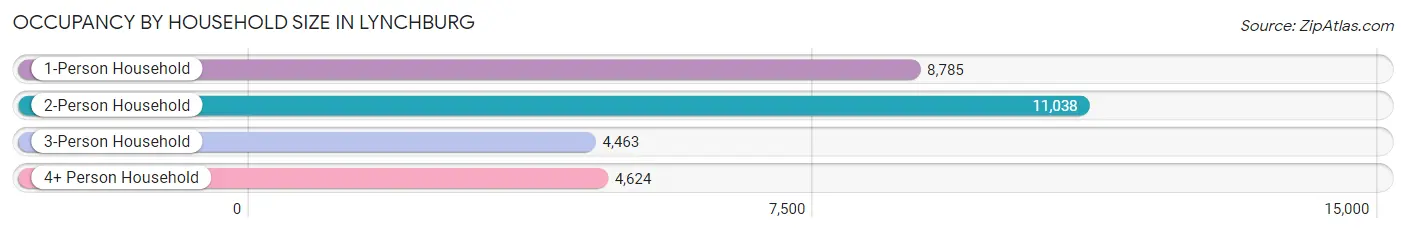
| Household Size | # Housing Units | % Housing Units |
| 1-Person Household | 8,785 | 30.4% |
| 2-Person Household | 11,038 | 38.2% |
| 3-Person Household | 4,463 | 15.4% |
| 4+ Person Household | 4,624 | 16.0% |
| Total Housing Units | 28,910 | 100.0% |
Occupancy by Ownership by Household Size in Lynchburg
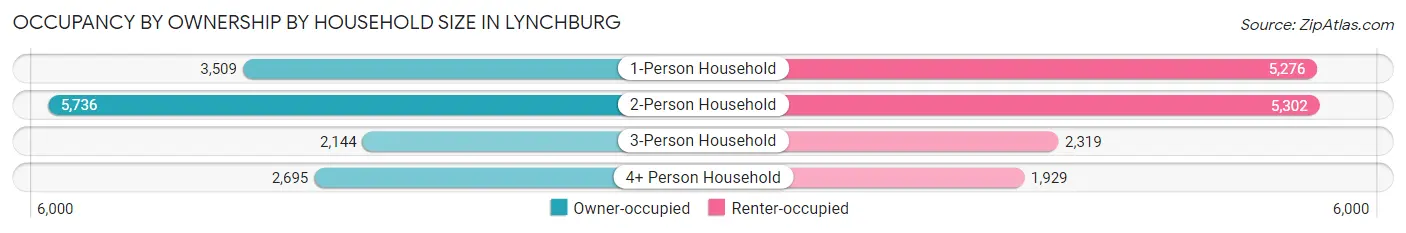
| Household Size | Owner-occupied | Renter-occupied |
| 1-Person Household | 3,509 (39.9%) | 5,276 (60.1%) |
| 2-Person Household | 5,736 (52.0%) | 5,302 (48.0%) |
| 3-Person Household | 2,144 (48.0%) | 2,319 (52.0%) |
| 4+ Person Household | 2,695 (58.3%) | 1,929 (41.7%) |
| Total Housing Units | 14,084 (48.7%) | 14,826 (51.3%) |
Occupancy by Educational Attainment in Lynchburg
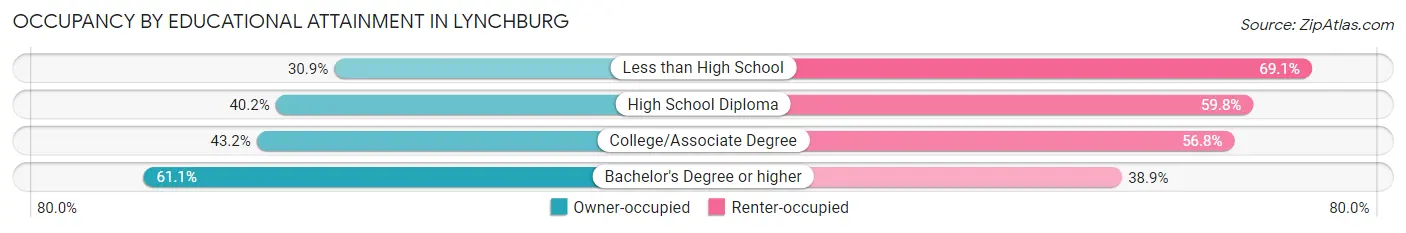
| Household Size | Owner-occupied | Renter-occupied |
| Less than High School | 756 (30.9%) | 1,688 (69.1%) |
| High School Diploma | 2,428 (40.2%) | 3,611 (59.8%) |
| College/Associate Degree | 3,826 (43.2%) | 5,028 (56.8%) |
| Bachelor's Degree or higher | 7,074 (61.1%) | 4,499 (38.9%) |
Occupancy by Age of Householder in Lynchburg
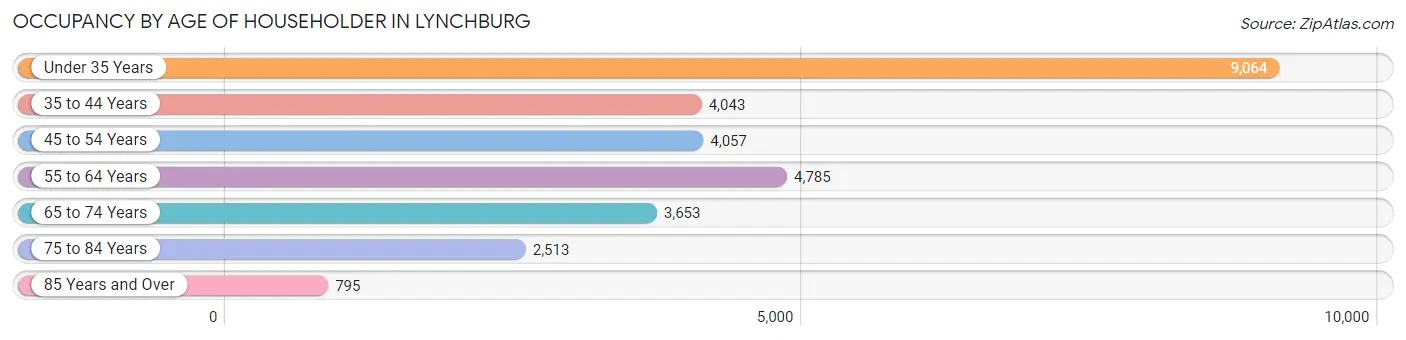
| Age Bracket | # Households | % Households |
| Under 35 Years | 9,064 | 31.4% |
| 35 to 44 Years | 4,043 | 14.0% |
| 45 to 54 Years | 4,057 | 14.0% |
| 55 to 64 Years | 4,785 | 16.6% |
| 65 to 74 Years | 3,653 | 12.6% |
| 75 to 84 Years | 2,513 | 8.7% |
| 85 Years and Over | 795 | 2.8% |
| Total | 28,910 | 100.0% |
Housing Finances in Lynchburg
Median Income by Occupancy in Lynchburg
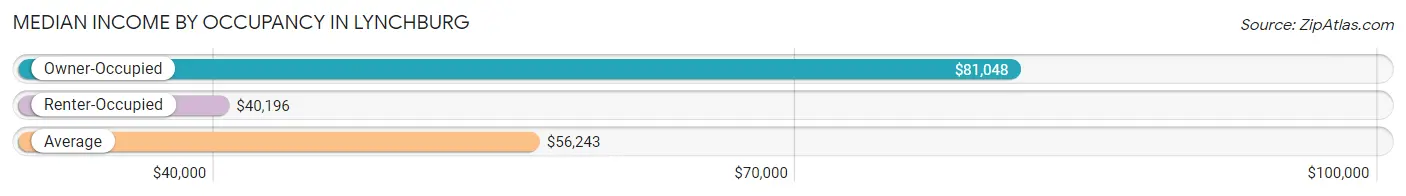
| Occupancy Type | # Households | Median Income |
| Owner-Occupied | 14,084 (48.7%) | $81,048 |
| Renter-Occupied | 14,826 (51.3%) | $40,196 |
| Average | 28,910 (100.0%) | $56,243 |
Occupancy by Householder Income Bracket in Lynchburg
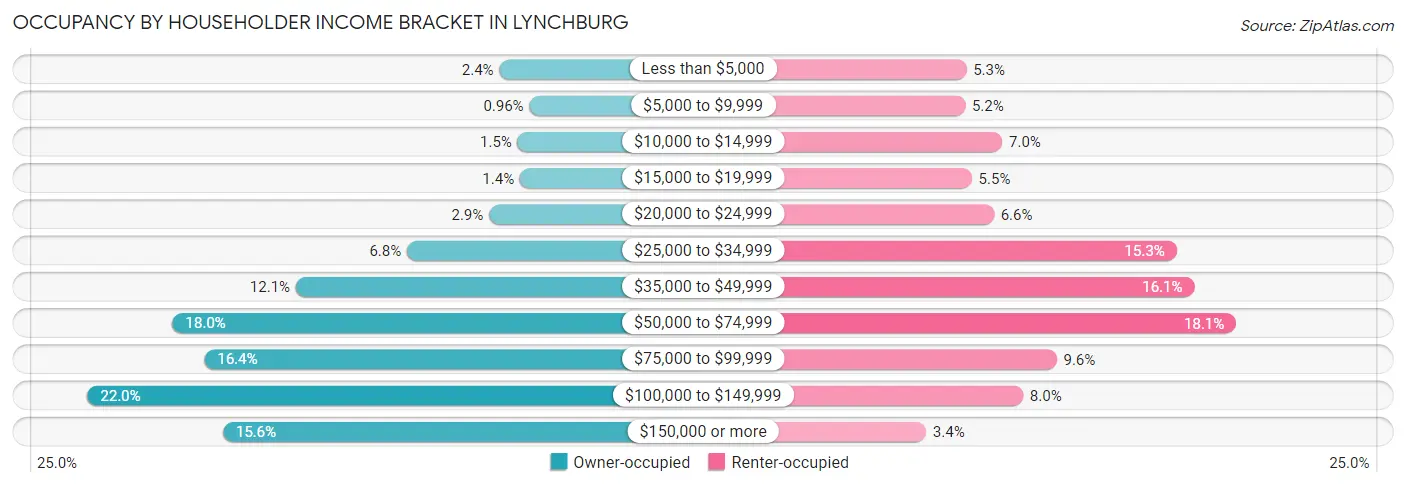
| Income Bracket | Owner-occupied | Renter-occupied |
| Less than $5,000 | 336 (2.4%) | 782 (5.3%) |
| $5,000 to $9,999 | 135 (1.0%) | 773 (5.2%) |
| $10,000 to $14,999 | 214 (1.5%) | 1,035 (7.0%) |
| $15,000 to $19,999 | 198 (1.4%) | 820 (5.5%) |
| $20,000 to $24,999 | 405 (2.9%) | 976 (6.6%) |
| $25,000 to $34,999 | 957 (6.8%) | 2,267 (15.3%) |
| $35,000 to $49,999 | 1,702 (12.1%) | 2,391 (16.1%) |
| $50,000 to $74,999 | 2,530 (18.0%) | 2,686 (18.1%) |
| $75,000 to $99,999 | 2,315 (16.4%) | 1,419 (9.6%) |
| $100,000 to $149,999 | 3,100 (22.0%) | 1,181 (8.0%) |
| $150,000 or more | 2,192 (15.6%) | 496 (3.4%) |
| Total | 14,084 (100.0%) | 14,826 (100.0%) |
Monthly Housing Cost Tiers in Lynchburg
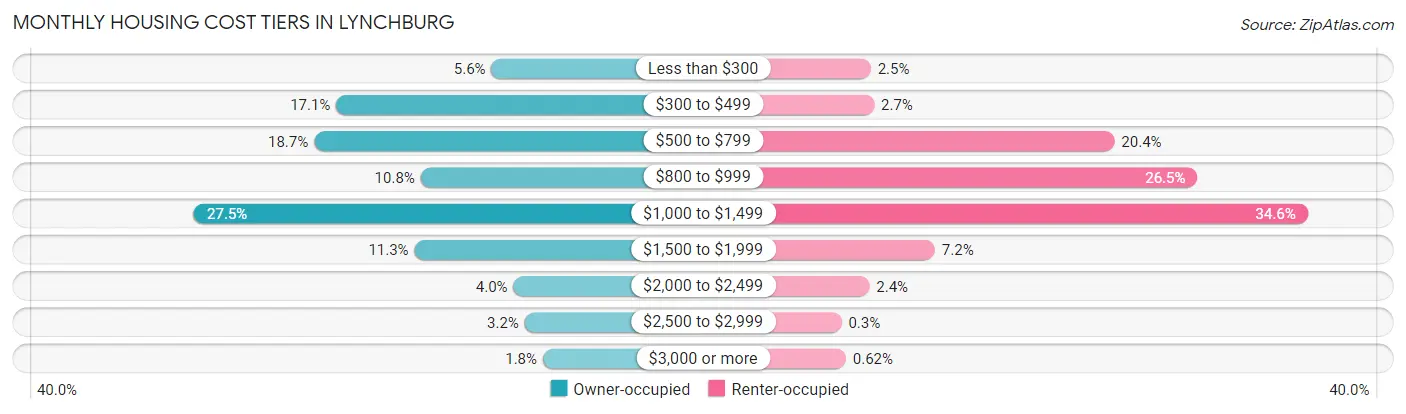
| Monthly Cost | Owner-occupied | Renter-occupied |
| Less than $300 | 792 (5.6%) | 363 (2.5%) |
| $300 to $499 | 2,402 (17.1%) | 401 (2.7%) |
| $500 to $799 | 2,631 (18.7%) | 3,025 (20.4%) |
| $800 to $999 | 1,525 (10.8%) | 3,929 (26.5%) |
| $1,000 to $1,499 | 3,877 (27.5%) | 5,134 (34.6%) |
| $1,500 to $1,999 | 1,590 (11.3%) | 1,065 (7.2%) |
| $2,000 to $2,499 | 563 (4.0%) | 348 (2.4%) |
| $2,500 to $2,999 | 446 (3.2%) | 44 (0.3%) |
| $3,000 or more | 258 (1.8%) | 92 (0.6%) |
| Total | 14,084 (100.0%) | 14,826 (100.0%) |
Physical Housing Characteristics in Lynchburg
Housing Structures in Lynchburg
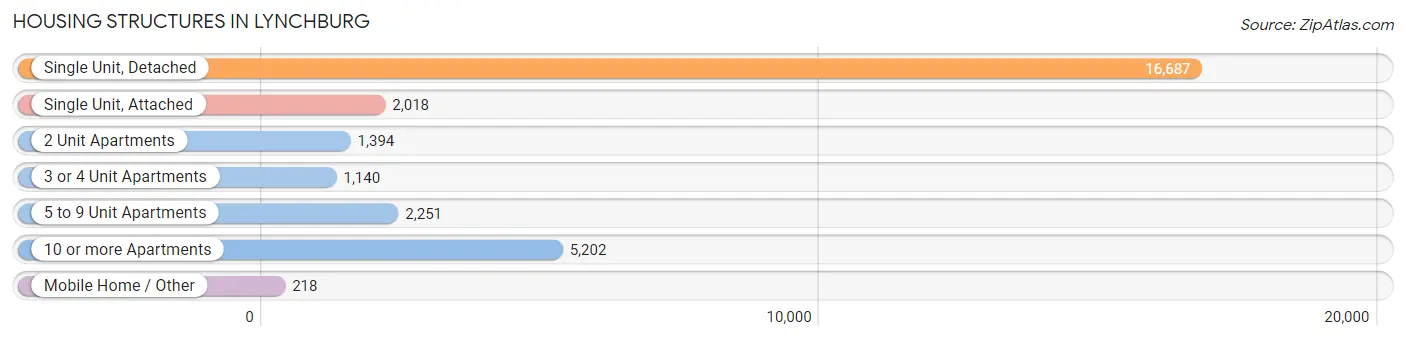
| Structure Type | # Housing Units | % Housing Units |
| Single Unit, Detached | 16,687 | 57.7% |
| Single Unit, Attached | 2,018 | 7.0% |
| 2 Unit Apartments | 1,394 | 4.8% |
| 3 or 4 Unit Apartments | 1,140 | 3.9% |
| 5 to 9 Unit Apartments | 2,251 | 7.8% |
| 10 or more Apartments | 5,202 | 18.0% |
| Mobile Home / Other | 218 | 0.7% |
| Total | 28,910 | 100.0% |
Housing Structures by Occupancy in Lynchburg
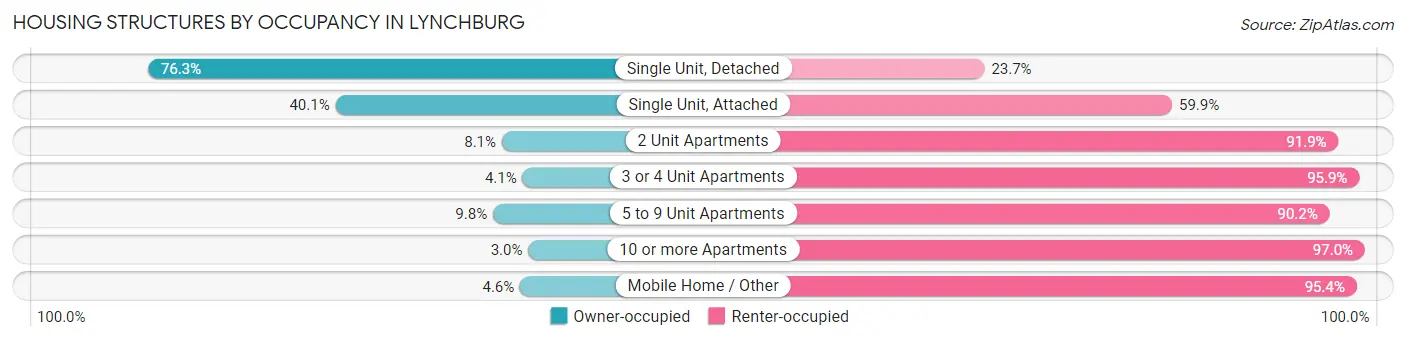
| Structure Type | Owner-occupied | Renter-occupied |
| Single Unit, Detached | 12,726 (76.3%) | 3,961 (23.7%) |
| Single Unit, Attached | 810 (40.1%) | 1,208 (59.9%) |
| 2 Unit Apartments | 113 (8.1%) | 1,281 (91.9%) |
| 3 or 4 Unit Apartments | 47 (4.1%) | 1,093 (95.9%) |
| 5 to 9 Unit Apartments | 221 (9.8%) | 2,030 (90.2%) |
| 10 or more Apartments | 157 (3.0%) | 5,045 (97.0%) |
| Mobile Home / Other | 10 (4.6%) | 208 (95.4%) |
| Total | 14,084 (48.7%) | 14,826 (51.3%) |
Housing Structures by Number of Rooms in Lynchburg
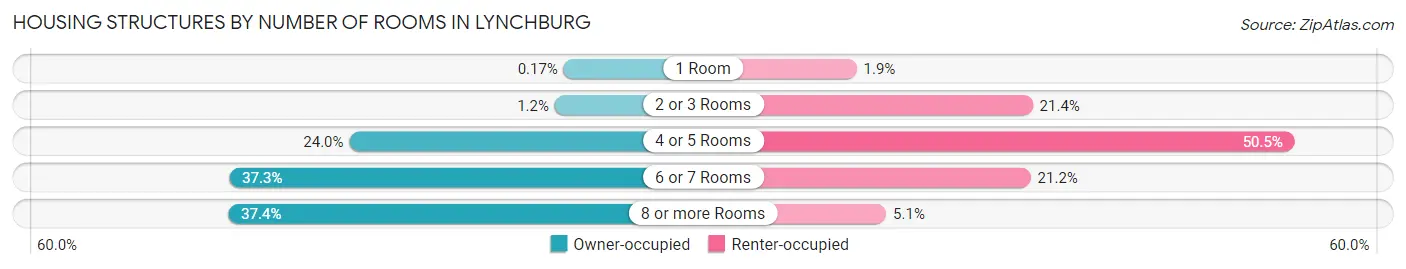
| Number of Rooms | Owner-occupied | Renter-occupied |
| 1 Room | 24 (0.2%) | 274 (1.8%) |
| 2 or 3 Rooms | 164 (1.2%) | 3,171 (21.4%) |
| 4 or 5 Rooms | 3,374 (24.0%) | 7,482 (50.5%) |
| 6 or 7 Rooms | 5,253 (37.3%) | 3,139 (21.2%) |
| 8 or more Rooms | 5,269 (37.4%) | 760 (5.1%) |
| Total | 14,084 (100.0%) | 14,826 (100.0%) |
Housing Structure by Heating Type in Lynchburg
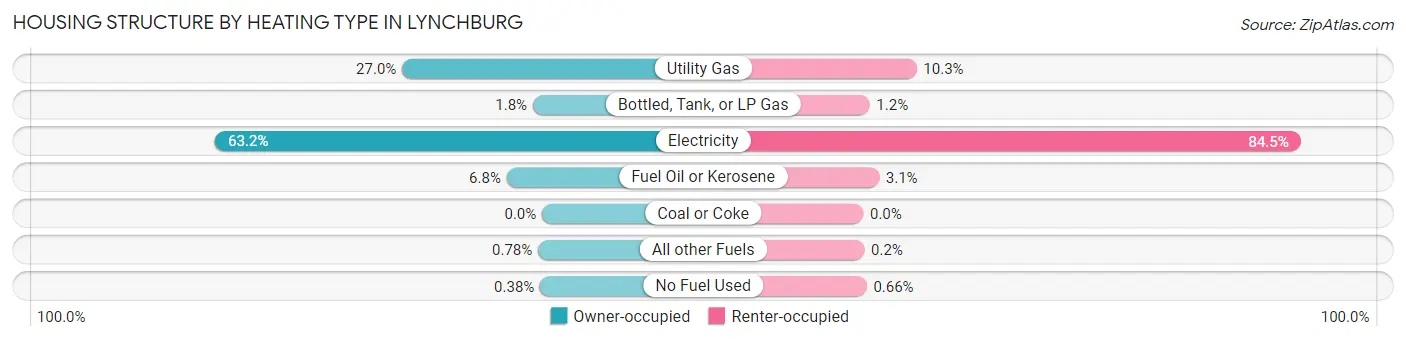
| Heating Type | Owner-occupied | Renter-occupied |
| Utility Gas | 3,809 (27.0%) | 1,529 (10.3%) |
| Bottled, Tank, or LP Gas | 249 (1.8%) | 182 (1.2%) |
| Electricity | 8,900 (63.2%) | 12,534 (84.5%) |
| Fuel Oil or Kerosene | 962 (6.8%) | 453 (3.1%) |
| Coal or Coke | 0 (0.0%) | 0 (0.0%) |
| All other Fuels | 110 (0.8%) | 30 (0.2%) |
| No Fuel Used | 54 (0.4%) | 98 (0.7%) |
| Total | 14,084 (100.0%) | 14,826 (100.0%) |
Household Vehicle Usage in Lynchburg
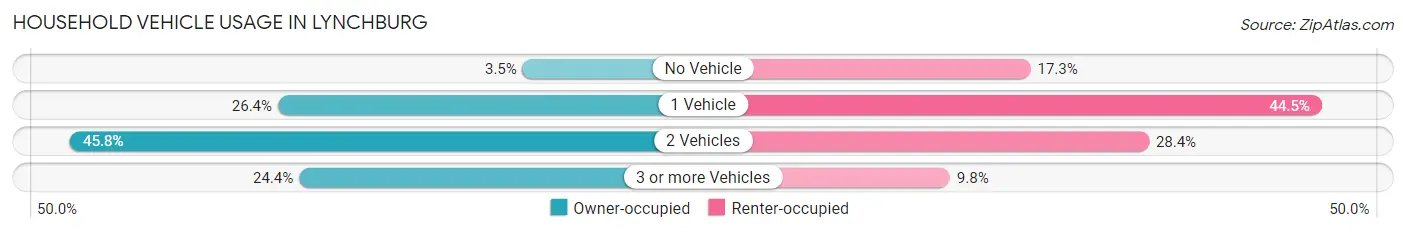
| Vehicles per Household | Owner-occupied | Renter-occupied |
| No Vehicle | 495 (3.5%) | 2,569 (17.3%) |
| 1 Vehicle | 3,712 (26.4%) | 6,597 (44.5%) |
| 2 Vehicles | 6,443 (45.8%) | 4,207 (28.4%) |
| 3 or more Vehicles | 3,434 (24.4%) | 1,453 (9.8%) |
| Total | 14,084 (100.0%) | 14,826 (100.0%) |
Real Estate & Mortgages in Lynchburg
Real Estate and Mortgage Overview in Lynchburg
| Characteristic | Without Mortgage | With Mortgage |
| Housing Units | 5,387 | 8,697 |
| Median Property Value | $193,000 | $197,400 |
| Median Household Income | $68,877 | $1,503 |
| Monthly Housing Costs | $469 | $258 |
| Real Estate Taxes | $1,735 | $174 |
Property Value by Mortgage Status in Lynchburg
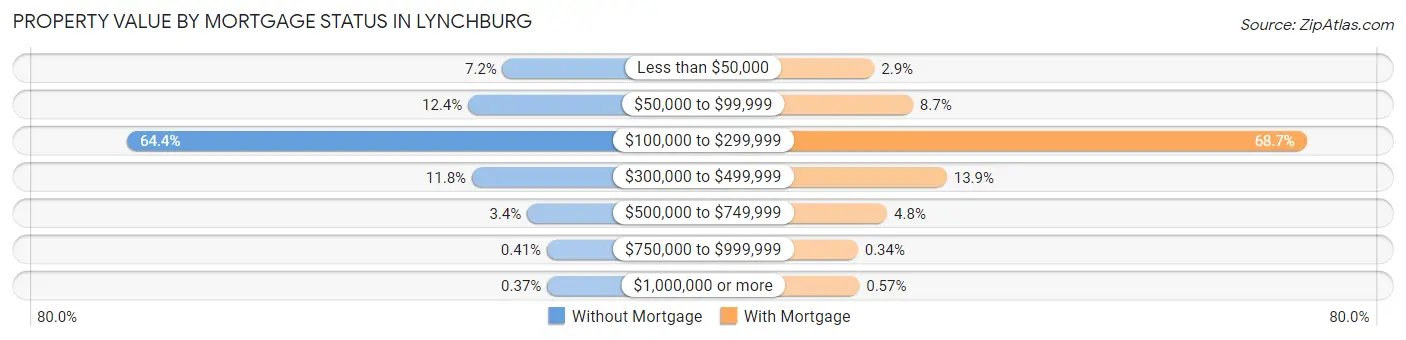
| Property Value | Without Mortgage | With Mortgage |
| Less than $50,000 | 385 (7.1%) | 250 (2.9%) |
| $50,000 to $99,999 | 669 (12.4%) | 760 (8.7%) |
| $100,000 to $299,999 | 3,468 (64.4%) | 5,978 (68.7%) |
| $300,000 to $499,999 | 638 (11.8%) | 1,210 (13.9%) |
| $500,000 to $749,999 | 185 (3.4%) | 419 (4.8%) |
| $750,000 to $999,999 | 22 (0.4%) | 30 (0.3%) |
| $1,000,000 or more | 20 (0.4%) | 50 (0.6%) |
| Total | 5,387 (100.0%) | 8,697 (100.0%) |
Household Income by Mortgage Status in Lynchburg
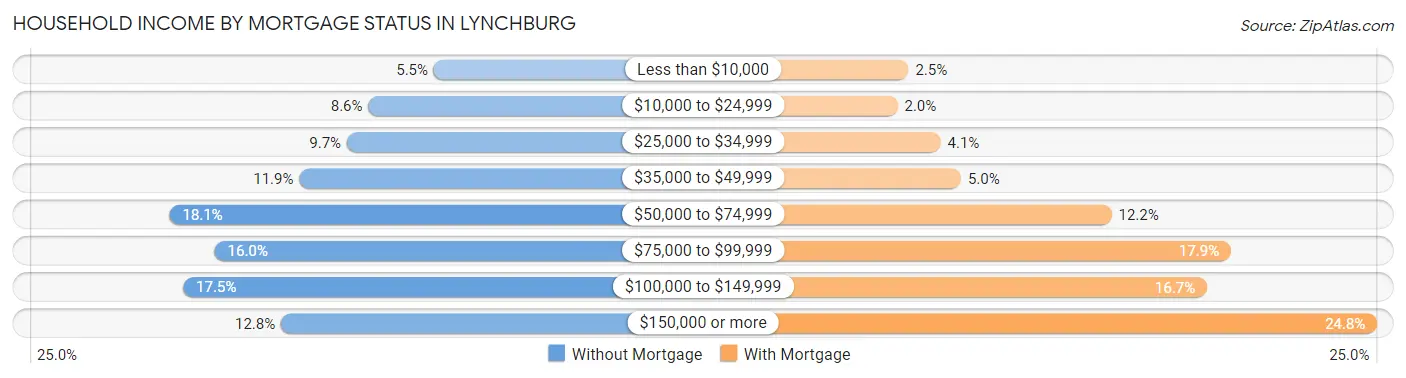
| Household Income | Without Mortgage | With Mortgage |
| Less than $10,000 | 297 (5.5%) | 219 (2.5%) |
| $10,000 to $24,999 | 465 (8.6%) | 174 (2.0%) |
| $25,000 to $34,999 | 520 (9.7%) | 352 (4.1%) |
| $35,000 to $49,999 | 642 (11.9%) | 437 (5.0%) |
| $50,000 to $74,999 | 975 (18.1%) | 1,060 (12.2%) |
| $75,000 to $99,999 | 859 (16.0%) | 1,555 (17.9%) |
| $100,000 to $149,999 | 940 (17.4%) | 1,456 (16.7%) |
| $150,000 or more | 689 (12.8%) | 2,160 (24.8%) |
| Total | 5,387 (100.0%) | 8,697 (100.0%) |
Property Value to Household Income Ratio in Lynchburg
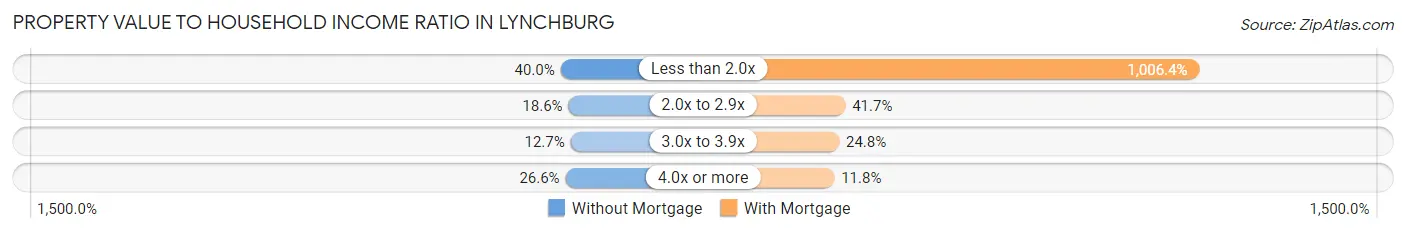
| Value-to-Income Ratio | Without Mortgage | With Mortgage |
| Less than 2.0x | 2,152 (40.0%) | 87,528 (1,006.4%) |
| 2.0x to 2.9x | 1,002 (18.6%) | 3,627 (41.7%) |
| 3.0x to 3.9x | 685 (12.7%) | 2,156 (24.8%) |
| 4.0x or more | 1,434 (26.6%) | 1,024 (11.8%) |
| Total | 5,387 (100.0%) | 8,697 (100.0%) |
Real Estate Taxes by Mortgage Status in Lynchburg
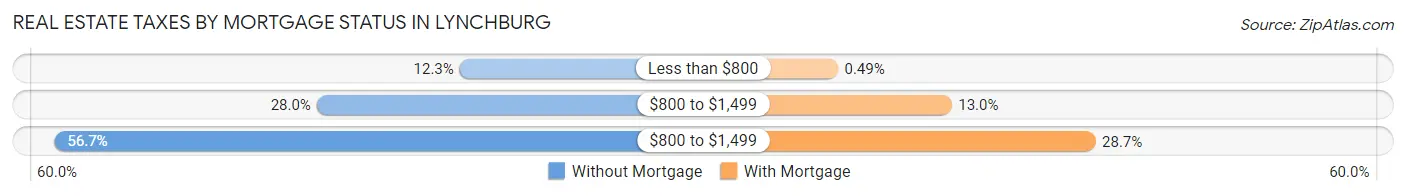
| Property Taxes | Without Mortgage | With Mortgage |
| Less than $800 | 664 (12.3%) | 43 (0.5%) |
| $800 to $1,499 | 1,508 (28.0%) | 1,127 (13.0%) |
| $800 to $1,499 | 3,056 (56.7%) | 2,498 (28.7%) |
| Total | 5,387 (100.0%) | 8,697 (100.0%) |
Health & Disability in Lynchburg
Health Insurance Coverage by Age in Lynchburg
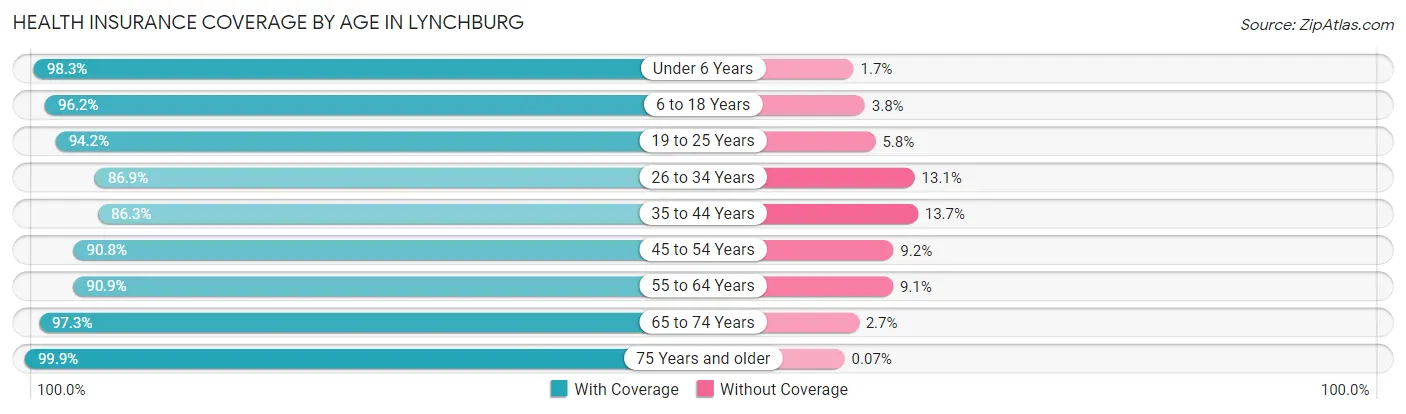
| Age Bracket | With Coverage | Without Coverage |
| Under 6 Years | 5,132 (98.3%) | 91 (1.7%) |
| 6 to 18 Years | 12,160 (96.2%) | 484 (3.8%) |
| 19 to 25 Years | 17,346 (94.2%) | 1,069 (5.8%) |
| 26 to 34 Years | 8,304 (86.9%) | 1,253 (13.1%) |
| 35 to 44 Years | 5,988 (86.3%) | 951 (13.7%) |
| 45 to 54 Years | 5,930 (90.8%) | 598 (9.2%) |
| 55 to 64 Years | 6,999 (90.9%) | 700 (9.1%) |
| 65 to 74 Years | 5,643 (97.3%) | 156 (2.7%) |
| 75 Years and older | 4,482 (99.9%) | 3 (0.1%) |
| Total | 71,984 (93.1%) | 5,305 (6.9%) |
Health Insurance Coverage by Citizenship Status in Lynchburg
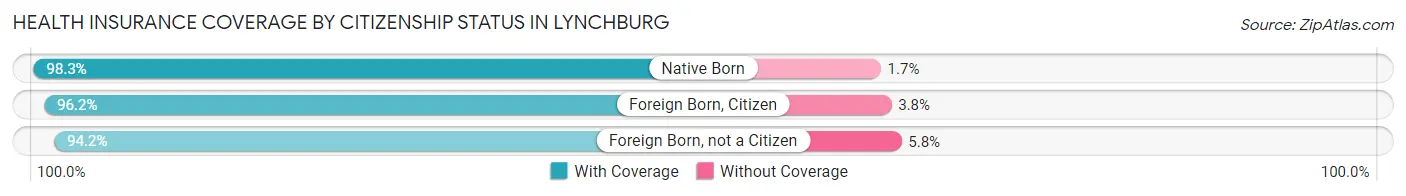
| Citizenship Status | With Coverage | Without Coverage |
| Native Born | 5,132 (98.3%) | 91 (1.7%) |
| Foreign Born, Citizen | 12,160 (96.2%) | 484 (3.8%) |
| Foreign Born, not a Citizen | 17,346 (94.2%) | 1,069 (5.8%) |
Health Insurance Coverage by Household Income in Lynchburg
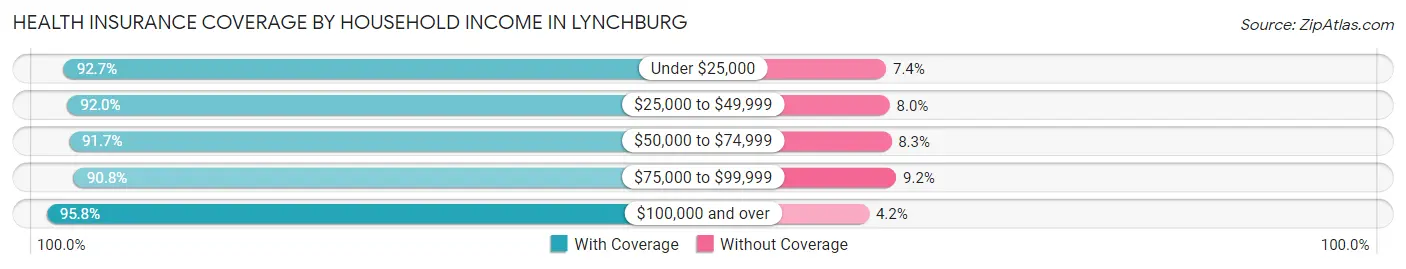
| Household Income | With Coverage | Without Coverage |
| Under $25,000 | 9,396 (92.6%) | 745 (7.3%) |
| $25,000 to $49,999 | 13,561 (92.0%) | 1,183 (8.0%) |
| $50,000 to $74,999 | 10,877 (91.7%) | 987 (8.3%) |
| $75,000 to $99,999 | 9,249 (90.8%) | 942 (9.2%) |
| $100,000 and over | 20,365 (95.8%) | 885 (4.2%) |
Public vs Private Health Insurance Coverage by Age in Lynchburg
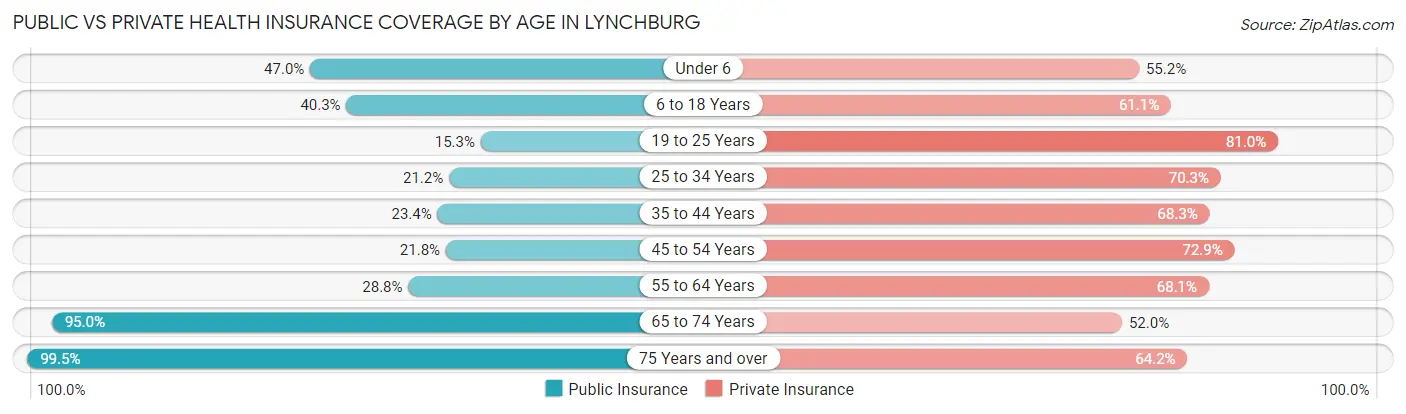
| Age Bracket | Public Insurance | Private Insurance |
| Under 6 | 2,455 (47.0%) | 2,881 (55.2%) |
| 6 to 18 Years | 5,091 (40.3%) | 7,725 (61.1%) |
| 19 to 25 Years | 2,821 (15.3%) | 14,911 (81.0%) |
| 25 to 34 Years | 2,027 (21.2%) | 6,722 (70.3%) |
| 35 to 44 Years | 1,620 (23.4%) | 4,737 (68.3%) |
| 45 to 54 Years | 1,423 (21.8%) | 4,758 (72.9%) |
| 55 to 64 Years | 2,215 (28.8%) | 5,245 (68.1%) |
| 65 to 74 Years | 5,507 (95.0%) | 3,016 (52.0%) |
| 75 Years and over | 4,463 (99.5%) | 2,877 (64.1%) |
| Total | 27,622 (35.7%) | 52,872 (68.4%) |
Disability Status by Sex by Age in Lynchburg
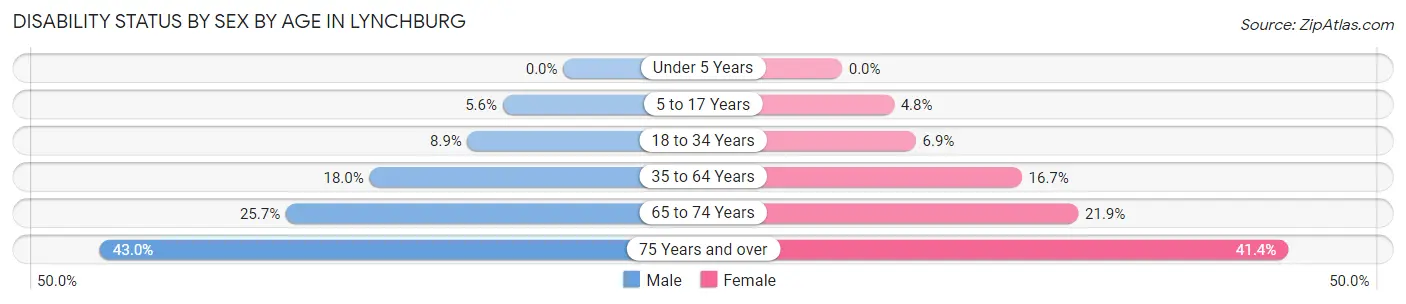
| Age Bracket | Male | Female |
| Under 5 Years | 0 (0.0%) | 0 (0.0%) |
| 5 to 17 Years | 295 (5.6%) | 243 (4.8%) |
| 18 to 34 Years | 1,289 (8.9%) | 1,123 (6.9%) |
| 35 to 64 Years | 1,751 (18.0%) | 1,908 (16.7%) |
| 65 to 74 Years | 665 (25.7%) | 705 (21.9%) |
| 75 Years and over | 744 (43.0%) | 1,141 (41.4%) |
Disability Class by Sex by Age in Lynchburg
Disability Class: Hearing Difficulty
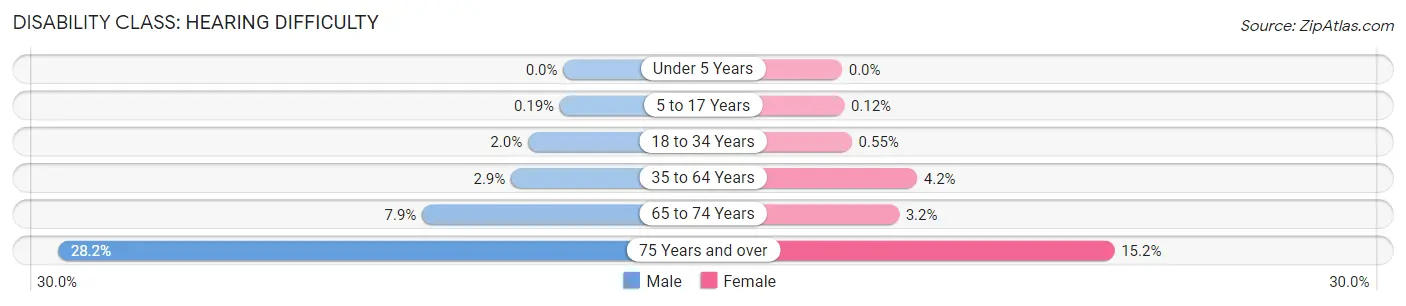
| Age Bracket | Male | Female |
| Under 5 Years | 0 (0.0%) | 0 (0.0%) |
| 5 to 17 Years | 10 (0.2%) | 6 (0.1%) |
| 18 to 34 Years | 286 (2.0%) | 90 (0.5%) |
| 35 to 64 Years | 283 (2.9%) | 478 (4.2%) |
| 65 to 74 Years | 203 (7.9%) | 102 (3.2%) |
| 75 Years and over | 487 (28.1%) | 418 (15.2%) |
Disability Class: Vision Difficulty
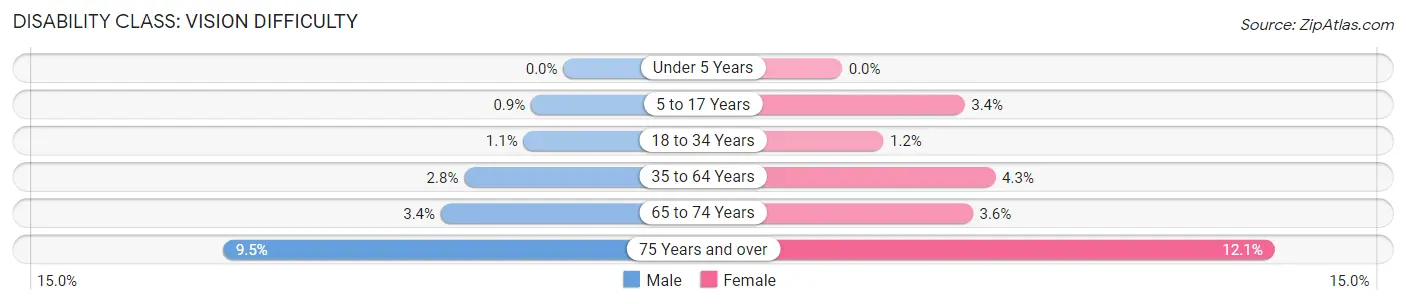
| Age Bracket | Male | Female |
| Under 5 Years | 0 (0.0%) | 0 (0.0%) |
| 5 to 17 Years | 47 (0.9%) | 172 (3.4%) |
| 18 to 34 Years | 161 (1.1%) | 188 (1.1%) |
| 35 to 64 Years | 269 (2.8%) | 488 (4.3%) |
| 65 to 74 Years | 88 (3.4%) | 117 (3.6%) |
| 75 Years and over | 164 (9.5%) | 332 (12.0%) |
Disability Class: Cognitive Difficulty
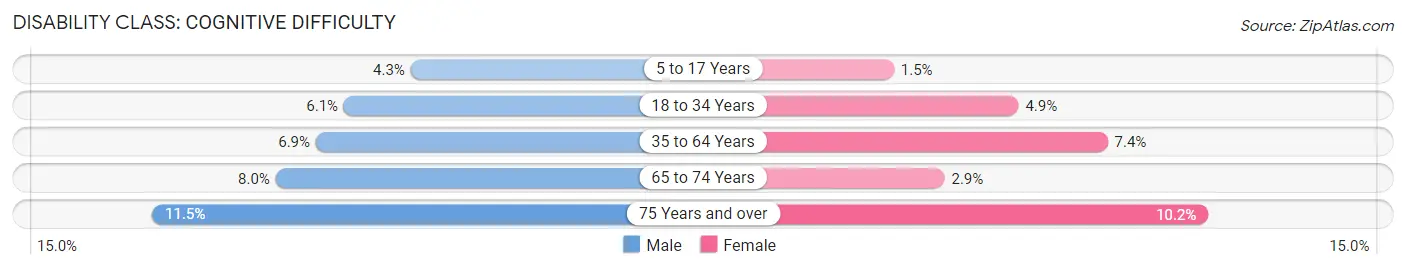
| Age Bracket | Male | Female |
| 5 to 17 Years | 223 (4.3%) | 73 (1.5%) |
| 18 to 34 Years | 887 (6.1%) | 807 (4.9%) |
| 35 to 64 Years | 670 (6.9%) | 846 (7.4%) |
| 65 to 74 Years | 207 (8.0%) | 92 (2.9%) |
| 75 Years and over | 198 (11.5%) | 281 (10.2%) |
Disability Class: Ambulatory Difficulty
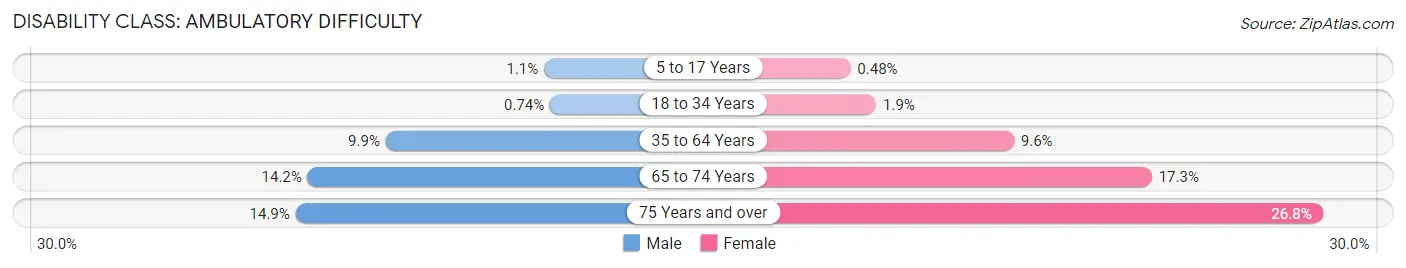
| Age Bracket | Male | Female |
| 5 to 17 Years | 56 (1.1%) | 24 (0.5%) |
| 18 to 34 Years | 108 (0.7%) | 313 (1.9%) |
| 35 to 64 Years | 962 (9.9%) | 1,095 (9.6%) |
| 65 to 74 Years | 368 (14.2%) | 555 (17.3%) |
| 75 Years and over | 258 (14.9%) | 739 (26.8%) |
Disability Class: Self-Care Difficulty
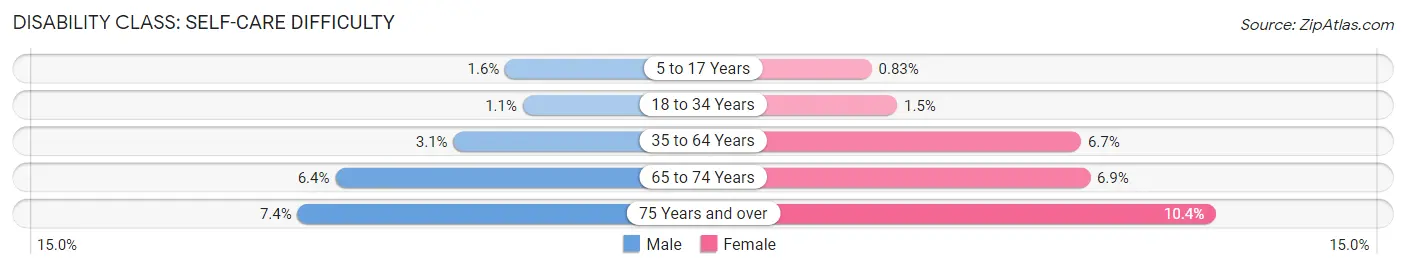
| Age Bracket | Male | Female |
| 5 to 17 Years | 85 (1.6%) | 42 (0.8%) |
| 18 to 34 Years | 164 (1.1%) | 252 (1.5%) |
| 35 to 64 Years | 298 (3.1%) | 762 (6.7%) |
| 65 to 74 Years | 164 (6.4%) | 222 (6.9%) |
| 75 Years and over | 128 (7.4%) | 287 (10.4%) |
Technology Access in Lynchburg
Computing Device Access in Lynchburg
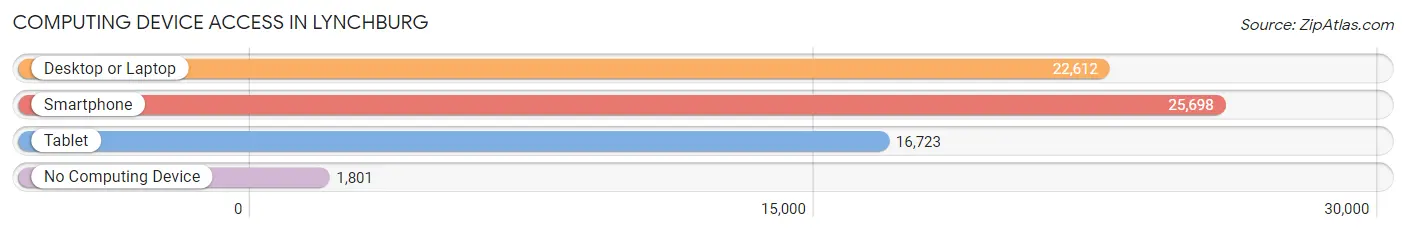
| Device Type | # Households | % Households |
| Desktop or Laptop | 22,612 | 78.2% |
| Smartphone | 25,698 | 88.9% |
| Tablet | 16,723 | 57.9% |
| No Computing Device | 1,801 | 6.2% |
| Total | 28,910 | 100.0% |
Internet Access in Lynchburg
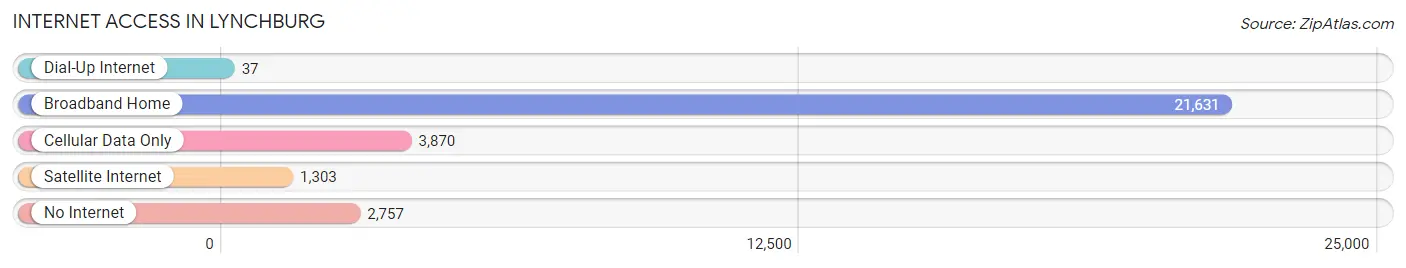
| Internet Type | # Households | % Households |
| Dial-Up Internet | 37 | 0.1% |
| Broadband Home | 21,631 | 74.8% |
| Cellular Data Only | 3,870 | 13.4% |
| Satellite Internet | 1,303 | 4.5% |
| No Internet | 2,757 | 9.5% |
| Total | 28,910 | 100.0% |
Lynchburg Summary
Lynchburg, Virginia is a city located in the foothills of the Blue Ridge Mountains in the central part of the state. It is the county seat of Campbell County and is the fifth largest city in Virginia. The city is situated along the James River and is home to a population of approximately 75,000 people.
History
The area that is now Lynchburg was first settled in 1757 by John Lynch, who established a ferry service across the James River. The city was officially established in 1786 and was named after Lynch. During the American Revolution, Lynchburg served as a supply depot for the Continental Army. In the 19th century, Lynchburg became an important center for the tobacco and iron industries. The city was also a major hub for the railroad industry, with the first railroad line in the state being built in Lynchburg in 1834.
During the Civil War, Lynchburg was a major Confederate stronghold and was the site of several battles. After the war, the city experienced a period of economic growth and development, with the establishment of several new industries, including textiles, furniture, and tobacco.
Geography
Lynchburg is located in the foothills of the Blue Ridge Mountains in the central part of Virginia. The city is situated along the James River and is surrounded by several smaller towns and villages. The city has a total area of 24.3 square miles, of which 24.2 square miles is land and 0.1 square miles is water. The city has a humid subtropical climate, with hot, humid summers and mild winters.
Economy
The economy of Lynchburg is largely based on manufacturing, with the city being home to several large manufacturing companies, including BWX Technologies, Genworth Financial, and Babcock & Wilcox. The city is also home to several educational institutions, including Liberty University, Randolph College, and Lynchburg College. Tourism is also an important part of the local economy, with the city being home to several historic sites, including the Old City Cemetery and the Point of Honor.
Demographics
As of the 2010 census, Lynchburg had a population of 75,568 people. The racial makeup of the city was 73.2% White, 19.2% African American, 0.4% Native American, 2.2% Asian, 0.1% Pacific Islander, 2.3% from other races, and 2.7% from two or more races. The median household income was $37,837 and the median family income was $45,945. The per capita income was $21,845.
Lynchburg is a diverse city with a rich history and a vibrant economy. The city is home to several educational institutions, manufacturing companies, and historic sites, making it an attractive destination for both tourists and businesses. The city has a diverse population and a strong sense of community, making it an ideal place to live and work.
Common Questions
What is Per Capita Income in Lynchburg?
Per Capita income in Lynchburg is $28,478.
What is the Median Family Income in Lynchburg?
Median Family Income in Lynchburg is $71,392.
What is the Median Household income in Lynchburg?
Median Household Income in Lynchburg is $56,243.
What is Income or Wage Gap in Lynchburg?
Income or Wage Gap in Lynchburg is 28.4%.
Women in Lynchburg earn 71.6 cents for every dollar earned by a man.
What is Family Income Deficit in Lynchburg?
Family Income Deficit in Lynchburg is $11,024.
Families that are below poverty line in Lynchburg earn $11,024 less on average than the poverty threshold level.
What is Inequality or Gini Index in Lynchburg?
Inequality or Gini Index in Lynchburg is 0.45.
What is the Total Population of Lynchburg?
Total Population of Lynchburg is 79,166.
What is the Total Male Population of Lynchburg?
Total Male Population of Lynchburg is 36,991.
What is the Total Female Population of Lynchburg?
Total Female Population of Lynchburg is 42,175.
What is the Ratio of Males per 100 Females in Lynchburg?
There are 87.71 Males per 100 Females in Lynchburg.
What is the Ratio of Females per 100 Males in Lynchburg?
There are 114.01 Females per 100 Males in Lynchburg.
What is the Median Population Age in Lynchburg?
Median Population Age in Lynchburg is 28.4 Years.
What is the Average Family Size in Lynchburg
Average Family Size in Lynchburg is 3.0 People.
What is the Average Household Size in Lynchburg
Average Household Size in Lynchburg is 2.4 People.
How Large is the Labor Force in Lynchburg?
There are 38,961 People in the Labor Forcein in Lynchburg.
What is the Percentage of People in the Labor Force in Lynchburg?
59.3% of People are in the Labor Force in Lynchburg.
What is the Unemployment Rate in Lynchburg?
Unemployment Rate in Lynchburg is 5.4%.