Mount Crawford, VA Map & Demographics
Mount Crawford Map
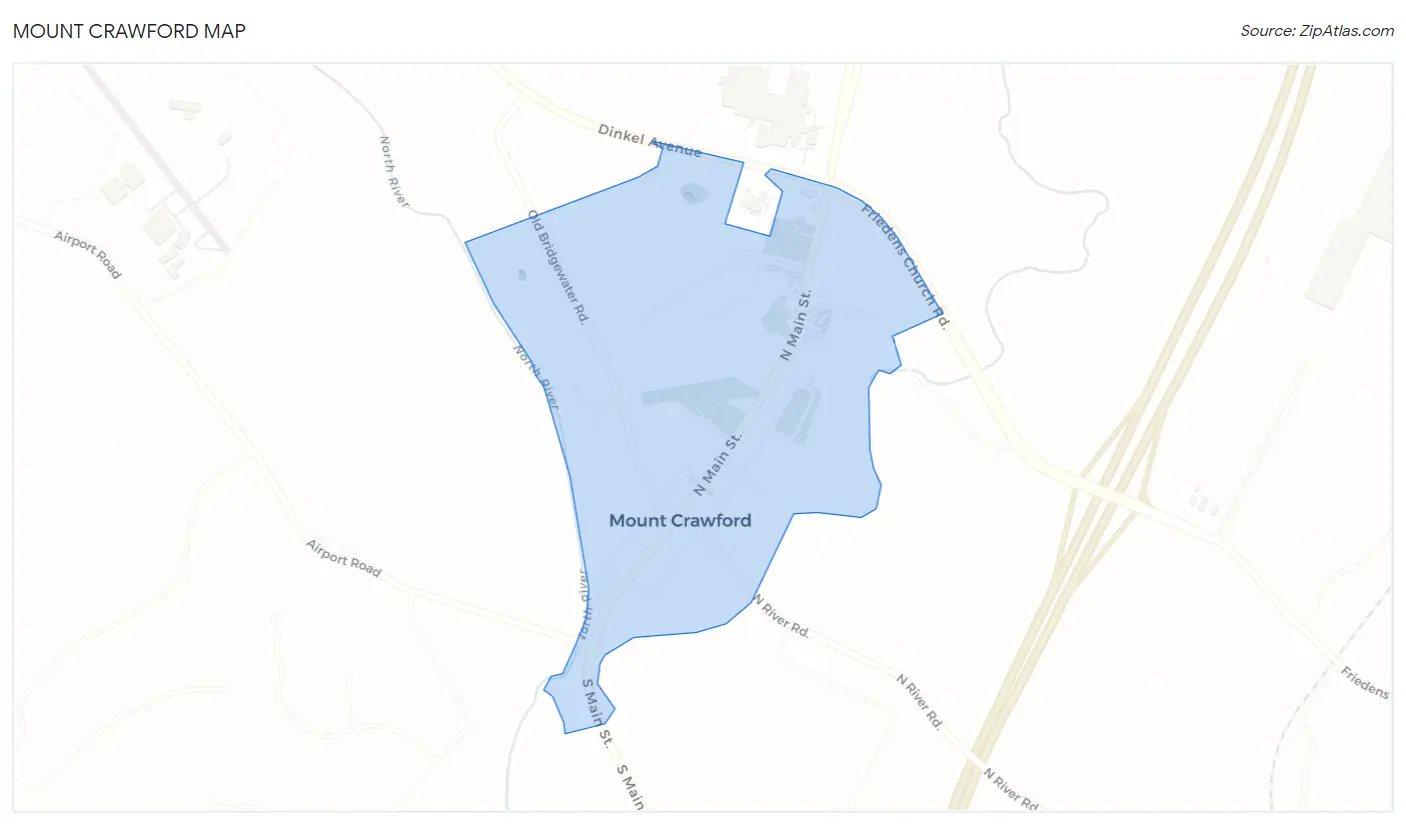
Mount Crawford Overview
$33,743
PER CAPITA INCOME
$91,250
AVG FAMILY INCOME
$82,083
AVG HOUSEHOLD INCOME
28.2%
WAGE / INCOME GAP [ % ]
71.8¢/ $1
WAGE / INCOME GAP [ $ ]
0.34
INEQUALITY / GINI INDEX
509
TOTAL POPULATION
258
MALE POPULATION
251
FEMALE POPULATION
102.79
MALES / 100 FEMALES
97.29
FEMALES / 100 MALES
33.9
MEDIAN AGE
3.3
AVG FAMILY SIZE
3.0
AVG HOUSEHOLD SIZE
312
LABOR FORCE [ PEOPLE ]
74.6%
PERCENT IN LABOR FORCE
1.0%
UNEMPLOYMENT RATE
Mount Crawford Zip Codes
Income in Mount Crawford
Income Overview in Mount Crawford
Per Capita Income in Mount Crawford is $33,743, while median incomes of families and households are $91,250 and $82,083 respectively.
| Characteristic | Number | Measure |
| Per Capita Income | 509 | $33,743 |
| Median Family Income | 131 | $91,250 |
| Mean Family Income | 131 | $100,834 |
| Median Household Income | 170 | $82,083 |
| Mean Household Income | 170 | $93,042 |
| Income Deficit | 131 | $0 |
| Wage / Income Gap (%) | 509 | 28.21% |
| Wage / Income Gap ($) | 509 | 71.79¢ per $1 |
| Gini / Inequality Index | 509 | 0.34 |
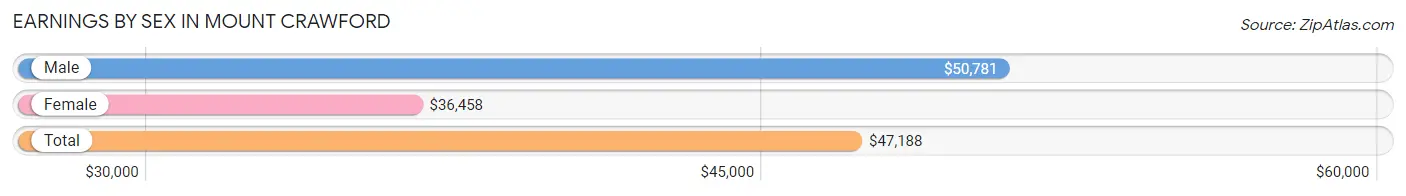
Earnings by Sex in Mount Crawford
Average Earnings in Mount Crawford are $47,188, $50,781 for men and $36,458 for women, a difference of 28.2%.
| Sex | Number | Average Earnings |
| Male | 183 (56.0%) | $50,781 |
| Female | 144 (44.0%) | $36,458 |
| Total | 327 (100.0%) | $47,188 |
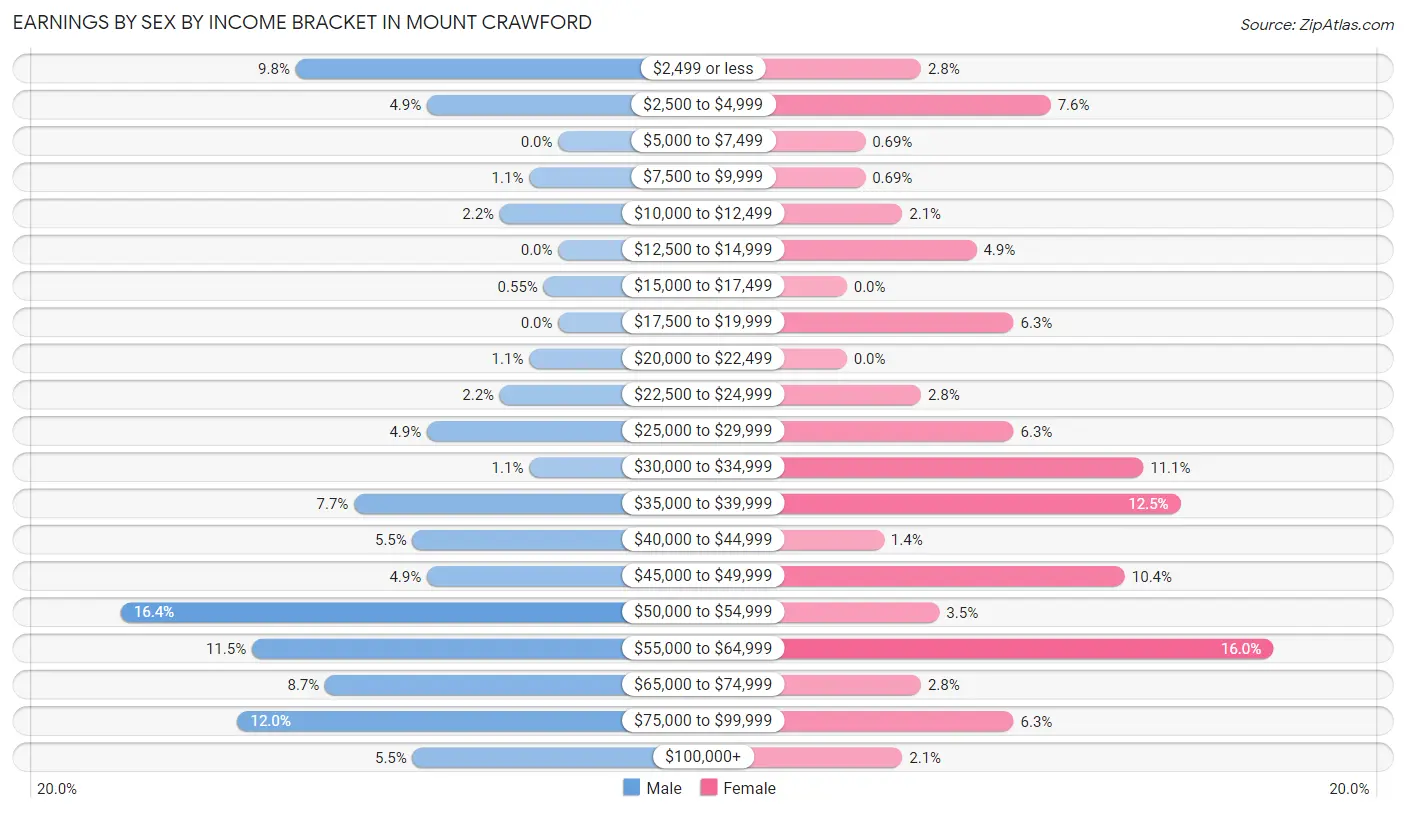
Earnings by Sex by Income Bracket in Mount Crawford
The most common earnings brackets in Mount Crawford are $50,000 to $54,999 for men (30 | 16.4%) and $55,000 to $64,999 for women (23 | 16.0%).
| Income | Male | Female |
| $2,499 or less | 18 (9.8%) | 4 (2.8%) |
| $2,500 to $4,999 | 9 (4.9%) | 11 (7.6%) |
| $5,000 to $7,499 | 0 (0.0%) | 1 (0.7%) |
| $7,500 to $9,999 | 2 (1.1%) | 1 (0.7%) |
| $10,000 to $12,499 | 4 (2.2%) | 3 (2.1%) |
| $12,500 to $14,999 | 0 (0.0%) | 7 (4.9%) |
| $15,000 to $17,499 | 1 (0.5%) | 0 (0.0%) |
| $17,500 to $19,999 | 0 (0.0%) | 9 (6.2%) |
| $20,000 to $22,499 | 2 (1.1%) | 0 (0.0%) |
| $22,500 to $24,999 | 4 (2.2%) | 4 (2.8%) |
| $25,000 to $29,999 | 9 (4.9%) | 9 (6.2%) |
| $30,000 to $34,999 | 2 (1.1%) | 16 (11.1%) |
| $35,000 to $39,999 | 14 (7.6%) | 18 (12.5%) |
| $40,000 to $44,999 | 10 (5.5%) | 2 (1.4%) |
| $45,000 to $49,999 | 9 (4.9%) | 15 (10.4%) |
| $50,000 to $54,999 | 30 (16.4%) | 5 (3.5%) |
| $55,000 to $64,999 | 21 (11.5%) | 23 (16.0%) |
| $65,000 to $74,999 | 16 (8.7%) | 4 (2.8%) |
| $75,000 to $99,999 | 22 (12.0%) | 9 (6.2%) |
| $100,000+ | 10 (5.5%) | 3 (2.1%) |
| Total | 183 (100.0%) | 144 (100.0%) |
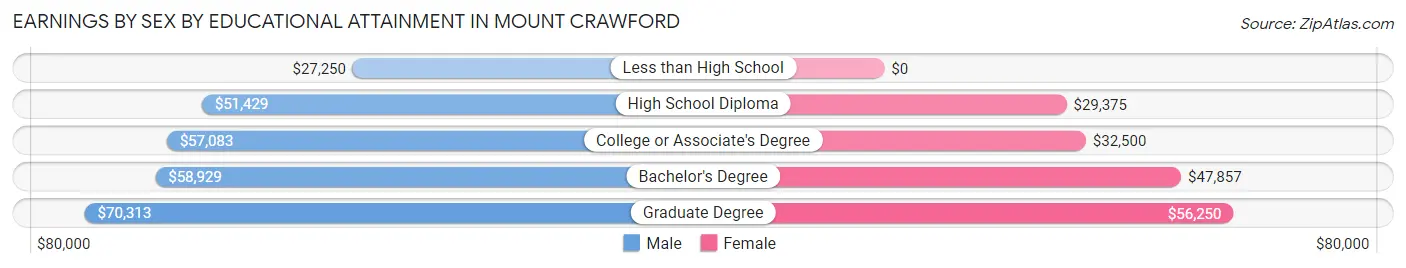
Earnings by Sex by Educational Attainment in Mount Crawford
Average earnings in Mount Crawford are $51,685 for men and $36,979 for women, a difference of 28.4%. Men with an educational attainment of graduate degree enjoy the highest average annual earnings of $70,313, while those with less than high school education earn the least with $27,250. Women with an educational attainment of graduate degree earn the most with the average annual earnings of $56,250, while those with high school diploma education have the smallest earnings of $29,375.
| Educational Attainment | Male Income | Female Income |
| Less than High School | $27,250 | $0 |
| High School Diploma | $51,429 | $29,375 |
| College or Associate's Degree | $57,083 | $32,500 |
| Bachelor's Degree | $58,929 | $47,857 |
| Graduate Degree | $70,313 | $56,250 |
| Total | $51,685 | $36,979 |
Family Income in Mount Crawford
Family Income Brackets in Mount Crawford
According to the Mount Crawford family income data, there are 32 families falling into the $100,000 to $149,999 income range, which is the most common income bracket and makes up 24.4% of all families.
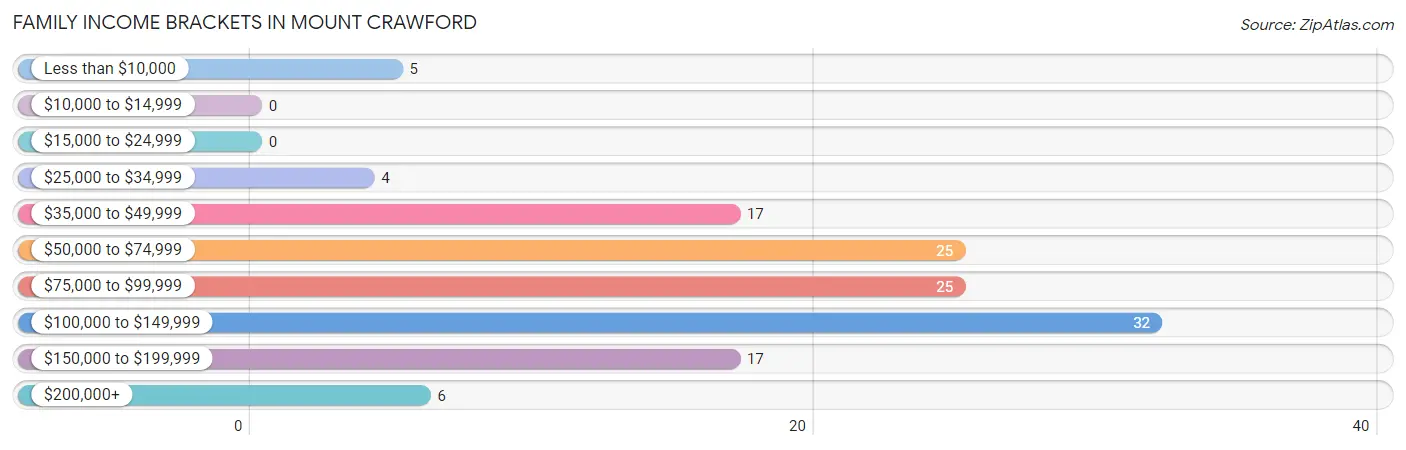
| Income Bracket | # Families | % Families |
| Less than $10,000 | 5 | 3.8% |
| $10,000 to $14,999 | 0 | 0.0% |
| $15,000 to $24,999 | 0 | 0.0% |
| $25,000 to $34,999 | 4 | 3.1% |
| $35,000 to $49,999 | 17 | 13.0% |
| $50,000 to $74,999 | 25 | 19.1% |
| $75,000 to $99,999 | 25 | 19.1% |
| $100,000 to $149,999 | 32 | 24.4% |
| $150,000 to $199,999 | 17 | 13.0% |
| $200,000+ | 6 | 4.6% |
Family Income by Famaliy Size in Mount Crawford
5-person families (4 | 3.0%) account for the highest median family income in Mount Crawford with $143,750 per family, while 2-person families (46 | 35.1%) have the highest median income of $46,666 per family member.
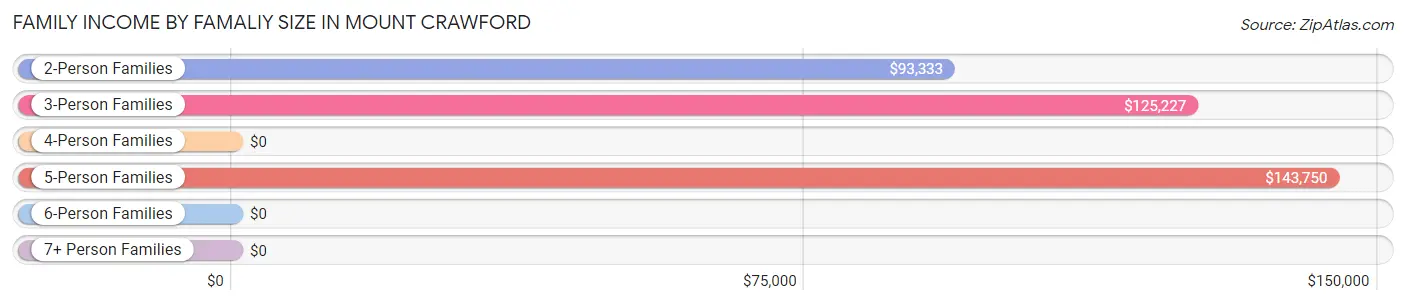
| Income Bracket | # Families | Median Income |
| 2-Person Families | 46 (35.1%) | $93,333 |
| 3-Person Families | 58 (44.3%) | $125,227 |
| 4-Person Families | 20 (15.3%) | $0 |
| 5-Person Families | 4 (3.0%) | $143,750 |
| 6-Person Families | 1 (0.8%) | $0 |
| 7+ Person Families | 2 (1.5%) | $0 |
| Total | 131 (100.0%) | $91,250 |
Family Income by Number of Earners in Mount Crawford
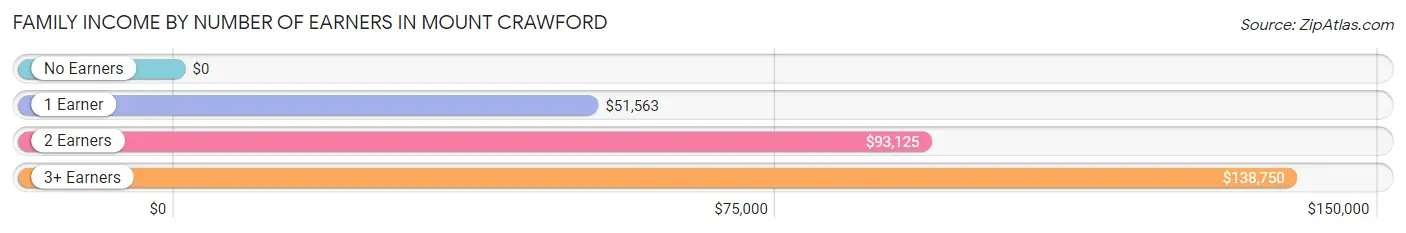
| Number of Earners | # Families | Median Income |
| No Earners | 5 (3.8%) | $0 |
| 1 Earner | 33 (25.2%) | $51,563 |
| 2 Earners | 68 (51.9%) | $93,125 |
| 3+ Earners | 25 (19.1%) | $138,750 |
| Total | 131 (100.0%) | $91,250 |
Household Income in Mount Crawford
Household Income Brackets in Mount Crawford
With 36 households falling in the category, the $75,000 to $99,999 income range is the most frequent in Mount Crawford, accounting for 21.2% of all households. In contrast, only 1 households (0.6%) fall into the $10,000 to $14,999 income bracket, making it the least populous group.
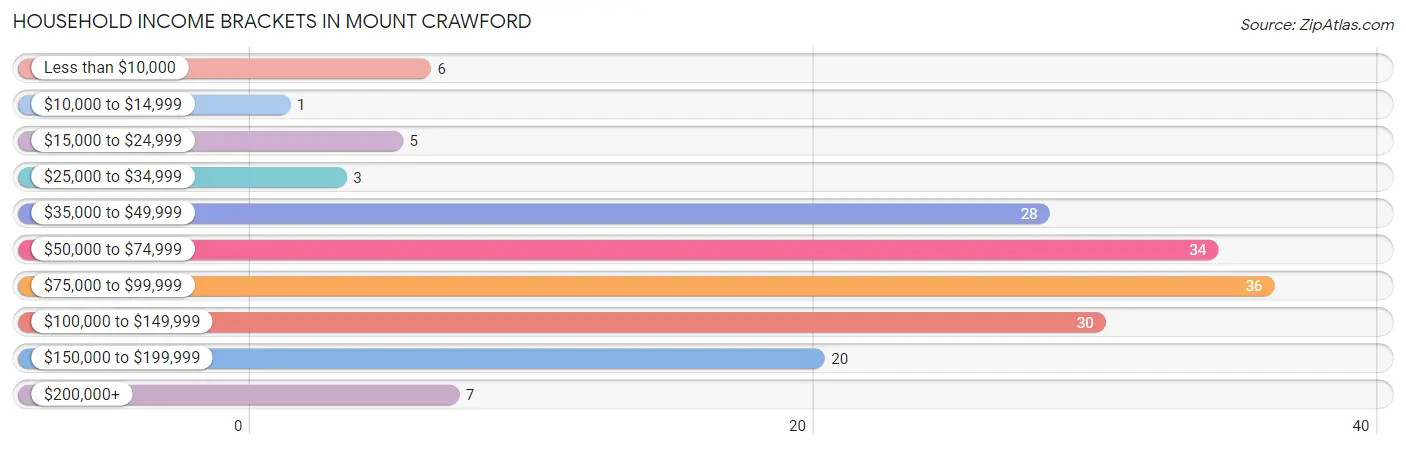
| Income Bracket | # Households | % Households |
| Less than $10,000 | 6 | 3.5% |
| $10,000 to $14,999 | 1 | 0.6% |
| $15,000 to $24,999 | 5 | 2.9% |
| $25,000 to $34,999 | 3 | 1.8% |
| $35,000 to $49,999 | 28 | 16.5% |
| $50,000 to $74,999 | 34 | 20.0% |
| $75,000 to $99,999 | 36 | 21.2% |
| $100,000 to $149,999 | 30 | 17.6% |
| $150,000 to $199,999 | 20 | 11.8% |
| $200,000+ | 7 | 4.1% |
Household Income by Householder Age in Mount Crawford
The median household income in Mount Crawford is $82,083, with the highest median household income of $113,750 found in the 45 to 64 years age bracket for the primary householder. A total of 52 households (30.6%) fall into this category. Meanwhile, the 15 to 24 years age bracket for the primary householder has the lowest median household income of $0, with 2 households (1.2%) in this group.
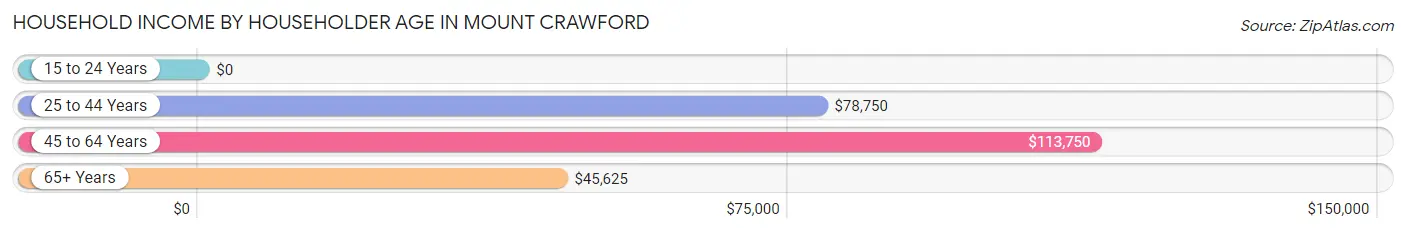
| Income Bracket | # Households | Median Income |
| 15 to 24 Years | 2 (1.2%) | $0 |
| 25 to 44 Years | 91 (53.5%) | $78,750 |
| 45 to 64 Years | 52 (30.6%) | $113,750 |
| 65+ Years | 25 (14.7%) | $45,625 |
| Total | 170 (100.0%) | $82,083 |
Poverty in Mount Crawford
Income Below Poverty by Sex and Age in Mount Crawford
With 3.5% poverty level for males and 20.3% for females among the residents of Mount Crawford, 25 to 34 year old males and 15 year old females are the most vulnerable to poverty, with 8 males (10.7%) and 21 females (100.0%) in their respective age groups living below the poverty level.
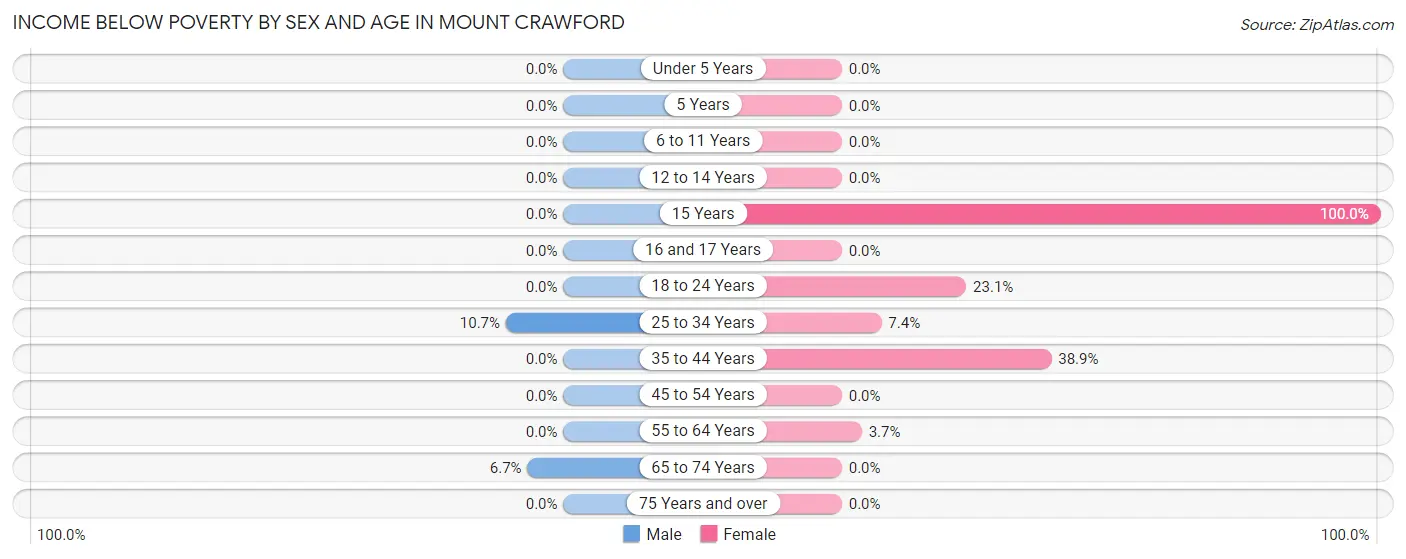
| Age Bracket | Male | Female |
| Under 5 Years | 0 (0.0%) | 0 (0.0%) |
| 5 Years | 0 (0.0%) | 0 (0.0%) |
| 6 to 11 Years | 0 (0.0%) | 0 (0.0%) |
| 12 to 14 Years | 0 (0.0%) | 0 (0.0%) |
| 15 Years | 0 (0.0%) | 21 (100.0%) |
| 16 and 17 Years | 0 (0.0%) | 0 (0.0%) |
| 18 to 24 Years | 0 (0.0%) | 3 (23.1%) |
| 25 to 34 Years | 8 (10.7%) | 5 (7.3%) |
| 35 to 44 Years | 0 (0.0%) | 21 (38.9%) |
| 45 to 54 Years | 0 (0.0%) | 0 (0.0%) |
| 55 to 64 Years | 0 (0.0%) | 1 (3.7%) |
| 65 to 74 Years | 1 (6.7%) | 0 (0.0%) |
| 75 Years and over | 0 (0.0%) | 0 (0.0%) |
| Total | 9 (3.5%) | 51 (20.3%) |
Income Above Poverty by Sex and Age in Mount Crawford
According to the poverty statistics in Mount Crawford, males aged under 5 years and females aged under 5 years are the age groups that are most secure financially, with 100.0% of males and 100.0% of females in these age groups living above the poverty line.
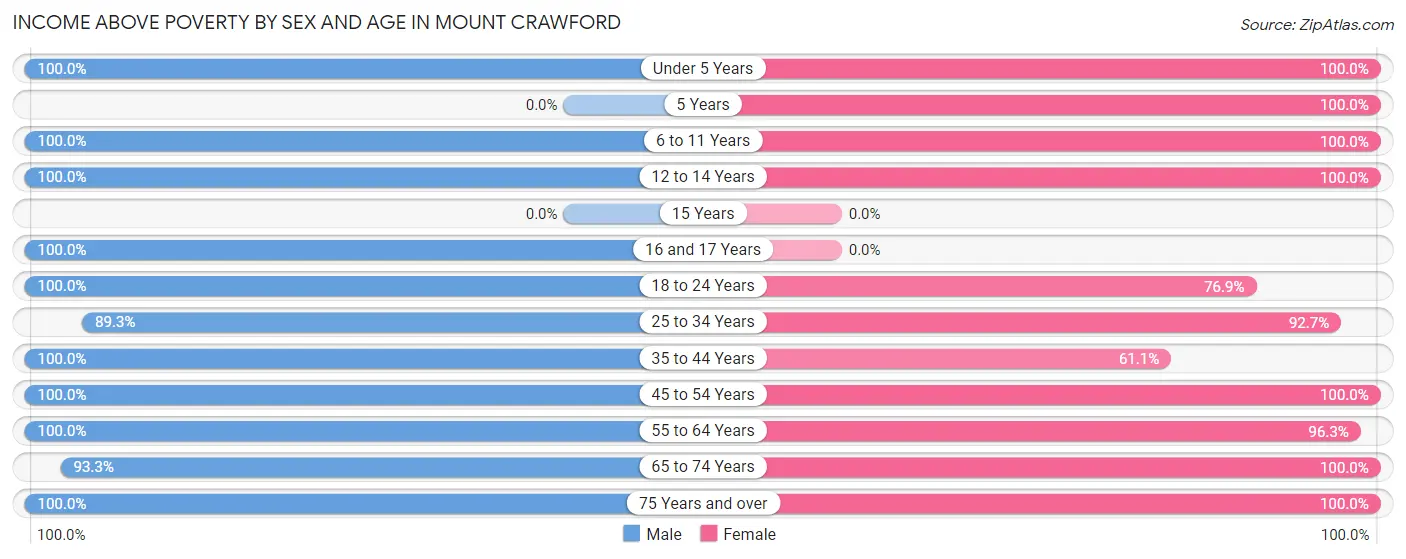
| Age Bracket | Male | Female |
| Under 5 Years | 16 (100.0%) | 21 (100.0%) |
| 5 Years | 0 (0.0%) | 1 (100.0%) |
| 6 to 11 Years | 15 (100.0%) | 9 (100.0%) |
| 12 to 14 Years | 7 (100.0%) | 1 (100.0%) |
| 15 Years | 0 (0.0%) | 0 (0.0%) |
| 16 and 17 Years | 7 (100.0%) | 0 (0.0%) |
| 18 to 24 Years | 22 (100.0%) | 10 (76.9%) |
| 25 to 34 Years | 67 (89.3%) | 63 (92.6%) |
| 35 to 44 Years | 33 (100.0%) | 33 (61.1%) |
| 45 to 54 Years | 23 (100.0%) | 12 (100.0%) |
| 55 to 64 Years | 37 (100.0%) | 26 (96.3%) |
| 65 to 74 Years | 14 (93.3%) | 19 (100.0%) |
| 75 Years and over | 8 (100.0%) | 5 (100.0%) |
| Total | 249 (96.5%) | 200 (79.7%) |
Income Below Poverty Among Married-Couple Families in Mount Crawford
The poverty statistics for married-couple families in Mount Crawford show that 5.1% or 5 of the total 98 families live below the poverty line. Families with 1 or 2 children have the highest poverty rate of 10.4%, comprising of 5 families. On the other hand, families with no children have the lowest poverty rate of 0.0%, which includes 0 families.
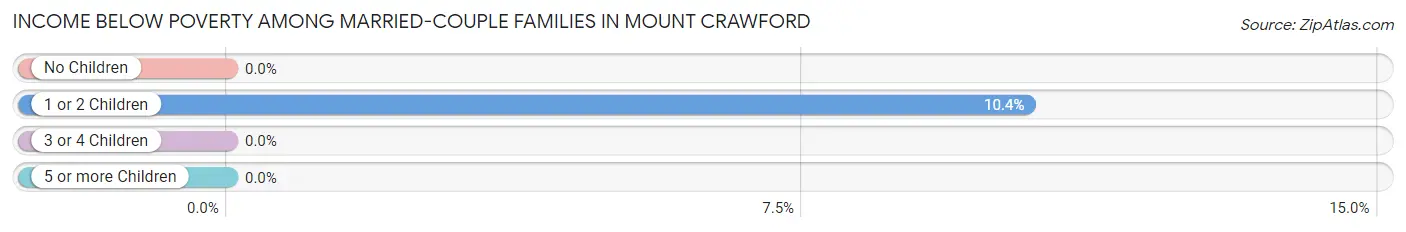
| Children | Above Poverty | Below Poverty |
| No Children | 50 (100.0%) | 0 (0.0%) |
| 1 or 2 Children | 43 (89.6%) | 5 (10.4%) |
| 3 or 4 Children | 0 (0.0%) | 0 (0.0%) |
| 5 or more Children | 0 (0.0%) | 0 (0.0%) |
| Total | 93 (94.9%) | 5 (5.1%) |
Income Below Poverty Among Single-Parent Households in Mount Crawford
| Children | Single Father | Single Mother |
| No Children | 0 (0.0%) | 0 (0.0%) |
| 1 or 2 Children | 0 (0.0%) | 0 (0.0%) |
| 3 or 4 Children | 0 (0.0%) | 0 (0.0%) |
| 5 or more Children | 0 (0.0%) | 0 (0.0%) |
| Total | 0 (0.0%) | 0 (0.0%) |
Income Below Poverty Among Married-Couple vs Single-Parent Households in Mount Crawford
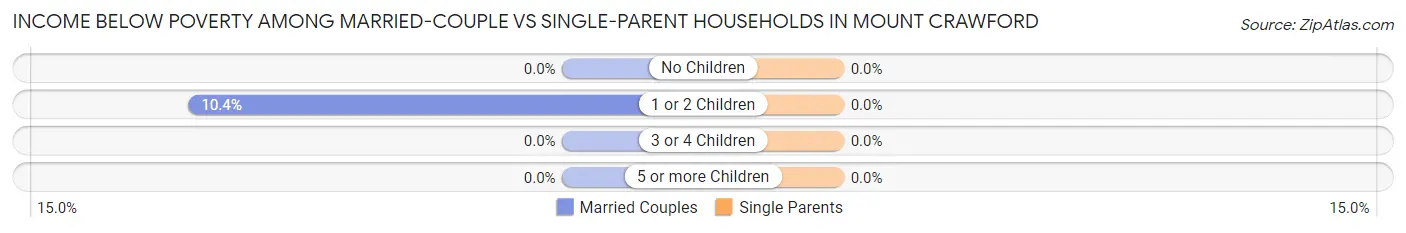
| Children | Married-Couple Families | Single-Parent Households |
| No Children | 0 (0.0%) | 0 (0.0%) |
| 1 or 2 Children | 5 (10.4%) | 0 (0.0%) |
| 3 or 4 Children | 0 (0.0%) | 0 (0.0%) |
| 5 or more Children | 0 (0.0%) | 0 (0.0%) |
| Total | 5 (5.1%) | 0 (0.0%) |
Race in Mount Crawford
The most populous races in Mount Crawford are White / Caucasian (454 | 89.2%), Hispanic or Latino (51 | 10.0%), and Some other Race (49 | 9.6%).
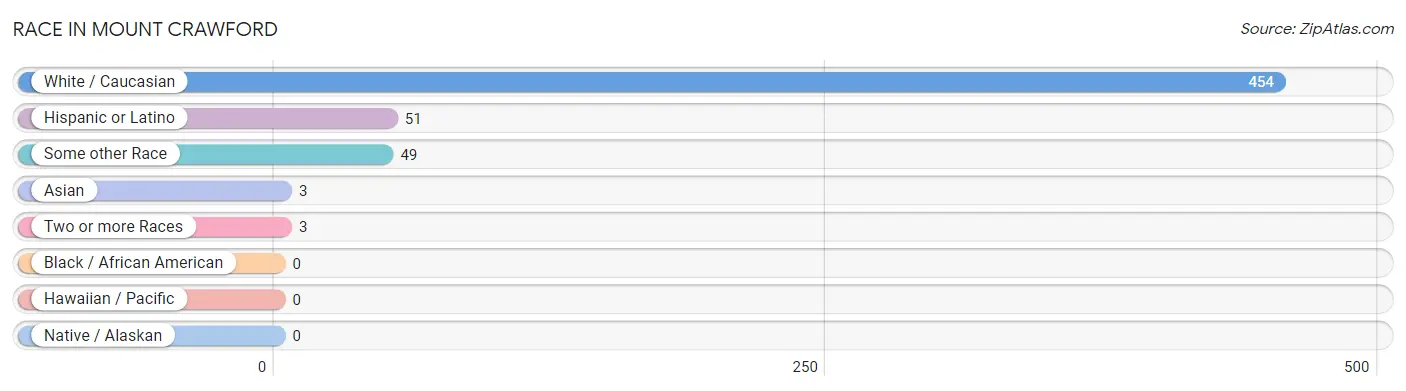
| Race | # Population | % Population |
| Asian | 3 | 0.6% |
| Black / African American | 0 | 0.0% |
| Hawaiian / Pacific | 0 | 0.0% |
| Hispanic or Latino | 51 | 10.0% |
| Native / Alaskan | 0 | 0.0% |
| White / Caucasian | 454 | 89.2% |
| Two or more Races | 3 | 0.6% |
| Some other Race | 49 | 9.6% |
| Total | 509 | 100.0% |
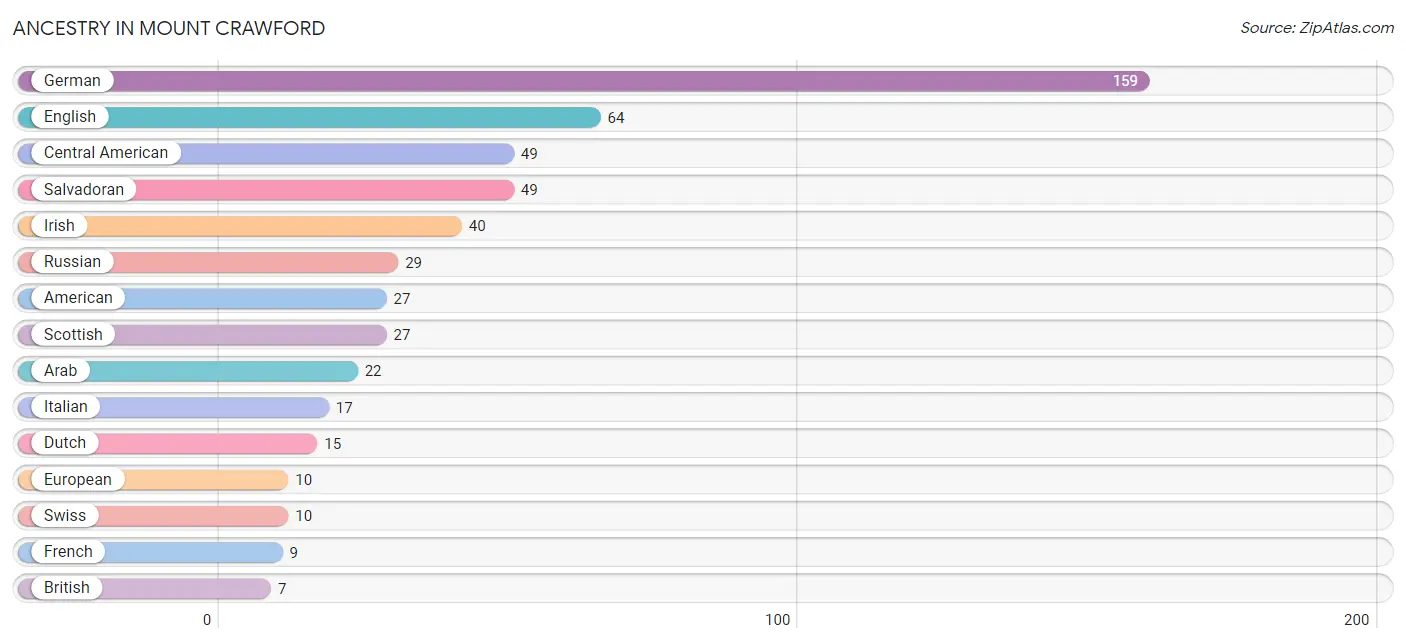
Ancestry in Mount Crawford
The most populous ancestries reported in Mount Crawford are German (159 | 31.2%), English (64 | 12.6%), Central American (49 | 9.6%), Salvadoran (49 | 9.6%), and Irish (40 | 7.9%), together accounting for 70.9% of all Mount Crawford residents.
| Ancestry | # Population | % Population |
| American | 27 | 5.3% |
| Arab | 22 | 4.3% |
| British | 7 | 1.4% |
| Burmese | 1 | 0.2% |
| Central American | 49 | 9.6% |
| Dutch | 15 | 2.9% |
| Eastern European | 4 | 0.8% |
| English | 64 | 12.6% |
| European | 10 | 2.0% |
| French | 9 | 1.8% |
| French Canadian | 1 | 0.2% |
| German | 159 | 31.2% |
| Irish | 40 | 7.9% |
| Italian | 17 | 3.3% |
| Japanese | 5 | 1.0% |
| Lithuanian | 3 | 0.6% |
| Mexican | 1 | 0.2% |
| Polish | 1 | 0.2% |
| Portuguese | 1 | 0.2% |
| Puerto Rican | 1 | 0.2% |
| Russian | 29 | 5.7% |
| Salvadoran | 49 | 9.6% |
| Scotch-Irish | 6 | 1.2% |
| Scottish | 27 | 5.3% |
| Serbian | 4 | 0.8% |
| Slovak | 2 | 0.4% |
| Sri Lankan | 2 | 0.4% |
| Swiss | 10 | 2.0% |
| Ukrainian | 1 | 0.2% |
| Welsh | 2 | 0.4% | View All 30 Rows |
Immigrants in Mount Crawford
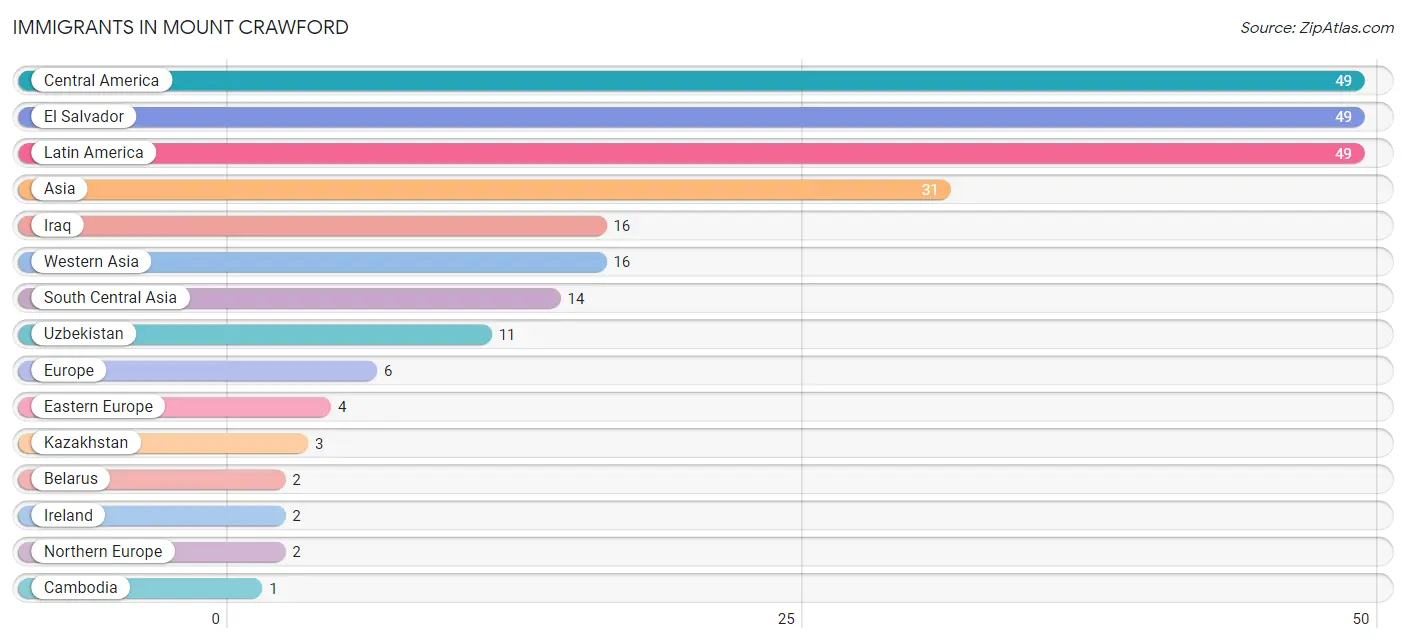
The most numerous immigrant groups reported in Mount Crawford came from Central America (49 | 9.6%), El Salvador (49 | 9.6%), Latin America (49 | 9.6%), Asia (31 | 6.1%), and Iraq (16 | 3.1%), together accounting for 38.1% of all Mount Crawford residents.
| Immigration Origin | # Population | % Population |
| Asia | 31 | 6.1% |
| Belarus | 2 | 0.4% |
| Cambodia | 1 | 0.2% |
| Central America | 49 | 9.6% |
| Eastern Europe | 4 | 0.8% |
| El Salvador | 49 | 9.6% |
| Europe | 6 | 1.2% |
| Iraq | 16 | 3.1% |
| Ireland | 2 | 0.4% |
| Kazakhstan | 3 | 0.6% |
| Latin America | 49 | 9.6% |
| Northern Europe | 2 | 0.4% |
| Russia | 1 | 0.2% |
| South Central Asia | 14 | 2.8% |
| South Eastern Asia | 1 | 0.2% |
| Ukraine | 1 | 0.2% |
| Uzbekistan | 11 | 2.2% |
| Western Asia | 16 | 3.1% | View All 18 Rows |
Sex and Age in Mount Crawford
Sex and Age in Mount Crawford
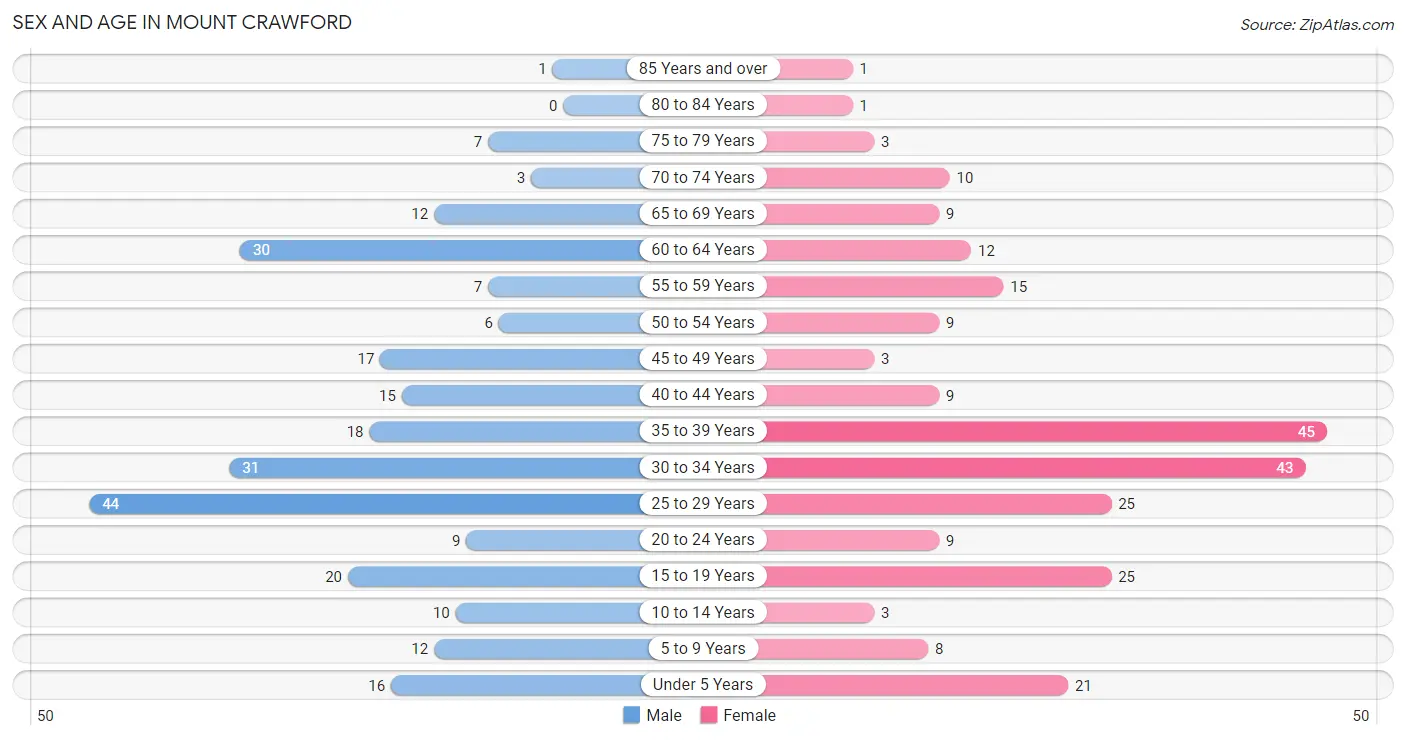
The most populous age groups in Mount Crawford are 25 to 29 Years (44 | 17.1%) for men and 35 to 39 Years (45 | 17.9%) for women.
| Age Bracket | Male | Female |
| Under 5 Years | 16 (6.2%) | 21 (8.4%) |
| 5 to 9 Years | 12 (4.6%) | 8 (3.2%) |
| 10 to 14 Years | 10 (3.9%) | 3 (1.2%) |
| 15 to 19 Years | 20 (7.7%) | 25 (10.0%) |
| 20 to 24 Years | 9 (3.5%) | 9 (3.6%) |
| 25 to 29 Years | 44 (17.1%) | 25 (10.0%) |
| 30 to 34 Years | 31 (12.0%) | 43 (17.1%) |
| 35 to 39 Years | 18 (7.0%) | 45 (17.9%) |
| 40 to 44 Years | 15 (5.8%) | 9 (3.6%) |
| 45 to 49 Years | 17 (6.6%) | 3 (1.2%) |
| 50 to 54 Years | 6 (2.3%) | 9 (3.6%) |
| 55 to 59 Years | 7 (2.7%) | 15 (6.0%) |
| 60 to 64 Years | 30 (11.6%) | 12 (4.8%) |
| 65 to 69 Years | 12 (4.6%) | 9 (3.6%) |
| 70 to 74 Years | 3 (1.2%) | 10 (4.0%) |
| 75 to 79 Years | 7 (2.7%) | 3 (1.2%) |
| 80 to 84 Years | 0 (0.0%) | 1 (0.4%) |
| 85 Years and over | 1 (0.4%) | 1 (0.4%) |
| Total | 258 (100.0%) | 251 (100.0%) |
Families and Households in Mount Crawford
Median Family Size in Mount Crawford
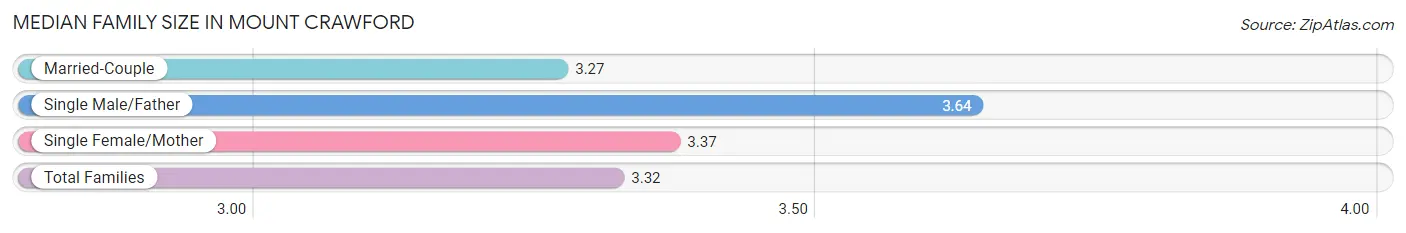
The median family size in Mount Crawford is 3.32 persons per family, with single male/father families (14 | 10.7%) accounting for the largest median family size of 3.64 persons per family. On the other hand, married-couple families (98 | 74.8%) represent the smallest median family size with 3.27 persons per family.
| Family Type | # Families | Family Size |
| Married-Couple | 98 (74.8%) | 3.27 |
| Single Male/Father | 14 (10.7%) | 3.64 |
| Single Female/Mother | 19 (14.5%) | 3.37 |
| Total Families | 131 (100.0%) | 3.32 |
Median Household Size in Mount Crawford
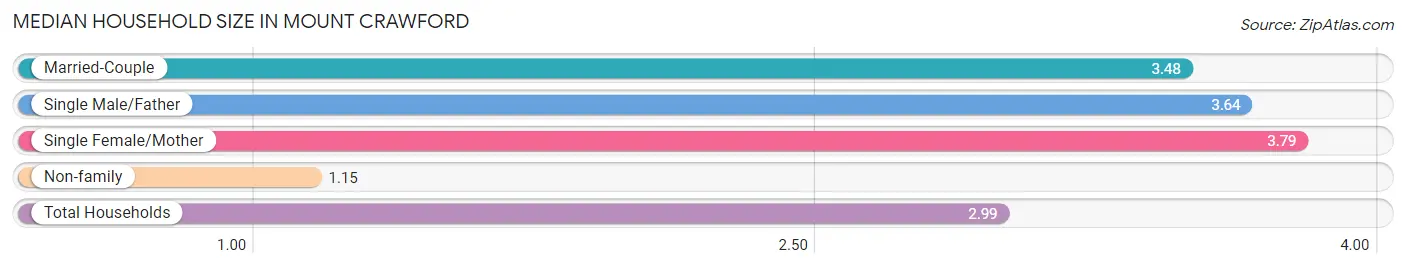
The median household size in Mount Crawford is 2.99 persons per household, with single female/mother households (19 | 11.2%) accounting for the largest median household size of 3.79 persons per household. non-family households (39 | 22.9%) represent the smallest median household size with 1.15 persons per household.
| Household Type | # Households | Household Size |
| Married-Couple | 98 (57.7%) | 3.48 |
| Single Male/Father | 14 (8.2%) | 3.64 |
| Single Female/Mother | 19 (11.2%) | 3.79 |
| Non-family | 39 (22.9%) | 1.15 |
| Total Households | 170 (100.0%) | 2.99 |
Household Size by Marriage Status in Mount Crawford
Out of a total of 170 households in Mount Crawford, 131 (77.1%) are family households, while 39 (22.9%) are nonfamily households. The most numerous type of family households are 3-person households, comprising 51, and the most common type of nonfamily households are 1-person households, comprising 33.
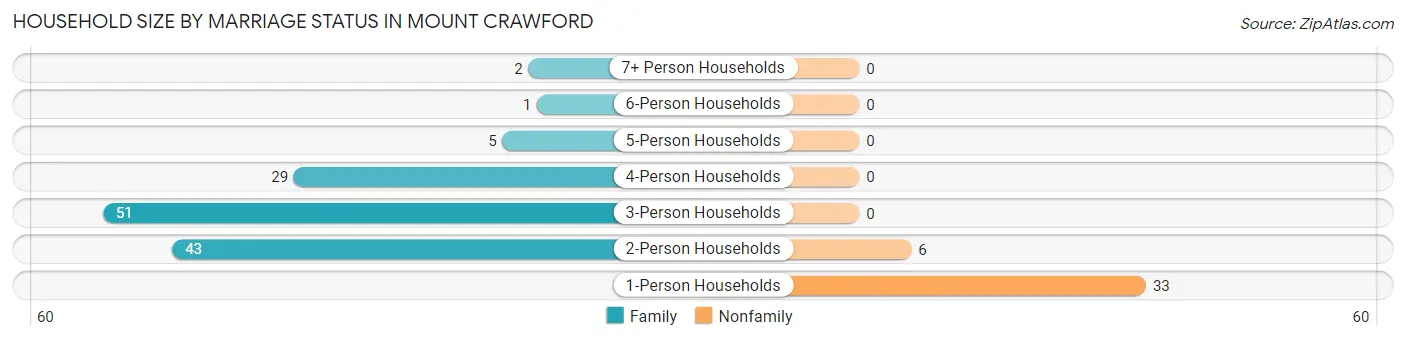
| Household Size | Family Households | Nonfamily Households |
| 1-Person Households | - | 33 (19.4%) |
| 2-Person Households | 43 (25.3%) | 6 (3.5%) |
| 3-Person Households | 51 (30.0%) | 0 (0.0%) |
| 4-Person Households | 29 (17.1%) | 0 (0.0%) |
| 5-Person Households | 5 (2.9%) | 0 (0.0%) |
| 6-Person Households | 1 (0.6%) | 0 (0.0%) |
| 7+ Person Households | 2 (1.2%) | 0 (0.0%) |
| Total | 131 (77.1%) | 39 (22.9%) |
Female Fertility in Mount Crawford
Fertility by Age in Mount Crawford
Average fertility rate in Mount Crawford is 63.0 births per 1,000 women. Women in the age bracket of 20 to 34 years have the highest fertility rate with 130.0 births per 1,000 women. Women in the age bracket of 20 to 34 years acount for 100.0% of all women with births.
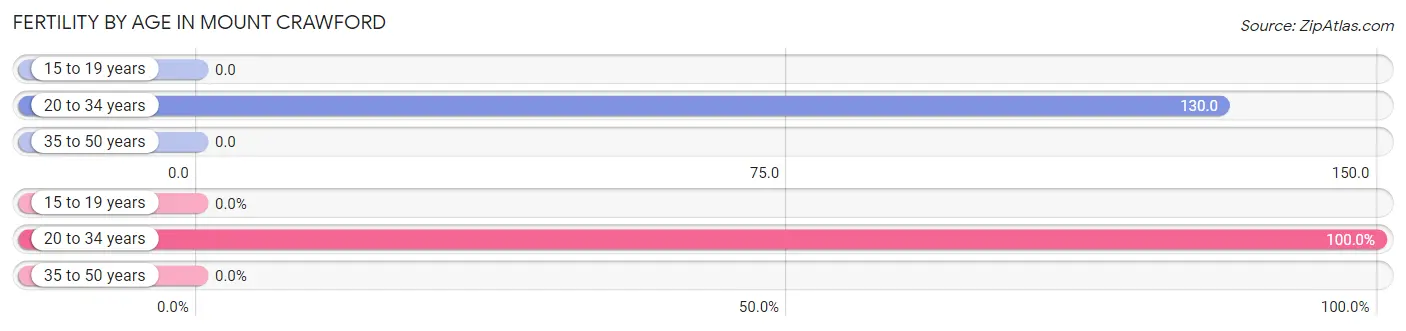
| Age Bracket | Women with Births | Births / 1,000 Women |
| 15 to 19 years | 0 (0.0%) | 0.0 |
| 20 to 34 years | 10 (100.0%) | 130.0 |
| 35 to 50 years | 0 (0.0%) | 0.0 |
| Total | 10 (100.0%) | 63.0 |
Fertility by Age by Marriage Status in Mount Crawford
80.0% of women with births (10) in Mount Crawford are married. The highest percentage of unmarried women with births falls into 20 to 34 years age bracket with 20.0% of them unmarried at the time of birth, while the lowest percentage of unmarried women with births belong to 20 to 34 years age bracket with 20.0% of them unmarried.
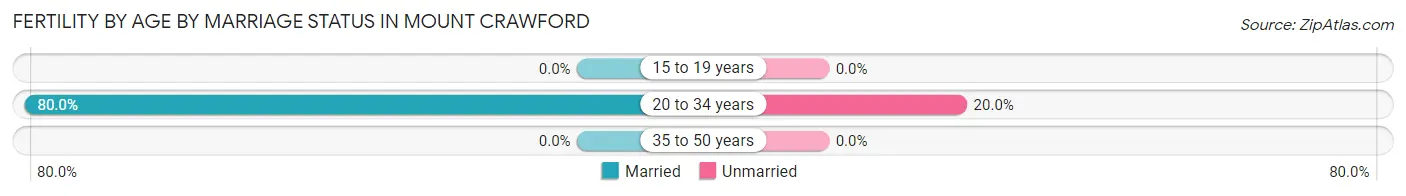
| Age Bracket | Married | Unmarried |
| 15 to 19 years | 0 (0.0%) | 0 (0.0%) |
| 20 to 34 years | 8 (80.0%) | 2 (20.0%) |
| 35 to 50 years | 0 (0.0%) | 0 (0.0%) |
| Total | 8 (80.0%) | 2 (20.0%) |
Fertility by Education in Mount Crawford
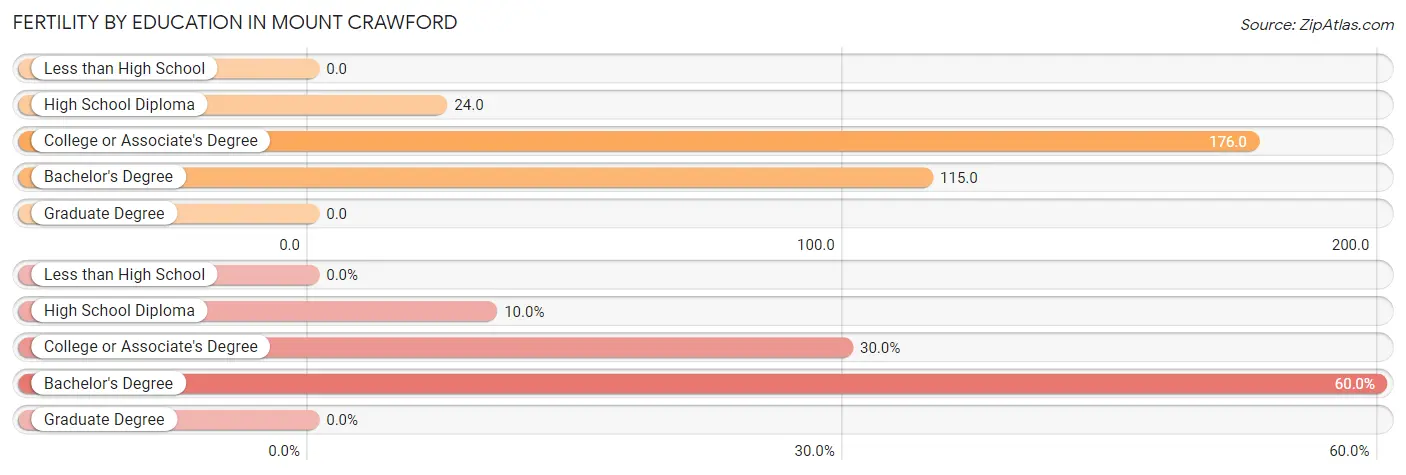
| Educational Attainment | Women with Births | Births / 1,000 Women |
| Less than High School | 0 (0.0%) | 0.0 |
| High School Diploma | 1 (10.0%) | 24.0 |
| College or Associate's Degree | 3 (30.0%) | 176.0 |
| Bachelor's Degree | 6 (60.0%) | 115.0 |
| Graduate Degree | 0 (0.0%) | 0.0 |
| Total | 10 (100.0%) | 63.0 |
Fertility by Education by Marriage Status in Mount Crawford
20.0% of women with births in Mount Crawford are unmarried. Women with the educational attainment of high school diploma are most likely to be married with 100.0% of them married at childbirth, while women with the educational attainment of college or associate's degree are least likely to be married with 66.7% of them unmarried at childbirth.
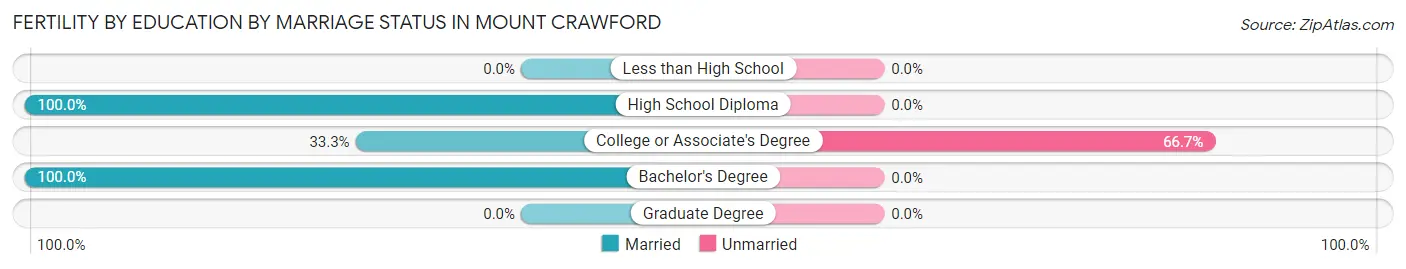
| Educational Attainment | Married | Unmarried |
| Less than High School | 0 (0.0%) | 0 (0.0%) |
| High School Diploma | 1 (100.0%) | 0 (0.0%) |
| College or Associate's Degree | 1 (33.3%) | 2 (66.7%) |
| Bachelor's Degree | 6 (100.0%) | 0 (0.0%) |
| Graduate Degree | 0 (0.0%) | 0 (0.0%) |
| Total | 8 (80.0%) | 2 (20.0%) |
Employment Characteristics in Mount Crawford
Employment by Class of Employer in Mount Crawford
Among the 304 employed individuals in Mount Crawford, private company employees (193 | 63.5%), local government employees (26 | 8.6%), and state government employees (25 | 8.2%) make up the most common classes of employment.
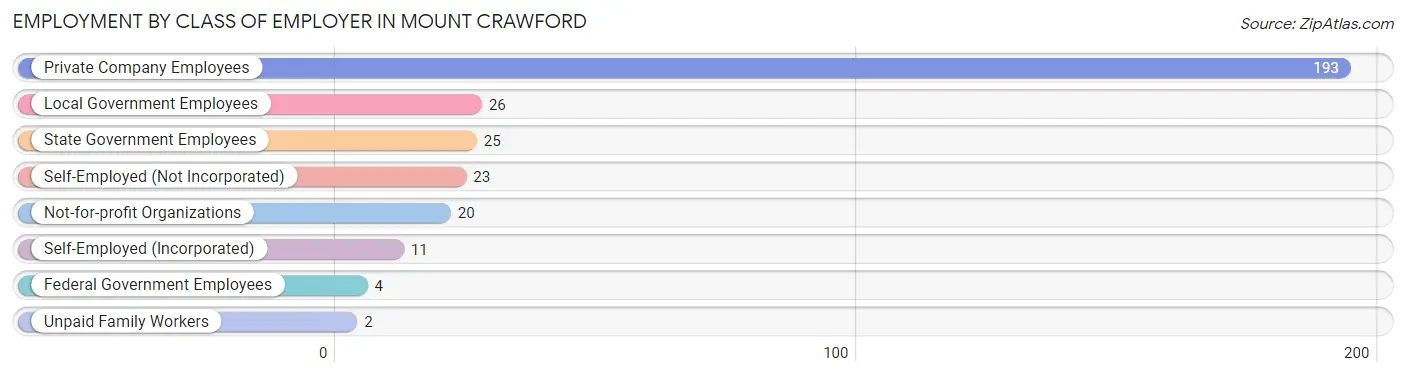
| Employer Class | # Employees | % Employees |
| Private Company Employees | 193 | 63.5% |
| Self-Employed (Incorporated) | 11 | 3.6% |
| Self-Employed (Not Incorporated) | 23 | 7.6% |
| Not-for-profit Organizations | 20 | 6.6% |
| Local Government Employees | 26 | 8.6% |
| State Government Employees | 25 | 8.2% |
| Federal Government Employees | 4 | 1.3% |
| Unpaid Family Workers | 2 | 0.7% |
| Total | 304 | 100.0% |
Employment Status by Age in Mount Crawford
According to the labor force statistics for Mount Crawford, out of the total population over 16 years of age (418), 74.6% or 312 individuals are in the labor force, with 1.0% or 3 of them unemployed. The age group with the highest labor force participation rate is 30 to 34 years, with 95.9% or 71 individuals in the labor force. Within the labor force, the 20 to 24 years age range has the highest percentage of unemployed individuals, with 7.7% or 1 of them being unemployed.
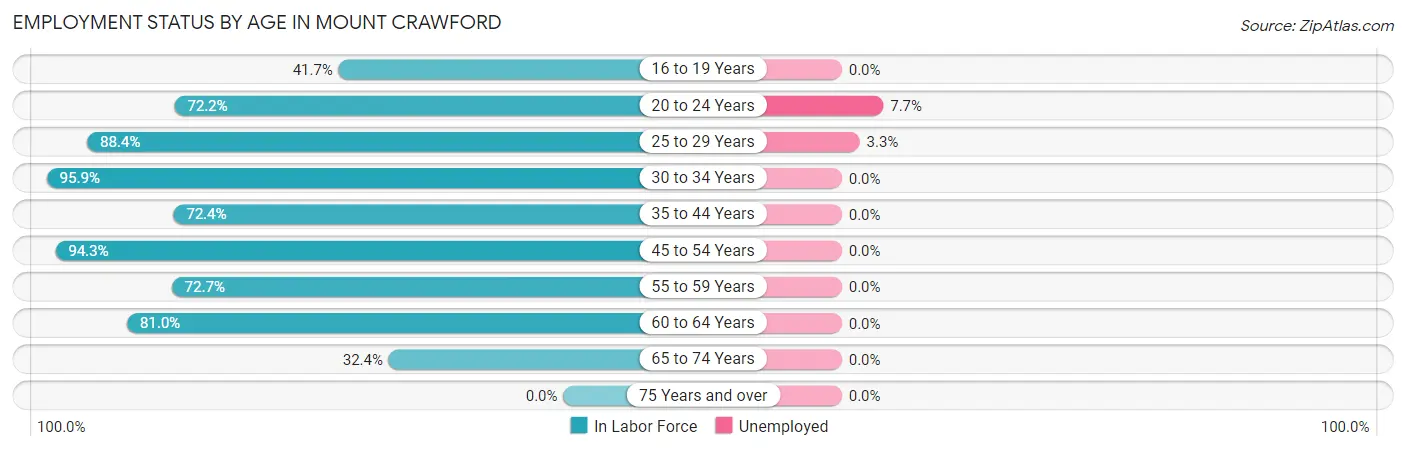
| Age Bracket | In Labor Force | Unemployed |
| 16 to 19 Years | 10 (41.7%) | 0 (0.0%) |
| 20 to 24 Years | 13 (72.2%) | 1 (7.7%) |
| 25 to 29 Years | 61 (88.4%) | 2 (3.3%) |
| 30 to 34 Years | 71 (95.9%) | 0 (0.0%) |
| 35 to 44 Years | 63 (72.4%) | 0 (0.0%) |
| 45 to 54 Years | 33 (94.3%) | 0 (0.0%) |
| 55 to 59 Years | 16 (72.7%) | 0 (0.0%) |
| 60 to 64 Years | 34 (81.0%) | 0 (0.0%) |
| 65 to 74 Years | 11 (32.4%) | 0 (0.0%) |
| 75 Years and over | 0 (0.0%) | 0 (0.0%) |
| Total | 312 (74.6%) | 3 (1.0%) |
Employment Status by Educational Attainment in Mount Crawford
According to labor force statistics for Mount Crawford, 84.5% of individuals (278) out of the total population between 25 and 64 years of age (329) are in the labor force, with 0.7% or 2 of them being unemployed. The group with the highest labor force participation rate are those with the educational attainment of college / associate degree, with 97.8% or 45 individuals in the labor force. Within the labor force, individuals with high school diploma education have the highest percentage of unemployment, with 2.3% or 2 of them being unemployed.
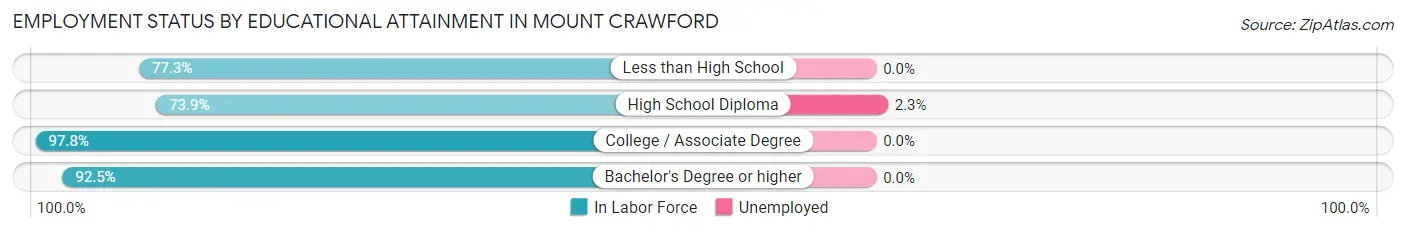
| Educational Attainment | In Labor Force | Unemployed |
| Less than High School | 34 (77.3%) | 0 (0.0%) |
| High School Diploma | 88 (73.9%) | 3 (2.3%) |
| College / Associate Degree | 45 (97.8%) | 0 (0.0%) |
| Bachelor's Degree or higher | 111 (92.5%) | 0 (0.0%) |
| Total | 278 (84.5%) | 2 (0.7%) |
Employment Occupations by Sex in Mount Crawford
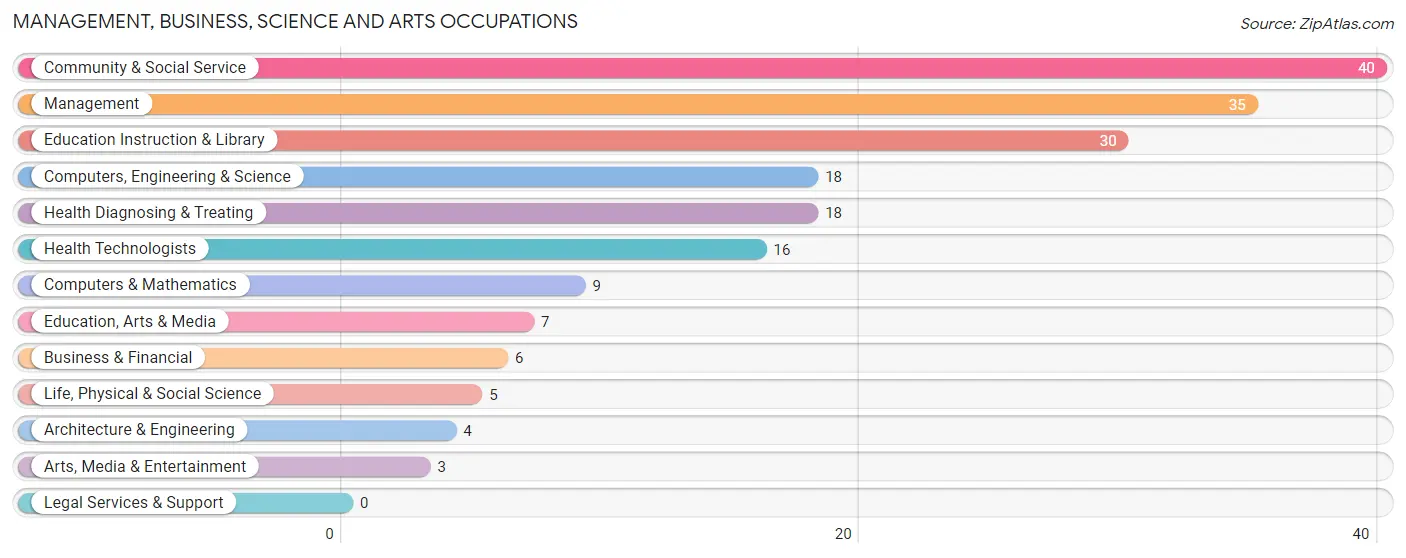
Management, Business, Science and Arts Occupations
The most common Management, Business, Science and Arts occupations in Mount Crawford are Community & Social Service (40 | 12.9%), Management (35 | 11.3%), Education Instruction & Library (30 | 9.7%), Computers, Engineering & Science (18 | 5.8%), and Health Diagnosing & Treating (18 | 5.8%).
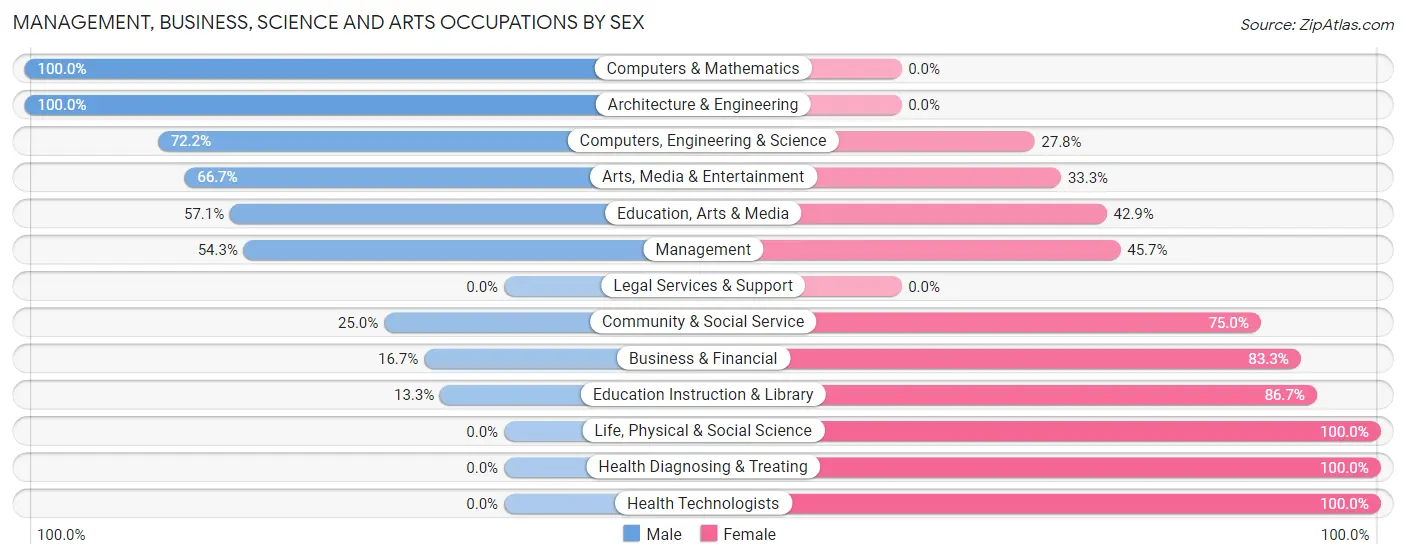
Management, Business, Science and Arts Occupations by Sex
Within the Management, Business, Science and Arts occupations in Mount Crawford, the most male-oriented occupations are Computers & Mathematics (100.0%), Architecture & Engineering (100.0%), and Computers, Engineering & Science (72.2%), while the most female-oriented occupations are Life, Physical & Social Science (100.0%), Health Diagnosing & Treating (100.0%), and Health Technologists (100.0%).
| Occupation | Male | Female |
| Management | 19 (54.3%) | 16 (45.7%) |
| Business & Financial | 1 (16.7%) | 5 (83.3%) |
| Computers, Engineering & Science | 13 (72.2%) | 5 (27.8%) |
| Computers & Mathematics | 9 (100.0%) | 0 (0.0%) |
| Architecture & Engineering | 4 (100.0%) | 0 (0.0%) |
| Life, Physical & Social Science | 0 (0.0%) | 5 (100.0%) |
| Community & Social Service | 10 (25.0%) | 30 (75.0%) |
| Education, Arts & Media | 4 (57.1%) | 3 (42.9%) |
| Legal Services & Support | 0 (0.0%) | 0 (0.0%) |
| Education Instruction & Library | 4 (13.3%) | 26 (86.7%) |
| Arts, Media & Entertainment | 2 (66.7%) | 1 (33.3%) |
| Health Diagnosing & Treating | 0 (0.0%) | 18 (100.0%) |
| Health Technologists | 0 (0.0%) | 16 (100.0%) |
| Total (Category) | 43 (36.7%) | 74 (63.2%) |
| Total (Overall) | 175 (56.6%) | 134 (43.4%) |
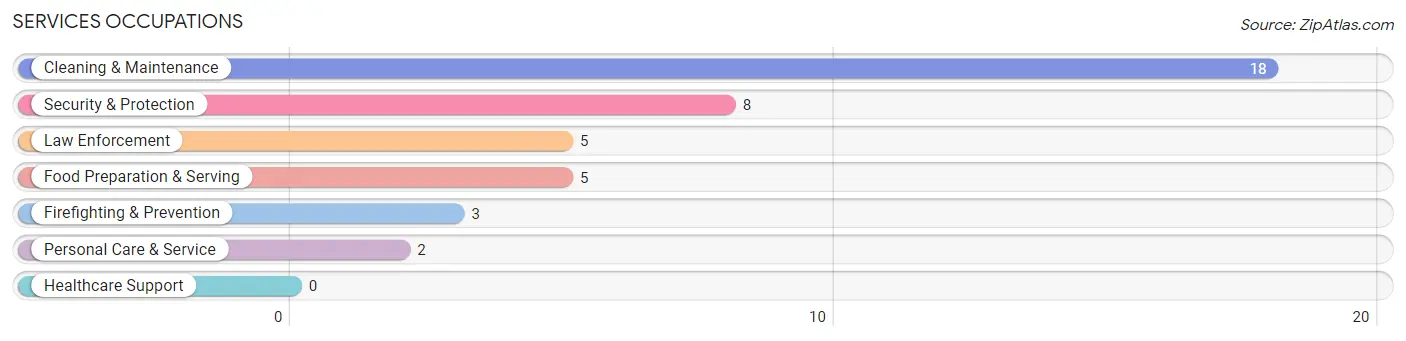
Services Occupations
The most common Services occupations in Mount Crawford are Cleaning & Maintenance (18 | 5.8%), Security & Protection (8 | 2.6%), Law Enforcement (5 | 1.6%), Food Preparation & Serving (5 | 1.6%), and Firefighting & Prevention (3 | 1.0%).
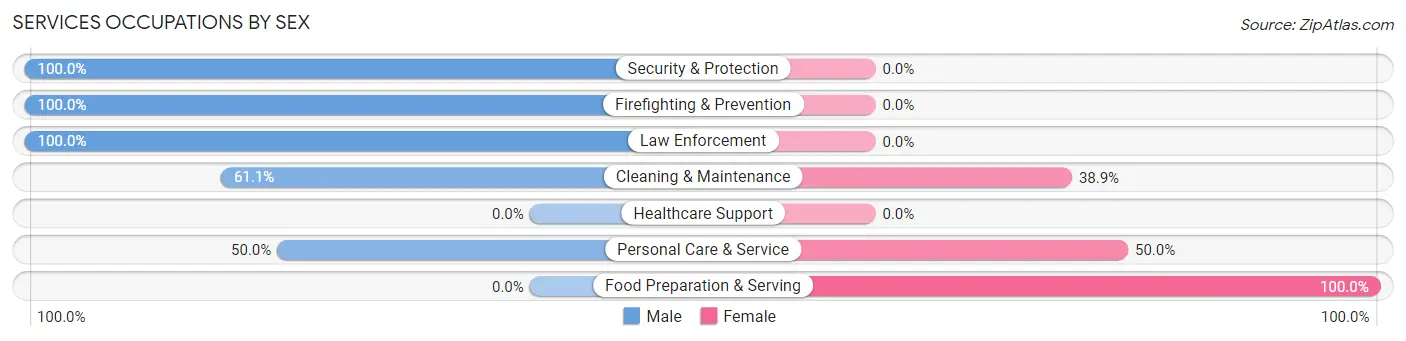
Services Occupations by Sex
Within the Services occupations in Mount Crawford, the most male-oriented occupations are Security & Protection (100.0%), Firefighting & Prevention (100.0%), and Law Enforcement (100.0%), while the most female-oriented occupations are Food Preparation & Serving (100.0%), Personal Care & Service (50.0%), and Cleaning & Maintenance (38.9%).
| Occupation | Male | Female |
| Healthcare Support | 0 (0.0%) | 0 (0.0%) |
| Security & Protection | 8 (100.0%) | 0 (0.0%) |
| Firefighting & Prevention | 3 (100.0%) | 0 (0.0%) |
| Law Enforcement | 5 (100.0%) | 0 (0.0%) |
| Food Preparation & Serving | 0 (0.0%) | 5 (100.0%) |
| Cleaning & Maintenance | 11 (61.1%) | 7 (38.9%) |
| Personal Care & Service | 1 (50.0%) | 1 (50.0%) |
| Total (Category) | 20 (60.6%) | 13 (39.4%) |
| Total (Overall) | 175 (56.6%) | 134 (43.4%) |
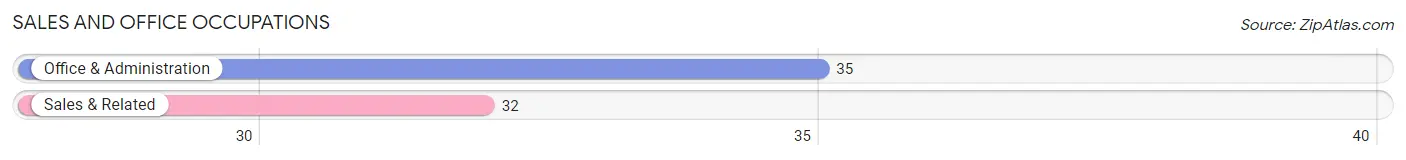
Sales and Office Occupations
The most common Sales and Office occupations in Mount Crawford are Office & Administration (35 | 11.3%), and Sales & Related (32 | 10.4%).
Sales and Office Occupations by Sex
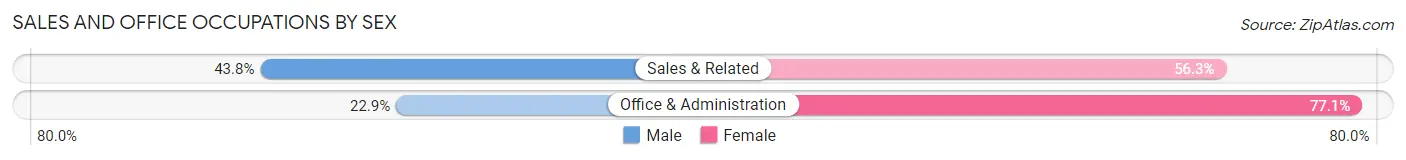
| Occupation | Male | Female |
| Sales & Related | 14 (43.8%) | 18 (56.2%) |
| Office & Administration | 8 (22.9%) | 27 (77.1%) |
| Total (Category) | 22 (32.8%) | 45 (67.2%) |
| Total (Overall) | 175 (56.6%) | 134 (43.4%) |
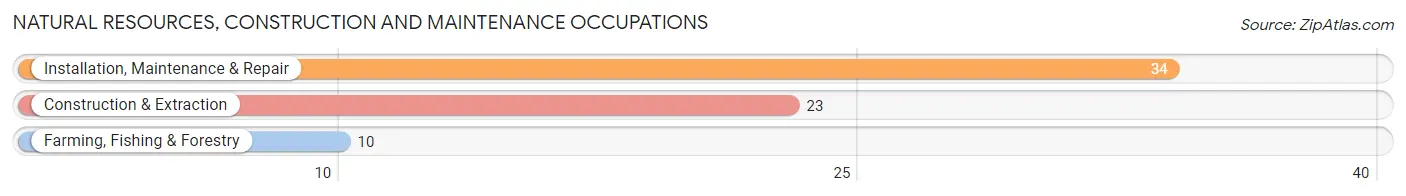
Natural Resources, Construction and Maintenance Occupations
The most common Natural Resources, Construction and Maintenance occupations in Mount Crawford are Installation, Maintenance & Repair (34 | 11.0%), Construction & Extraction (23 | 7.4%), and Farming, Fishing & Forestry (10 | 3.2%).
Natural Resources, Construction and Maintenance Occupations by Sex
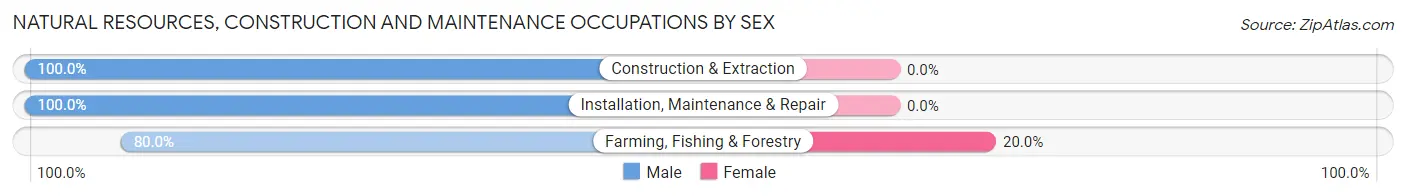
| Occupation | Male | Female |
| Farming, Fishing & Forestry | 8 (80.0%) | 2 (20.0%) |
| Construction & Extraction | 23 (100.0%) | 0 (0.0%) |
| Installation, Maintenance & Repair | 34 (100.0%) | 0 (0.0%) |
| Total (Category) | 65 (97.0%) | 2 (3.0%) |
| Total (Overall) | 175 (56.6%) | 134 (43.4%) |
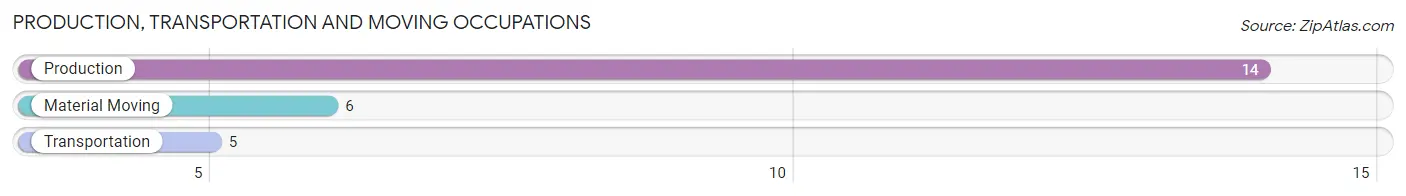
Production, Transportation and Moving Occupations
The most common Production, Transportation and Moving occupations in Mount Crawford are Production (14 | 4.5%), Material Moving (6 | 1.9%), and Transportation (5 | 1.6%).
Production, Transportation and Moving Occupations by Sex
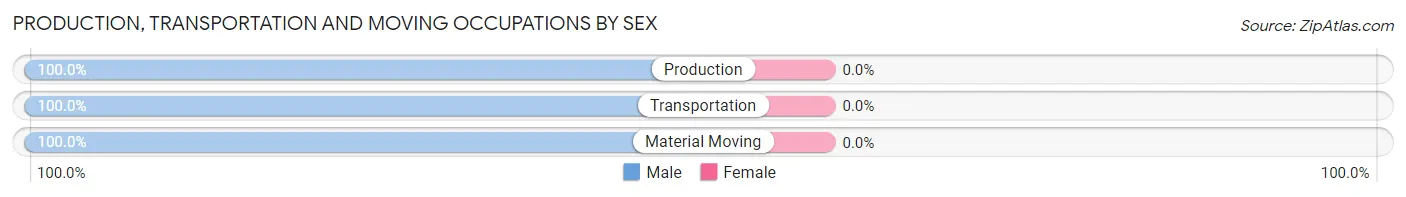
| Occupation | Male | Female |
| Production | 14 (100.0%) | 0 (0.0%) |
| Transportation | 5 (100.0%) | 0 (0.0%) |
| Material Moving | 6 (100.0%) | 0 (0.0%) |
| Total (Category) | 25 (100.0%) | 0 (0.0%) |
| Total (Overall) | 175 (56.6%) | 134 (43.4%) |
Employment Industries by Sex in Mount Crawford
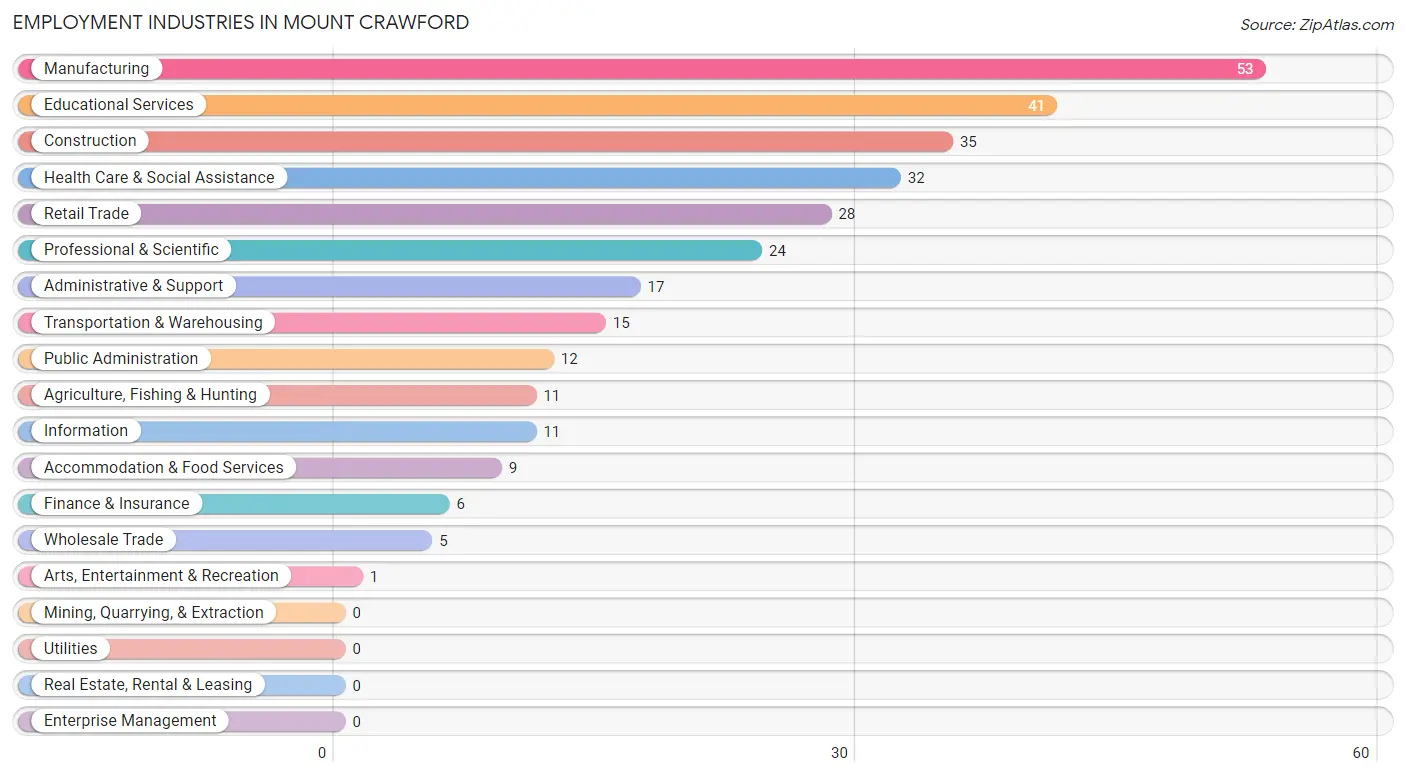
Employment Industries in Mount Crawford
The major employment industries in Mount Crawford include Manufacturing (53 | 17.2%), Educational Services (41 | 13.3%), Construction (35 | 11.3%), Health Care & Social Assistance (32 | 10.4%), and Retail Trade (28 | 9.1%).
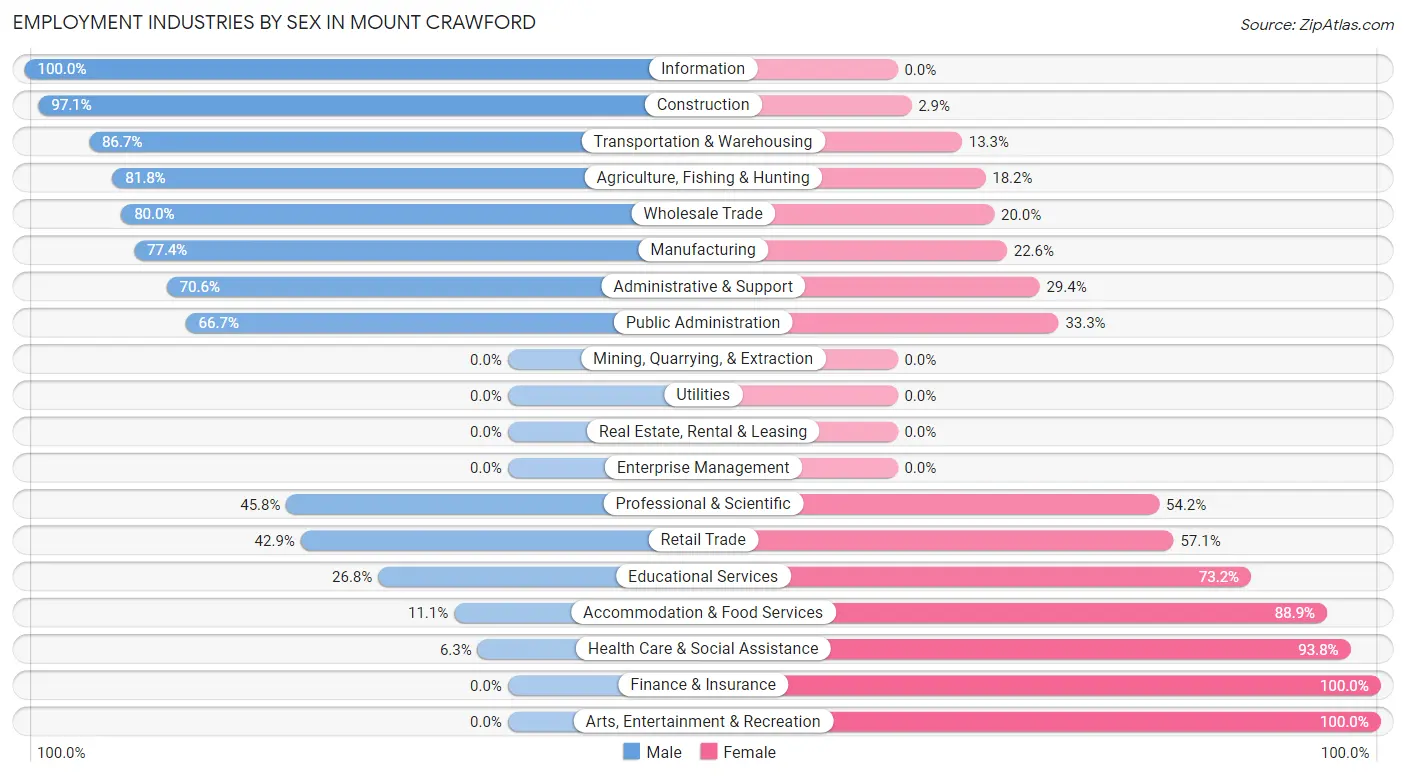
Employment Industries by Sex in Mount Crawford
The Mount Crawford industries that see more men than women are Information (100.0%), Construction (97.1%), and Transportation & Warehousing (86.7%), whereas the industries that tend to have a higher number of women are Finance & Insurance (100.0%), Arts, Entertainment & Recreation (100.0%), and Health Care & Social Assistance (93.8%).
| Industry | Male | Female |
| Agriculture, Fishing & Hunting | 9 (81.8%) | 2 (18.2%) |
| Mining, Quarrying, & Extraction | 0 (0.0%) | 0 (0.0%) |
| Construction | 34 (97.1%) | 1 (2.9%) |
| Manufacturing | 41 (77.4%) | 12 (22.6%) |
| Wholesale Trade | 4 (80.0%) | 1 (20.0%) |
| Retail Trade | 12 (42.9%) | 16 (57.1%) |
| Transportation & Warehousing | 13 (86.7%) | 2 (13.3%) |
| Utilities | 0 (0.0%) | 0 (0.0%) |
| Information | 11 (100.0%) | 0 (0.0%) |
| Finance & Insurance | 0 (0.0%) | 6 (100.0%) |
| Real Estate, Rental & Leasing | 0 (0.0%) | 0 (0.0%) |
| Professional & Scientific | 11 (45.8%) | 13 (54.2%) |
| Enterprise Management | 0 (0.0%) | 0 (0.0%) |
| Administrative & Support | 12 (70.6%) | 5 (29.4%) |
| Educational Services | 11 (26.8%) | 30 (73.2%) |
| Health Care & Social Assistance | 2 (6.2%) | 30 (93.8%) |
| Arts, Entertainment & Recreation | 0 (0.0%) | 1 (100.0%) |
| Accommodation & Food Services | 1 (11.1%) | 8 (88.9%) |
| Public Administration | 8 (66.7%) | 4 (33.3%) |
| Total | 175 (56.6%) | 134 (43.4%) |
Education in Mount Crawford
School Enrollment in Mount Crawford
The most common levels of schooling among the 85 students in Mount Crawford are high school (35 | 41.2%), graduate / professional (16 | 18.8%), and elementary school (14 | 16.5%).
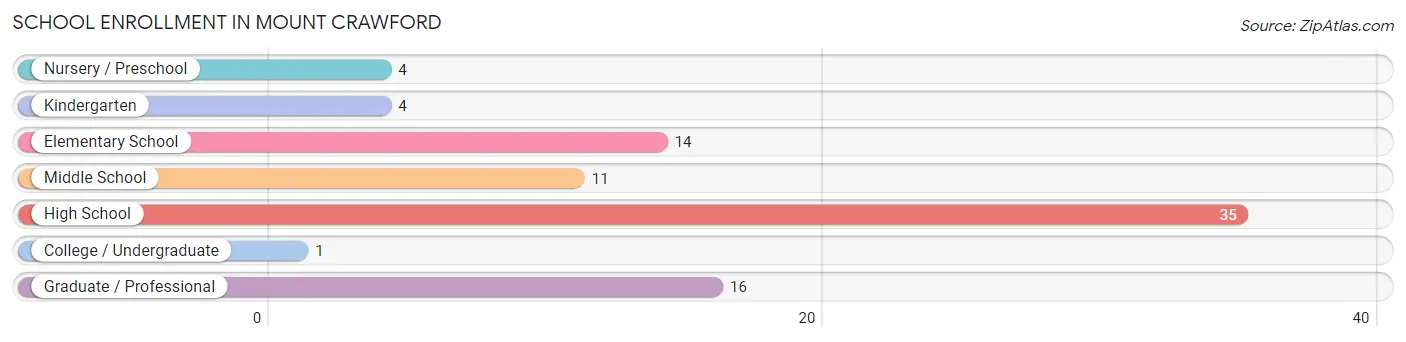
| School Level | # Students | % Students |
| Nursery / Preschool | 4 | 4.7% |
| Kindergarten | 4 | 4.7% |
| Elementary School | 14 | 16.5% |
| Middle School | 11 | 12.9% |
| High School | 35 | 41.2% |
| College / Undergraduate | 1 | 1.2% |
| Graduate / Professional | 16 | 18.8% |
| Total | 85 | 100.0% |
School Enrollment by Age by Funding Source in Mount Crawford
Out of a total of 85 students who are enrolled in schools in Mount Crawford, 10 (11.8%) attend a private institution, while the remaining 75 (88.2%) are enrolled in public schools. The age group of 3 to 4 year olds has the highest likelihood of being enrolled in private schools, with 3 (100.0% in the age bracket) enrolled. Conversely, the age group of 15 to 17 year olds has the lowest likelihood of being enrolled in a private school, with 28 (100.0% in the age bracket) attending a public institution.
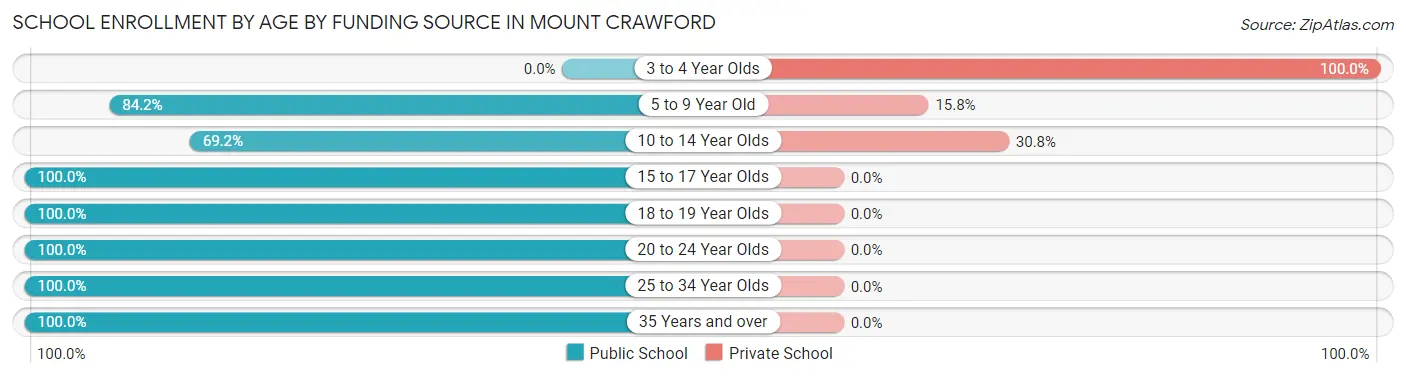
| Age Bracket | Public School | Private School |
| 3 to 4 Year Olds | 0 (0.0%) | 3 (100.0%) |
| 5 to 9 Year Old | 16 (84.2%) | 3 (15.8%) |
| 10 to 14 Year Olds | 9 (69.2%) | 4 (30.8%) |
| 15 to 17 Year Olds | 28 (100.0%) | 0 (0.0%) |
| 18 to 19 Year Olds | 5 (100.0%) | 0 (0.0%) |
| 20 to 24 Year Olds | 7 (100.0%) | 0 (0.0%) |
| 25 to 34 Year Olds | 9 (100.0%) | 0 (0.0%) |
| 35 Years and over | 1 (100.0%) | 0 (0.0%) |
| Total | 75 (88.2%) | 10 (11.8%) |
Educational Attainment by Field of Study in Mount Crawford
Science & technology (26 | 20.0%), business (22 | 16.9%), liberal arts & history (16 | 12.3%), literature & languages (12 | 9.2%), and arts & humanities (10 | 7.7%) are the most common fields of study among 130 individuals in Mount Crawford who have obtained a bachelor's degree or higher.
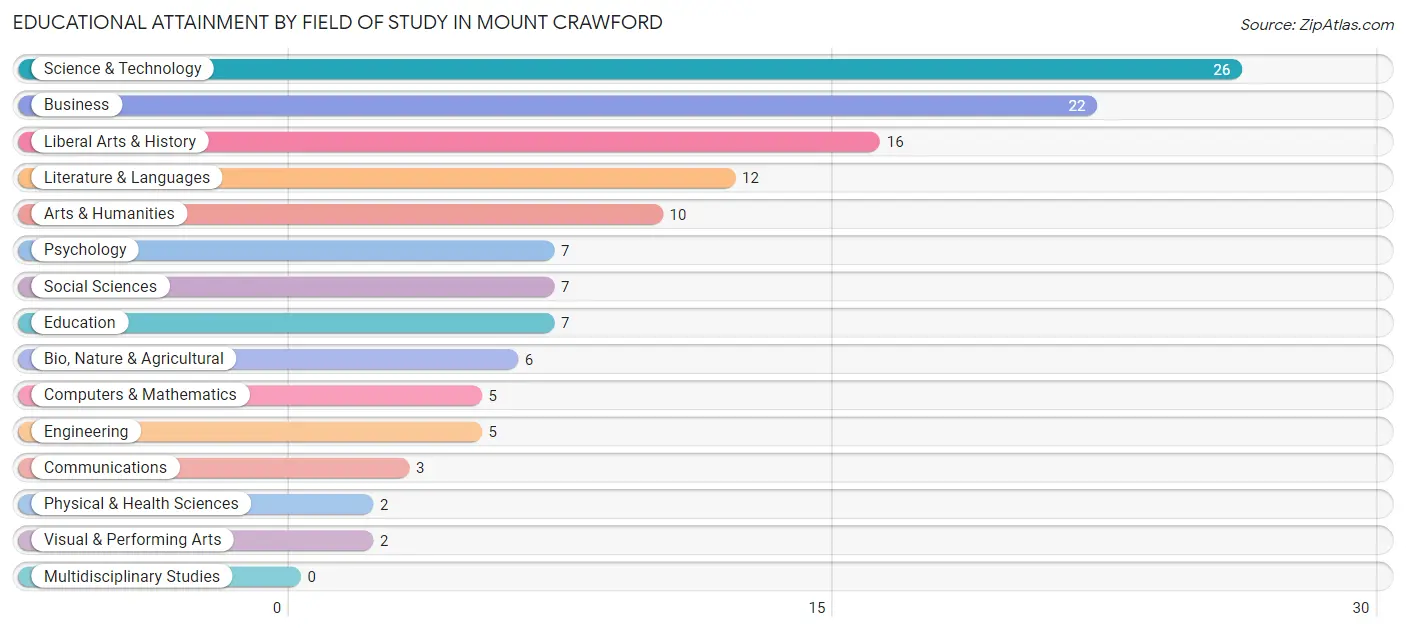
| Field of Study | # Graduates | % Graduates |
| Computers & Mathematics | 5 | 3.8% |
| Bio, Nature & Agricultural | 6 | 4.6% |
| Physical & Health Sciences | 2 | 1.5% |
| Psychology | 7 | 5.4% |
| Social Sciences | 7 | 5.4% |
| Engineering | 5 | 3.8% |
| Multidisciplinary Studies | 0 | 0.0% |
| Science & Technology | 26 | 20.0% |
| Business | 22 | 16.9% |
| Education | 7 | 5.4% |
| Literature & Languages | 12 | 9.2% |
| Liberal Arts & History | 16 | 12.3% |
| Visual & Performing Arts | 2 | 1.5% |
| Communications | 3 | 2.3% |
| Arts & Humanities | 10 | 7.7% |
| Total | 130 | 100.0% |
Transportation & Commute in Mount Crawford
Vehicle Availability by Sex in Mount Crawford
The most prevalent vehicle ownership categories in Mount Crawford are males with 2 vehicles (65, accounting for 37.1%) and females with 2 vehicles (55, making up 50.4%).
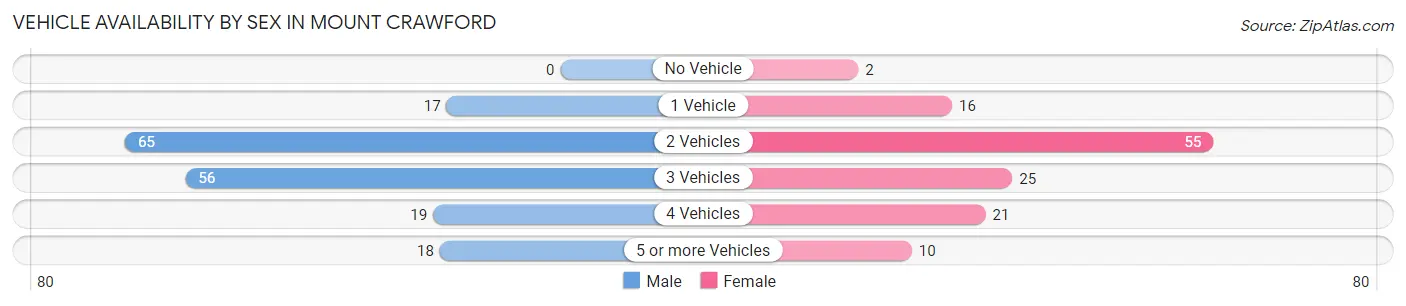
| Vehicles Available | Male | Female |
| No Vehicle | 0 (0.0%) | 2 (1.5%) |
| 1 Vehicle | 17 (9.7%) | 16 (12.4%) |
| 2 Vehicles | 65 (37.1%) | 55 (42.6%) |
| 3 Vehicles | 56 (32.0%) | 25 (19.4%) |
| 4 Vehicles | 19 (10.9%) | 21 (16.3%) |
| 5 or more Vehicles | 18 (10.3%) | 10 (7.7%) |
| Total | 175 (100.0%) | 129 (100.0%) |
Commute Time in Mount Crawford
The most frequently occuring commute durations in Mount Crawford are 10 to 14 minutes (71 commuters, 25.1%), 15 to 19 minutes (57 commuters, 20.1%), and 20 to 24 minutes (45 commuters, 15.9%).
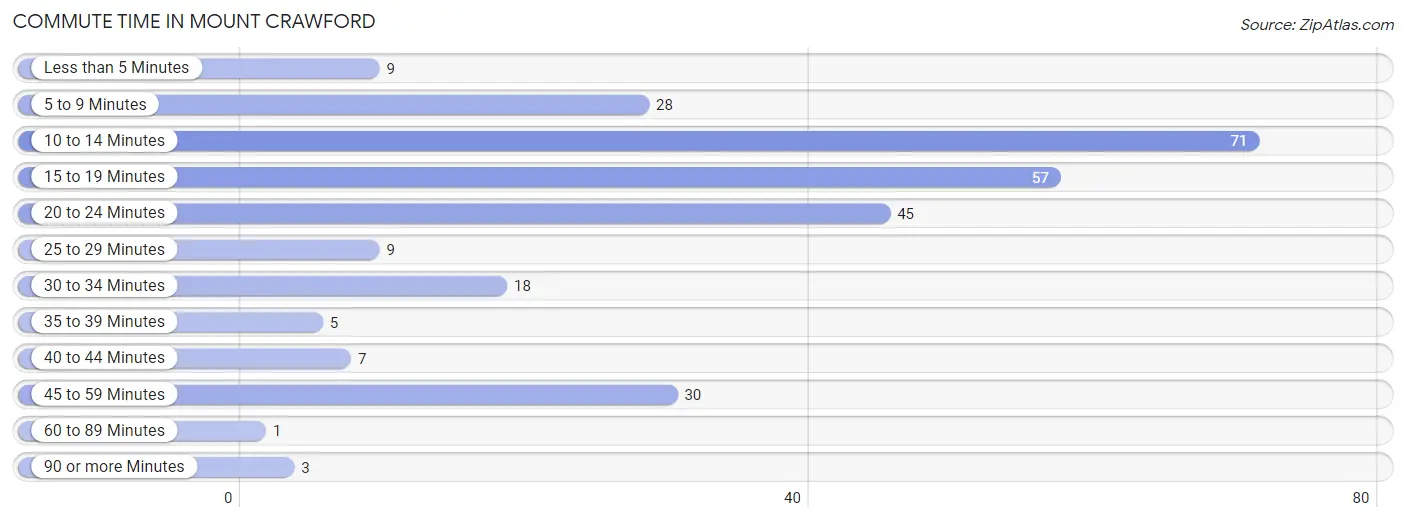
| Commute Time | # Commuters | % Commuters |
| Less than 5 Minutes | 9 | 3.2% |
| 5 to 9 Minutes | 28 | 9.9% |
| 10 to 14 Minutes | 71 | 25.1% |
| 15 to 19 Minutes | 57 | 20.1% |
| 20 to 24 Minutes | 45 | 15.9% |
| 25 to 29 Minutes | 9 | 3.2% |
| 30 to 34 Minutes | 18 | 6.4% |
| 35 to 39 Minutes | 5 | 1.8% |
| 40 to 44 Minutes | 7 | 2.5% |
| 45 to 59 Minutes | 30 | 10.6% |
| 60 to 89 Minutes | 1 | 0.4% |
| 90 or more Minutes | 3 | 1.1% |
Commute Time by Sex in Mount Crawford
The most common commute times in Mount Crawford are 15 to 19 minutes (33 commuters, 20.3%) for males and 10 to 14 minutes (39 commuters, 32.5%) for females.
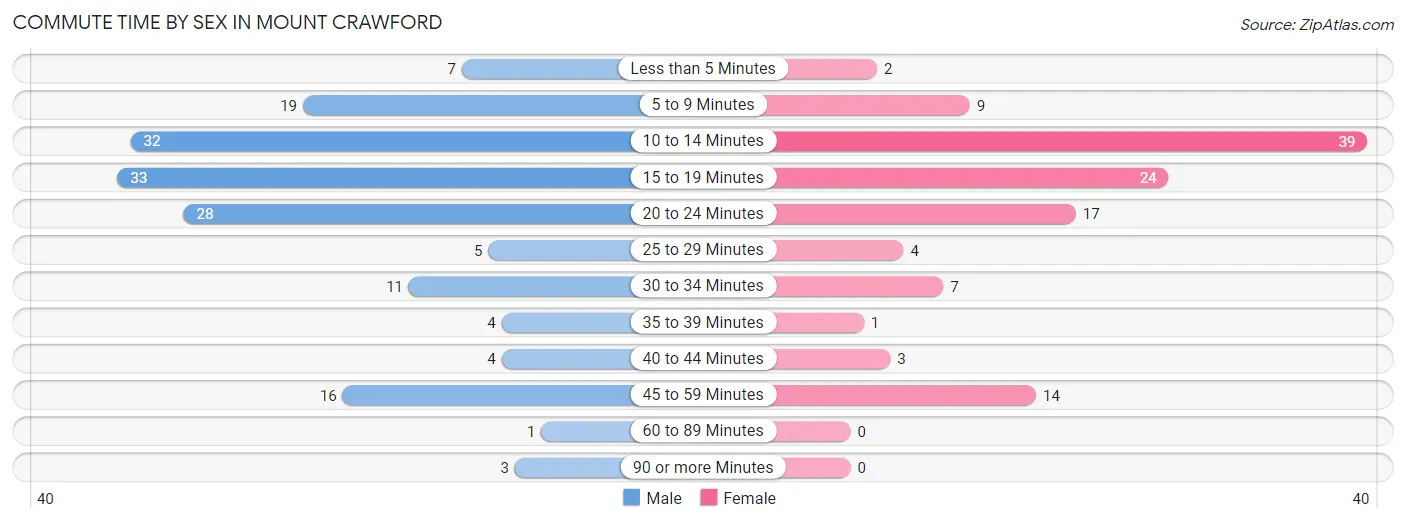
| Commute Time | Male | Female |
| Less than 5 Minutes | 7 (4.3%) | 2 (1.7%) |
| 5 to 9 Minutes | 19 (11.7%) | 9 (7.5%) |
| 10 to 14 Minutes | 32 (19.6%) | 39 (32.5%) |
| 15 to 19 Minutes | 33 (20.3%) | 24 (20.0%) |
| 20 to 24 Minutes | 28 (17.2%) | 17 (14.2%) |
| 25 to 29 Minutes | 5 (3.1%) | 4 (3.3%) |
| 30 to 34 Minutes | 11 (6.8%) | 7 (5.8%) |
| 35 to 39 Minutes | 4 (2.5%) | 1 (0.8%) |
| 40 to 44 Minutes | 4 (2.5%) | 3 (2.5%) |
| 45 to 59 Minutes | 16 (9.8%) | 14 (11.7%) |
| 60 to 89 Minutes | 1 (0.6%) | 0 (0.0%) |
| 90 or more Minutes | 3 (1.8%) | 0 (0.0%) |
Time of Departure to Work by Sex in Mount Crawford
The most frequent times of departure to work in Mount Crawford are 7:30 AM to 7:59 AM (34, 20.9%) for males and 7:30 AM to 7:59 AM (35, 29.2%) for females.
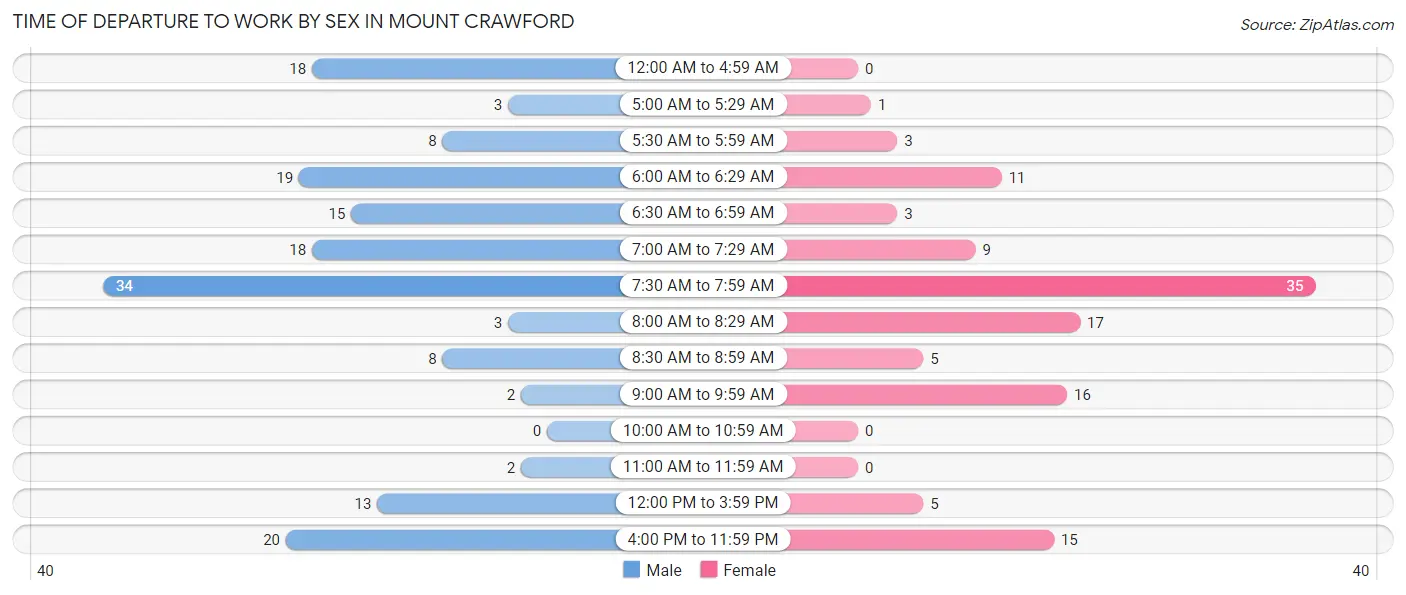
| Time of Departure | Male | Female |
| 12:00 AM to 4:59 AM | 18 (11.0%) | 0 (0.0%) |
| 5:00 AM to 5:29 AM | 3 (1.8%) | 1 (0.8%) |
| 5:30 AM to 5:59 AM | 8 (4.9%) | 3 (2.5%) |
| 6:00 AM to 6:29 AM | 19 (11.7%) | 11 (9.2%) |
| 6:30 AM to 6:59 AM | 15 (9.2%) | 3 (2.5%) |
| 7:00 AM to 7:29 AM | 18 (11.0%) | 9 (7.5%) |
| 7:30 AM to 7:59 AM | 34 (20.9%) | 35 (29.2%) |
| 8:00 AM to 8:29 AM | 3 (1.8%) | 17 (14.2%) |
| 8:30 AM to 8:59 AM | 8 (4.9%) | 5 (4.2%) |
| 9:00 AM to 9:59 AM | 2 (1.2%) | 16 (13.3%) |
| 10:00 AM to 10:59 AM | 0 (0.0%) | 0 (0.0%) |
| 11:00 AM to 11:59 AM | 2 (1.2%) | 0 (0.0%) |
| 12:00 PM to 3:59 PM | 13 (8.0%) | 5 (4.2%) |
| 4:00 PM to 11:59 PM | 20 (12.3%) | 15 (12.5%) |
| Total | 163 (100.0%) | 120 (100.0%) |
Housing Occupancy in Mount Crawford
Occupancy by Ownership in Mount Crawford
Of the total 170 dwellings in Mount Crawford, owner-occupied units account for 123 (72.4%), while renter-occupied units make up 47 (27.7%).
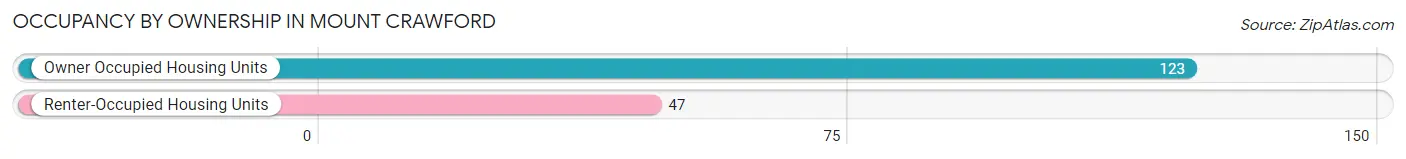
| Occupancy | # Housing Units | % Housing Units |
| Owner Occupied Housing Units | 123 | 72.4% |
| Renter-Occupied Housing Units | 47 | 27.7% |
| Total Occupied Housing Units | 170 | 100.0% |
Occupancy by Household Size in Mount Crawford
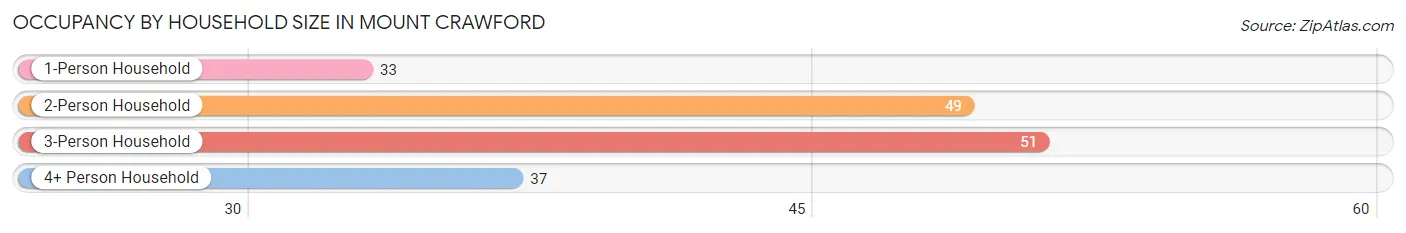
| Household Size | # Housing Units | % Housing Units |
| 1-Person Household | 33 | 19.4% |
| 2-Person Household | 49 | 28.8% |
| 3-Person Household | 51 | 30.0% |
| 4+ Person Household | 37 | 21.8% |
| Total Housing Units | 170 | 100.0% |
Occupancy by Ownership by Household Size in Mount Crawford
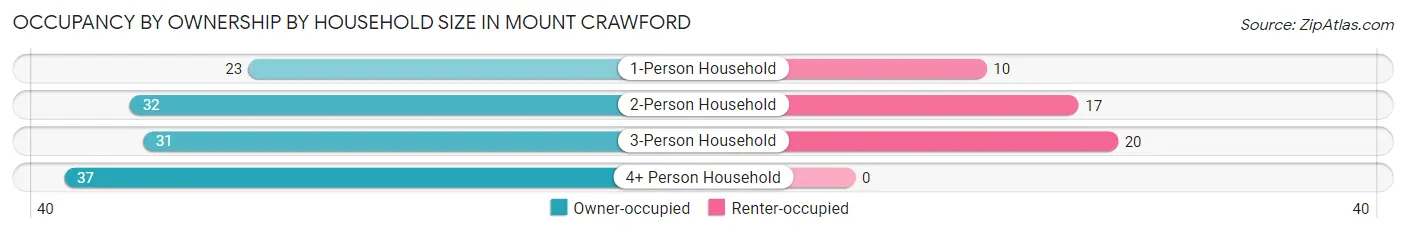
| Household Size | Owner-occupied | Renter-occupied |
| 1-Person Household | 23 (69.7%) | 10 (30.3%) |
| 2-Person Household | 32 (65.3%) | 17 (34.7%) |
| 3-Person Household | 31 (60.8%) | 20 (39.2%) |
| 4+ Person Household | 37 (100.0%) | 0 (0.0%) |
| Total Housing Units | 123 (72.4%) | 47 (27.7%) |
Occupancy by Educational Attainment in Mount Crawford
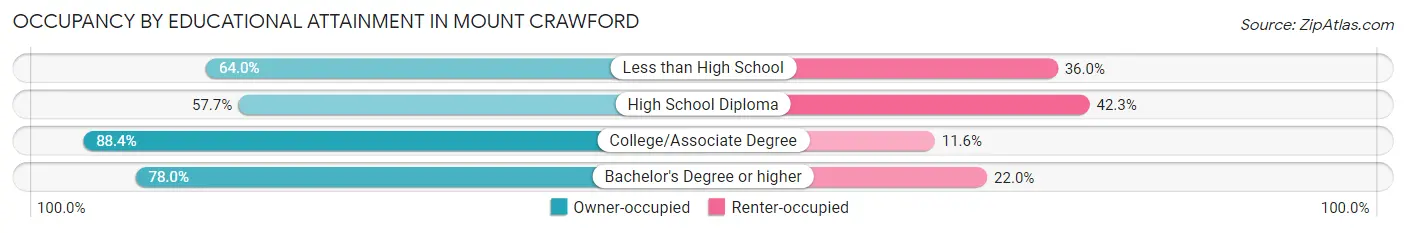
| Household Size | Owner-occupied | Renter-occupied |
| Less than High School | 16 (64.0%) | 9 (36.0%) |
| High School Diploma | 30 (57.7%) | 22 (42.3%) |
| College/Associate Degree | 38 (88.4%) | 5 (11.6%) |
| Bachelor's Degree or higher | 39 (78.0%) | 11 (22.0%) |
Occupancy by Age of Householder in Mount Crawford
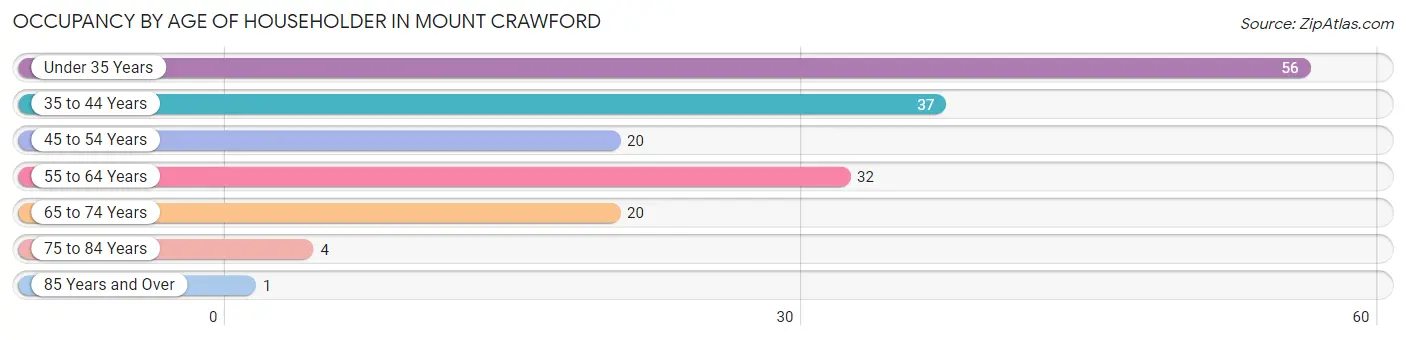
| Age Bracket | # Households | % Households |
| Under 35 Years | 56 | 32.9% |
| 35 to 44 Years | 37 | 21.8% |
| 45 to 54 Years | 20 | 11.8% |
| 55 to 64 Years | 32 | 18.8% |
| 65 to 74 Years | 20 | 11.8% |
| 75 to 84 Years | 4 | 2.4% |
| 85 Years and Over | 1 | 0.6% |
| Total | 170 | 100.0% |
Housing Finances in Mount Crawford
Median Income by Occupancy in Mount Crawford
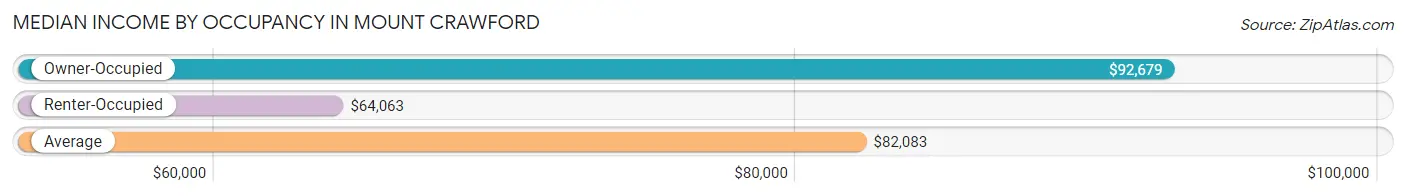
| Occupancy Type | # Households | Median Income |
| Owner-Occupied | 123 (72.4%) | $92,679 |
| Renter-Occupied | 47 (27.7%) | $64,063 |
| Average | 170 (100.0%) | $82,083 |
Occupancy by Householder Income Bracket in Mount Crawford
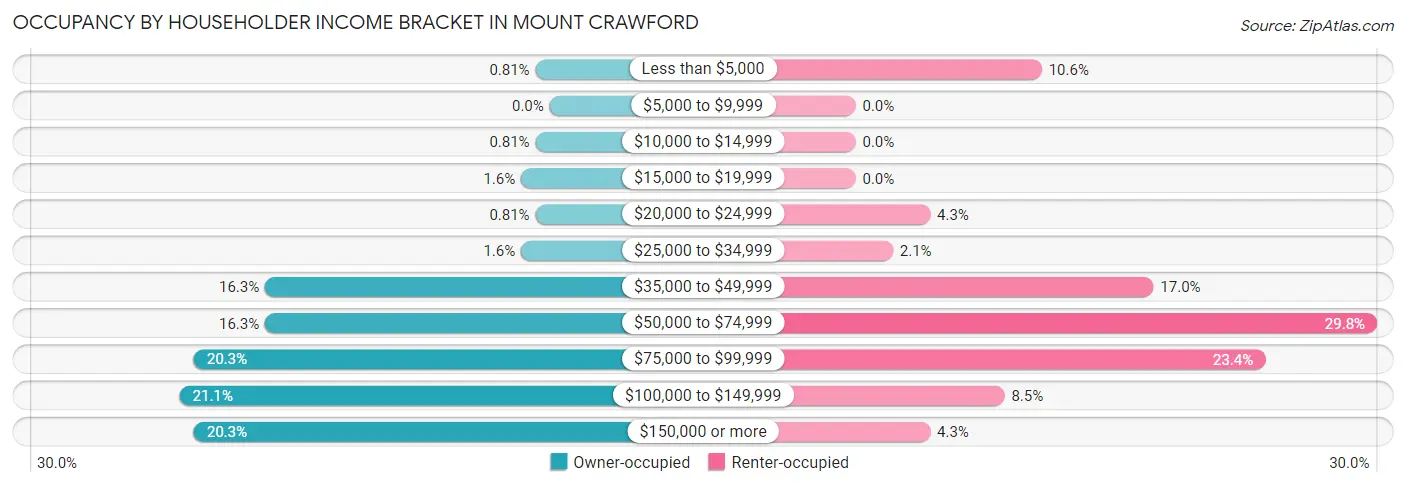
| Income Bracket | Owner-occupied | Renter-occupied |
| Less than $5,000 | 1 (0.8%) | 5 (10.6%) |
| $5,000 to $9,999 | 0 (0.0%) | 0 (0.0%) |
| $10,000 to $14,999 | 1 (0.8%) | 0 (0.0%) |
| $15,000 to $19,999 | 2 (1.6%) | 0 (0.0%) |
| $20,000 to $24,999 | 1 (0.8%) | 2 (4.3%) |
| $25,000 to $34,999 | 2 (1.6%) | 1 (2.1%) |
| $35,000 to $49,999 | 20 (16.3%) | 8 (17.0%) |
| $50,000 to $74,999 | 20 (16.3%) | 14 (29.8%) |
| $75,000 to $99,999 | 25 (20.3%) | 11 (23.4%) |
| $100,000 to $149,999 | 26 (21.1%) | 4 (8.5%) |
| $150,000 or more | 25 (20.3%) | 2 (4.3%) |
| Total | 123 (100.0%) | 47 (100.0%) |
Monthly Housing Cost Tiers in Mount Crawford
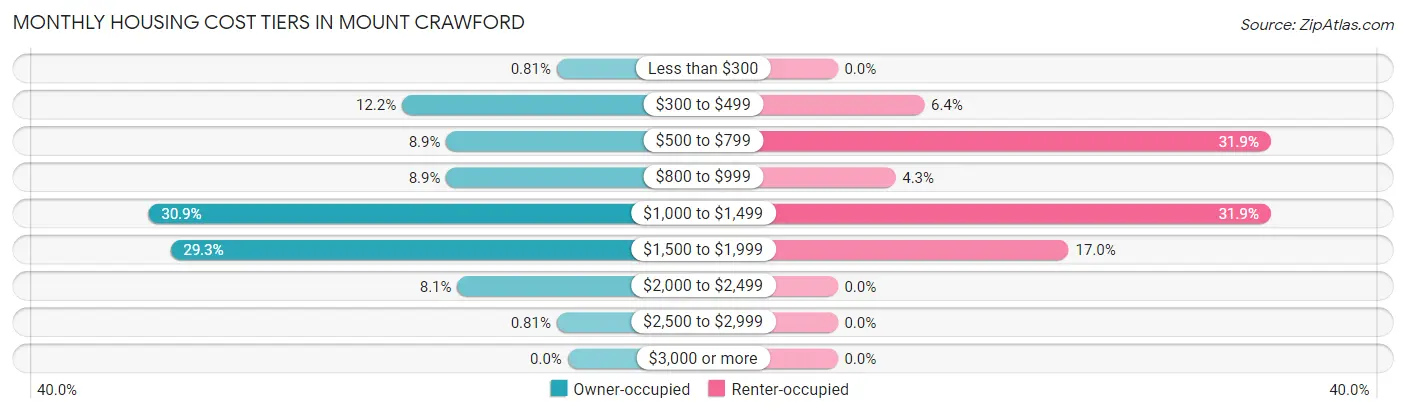
| Monthly Cost | Owner-occupied | Renter-occupied |
| Less than $300 | 1 (0.8%) | 0 (0.0%) |
| $300 to $499 | 15 (12.2%) | 3 (6.4%) |
| $500 to $799 | 11 (8.9%) | 15 (31.9%) |
| $800 to $999 | 11 (8.9%) | 2 (4.3%) |
| $1,000 to $1,499 | 38 (30.9%) | 15 (31.9%) |
| $1,500 to $1,999 | 36 (29.3%) | 8 (17.0%) |
| $2,000 to $2,499 | 10 (8.1%) | 0 (0.0%) |
| $2,500 to $2,999 | 1 (0.8%) | 0 (0.0%) |
| $3,000 or more | 0 (0.0%) | 0 (0.0%) |
| Total | 123 (100.0%) | 47 (100.0%) |
Physical Housing Characteristics in Mount Crawford
Housing Structures in Mount Crawford
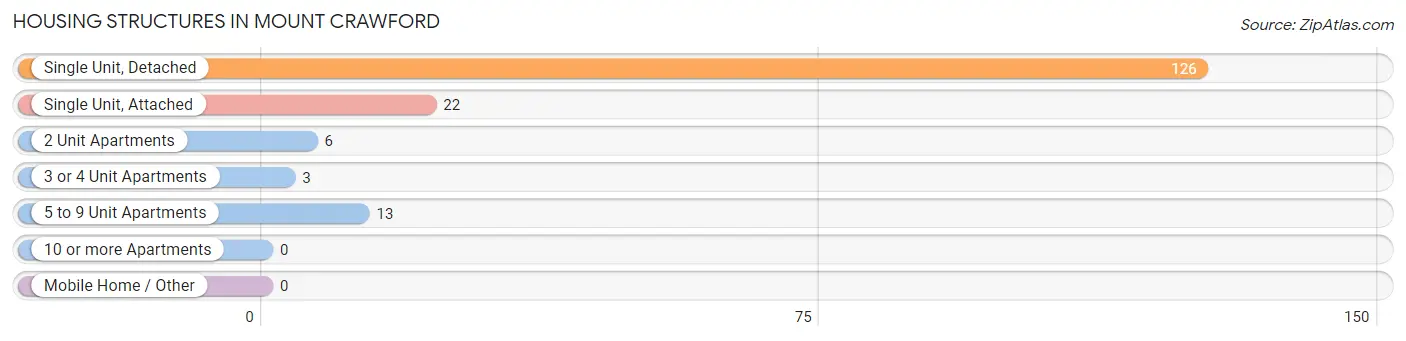
| Structure Type | # Housing Units | % Housing Units |
| Single Unit, Detached | 126 | 74.1% |
| Single Unit, Attached | 22 | 12.9% |
| 2 Unit Apartments | 6 | 3.5% |
| 3 or 4 Unit Apartments | 3 | 1.8% |
| 5 to 9 Unit Apartments | 13 | 7.6% |
| 10 or more Apartments | 0 | 0.0% |
| Mobile Home / Other | 0 | 0.0% |
| Total | 170 | 100.0% |
Housing Structures by Occupancy in Mount Crawford
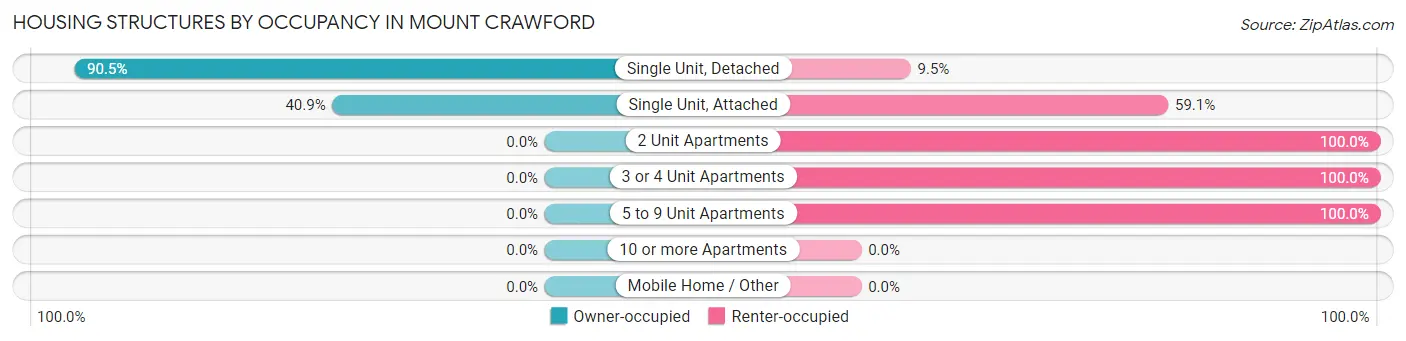
| Structure Type | Owner-occupied | Renter-occupied |
| Single Unit, Detached | 114 (90.5%) | 12 (9.5%) |
| Single Unit, Attached | 9 (40.9%) | 13 (59.1%) |
| 2 Unit Apartments | 0 (0.0%) | 6 (100.0%) |
| 3 or 4 Unit Apartments | 0 (0.0%) | 3 (100.0%) |
| 5 to 9 Unit Apartments | 0 (0.0%) | 13 (100.0%) |
| 10 or more Apartments | 0 (0.0%) | 0 (0.0%) |
| Mobile Home / Other | 0 (0.0%) | 0 (0.0%) |
| Total | 123 (72.4%) | 47 (27.7%) |
Housing Structures by Number of Rooms in Mount Crawford
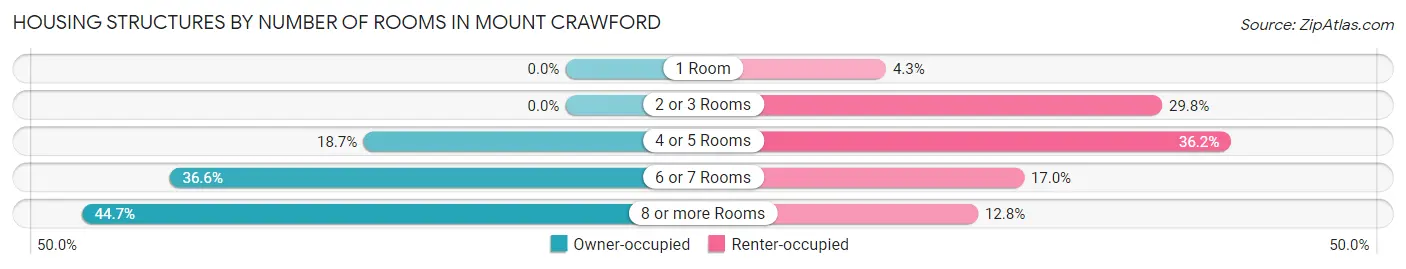
| Number of Rooms | Owner-occupied | Renter-occupied |
| 1 Room | 0 (0.0%) | 2 (4.3%) |
| 2 or 3 Rooms | 0 (0.0%) | 14 (29.8%) |
| 4 or 5 Rooms | 23 (18.7%) | 17 (36.2%) |
| 6 or 7 Rooms | 45 (36.6%) | 8 (17.0%) |
| 8 or more Rooms | 55 (44.7%) | 6 (12.8%) |
| Total | 123 (100.0%) | 47 (100.0%) |
Housing Structure by Heating Type in Mount Crawford
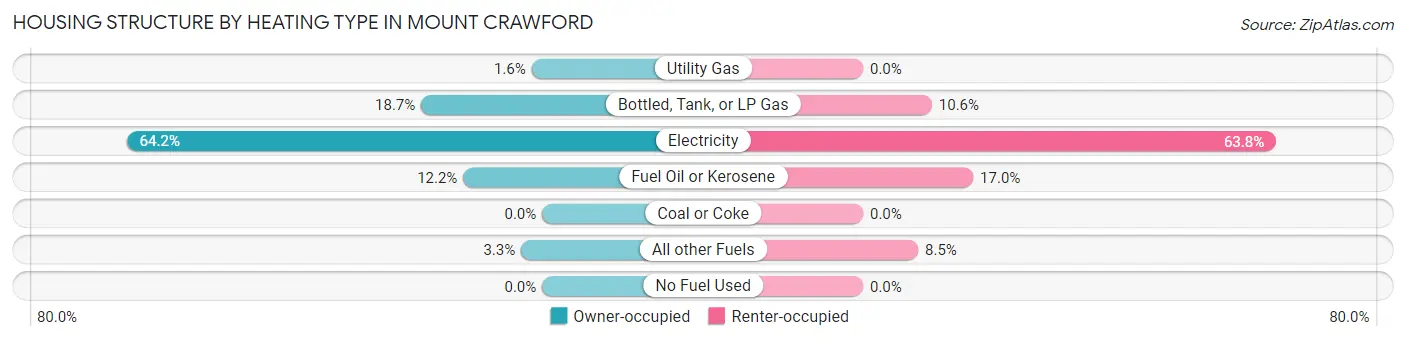
| Heating Type | Owner-occupied | Renter-occupied |
| Utility Gas | 2 (1.6%) | 0 (0.0%) |
| Bottled, Tank, or LP Gas | 23 (18.7%) | 5 (10.6%) |
| Electricity | 79 (64.2%) | 30 (63.8%) |
| Fuel Oil or Kerosene | 15 (12.2%) | 8 (17.0%) |
| Coal or Coke | 0 (0.0%) | 0 (0.0%) |
| All other Fuels | 4 (3.3%) | 4 (8.5%) |
| No Fuel Used | 0 (0.0%) | 0 (0.0%) |
| Total | 123 (100.0%) | 47 (100.0%) |
Household Vehicle Usage in Mount Crawford
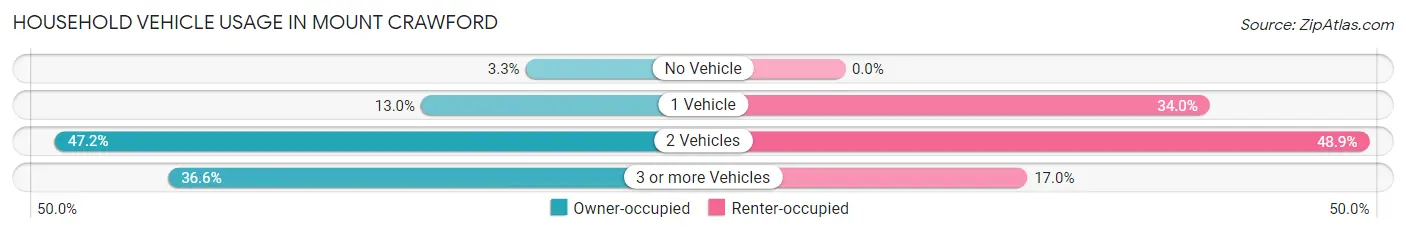
| Vehicles per Household | Owner-occupied | Renter-occupied |
| No Vehicle | 4 (3.3%) | 0 (0.0%) |
| 1 Vehicle | 16 (13.0%) | 16 (34.0%) |
| 2 Vehicles | 58 (47.1%) | 23 (48.9%) |
| 3 or more Vehicles | 45 (36.6%) | 8 (17.0%) |
| Total | 123 (100.0%) | 47 (100.0%) |
Real Estate & Mortgages in Mount Crawford
Real Estate and Mortgage Overview in Mount Crawford
| Characteristic | Without Mortgage | With Mortgage |
| Housing Units | 30 | 93 |
| Median Property Value | $241,700 | $270,200 |
| Median Household Income | $61,250 | $19 |
| Monthly Housing Costs | $488 | $0 |
| Real Estate Taxes | $1,625 | $1 |
Property Value by Mortgage Status in Mount Crawford
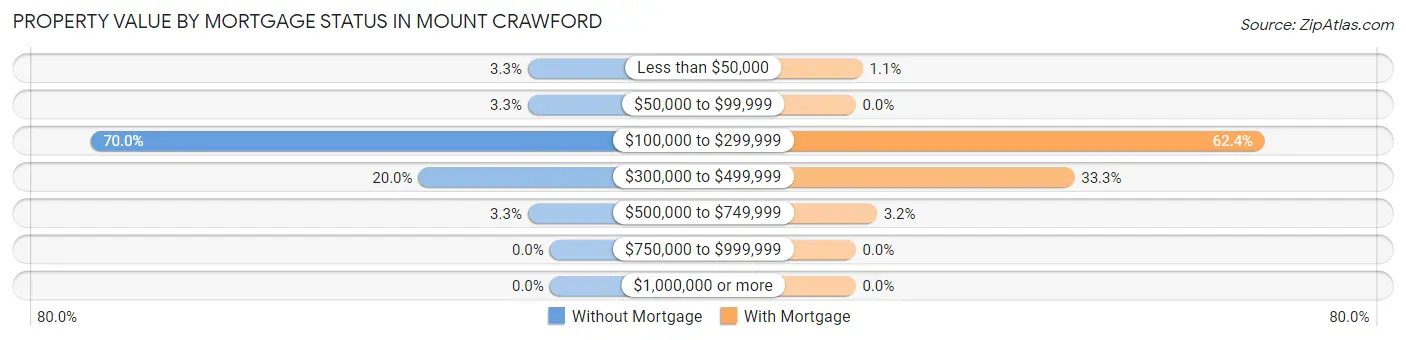
| Property Value | Without Mortgage | With Mortgage |
| Less than $50,000 | 1 (3.3%) | 1 (1.1%) |
| $50,000 to $99,999 | 1 (3.3%) | 0 (0.0%) |
| $100,000 to $299,999 | 21 (70.0%) | 58 (62.4%) |
| $300,000 to $499,999 | 6 (20.0%) | 31 (33.3%) |
| $500,000 to $749,999 | 1 (3.3%) | 3 (3.2%) |
| $750,000 to $999,999 | 0 (0.0%) | 0 (0.0%) |
| $1,000,000 or more | 0 (0.0%) | 0 (0.0%) |
| Total | 30 (100.0%) | 93 (100.0%) |
Household Income by Mortgage Status in Mount Crawford
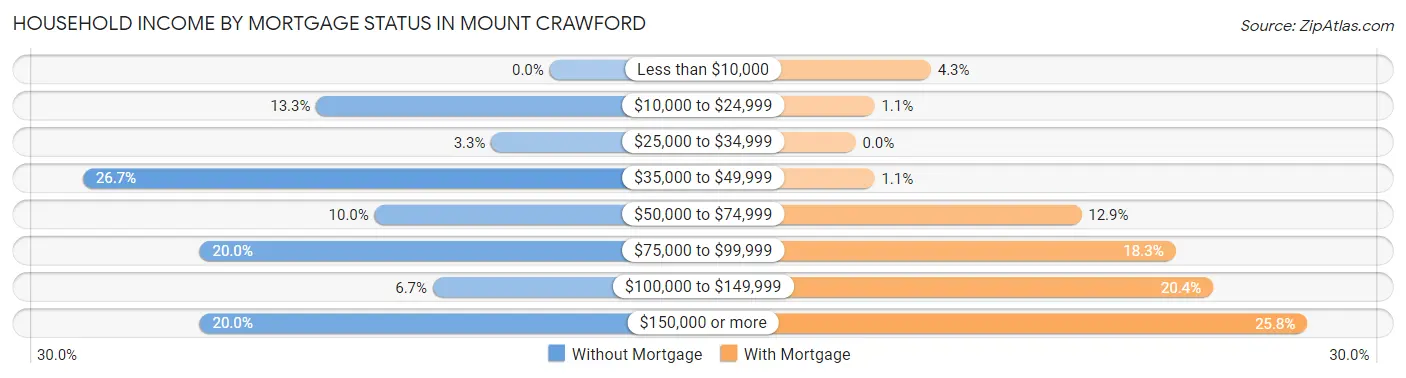
| Household Income | Without Mortgage | With Mortgage |
| Less than $10,000 | 0 (0.0%) | 4 (4.3%) |
| $10,000 to $24,999 | 4 (13.3%) | 1 (1.1%) |
| $25,000 to $34,999 | 1 (3.3%) | 0 (0.0%) |
| $35,000 to $49,999 | 8 (26.7%) | 1 (1.1%) |
| $50,000 to $74,999 | 3 (10.0%) | 12 (12.9%) |
| $75,000 to $99,999 | 6 (20.0%) | 17 (18.3%) |
| $100,000 to $149,999 | 2 (6.7%) | 19 (20.4%) |
| $150,000 or more | 6 (20.0%) | 24 (25.8%) |
| Total | 30 (100.0%) | 93 (100.0%) |
Property Value to Household Income Ratio in Mount Crawford
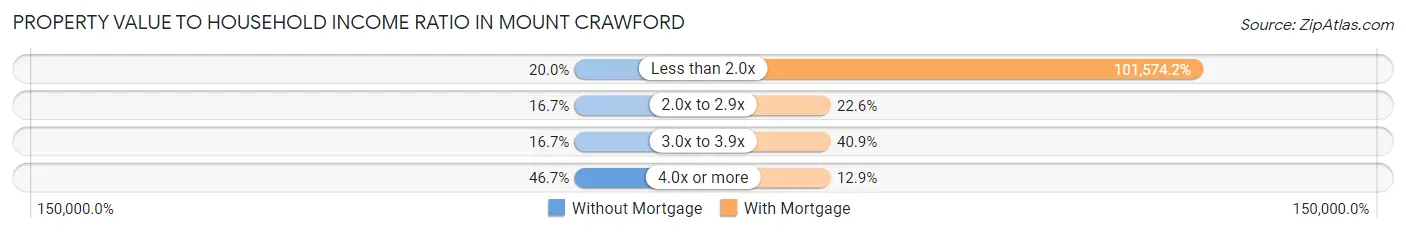
| Value-to-Income Ratio | Without Mortgage | With Mortgage |
| Less than 2.0x | 6 (20.0%) | 94,464 (101,574.2%) |
| 2.0x to 2.9x | 5 (16.7%) | 21 (22.6%) |
| 3.0x to 3.9x | 5 (16.7%) | 38 (40.9%) |
| 4.0x or more | 14 (46.7%) | 12 (12.9%) |
| Total | 30 (100.0%) | 93 (100.0%) |
Real Estate Taxes by Mortgage Status in Mount Crawford
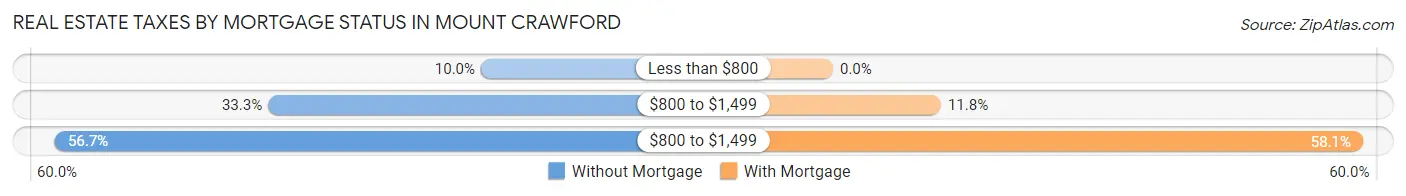
| Property Taxes | Without Mortgage | With Mortgage |
| Less than $800 | 3 (10.0%) | 0 (0.0%) |
| $800 to $1,499 | 10 (33.3%) | 11 (11.8%) |
| $800 to $1,499 | 17 (56.7%) | 54 (58.1%) |
| Total | 30 (100.0%) | 93 (100.0%) |
Health & Disability in Mount Crawford
Health Insurance Coverage by Age in Mount Crawford
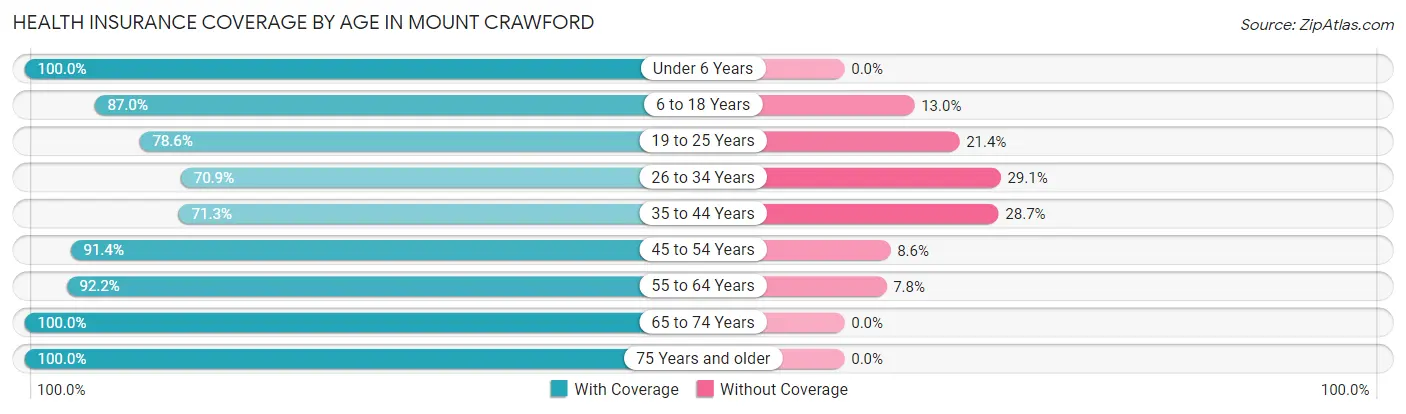
| Age Bracket | With Coverage | Without Coverage |
| Under 6 Years | 38 (100.0%) | 0 (0.0%) |
| 6 to 18 Years | 60 (87.0%) | 9 (13.0%) |
| 19 to 25 Years | 33 (78.6%) | 9 (21.4%) |
| 26 to 34 Years | 90 (70.9%) | 37 (29.1%) |
| 35 to 44 Years | 62 (71.3%) | 25 (28.7%) |
| 45 to 54 Years | 32 (91.4%) | 3 (8.6%) |
| 55 to 64 Years | 59 (92.2%) | 5 (7.8%) |
| 65 to 74 Years | 34 (100.0%) | 0 (0.0%) |
| 75 Years and older | 13 (100.0%) | 0 (0.0%) |
| Total | 421 (82.7%) | 88 (17.3%) |
Health Insurance Coverage by Citizenship Status in Mount Crawford
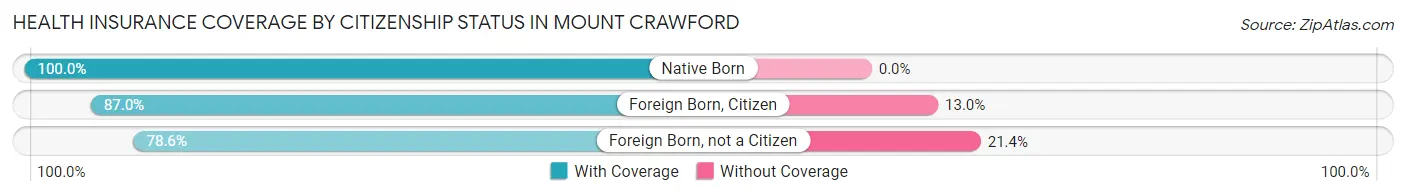
| Citizenship Status | With Coverage | Without Coverage |
| Native Born | 38 (100.0%) | 0 (0.0%) |
| Foreign Born, Citizen | 60 (87.0%) | 9 (13.0%) |
| Foreign Born, not a Citizen | 33 (78.6%) | 9 (21.4%) |
Health Insurance Coverage by Household Income in Mount Crawford
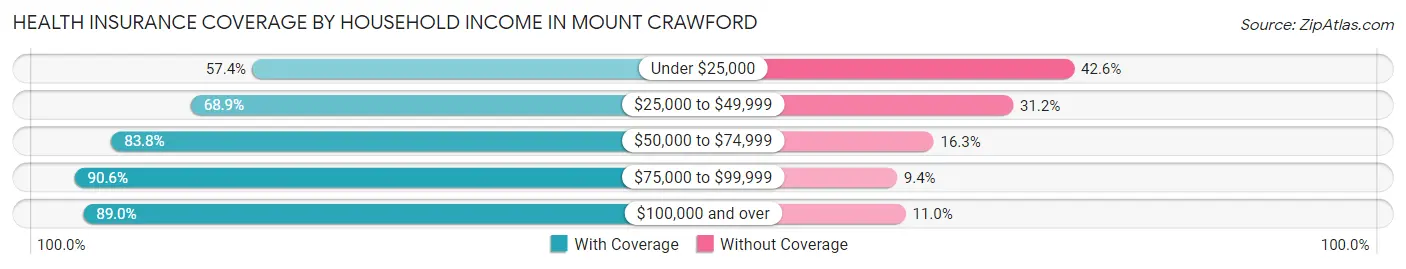
| Household Income | With Coverage | Without Coverage |
| Under $25,000 | 31 (57.4%) | 23 (42.6%) |
| $25,000 to $49,999 | 42 (68.9%) | 19 (31.1%) |
| $50,000 to $74,999 | 67 (83.8%) | 13 (16.3%) |
| $75,000 to $99,999 | 87 (90.6%) | 9 (9.4%) |
| $100,000 and over | 194 (89.0%) | 24 (11.0%) |
Public vs Private Health Insurance Coverage by Age in Mount Crawford
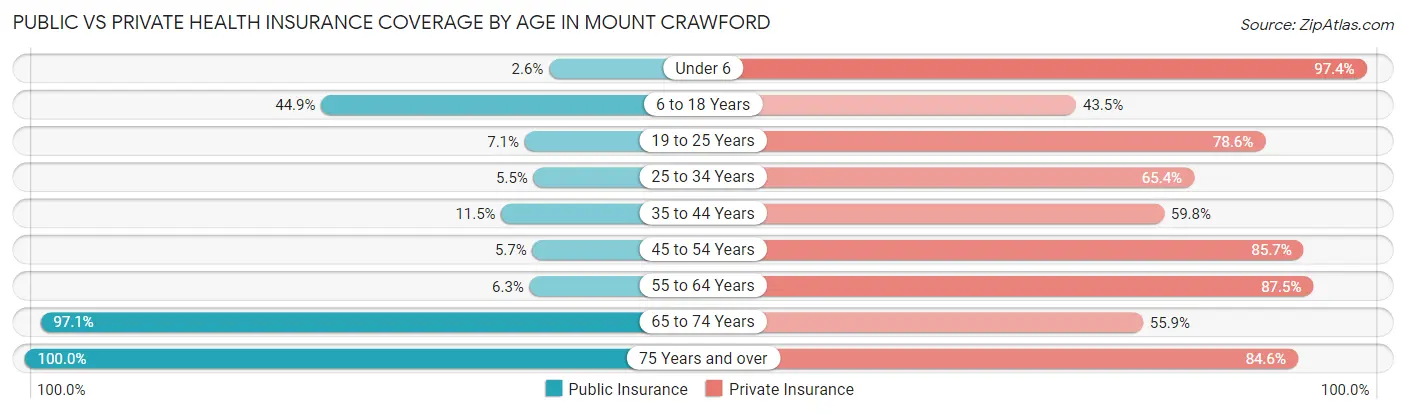
| Age Bracket | Public Insurance | Private Insurance |
| Under 6 | 1 (2.6%) | 37 (97.4%) |
| 6 to 18 Years | 31 (44.9%) | 30 (43.5%) |
| 19 to 25 Years | 3 (7.1%) | 33 (78.6%) |
| 25 to 34 Years | 7 (5.5%) | 83 (65.3%) |
| 35 to 44 Years | 10 (11.5%) | 52 (59.8%) |
| 45 to 54 Years | 2 (5.7%) | 30 (85.7%) |
| 55 to 64 Years | 4 (6.2%) | 56 (87.5%) |
| 65 to 74 Years | 33 (97.1%) | 19 (55.9%) |
| 75 Years and over | 13 (100.0%) | 11 (84.6%) |
| Total | 104 (20.4%) | 351 (69.0%) |
Disability Status by Sex by Age in Mount Crawford
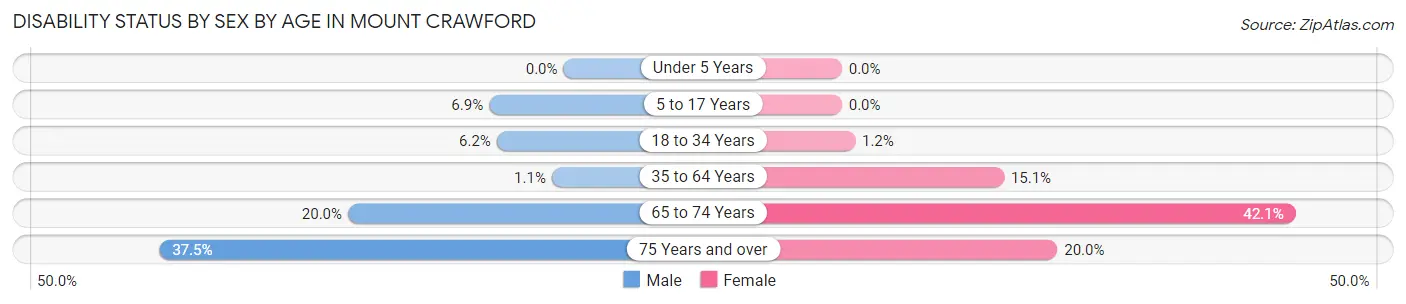
| Age Bracket | Male | Female |
| Under 5 Years | 0 (0.0%) | 0 (0.0%) |
| 5 to 17 Years | 2 (6.9%) | 0 (0.0%) |
| 18 to 34 Years | 6 (6.2%) | 1 (1.2%) |
| 35 to 64 Years | 1 (1.1%) | 14 (15.0%) |
| 65 to 74 Years | 3 (20.0%) | 8 (42.1%) |
| 75 Years and over | 3 (37.5%) | 1 (20.0%) |
Disability Class by Sex by Age in Mount Crawford
Disability Class: Hearing Difficulty
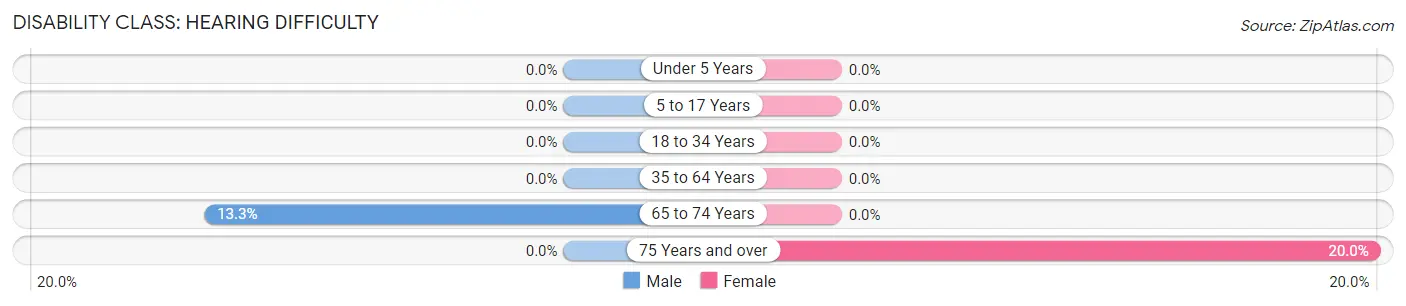
| Age Bracket | Male | Female |
| Under 5 Years | 0 (0.0%) | 0 (0.0%) |
| 5 to 17 Years | 0 (0.0%) | 0 (0.0%) |
| 18 to 34 Years | 0 (0.0%) | 0 (0.0%) |
| 35 to 64 Years | 0 (0.0%) | 0 (0.0%) |
| 65 to 74 Years | 2 (13.3%) | 0 (0.0%) |
| 75 Years and over | 0 (0.0%) | 1 (20.0%) |
Disability Class: Vision Difficulty
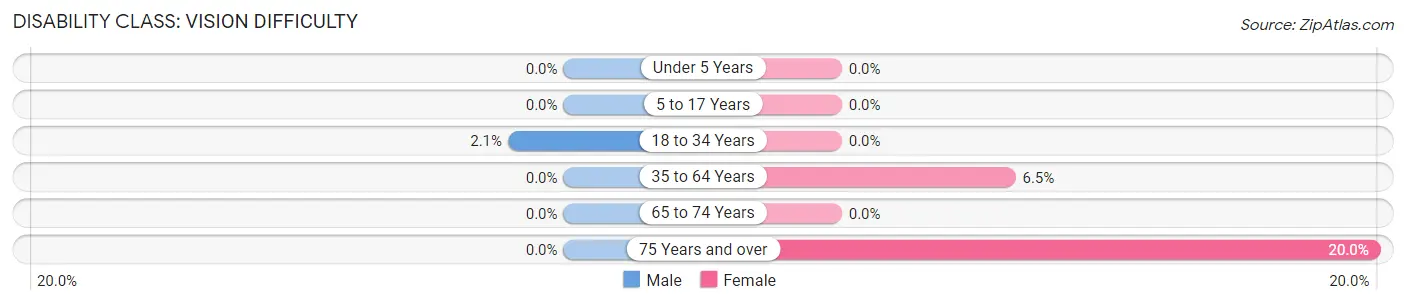
| Age Bracket | Male | Female |
| Under 5 Years | 0 (0.0%) | 0 (0.0%) |
| 5 to 17 Years | 0 (0.0%) | 0 (0.0%) |
| 18 to 34 Years | 2 (2.1%) | 0 (0.0%) |
| 35 to 64 Years | 0 (0.0%) | 6 (6.5%) |
| 65 to 74 Years | 0 (0.0%) | 0 (0.0%) |
| 75 Years and over | 0 (0.0%) | 1 (20.0%) |
Disability Class: Cognitive Difficulty
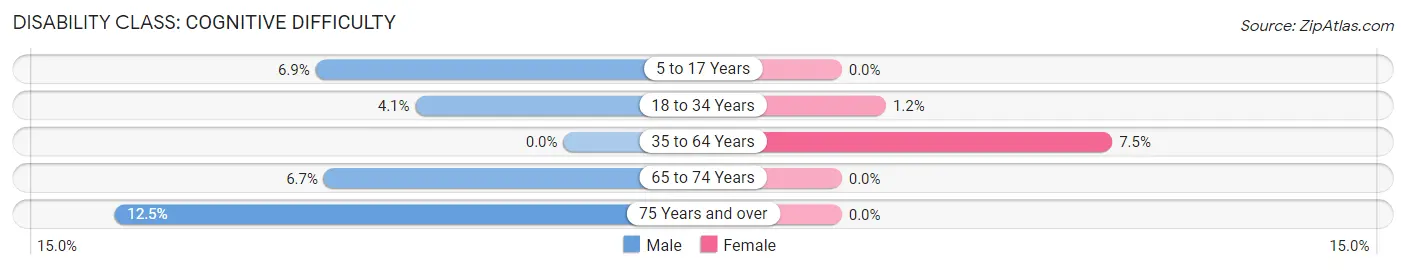
| Age Bracket | Male | Female |
| 5 to 17 Years | 2 (6.9%) | 0 (0.0%) |
| 18 to 34 Years | 4 (4.1%) | 1 (1.2%) |
| 35 to 64 Years | 0 (0.0%) | 7 (7.5%) |
| 65 to 74 Years | 1 (6.7%) | 0 (0.0%) |
| 75 Years and over | 1 (12.5%) | 0 (0.0%) |
Disability Class: Ambulatory Difficulty
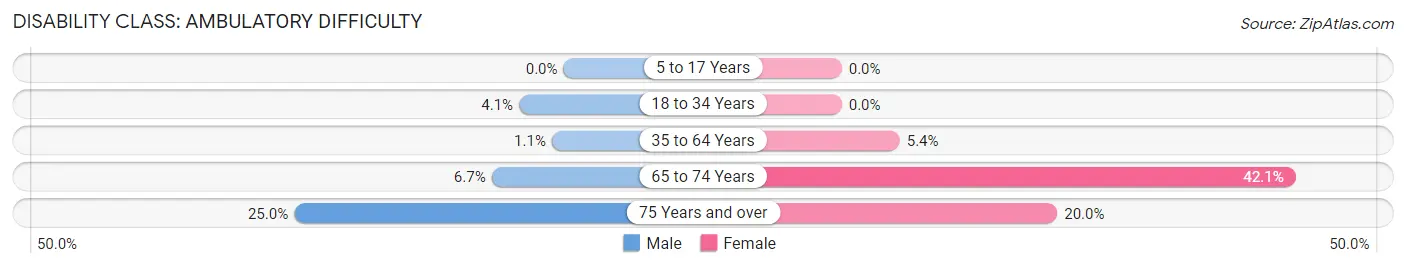
| Age Bracket | Male | Female |
| 5 to 17 Years | 0 (0.0%) | 0 (0.0%) |
| 18 to 34 Years | 4 (4.1%) | 0 (0.0%) |
| 35 to 64 Years | 1 (1.1%) | 5 (5.4%) |
| 65 to 74 Years | 1 (6.7%) | 8 (42.1%) |
| 75 Years and over | 2 (25.0%) | 1 (20.0%) |
Disability Class: Self-Care Difficulty
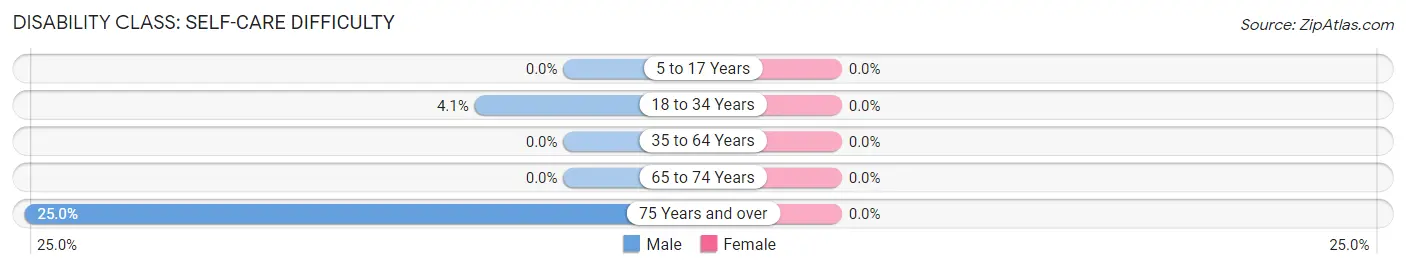
| Age Bracket | Male | Female |
| 5 to 17 Years | 0 (0.0%) | 0 (0.0%) |
| 18 to 34 Years | 4 (4.1%) | 0 (0.0%) |
| 35 to 64 Years | 0 (0.0%) | 0 (0.0%) |
| 65 to 74 Years | 0 (0.0%) | 0 (0.0%) |
| 75 Years and over | 2 (25.0%) | 0 (0.0%) |
Technology Access in Mount Crawford
Computing Device Access in Mount Crawford
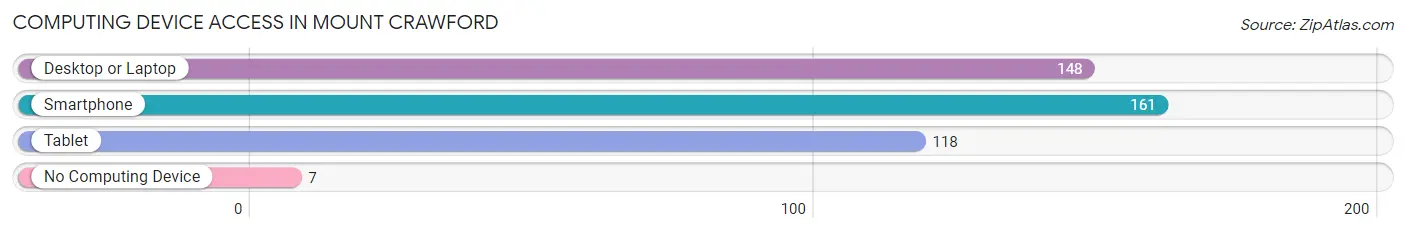
| Device Type | # Households | % Households |
| Desktop or Laptop | 148 | 87.1% |
| Smartphone | 161 | 94.7% |
| Tablet | 118 | 69.4% |
| No Computing Device | 7 | 4.1% |
| Total | 170 | 100.0% |
Internet Access in Mount Crawford
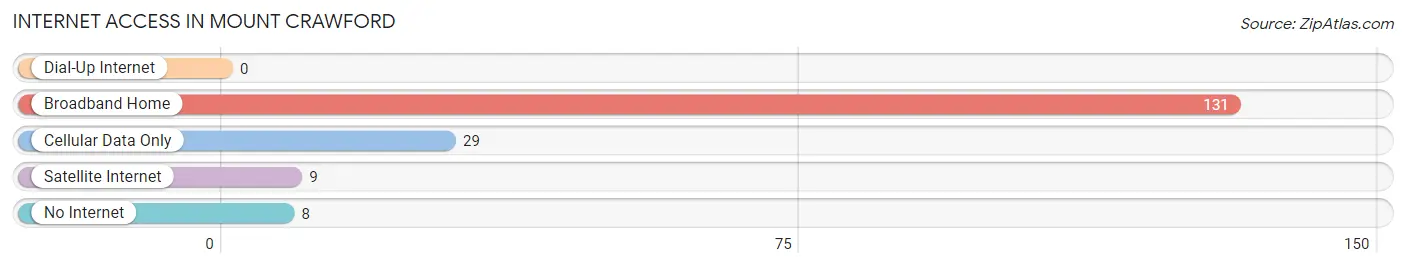
| Internet Type | # Households | % Households |
| Dial-Up Internet | 0 | 0.0% |
| Broadband Home | 131 | 77.1% |
| Cellular Data Only | 29 | 17.1% |
| Satellite Internet | 9 | 5.3% |
| No Internet | 8 | 4.7% |
| Total | 170 | 100.0% |
Mount Crawford Summary
History
The small town of Mount Crawford, Virginia is located in the Shenandoah Valley, in the northern part of Rockingham County. It was first settled in the late 1700s by German immigrants, who named the town after a nearby mountain. The town was officially incorporated in 1872.
In the late 1800s, Mount Crawford was a thriving agricultural community, with a variety of crops being grown in the area. The town was also home to several mills, including a grist mill, a saw mill, and a woolen mill. The town was also home to a number of small businesses, including a blacksmith shop, a general store, and a hotel.
In the early 1900s, the town began to experience a decline in population as many of its residents moved away in search of better economic opportunities. This trend continued until the 1950s, when the town began to experience a resurgence in population and economic activity. This was due in part to the construction of a new highway, which connected the town to nearby cities and towns.
In the late 20th century, Mount Crawford experienced a period of growth and development. The town was home to a number of new businesses, including a grocery store, a hardware store, and a bank. The town also saw the construction of a new elementary school, as well as a new library.
Geography
Mount Crawford is located in the northern part of Rockingham County, in the Shenandoah Valley region of Virginia. The town is situated at the base of the Massanutten Mountain, which is part of the Blue Ridge Mountains. The town is located approximately 25 miles south of Harrisonburg, and about 50 miles west of Washington, D.C.
The town is situated in a rural area, with rolling hills and farmland. The town is surrounded by a number of small towns and villages, including Bridgewater, Dayton, and Broadway. The town is also located near the Shenandoah National Park, which is a popular destination for outdoor recreation.
Economy
The economy of Mount Crawford is largely based on agriculture and tourism. The town is home to a number of farms, which produce a variety of crops, including corn, soybeans, wheat, and hay. The town is also home to a number of small businesses, including a grocery store, a hardware store, and a bank.
The town is also a popular destination for tourists, who come to the area to enjoy the natural beauty of the Shenandoah Valley. The town is home to a number of attractions, including the Shenandoah National Park, the Massanutten Mountain, and the Appalachian Trail.
Demographics
As of the 2010 census, the population of Mount Crawford was 1,845. The town has a total area of 1.2 square miles, with a population density of 1,541 people per square mile. The median age of the population is 43.7 years, with a median household income of $45,000.
The racial makeup of the town is 94.3% White, 2.2% African American, 0.3% Native American, 0.7% Asian, and 2.5% from other races. The town is also home to a large number of Hispanic and Latino residents, who make up 8.2% of the population.
Conclusion
Mount Crawford, Virginia is a small town located in the Shenandoah Valley region of Virginia. The town has a long history, dating back to the late 1700s, when it was first settled by German immigrants. The town has experienced a period of growth and development in the late 20th century, with a number of new businesses and attractions being established. The economy of the town is largely based on agriculture and tourism, and the population is largely white, with a significant Hispanic and Latino population.
Common Questions
What is Per Capita Income in Mount Crawford?
Per Capita income in Mount Crawford is $33,743.
What is the Median Family Income in Mount Crawford?
Median Family Income in Mount Crawford is $91,250.
What is the Median Household income in Mount Crawford?
Median Household Income in Mount Crawford is $82,083.
What is Income or Wage Gap in Mount Crawford?
Income or Wage Gap in Mount Crawford is 28.2%.
Women in Mount Crawford earn 71.8 cents for every dollar earned by a man.
What is Inequality or Gini Index in Mount Crawford?
Inequality or Gini Index in Mount Crawford is 0.34.
What is the Total Population of Mount Crawford?
Total Population of Mount Crawford is 509.
What is the Total Male Population of Mount Crawford?
Total Male Population of Mount Crawford is 258.
What is the Total Female Population of Mount Crawford?
Total Female Population of Mount Crawford is 251.
What is the Ratio of Males per 100 Females in Mount Crawford?
There are 102.79 Males per 100 Females in Mount Crawford.
What is the Ratio of Females per 100 Males in Mount Crawford?
There are 97.29 Females per 100 Males in Mount Crawford.
What is the Median Population Age in Mount Crawford?
Median Population Age in Mount Crawford is 33.9 Years.
What is the Average Family Size in Mount Crawford
Average Family Size in Mount Crawford is 3.3 People.
What is the Average Household Size in Mount Crawford
Average Household Size in Mount Crawford is 3.0 People.
How Large is the Labor Force in Mount Crawford?
There are 312 People in the Labor Forcein in Mount Crawford.
What is the Percentage of People in the Labor Force in Mount Crawford?
74.6% of People are in the Labor Force in Mount Crawford.
What is the Unemployment Rate in Mount Crawford?
Unemployment Rate in Mount Crawford is 1.0%.