Wytheville, VA Map & Demographics
Wytheville Map
Wytheville Overview
$33,813
PER CAPITA INCOME
$75,964
AVG FAMILY INCOME
$39,459
AVG HOUSEHOLD INCOME
33.9%
WAGE / INCOME GAP [ % ]
66.1¢/ $1
WAGE / INCOME GAP [ $ ]
$14,736
FAMILY INCOME DEFICIT
0.56
INEQUALITY / GINI INDEX
8,228
TOTAL POPULATION
4,237
MALE POPULATION
3,991
FEMALE POPULATION
106.16
MALES / 100 FEMALES
94.19
FEMALES / 100 MALES
45.2
MEDIAN AGE
2.9
AVG FAMILY SIZE
1.9
AVG HOUSEHOLD SIZE
3,550
LABOR FORCE [ PEOPLE ]
51.7%
PERCENT IN LABOR FORCE
5.4%
UNEMPLOYMENT RATE
Wytheville Zip Codes
Wytheville Area Codes
Income in Wytheville
Income Overview in Wytheville
Per Capita Income in Wytheville is $33,813, while median incomes of families and households are $75,964 and $39,459 respectively.
| Characteristic | Number | Measure |
| Per Capita Income | 8,228 | $33,813 |
| Median Family Income | 1,913 | $75,964 |
| Mean Family Income | 1,913 | $95,921 |
| Median Household Income | 4,117 | $39,459 |
| Mean Household Income | 4,117 | $66,606 |
| Income Deficit | 1,913 | $14,736 |
| Wage / Income Gap (%) | 8,228 | 33.89% |
| Wage / Income Gap ($) | 8,228 | 66.11¢ per $1 |
| Gini / Inequality Index | 8,228 | 0.56 |
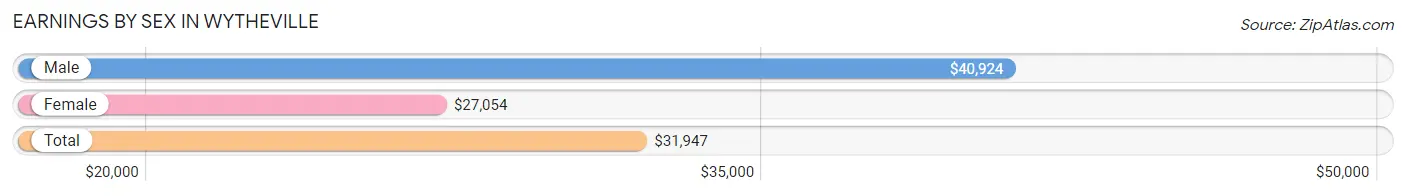
Earnings by Sex in Wytheville
Average Earnings in Wytheville are $31,947, $40,924 for men and $27,054 for women, a difference of 33.9%.
| Sex | Number | Average Earnings |
| Male | 1,897 (53.2%) | $40,924 |
| Female | 1,666 (46.8%) | $27,054 |
| Total | 3,563 (100.0%) | $31,947 |
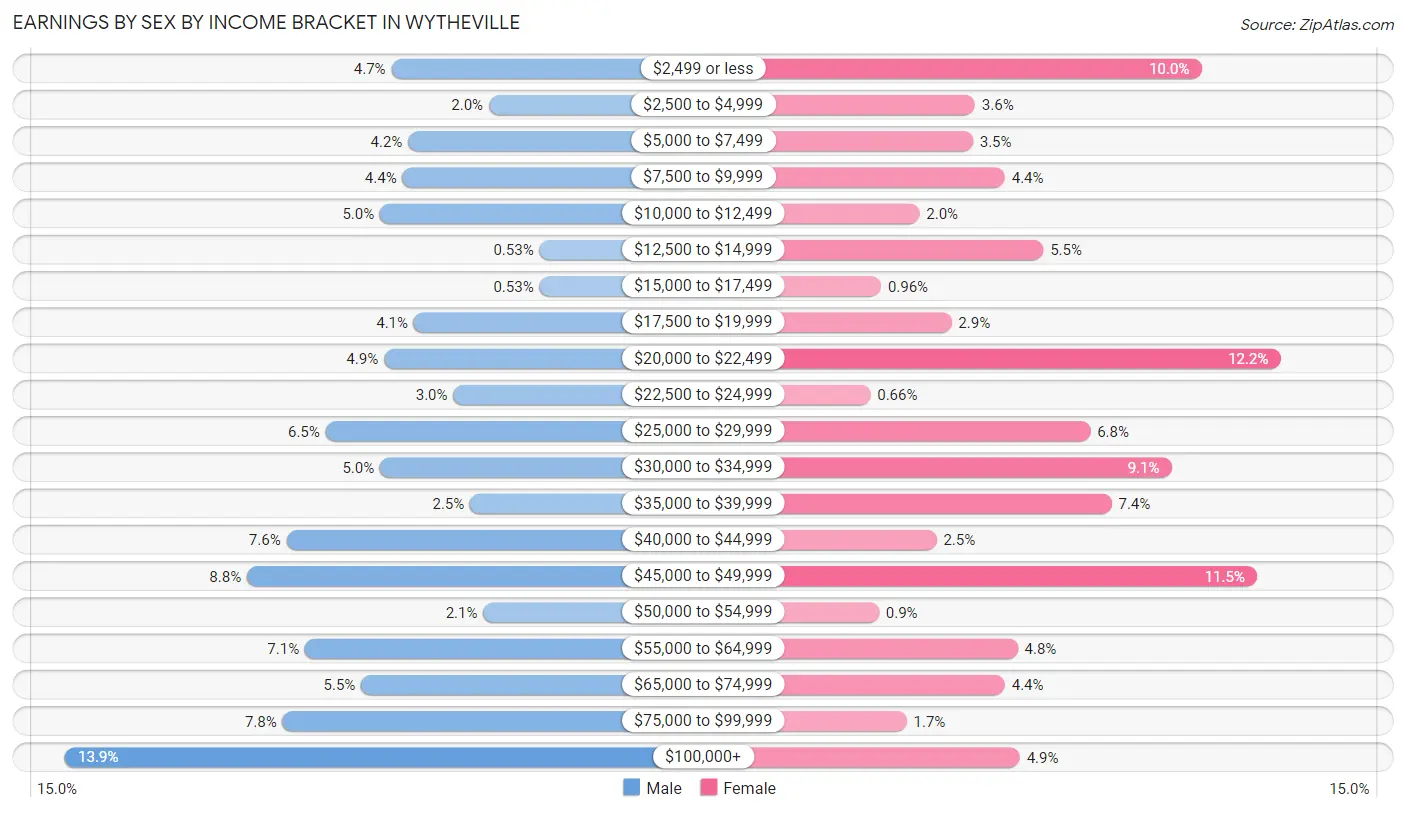
Earnings by Sex by Income Bracket in Wytheville
The most common earnings brackets in Wytheville are $100,000+ for men (263 | 13.9%) and $20,000 to $22,499 for women (203 | 12.2%).
| Income | Male | Female |
| $2,499 or less | 89 (4.7%) | 166 (10.0%) |
| $2,500 to $4,999 | 37 (1.9%) | 60 (3.6%) |
| $5,000 to $7,499 | 80 (4.2%) | 59 (3.5%) |
| $7,500 to $9,999 | 83 (4.4%) | 74 (4.4%) |
| $10,000 to $12,499 | 95 (5.0%) | 34 (2.0%) |
| $12,500 to $14,999 | 10 (0.5%) | 92 (5.5%) |
| $15,000 to $17,499 | 10 (0.5%) | 16 (1.0%) |
| $17,500 to $19,999 | 77 (4.1%) | 49 (2.9%) |
| $20,000 to $22,499 | 93 (4.9%) | 203 (12.2%) |
| $22,500 to $24,999 | 56 (2.9%) | 11 (0.7%) |
| $25,000 to $29,999 | 124 (6.5%) | 114 (6.8%) |
| $30,000 to $34,999 | 95 (5.0%) | 152 (9.1%) |
| $35,000 to $39,999 | 47 (2.5%) | 124 (7.4%) |
| $40,000 to $44,999 | 145 (7.6%) | 42 (2.5%) |
| $45,000 to $49,999 | 166 (8.7%) | 192 (11.5%) |
| $50,000 to $54,999 | 40 (2.1%) | 15 (0.9%) |
| $55,000 to $64,999 | 135 (7.1%) | 80 (4.8%) |
| $65,000 to $74,999 | 105 (5.5%) | 74 (4.4%) |
| $75,000 to $99,999 | 147 (7.7%) | 28 (1.7%) |
| $100,000+ | 263 (13.9%) | 81 (4.9%) |
| Total | 1,897 (100.0%) | 1,666 (100.0%) |
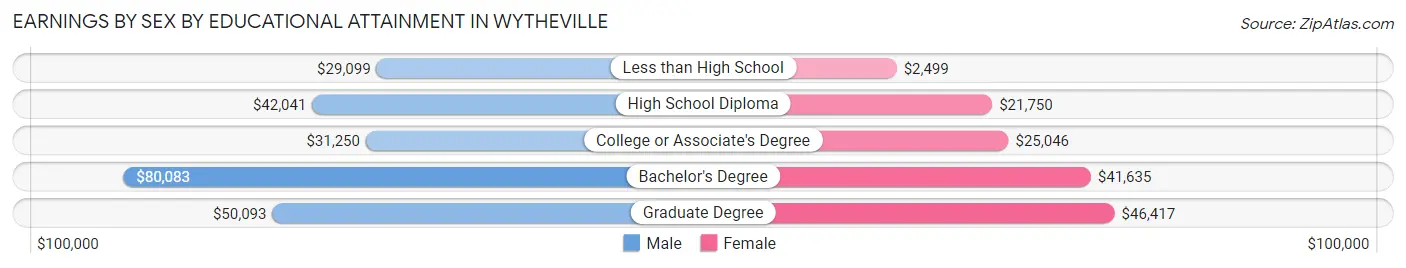
Earnings by Sex by Educational Attainment in Wytheville
Average earnings in Wytheville are $46,000 for men and $27,011 for women, a difference of 41.3%. Men with an educational attainment of bachelor's degree enjoy the highest average annual earnings of $80,083, while those with less than high school education earn the least with $29,099. Women with an educational attainment of graduate degree earn the most with the average annual earnings of $46,417, while those with less than high school education have the smallest earnings of $2,499.
| Educational Attainment | Male Income | Female Income |
| Less than High School | $29,099 | $2,499 |
| High School Diploma | $42,041 | $21,750 |
| College or Associate's Degree | $31,250 | $25,046 |
| Bachelor's Degree | $80,083 | $41,635 |
| Graduate Degree | $50,093 | $46,417 |
| Total | $46,000 | $27,011 |
Family Income in Wytheville
Family Income Brackets in Wytheville
According to the Wytheville family income data, there are 419 families falling into the $75,000 to $99,999 income range, which is the most common income bracket and makes up 21.9% of all families.
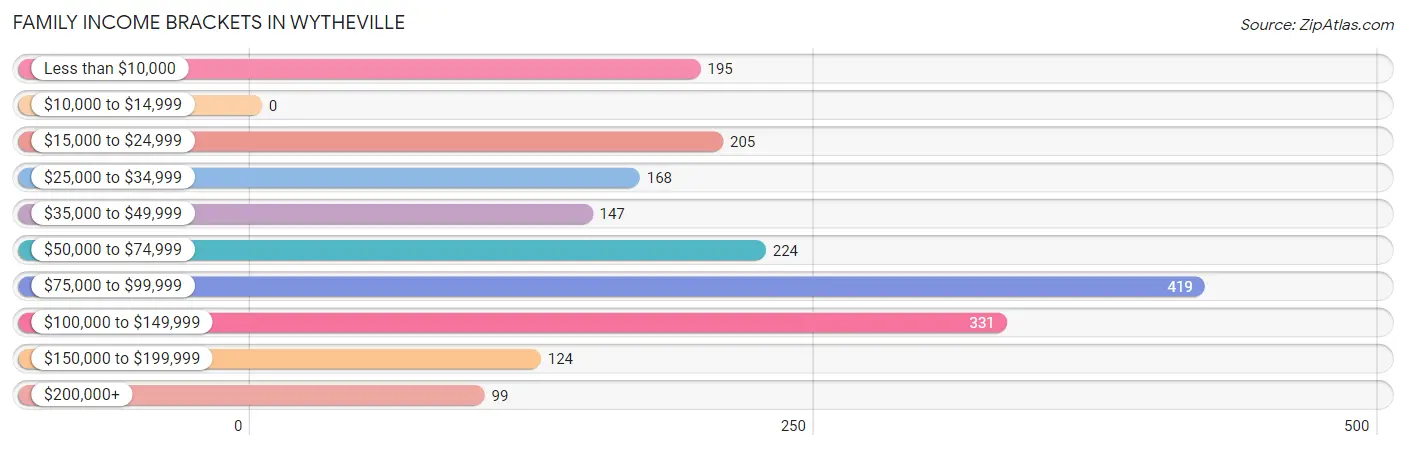
| Income Bracket | # Families | % Families |
| Less than $10,000 | 195 | 10.2% |
| $10,000 to $14,999 | 0 | 0.0% |
| $15,000 to $24,999 | 205 | 10.7% |
| $25,000 to $34,999 | 168 | 8.8% |
| $35,000 to $49,999 | 147 | 7.7% |
| $50,000 to $74,999 | 224 | 11.7% |
| $75,000 to $99,999 | 419 | 21.9% |
| $100,000 to $149,999 | 331 | 17.3% |
| $150,000 to $199,999 | 124 | 6.5% |
| $200,000+ | 99 | 5.2% |
Family Income by Famaliy Size in Wytheville
4-person families (597 | 31.2%) account for the highest median family income in Wytheville with $79,468 per family, while 2-person families (864 | 45.2%) have the highest median income of $37,171 per family member.
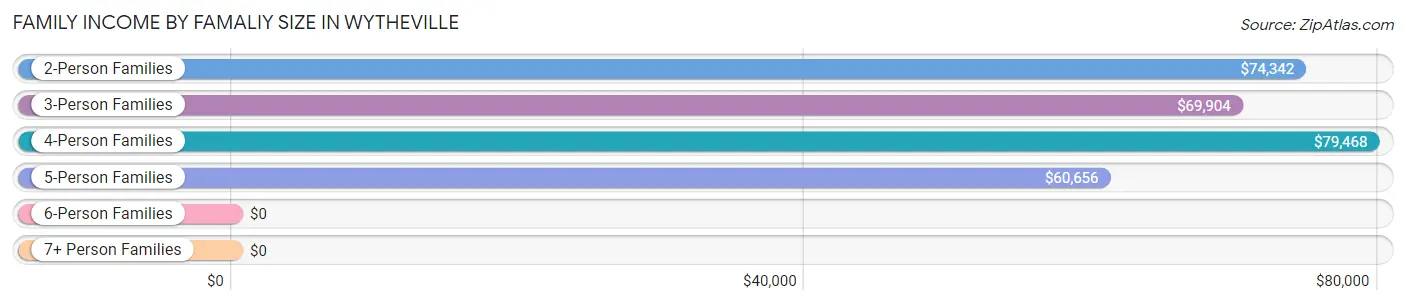
| Income Bracket | # Families | Median Income |
| 2-Person Families | 864 (45.2%) | $74,342 |
| 3-Person Families | 369 (19.3%) | $69,904 |
| 4-Person Families | 597 (31.2%) | $79,468 |
| 5-Person Families | 83 (4.3%) | $60,656 |
| 6-Person Families | 0 (0.0%) | $0 |
| 7+ Person Families | 0 (0.0%) | $0 |
| Total | 1,913 (100.0%) | $75,964 |
Family Income by Number of Earners in Wytheville
The median family income in Wytheville is $75,964, with families comprising 3+ earners (159) having the highest median family income of $94,341, while families with no earners (554) have the lowest median family income of $33,833, accounting for 8.3% and 29.0% of families, respectively.
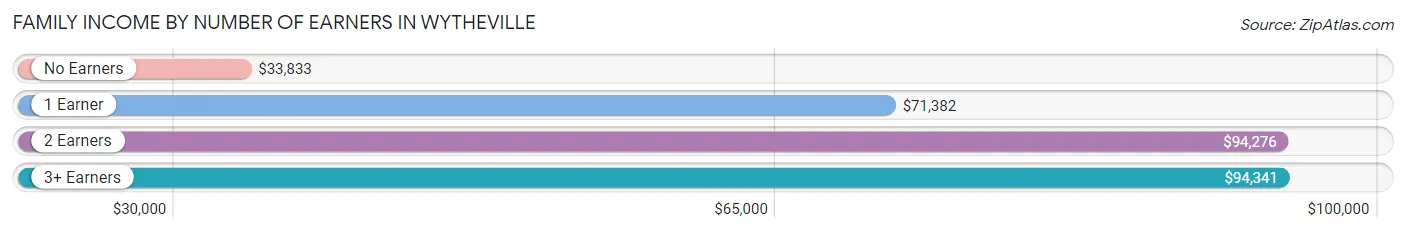
| Number of Earners | # Families | Median Income |
| No Earners | 554 (29.0%) | $33,833 |
| 1 Earner | 733 (38.3%) | $71,382 |
| 2 Earners | 467 (24.4%) | $94,276 |
| 3+ Earners | 159 (8.3%) | $94,341 |
| Total | 1,913 (100.0%) | $75,964 |
Household Income in Wytheville
Household Income Brackets in Wytheville
With 675 households falling in the category, the $35,000 to $49,999 income range is the most frequent in Wytheville, accounting for 16.4% of all households. In contrast, only 111 households (2.7%) fall into the $200,000+ income bracket, making it the least populous group.
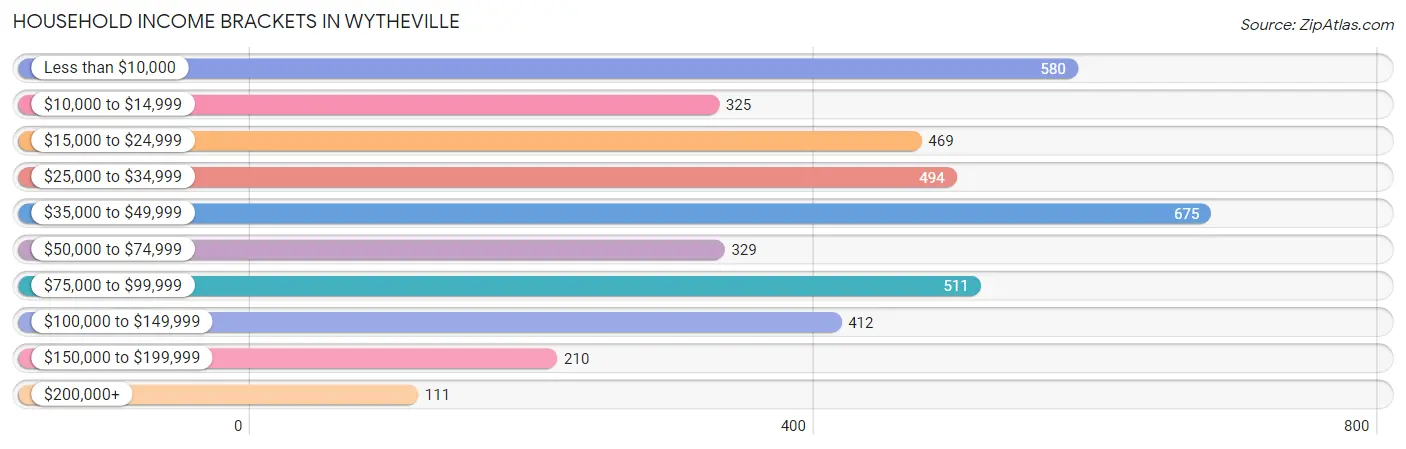
| Income Bracket | # Households | % Households |
| Less than $10,000 | 580 | 14.1% |
| $10,000 to $14,999 | 325 | 7.9% |
| $15,000 to $24,999 | 469 | 11.4% |
| $25,000 to $34,999 | 494 | 12.0% |
| $35,000 to $49,999 | 675 | 16.4% |
| $50,000 to $74,999 | 329 | 8.0% |
| $75,000 to $99,999 | 511 | 12.4% |
| $100,000 to $149,999 | 412 | 10.0% |
| $150,000 to $199,999 | 210 | 5.1% |
| $200,000+ | 111 | 2.7% |
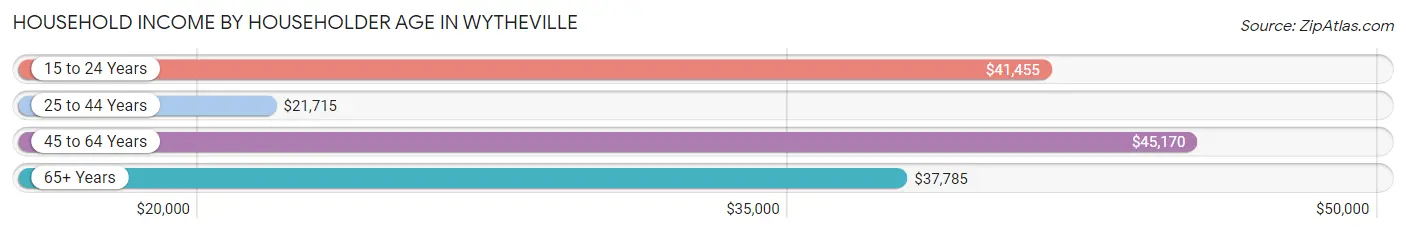
Household Income by Householder Age in Wytheville
The median household income in Wytheville is $39,459, with the highest median household income of $45,170 found in the 45 to 64 years age bracket for the primary householder. A total of 1,502 households (36.5%) fall into this category. Meanwhile, the 25 to 44 years age bracket for the primary householder has the lowest median household income of $21,715, with 952 households (23.1%) in this group.
| Income Bracket | # Households | Median Income |
| 15 to 24 Years | 270 (6.6%) | $41,455 |
| 25 to 44 Years | 952 (23.1%) | $21,715 |
| 45 to 64 Years | 1,502 (36.5%) | $45,170 |
| 65+ Years | 1,393 (33.8%) | $37,785 |
| Total | 4,117 (100.0%) | $39,459 |
Poverty in Wytheville
Income Below Poverty by Sex and Age in Wytheville
With 26.4% poverty level for males and 28.3% for females among the residents of Wytheville, 5 year old males and 16 and 17 year old females are the most vulnerable to poverty, with 84 males (50.3%) and 99 females (91.7%) in their respective age groups living below the poverty level.
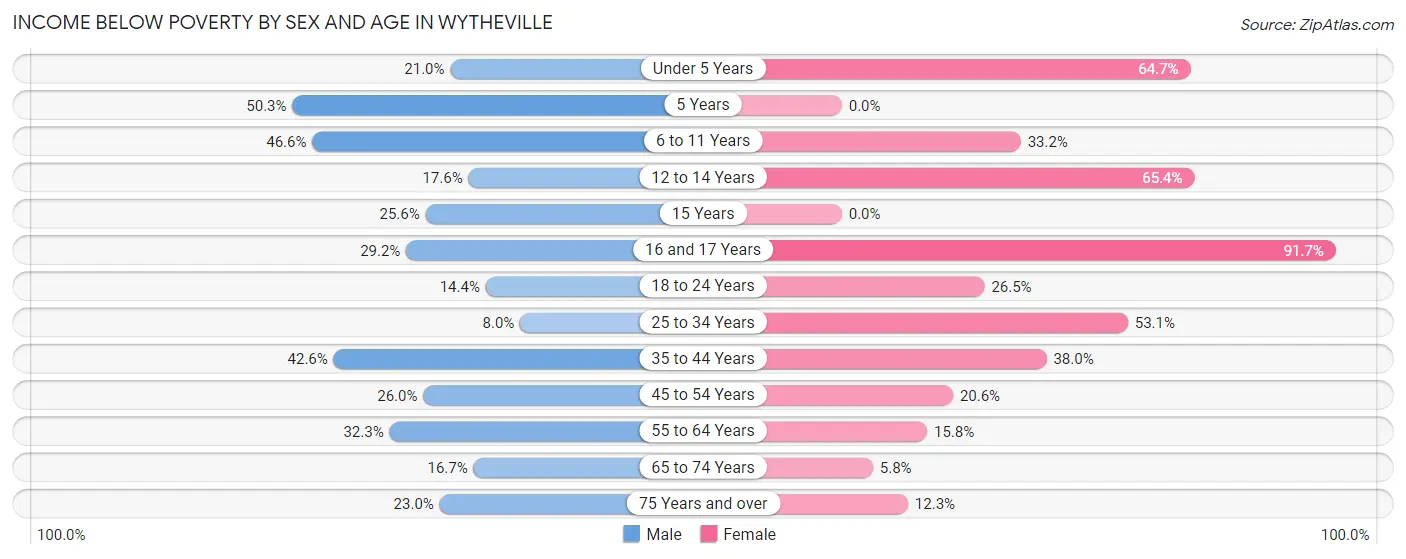
| Age Bracket | Male | Female |
| Under 5 Years | 52 (21.0%) | 77 (64.7%) |
| 5 Years | 84 (50.3%) | 0 (0.0%) |
| 6 to 11 Years | 89 (46.6%) | 87 (33.2%) |
| 12 to 14 Years | 28 (17.6%) | 53 (65.4%) |
| 15 Years | 22 (25.6%) | 0 (0.0%) |
| 16 and 17 Years | 35 (29.2%) | 99 (91.7%) |
| 18 to 24 Years | 51 (14.4%) | 76 (26.5%) |
| 25 to 34 Years | 27 (8.0%) | 250 (53.1%) |
| 35 to 44 Years | 226 (42.6%) | 185 (38.0%) |
| 45 to 54 Years | 176 (26.0%) | 98 (20.6%) |
| 55 to 64 Years | 141 (32.3%) | 72 (15.8%) |
| 65 to 74 Years | 79 (16.7%) | 29 (5.8%) |
| 75 Years and over | 87 (23.0%) | 75 (12.3%) |
| Total | 1,097 (26.4%) | 1,101 (28.3%) |
Income Above Poverty by Sex and Age in Wytheville
According to the poverty statistics in Wytheville, males aged 25 to 34 years and females aged 5 years are the age groups that are most secure financially, with 92.0% of males and 100.0% of females in these age groups living above the poverty line.
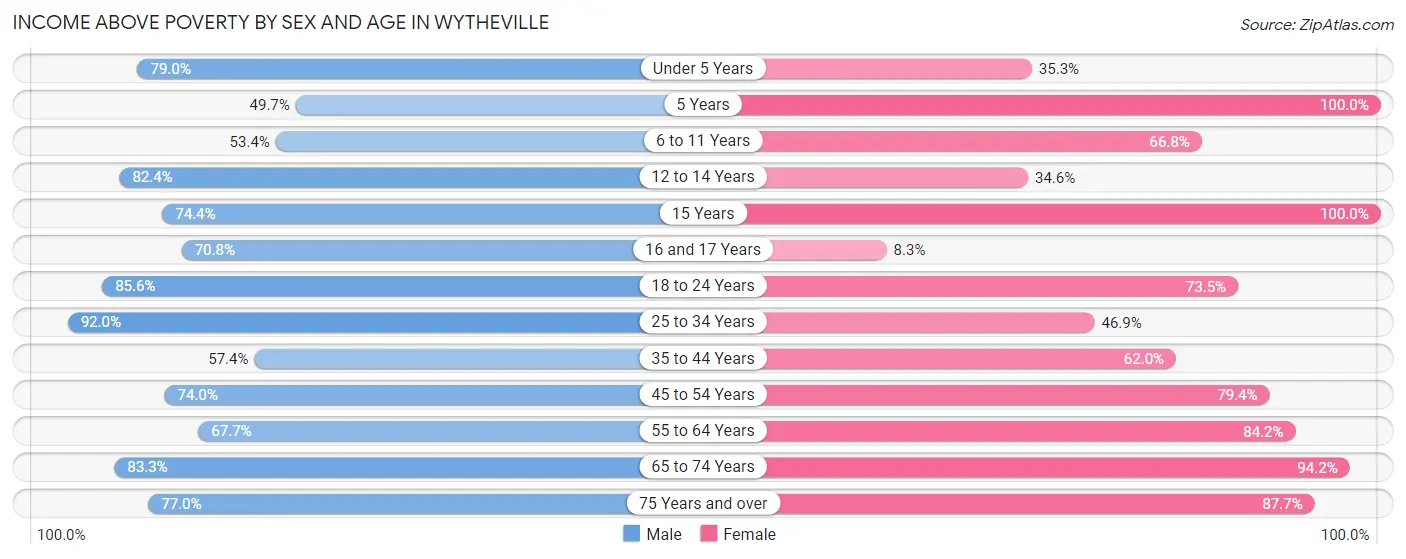
| Age Bracket | Male | Female |
| Under 5 Years | 196 (79.0%) | 42 (35.3%) |
| 5 Years | 83 (49.7%) | 33 (100.0%) |
| 6 to 11 Years | 102 (53.4%) | 175 (66.8%) |
| 12 to 14 Years | 131 (82.4%) | 28 (34.6%) |
| 15 Years | 64 (74.4%) | 2 (100.0%) |
| 16 and 17 Years | 85 (70.8%) | 9 (8.3%) |
| 18 to 24 Years | 303 (85.6%) | 211 (73.5%) |
| 25 to 34 Years | 310 (92.0%) | 221 (46.9%) |
| 35 to 44 Years | 304 (57.4%) | 302 (62.0%) |
| 45 to 54 Years | 501 (74.0%) | 377 (79.4%) |
| 55 to 64 Years | 296 (67.7%) | 383 (84.2%) |
| 65 to 74 Years | 395 (83.3%) | 474 (94.2%) |
| 75 Years and over | 292 (77.0%) | 536 (87.7%) |
| Total | 3,062 (73.6%) | 2,793 (71.7%) |
Income Below Poverty Among Married-Couple Families in Wytheville
The poverty statistics for married-couple families in Wytheville show that 13.7% or 178 of the total 1,299 families live below the poverty line. Families with 3 or 4 children have the highest poverty rate of 100.0%, comprising of 16 families. On the other hand, families with no children have the lowest poverty rate of 4.0%, which includes 30 families.
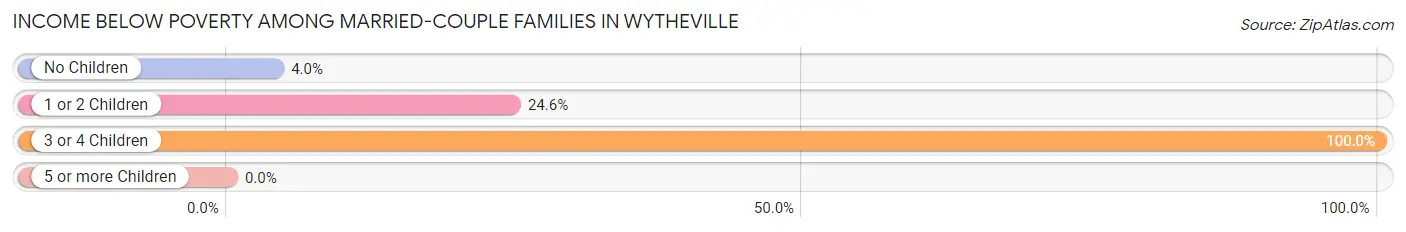
| Children | Above Poverty | Below Poverty |
| No Children | 717 (96.0%) | 30 (4.0%) |
| 1 or 2 Children | 404 (75.4%) | 132 (24.6%) |
| 3 or 4 Children | 0 (0.0%) | 16 (100.0%) |
| 5 or more Children | 0 (0.0%) | 0 (0.0%) |
| Total | 1,121 (86.3%) | 178 (13.7%) |
Income Below Poverty Among Single-Parent Households in Wytheville
According to the poverty data in Wytheville, 16.7% or 42 single-father households and 46.8% or 170 single-mother households are living below the poverty line. Among single-father households, those with 1 or 2 children have the highest poverty rate, with 42 households (23.0%) experiencing poverty. Likewise, among single-mother households, those with 3 or 4 children have the highest poverty rate, with 97 households (70.8%) falling below the poverty line.
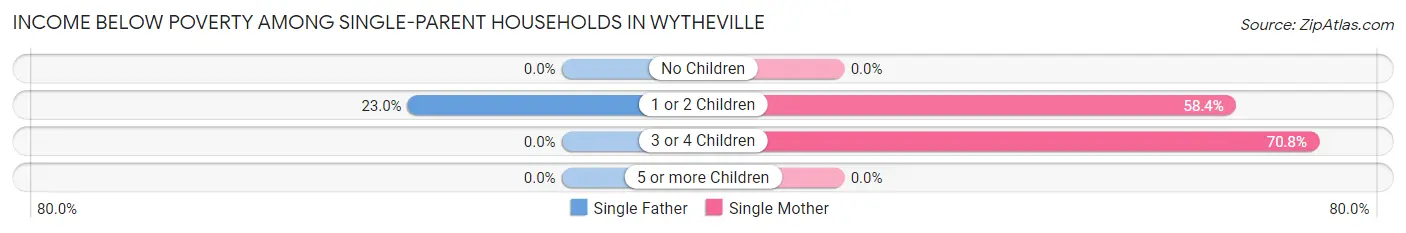
| Children | Single Father | Single Mother |
| No Children | 0 (0.0%) | 0 (0.0%) |
| 1 or 2 Children | 42 (23.0%) | 73 (58.4%) |
| 3 or 4 Children | 0 (0.0%) | 97 (70.8%) |
| 5 or more Children | 0 (0.0%) | 0 (0.0%) |
| Total | 42 (16.7%) | 170 (46.8%) |
Income Below Poverty Among Married-Couple vs Single-Parent Households in Wytheville
The poverty data for Wytheville shows that 178 of the married-couple family households (13.7%) and 212 of the single-parent households (34.5%) are living below the poverty level. Within the married-couple family households, those with 3 or 4 children have the highest poverty rate, with 16 households (100.0%) falling below the poverty line. Among the single-parent households, those with 3 or 4 children have the highest poverty rate, with 97 household (70.8%) living below poverty.
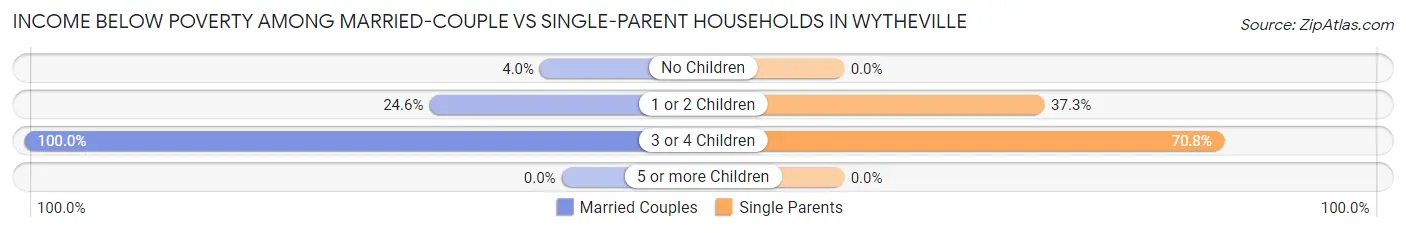
| Children | Married-Couple Families | Single-Parent Households |
| No Children | 30 (4.0%) | 0 (0.0%) |
| 1 or 2 Children | 132 (24.6%) | 115 (37.3%) |
| 3 or 4 Children | 16 (100.0%) | 97 (70.8%) |
| 5 or more Children | 0 (0.0%) | 0 (0.0%) |
| Total | 178 (13.7%) | 212 (34.5%) |
Race in Wytheville
The most populous races in Wytheville are White / Caucasian (7,388 | 89.8%), Black / African American (428 | 5.2%), and Two or more Races (208 | 2.5%).
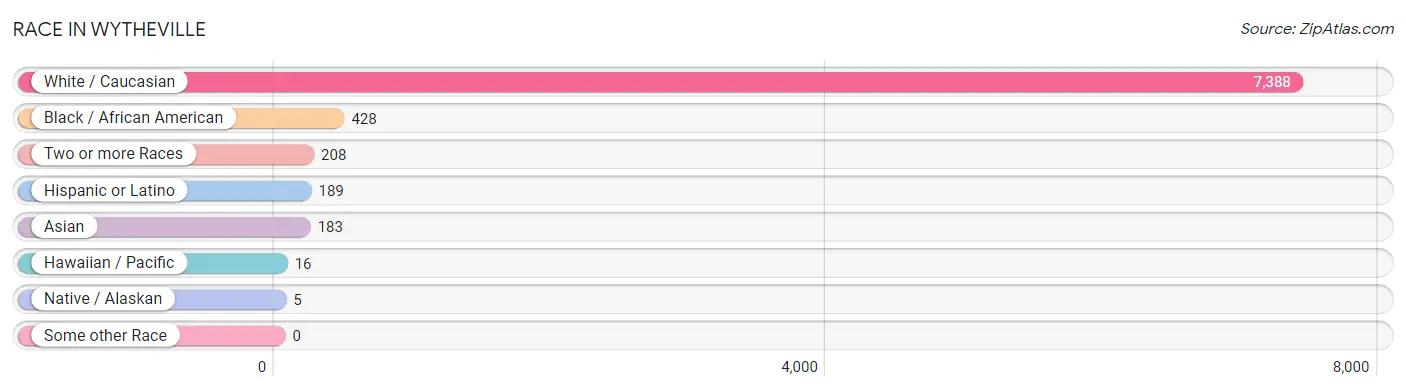
| Race | # Population | % Population |
| Asian | 183 | 2.2% |
| Black / African American | 428 | 5.2% |
| Hawaiian / Pacific | 16 | 0.2% |
| Hispanic or Latino | 189 | 2.3% |
| Native / Alaskan | 5 | 0.1% |
| White / Caucasian | 7,388 | 89.8% |
| Two or more Races | 208 | 2.5% |
| Some other Race | 0 | 0.0% |
| Total | 8,228 | 100.0% |
Ancestry in Wytheville
The most populous ancestries reported in Wytheville are American (2,348 | 28.5%), English (963 | 11.7%), German (946 | 11.5%), Irish (800 | 9.7%), and Scottish (222 | 2.7%), together accounting for 64.2% of all Wytheville residents.
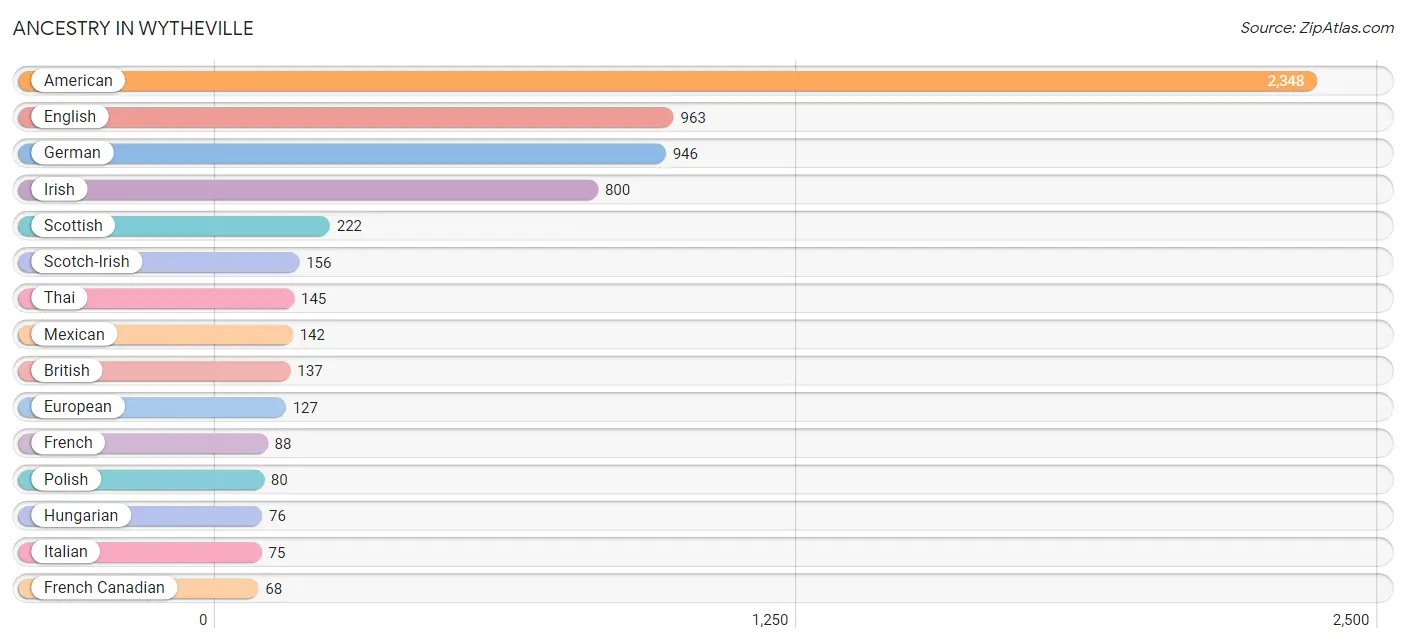
| Ancestry | # Population | % Population |
| American | 2,348 | 28.5% |
| Arab | 20 | 0.2% |
| Bhutanese | 15 | 0.2% |
| British | 137 | 1.7% |
| Canadian | 21 | 0.3% |
| Celtic | 10 | 0.1% |
| Central American | 1 | 0.0% |
| Cherokee | 10 | 0.1% |
| Choctaw | 9 | 0.1% |
| Danish | 15 | 0.2% |
| Dutch | 61 | 0.7% |
| Egyptian | 20 | 0.2% |
| English | 963 | 11.7% |
| Ethiopian | 1 | 0.0% |
| European | 127 | 1.5% |
| French | 88 | 1.1% |
| French Canadian | 68 | 0.8% |
| German | 946 | 11.5% |
| Greek | 8 | 0.1% |
| Honduran | 1 | 0.0% |
| Hungarian | 76 | 0.9% |
| Indian (Asian) | 10 | 0.1% |
| Irish | 800 | 9.7% |
| Italian | 75 | 0.9% |
| Lumbee | 1 | 0.0% |
| Mexican | 142 | 1.7% |
| Norwegian | 23 | 0.3% |
| Polish | 80 | 1.0% |
| Scotch-Irish | 156 | 1.9% |
| Scottish | 222 | 2.7% |
| Spaniard | 41 | 0.5% |
| Sri Lankan | 13 | 0.2% |
| Subsaharan African | 1 | 0.0% |
| Swedish | 24 | 0.3% |
| Swiss | 14 | 0.2% |
| Thai | 145 | 1.8% |
| Welsh | 33 | 0.4% | View All 37 Rows |
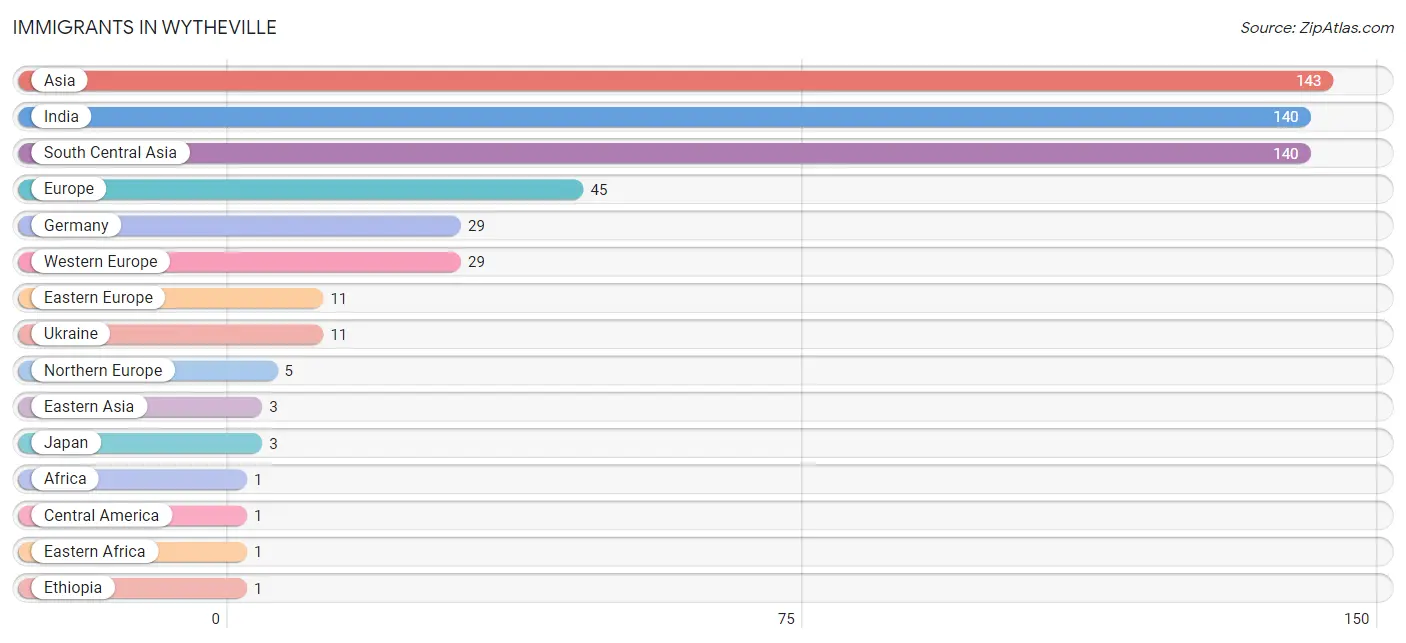
Immigrants in Wytheville
The most numerous immigrant groups reported in Wytheville came from Asia (143 | 1.7%), India (140 | 1.7%), South Central Asia (140 | 1.7%), Europe (45 | 0.5%), and Germany (29 | 0.4%), together accounting for 6.0% of all Wytheville residents.
| Immigration Origin | # Population | % Population |
| Africa | 1 | 0.0% |
| Asia | 143 | 1.7% |
| Central America | 1 | 0.0% |
| Eastern Africa | 1 | 0.0% |
| Eastern Asia | 3 | 0.0% |
| Eastern Europe | 11 | 0.1% |
| Ethiopia | 1 | 0.0% |
| Europe | 45 | 0.5% |
| Germany | 29 | 0.4% |
| Honduras | 1 | 0.0% |
| India | 140 | 1.7% |
| Japan | 3 | 0.0% |
| Latin America | 1 | 0.0% |
| Northern Europe | 5 | 0.1% |
| South Central Asia | 140 | 1.7% |
| Ukraine | 11 | 0.1% |
| Western Europe | 29 | 0.4% | View All 17 Rows |
Sex and Age in Wytheville
Sex and Age in Wytheville
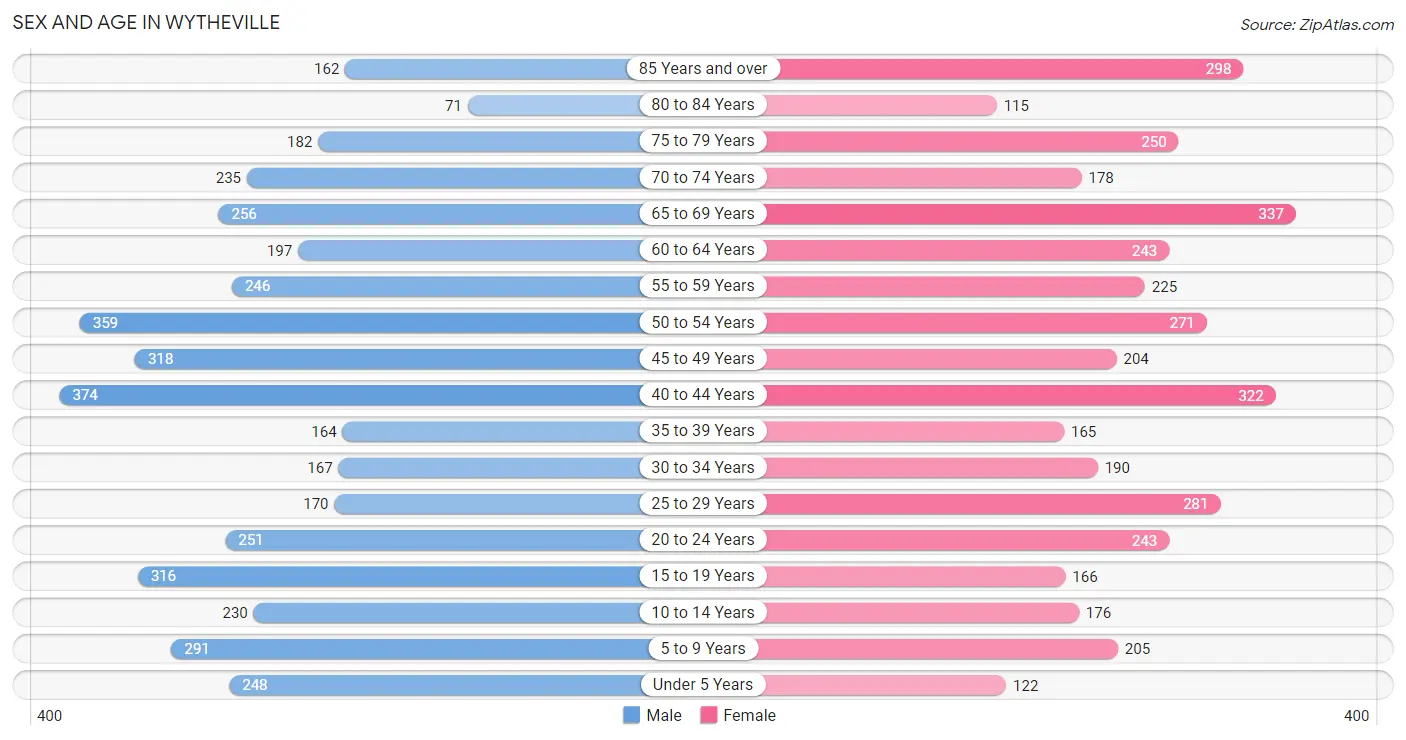
The most populous age groups in Wytheville are 40 to 44 Years (374 | 8.8%) for men and 65 to 69 Years (337 | 8.4%) for women.
| Age Bracket | Male | Female |
| Under 5 Years | 248 (5.9%) | 122 (3.1%) |
| 5 to 9 Years | 291 (6.9%) | 205 (5.1%) |
| 10 to 14 Years | 230 (5.4%) | 176 (4.4%) |
| 15 to 19 Years | 316 (7.5%) | 166 (4.2%) |
| 20 to 24 Years | 251 (5.9%) | 243 (6.1%) |
| 25 to 29 Years | 170 (4.0%) | 281 (7.0%) |
| 30 to 34 Years | 167 (3.9%) | 190 (4.8%) |
| 35 to 39 Years | 164 (3.9%) | 165 (4.1%) |
| 40 to 44 Years | 374 (8.8%) | 322 (8.1%) |
| 45 to 49 Years | 318 (7.5%) | 204 (5.1%) |
| 50 to 54 Years | 359 (8.5%) | 271 (6.8%) |
| 55 to 59 Years | 246 (5.8%) | 225 (5.6%) |
| 60 to 64 Years | 197 (4.6%) | 243 (6.1%) |
| 65 to 69 Years | 256 (6.0%) | 337 (8.4%) |
| 70 to 74 Years | 235 (5.6%) | 178 (4.5%) |
| 75 to 79 Years | 182 (4.3%) | 250 (6.3%) |
| 80 to 84 Years | 71 (1.7%) | 115 (2.9%) |
| 85 Years and over | 162 (3.8%) | 298 (7.5%) |
| Total | 4,237 (100.0%) | 3,991 (100.0%) |
Families and Households in Wytheville
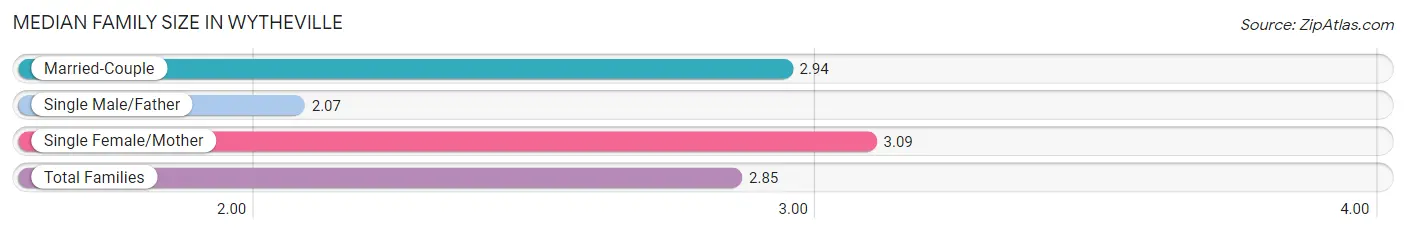
Median Family Size in Wytheville
The median family size in Wytheville is 2.85 persons per family, with single female/mother families (363 | 19.0%) accounting for the largest median family size of 3.09 persons per family. On the other hand, single male/father families (251 | 13.1%) represent the smallest median family size with 2.07 persons per family.
| Family Type | # Families | Family Size |
| Married-Couple | 1,299 (67.9%) | 2.94 |
| Single Male/Father | 251 (13.1%) | 2.07 |
| Single Female/Mother | 363 (19.0%) | 3.09 |
| Total Families | 1,913 (100.0%) | 2.85 |
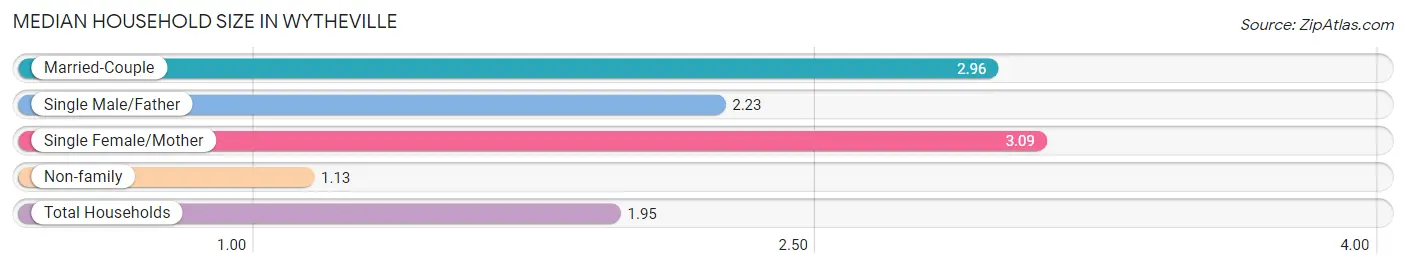
Median Household Size in Wytheville
The median household size in Wytheville is 1.95 persons per household, with single female/mother households (363 | 8.8%) accounting for the largest median household size of 3.09 persons per household. non-family households (2,204 | 53.5%) represent the smallest median household size with 1.13 persons per household.
| Household Type | # Households | Household Size |
| Married-Couple | 1,299 (31.6%) | 2.96 |
| Single Male/Father | 251 (6.1%) | 2.23 |
| Single Female/Mother | 363 (8.8%) | 3.09 |
| Non-family | 2,204 (53.5%) | 1.13 |
| Total Households | 4,117 (100.0%) | 1.95 |
Household Size by Marriage Status in Wytheville
Out of a total of 4,117 households in Wytheville, 1,913 (46.5%) are family households, while 2,204 (53.5%) are nonfamily households. The most numerous type of family households are 2-person households, comprising 864, and the most common type of nonfamily households are 1-person households, comprising 1,967.
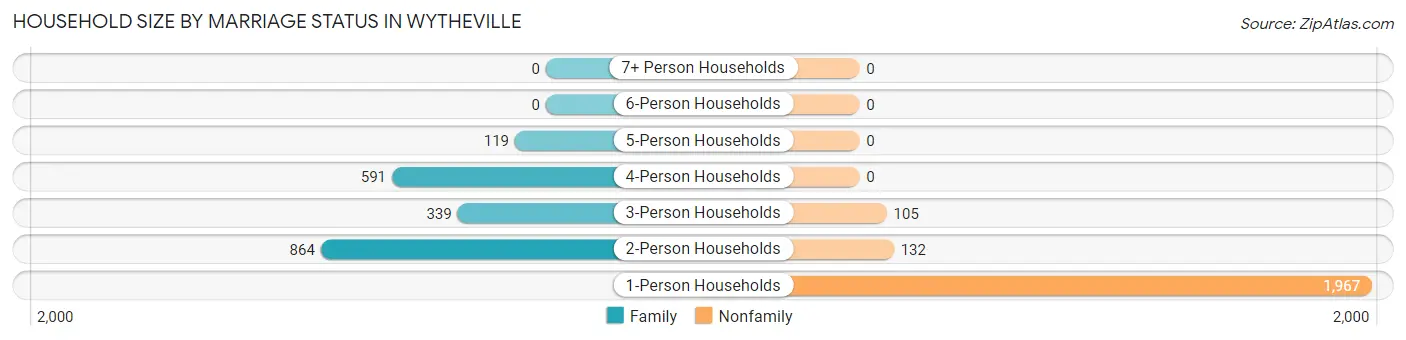
| Household Size | Family Households | Nonfamily Households |
| 1-Person Households | - | 1,967 (47.8%) |
| 2-Person Households | 864 (21.0%) | 132 (3.2%) |
| 3-Person Households | 339 (8.2%) | 105 (2.5%) |
| 4-Person Households | 591 (14.4%) | 0 (0.0%) |
| 5-Person Households | 119 (2.9%) | 0 (0.0%) |
| 6-Person Households | 0 (0.0%) | 0 (0.0%) |
| 7+ Person Households | 0 (0.0%) | 0 (0.0%) |
| Total | 1,913 (46.5%) | 2,204 (53.5%) |
Female Fertility in Wytheville
Fertility by Age in Wytheville
Average fertility rate in Wytheville is 64.0 births per 1,000 women. Women in the age bracket of 20 to 34 years have the highest fertility rate with 143.0 births per 1,000 women. Women in the age bracket of 20 to 34 years acount for 100.0% of all women with births.
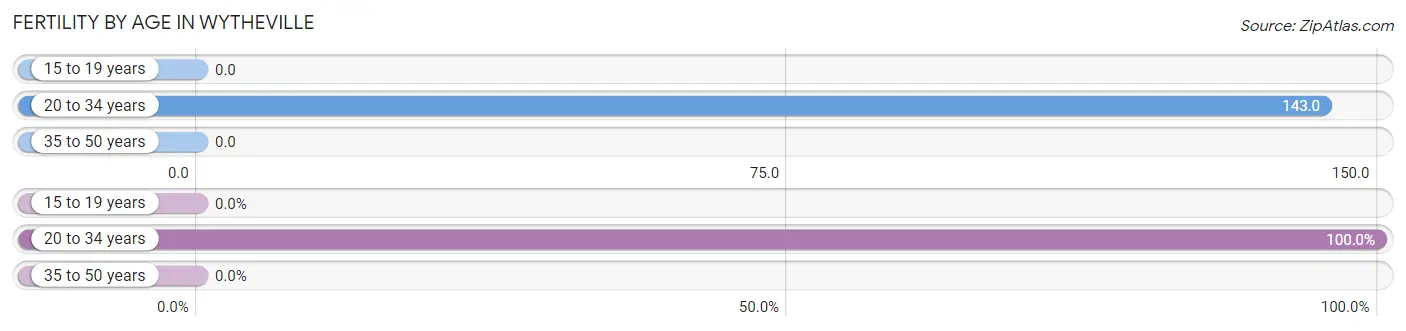
| Age Bracket | Women with Births | Births / 1,000 Women |
| 15 to 19 years | 0 (0.0%) | 0.0 |
| 20 to 34 years | 102 (100.0%) | 143.0 |
| 35 to 50 years | 0 (0.0%) | 0.0 |
| Total | 102 (100.0%) | 64.0 |
Fertility by Age by Marriage Status in Wytheville
49.0% of women with births (102) in Wytheville are married. The highest percentage of unmarried women with births falls into 20 to 34 years age bracket with 51.0% of them unmarried at the time of birth, while the lowest percentage of unmarried women with births belong to 20 to 34 years age bracket with 51.0% of them unmarried.
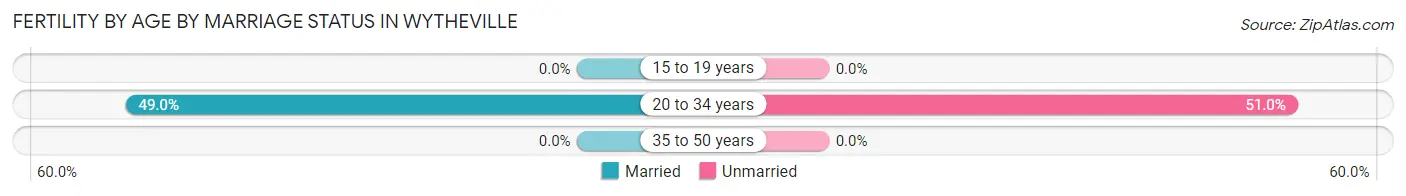
| Age Bracket | Married | Unmarried |
| 15 to 19 years | 0 (0.0%) | 0 (0.0%) |
| 20 to 34 years | 50 (49.0%) | 52 (51.0%) |
| 35 to 50 years | 0 (0.0%) | 0 (0.0%) |
| Total | 50 (49.0%) | 52 (51.0%) |
Fertility by Education in Wytheville
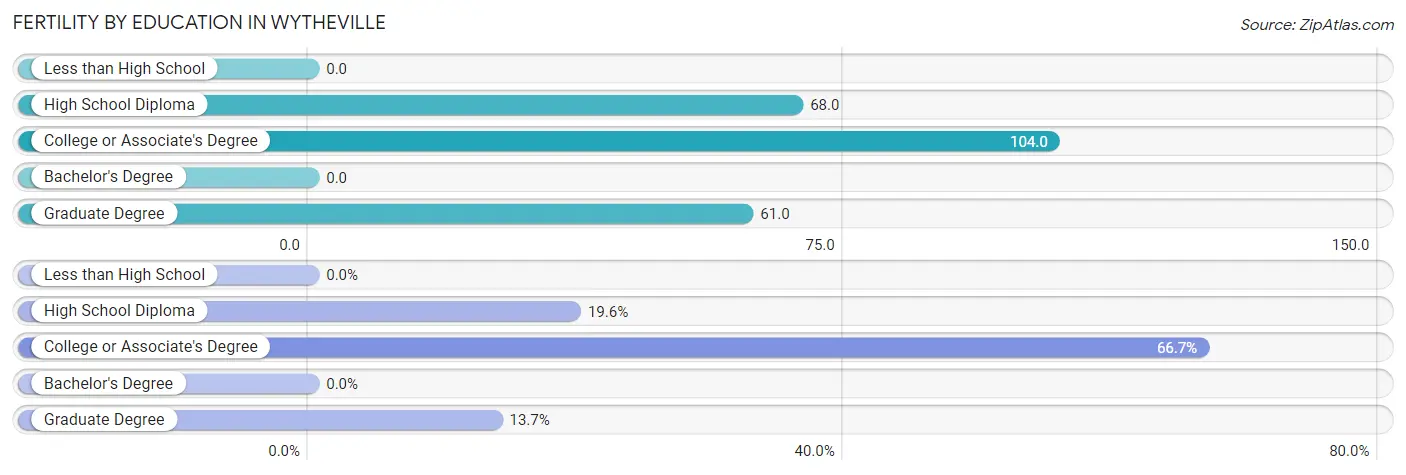
| Educational Attainment | Women with Births | Births / 1,000 Women |
| Less than High School | 0 (0.0%) | 0.0 |
| High School Diploma | 20 (19.6%) | 68.0 |
| College or Associate's Degree | 68 (66.7%) | 104.0 |
| Bachelor's Degree | 0 (0.0%) | 0.0 |
| Graduate Degree | 14 (13.7%) | 61.0 |
| Total | 102 (100.0%) | 64.0 |
Fertility by Education by Marriage Status in Wytheville
51.0% of women with births in Wytheville are unmarried. Women with the educational attainment of high school diploma are most likely to be married with 100.0% of them married at childbirth, while women with the educational attainment of college or associate's degree are least likely to be married with 76.5% of them unmarried at childbirth.
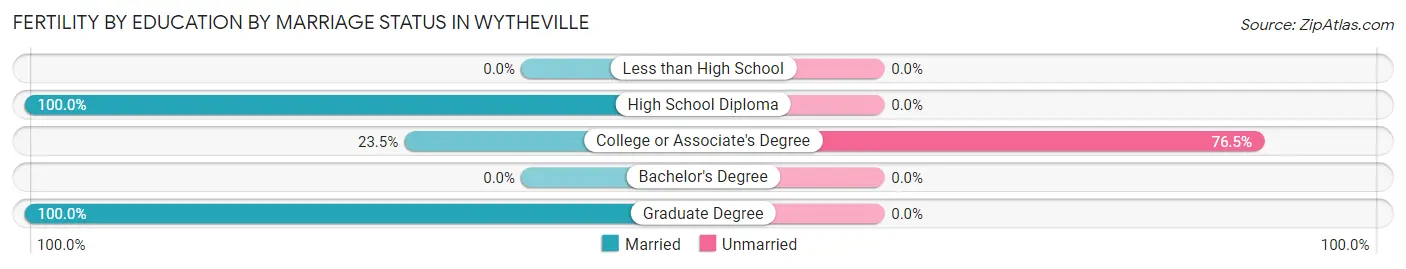
| Educational Attainment | Married | Unmarried |
| Less than High School | 0 (0.0%) | 0 (0.0%) |
| High School Diploma | 20 (100.0%) | 0 (0.0%) |
| College or Associate's Degree | 16 (23.5%) | 52 (76.5%) |
| Bachelor's Degree | 0 (0.0%) | 0 (0.0%) |
| Graduate Degree | 14 (100.0%) | 0 (0.0%) |
| Total | 50 (49.0%) | 52 (51.0%) |
Employment Characteristics in Wytheville
Employment by Class of Employer in Wytheville
Among the 3,282 employed individuals in Wytheville, private company employees (2,189 | 66.7%), local government employees (443 | 13.5%), and state government employees (210 | 6.4%) make up the most common classes of employment.
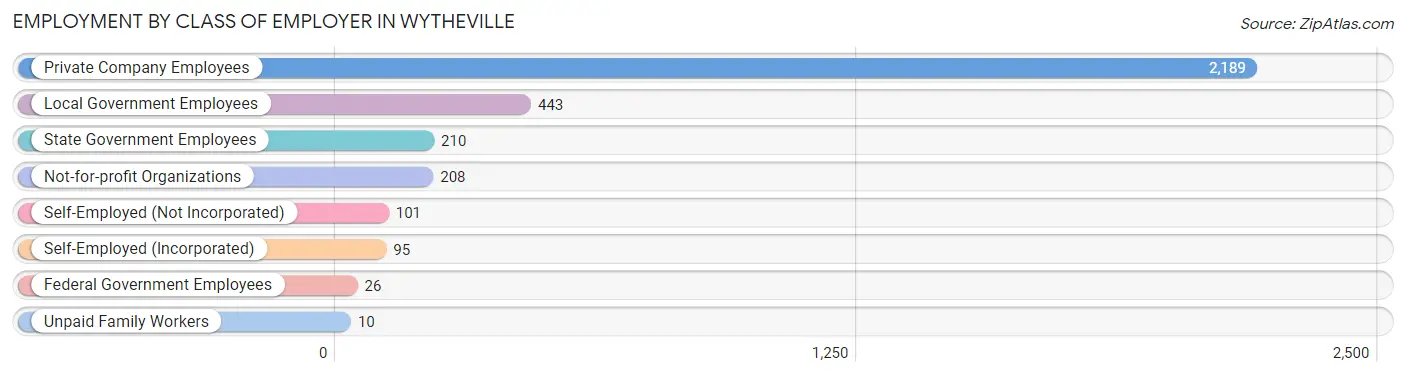
| Employer Class | # Employees | % Employees |
| Private Company Employees | 2,189 | 66.7% |
| Self-Employed (Incorporated) | 95 | 2.9% |
| Self-Employed (Not Incorporated) | 101 | 3.1% |
| Not-for-profit Organizations | 208 | 6.3% |
| Local Government Employees | 443 | 13.5% |
| State Government Employees | 210 | 6.4% |
| Federal Government Employees | 26 | 0.8% |
| Unpaid Family Workers | 10 | 0.3% |
| Total | 3,282 | 100.0% |
Employment Status by Age in Wytheville
According to the labor force statistics for Wytheville, out of the total population over 16 years of age (6,867), 51.7% or 3,550 individuals are in the labor force, with 5.4% or 192 of them unemployed. The age group with the highest labor force participation rate is 45 to 54 years, with 83.2% or 958 individuals in the labor force. Within the labor force, the 35 to 44 years age range has the highest percentage of unemployed individuals, with 14.3% or 108 of them being unemployed.
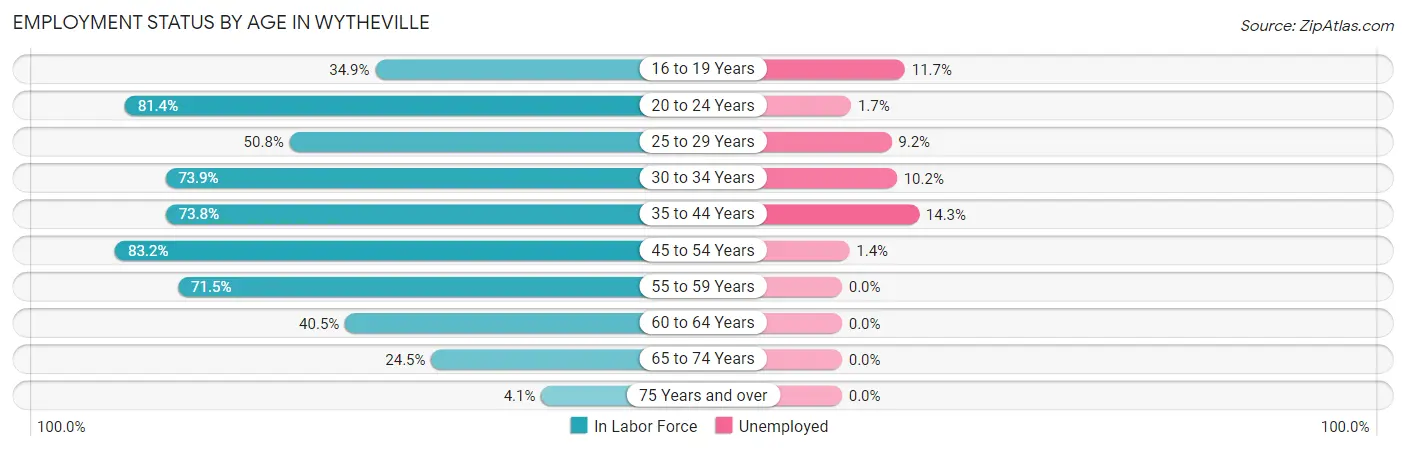
| Age Bracket | In Labor Force | Unemployed |
| 16 to 19 Years | 137 (34.9%) | 16 (11.7%) |
| 20 to 24 Years | 402 (81.4%) | 7 (1.7%) |
| 25 to 29 Years | 229 (50.8%) | 21 (9.2%) |
| 30 to 34 Years | 264 (73.9%) | 27 (10.2%) |
| 35 to 44 Years | 756 (73.8%) | 108 (14.3%) |
| 45 to 54 Years | 958 (83.2%) | 13 (1.4%) |
| 55 to 59 Years | 337 (71.5%) | 0 (0.0%) |
| 60 to 64 Years | 178 (40.5%) | 0 (0.0%) |
| 65 to 74 Years | 246 (24.5%) | 0 (0.0%) |
| 75 Years and over | 44 (4.1%) | 0 (0.0%) |
| Total | 3,550 (51.7%) | 192 (5.4%) |
Employment Status by Educational Attainment in Wytheville
According to labor force statistics for Wytheville, 69.9% of individuals (2,723) out of the total population between 25 and 64 years of age (3,896) are in the labor force, with 6.2% or 169 of them being unemployed. The group with the highest labor force participation rate are those with the educational attainment of bachelor's degree or higher, with 82.5% or 799 individuals in the labor force. Within the labor force, individuals with less than high school education have the highest percentage of unemployment, with 10.8% or 27 of them being unemployed.
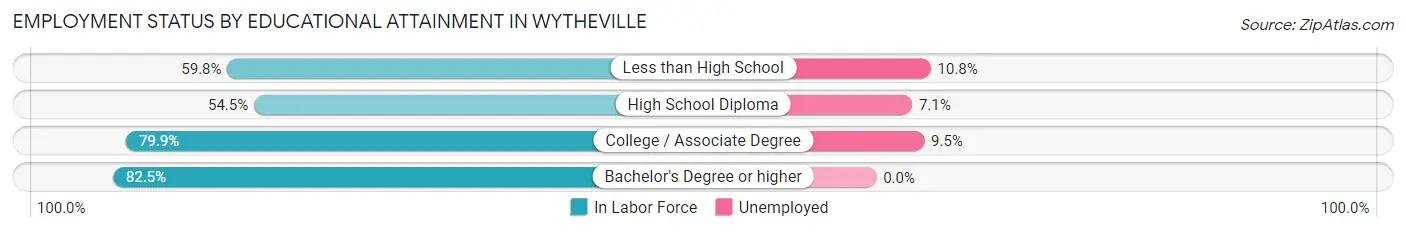
| Educational Attainment | In Labor Force | Unemployed |
| Less than High School | 250 (59.8%) | 45 (10.8%) |
| High School Diploma | 716 (54.5%) | 93 (7.1%) |
| College / Associate Degree | 956 (79.9%) | 114 (9.5%) |
| Bachelor's Degree or higher | 799 (82.5%) | 0 (0.0%) |
| Total | 2,723 (69.9%) | 242 (6.2%) |
Employment Occupations by Sex in Wytheville
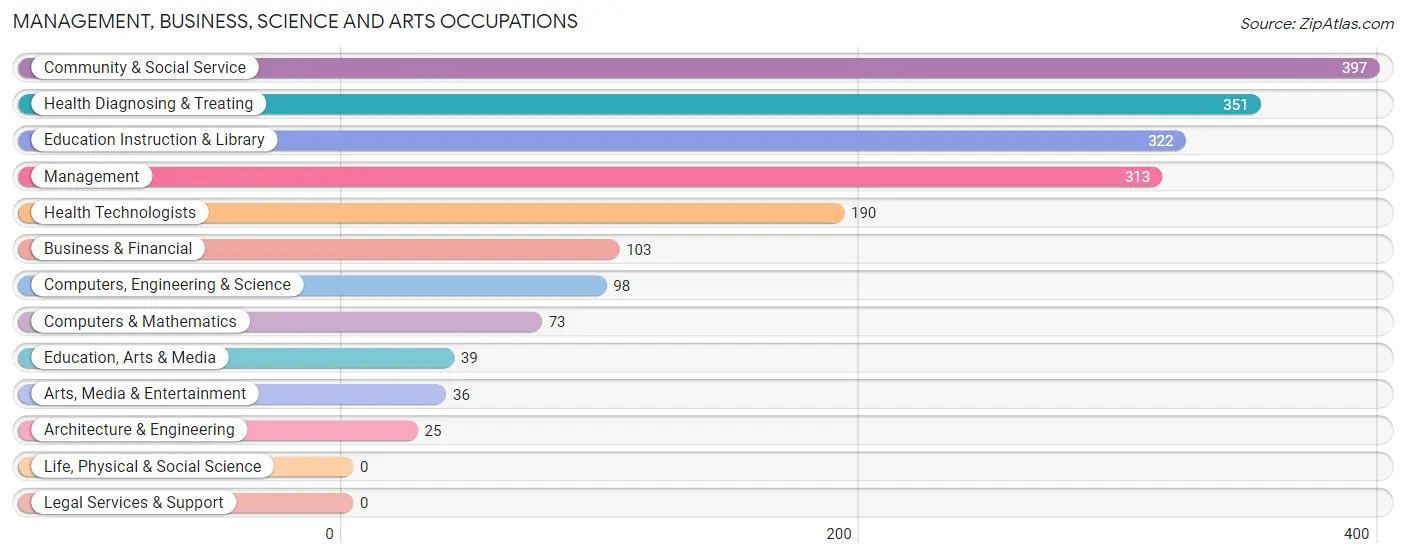
Management, Business, Science and Arts Occupations
The most common Management, Business, Science and Arts occupations in Wytheville are Community & Social Service (397 | 11.8%), Health Diagnosing & Treating (351 | 10.4%), Education Instruction & Library (322 | 9.6%), Management (313 | 9.3%), and Health Technologists (190 | 5.7%).
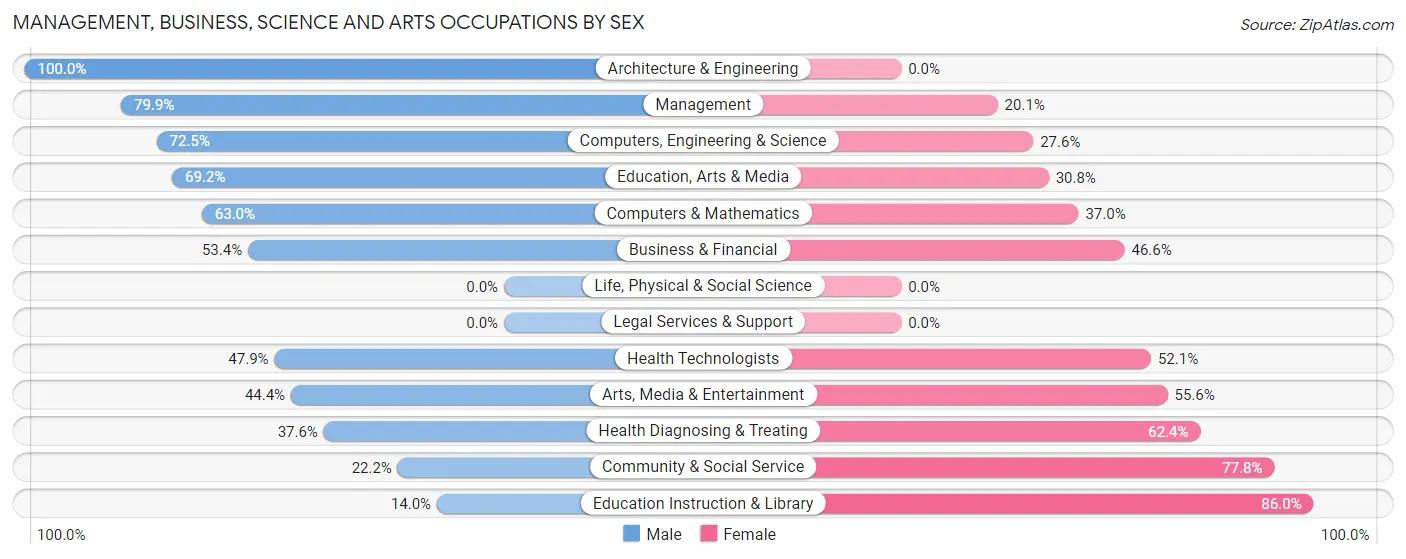
Management, Business, Science and Arts Occupations by Sex
Within the Management, Business, Science and Arts occupations in Wytheville, the most male-oriented occupations are Architecture & Engineering (100.0%), Management (79.9%), and Computers, Engineering & Science (72.5%), while the most female-oriented occupations are Education Instruction & Library (86.0%), Community & Social Service (77.8%), and Health Diagnosing & Treating (62.4%).
| Occupation | Male | Female |
| Management | 250 (79.9%) | 63 (20.1%) |
| Business & Financial | 55 (53.4%) | 48 (46.6%) |
| Computers, Engineering & Science | 71 (72.5%) | 27 (27.6%) |
| Computers & Mathematics | 46 (63.0%) | 27 (37.0%) |
| Architecture & Engineering | 25 (100.0%) | 0 (0.0%) |
| Life, Physical & Social Science | 0 (0.0%) | 0 (0.0%) |
| Community & Social Service | 88 (22.2%) | 309 (77.8%) |
| Education, Arts & Media | 27 (69.2%) | 12 (30.8%) |
| Legal Services & Support | 0 (0.0%) | 0 (0.0%) |
| Education Instruction & Library | 45 (14.0%) | 277 (86.0%) |
| Arts, Media & Entertainment | 16 (44.4%) | 20 (55.6%) |
| Health Diagnosing & Treating | 132 (37.6%) | 219 (62.4%) |
| Health Technologists | 91 (47.9%) | 99 (52.1%) |
| Total (Category) | 596 (47.2%) | 666 (52.8%) |
| Total (Overall) | 1,805 (53.7%) | 1,554 (46.3%) |
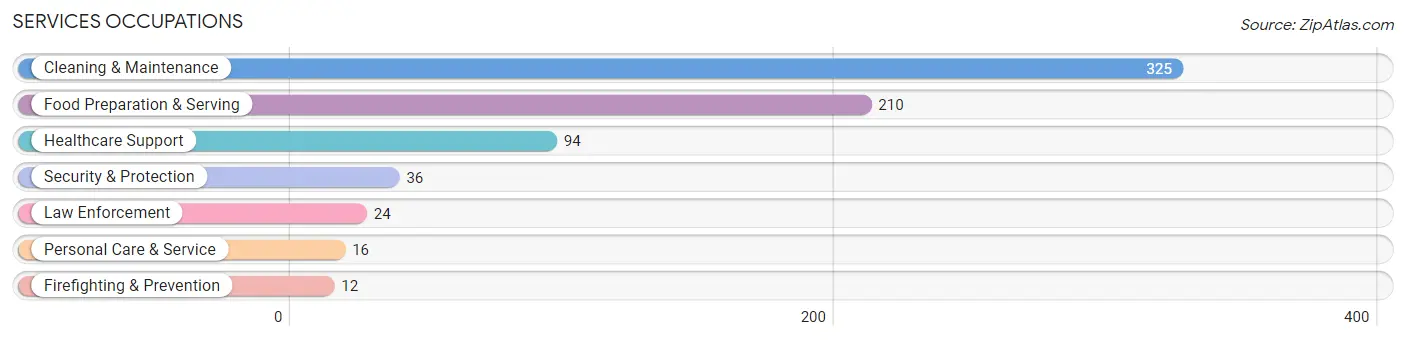
Services Occupations
The most common Services occupations in Wytheville are Cleaning & Maintenance (325 | 9.7%), Food Preparation & Serving (210 | 6.2%), Healthcare Support (94 | 2.8%), Security & Protection (36 | 1.1%), and Law Enforcement (24 | 0.7%).
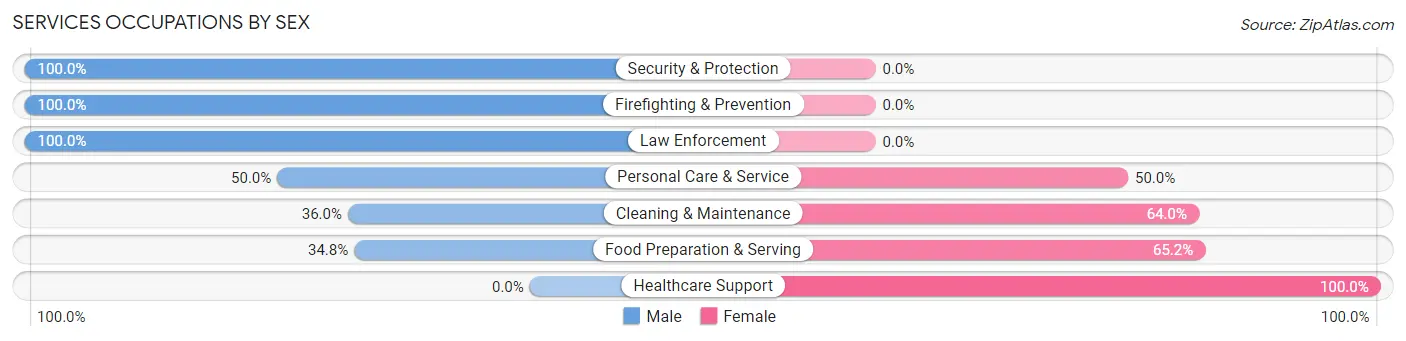
Services Occupations by Sex
Within the Services occupations in Wytheville, the most male-oriented occupations are Security & Protection (100.0%), Firefighting & Prevention (100.0%), and Law Enforcement (100.0%), while the most female-oriented occupations are Healthcare Support (100.0%), Food Preparation & Serving (65.2%), and Cleaning & Maintenance (64.0%).
| Occupation | Male | Female |
| Healthcare Support | 0 (0.0%) | 94 (100.0%) |
| Security & Protection | 36 (100.0%) | 0 (0.0%) |
| Firefighting & Prevention | 12 (100.0%) | 0 (0.0%) |
| Law Enforcement | 24 (100.0%) | 0 (0.0%) |
| Food Preparation & Serving | 73 (34.8%) | 137 (65.2%) |
| Cleaning & Maintenance | 117 (36.0%) | 208 (64.0%) |
| Personal Care & Service | 8 (50.0%) | 8 (50.0%) |
| Total (Category) | 234 (34.4%) | 447 (65.6%) |
| Total (Overall) | 1,805 (53.7%) | 1,554 (46.3%) |
Sales and Office Occupations
The most common Sales and Office occupations in Wytheville are Sales & Related (422 | 12.6%), and Office & Administration (205 | 6.1%).
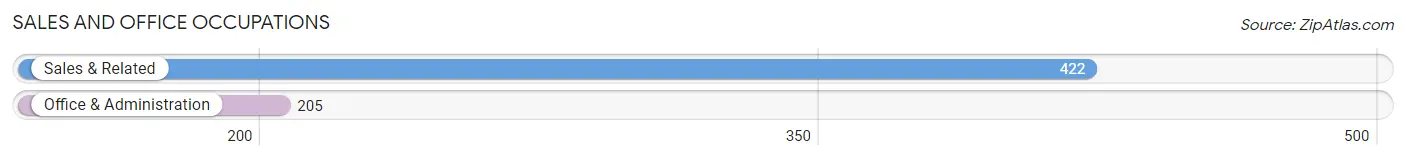
Sales and Office Occupations by Sex
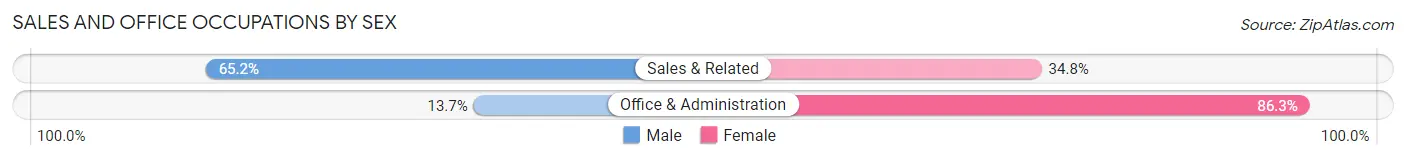
| Occupation | Male | Female |
| Sales & Related | 275 (65.2%) | 147 (34.8%) |
| Office & Administration | 28 (13.7%) | 177 (86.3%) |
| Total (Category) | 303 (48.3%) | 324 (51.7%) |
| Total (Overall) | 1,805 (53.7%) | 1,554 (46.3%) |
Natural Resources, Construction and Maintenance Occupations
The most common Natural Resources, Construction and Maintenance occupations in Wytheville are Installation, Maintenance & Repair (48 | 1.4%), and Construction & Extraction (46 | 1.4%).
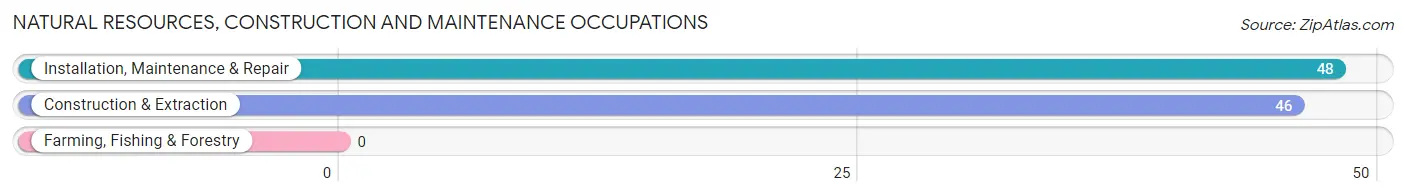
Natural Resources, Construction and Maintenance Occupations by Sex
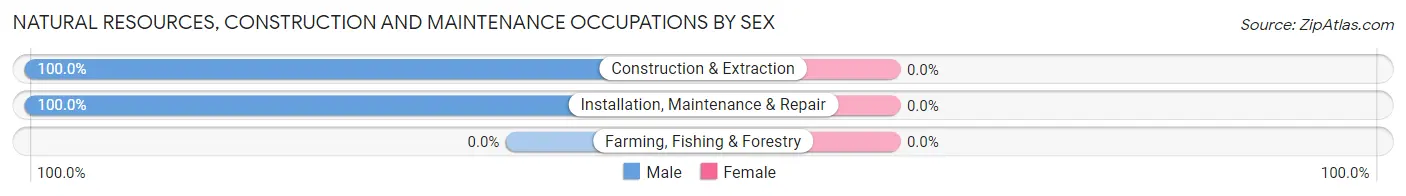
| Occupation | Male | Female |
| Farming, Fishing & Forestry | 0 (0.0%) | 0 (0.0%) |
| Construction & Extraction | 46 (100.0%) | 0 (0.0%) |
| Installation, Maintenance & Repair | 48 (100.0%) | 0 (0.0%) |
| Total (Category) | 94 (100.0%) | 0 (0.0%) |
| Total (Overall) | 1,805 (53.7%) | 1,554 (46.3%) |
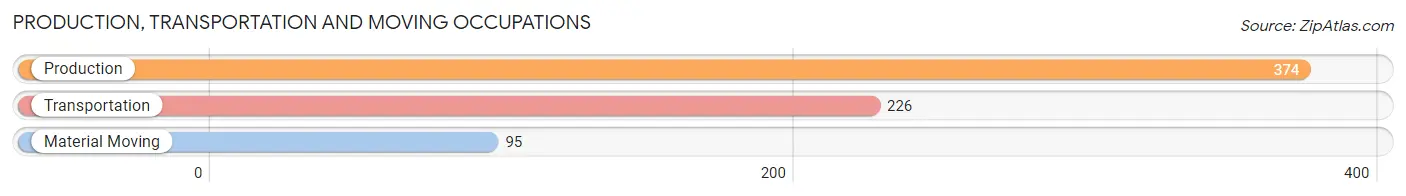
Production, Transportation and Moving Occupations
The most common Production, Transportation and Moving occupations in Wytheville are Production (374 | 11.1%), Transportation (226 | 6.7%), and Material Moving (95 | 2.8%).
Production, Transportation and Moving Occupations by Sex
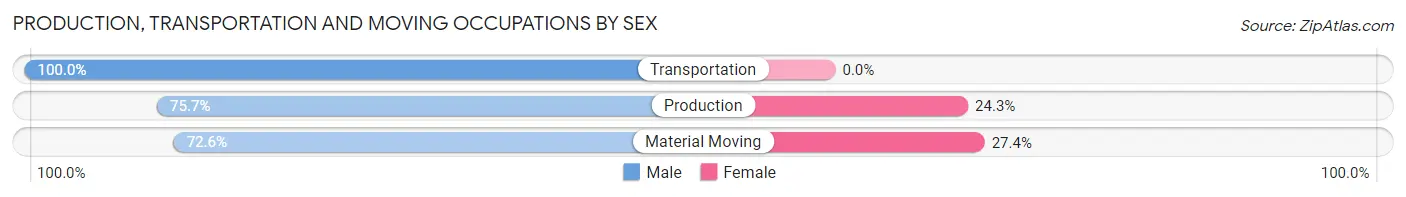
| Occupation | Male | Female |
| Production | 283 (75.7%) | 91 (24.3%) |
| Transportation | 226 (100.0%) | 0 (0.0%) |
| Material Moving | 69 (72.6%) | 26 (27.4%) |
| Total (Category) | 578 (83.2%) | 117 (16.8%) |
| Total (Overall) | 1,805 (53.7%) | 1,554 (46.3%) |
Employment Industries by Sex in Wytheville
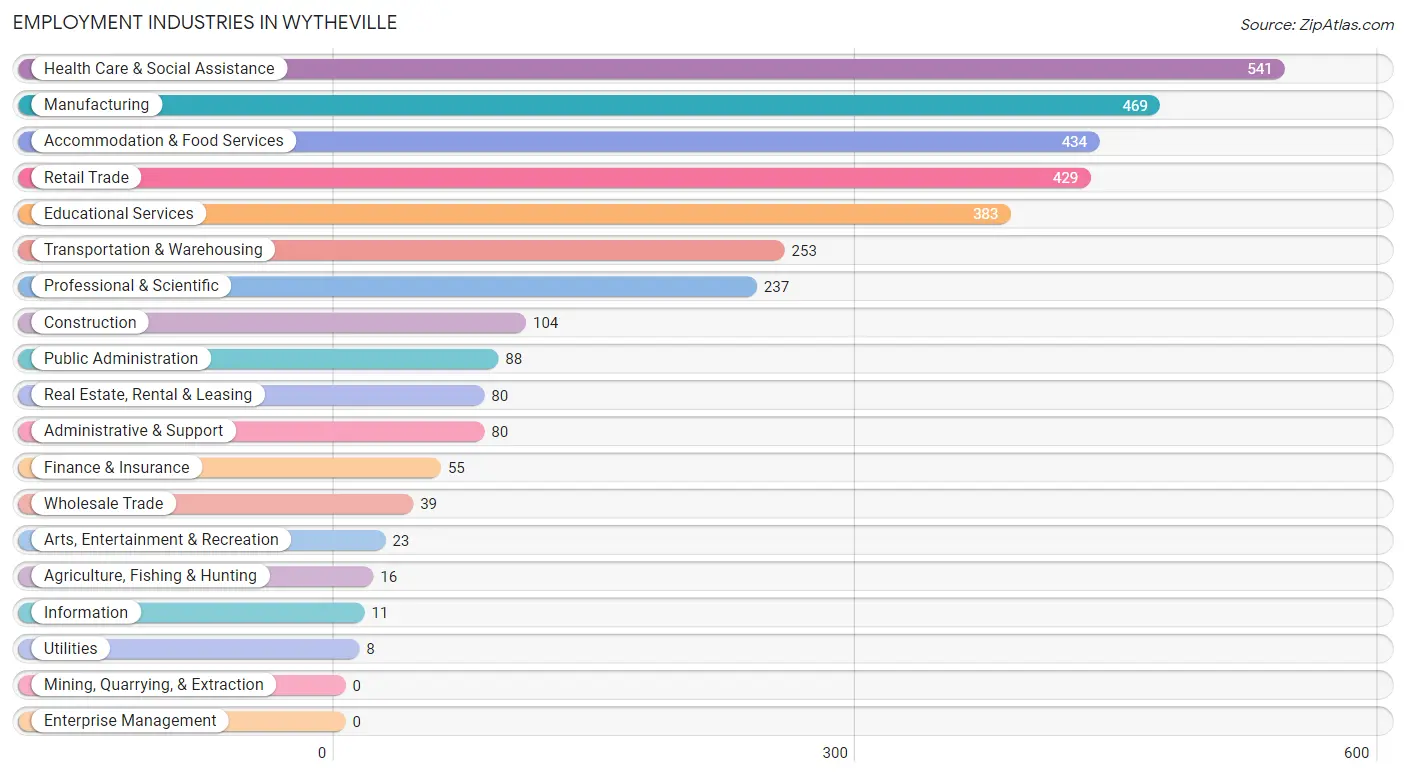
Employment Industries in Wytheville
The major employment industries in Wytheville include Health Care & Social Assistance (541 | 16.1%), Manufacturing (469 | 14.0%), Accommodation & Food Services (434 | 12.9%), Retail Trade (429 | 12.8%), and Educational Services (383 | 11.4%).
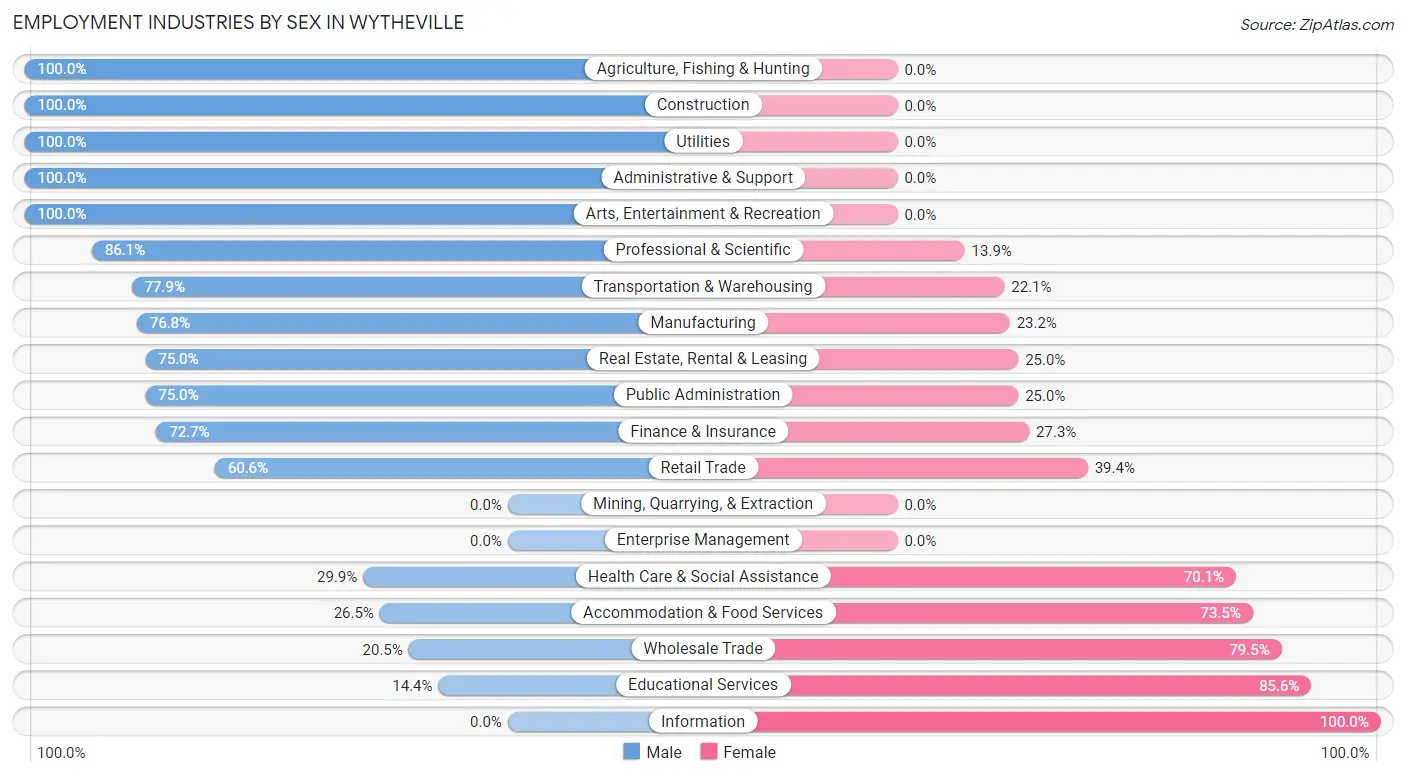
Employment Industries by Sex in Wytheville
The Wytheville industries that see more men than women are Agriculture, Fishing & Hunting (100.0%), Construction (100.0%), and Utilities (100.0%), whereas the industries that tend to have a higher number of women are Information (100.0%), Educational Services (85.6%), and Wholesale Trade (79.5%).
| Industry | Male | Female |
| Agriculture, Fishing & Hunting | 16 (100.0%) | 0 (0.0%) |
| Mining, Quarrying, & Extraction | 0 (0.0%) | 0 (0.0%) |
| Construction | 104 (100.0%) | 0 (0.0%) |
| Manufacturing | 360 (76.8%) | 109 (23.2%) |
| Wholesale Trade | 8 (20.5%) | 31 (79.5%) |
| Retail Trade | 260 (60.6%) | 169 (39.4%) |
| Transportation & Warehousing | 197 (77.9%) | 56 (22.1%) |
| Utilities | 8 (100.0%) | 0 (0.0%) |
| Information | 0 (0.0%) | 11 (100.0%) |
| Finance & Insurance | 40 (72.7%) | 15 (27.3%) |
| Real Estate, Rental & Leasing | 60 (75.0%) | 20 (25.0%) |
| Professional & Scientific | 204 (86.1%) | 33 (13.9%) |
| Enterprise Management | 0 (0.0%) | 0 (0.0%) |
| Administrative & Support | 80 (100.0%) | 0 (0.0%) |
| Educational Services | 55 (14.4%) | 328 (85.6%) |
| Health Care & Social Assistance | 162 (29.9%) | 379 (70.1%) |
| Arts, Entertainment & Recreation | 23 (100.0%) | 0 (0.0%) |
| Accommodation & Food Services | 115 (26.5%) | 319 (73.5%) |
| Public Administration | 66 (75.0%) | 22 (25.0%) |
| Total | 1,805 (53.7%) | 1,554 (46.3%) |
Education in Wytheville
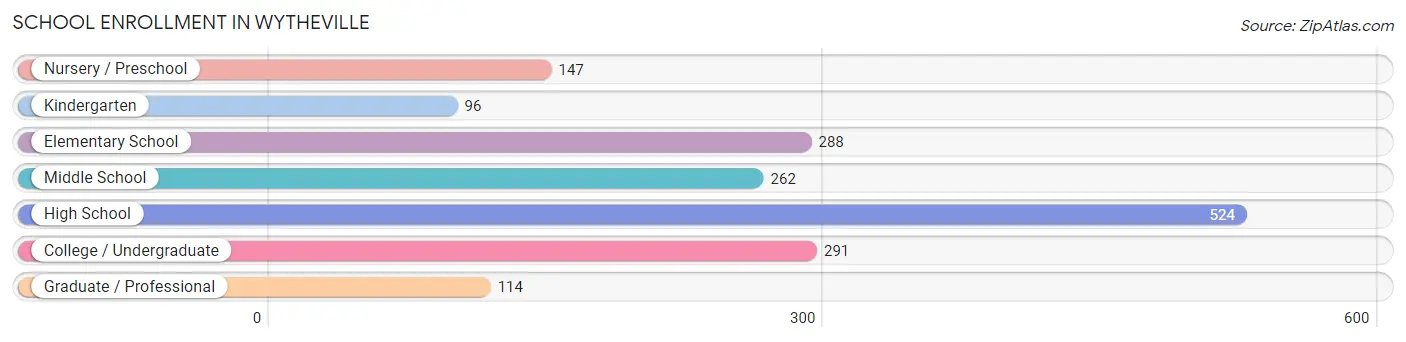
School Enrollment in Wytheville
The most common levels of schooling among the 1,722 students in Wytheville are high school (524 | 30.4%), college / undergraduate (291 | 16.9%), and elementary school (288 | 16.7%).
| School Level | # Students | % Students |
| Nursery / Preschool | 147 | 8.5% |
| Kindergarten | 96 | 5.6% |
| Elementary School | 288 | 16.7% |
| Middle School | 262 | 15.2% |
| High School | 524 | 30.4% |
| College / Undergraduate | 291 | 16.9% |
| Graduate / Professional | 114 | 6.6% |
| Total | 1,722 | 100.0% |
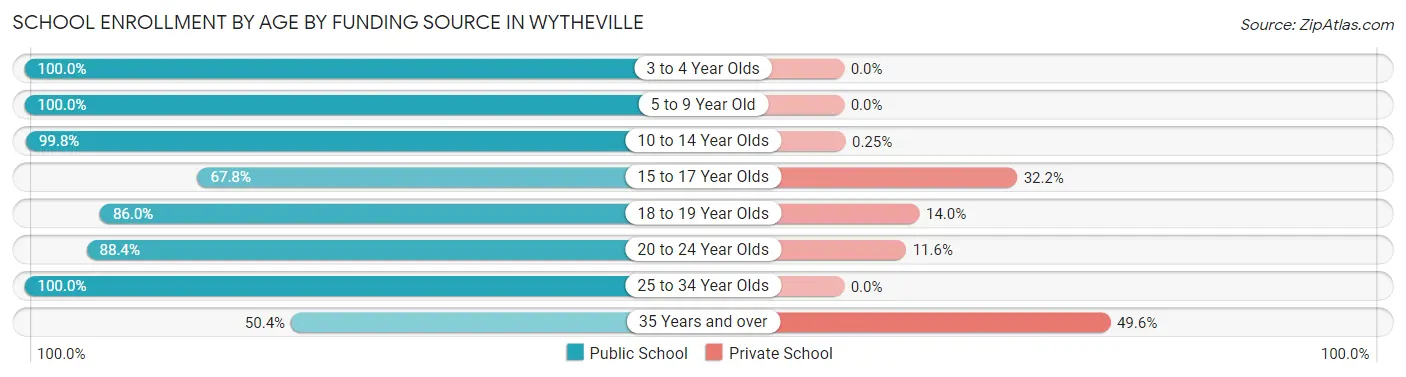
School Enrollment by Age by Funding Source in Wytheville
Out of a total of 1,722 students who are enrolled in schools in Wytheville, 208 (12.1%) attend a private institution, while the remaining 1,514 (87.9%) are enrolled in public schools. The age group of 35 years and over has the highest likelihood of being enrolled in private schools, with 62 (49.6% in the age bracket) enrolled. Conversely, the age group of 3 to 4 year olds has the lowest likelihood of being enrolled in a private school, with 43 (100.0% in the age bracket) attending a public institution.
| Age Bracket | Public School | Private School |
| 3 to 4 Year Olds | 43 (100.0%) | 0 (0.0%) |
| 5 to 9 Year Old | 487 (100.0%) | 0 (0.0%) |
| 10 to 14 Year Olds | 405 (99.8%) | 1 (0.3%) |
| 15 to 17 Year Olds | 225 (67.8%) | 107 (32.2%) |
| 18 to 19 Year Olds | 98 (86.0%) | 16 (14.0%) |
| 20 to 24 Year Olds | 176 (88.4%) | 23 (11.6%) |
| 25 to 34 Year Olds | 16 (100.0%) | 0 (0.0%) |
| 35 Years and over | 63 (50.4%) | 62 (49.6%) |
| Total | 1,514 (87.9%) | 208 (12.1%) |
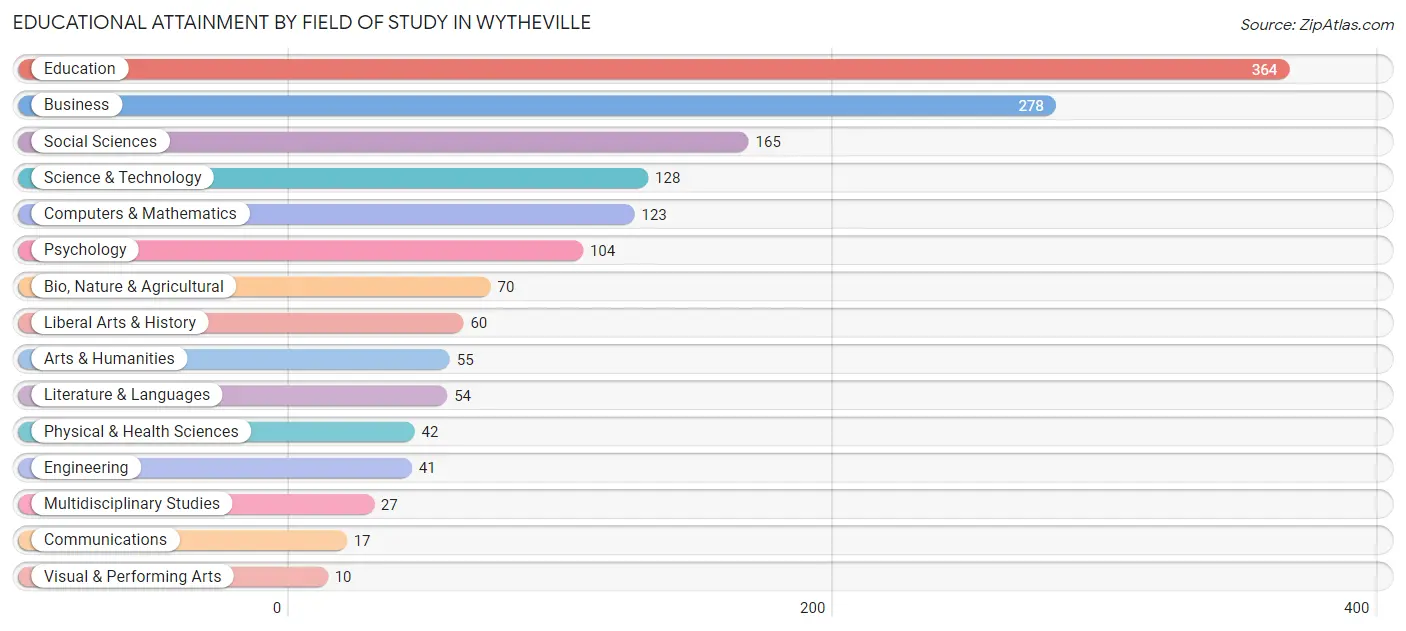
Educational Attainment by Field of Study in Wytheville
Education (364 | 23.7%), business (278 | 18.1%), social sciences (165 | 10.7%), science & technology (128 | 8.3%), and computers & mathematics (123 | 8.0%) are the most common fields of study among 1,538 individuals in Wytheville who have obtained a bachelor's degree or higher.
| Field of Study | # Graduates | % Graduates |
| Computers & Mathematics | 123 | 8.0% |
| Bio, Nature & Agricultural | 70 | 4.5% |
| Physical & Health Sciences | 42 | 2.7% |
| Psychology | 104 | 6.8% |
| Social Sciences | 165 | 10.7% |
| Engineering | 41 | 2.7% |
| Multidisciplinary Studies | 27 | 1.8% |
| Science & Technology | 128 | 8.3% |
| Business | 278 | 18.1% |
| Education | 364 | 23.7% |
| Literature & Languages | 54 | 3.5% |
| Liberal Arts & History | 60 | 3.9% |
| Visual & Performing Arts | 10 | 0.6% |
| Communications | 17 | 1.1% |
| Arts & Humanities | 55 | 3.6% |
| Total | 1,538 | 100.0% |
Transportation & Commute in Wytheville
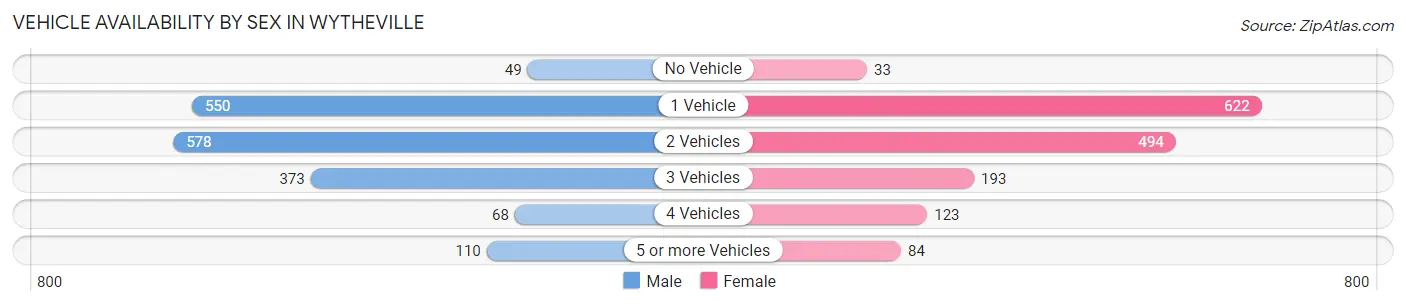
Vehicle Availability by Sex in Wytheville
The most prevalent vehicle ownership categories in Wytheville are males with 2 vehicles (578, accounting for 33.5%) and females with 2 vehicles (494, making up 37.3%).
| Vehicles Available | Male | Female |
| No Vehicle | 49 (2.8%) | 33 (2.1%) |
| 1 Vehicle | 550 (31.8%) | 622 (40.2%) |
| 2 Vehicles | 578 (33.5%) | 494 (31.9%) |
| 3 Vehicles | 373 (21.6%) | 193 (12.5%) |
| 4 Vehicles | 68 (3.9%) | 123 (7.9%) |
| 5 or more Vehicles | 110 (6.4%) | 84 (5.4%) |
| Total | 1,728 (100.0%) | 1,549 (100.0%) |
Commute Time in Wytheville
The most frequently occuring commute durations in Wytheville are 5 to 9 minutes (688 commuters, 22.8%), 10 to 14 minutes (542 commuters, 17.9%), and 15 to 19 minutes (467 commuters, 15.5%).
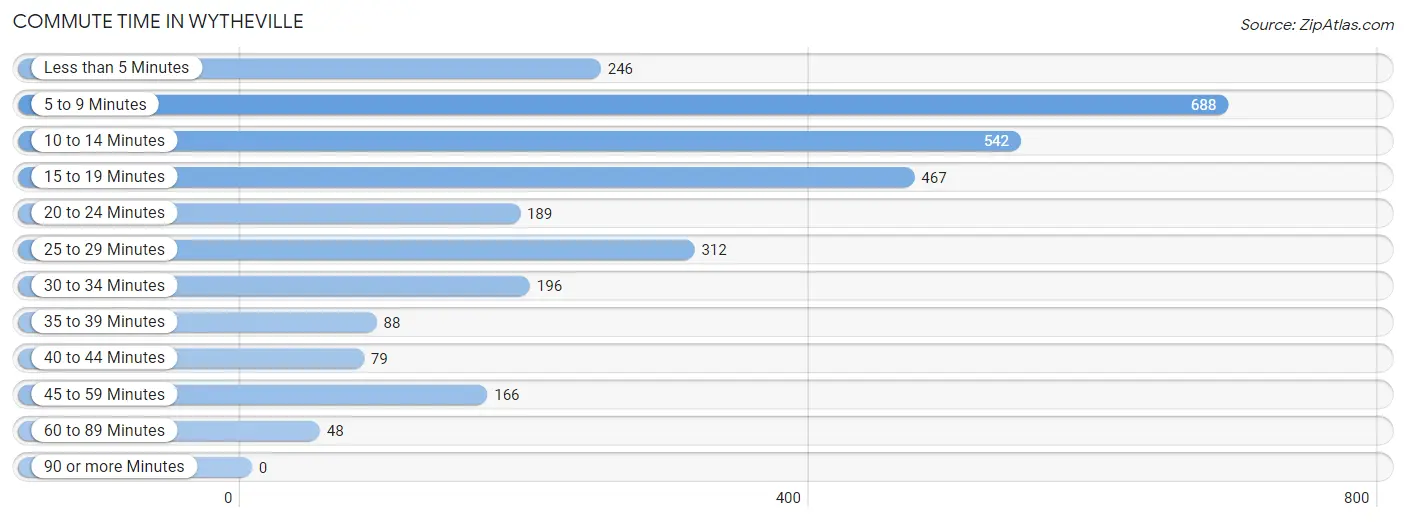
| Commute Time | # Commuters | % Commuters |
| Less than 5 Minutes | 246 | 8.1% |
| 5 to 9 Minutes | 688 | 22.8% |
| 10 to 14 Minutes | 542 | 17.9% |
| 15 to 19 Minutes | 467 | 15.5% |
| 20 to 24 Minutes | 189 | 6.3% |
| 25 to 29 Minutes | 312 | 10.3% |
| 30 to 34 Minutes | 196 | 6.5% |
| 35 to 39 Minutes | 88 | 2.9% |
| 40 to 44 Minutes | 79 | 2.6% |
| 45 to 59 Minutes | 166 | 5.5% |
| 60 to 89 Minutes | 48 | 1.6% |
| 90 or more Minutes | 0 | 0.0% |
Commute Time by Sex in Wytheville
The most common commute times in Wytheville are 10 to 14 minutes (319 commuters, 21.3%) for males and 5 to 9 minutes (468 commuters, 30.7%) for females.
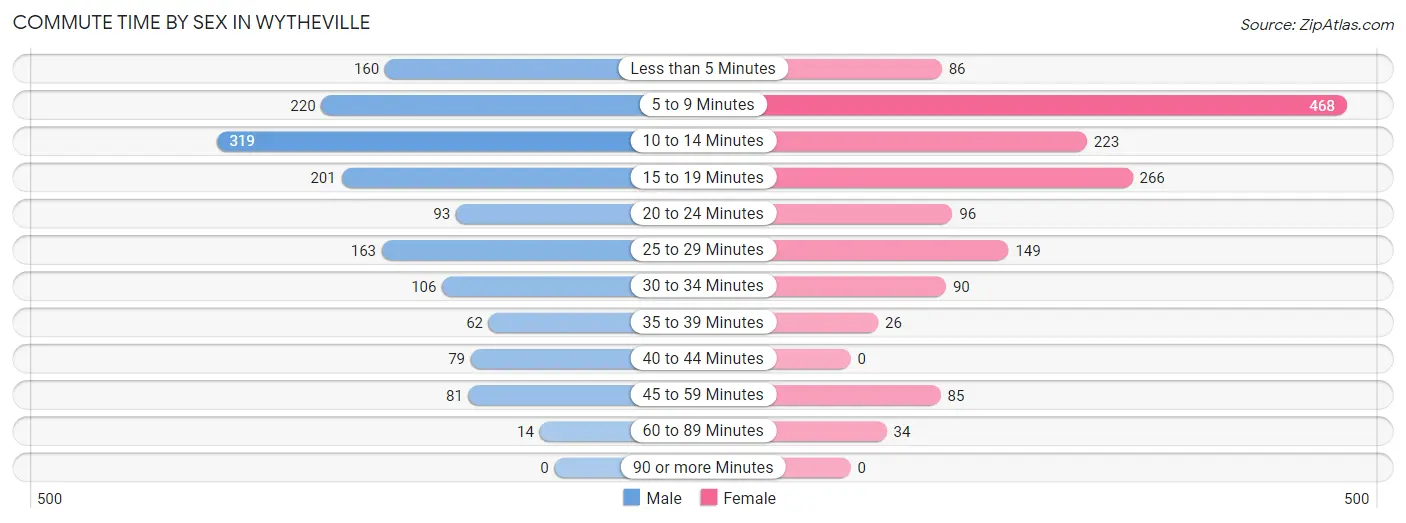
| Commute Time | Male | Female |
| Less than 5 Minutes | 160 (10.7%) | 86 (5.7%) |
| 5 to 9 Minutes | 220 (14.7%) | 468 (30.7%) |
| 10 to 14 Minutes | 319 (21.3%) | 223 (14.6%) |
| 15 to 19 Minutes | 201 (13.4%) | 266 (17.5%) |
| 20 to 24 Minutes | 93 (6.2%) | 96 (6.3%) |
| 25 to 29 Minutes | 163 (10.9%) | 149 (9.8%) |
| 30 to 34 Minutes | 106 (7.1%) | 90 (5.9%) |
| 35 to 39 Minutes | 62 (4.1%) | 26 (1.7%) |
| 40 to 44 Minutes | 79 (5.3%) | 0 (0.0%) |
| 45 to 59 Minutes | 81 (5.4%) | 85 (5.6%) |
| 60 to 89 Minutes | 14 (0.9%) | 34 (2.2%) |
| 90 or more Minutes | 0 (0.0%) | 0 (0.0%) |
Time of Departure to Work by Sex in Wytheville
The most frequent times of departure to work in Wytheville are 7:00 AM to 7:29 AM (251, 16.8%) for males and 7:30 AM to 7:59 AM (605, 39.7%) for females.
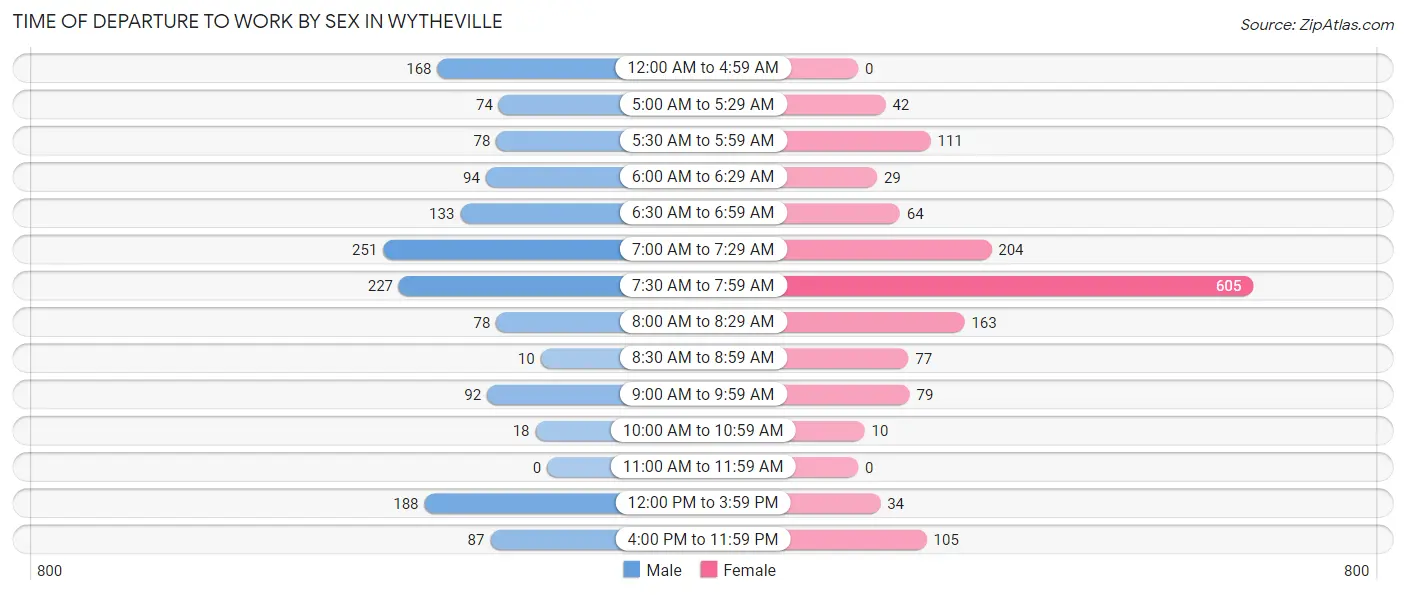
| Time of Departure | Male | Female |
| 12:00 AM to 4:59 AM | 168 (11.2%) | 0 (0.0%) |
| 5:00 AM to 5:29 AM | 74 (4.9%) | 42 (2.8%) |
| 5:30 AM to 5:59 AM | 78 (5.2%) | 111 (7.3%) |
| 6:00 AM to 6:29 AM | 94 (6.3%) | 29 (1.9%) |
| 6:30 AM to 6:59 AM | 133 (8.9%) | 64 (4.2%) |
| 7:00 AM to 7:29 AM | 251 (16.8%) | 204 (13.4%) |
| 7:30 AM to 7:59 AM | 227 (15.1%) | 605 (39.7%) |
| 8:00 AM to 8:29 AM | 78 (5.2%) | 163 (10.7%) |
| 8:30 AM to 8:59 AM | 10 (0.7%) | 77 (5.1%) |
| 9:00 AM to 9:59 AM | 92 (6.1%) | 79 (5.2%) |
| 10:00 AM to 10:59 AM | 18 (1.2%) | 10 (0.7%) |
| 11:00 AM to 11:59 AM | 0 (0.0%) | 0 (0.0%) |
| 12:00 PM to 3:59 PM | 188 (12.6%) | 34 (2.2%) |
| 4:00 PM to 11:59 PM | 87 (5.8%) | 105 (6.9%) |
| Total | 1,498 (100.0%) | 1,523 (100.0%) |
Housing Occupancy in Wytheville
Occupancy by Ownership in Wytheville
Of the total 4,117 dwellings in Wytheville, owner-occupied units account for 2,118 (51.4%), while renter-occupied units make up 1,999 (48.5%).
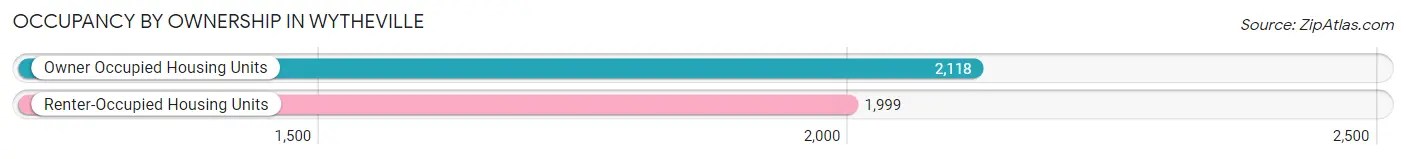
| Occupancy | # Housing Units | % Housing Units |
| Owner Occupied Housing Units | 2,118 | 51.4% |
| Renter-Occupied Housing Units | 1,999 | 48.5% |
| Total Occupied Housing Units | 4,117 | 100.0% |
Occupancy by Household Size in Wytheville
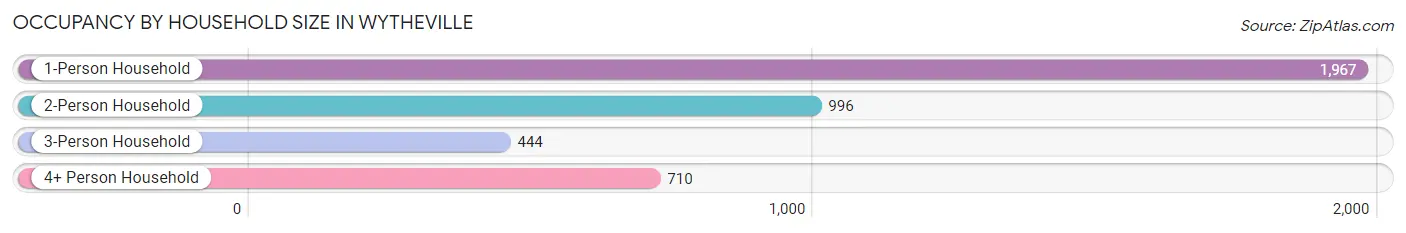
| Household Size | # Housing Units | % Housing Units |
| 1-Person Household | 1,967 | 47.8% |
| 2-Person Household | 996 | 24.2% |
| 3-Person Household | 444 | 10.8% |
| 4+ Person Household | 710 | 17.2% |
| Total Housing Units | 4,117 | 100.0% |
Occupancy by Ownership by Household Size in Wytheville
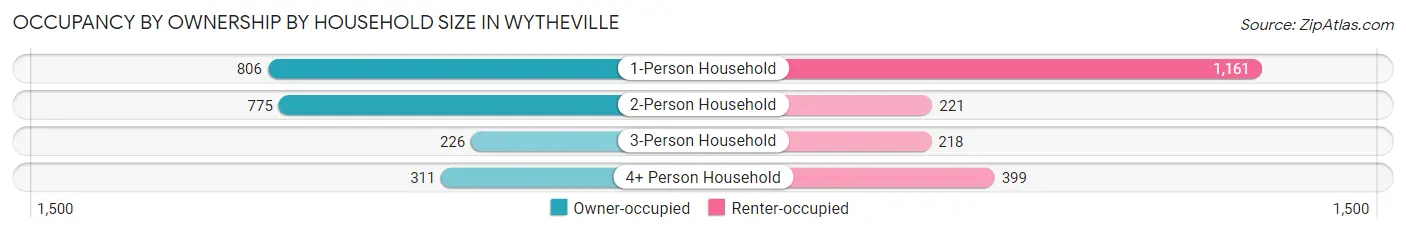
| Household Size | Owner-occupied | Renter-occupied |
| 1-Person Household | 806 (41.0%) | 1,161 (59.0%) |
| 2-Person Household | 775 (77.8%) | 221 (22.2%) |
| 3-Person Household | 226 (50.9%) | 218 (49.1%) |
| 4+ Person Household | 311 (43.8%) | 399 (56.2%) |
| Total Housing Units | 2,118 (51.4%) | 1,999 (48.5%) |
Occupancy by Educational Attainment in Wytheville
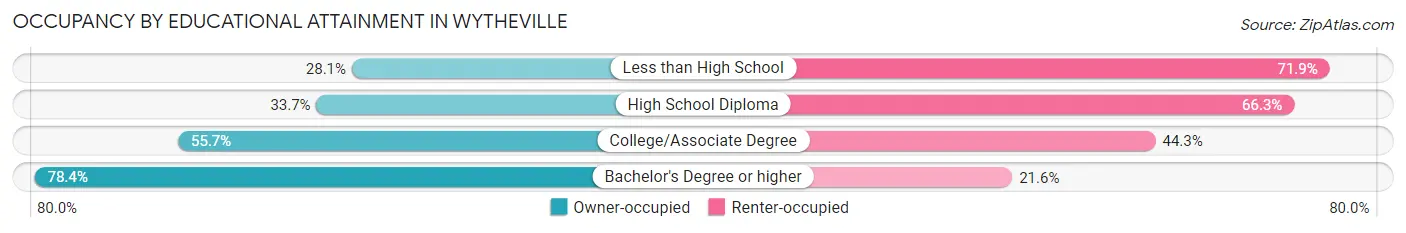
| Household Size | Owner-occupied | Renter-occupied |
| Less than High School | 125 (28.1%) | 320 (71.9%) |
| High School Diploma | 414 (33.7%) | 814 (66.3%) |
| College/Associate Degree | 827 (55.7%) | 658 (44.3%) |
| Bachelor's Degree or higher | 752 (78.4%) | 207 (21.6%) |
Occupancy by Age of Householder in Wytheville
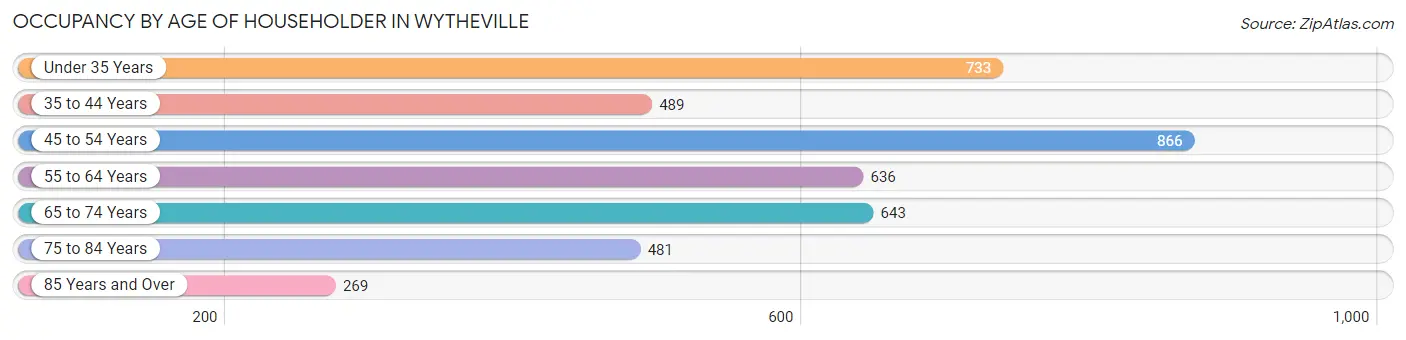
| Age Bracket | # Households | % Households |
| Under 35 Years | 733 | 17.8% |
| 35 to 44 Years | 489 | 11.9% |
| 45 to 54 Years | 866 | 21.0% |
| 55 to 64 Years | 636 | 15.4% |
| 65 to 74 Years | 643 | 15.6% |
| 75 to 84 Years | 481 | 11.7% |
| 85 Years and Over | 269 | 6.5% |
| Total | 4,117 | 100.0% |
Housing Finances in Wytheville
Median Income by Occupancy in Wytheville
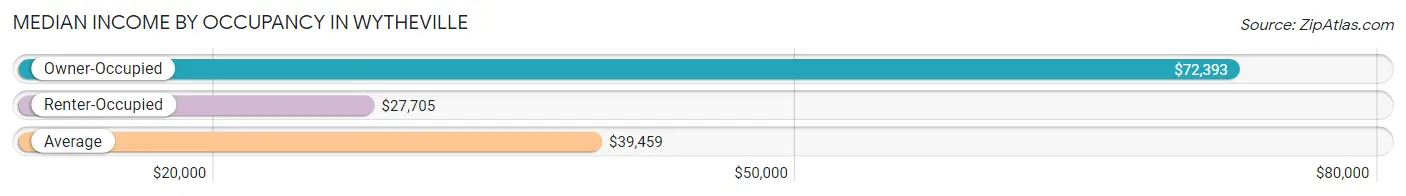
| Occupancy Type | # Households | Median Income |
| Owner-Occupied | 2,118 (51.4%) | $72,393 |
| Renter-Occupied | 1,999 (48.5%) | $27,705 |
| Average | 4,117 (100.0%) | $39,459 |
Occupancy by Householder Income Bracket in Wytheville
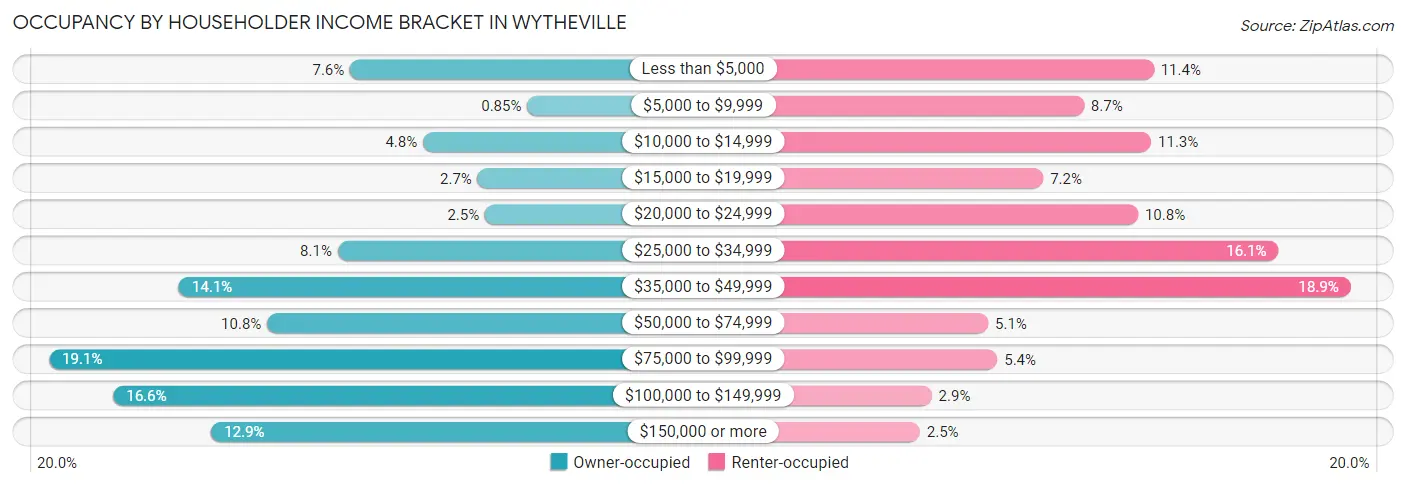
| Income Bracket | Owner-occupied | Renter-occupied |
| Less than $5,000 | 161 (7.6%) | 227 (11.4%) |
| $5,000 to $9,999 | 18 (0.9%) | 174 (8.7%) |
| $10,000 to $14,999 | 102 (4.8%) | 225 (11.3%) |
| $15,000 to $19,999 | 58 (2.7%) | 143 (7.1%) |
| $20,000 to $24,999 | 52 (2.5%) | 215 (10.8%) |
| $25,000 to $34,999 | 171 (8.1%) | 322 (16.1%) |
| $35,000 to $49,999 | 299 (14.1%) | 377 (18.9%) |
| $50,000 to $74,999 | 228 (10.8%) | 101 (5.1%) |
| $75,000 to $99,999 | 404 (19.1%) | 108 (5.4%) |
| $100,000 to $149,999 | 352 (16.6%) | 58 (2.9%) |
| $150,000 or more | 273 (12.9%) | 49 (2.5%) |
| Total | 2,118 (100.0%) | 1,999 (100.0%) |
Monthly Housing Cost Tiers in Wytheville
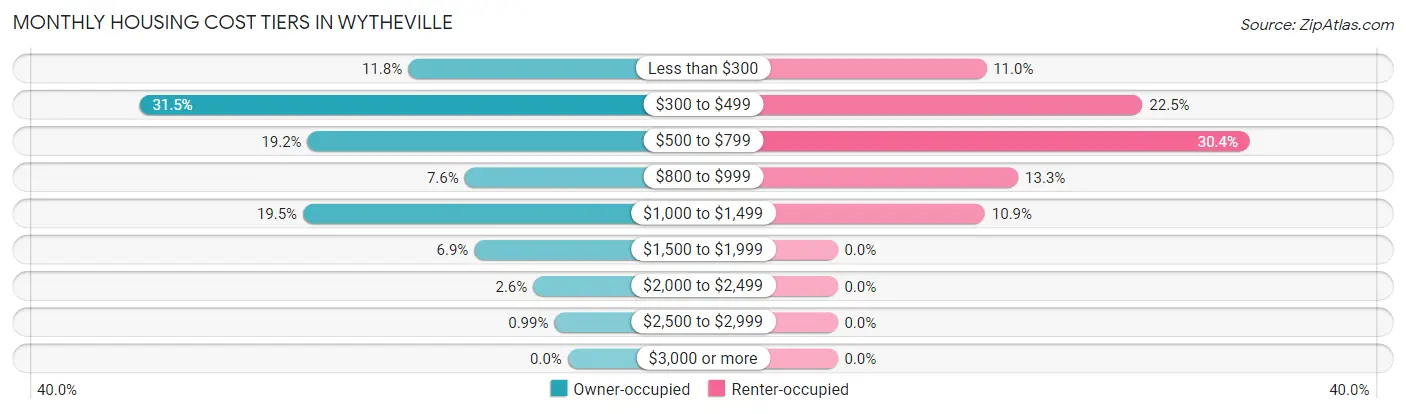
| Monthly Cost | Owner-occupied | Renter-occupied |
| Less than $300 | 249 (11.8%) | 219 (11.0%) |
| $300 to $499 | 668 (31.5%) | 449 (22.5%) |
| $500 to $799 | 406 (19.2%) | 607 (30.4%) |
| $800 to $999 | 161 (7.6%) | 266 (13.3%) |
| $1,000 to $1,499 | 413 (19.5%) | 217 (10.9%) |
| $1,500 to $1,999 | 146 (6.9%) | 0 (0.0%) |
| $2,000 to $2,499 | 54 (2.5%) | 0 (0.0%) |
| $2,500 to $2,999 | 21 (1.0%) | 0 (0.0%) |
| $3,000 or more | 0 (0.0%) | 0 (0.0%) |
| Total | 2,118 (100.0%) | 1,999 (100.0%) |
Physical Housing Characteristics in Wytheville
Housing Structures in Wytheville
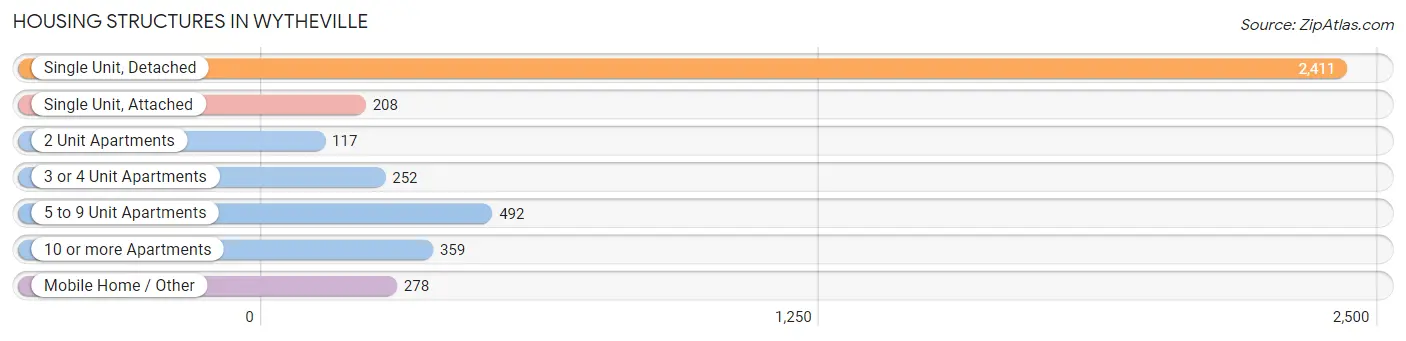
| Structure Type | # Housing Units | % Housing Units |
| Single Unit, Detached | 2,411 | 58.6% |
| Single Unit, Attached | 208 | 5.1% |
| 2 Unit Apartments | 117 | 2.8% |
| 3 or 4 Unit Apartments | 252 | 6.1% |
| 5 to 9 Unit Apartments | 492 | 11.9% |
| 10 or more Apartments | 359 | 8.7% |
| Mobile Home / Other | 278 | 6.8% |
| Total | 4,117 | 100.0% |
Housing Structures by Occupancy in Wytheville
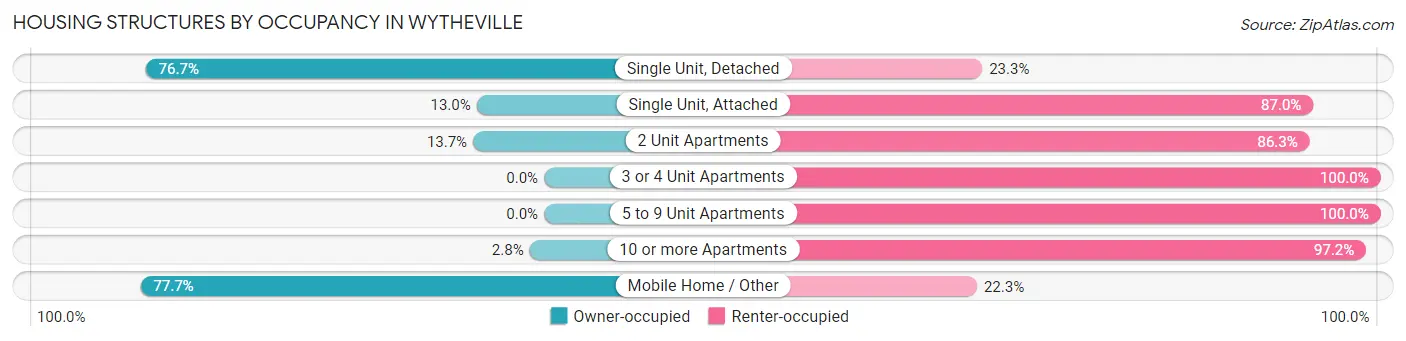
| Structure Type | Owner-occupied | Renter-occupied |
| Single Unit, Detached | 1,849 (76.7%) | 562 (23.3%) |
| Single Unit, Attached | 27 (13.0%) | 181 (87.0%) |
| 2 Unit Apartments | 16 (13.7%) | 101 (86.3%) |
| 3 or 4 Unit Apartments | 0 (0.0%) | 252 (100.0%) |
| 5 to 9 Unit Apartments | 0 (0.0%) | 492 (100.0%) |
| 10 or more Apartments | 10 (2.8%) | 349 (97.2%) |
| Mobile Home / Other | 216 (77.7%) | 62 (22.3%) |
| Total | 2,118 (51.4%) | 1,999 (48.5%) |
Housing Structures by Number of Rooms in Wytheville
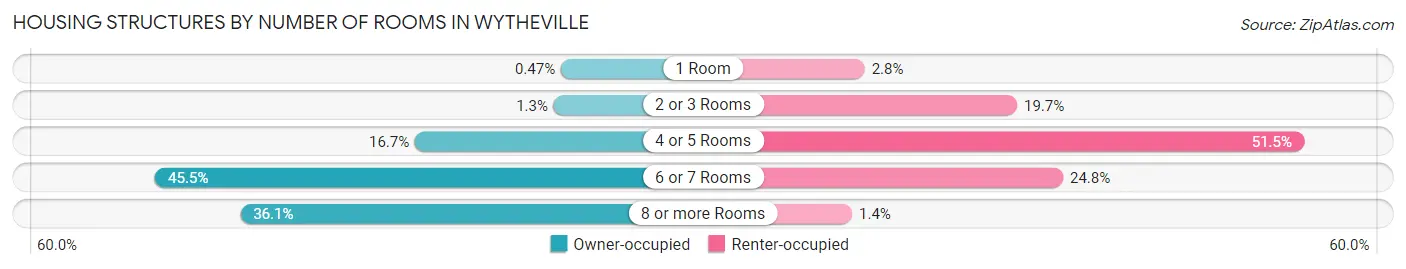
| Number of Rooms | Owner-occupied | Renter-occupied |
| 1 Room | 10 (0.5%) | 55 (2.8%) |
| 2 or 3 Rooms | 27 (1.3%) | 393 (19.7%) |
| 4 or 5 Rooms | 353 (16.7%) | 1,029 (51.5%) |
| 6 or 7 Rooms | 964 (45.5%) | 495 (24.8%) |
| 8 or more Rooms | 764 (36.1%) | 27 (1.3%) |
| Total | 2,118 (100.0%) | 1,999 (100.0%) |
Housing Structure by Heating Type in Wytheville
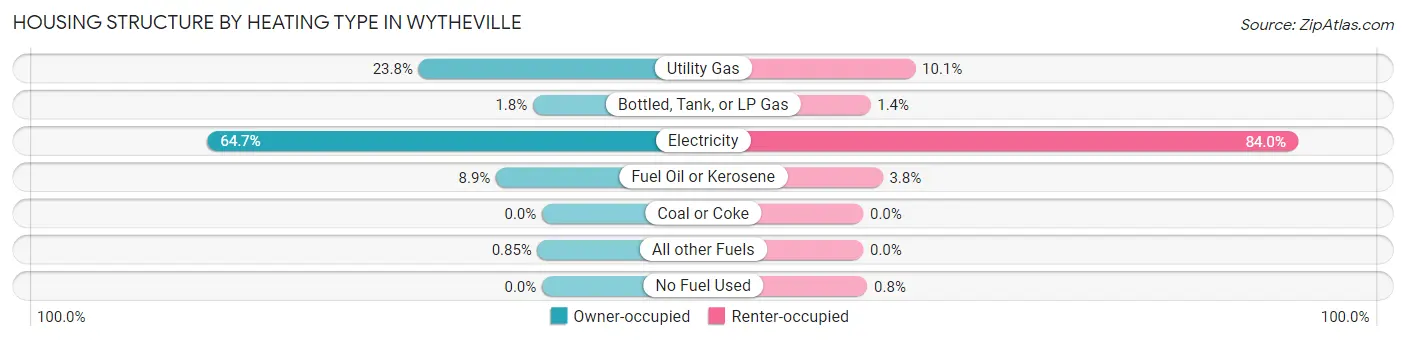
| Heating Type | Owner-occupied | Renter-occupied |
| Utility Gas | 505 (23.8%) | 201 (10.1%) |
| Bottled, Tank, or LP Gas | 37 (1.8%) | 28 (1.4%) |
| Electricity | 1,370 (64.7%) | 1,679 (84.0%) |
| Fuel Oil or Kerosene | 188 (8.9%) | 75 (3.7%) |
| Coal or Coke | 0 (0.0%) | 0 (0.0%) |
| All other Fuels | 18 (0.9%) | 0 (0.0%) |
| No Fuel Used | 0 (0.0%) | 16 (0.8%) |
| Total | 2,118 (100.0%) | 1,999 (100.0%) |
Household Vehicle Usage in Wytheville
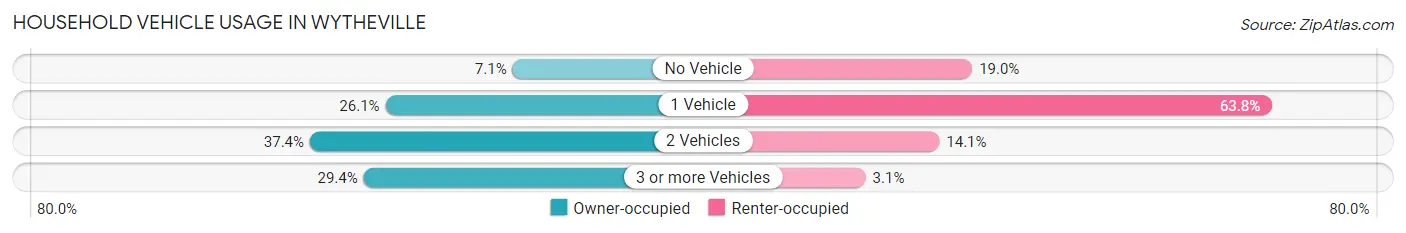
| Vehicles per Household | Owner-occupied | Renter-occupied |
| No Vehicle | 151 (7.1%) | 380 (19.0%) |
| 1 Vehicle | 553 (26.1%) | 1,275 (63.8%) |
| 2 Vehicles | 792 (37.4%) | 282 (14.1%) |
| 3 or more Vehicles | 622 (29.4%) | 62 (3.1%) |
| Total | 2,118 (100.0%) | 1,999 (100.0%) |
Real Estate & Mortgages in Wytheville
Real Estate and Mortgage Overview in Wytheville
| Characteristic | Without Mortgage | With Mortgage |
| Housing Units | 1,173 | 945 |
| Median Property Value | $196,900 | $172,600 |
| Median Household Income | $48,375 | $170 |
| Monthly Housing Costs | $392 | $0 |
| Real Estate Taxes | $991 | $0 |
Property Value by Mortgage Status in Wytheville
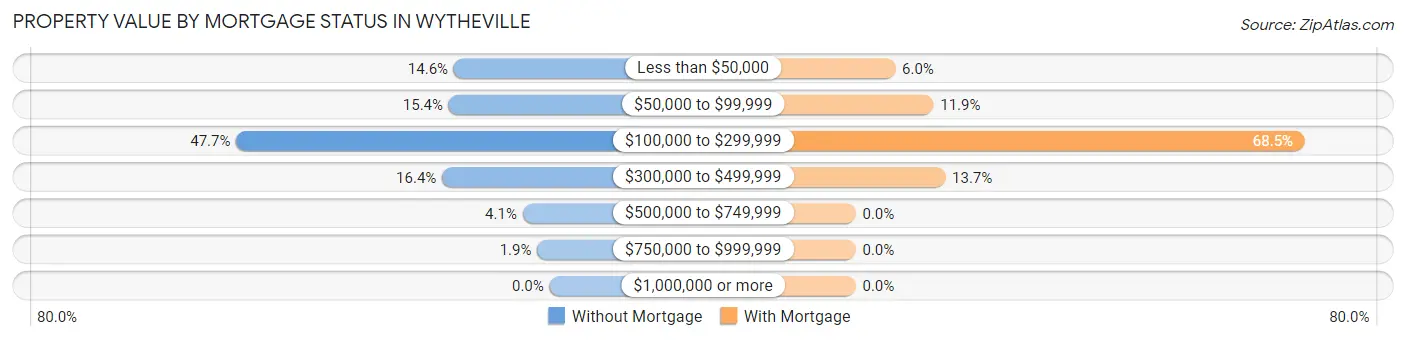
| Property Value | Without Mortgage | With Mortgage |
| Less than $50,000 | 171 (14.6%) | 57 (6.0%) |
| $50,000 to $99,999 | 180 (15.3%) | 112 (11.8%) |
| $100,000 to $299,999 | 560 (47.7%) | 647 (68.5%) |
| $300,000 to $499,999 | 192 (16.4%) | 129 (13.7%) |
| $500,000 to $749,999 | 48 (4.1%) | 0 (0.0%) |
| $750,000 to $999,999 | 22 (1.9%) | 0 (0.0%) |
| $1,000,000 or more | 0 (0.0%) | 0 (0.0%) |
| Total | 1,173 (100.0%) | 945 (100.0%) |
Household Income by Mortgage Status in Wytheville
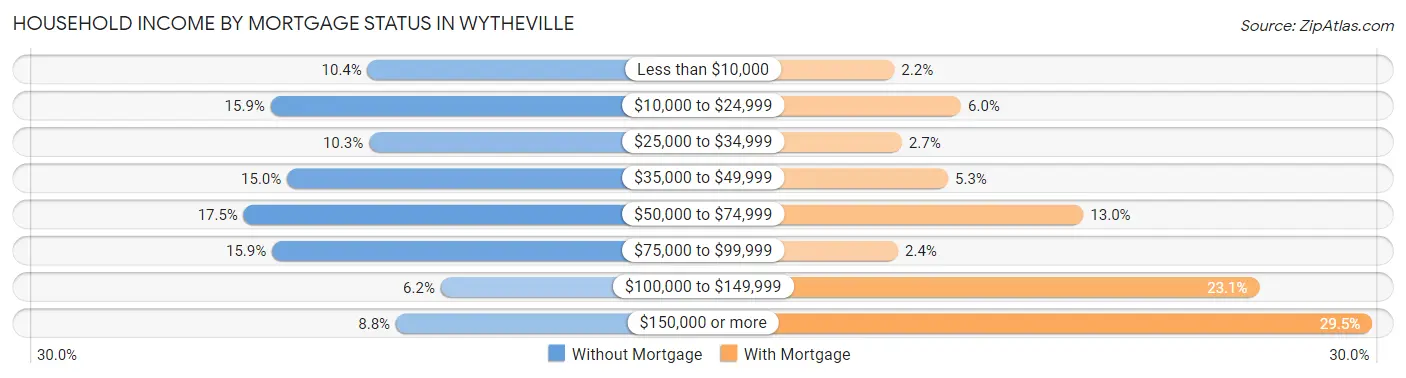
| Household Income | Without Mortgage | With Mortgage |
| Less than $10,000 | 122 (10.4%) | 21 (2.2%) |
| $10,000 to $24,999 | 187 (15.9%) | 57 (6.0%) |
| $25,000 to $34,999 | 121 (10.3%) | 25 (2.6%) |
| $35,000 to $49,999 | 176 (15.0%) | 50 (5.3%) |
| $50,000 to $74,999 | 205 (17.5%) | 123 (13.0%) |
| $75,000 to $99,999 | 186 (15.9%) | 23 (2.4%) |
| $100,000 to $149,999 | 73 (6.2%) | 218 (23.1%) |
| $150,000 or more | 103 (8.8%) | 279 (29.5%) |
| Total | 1,173 (100.0%) | 945 (100.0%) |
Property Value to Household Income Ratio in Wytheville
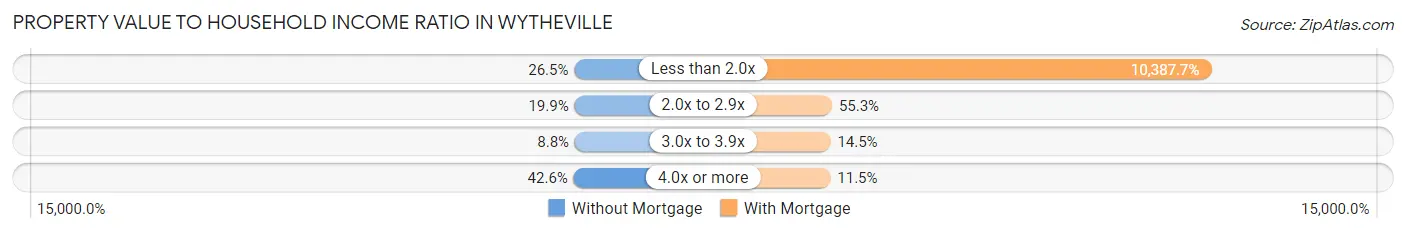
| Value-to-Income Ratio | Without Mortgage | With Mortgage |
| Less than 2.0x | 311 (26.5%) | 98,164 (10,387.7%) |
| 2.0x to 2.9x | 233 (19.9%) | 523 (55.3%) |
| 3.0x to 3.9x | 103 (8.8%) | 137 (14.5%) |
| 4.0x or more | 500 (42.6%) | 109 (11.5%) |
| Total | 1,173 (100.0%) | 945 (100.0%) |
Real Estate Taxes by Mortgage Status in Wytheville
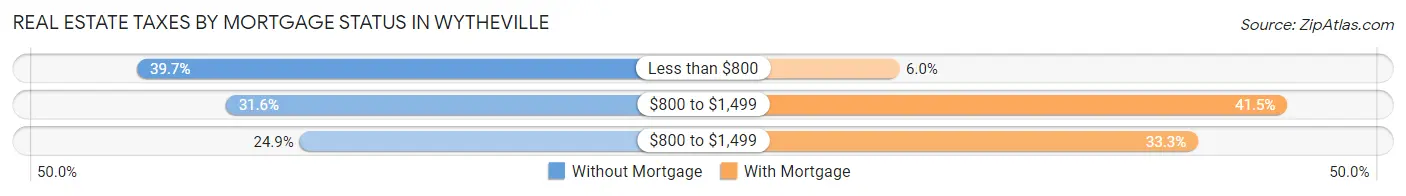
| Property Taxes | Without Mortgage | With Mortgage |
| Less than $800 | 466 (39.7%) | 57 (6.0%) |
| $800 to $1,499 | 371 (31.6%) | 392 (41.5%) |
| $800 to $1,499 | 292 (24.9%) | 315 (33.3%) |
| Total | 1,173 (100.0%) | 945 (100.0%) |
Health & Disability in Wytheville
Health Insurance Coverage by Age in Wytheville
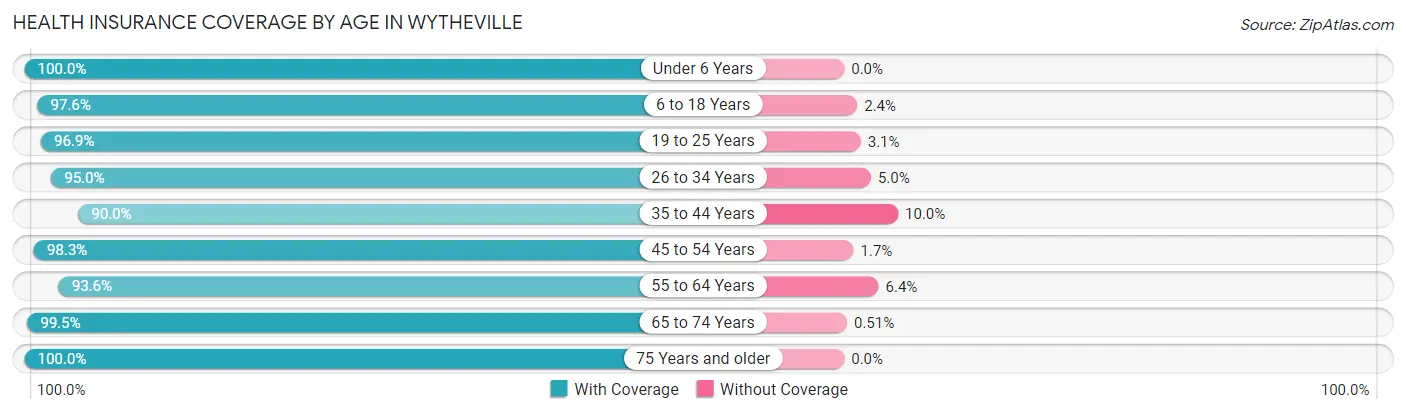
| Age Bracket | With Coverage | Without Coverage |
| Under 6 Years | 570 (100.0%) | 0 (0.0%) |
| 6 to 18 Years | 1,009 (97.6%) | 25 (2.4%) |
| 19 to 25 Years | 660 (96.9%) | 21 (3.1%) |
| 26 to 34 Years | 706 (95.0%) | 37 (5.0%) |
| 35 to 44 Years | 915 (90.0%) | 102 (10.0%) |
| 45 to 54 Years | 1,132 (98.3%) | 20 (1.7%) |
| 55 to 64 Years | 835 (93.6%) | 57 (6.4%) |
| 65 to 74 Years | 972 (99.5%) | 5 (0.5%) |
| 75 Years and older | 990 (100.0%) | 0 (0.0%) |
| Total | 7,789 (96.7%) | 267 (3.3%) |
Health Insurance Coverage by Citizenship Status in Wytheville
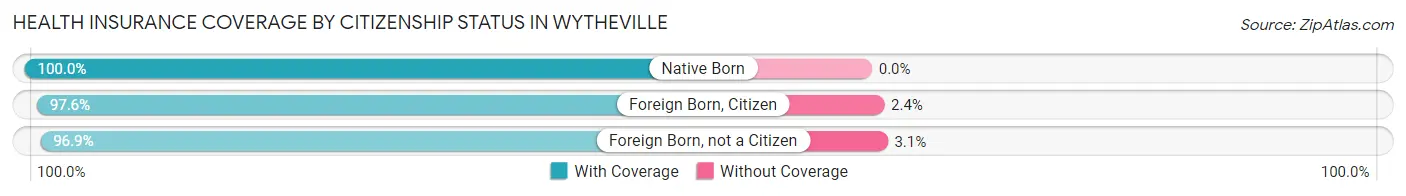
| Citizenship Status | With Coverage | Without Coverage |
| Native Born | 570 (100.0%) | 0 (0.0%) |
| Foreign Born, Citizen | 1,009 (97.6%) | 25 (2.4%) |
| Foreign Born, not a Citizen | 660 (96.9%) | 21 (3.1%) |
Health Insurance Coverage by Household Income in Wytheville
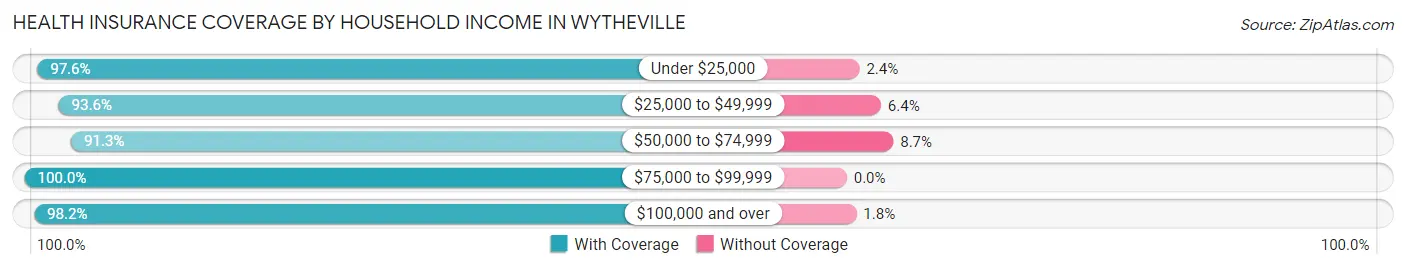
| Household Income | With Coverage | Without Coverage |
| Under $25,000 | 2,176 (97.6%) | 53 (2.4%) |
| $25,000 to $49,999 | 1,642 (93.6%) | 112 (6.4%) |
| $50,000 to $74,999 | 639 (91.3%) | 61 (8.7%) |
| $75,000 to $99,999 | 1,504 (100.0%) | 0 (0.0%) |
| $100,000 and over | 1,802 (98.2%) | 33 (1.8%) |
Public vs Private Health Insurance Coverage by Age in Wytheville
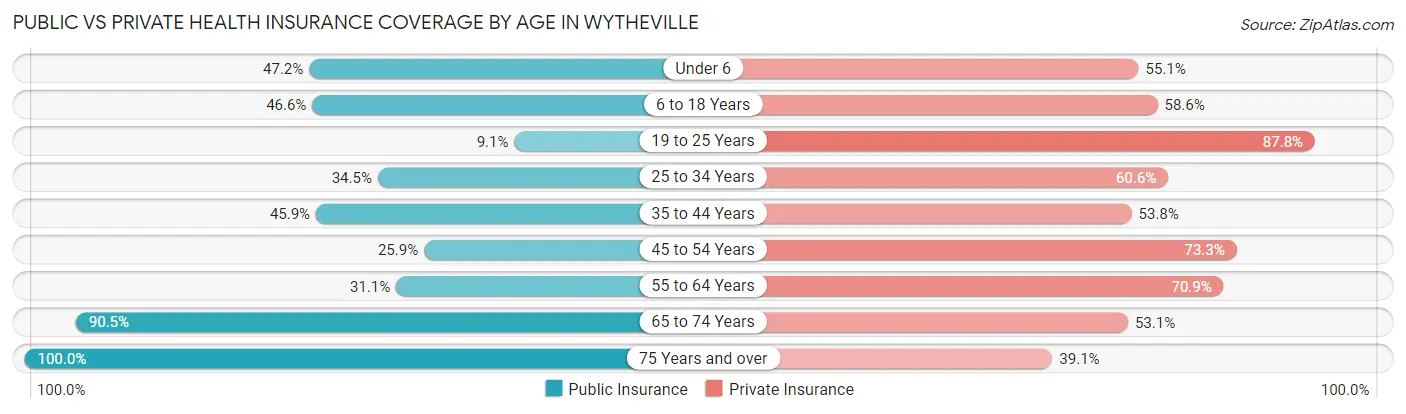
| Age Bracket | Public Insurance | Private Insurance |
| Under 6 | 269 (47.2%) | 314 (55.1%) |
| 6 to 18 Years | 482 (46.6%) | 606 (58.6%) |
| 19 to 25 Years | 62 (9.1%) | 598 (87.8%) |
| 25 to 34 Years | 256 (34.4%) | 450 (60.6%) |
| 35 to 44 Years | 467 (45.9%) | 547 (53.8%) |
| 45 to 54 Years | 298 (25.9%) | 844 (73.3%) |
| 55 to 64 Years | 277 (31.0%) | 632 (70.9%) |
| 65 to 74 Years | 884 (90.5%) | 519 (53.1%) |
| 75 Years and over | 990 (100.0%) | 387 (39.1%) |
| Total | 3,985 (49.5%) | 4,897 (60.8%) |
Disability Status by Sex by Age in Wytheville
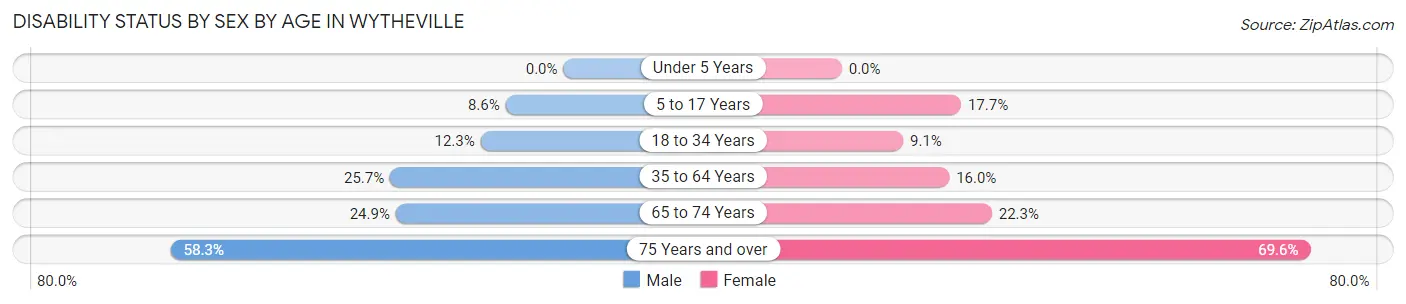
| Age Bracket | Male | Female |
| Under 5 Years | 0 (0.0%) | 0 (0.0%) |
| 5 to 17 Years | 62 (8.6%) | 86 (17.7%) |
| 18 to 34 Years | 85 (12.3%) | 69 (9.1%) |
| 35 to 64 Years | 423 (25.7%) | 226 (16.0%) |
| 65 to 74 Years | 118 (24.9%) | 112 (22.3%) |
| 75 Years and over | 221 (58.3%) | 425 (69.6%) |
Disability Class by Sex by Age in Wytheville
Disability Class: Hearing Difficulty
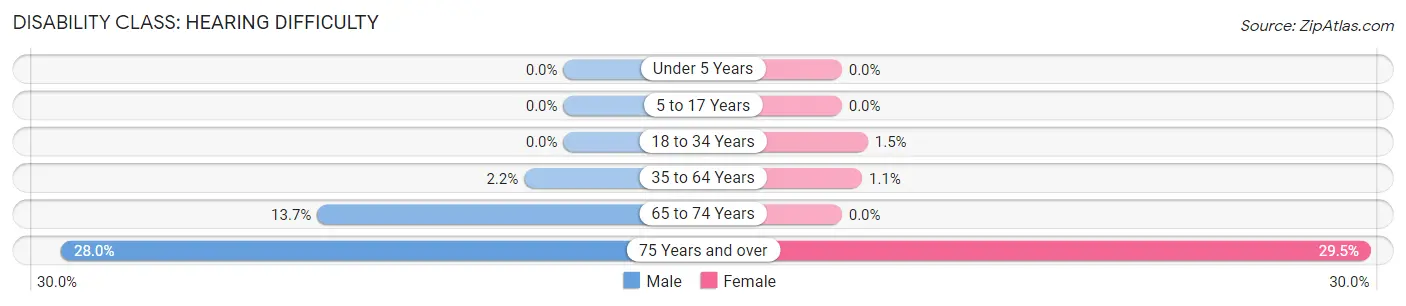
| Age Bracket | Male | Female |
| Under 5 Years | 0 (0.0%) | 0 (0.0%) |
| 5 to 17 Years | 0 (0.0%) | 0 (0.0%) |
| 18 to 34 Years | 0 (0.0%) | 11 (1.5%) |
| 35 to 64 Years | 36 (2.2%) | 16 (1.1%) |
| 65 to 74 Years | 65 (13.7%) | 0 (0.0%) |
| 75 Years and over | 106 (28.0%) | 180 (29.5%) |
Disability Class: Vision Difficulty
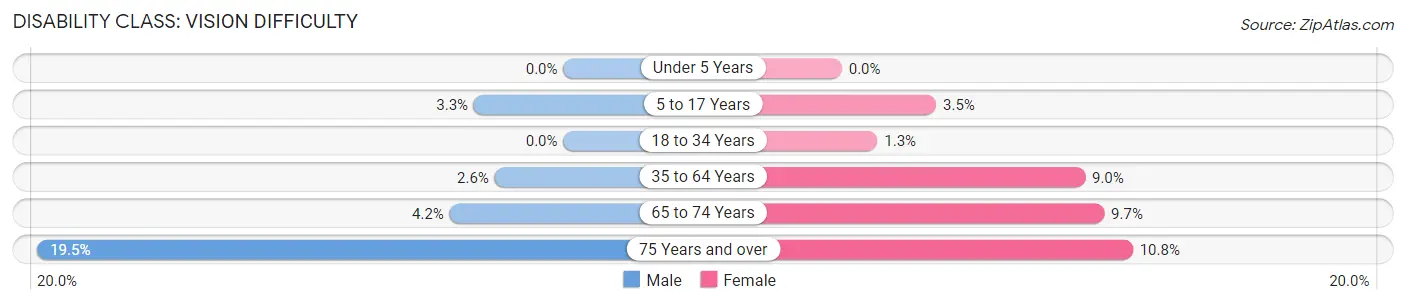
| Age Bracket | Male | Female |
| Under 5 Years | 0 (0.0%) | 0 (0.0%) |
| 5 to 17 Years | 24 (3.3%) | 17 (3.5%) |
| 18 to 34 Years | 0 (0.0%) | 10 (1.3%) |
| 35 to 64 Years | 42 (2.5%) | 128 (9.0%) |
| 65 to 74 Years | 20 (4.2%) | 49 (9.7%) |
| 75 Years and over | 74 (19.5%) | 66 (10.8%) |
Disability Class: Cognitive Difficulty
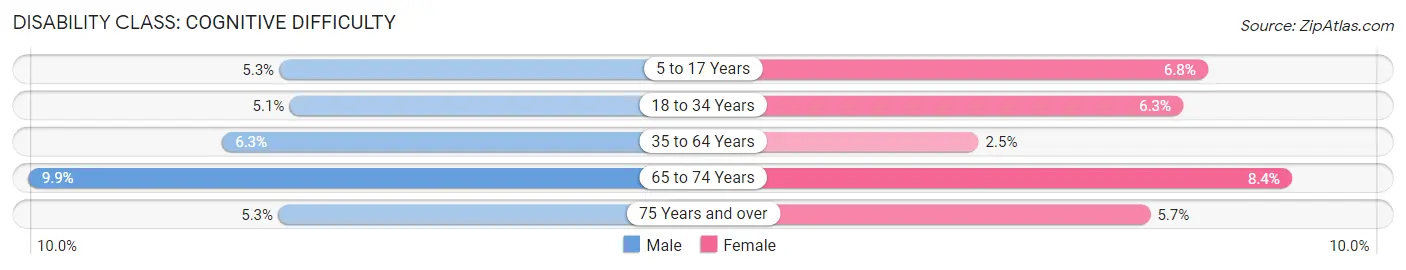
| Age Bracket | Male | Female |
| 5 to 17 Years | 38 (5.3%) | 33 (6.8%) |
| 18 to 34 Years | 35 (5.1%) | 48 (6.3%) |
| 35 to 64 Years | 104 (6.3%) | 36 (2.5%) |
| 65 to 74 Years | 47 (9.9%) | 42 (8.4%) |
| 75 Years and over | 20 (5.3%) | 35 (5.7%) |
Disability Class: Ambulatory Difficulty
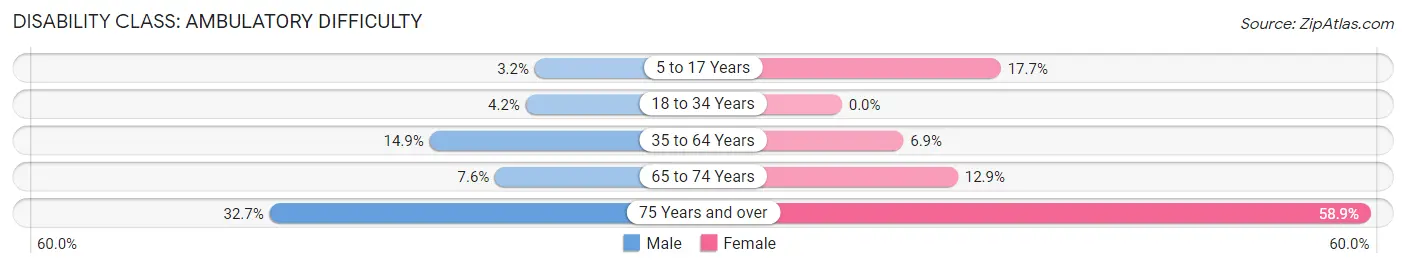
| Age Bracket | Male | Female |
| 5 to 17 Years | 23 (3.2%) | 86 (17.7%) |
| 18 to 34 Years | 29 (4.2%) | 0 (0.0%) |
| 35 to 64 Years | 245 (14.9%) | 97 (6.9%) |
| 65 to 74 Years | 36 (7.6%) | 65 (12.9%) |
| 75 Years and over | 124 (32.7%) | 360 (58.9%) |
Disability Class: Self-Care Difficulty
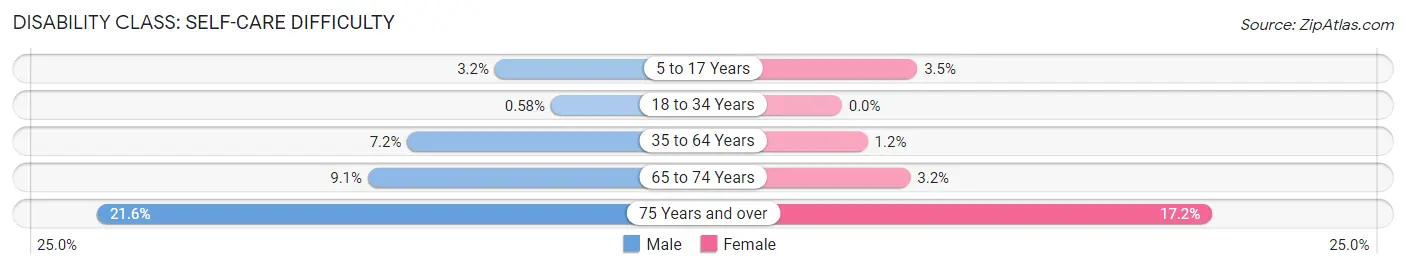
| Age Bracket | Male | Female |
| 5 to 17 Years | 23 (3.2%) | 17 (3.5%) |
| 18 to 34 Years | 4 (0.6%) | 0 (0.0%) |
| 35 to 64 Years | 119 (7.2%) | 17 (1.2%) |
| 65 to 74 Years | 43 (9.1%) | 16 (3.2%) |
| 75 Years and over | 82 (21.6%) | 105 (17.2%) |
Technology Access in Wytheville
Computing Device Access in Wytheville
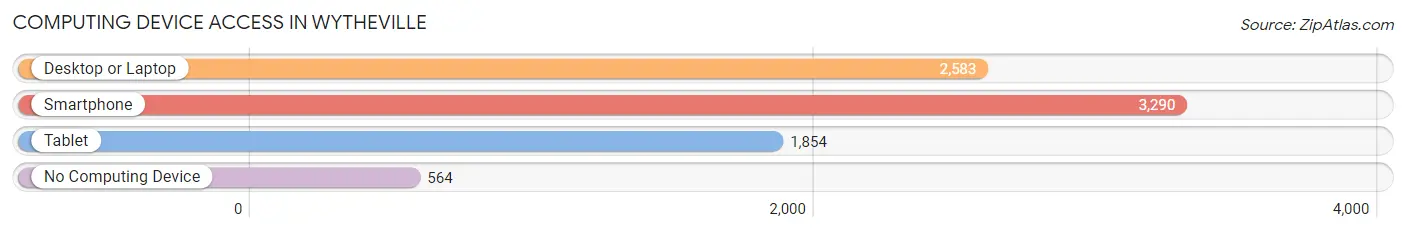
| Device Type | # Households | % Households |
| Desktop or Laptop | 2,583 | 62.7% |
| Smartphone | 3,290 | 79.9% |
| Tablet | 1,854 | 45.0% |
| No Computing Device | 564 | 13.7% |
| Total | 4,117 | 100.0% |
Internet Access in Wytheville
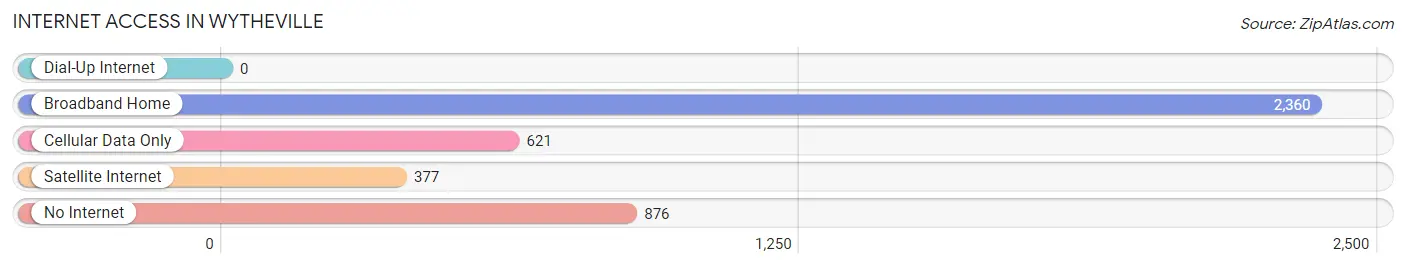
| Internet Type | # Households | % Households |
| Dial-Up Internet | 0 | 0.0% |
| Broadband Home | 2,360 | 57.3% |
| Cellular Data Only | 621 | 15.1% |
| Satellite Internet | 377 | 9.2% |
| No Internet | 876 | 21.3% |
| Total | 4,117 | 100.0% |
Wytheville Summary
Wytheville is a town located in Wythe County, Virginia, United States. It is the county seat of Wythe County and is located in the southwestern part of the state. The population of Wytheville was 8,211 at the 2010 census.
History
Wytheville was founded in 1790 by George Wythe, a signer of the Declaration of Independence. The town was named after him and was the first town in the county. Wytheville was incorporated in 1839 and has since grown to become the largest town in the county.
The town was an important stop on the Great Road, which connected the Shenandoah Valley to the Tidewater region of Virginia. During the Civil War, Wytheville was a strategic location for both Union and Confederate forces. The town was the site of several skirmishes and battles, including the Battle of Wytheville in 1863.
Geography
Wytheville is located in southwestern Virginia at the intersection of Interstate 77 and Interstate 81. The town is situated in the Appalachian Mountains and is surrounded by the Blue Ridge Mountains to the east and the Allegheny Mountains to the west. The town is located at an elevation of 1,890 feet (576 m).
The town is located in the Appalachian Plateau, which is characterized by rolling hills and valleys. The climate in Wytheville is humid subtropical, with hot, humid summers and mild winters.
Economy
Wytheville’s economy is largely based on tourism and manufacturing. The town is home to several large manufacturing companies, including General Electric, which produces lighting and electrical products. Other major employers in the area include Wytheville Community College, Wythe County Public Schools, and the Wytheville Medical Center.
The town is also a popular tourist destination, with attractions such as the Wytheville Historic District, the Wytheville Motor Speedway, and the Wytheville Arts and Crafts Center. The town is also home to several wineries and breweries, as well as a variety of restaurants and shops.
Demographics
As of the 2010 census, Wytheville had a population of 8,211. The racial makeup of the town was 87.3% White, 8.2% African American, 0.4% Native American, 0.7% Asian, 0.1% Pacific Islander, 1.2% from other races, and 2.1% from two or more races. Hispanic or Latino of any race were 3.2% of the population.
The median income for a household in Wytheville was $35,945, and the median income for a family was $45,945. The per capita income for the town was $20,845. About 14.2% of families and 17.7% of the population were below the poverty line, including 25.2% of those under age 18 and 11.2% of those age 65 or over.
Wytheville is a small town with a rich history and a vibrant economy. The town is home to a variety of attractions and businesses, and is a popular tourist destination. The town is also home to a diverse population, with a variety of racial and ethnic backgrounds.
Common Questions
What is Per Capita Income in Wytheville?
Per Capita income in Wytheville is $33,813.
What is the Median Family Income in Wytheville?
Median Family Income in Wytheville is $75,964.
What is the Median Household income in Wytheville?
Median Household Income in Wytheville is $39,459.
What is Income or Wage Gap in Wytheville?
Income or Wage Gap in Wytheville is 33.9%.
Women in Wytheville earn 66.1 cents for every dollar earned by a man.
What is Family Income Deficit in Wytheville?
Family Income Deficit in Wytheville is $14,736.
Families that are below poverty line in Wytheville earn $14,736 less on average than the poverty threshold level.
What is Inequality or Gini Index in Wytheville?
Inequality or Gini Index in Wytheville is 0.56.
What is the Total Population of Wytheville?
Total Population of Wytheville is 8,228.
What is the Total Male Population of Wytheville?
Total Male Population of Wytheville is 4,237.
What is the Total Female Population of Wytheville?
Total Female Population of Wytheville is 3,991.
What is the Ratio of Males per 100 Females in Wytheville?
There are 106.16 Males per 100 Females in Wytheville.
What is the Ratio of Females per 100 Males in Wytheville?
There are 94.19 Females per 100 Males in Wytheville.
What is the Median Population Age in Wytheville?
Median Population Age in Wytheville is 45.2 Years.
What is the Average Family Size in Wytheville
Average Family Size in Wytheville is 2.9 People.
What is the Average Household Size in Wytheville
Average Household Size in Wytheville is 1.9 People.
How Large is the Labor Force in Wytheville?
There are 3,550 People in the Labor Forcein in Wytheville.
What is the Percentage of People in the Labor Force in Wytheville?
51.7% of People are in the Labor Force in Wytheville.
What is the Unemployment Rate in Wytheville?
Unemployment Rate in Wytheville is 5.4%.