Mechanicsville, VA Map & Demographics
Mechanicsville Map
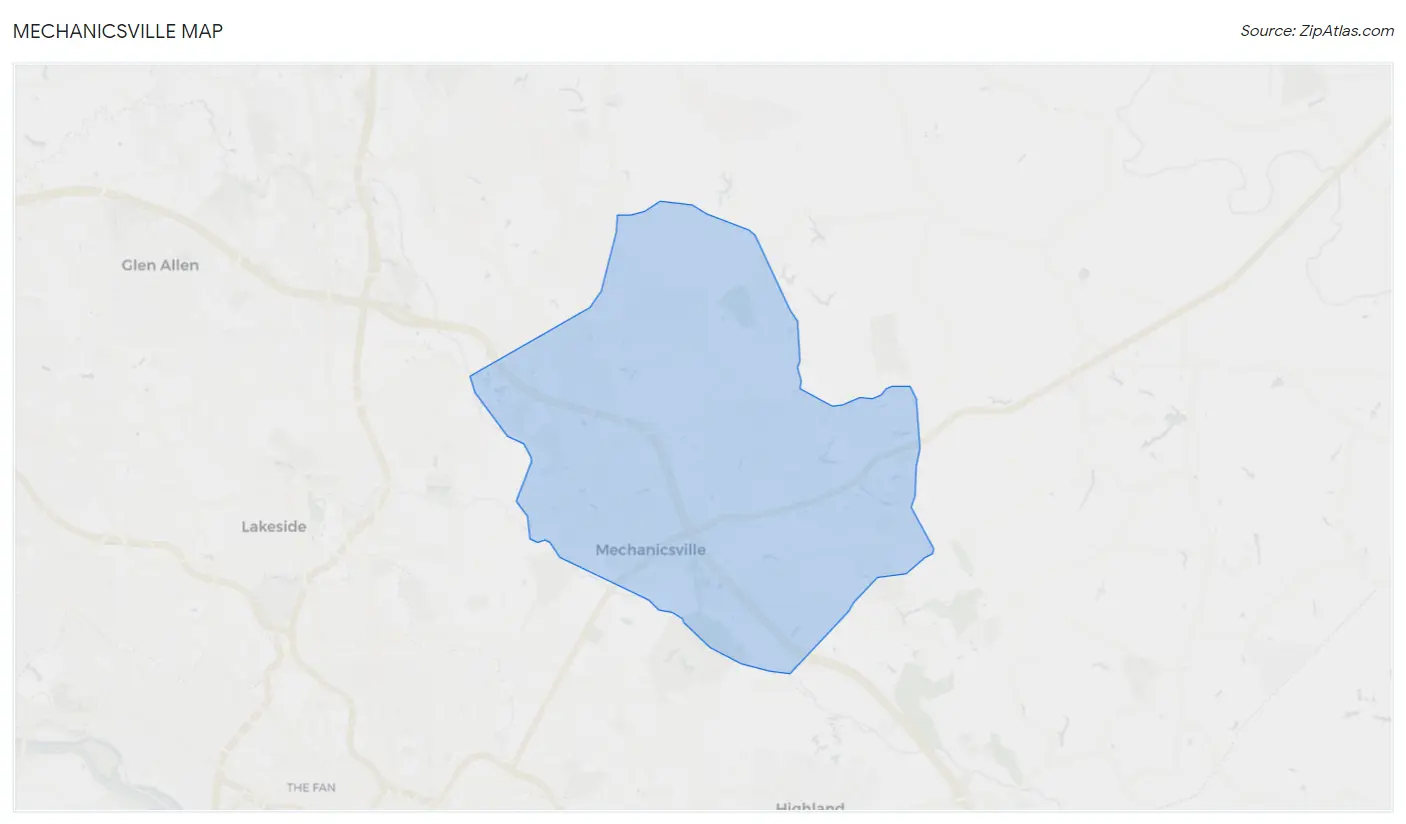
Mechanicsville Overview
$41,706
PER CAPITA INCOME
$112,143
AVG FAMILY INCOME
$91,393
AVG HOUSEHOLD INCOME
18.1%
WAGE / INCOME GAP [ % ]
81.9¢/ $1
WAGE / INCOME GAP [ $ ]
$8,868
FAMILY INCOME DEFICIT
0.38
INEQUALITY / GINI INDEX
38,328
TOTAL POPULATION
18,474
MALE POPULATION
19,854
FEMALE POPULATION
93.05
MALES / 100 FEMALES
107.47
FEMALES / 100 MALES
41.7
MEDIAN AGE
3.1
AVG FAMILY SIZE
2.5
AVG HOUSEHOLD SIZE
20,729
LABOR FORCE [ PEOPLE ]
67.2%
PERCENT IN LABOR FORCE
2.0%
UNEMPLOYMENT RATE
Mechanicsville Area Codes
Income in Mechanicsville
Income Overview in Mechanicsville
Per Capita Income in Mechanicsville is $41,706, while median incomes of families and households are $112,143 and $91,393 respectively.
| Characteristic | Number | Measure |
| Per Capita Income | 38,328 | $41,706 |
| Median Family Income | 10,034 | $112,143 |
| Mean Family Income | 10,034 | $123,229 |
| Median Household Income | 15,041 | $91,393 |
| Mean Household Income | 15,041 | $104,284 |
| Income Deficit | 10,034 | $8,868 |
| Wage / Income Gap (%) | 38,328 | 18.14% |
| Wage / Income Gap ($) | 38,328 | 81.86¢ per $1 |
| Gini / Inequality Index | 38,328 | 0.38 |
Earnings by Sex in Mechanicsville
Average Earnings in Mechanicsville are $49,555, $54,879 for men and $44,926 for women, a difference of 18.1%.
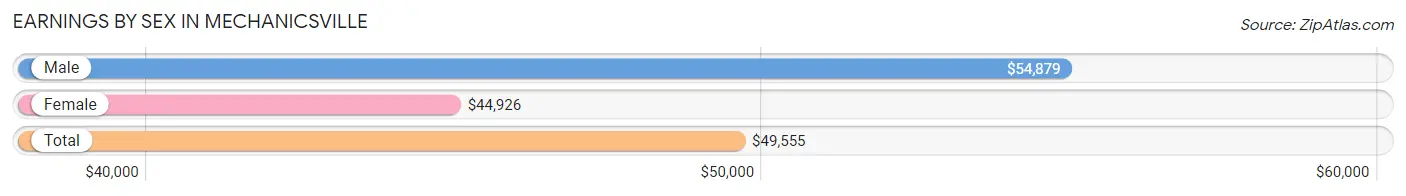
| Sex | Number | Average Earnings |
| Male | 10,825 (50.2%) | $54,879 |
| Female | 10,744 (49.8%) | $44,926 |
| Total | 21,569 (100.0%) | $49,555 |
Earnings by Sex by Income Bracket in Mechanicsville
The most common earnings brackets in Mechanicsville are $100,000+ for men (2,087 | 19.3%) and $100,000+ for women (1,295 | 12.0%).
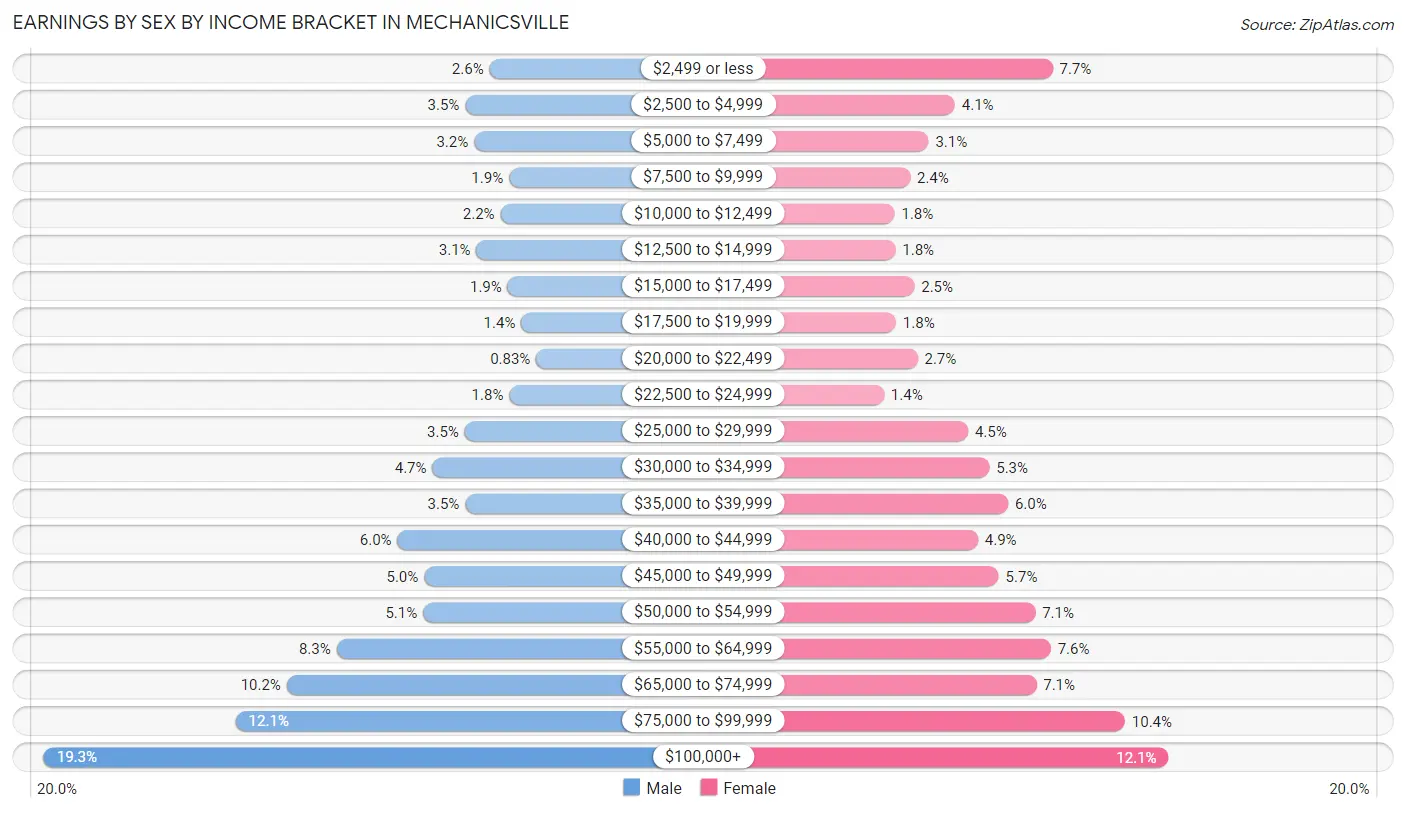
| Income | Male | Female |
| $2,499 or less | 279 (2.6%) | 828 (7.7%) |
| $2,500 to $4,999 | 378 (3.5%) | 435 (4.1%) |
| $5,000 to $7,499 | 342 (3.2%) | 329 (3.1%) |
| $7,500 to $9,999 | 200 (1.8%) | 255 (2.4%) |
| $10,000 to $12,499 | 235 (2.2%) | 192 (1.8%) |
| $12,500 to $14,999 | 332 (3.1%) | 196 (1.8%) |
| $15,000 to $17,499 | 206 (1.9%) | 272 (2.5%) |
| $17,500 to $19,999 | 151 (1.4%) | 198 (1.8%) |
| $20,000 to $22,499 | 90 (0.8%) | 285 (2.6%) |
| $22,500 to $24,999 | 199 (1.8%) | 149 (1.4%) |
| $25,000 to $29,999 | 380 (3.5%) | 488 (4.5%) |
| $30,000 to $34,999 | 511 (4.7%) | 574 (5.3%) |
| $35,000 to $39,999 | 378 (3.5%) | 649 (6.0%) |
| $40,000 to $44,999 | 653 (6.0%) | 527 (4.9%) |
| $45,000 to $49,999 | 544 (5.0%) | 611 (5.7%) |
| $50,000 to $54,999 | 549 (5.1%) | 758 (7.1%) |
| $55,000 to $64,999 | 900 (8.3%) | 821 (7.6%) |
| $65,000 to $74,999 | 1,102 (10.2%) | 763 (7.1%) |
| $75,000 to $99,999 | 1,309 (12.1%) | 1,119 (10.4%) |
| $100,000+ | 2,087 (19.3%) | 1,295 (12.0%) |
| Total | 10,825 (100.0%) | 10,744 (100.0%) |
Earnings by Sex by Educational Attainment in Mechanicsville
Average earnings in Mechanicsville are $62,939 for men and $51,071 for women, a difference of 18.9%. Men with an educational attainment of graduate degree enjoy the highest average annual earnings of $89,375, while those with less than high school education earn the least with $47,188. Women with an educational attainment of graduate degree earn the most with the average annual earnings of $68,419, while those with high school diploma education have the smallest earnings of $35,764.
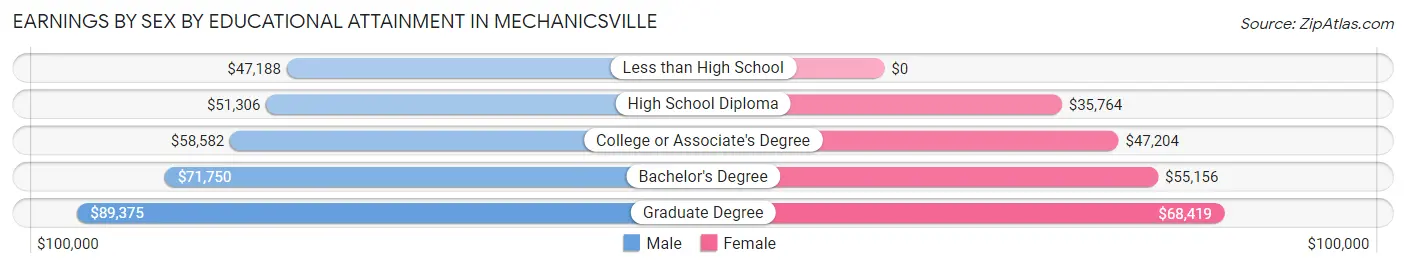
| Educational Attainment | Male Income | Female Income |
| Less than High School | $47,188 | $0 |
| High School Diploma | $51,306 | $35,764 |
| College or Associate's Degree | $58,582 | $47,204 |
| Bachelor's Degree | $71,750 | $55,156 |
| Graduate Degree | $89,375 | $68,419 |
| Total | $62,939 | $51,071 |
Family Income in Mechanicsville
Family Income Brackets in Mechanicsville
According to the Mechanicsville family income data, there are 3,020 families falling into the $100,000 to $149,999 income range, which is the most common income bracket and makes up 30.1% of all families. Conversely, the $10,000 to $14,999 income bracket is the least frequent group with only 100 families (1.0%) belonging to this category.
| Income Bracket | # Families | % Families |
| Less than $10,000 | 161 | 1.6% |
| $10,000 to $14,999 | 100 | 1.0% |
| $15,000 to $24,999 | 311 | 3.1% |
| $25,000 to $34,999 | 261 | 2.6% |
| $35,000 to $49,999 | 462 | 4.6% |
| $50,000 to $74,999 | 1,495 | 14.9% |
| $75,000 to $99,999 | 1,415 | 14.1% |
| $100,000 to $149,999 | 3,020 | 30.1% |
| $150,000 to $199,999 | 1,605 | 16.0% |
| $200,000+ | 1,214 | 12.1% |
Family Income by Famaliy Size in Mechanicsville
7+ person families (85 | 0.9%) account for the highest median family income in Mechanicsville with $155,063 per family, while 2-person families (4,854 | 48.4%) have the highest median income of $51,666 per family member.
| Income Bracket | # Families | Median Income |
| 2-Person Families | 4,854 (48.4%) | $103,333 |
| 3-Person Families | 2,384 (23.8%) | $106,417 |
| 4-Person Families | 1,875 (18.7%) | $138,750 |
| 5-Person Families | 677 (6.8%) | $131,495 |
| 6-Person Families | 159 (1.6%) | $136,523 |
| 7+ Person Families | 85 (0.9%) | $155,063 |
| Total | 10,034 (100.0%) | $112,143 |
Family Income by Number of Earners in Mechanicsville
The median family income in Mechanicsville is $112,143, with families comprising 3+ earners (1,413) having the highest median family income of $145,262, while families with no earners (1,182) have the lowest median family income of $70,795, accounting for 14.1% and 11.8% of families, respectively.
| Number of Earners | # Families | Median Income |
| No Earners | 1,182 (11.8%) | $70,795 |
| 1 Earner | 2,883 (28.7%) | $76,342 |
| 2 Earners | 4,556 (45.4%) | $132,668 |
| 3+ Earners | 1,413 (14.1%) | $145,262 |
| Total | 10,034 (100.0%) | $112,143 |
Household Income in Mechanicsville
Household Income Brackets in Mechanicsville
With 3,745 households falling in the category, the $100,000 to $149,999 income range is the most frequent in Mechanicsville, accounting for 24.9% of all households. In contrast, only 346 households (2.3%) fall into the less than $10,000 income bracket, making it the least populous group.
| Income Bracket | # Households | % Households |
| Less than $10,000 | 346 | 2.3% |
| $10,000 to $14,999 | 376 | 2.5% |
| $15,000 to $24,999 | 1,083 | 7.2% |
| $25,000 to $34,999 | 797 | 5.3% |
| $35,000 to $49,999 | 1,053 | 7.0% |
| $50,000 to $74,999 | 2,437 | 16.2% |
| $75,000 to $99,999 | 2,046 | 13.6% |
| $100,000 to $149,999 | 3,745 | 24.9% |
| $150,000 to $199,999 | 1,820 | 12.1% |
| $200,000+ | 1,354 | 9.0% |
Household Income by Householder Age in Mechanicsville
The median household income in Mechanicsville is $91,393, with the highest median household income of $113,974 found in the 45 to 64 years age bracket for the primary householder. A total of 5,638 households (37.5%) fall into this category. Meanwhile, the 65+ years age bracket for the primary householder has the lowest median household income of $57,958, with 4,690 households (31.2%) in this group.
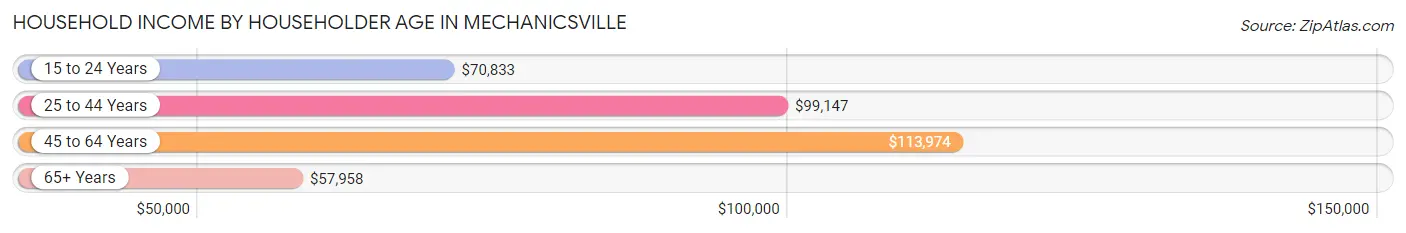
| Income Bracket | # Households | Median Income |
| 15 to 24 Years | 334 (2.2%) | $70,833 |
| 25 to 44 Years | 4,379 (29.1%) | $99,147 |
| 45 to 64 Years | 5,638 (37.5%) | $113,974 |
| 65+ Years | 4,690 (31.2%) | $57,958 |
| Total | 15,041 (100.0%) | $91,393 |
Poverty in Mechanicsville
Income Below Poverty by Sex and Age in Mechanicsville
With 4.6% poverty level for males and 6.3% for females among the residents of Mechanicsville, 15 year old males and under 5 year old females are the most vulnerable to poverty, with 51 males (20.1%) and 155 females (17.9%) in their respective age groups living below the poverty level.
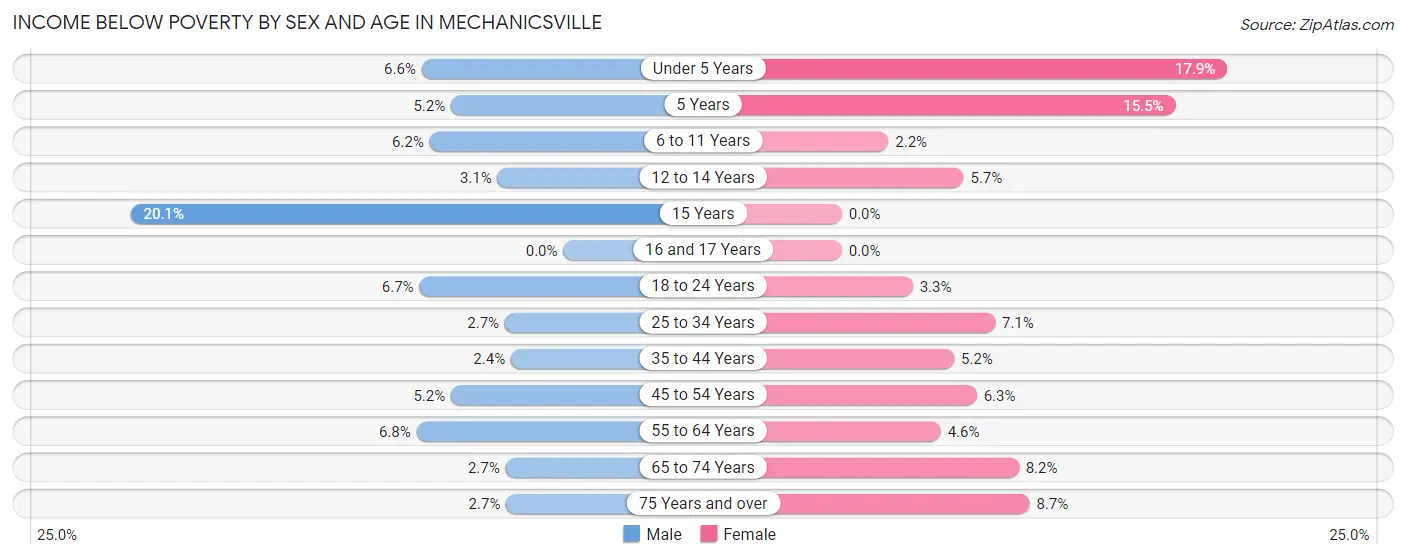
| Age Bracket | Male | Female |
| Under 5 Years | 70 (6.6%) | 155 (17.9%) |
| 5 Years | 11 (5.2%) | 37 (15.5%) |
| 6 to 11 Years | 89 (6.2%) | 25 (2.2%) |
| 12 to 14 Years | 28 (3.0%) | 56 (5.7%) |
| 15 Years | 51 (20.1%) | 0 (0.0%) |
| 16 and 17 Years | 0 (0.0%) | 0 (0.0%) |
| 18 to 24 Years | 104 (6.7%) | 50 (3.3%) |
| 25 to 34 Years | 59 (2.7%) | 148 (7.1%) |
| 35 to 44 Years | 59 (2.4%) | 124 (5.2%) |
| 45 to 54 Years | 113 (5.2%) | 163 (6.3%) |
| 55 to 64 Years | 173 (6.8%) | 130 (4.6%) |
| 65 to 74 Years | 46 (2.7%) | 160 (8.2%) |
| 75 Years and over | 36 (2.6%) | 184 (8.7%) |
| Total | 839 (4.6%) | 1,232 (6.3%) |
Income Above Poverty by Sex and Age in Mechanicsville
According to the poverty statistics in Mechanicsville, males aged 16 and 17 years and females aged 15 years are the age groups that are most secure financially, with 100.0% of males and 100.0% of females in these age groups living above the poverty line.
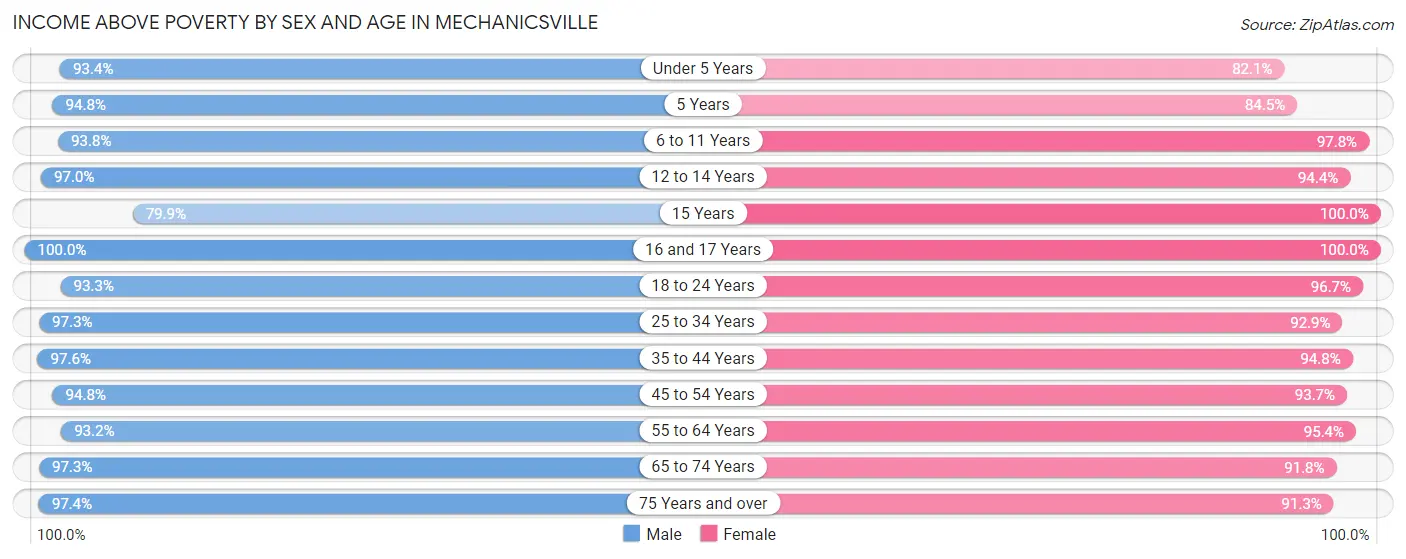
| Age Bracket | Male | Female |
| Under 5 Years | 996 (93.4%) | 712 (82.1%) |
| 5 Years | 200 (94.8%) | 202 (84.5%) |
| 6 to 11 Years | 1,346 (93.8%) | 1,135 (97.8%) |
| 12 to 14 Years | 891 (97.0%) | 936 (94.4%) |
| 15 Years | 203 (79.9%) | 292 (100.0%) |
| 16 and 17 Years | 552 (100.0%) | 661 (100.0%) |
| 18 to 24 Years | 1,454 (93.3%) | 1,472 (96.7%) |
| 25 to 34 Years | 2,115 (97.3%) | 1,934 (92.9%) |
| 35 to 44 Years | 2,369 (97.6%) | 2,254 (94.8%) |
| 45 to 54 Years | 2,054 (94.8%) | 2,441 (93.7%) |
| 55 to 64 Years | 2,366 (93.2%) | 2,702 (95.4%) |
| 65 to 74 Years | 1,670 (97.3%) | 1,789 (91.8%) |
| 75 Years and over | 1,323 (97.4%) | 1,928 (91.3%) |
| Total | 17,539 (95.4%) | 18,458 (93.7%) |
Income Below Poverty Among Married-Couple Families in Mechanicsville
The poverty statistics for married-couple families in Mechanicsville show that 1.8% or 135 of the total 7,720 families live below the poverty line. Families with 1 or 2 children have the highest poverty rate of 1.9%, comprising of 53 families. On the other hand, families with 3 or 4 children have the lowest poverty rate of 0.0%, which includes 0 families.
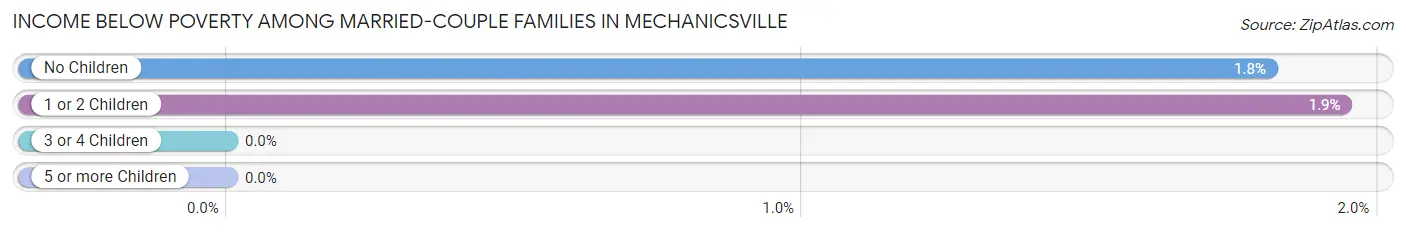
| Children | Above Poverty | Below Poverty |
| No Children | 4,440 (98.2%) | 82 (1.8%) |
| 1 or 2 Children | 2,676 (98.1%) | 53 (1.9%) |
| 3 or 4 Children | 418 (100.0%) | 0 (0.0%) |
| 5 or more Children | 51 (100.0%) | 0 (0.0%) |
| Total | 7,585 (98.3%) | 135 (1.8%) |
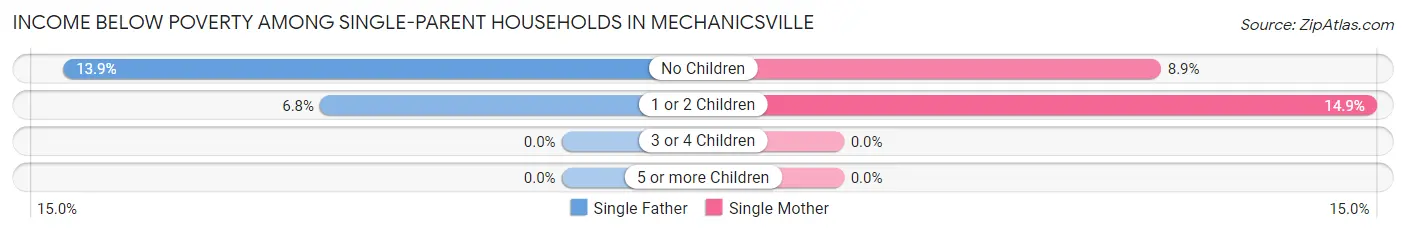
Income Below Poverty Among Single-Parent Households in Mechanicsville
According to the poverty data in Mechanicsville, 9.3% or 70 single-father households and 12.2% or 190 single-mother households are living below the poverty line. Among single-father households, those with no children have the highest poverty rate, with 49 households (13.9%) experiencing poverty. Likewise, among single-mother households, those with 1 or 2 children have the highest poverty rate, with 137 households (14.9%) falling below the poverty line.
| Children | Single Father | Single Mother |
| No Children | 49 (13.9%) | 53 (8.9%) |
| 1 or 2 Children | 21 (6.8%) | 137 (14.9%) |
| 3 or 4 Children | 0 (0.0%) | 0 (0.0%) |
| 5 or more Children | 0 (0.0%) | 0 (0.0%) |
| Total | 70 (9.3%) | 190 (12.2%) |
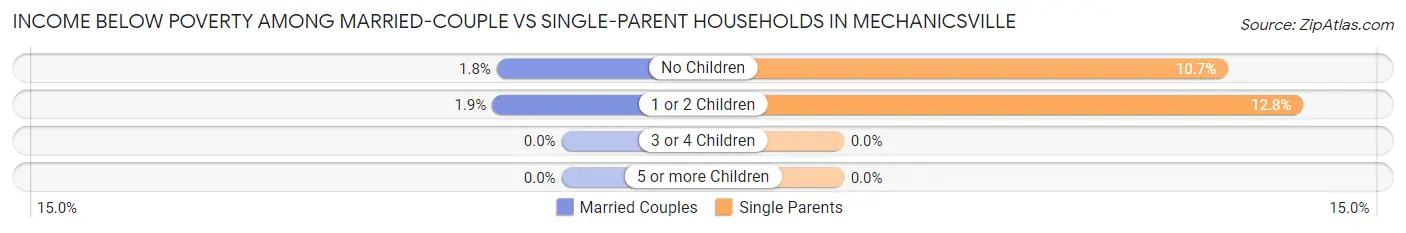
Income Below Poverty Among Married-Couple vs Single-Parent Households in Mechanicsville
The poverty data for Mechanicsville shows that 135 of the married-couple family households (1.8%) and 260 of the single-parent households (11.2%) are living below the poverty level. Within the married-couple family households, those with 1 or 2 children have the highest poverty rate, with 53 households (1.9%) falling below the poverty line. Among the single-parent households, those with 1 or 2 children have the highest poverty rate, with 158 household (12.8%) living below poverty.
| Children | Married-Couple Families | Single-Parent Households |
| No Children | 82 (1.8%) | 102 (10.7%) |
| 1 or 2 Children | 53 (1.9%) | 158 (12.8%) |
| 3 or 4 Children | 0 (0.0%) | 0 (0.0%) |
| 5 or more Children | 0 (0.0%) | 0 (0.0%) |
| Total | 135 (1.8%) | 260 (11.2%) |
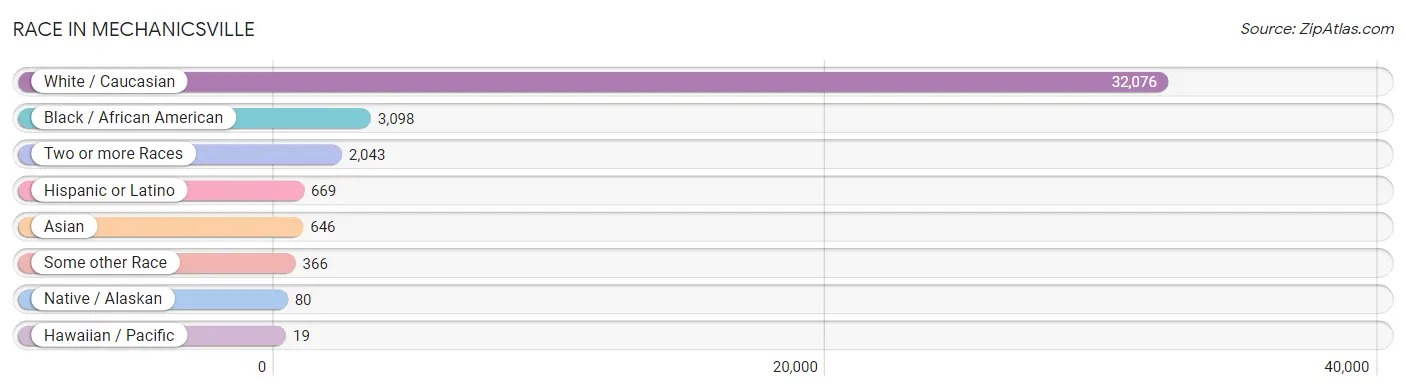
Race in Mechanicsville
The most populous races in Mechanicsville are White / Caucasian (32,076 | 83.7%), Black / African American (3,098 | 8.1%), and Two or more Races (2,043 | 5.3%).
| Race | # Population | % Population |
| Asian | 646 | 1.7% |
| Black / African American | 3,098 | 8.1% |
| Hawaiian / Pacific | 19 | 0.1% |
| Hispanic or Latino | 669 | 1.8% |
| Native / Alaskan | 80 | 0.2% |
| White / Caucasian | 32,076 | 83.7% |
| Two or more Races | 2,043 | 5.3% |
| Some other Race | 366 | 0.9% |
| Total | 38,328 | 100.0% |
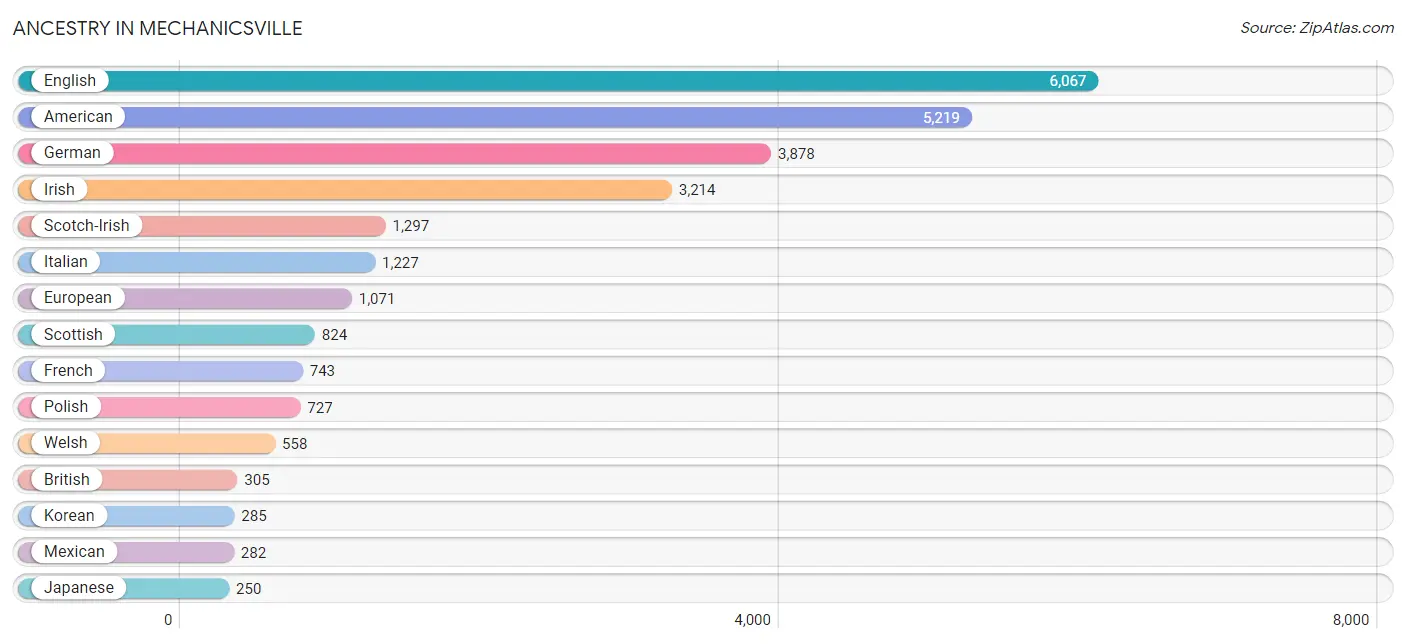
Ancestry in Mechanicsville
The most populous ancestries reported in Mechanicsville are English (6,067 | 15.8%), American (5,219 | 13.6%), German (3,878 | 10.1%), Irish (3,214 | 8.4%), and Scotch-Irish (1,297 | 3.4%), together accounting for 51.3% of all Mechanicsville residents.
| Ancestry | # Population | % Population |
| African | 219 | 0.6% |
| American | 5,219 | 13.6% |
| Arab | 157 | 0.4% |
| Australian | 15 | 0.0% |
| Austrian | 101 | 0.3% |
| Bhutanese | 36 | 0.1% |
| Blackfeet | 3 | 0.0% |
| Brazilian | 40 | 0.1% |
| British | 305 | 0.8% |
| Burmese | 67 | 0.2% |
| Cajun | 62 | 0.2% |
| Canadian | 58 | 0.2% |
| Celtic | 32 | 0.1% |
| Central American | 74 | 0.2% |
| Cherokee | 81 | 0.2% |
| Chippewa | 18 | 0.1% |
| Colombian | 67 | 0.2% |
| Costa Rican | 6 | 0.0% |
| Croatian | 22 | 0.1% |
| Czech | 138 | 0.4% |
| Danish | 10 | 0.0% |
| Dutch | 247 | 0.6% |
| Eastern European | 83 | 0.2% |
| Ecuadorian | 6 | 0.0% |
| Egyptian | 17 | 0.0% |
| English | 6,067 | 15.8% |
| Ethiopian | 19 | 0.1% |
| European | 1,071 | 2.8% |
| French | 743 | 1.9% |
| French Canadian | 177 | 0.5% |
| German | 3,878 | 10.1% |
| Greek | 67 | 0.2% |
| Guamanian / Chamorro | 9 | 0.0% |
| Guyanese | 31 | 0.1% |
| Honduran | 1 | 0.0% |
| Hungarian | 66 | 0.2% |
| Indian (Asian) | 60 | 0.2% |
| Irish | 3,214 | 8.4% |
| Italian | 1,227 | 3.2% |
| Jamaican | 71 | 0.2% |
| Japanese | 250 | 0.6% |
| Jordanian | 12 | 0.0% |
| Korean | 285 | 0.7% |
| Latvian | 35 | 0.1% |
| Lebanese | 84 | 0.2% |
| Lithuanian | 43 | 0.1% |
| Macedonian | 32 | 0.1% |
| Mexican | 282 | 0.7% |
| Norwegian | 144 | 0.4% |
| Pennsylvania German | 30 | 0.1% |
| Polish | 727 | 1.9% |
| Portuguese | 40 | 0.1% |
| Puerto Rican | 85 | 0.2% |
| Romanian | 53 | 0.1% |
| Russian | 227 | 0.6% |
| Salvadoran | 67 | 0.2% |
| Scandinavian | 66 | 0.2% |
| Scotch-Irish | 1,297 | 3.4% |
| Scottish | 824 | 2.1% |
| Slavic | 26 | 0.1% |
| Slovak | 11 | 0.0% |
| South American | 142 | 0.4% |
| Spaniard | 41 | 0.1% |
| Spanish | 12 | 0.0% |
| Sri Lankan | 95 | 0.3% |
| Subsaharan African | 238 | 0.6% |
| Swedish | 108 | 0.3% |
| Swiss | 54 | 0.1% |
| Syrian | 13 | 0.0% |
| Thai | 115 | 0.3% |
| Ukrainian | 60 | 0.2% |
| Venezuelan | 69 | 0.2% |
| Welsh | 558 | 1.5% |
| West Indian | 125 | 0.3% |
| Yaqui | 33 | 0.1% |
| Yugoslavian | 18 | 0.1% | View All 76 Rows |
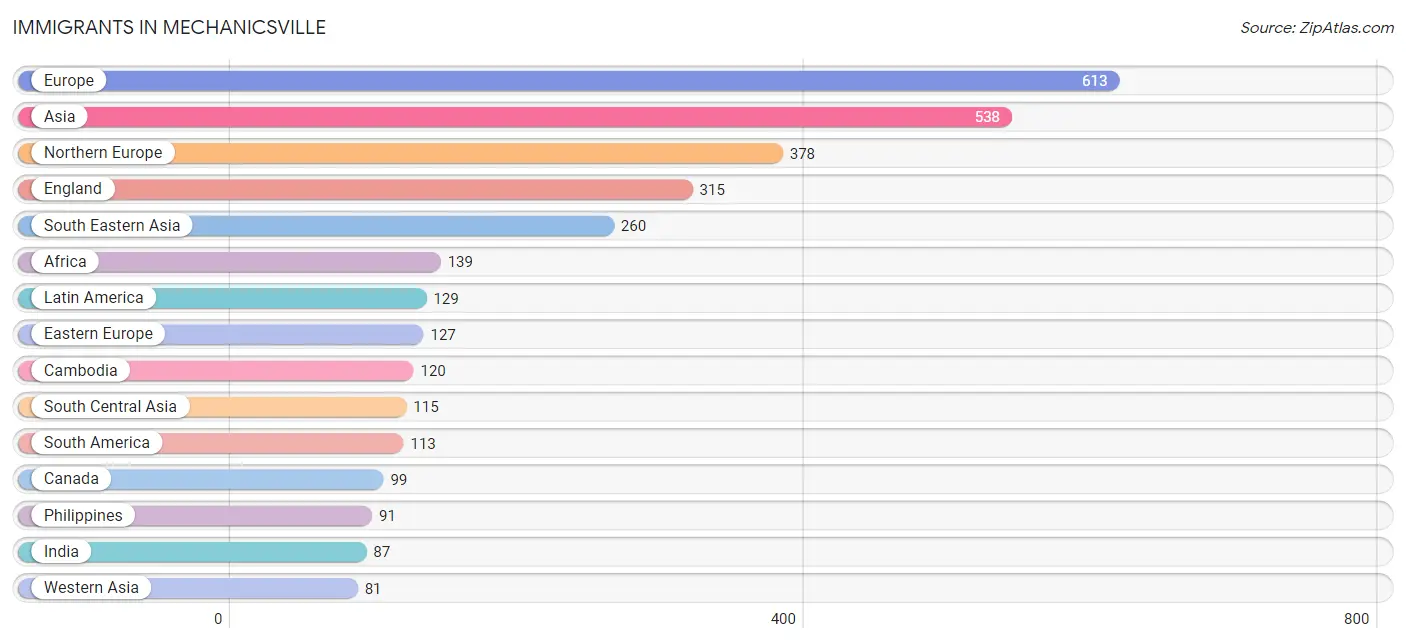
Immigrants in Mechanicsville
The most numerous immigrant groups reported in Mechanicsville came from Europe (613 | 1.6%), Asia (538 | 1.4%), Northern Europe (378 | 1.0%), England (315 | 0.8%), and South Eastern Asia (260 | 0.7%), together accounting for 5.5% of all Mechanicsville residents.
| Immigration Origin | # Population | % Population |
| Africa | 139 | 0.4% |
| Asia | 538 | 1.4% |
| Brazil | 41 | 0.1% |
| Cambodia | 120 | 0.3% |
| Canada | 99 | 0.3% |
| Central America | 16 | 0.0% |
| China | 34 | 0.1% |
| Colombia | 57 | 0.2% |
| Costa Rica | 6 | 0.0% |
| Eastern Africa | 63 | 0.2% |
| Eastern Asia | 72 | 0.2% |
| Eastern Europe | 127 | 0.3% |
| Egypt | 17 | 0.0% |
| El Salvador | 10 | 0.0% |
| England | 315 | 0.8% |
| Eritrea | 28 | 0.1% |
| Ethiopia | 1 | 0.0% |
| Europe | 613 | 1.6% |
| Germany | 72 | 0.2% |
| Hong Kong | 14 | 0.0% |
| India | 87 | 0.2% |
| Israel | 7 | 0.0% |
| Italy | 36 | 0.1% |
| Japan | 24 | 0.1% |
| Jordan | 24 | 0.1% |
| Korea | 14 | 0.0% |
| Latin America | 129 | 0.3% |
| Latvia | 8 | 0.0% |
| Micronesia | 10 | 0.0% |
| Morocco | 8 | 0.0% |
| Northern Africa | 25 | 0.1% |
| Northern Europe | 378 | 1.0% |
| Oceania | 10 | 0.0% |
| Pakistan | 28 | 0.1% |
| Philippines | 91 | 0.2% |
| Romania | 18 | 0.1% |
| Russia | 66 | 0.2% |
| Saudi Arabia | 31 | 0.1% |
| Scotland | 27 | 0.1% |
| South America | 113 | 0.3% |
| South Central Asia | 115 | 0.3% |
| South Eastern Asia | 260 | 0.7% |
| Southern Europe | 36 | 0.1% |
| Ukraine | 35 | 0.1% |
| Venezuela | 15 | 0.0% |
| Vietnam | 49 | 0.1% |
| Western Africa | 51 | 0.1% |
| Western Asia | 81 | 0.2% |
| Western Europe | 72 | 0.2% |
| Zimbabwe | 27 | 0.1% | View All 50 Rows |
Sex and Age in Mechanicsville
Sex and Age in Mechanicsville
The most populous age groups in Mechanicsville are 10 to 14 Years (1,602 | 8.7%) for men and 55 to 59 Years (1,581 | 8.0%) for women.
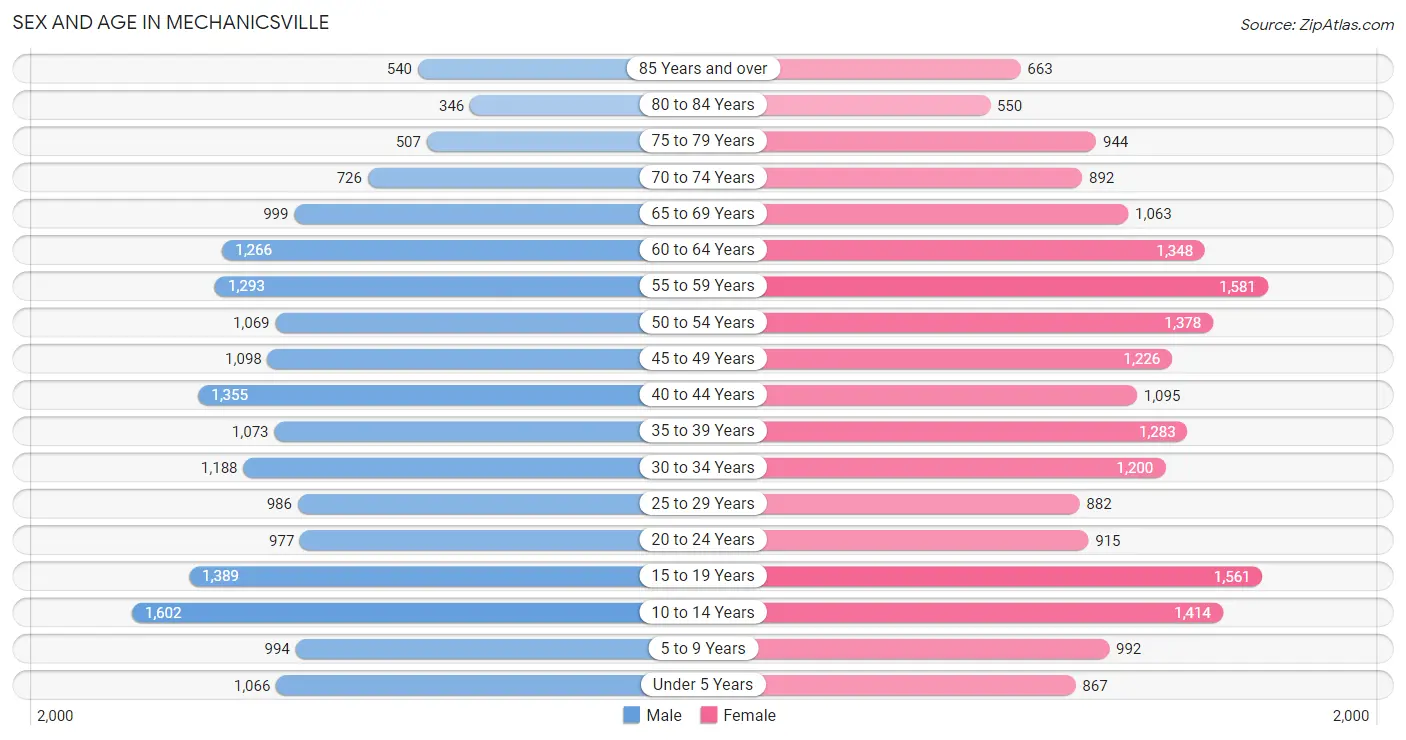
| Age Bracket | Male | Female |
| Under 5 Years | 1,066 (5.8%) | 867 (4.4%) |
| 5 to 9 Years | 994 (5.4%) | 992 (5.0%) |
| 10 to 14 Years | 1,602 (8.7%) | 1,414 (7.1%) |
| 15 to 19 Years | 1,389 (7.5%) | 1,561 (7.9%) |
| 20 to 24 Years | 977 (5.3%) | 915 (4.6%) |
| 25 to 29 Years | 986 (5.3%) | 882 (4.4%) |
| 30 to 34 Years | 1,188 (6.4%) | 1,200 (6.0%) |
| 35 to 39 Years | 1,073 (5.8%) | 1,283 (6.5%) |
| 40 to 44 Years | 1,355 (7.3%) | 1,095 (5.5%) |
| 45 to 49 Years | 1,098 (5.9%) | 1,226 (6.2%) |
| 50 to 54 Years | 1,069 (5.8%) | 1,378 (6.9%) |
| 55 to 59 Years | 1,293 (7.0%) | 1,581 (8.0%) |
| 60 to 64 Years | 1,266 (6.9%) | 1,348 (6.8%) |
| 65 to 69 Years | 999 (5.4%) | 1,063 (5.3%) |
| 70 to 74 Years | 726 (3.9%) | 892 (4.5%) |
| 75 to 79 Years | 507 (2.7%) | 944 (4.8%) |
| 80 to 84 Years | 346 (1.9%) | 550 (2.8%) |
| 85 Years and over | 540 (2.9%) | 663 (3.3%) |
| Total | 18,474 (100.0%) | 19,854 (100.0%) |
Families and Households in Mechanicsville
Median Family Size in Mechanicsville
The median family size in Mechanicsville is 3.10 persons per family, with single male/father families (752 | 7.5%) accounting for the largest median family size of 3.23 persons per family. On the other hand, single female/mother families (1,562 | 15.6%) represent the smallest median family size with 2.81 persons per family.
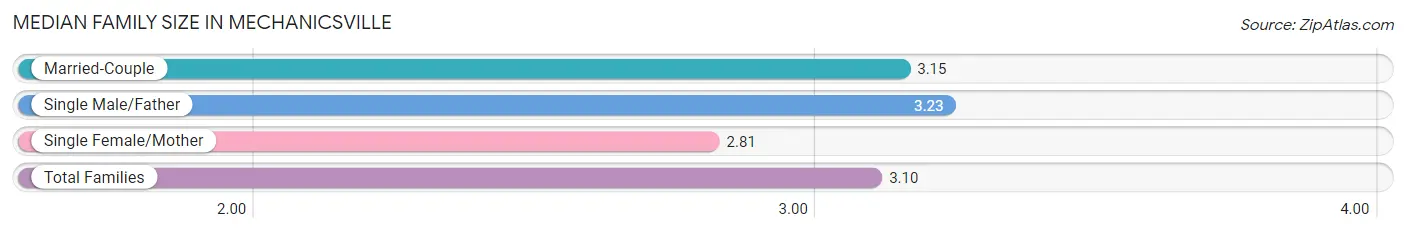
| Family Type | # Families | Family Size |
| Married-Couple | 7,720 (76.9%) | 3.15 |
| Single Male/Father | 752 (7.5%) | 3.23 |
| Single Female/Mother | 1,562 (15.6%) | 2.81 |
| Total Families | 10,034 (100.0%) | 3.10 |
Median Household Size in Mechanicsville
The median household size in Mechanicsville is 2.53 persons per household, with single male/father households (752 | 5.0%) accounting for the largest median household size of 3.65 persons per household. non-family households (5,007 | 33.3%) represent the smallest median household size with 1.21 persons per household.
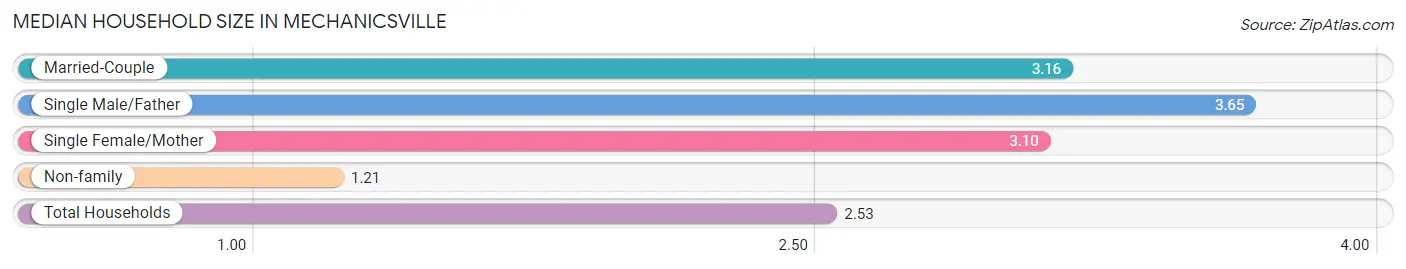
| Household Type | # Households | Household Size |
| Married-Couple | 7,720 (51.3%) | 3.16 |
| Single Male/Father | 752 (5.0%) | 3.65 |
| Single Female/Mother | 1,562 (10.4%) | 3.10 |
| Non-family | 5,007 (33.3%) | 1.21 |
| Total Households | 15,041 (100.0%) | 2.53 |
Household Size by Marriage Status in Mechanicsville
Out of a total of 15,041 households in Mechanicsville, 10,034 (66.7%) are family households, while 5,007 (33.3%) are nonfamily households. The most numerous type of family households are 2-person households, comprising 4,607, and the most common type of nonfamily households are 1-person households, comprising 4,083.
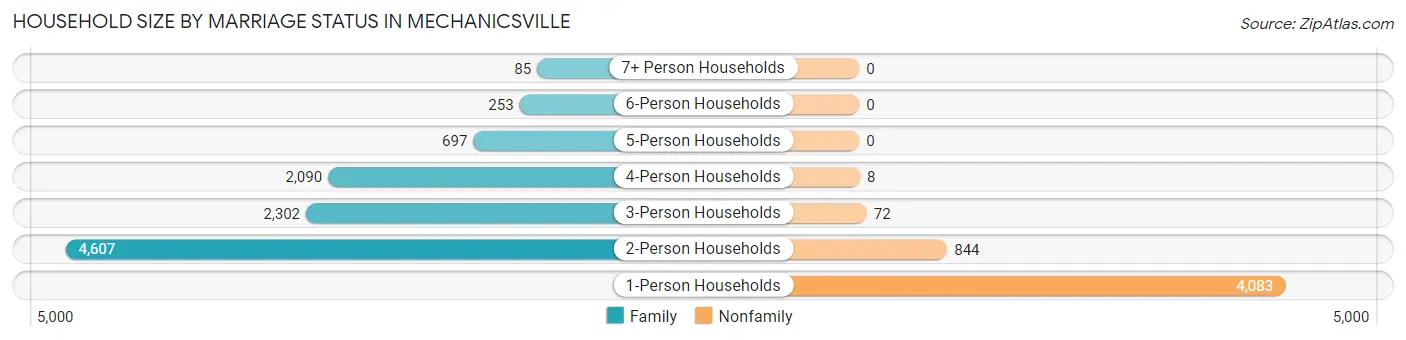
| Household Size | Family Households | Nonfamily Households |
| 1-Person Households | - | 4,083 (27.2%) |
| 2-Person Households | 4,607 (30.6%) | 844 (5.6%) |
| 3-Person Households | 2,302 (15.3%) | 72 (0.5%) |
| 4-Person Households | 2,090 (13.9%) | 8 (0.1%) |
| 5-Person Households | 697 (4.6%) | 0 (0.0%) |
| 6-Person Households | 253 (1.7%) | 0 (0.0%) |
| 7+ Person Households | 85 (0.6%) | 0 (0.0%) |
| Total | 10,034 (66.7%) | 5,007 (33.3%) |
Female Fertility in Mechanicsville
Fertility by Age in Mechanicsville
Average fertility rate in Mechanicsville is 46.0 births per 1,000 women. Women in the age bracket of 20 to 34 years have the highest fertility rate with 105.0 births per 1,000 women. Women in the age bracket of 20 to 34 years acount for 81.2% of all women with births.
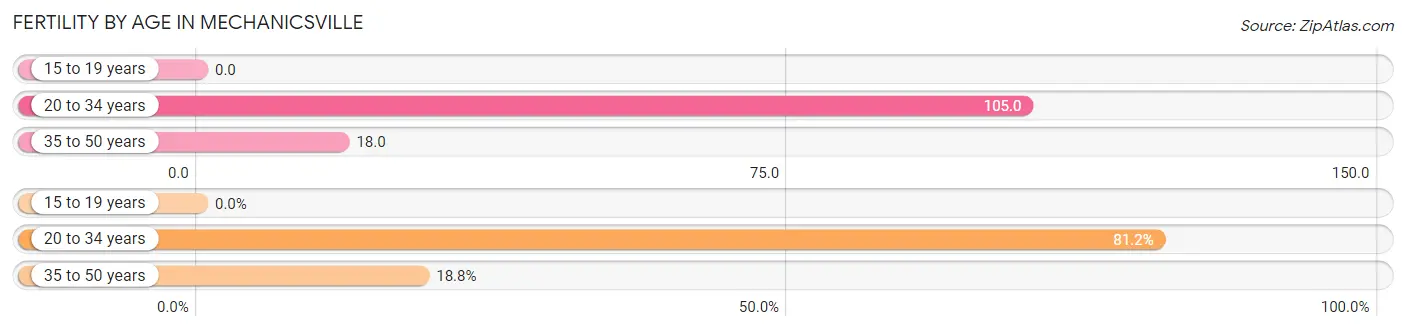
| Age Bracket | Women with Births | Births / 1,000 Women |
| 15 to 19 years | 0 (0.0%) | 0.0 |
| 20 to 34 years | 316 (81.2%) | 105.0 |
| 35 to 50 years | 73 (18.8%) | 18.0 |
| Total | 389 (100.0%) | 46.0 |
Fertility by Age by Marriage Status in Mechanicsville
72.2% of women with births (389) in Mechanicsville are married. The highest percentage of unmarried women with births falls into 20 to 34 years age bracket with 34.2% of them unmarried at the time of birth, while the lowest percentage of unmarried women with births belong to 35 to 50 years age bracket with 0.0% of them unmarried.
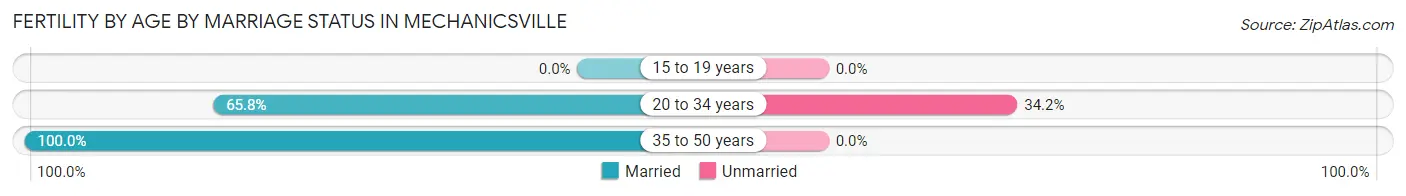
| Age Bracket | Married | Unmarried |
| 15 to 19 years | 0 (0.0%) | 0 (0.0%) |
| 20 to 34 years | 208 (65.8%) | 108 (34.2%) |
| 35 to 50 years | 73 (100.0%) | 0 (0.0%) |
| Total | 281 (72.2%) | 108 (27.8%) |
Fertility by Education in Mechanicsville
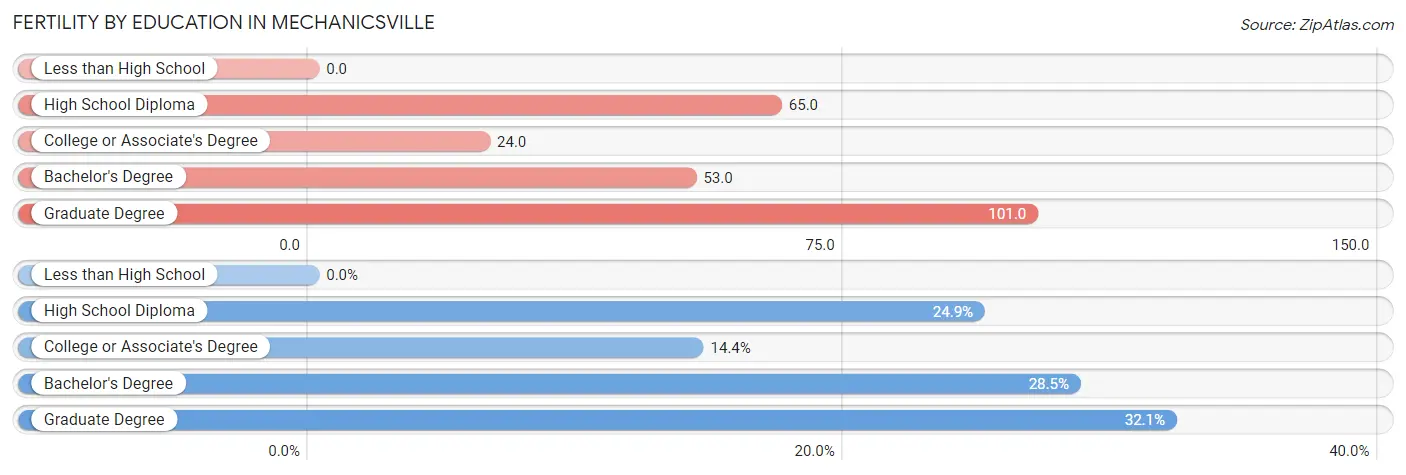
| Educational Attainment | Women with Births | Births / 1,000 Women |
| Less than High School | 0 (0.0%) | 0.0 |
| High School Diploma | 97 (24.9%) | 65.0 |
| College or Associate's Degree | 56 (14.4%) | 24.0 |
| Bachelor's Degree | 111 (28.5%) | 53.0 |
| Graduate Degree | 125 (32.1%) | 101.0 |
| Total | 389 (100.0%) | 46.0 |
Fertility by Education by Marriage Status in Mechanicsville
27.8% of women with births in Mechanicsville are unmarried. Women with the educational attainment of college or associate's degree are most likely to be married with 100.0% of them married at childbirth, while women with the educational attainment of graduate degree are least likely to be married with 54.4% of them unmarried at childbirth.
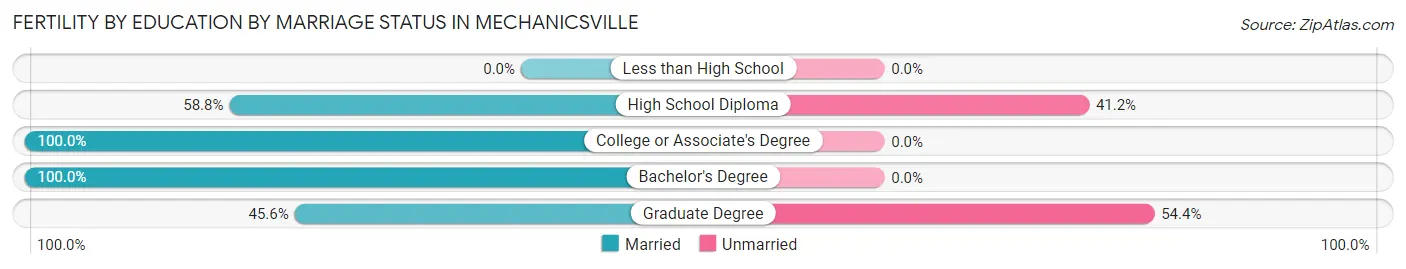
| Educational Attainment | Married | Unmarried |
| Less than High School | 0 (0.0%) | 0 (0.0%) |
| High School Diploma | 57 (58.8%) | 40 (41.2%) |
| College or Associate's Degree | 56 (100.0%) | 0 (0.0%) |
| Bachelor's Degree | 111 (100.0%) | 0 (0.0%) |
| Graduate Degree | 57 (45.6%) | 68 (54.4%) |
| Total | 281 (72.2%) | 108 (27.8%) |
Employment Characteristics in Mechanicsville
Employment by Class of Employer in Mechanicsville
Among the 19,901 employed individuals in Mechanicsville, private company employees (13,438 | 67.5%), local government employees (1,732 | 8.7%), and not-for-profit organizations (1,600 | 8.0%) make up the most common classes of employment.
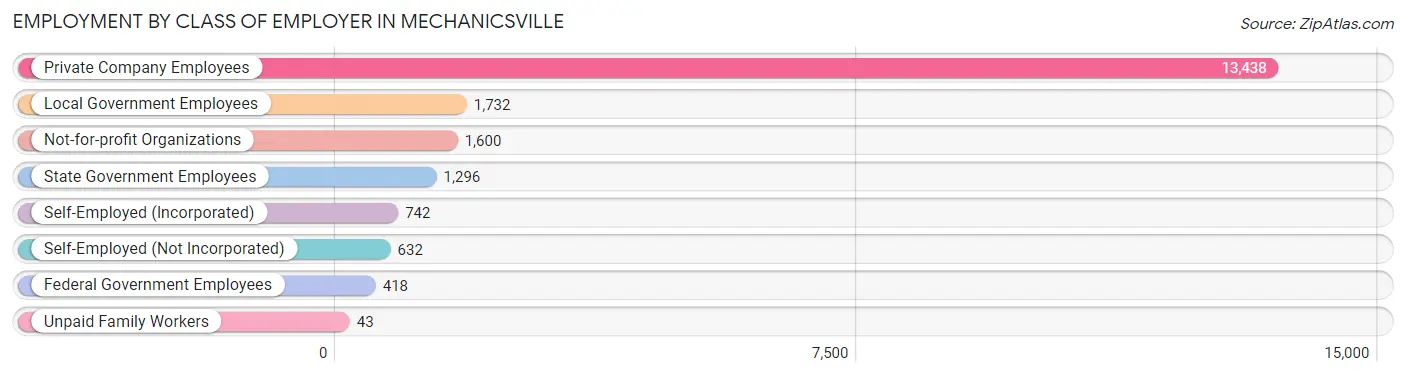
| Employer Class | # Employees | % Employees |
| Private Company Employees | 13,438 | 67.5% |
| Self-Employed (Incorporated) | 742 | 3.7% |
| Self-Employed (Not Incorporated) | 632 | 3.2% |
| Not-for-profit Organizations | 1,600 | 8.0% |
| Local Government Employees | 1,732 | 8.7% |
| State Government Employees | 1,296 | 6.5% |
| Federal Government Employees | 418 | 2.1% |
| Unpaid Family Workers | 43 | 0.2% |
| Total | 19,901 | 100.0% |
Employment Status by Age in Mechanicsville
According to the labor force statistics for Mechanicsville, out of the total population over 16 years of age (30,847), 67.2% or 20,729 individuals are in the labor force, with 2.0% or 415 of them unemployed. The age group with the highest labor force participation rate is 20 to 24 years, with 93.7% or 1,773 individuals in the labor force. Within the labor force, the 16 to 19 years age range has the highest percentage of unemployed individuals, with 8.2% or 109 of them being unemployed.
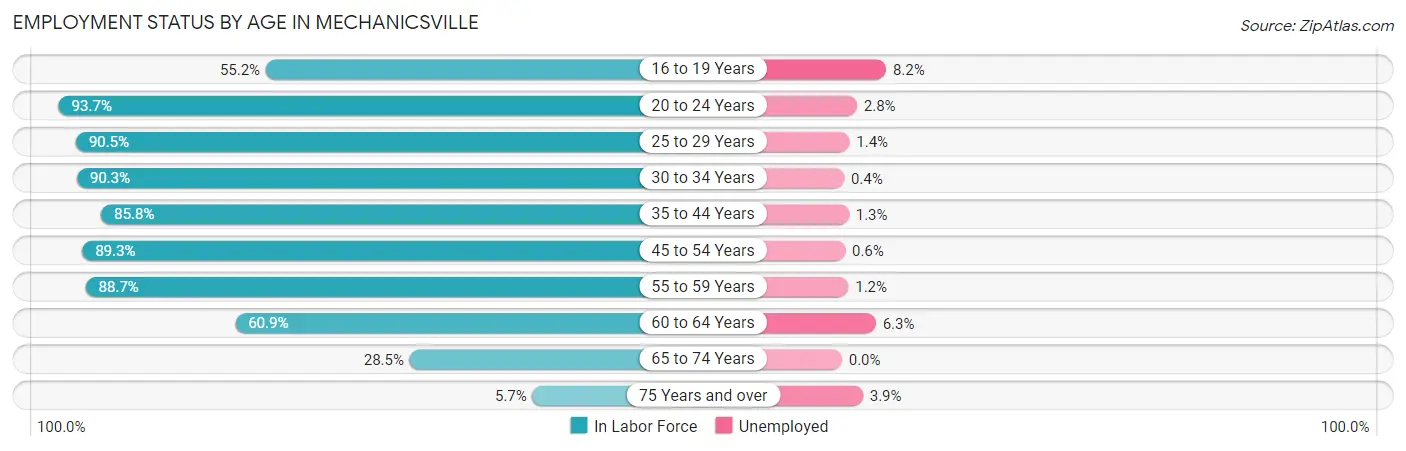
| Age Bracket | In Labor Force | Unemployed |
| 16 to 19 Years | 1,327 (55.2%) | 109 (8.2%) |
| 20 to 24 Years | 1,773 (93.7%) | 50 (2.8%) |
| 25 to 29 Years | 1,691 (90.5%) | 24 (1.4%) |
| 30 to 34 Years | 2,156 (90.3%) | 9 (0.4%) |
| 35 to 44 Years | 4,124 (85.8%) | 54 (1.3%) |
| 45 to 54 Years | 4,261 (89.3%) | 26 (0.6%) |
| 55 to 59 Years | 2,549 (88.7%) | 31 (1.2%) |
| 60 to 64 Years | 1,592 (60.9%) | 100 (6.3%) |
| 65 to 74 Years | 1,049 (28.5%) | 0 (0.0%) |
| 75 Years and over | 202 (5.7%) | 8 (3.9%) |
| Total | 20,729 (67.2%) | 415 (2.0%) |
Employment Status by Educational Attainment in Mechanicsville
According to labor force statistics for Mechanicsville, 84.7% of individuals (16,365) out of the total population between 25 and 64 years of age (19,321) are in the labor force, with 1.5% or 245 of them being unemployed. The group with the highest labor force participation rate are those with the educational attainment of bachelor's degree or higher, with 89.8% or 7,224 individuals in the labor force. Within the labor force, individuals with high school diploma education have the highest percentage of unemployment, with 2.8% or 93 of them being unemployed.
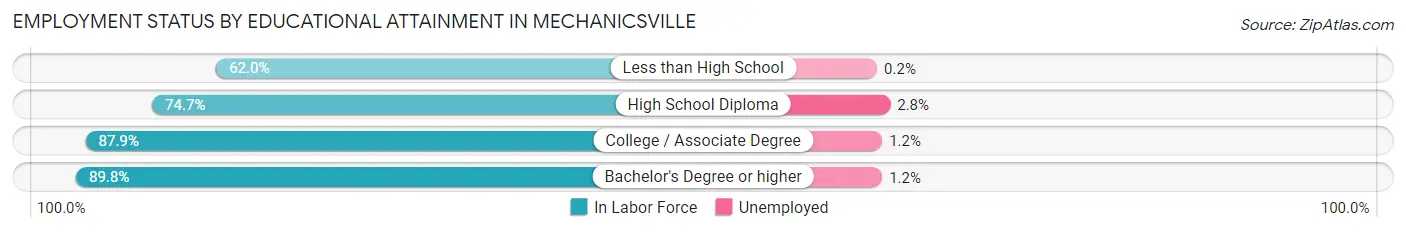
| Educational Attainment | In Labor Force | Unemployed |
| Less than High School | 423 (62.0%) | 1 (0.2%) |
| High School Diploma | 3,336 (74.7%) | 125 (2.8%) |
| College / Associate Degree | 5,387 (87.9%) | 74 (1.2%) |
| Bachelor's Degree or higher | 7,224 (89.8%) | 97 (1.2%) |
| Total | 16,365 (84.7%) | 290 (1.5%) |
Employment Occupations by Sex in Mechanicsville
Management, Business, Science and Arts Occupations
The most common Management, Business, Science and Arts occupations in Mechanicsville are Management (2,399 | 11.8%), Community & Social Service (2,048 | 10.1%), Business & Financial (1,697 | 8.4%), Health Diagnosing & Treating (1,576 | 7.8%), and Education Instruction & Library (1,222 | 6.0%).
Management, Business, Science and Arts Occupations by Sex
Within the Management, Business, Science and Arts occupations in Mechanicsville, the most male-oriented occupations are Architecture & Engineering (96.1%), Computers, Engineering & Science (74.4%), and Computers & Mathematics (73.6%), while the most female-oriented occupations are Health Technologists (80.4%), Health Diagnosing & Treating (76.5%), and Legal Services & Support (76.1%).
| Occupation | Male | Female |
| Management | 1,321 (55.1%) | 1,078 (44.9%) |
| Business & Financial | 605 (35.6%) | 1,092 (64.3%) |
| Computers, Engineering & Science | 797 (74.4%) | 274 (25.6%) |
| Computers & Mathematics | 468 (73.6%) | 168 (26.4%) |
| Architecture & Engineering | 247 (96.1%) | 10 (3.9%) |
| Life, Physical & Social Science | 82 (46.1%) | 96 (53.9%) |
| Community & Social Service | 647 (31.6%) | 1,401 (68.4%) |
| Education, Arts & Media | 71 (24.0%) | 225 (76.0%) |
| Legal Services & Support | 47 (23.9%) | 150 (76.1%) |
| Education Instruction & Library | 314 (25.7%) | 908 (74.3%) |
| Arts, Media & Entertainment | 215 (64.6%) | 118 (35.4%) |
| Health Diagnosing & Treating | 370 (23.5%) | 1,206 (76.5%) |
| Health Technologists | 198 (19.6%) | 814 (80.4%) |
| Total (Category) | 3,740 (42.5%) | 5,051 (57.5%) |
| Total (Overall) | 10,213 (50.3%) | 10,078 (49.7%) |
Services Occupations
The most common Services occupations in Mechanicsville are Food Preparation & Serving (1,062 | 5.2%), Personal Care & Service (614 | 3.0%), Security & Protection (607 | 3.0%), Healthcare Support (356 | 1.8%), and Firefighting & Prevention (348 | 1.7%).
Services Occupations by Sex
Within the Services occupations in Mechanicsville, the most male-oriented occupations are Cleaning & Maintenance (94.9%), Firefighting & Prevention (84.2%), and Security & Protection (79.1%), while the most female-oriented occupations are Healthcare Support (92.1%), Personal Care & Service (66.1%), and Food Preparation & Serving (64.7%).
| Occupation | Male | Female |
| Healthcare Support | 28 (7.9%) | 328 (92.1%) |
| Security & Protection | 480 (79.1%) | 127 (20.9%) |
| Firefighting & Prevention | 293 (84.2%) | 55 (15.8%) |
| Law Enforcement | 187 (72.2%) | 72 (27.8%) |
| Food Preparation & Serving | 375 (35.3%) | 687 (64.7%) |
| Cleaning & Maintenance | 298 (94.9%) | 16 (5.1%) |
| Personal Care & Service | 208 (33.9%) | 406 (66.1%) |
| Total (Category) | 1,389 (47.0%) | 1,564 (53.0%) |
| Total (Overall) | 10,213 (50.3%) | 10,078 (49.7%) |
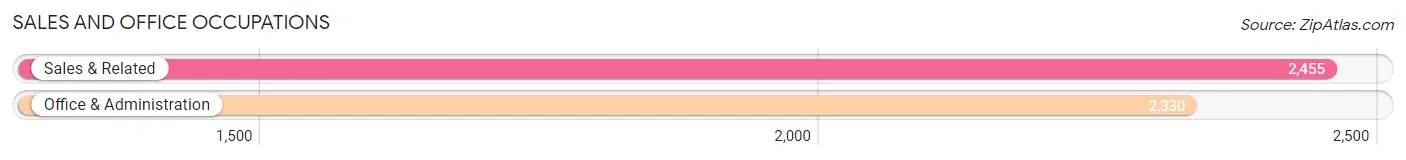
Sales and Office Occupations
The most common Sales and Office occupations in Mechanicsville are Sales & Related (2,455 | 12.1%), and Office & Administration (2,330 | 11.5%).
Sales and Office Occupations by Sex
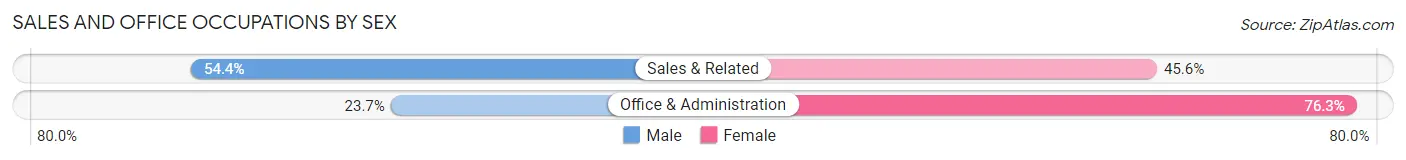
| Occupation | Male | Female |
| Sales & Related | 1,335 (54.4%) | 1,120 (45.6%) |
| Office & Administration | 552 (23.7%) | 1,778 (76.3%) |
| Total (Category) | 1,887 (39.4%) | 2,898 (60.6%) |
| Total (Overall) | 10,213 (50.3%) | 10,078 (49.7%) |
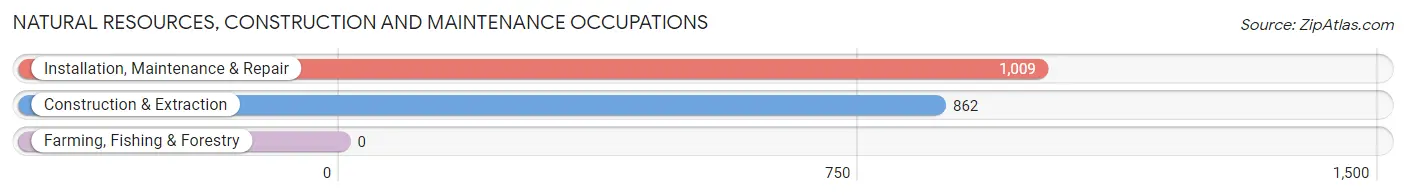
Natural Resources, Construction and Maintenance Occupations
The most common Natural Resources, Construction and Maintenance occupations in Mechanicsville are Installation, Maintenance & Repair (1,009 | 5.0%), and Construction & Extraction (862 | 4.3%).
Natural Resources, Construction and Maintenance Occupations by Sex
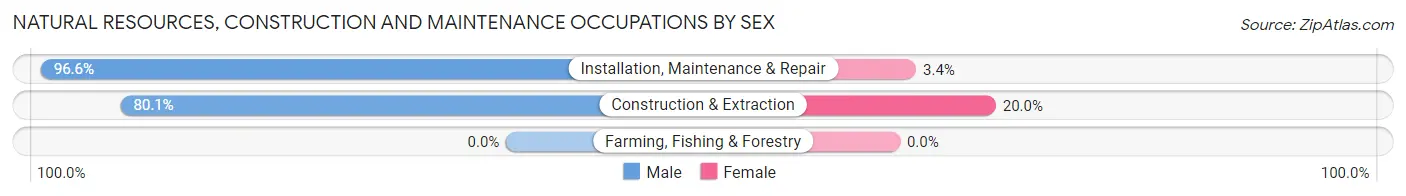
| Occupation | Male | Female |
| Farming, Fishing & Forestry | 0 (0.0%) | 0 (0.0%) |
| Construction & Extraction | 690 (80.0%) | 172 (20.0%) |
| Installation, Maintenance & Repair | 975 (96.6%) | 34 (3.4%) |
| Total (Category) | 1,665 (89.0%) | 206 (11.0%) |
| Total (Overall) | 10,213 (50.3%) | 10,078 (49.7%) |
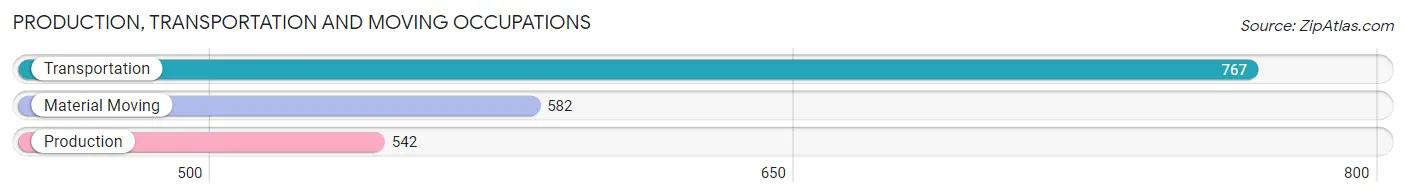
Production, Transportation and Moving Occupations
The most common Production, Transportation and Moving occupations in Mechanicsville are Transportation (767 | 3.8%), Material Moving (582 | 2.9%), and Production (542 | 2.7%).
Production, Transportation and Moving Occupations by Sex
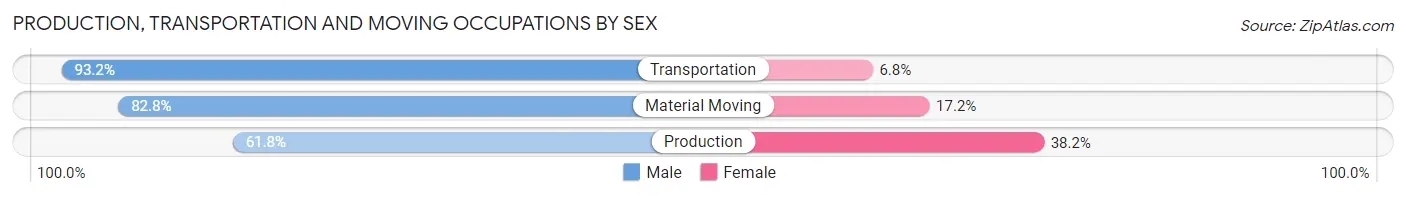
| Occupation | Male | Female |
| Production | 335 (61.8%) | 207 (38.2%) |
| Transportation | 715 (93.2%) | 52 (6.8%) |
| Material Moving | 482 (82.8%) | 100 (17.2%) |
| Total (Category) | 1,532 (81.0%) | 359 (19.0%) |
| Total (Overall) | 10,213 (50.3%) | 10,078 (49.7%) |
Employment Industries by Sex in Mechanicsville
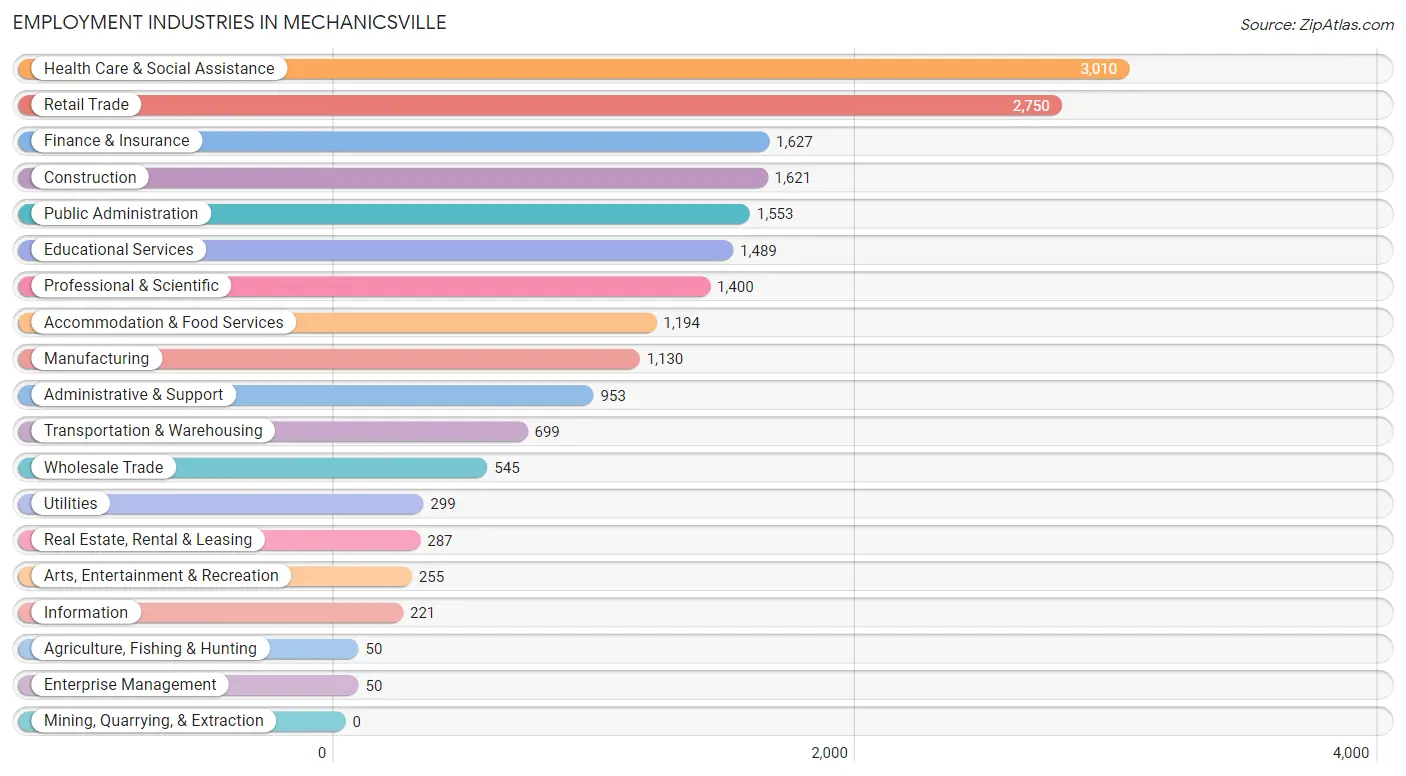
Employment Industries in Mechanicsville
The major employment industries in Mechanicsville include Health Care & Social Assistance (3,010 | 14.8%), Retail Trade (2,750 | 13.6%), Finance & Insurance (1,627 | 8.0%), Construction (1,621 | 8.0%), and Public Administration (1,553 | 7.6%).
Employment Industries by Sex in Mechanicsville
The Mechanicsville industries that see more men than women are Construction (84.1%), Transportation & Warehousing (84.0%), and Information (80.5%), whereas the industries that tend to have a higher number of women are Enterprise Management (100.0%), Health Care & Social Assistance (79.1%), and Educational Services (67.1%).
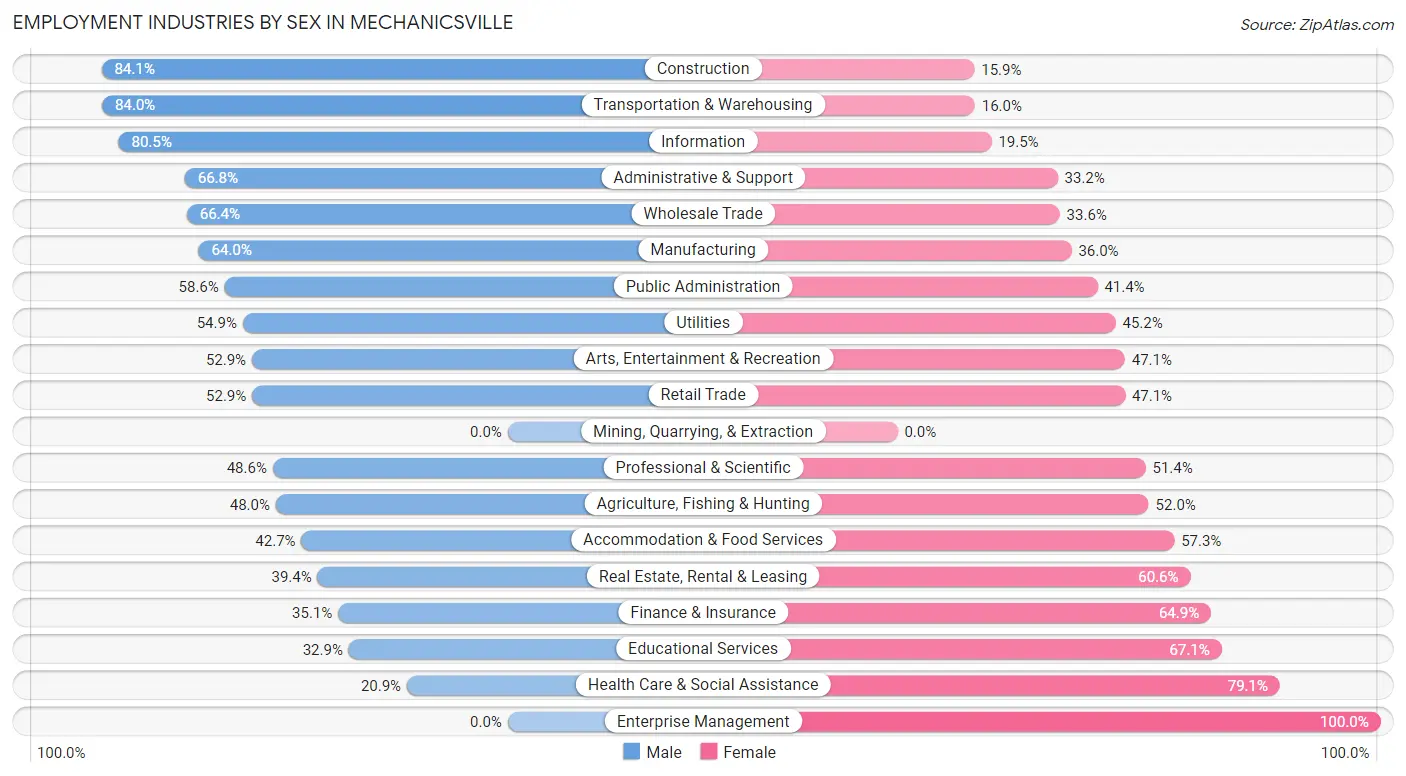
| Industry | Male | Female |
| Agriculture, Fishing & Hunting | 24 (48.0%) | 26 (52.0%) |
| Mining, Quarrying, & Extraction | 0 (0.0%) | 0 (0.0%) |
| Construction | 1,363 (84.1%) | 258 (15.9%) |
| Manufacturing | 723 (64.0%) | 407 (36.0%) |
| Wholesale Trade | 362 (66.4%) | 183 (33.6%) |
| Retail Trade | 1,455 (52.9%) | 1,295 (47.1%) |
| Transportation & Warehousing | 587 (84.0%) | 112 (16.0%) |
| Utilities | 164 (54.8%) | 135 (45.2%) |
| Information | 178 (80.5%) | 43 (19.5%) |
| Finance & Insurance | 571 (35.1%) | 1,056 (64.9%) |
| Real Estate, Rental & Leasing | 113 (39.4%) | 174 (60.6%) |
| Professional & Scientific | 681 (48.6%) | 719 (51.4%) |
| Enterprise Management | 0 (0.0%) | 50 (100.0%) |
| Administrative & Support | 637 (66.8%) | 316 (33.2%) |
| Educational Services | 490 (32.9%) | 999 (67.1%) |
| Health Care & Social Assistance | 628 (20.9%) | 2,382 (79.1%) |
| Arts, Entertainment & Recreation | 135 (52.9%) | 120 (47.1%) |
| Accommodation & Food Services | 510 (42.7%) | 684 (57.3%) |
| Public Administration | 910 (58.6%) | 643 (41.4%) |
| Total | 10,213 (50.3%) | 10,078 (49.7%) |
Education in Mechanicsville
School Enrollment in Mechanicsville
The most common levels of schooling among the 9,096 students in Mechanicsville are high school (2,749 | 30.2%), middle school (2,410 | 26.5%), and elementary school (1,533 | 16.9%).
| School Level | # Students | % Students |
| Nursery / Preschool | 489 | 5.4% |
| Kindergarten | 318 | 3.5% |
| Elementary School | 1,533 | 16.9% |
| Middle School | 2,410 | 26.5% |
| High School | 2,749 | 30.2% |
| College / Undergraduate | 1,202 | 13.2% |
| Graduate / Professional | 395 | 4.3% |
| Total | 9,096 | 100.0% |
School Enrollment by Age by Funding Source in Mechanicsville
Out of a total of 9,096 students who are enrolled in schools in Mechanicsville, 1,455 (16.0%) attend a private institution, while the remaining 7,641 (84.0%) are enrolled in public schools. The age group of 25 to 34 year olds has the highest likelihood of being enrolled in private schools, with 162 (70.4% in the age bracket) enrolled. Conversely, the age group of 10 to 14 year olds has the lowest likelihood of being enrolled in a private school, with 2,755 (95.3% in the age bracket) attending a public institution.
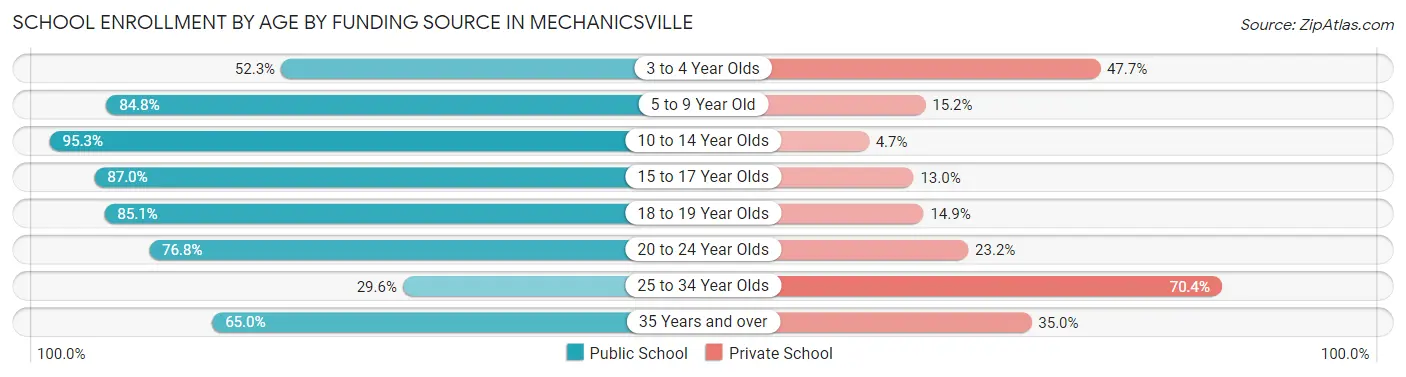
| Age Bracket | Public School | Private School |
| 3 to 4 Year Olds | 220 (52.3%) | 201 (47.7%) |
| 5 to 9 Year Old | 1,521 (84.8%) | 273 (15.2%) |
| 10 to 14 Year Olds | 2,755 (95.3%) | 135 (4.7%) |
| 15 to 17 Year Olds | 1,532 (87.0%) | 229 (13.0%) |
| 18 to 19 Year Olds | 727 (85.1%) | 127 (14.9%) |
| 20 to 24 Year Olds | 487 (76.8%) | 147 (23.2%) |
| 25 to 34 Year Olds | 68 (29.6%) | 162 (70.4%) |
| 35 Years and over | 333 (65.0%) | 179 (35.0%) |
| Total | 7,641 (84.0%) | 1,455 (16.0%) |
Educational Attainment by Field of Study in Mechanicsville
Business (2,287 | 21.6%), science & technology (1,210 | 11.4%), education (1,035 | 9.8%), social sciences (1,021 | 9.6%), and psychology (669 | 6.3%) are the most common fields of study among 10,596 individuals in Mechanicsville who have obtained a bachelor's degree or higher.
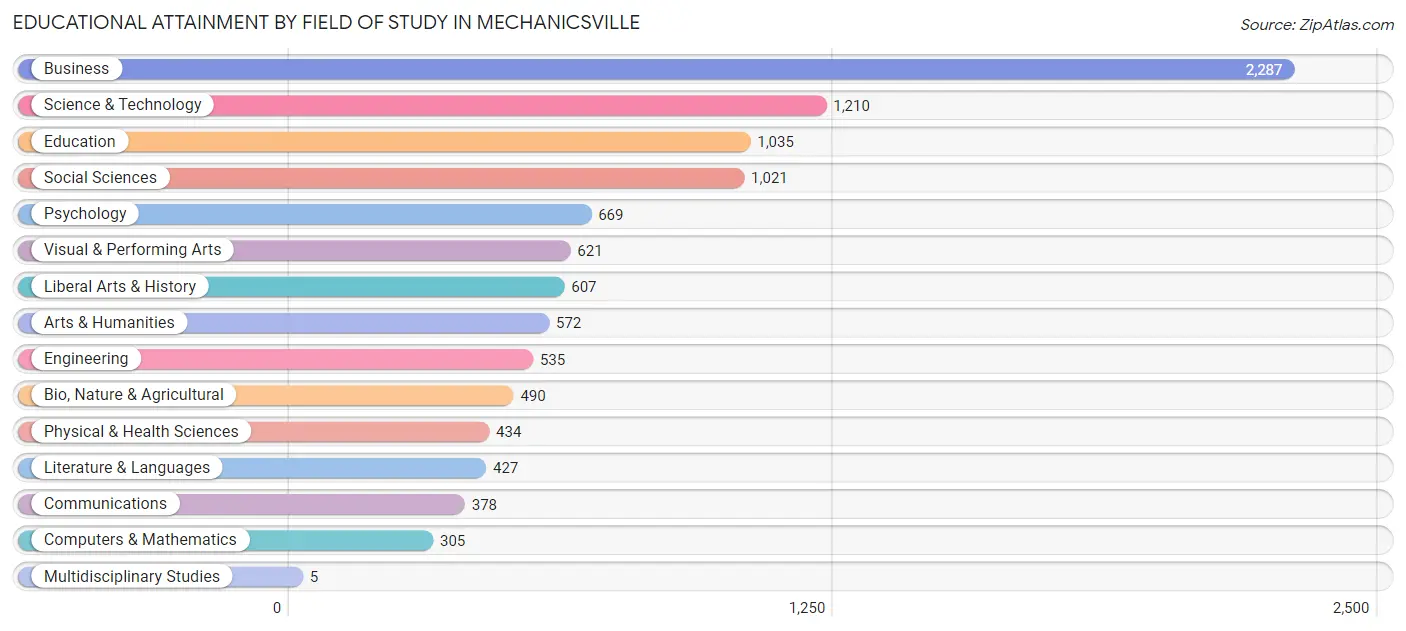
| Field of Study | # Graduates | % Graduates |
| Computers & Mathematics | 305 | 2.9% |
| Bio, Nature & Agricultural | 490 | 4.6% |
| Physical & Health Sciences | 434 | 4.1% |
| Psychology | 669 | 6.3% |
| Social Sciences | 1,021 | 9.6% |
| Engineering | 535 | 5.1% |
| Multidisciplinary Studies | 5 | 0.1% |
| Science & Technology | 1,210 | 11.4% |
| Business | 2,287 | 21.6% |
| Education | 1,035 | 9.8% |
| Literature & Languages | 427 | 4.0% |
| Liberal Arts & History | 607 | 5.7% |
| Visual & Performing Arts | 621 | 5.9% |
| Communications | 378 | 3.6% |
| Arts & Humanities | 572 | 5.4% |
| Total | 10,596 | 100.0% |
Transportation & Commute in Mechanicsville
Vehicle Availability by Sex in Mechanicsville
The most prevalent vehicle ownership categories in Mechanicsville are males with 2 vehicles (3,834, accounting for 37.8%) and females with 2 vehicles (3,569, making up 39.3%).
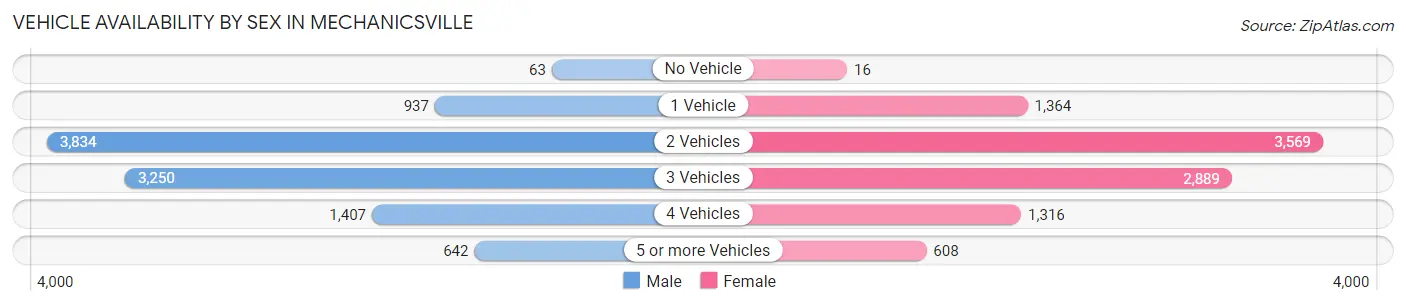
| Vehicles Available | Male | Female |
| No Vehicle | 63 (0.6%) | 16 (0.2%) |
| 1 Vehicle | 937 (9.2%) | 1,364 (14.0%) |
| 2 Vehicles | 3,834 (37.8%) | 3,569 (36.6%) |
| 3 Vehicles | 3,250 (32.1%) | 2,889 (29.6%) |
| 4 Vehicles | 1,407 (13.9%) | 1,316 (13.5%) |
| 5 or more Vehicles | 642 (6.3%) | 608 (6.2%) |
| Total | 10,133 (100.0%) | 9,762 (100.0%) |
Commute Time in Mechanicsville
The most frequently occuring commute durations in Mechanicsville are 20 to 24 minutes (4,141 commuters, 24.0%), 30 to 34 minutes (2,974 commuters, 17.2%), and 15 to 19 minutes (2,422 commuters, 14.0%).
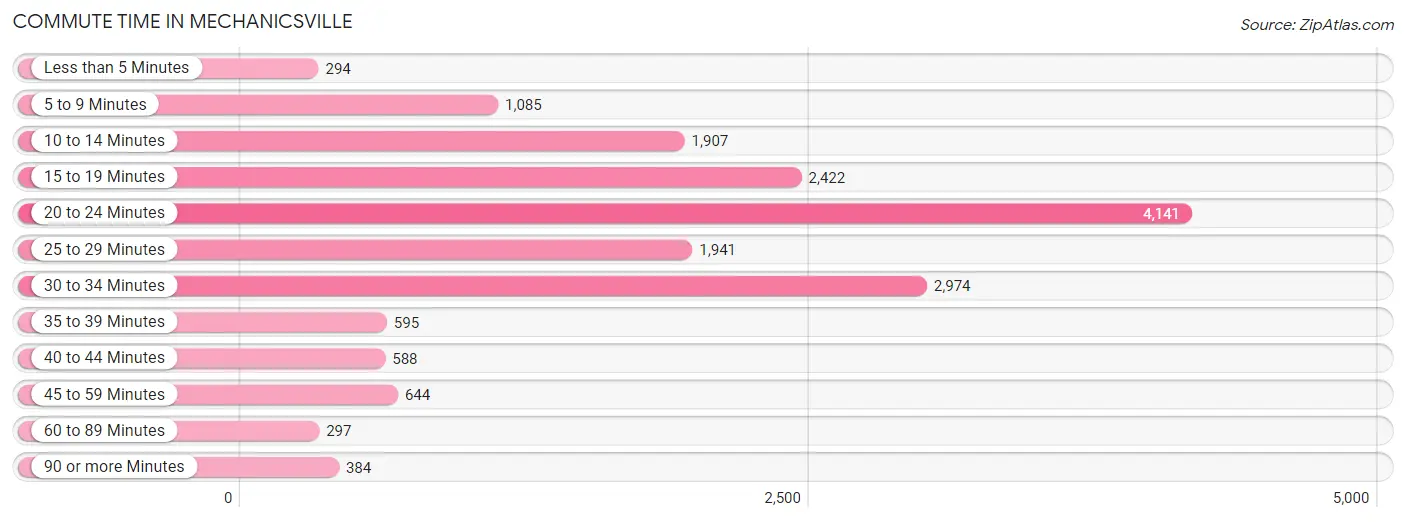
| Commute Time | # Commuters | % Commuters |
| Less than 5 Minutes | 294 | 1.7% |
| 5 to 9 Minutes | 1,085 | 6.3% |
| 10 to 14 Minutes | 1,907 | 11.0% |
| 15 to 19 Minutes | 2,422 | 14.0% |
| 20 to 24 Minutes | 4,141 | 24.0% |
| 25 to 29 Minutes | 1,941 | 11.2% |
| 30 to 34 Minutes | 2,974 | 17.2% |
| 35 to 39 Minutes | 595 | 3.4% |
| 40 to 44 Minutes | 588 | 3.4% |
| 45 to 59 Minutes | 644 | 3.7% |
| 60 to 89 Minutes | 297 | 1.7% |
| 90 or more Minutes | 384 | 2.2% |
Commute Time by Sex in Mechanicsville
The most common commute times in Mechanicsville are 20 to 24 minutes (2,291 commuters, 25.4%) for males and 20 to 24 minutes (1,850 commuters, 22.4%) for females.
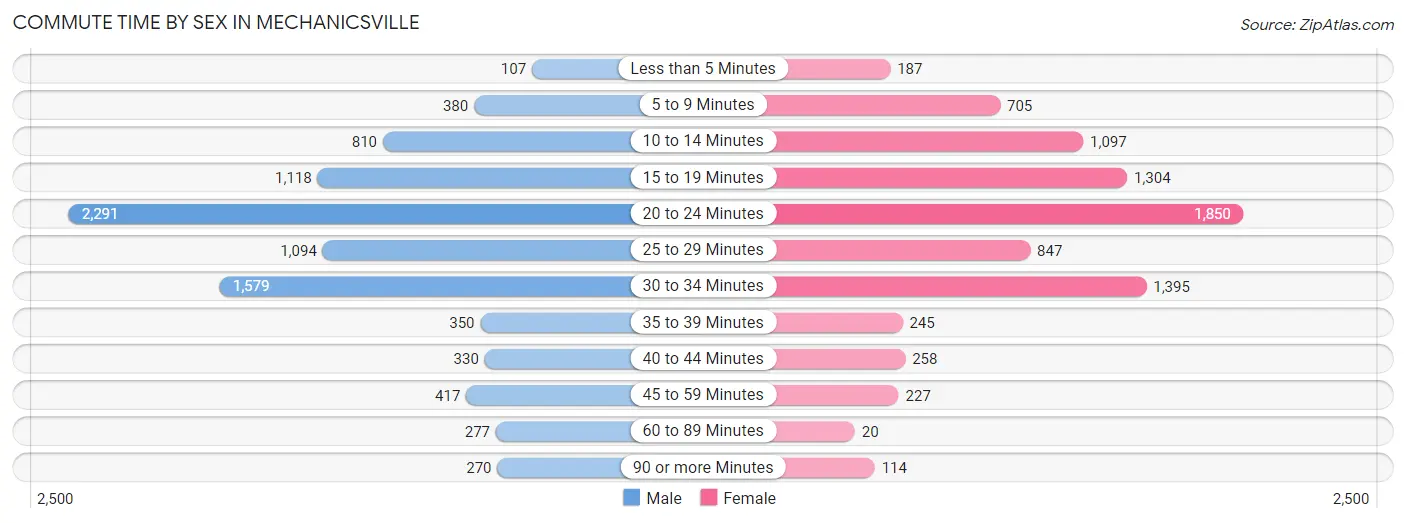
| Commute Time | Male | Female |
| Less than 5 Minutes | 107 (1.2%) | 187 (2.3%) |
| 5 to 9 Minutes | 380 (4.2%) | 705 (8.6%) |
| 10 to 14 Minutes | 810 (9.0%) | 1,097 (13.3%) |
| 15 to 19 Minutes | 1,118 (12.4%) | 1,304 (15.8%) |
| 20 to 24 Minutes | 2,291 (25.4%) | 1,850 (22.4%) |
| 25 to 29 Minutes | 1,094 (12.1%) | 847 (10.3%) |
| 30 to 34 Minutes | 1,579 (17.5%) | 1,395 (16.9%) |
| 35 to 39 Minutes | 350 (3.9%) | 245 (3.0%) |
| 40 to 44 Minutes | 330 (3.7%) | 258 (3.1%) |
| 45 to 59 Minutes | 417 (4.6%) | 227 (2.8%) |
| 60 to 89 Minutes | 277 (3.1%) | 20 (0.2%) |
| 90 or more Minutes | 270 (3.0%) | 114 (1.4%) |
Time of Departure to Work by Sex in Mechanicsville
The most frequent times of departure to work in Mechanicsville are 7:00 AM to 7:29 AM (1,492, 16.5%) for males and 7:30 AM to 7:59 AM (1,485, 18.0%) for females.
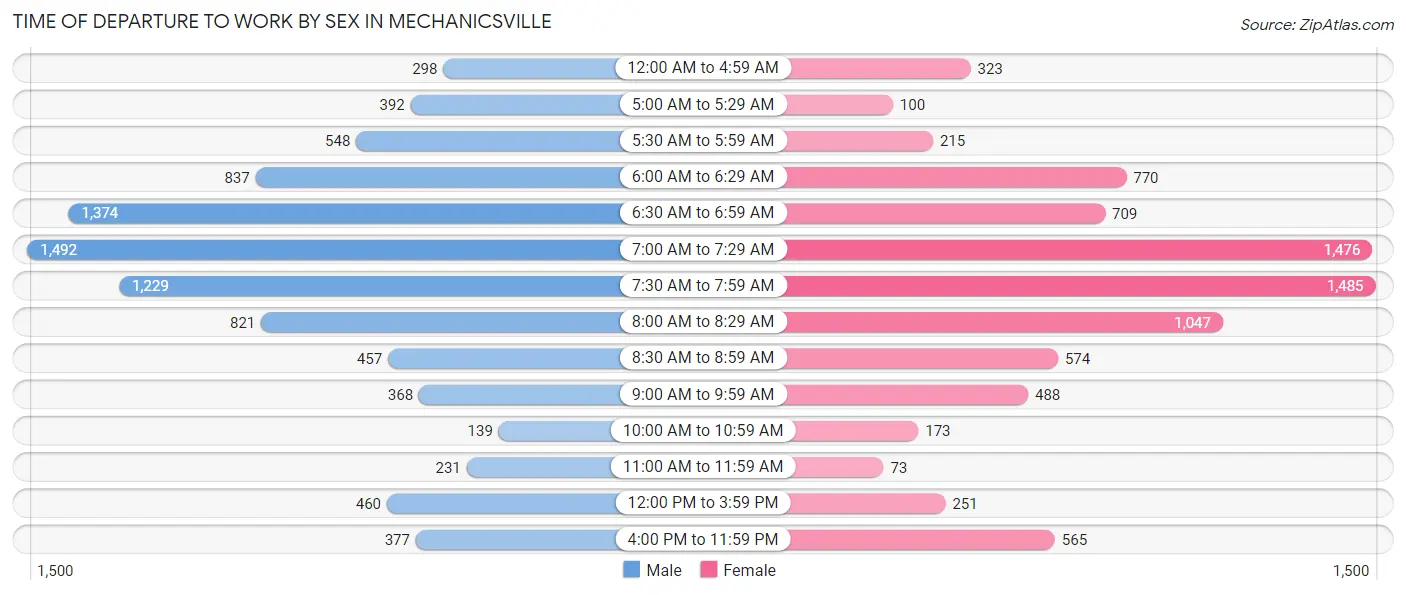
| Time of Departure | Male | Female |
| 12:00 AM to 4:59 AM | 298 (3.3%) | 323 (3.9%) |
| 5:00 AM to 5:29 AM | 392 (4.3%) | 100 (1.2%) |
| 5:30 AM to 5:59 AM | 548 (6.1%) | 215 (2.6%) |
| 6:00 AM to 6:29 AM | 837 (9.3%) | 770 (9.3%) |
| 6:30 AM to 6:59 AM | 1,374 (15.2%) | 709 (8.6%) |
| 7:00 AM to 7:29 AM | 1,492 (16.5%) | 1,476 (17.9%) |
| 7:30 AM to 7:59 AM | 1,229 (13.6%) | 1,485 (18.0%) |
| 8:00 AM to 8:29 AM | 821 (9.1%) | 1,047 (12.7%) |
| 8:30 AM to 8:59 AM | 457 (5.1%) | 574 (7.0%) |
| 9:00 AM to 9:59 AM | 368 (4.1%) | 488 (5.9%) |
| 10:00 AM to 10:59 AM | 139 (1.5%) | 173 (2.1%) |
| 11:00 AM to 11:59 AM | 231 (2.6%) | 73 (0.9%) |
| 12:00 PM to 3:59 PM | 460 (5.1%) | 251 (3.0%) |
| 4:00 PM to 11:59 PM | 377 (4.2%) | 565 (6.9%) |
| Total | 9,023 (100.0%) | 8,249 (100.0%) |
Housing Occupancy in Mechanicsville
Occupancy by Ownership in Mechanicsville
Of the total 15,041 dwellings in Mechanicsville, owner-occupied units account for 11,708 (77.8%), while renter-occupied units make up 3,333 (22.2%).
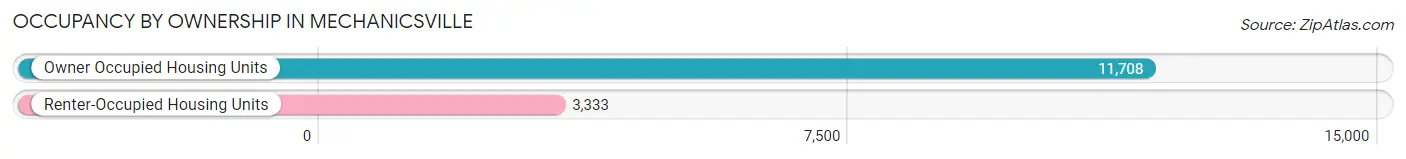
| Occupancy | # Housing Units | % Housing Units |
| Owner Occupied Housing Units | 11,708 | 77.8% |
| Renter-Occupied Housing Units | 3,333 | 22.2% |
| Total Occupied Housing Units | 15,041 | 100.0% |
Occupancy by Household Size in Mechanicsville
| Household Size | # Housing Units | % Housing Units |
| 1-Person Household | 4,083 | 27.2% |
| 2-Person Household | 5,451 | 36.2% |
| 3-Person Household | 2,374 | 15.8% |
| 4+ Person Household | 3,133 | 20.8% |
| Total Housing Units | 15,041 | 100.0% |
Occupancy by Ownership by Household Size in Mechanicsville
| Household Size | Owner-occupied | Renter-occupied |
| 1-Person Household | 2,672 (65.4%) | 1,411 (34.6%) |
| 2-Person Household | 4,589 (84.2%) | 862 (15.8%) |
| 3-Person Household | 1,870 (78.8%) | 504 (21.2%) |
| 4+ Person Household | 2,577 (82.3%) | 556 (17.7%) |
| Total Housing Units | 11,708 (77.8%) | 3,333 (22.2%) |
Occupancy by Educational Attainment in Mechanicsville
| Household Size | Owner-occupied | Renter-occupied |
| Less than High School | 521 (80.5%) | 126 (19.5%) |
| High School Diploma | 2,490 (69.7%) | 1,083 (30.3%) |
| College/Associate Degree | 3,725 (75.7%) | 1,195 (24.3%) |
| Bachelor's Degree or higher | 4,972 (84.3%) | 929 (15.7%) |
Occupancy by Age of Householder in Mechanicsville
| Age Bracket | # Households | % Households |
| Under 35 Years | 2,309 | 15.3% |
| 35 to 44 Years | 2,404 | 16.0% |
| 45 to 54 Years | 2,370 | 15.8% |
| 55 to 64 Years | 3,268 | 21.7% |
| 65 to 74 Years | 2,310 | 15.4% |
| 75 to 84 Years | 1,444 | 9.6% |
| 85 Years and Over | 936 | 6.2% |
| Total | 15,041 | 100.0% |
Housing Finances in Mechanicsville
Median Income by Occupancy in Mechanicsville
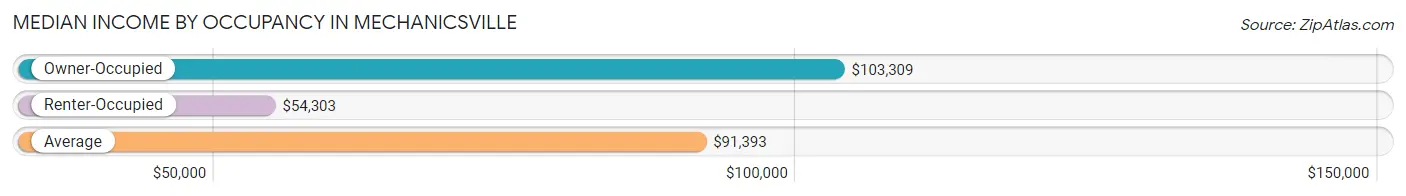
| Occupancy Type | # Households | Median Income |
| Owner-Occupied | 11,708 (77.8%) | $103,309 |
| Renter-Occupied | 3,333 (22.2%) | $54,303 |
| Average | 15,041 (100.0%) | $91,393 |
Occupancy by Householder Income Bracket in Mechanicsville
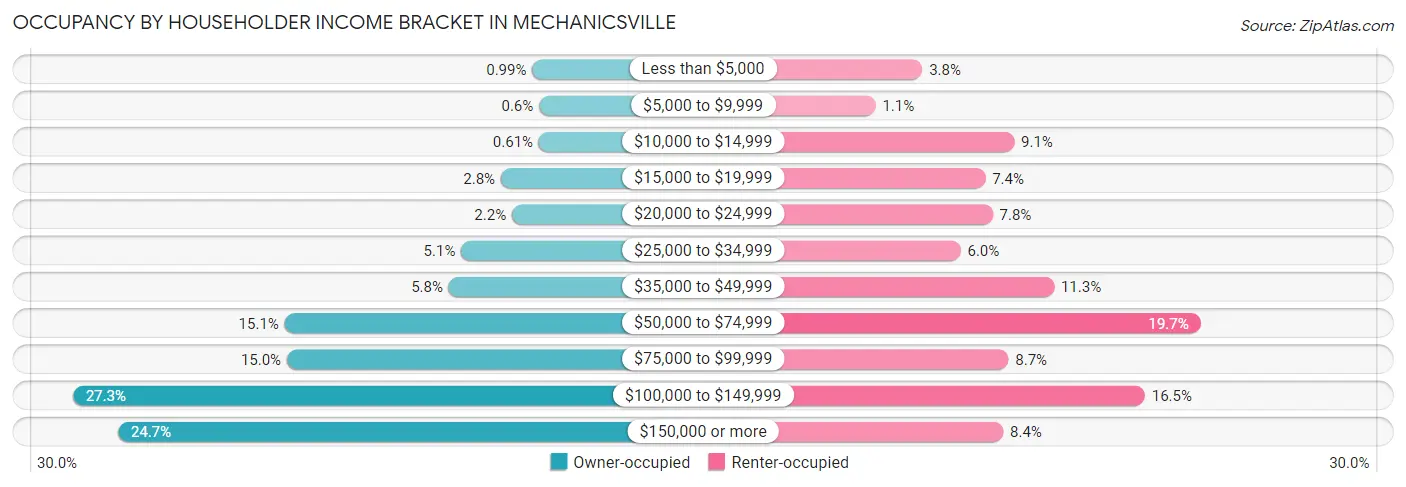
| Income Bracket | Owner-occupied | Renter-occupied |
| Less than $5,000 | 116 (1.0%) | 127 (3.8%) |
| $5,000 to $9,999 | 70 (0.6%) | 38 (1.1%) |
| $10,000 to $14,999 | 72 (0.6%) | 302 (9.1%) |
| $15,000 to $19,999 | 325 (2.8%) | 247 (7.4%) |
| $20,000 to $24,999 | 252 (2.1%) | 261 (7.8%) |
| $25,000 to $34,999 | 591 (5.1%) | 200 (6.0%) |
| $35,000 to $49,999 | 674 (5.8%) | 378 (11.3%) |
| $50,000 to $74,999 | 1,773 (15.1%) | 657 (19.7%) |
| $75,000 to $99,999 | 1,757 (15.0%) | 291 (8.7%) |
| $100,000 to $149,999 | 3,190 (27.3%) | 551 (16.5%) |
| $150,000 or more | 2,888 (24.7%) | 281 (8.4%) |
| Total | 11,708 (100.0%) | 3,333 (100.0%) |
Monthly Housing Cost Tiers in Mechanicsville
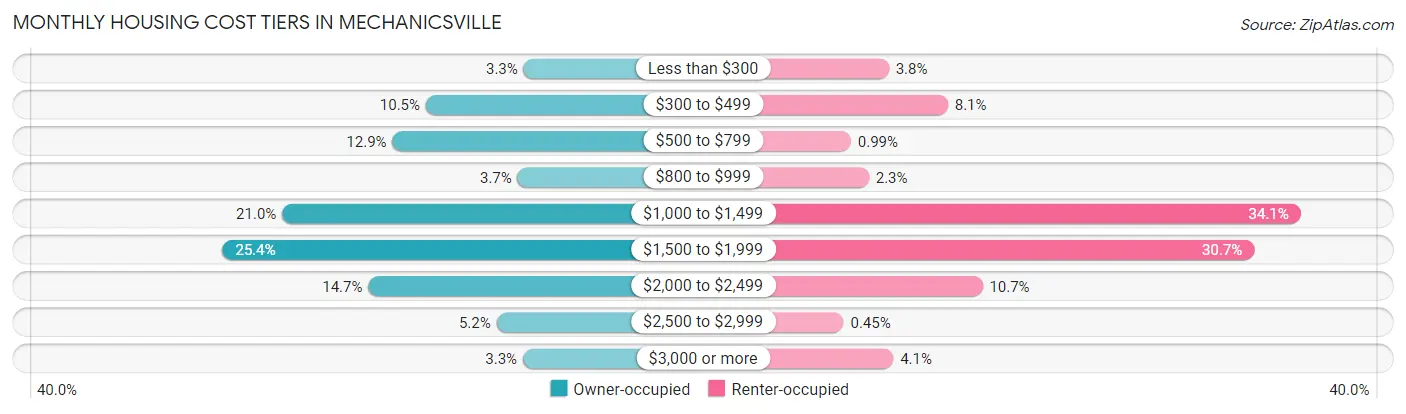
| Monthly Cost | Owner-occupied | Renter-occupied |
| Less than $300 | 381 (3.3%) | 126 (3.8%) |
| $300 to $499 | 1,223 (10.4%) | 271 (8.1%) |
| $500 to $799 | 1,512 (12.9%) | 33 (1.0%) |
| $800 to $999 | 432 (3.7%) | 77 (2.3%) |
| $1,000 to $1,499 | 2,462 (21.0%) | 1,137 (34.1%) |
| $1,500 to $1,999 | 2,978 (25.4%) | 1,023 (30.7%) |
| $2,000 to $2,499 | 1,720 (14.7%) | 356 (10.7%) |
| $2,500 to $2,999 | 614 (5.2%) | 15 (0.4%) |
| $3,000 or more | 386 (3.3%) | 137 (4.1%) |
| Total | 11,708 (100.0%) | 3,333 (100.0%) |
Physical Housing Characteristics in Mechanicsville
Housing Structures in Mechanicsville
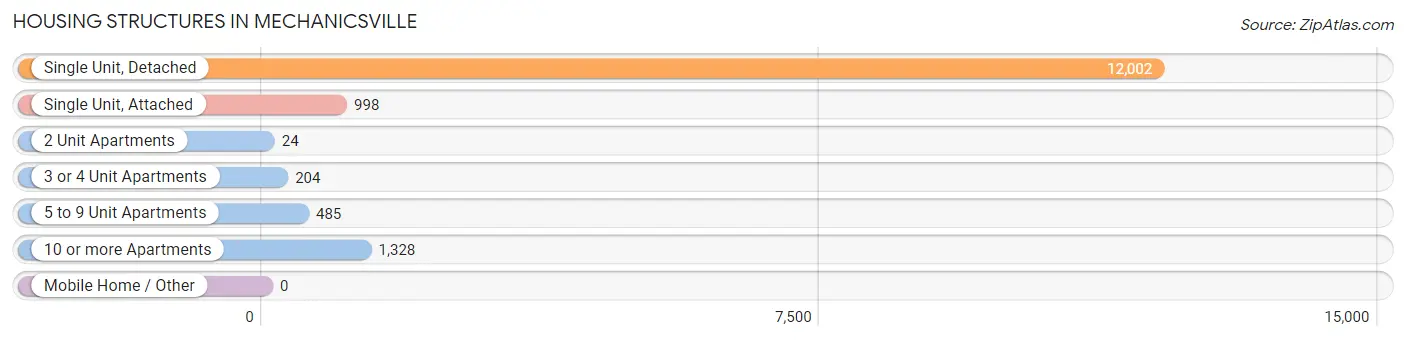
| Structure Type | # Housing Units | % Housing Units |
| Single Unit, Detached | 12,002 | 79.8% |
| Single Unit, Attached | 998 | 6.6% |
| 2 Unit Apartments | 24 | 0.2% |
| 3 or 4 Unit Apartments | 204 | 1.4% |
| 5 to 9 Unit Apartments | 485 | 3.2% |
| 10 or more Apartments | 1,328 | 8.8% |
| Mobile Home / Other | 0 | 0.0% |
| Total | 15,041 | 100.0% |
Housing Structures by Occupancy in Mechanicsville
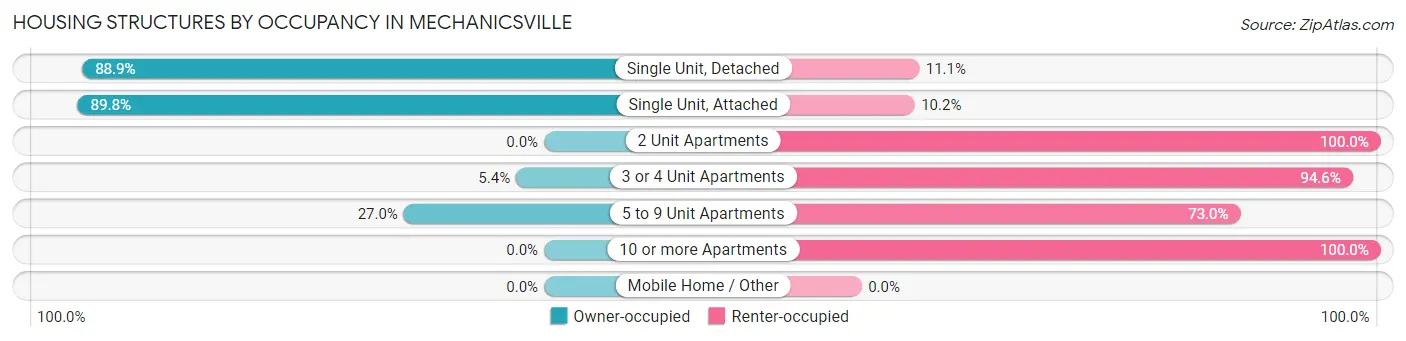
| Structure Type | Owner-occupied | Renter-occupied |
| Single Unit, Detached | 10,670 (88.9%) | 1,332 (11.1%) |
| Single Unit, Attached | 896 (89.8%) | 102 (10.2%) |
| 2 Unit Apartments | 0 (0.0%) | 24 (100.0%) |
| 3 or 4 Unit Apartments | 11 (5.4%) | 193 (94.6%) |
| 5 to 9 Unit Apartments | 131 (27.0%) | 354 (73.0%) |
| 10 or more Apartments | 0 (0.0%) | 1,328 (100.0%) |
| Mobile Home / Other | 0 (0.0%) | 0 (0.0%) |
| Total | 11,708 (77.8%) | 3,333 (22.2%) |
Housing Structures by Number of Rooms in Mechanicsville
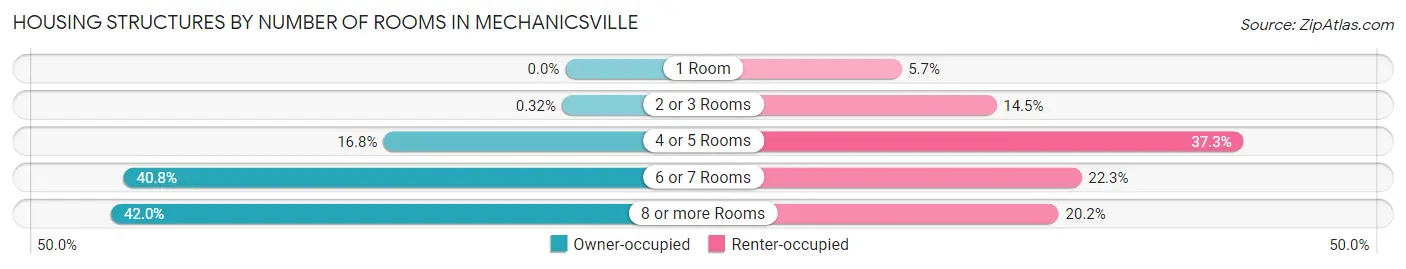
| Number of Rooms | Owner-occupied | Renter-occupied |
| 1 Room | 0 (0.0%) | 189 (5.7%) |
| 2 or 3 Rooms | 38 (0.3%) | 482 (14.5%) |
| 4 or 5 Rooms | 1,970 (16.8%) | 1,244 (37.3%) |
| 6 or 7 Rooms | 4,781 (40.8%) | 744 (22.3%) |
| 8 or more Rooms | 4,919 (42.0%) | 674 (20.2%) |
| Total | 11,708 (100.0%) | 3,333 (100.0%) |
Housing Structure by Heating Type in Mechanicsville
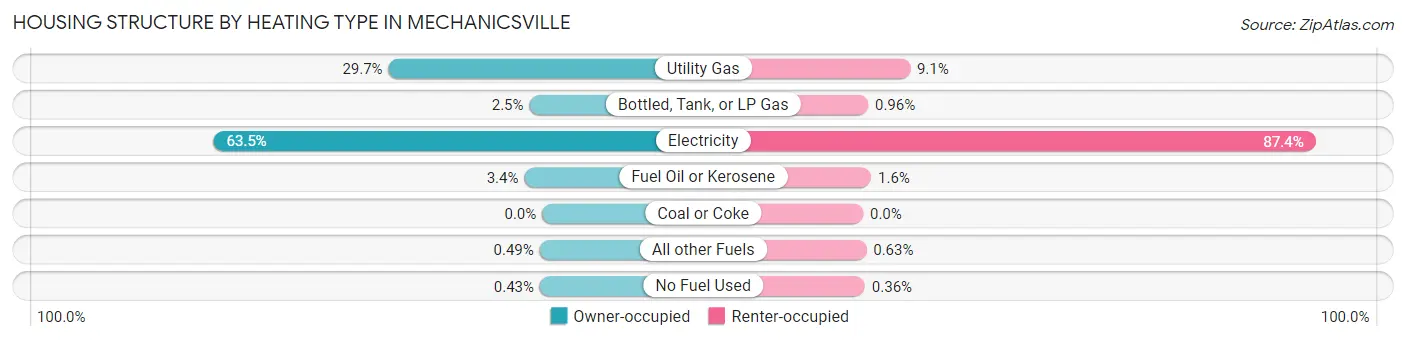
| Heating Type | Owner-occupied | Renter-occupied |
| Utility Gas | 3,476 (29.7%) | 302 (9.1%) |
| Bottled, Tank, or LP Gas | 288 (2.5%) | 32 (1.0%) |
| Electricity | 7,434 (63.5%) | 2,914 (87.4%) |
| Fuel Oil or Kerosene | 403 (3.4%) | 52 (1.6%) |
| Coal or Coke | 0 (0.0%) | 0 (0.0%) |
| All other Fuels | 57 (0.5%) | 21 (0.6%) |
| No Fuel Used | 50 (0.4%) | 12 (0.4%) |
| Total | 11,708 (100.0%) | 3,333 (100.0%) |
Household Vehicle Usage in Mechanicsville
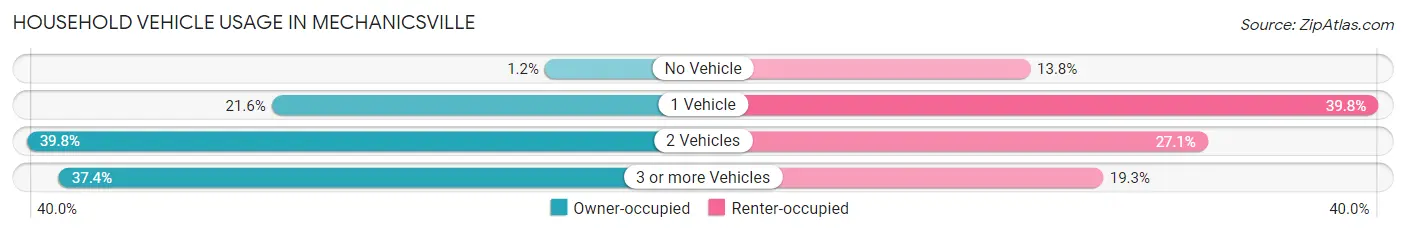
| Vehicles per Household | Owner-occupied | Renter-occupied |
| No Vehicle | 135 (1.1%) | 461 (13.8%) |
| 1 Vehicle | 2,524 (21.6%) | 1,327 (39.8%) |
| 2 Vehicles | 4,665 (39.8%) | 903 (27.1%) |
| 3 or more Vehicles | 4,384 (37.4%) | 642 (19.3%) |
| Total | 11,708 (100.0%) | 3,333 (100.0%) |
Real Estate & Mortgages in Mechanicsville
Real Estate and Mortgage Overview in Mechanicsville
| Characteristic | Without Mortgage | With Mortgage |
| Housing Units | 3,183 | 8,525 |
| Median Property Value | $293,100 | $301,000 |
| Median Household Income | $70,902 | $2,419 |
| Monthly Housing Costs | $503 | $378 |
| Real Estate Taxes | $2,204 | $187 |
Property Value by Mortgage Status in Mechanicsville
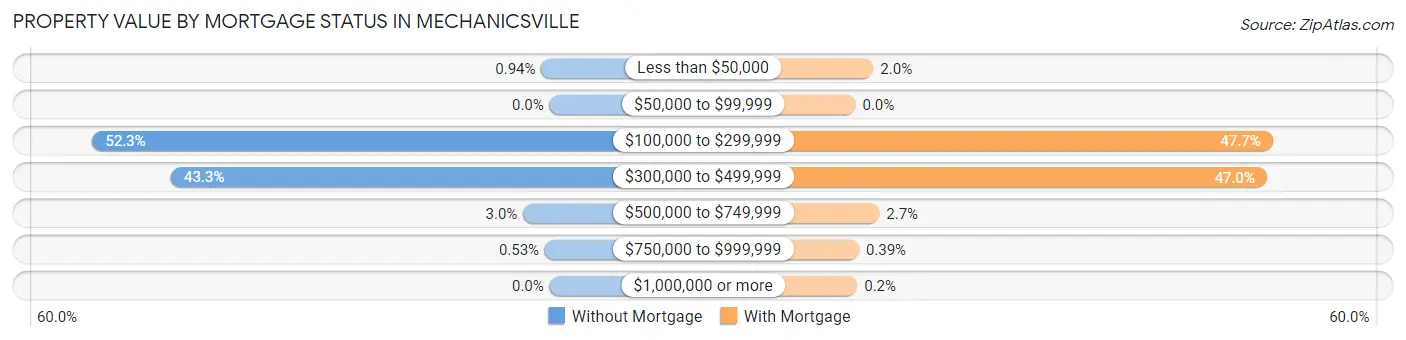
| Property Value | Without Mortgage | With Mortgage |
| Less than $50,000 | 30 (0.9%) | 174 (2.0%) |
| $50,000 to $99,999 | 0 (0.0%) | 0 (0.0%) |
| $100,000 to $299,999 | 1,663 (52.2%) | 4,063 (47.7%) |
| $300,000 to $499,999 | 1,377 (43.3%) | 4,006 (47.0%) |
| $500,000 to $749,999 | 96 (3.0%) | 232 (2.7%) |
| $750,000 to $999,999 | 17 (0.5%) | 33 (0.4%) |
| $1,000,000 or more | 0 (0.0%) | 17 (0.2%) |
| Total | 3,183 (100.0%) | 8,525 (100.0%) |
Household Income by Mortgage Status in Mechanicsville
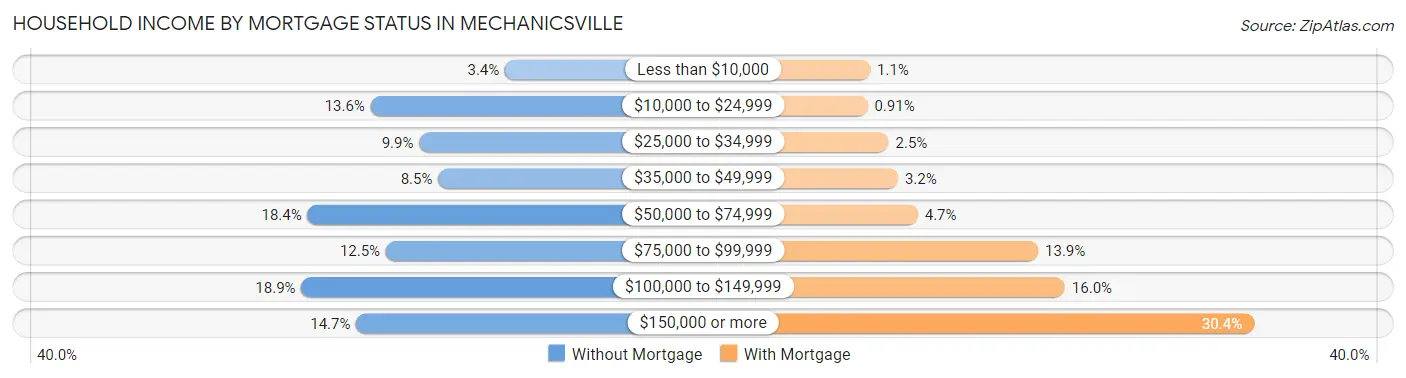
| Household Income | Without Mortgage | With Mortgage |
| Less than $10,000 | 108 (3.4%) | 95 (1.1%) |
| $10,000 to $24,999 | 434 (13.6%) | 78 (0.9%) |
| $25,000 to $34,999 | 316 (9.9%) | 215 (2.5%) |
| $35,000 to $49,999 | 270 (8.5%) | 275 (3.2%) |
| $50,000 to $74,999 | 587 (18.4%) | 404 (4.7%) |
| $75,000 to $99,999 | 397 (12.5%) | 1,186 (13.9%) |
| $100,000 to $149,999 | 602 (18.9%) | 1,360 (16.0%) |
| $150,000 or more | 469 (14.7%) | 2,588 (30.4%) |
| Total | 3,183 (100.0%) | 8,525 (100.0%) |
Property Value to Household Income Ratio in Mechanicsville
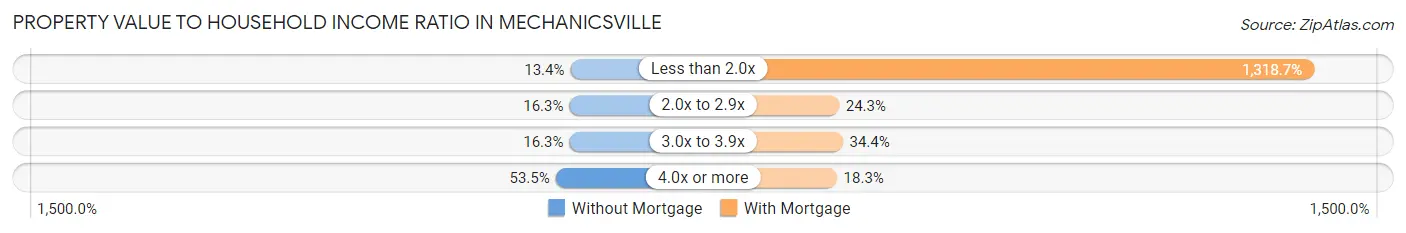
| Value-to-Income Ratio | Without Mortgage | With Mortgage |
| Less than 2.0x | 426 (13.4%) | 112,420 (1,318.7%) |
| 2.0x to 2.9x | 518 (16.3%) | 2,067 (24.2%) |
| 3.0x to 3.9x | 518 (16.3%) | 2,928 (34.4%) |
| 4.0x or more | 1,704 (53.5%) | 1,562 (18.3%) |
| Total | 3,183 (100.0%) | 8,525 (100.0%) |
Real Estate Taxes by Mortgage Status in Mechanicsville
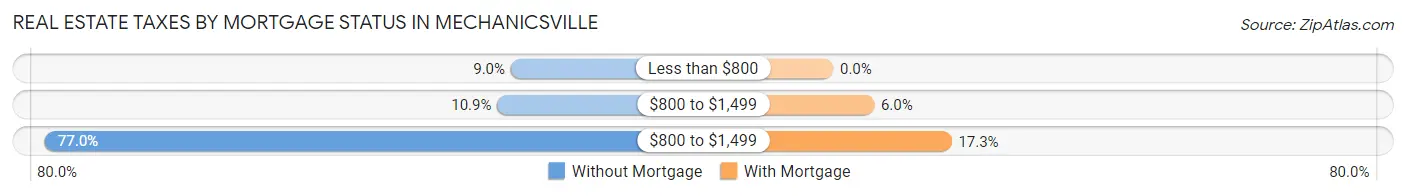
| Property Taxes | Without Mortgage | With Mortgage |
| Less than $800 | 285 (8.9%) | 0 (0.0%) |
| $800 to $1,499 | 348 (10.9%) | 510 (6.0%) |
| $800 to $1,499 | 2,452 (77.0%) | 1,475 (17.3%) |
| Total | 3,183 (100.0%) | 8,525 (100.0%) |
Health & Disability in Mechanicsville
Health Insurance Coverage by Age in Mechanicsville
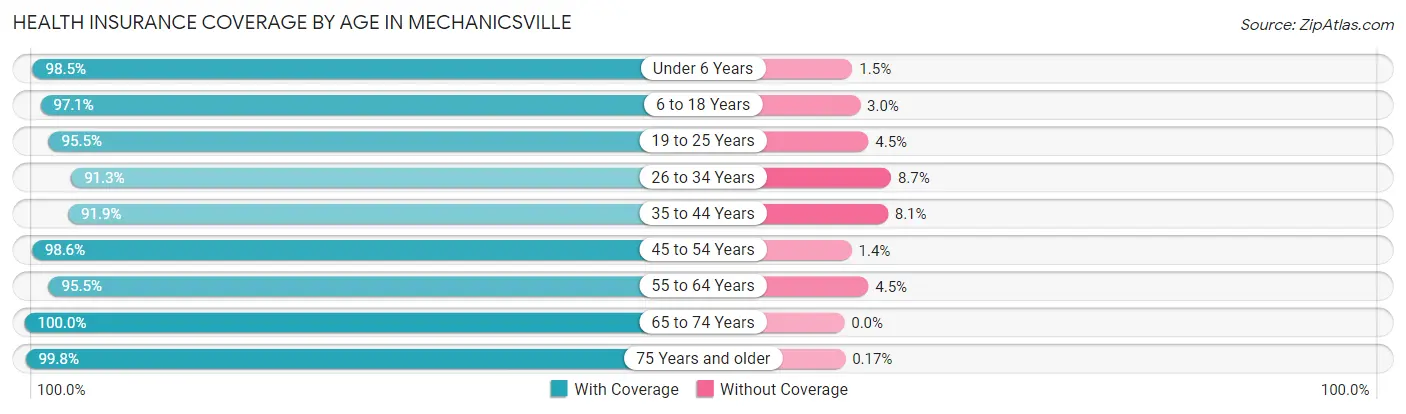
| Age Bracket | With Coverage | Without Coverage |
| Under 6 Years | 2,355 (98.5%) | 36 (1.5%) |
| 6 to 18 Years | 6,781 (97.1%) | 206 (2.9%) |
| 19 to 25 Years | 2,576 (95.5%) | 121 (4.5%) |
| 26 to 34 Years | 3,599 (91.3%) | 343 (8.7%) |
| 35 to 44 Years | 4,405 (91.9%) | 389 (8.1%) |
| 45 to 54 Years | 4,706 (98.6%) | 65 (1.4%) |
| 55 to 64 Years | 5,130 (95.5%) | 241 (4.5%) |
| 65 to 74 Years | 3,665 (100.0%) | 0 (0.0%) |
| 75 Years and older | 3,465 (99.8%) | 6 (0.2%) |
| Total | 36,682 (96.3%) | 1,407 (3.7%) |
Health Insurance Coverage by Citizenship Status in Mechanicsville
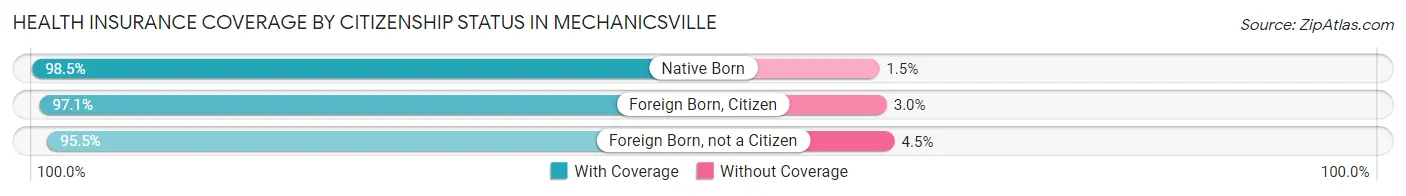
| Citizenship Status | With Coverage | Without Coverage |
| Native Born | 2,355 (98.5%) | 36 (1.5%) |
| Foreign Born, Citizen | 6,781 (97.1%) | 206 (2.9%) |
| Foreign Born, not a Citizen | 2,576 (95.5%) | 121 (4.5%) |
Health Insurance Coverage by Household Income in Mechanicsville
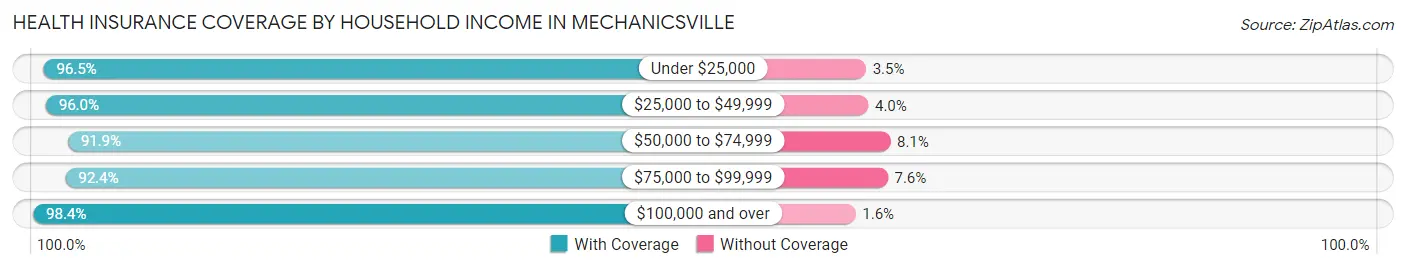
| Household Income | With Coverage | Without Coverage |
| Under $25,000 | 2,423 (96.5%) | 89 (3.5%) |
| $25,000 to $49,999 | 2,922 (96.0%) | 121 (4.0%) |
| $50,000 to $74,999 | 5,354 (91.9%) | 472 (8.1%) |
| $75,000 to $99,999 | 4,443 (92.4%) | 367 (7.6%) |
| $100,000 and over | 21,475 (98.4%) | 349 (1.6%) |
Public vs Private Health Insurance Coverage by Age in Mechanicsville
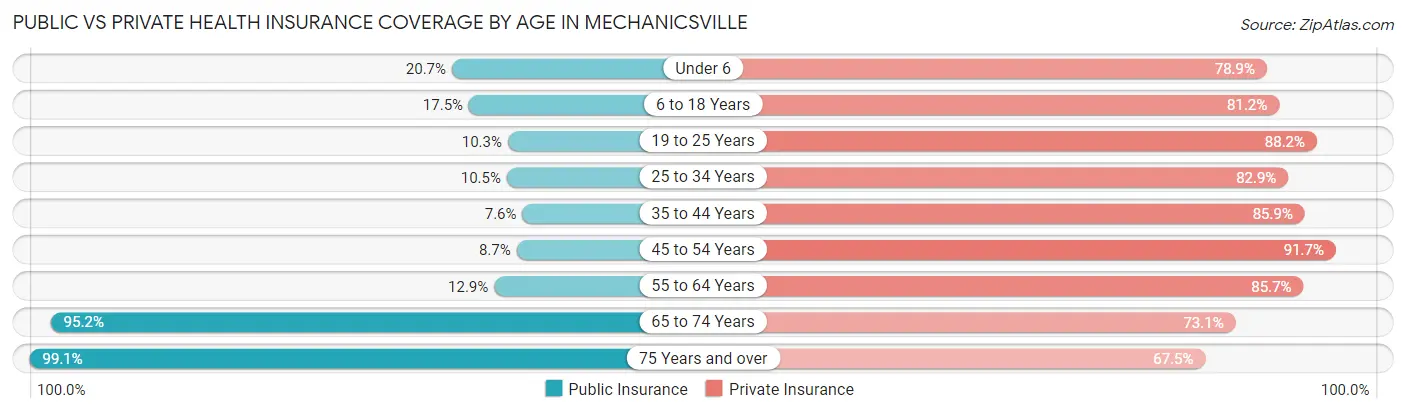
| Age Bracket | Public Insurance | Private Insurance |
| Under 6 | 495 (20.7%) | 1,886 (78.9%) |
| 6 to 18 Years | 1,225 (17.5%) | 5,671 (81.2%) |
| 19 to 25 Years | 278 (10.3%) | 2,378 (88.2%) |
| 25 to 34 Years | 414 (10.5%) | 3,266 (82.9%) |
| 35 to 44 Years | 365 (7.6%) | 4,119 (85.9%) |
| 45 to 54 Years | 414 (8.7%) | 4,374 (91.7%) |
| 55 to 64 Years | 690 (12.9%) | 4,602 (85.7%) |
| 65 to 74 Years | 3,488 (95.2%) | 2,678 (73.1%) |
| 75 Years and over | 3,440 (99.1%) | 2,342 (67.5%) |
| Total | 10,809 (28.4%) | 31,316 (82.2%) |
Disability Status by Sex by Age in Mechanicsville
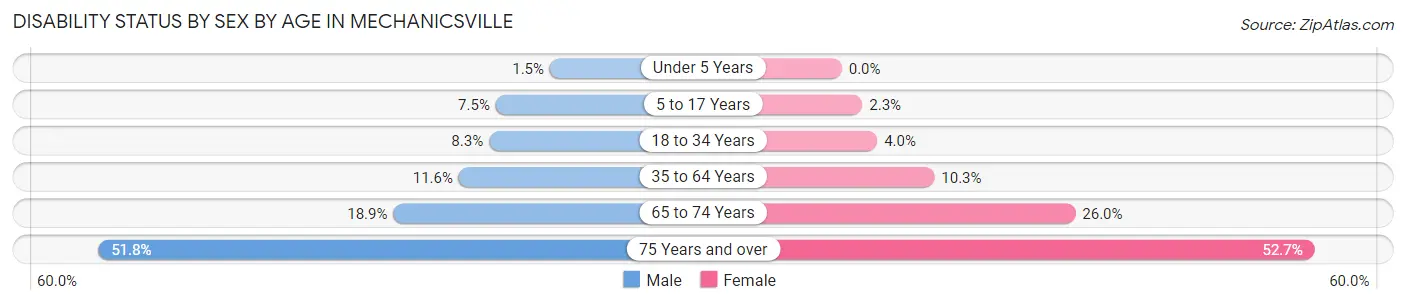
| Age Bracket | Male | Female |
| Under 5 Years | 16 (1.5%) | 0 (0.0%) |
| 5 to 17 Years | 256 (7.5%) | 77 (2.3%) |
| 18 to 34 Years | 309 (8.3%) | 142 (4.0%) |
| 35 to 64 Years | 829 (11.6%) | 806 (10.3%) |
| 65 to 74 Years | 325 (18.9%) | 507 (26.0%) |
| 75 Years and over | 704 (51.8%) | 1,112 (52.6%) |
Disability Class by Sex by Age in Mechanicsville
Disability Class: Hearing Difficulty
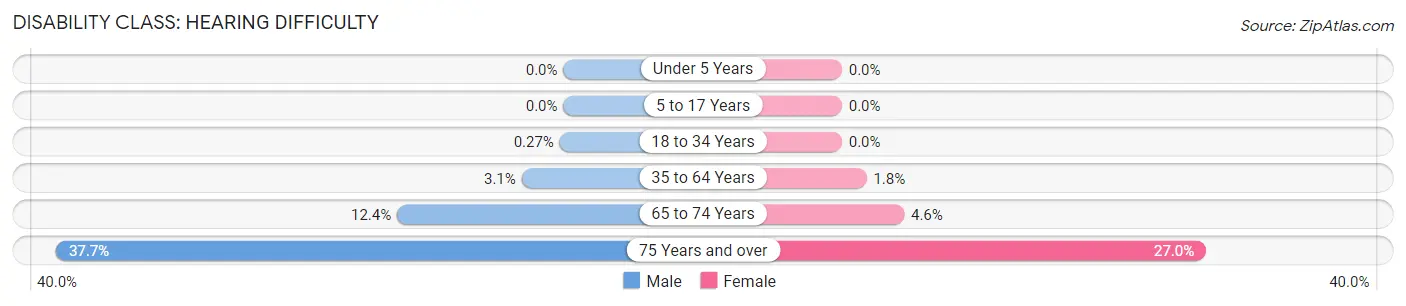
| Age Bracket | Male | Female |
| Under 5 Years | 0 (0.0%) | 0 (0.0%) |
| 5 to 17 Years | 0 (0.0%) | 0 (0.0%) |
| 18 to 34 Years | 10 (0.3%) | 0 (0.0%) |
| 35 to 64 Years | 221 (3.1%) | 143 (1.8%) |
| 65 to 74 Years | 212 (12.3%) | 90 (4.6%) |
| 75 Years and over | 512 (37.7%) | 571 (27.0%) |
Disability Class: Vision Difficulty
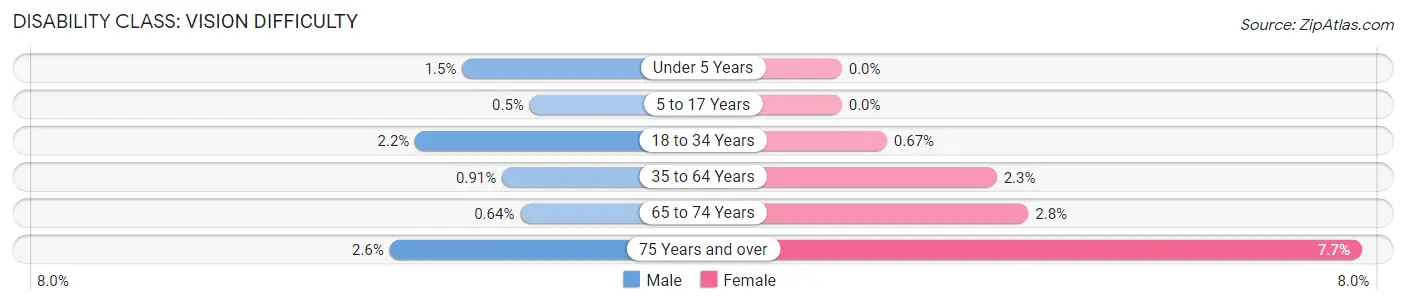
| Age Bracket | Male | Female |
| Under 5 Years | 16 (1.5%) | 0 (0.0%) |
| 5 to 17 Years | 17 (0.5%) | 0 (0.0%) |
| 18 to 34 Years | 82 (2.2%) | 24 (0.7%) |
| 35 to 64 Years | 65 (0.9%) | 180 (2.3%) |
| 65 to 74 Years | 11 (0.6%) | 54 (2.8%) |
| 75 Years and over | 35 (2.6%) | 163 (7.7%) |
Disability Class: Cognitive Difficulty
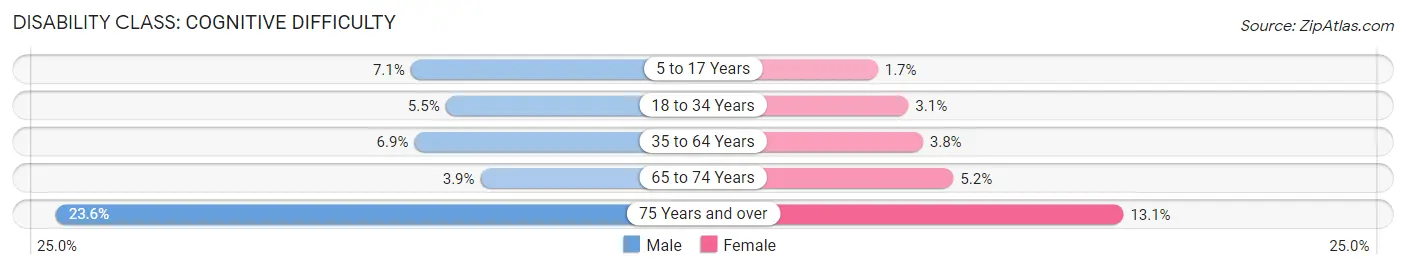
| Age Bracket | Male | Female |
| 5 to 17 Years | 241 (7.1%) | 56 (1.7%) |
| 18 to 34 Years | 204 (5.5%) | 111 (3.1%) |
| 35 to 64 Years | 493 (6.9%) | 294 (3.8%) |
| 65 to 74 Years | 66 (3.8%) | 101 (5.2%) |
| 75 Years and over | 320 (23.5%) | 276 (13.1%) |
Disability Class: Ambulatory Difficulty
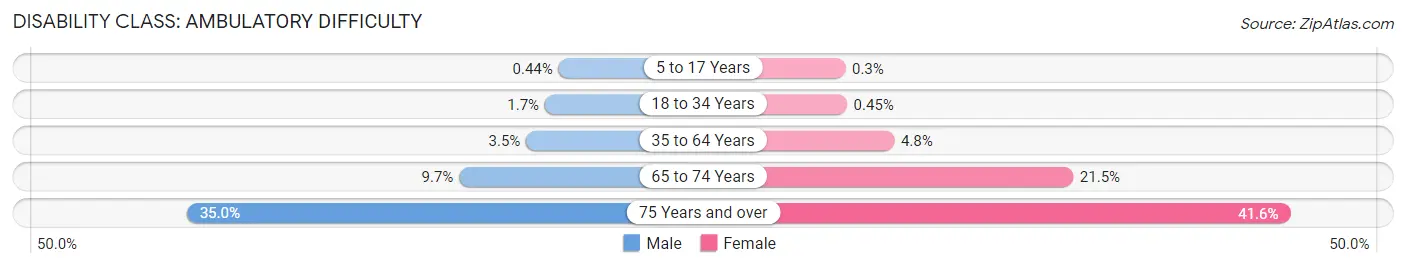
| Age Bracket | Male | Female |
| 5 to 17 Years | 15 (0.4%) | 10 (0.3%) |
| 18 to 34 Years | 64 (1.7%) | 16 (0.4%) |
| 35 to 64 Years | 246 (3.5%) | 378 (4.8%) |
| 65 to 74 Years | 166 (9.7%) | 418 (21.4%) |
| 75 Years and over | 475 (34.9%) | 879 (41.6%) |
Disability Class: Self-Care Difficulty
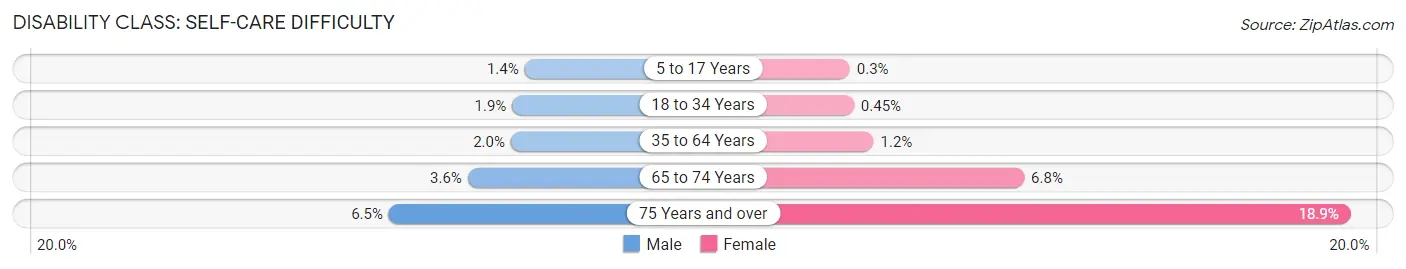
| Age Bracket | Male | Female |
| 5 to 17 Years | 49 (1.4%) | 10 (0.3%) |
| 18 to 34 Years | 71 (1.9%) | 16 (0.4%) |
| 35 to 64 Years | 139 (1.9%) | 92 (1.2%) |
| 65 to 74 Years | 61 (3.5%) | 132 (6.8%) |
| 75 Years and over | 88 (6.5%) | 399 (18.9%) |
Technology Access in Mechanicsville
Computing Device Access in Mechanicsville
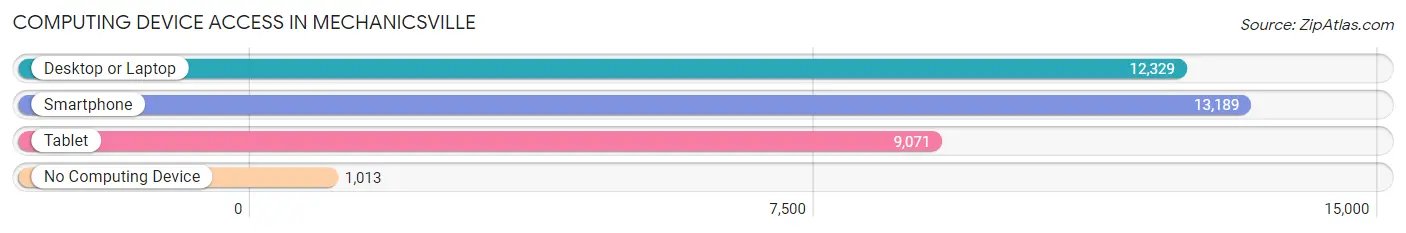
| Device Type | # Households | % Households |
| Desktop or Laptop | 12,329 | 82.0% |
| Smartphone | 13,189 | 87.7% |
| Tablet | 9,071 | 60.3% |
| No Computing Device | 1,013 | 6.7% |
| Total | 15,041 | 100.0% |
Internet Access in Mechanicsville
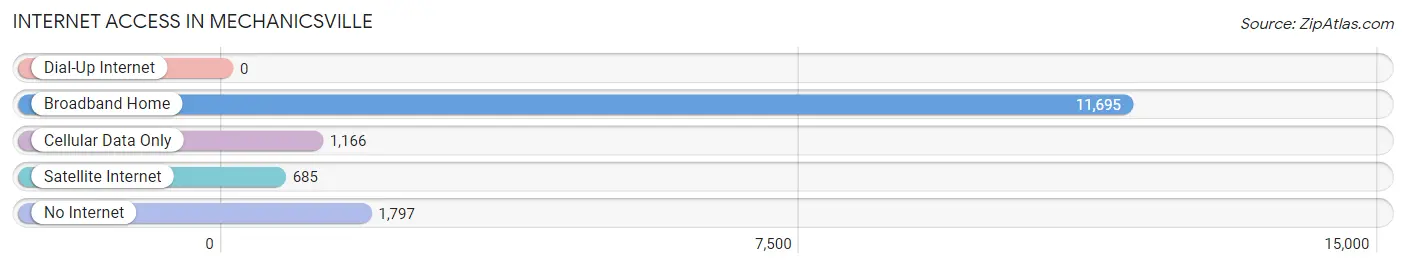
| Internet Type | # Households | % Households |
| Dial-Up Internet | 0 | 0.0% |
| Broadband Home | 11,695 | 77.7% |
| Cellular Data Only | 1,166 | 7.7% |
| Satellite Internet | 685 | 4.5% |
| No Internet | 1,797 | 11.9% |
| Total | 15,041 | 100.0% |
Mechanicsville Summary
Mechanicsville is a census-designated place (CDP) located in Hanover County, Virginia, United States. The population was 36,348 at the 2010 census. It is located approximately 20 miles north of Richmond, the state capital.
History
The area now known as Mechanicsville was first settled in the early 1700s by English colonists. The area was originally known as “Mechanicsville” due to the large number of mechanics and artisans who lived and worked in the area. The area was also home to a large number of tobacco plantations, which were the main source of income for the area.
In the early 1800s, Mechanicsville became a major transportation hub, with the Richmond and Danville Railroad passing through the area. This allowed for the easy transportation of goods and people to and from the area.
In the late 1800s, Mechanicsville began to experience rapid growth due to the development of the Richmond and Danville Railroad. This allowed for the easy transportation of goods and people to and from the area.
In the early 1900s, Mechanicsville experienced a period of industrialization, with the development of several factories and mills. This period of growth was short-lived, however, as the Great Depression hit the area hard.
Geography
Mechanicsville is located at 37°37′N 77°25′W (37.619, -77.417). According to the United States Census Bureau, the CDP has a total area of 11.2 square miles (29.0 km2), of which 11.1 square miles (28.7 km2) is land and 0.1 square miles (0.3 km2) (0.72%) is water.
Economy
Mechanicsville’s economy is largely based on the service industry, with many businesses providing services to the local population. The area is also home to several large retail stores, including Walmart, Target, and Home Depot.
The area is also home to several large industrial parks, which provide employment opportunities for many of the area’s residents. The largest of these is the Hanover Industrial Park, which is home to several large companies, including Siemens, Honeywell, and Lockheed Martin.
Demographics
As of the 2010 census, there were 36,348 people, 13,845 households, and 9,845 families residing in the CDP. The population density was 3,258.3 people per square mile (1,255.7/km2). There were 14,845 housing units at an average density of 1,334.2/sq mi (515.3/km2). The racial makeup of the CDP was 79.2% White, 14.3% African American, 0.3% Native American, 2.2% Asian, 0.1% Pacific Islander, 1.7% from other races, and 2.4% from two or more races. Hispanic or Latino of any race were 4.2% of the population.
There were 13,845 households, out of which 33.2% had children under the age of 18 living with them, 51.2% were married couples living together, 13.2% had a female householder with no husband present, and 30.7% were non-families. 24.7% of all households were made up of individuals, and 8.2% had someone living alone who was 65 years of age or older. The average household size was 2.60 and the average family size was 3.09.
In the CDP, the population was spread out, with 25.2% under the age of 18, 7.2% from 18 to 24, 30.2% from 25 to 44, 24.2% from 45 to 64, and 13.2% who were 65 years of age or older. The median age was 37 years. For every 100 females, there were 93.2 males. For every 100 females age 18 and over, there were 89.7 males.
The median income for a household in the CDP was $50,945, and the median income for a family was $59,945. Males had a median income of $41,945 versus $30,945 for females. The per capita income for the CDP was $23,945. About 5.2% of families and 7.2% of the population were below the poverty line, including 8.2% of those under age 18 and 8.2% of those age 65 or over.
Common Questions
What is Per Capita Income in Mechanicsville?
Per Capita income in Mechanicsville is $41,706.
What is the Median Family Income in Mechanicsville?
Median Family Income in Mechanicsville is $112,143.
What is the Median Household income in Mechanicsville?
Median Household Income in Mechanicsville is $91,393.
What is Income or Wage Gap in Mechanicsville?
Income or Wage Gap in Mechanicsville is 18.1%.
Women in Mechanicsville earn 81.9 cents for every dollar earned by a man.
What is Family Income Deficit in Mechanicsville?
Family Income Deficit in Mechanicsville is $8,868.
Families that are below poverty line in Mechanicsville earn $8,868 less on average than the poverty threshold level.
What is Inequality or Gini Index in Mechanicsville?
Inequality or Gini Index in Mechanicsville is 0.38.
What is the Total Population of Mechanicsville?
Total Population of Mechanicsville is 38,328.
What is the Total Male Population of Mechanicsville?
Total Male Population of Mechanicsville is 18,474.
What is the Total Female Population of Mechanicsville?
Total Female Population of Mechanicsville is 19,854.
What is the Ratio of Males per 100 Females in Mechanicsville?
There are 93.05 Males per 100 Females in Mechanicsville.
What is the Ratio of Females per 100 Males in Mechanicsville?
There are 107.47 Females per 100 Males in Mechanicsville.
What is the Median Population Age in Mechanicsville?
Median Population Age in Mechanicsville is 41.7 Years.
What is the Average Family Size in Mechanicsville
Average Family Size in Mechanicsville is 3.1 People.
What is the Average Household Size in Mechanicsville
Average Household Size in Mechanicsville is 2.5 People.
How Large is the Labor Force in Mechanicsville?
There are 20,729 People in the Labor Forcein in Mechanicsville.
What is the Percentage of People in the Labor Force in Mechanicsville?
67.2% of People are in the Labor Force in Mechanicsville.
What is the Unemployment Rate in Mechanicsville?
Unemployment Rate in Mechanicsville is 2.0%.