Cities with the Most Immigrants from Nigeria in Georgia
RELATED REPORTS & OPTIONS
Nigeria
Georgia
Compare Cities
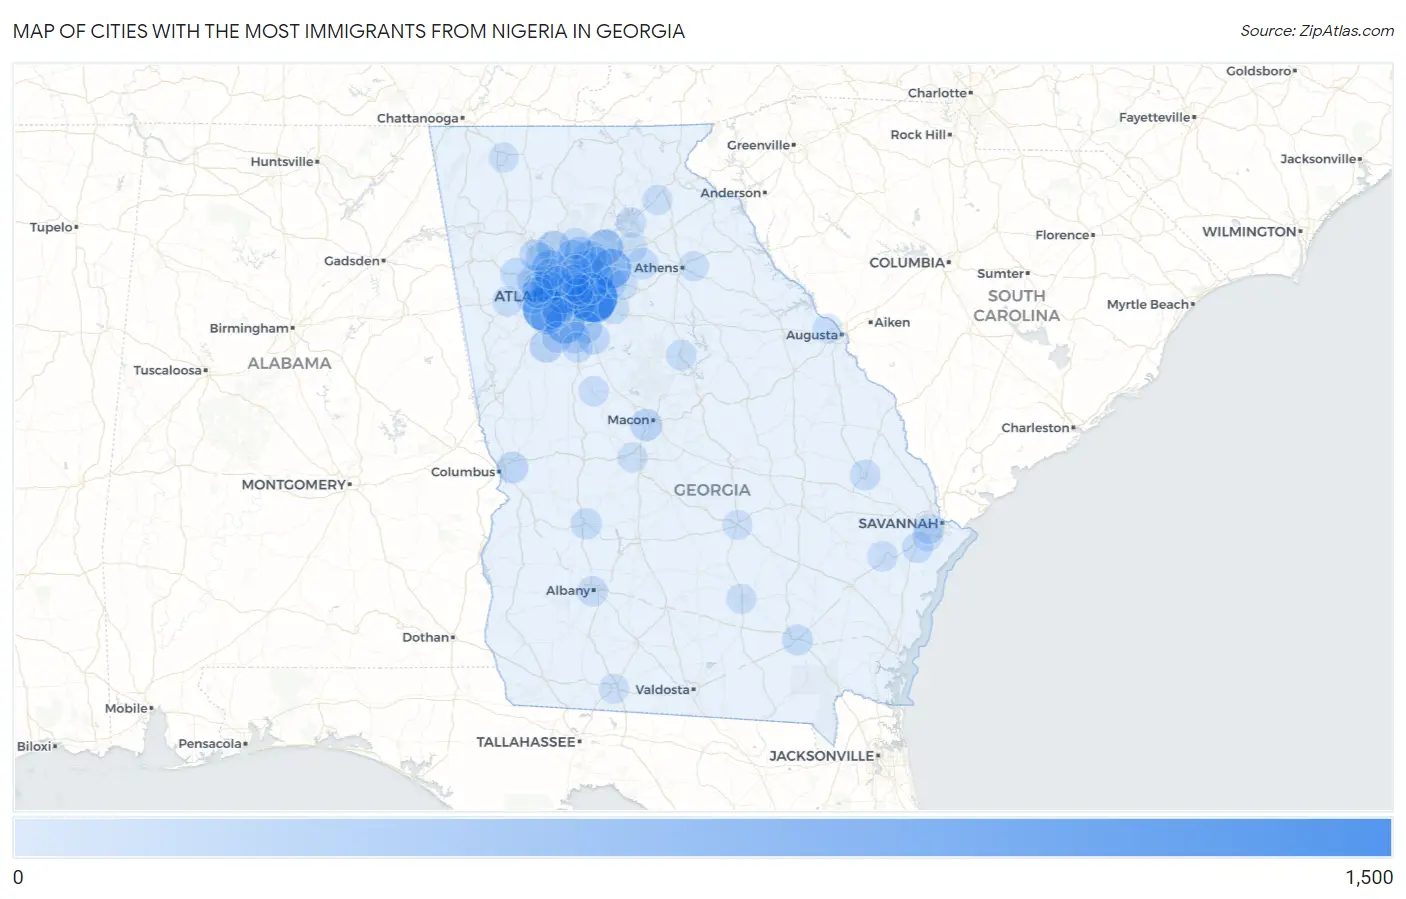
Map of Cities with the Most Immigrants from Nigeria in Georgia
0
1,500
Cities with the Most Immigrants from Nigeria in Georgia
| City | Nigeria | vs State | vs National | |
| 1. | Redan | 1,473 | 27,846(5.29%)#1 | 416,418(0.35%)#28 |
| 2. | South Fulton | 1,088 | 27,846(3.91%)#2 | 416,418(0.26%)#40 |
| 3. | Lawrenceville | 711 | 27,846(2.55%)#3 | 416,418(0.17%)#75 |
| 4. | Riverdale | 674 | 27,846(2.42%)#4 | 416,418(0.16%)#81 |
| 5. | Atlanta | 645 | 27,846(2.32%)#5 | 416,418(0.15%)#86 |
| 6. | Marietta | 503 | 27,846(1.81%)#6 | 416,418(0.12%)#123 |
| 7. | Smyrna | 484 | 27,846(1.74%)#7 | 416,418(0.12%)#129 |
| 8. | Sugar Hill | 444 | 27,846(1.59%)#8 | 416,418(0.11%)#144 |
| 9. | Stonecrest | 429 | 27,846(1.54%)#9 | 416,418(0.10%)#146 |
| 10. | Lilburn | 366 | 27,846(1.31%)#10 | 416,418(0.09%)#168 |
| 11. | Johns Creek | 281 | 27,846(1.01%)#11 | 416,418(0.07%)#220 |
| 12. | Sandy Springs | 270 | 27,846(0.97%)#12 | 416,418(0.06%)#228 |
| 13. | Peachtree Corners | 269 | 27,846(0.97%)#13 | 416,418(0.06%)#230 |
| 14. | Athens-Clarke County Unified Government (Balance) | 252 | 27,846(0.90%)#14 | 416,418(0.06%)#245 |
| 15. | Mableton | 252 | 27,846(0.90%)#15 | 416,418(0.06%)#246 |
| 16. | Woodstock | 248 | 27,846(0.89%)#16 | 416,418(0.06%)#247 |
| 17. | Peachtree City | 200 | 27,846(0.72%)#17 | 416,418(0.05%)#318 |
| 18. | Roswell | 198 | 27,846(0.71%)#18 | 416,418(0.05%)#322 |
| 19. | Powder Springs | 182 | 27,846(0.65%)#19 | 416,418(0.04%)#351 |
| 20. | Chamblee | 172 | 27,846(0.62%)#20 | 416,418(0.04%)#366 |
| 21. | Panthersville | 164 | 27,846(0.59%)#21 | 416,418(0.04%)#390 |
| 22. | East Point | 161 | 27,846(0.58%)#22 | 416,418(0.04%)#395 |
| 23. | Macon Bibb County | 159 | 27,846(0.57%)#23 | 416,418(0.04%)#399 |
| 24. | Austell | 158 | 27,846(0.57%)#24 | 416,418(0.04%)#403 |
| 25. | Douglasville | 145 | 27,846(0.52%)#25 | 416,418(0.03%)#438 |
| 26. | Union City | 130 | 27,846(0.47%)#26 | 416,418(0.03%)#474 |
| 27. | Columbus | 128 | 27,846(0.46%)#27 | 416,418(0.03%)#477 |
| 28. | Duluth | 127 | 27,846(0.46%)#28 | 416,418(0.03%)#481 |
| 29. | Alpharetta | 122 | 27,846(0.44%)#29 | 416,418(0.03%)#502 |
| 30. | Kennesaw | 113 | 27,846(0.41%)#30 | 416,418(0.03%)#542 |
| 31. | Mcdonough | 113 | 27,846(0.41%)#31 | 416,418(0.03%)#543 |
| 32. | Dallas | 109 | 27,846(0.39%)#32 | 416,418(0.03%)#563 |
| 33. | Stockbridge | 106 | 27,846(0.38%)#33 | 416,418(0.03%)#572 |
| 34. | Milton | 105 | 27,846(0.38%)#34 | 416,418(0.03%)#577 |
| 35. | Lovejoy | 105 | 27,846(0.38%)#35 | 416,418(0.03%)#581 |
| 36. | Acworth | 100 | 27,846(0.36%)#36 | 416,418(0.02%)#600 |
| 37. | Winder | 85 | 27,846(0.31%)#37 | 416,418(0.02%)#662 |
| 38. | Lithia Springs | 83 | 27,846(0.30%)#38 | 416,418(0.02%)#675 |
| 39. | North Decatur | 75 | 27,846(0.27%)#39 | 416,418(0.02%)#717 |
| 40. | Augusta-Richmond County Consolidated Government (Balance) | 72 | 27,846(0.26%)#40 | 416,418(0.02%)#736 |
| 41. | Snellville | 69 | 27,846(0.25%)#41 | 416,418(0.02%)#762 |
| 42. | Waycross | 68 | 27,846(0.24%)#42 | 416,418(0.02%)#772 |
| 43. | Americus | 67 | 27,846(0.24%)#43 | 416,418(0.02%)#782 |
| 44. | Richmond Hill | 66 | 27,846(0.24%)#44 | 416,418(0.02%)#788 |
| 45. | Scottdale | 65 | 27,846(0.23%)#45 | 416,418(0.02%)#796 |
| 46. | North Druid Hills | 60 | 27,846(0.22%)#46 | 416,418(0.01%)#843 |
| 47. | Stone Mountain | 57 | 27,846(0.20%)#47 | 416,418(0.01%)#872 |
| 48. | Fayetteville | 56 | 27,846(0.20%)#48 | 416,418(0.01%)#885 |
| 49. | Decatur | 55 | 27,846(0.20%)#49 | 416,418(0.01%)#896 |
| 50. | Albany | 48 | 27,846(0.17%)#50 | 416,418(0.01%)#977 |
| 51. | Conyers | 47 | 27,846(0.17%)#51 | 416,418(0.01%)#991 |
| 52. | Brookhaven | 45 | 27,846(0.16%)#52 | 416,418(0.01%)#1,011 |
| 53. | Statesboro | 43 | 27,846(0.15%)#53 | 416,418(0.01%)#1,039 |
| 54. | Fair Oaks | 42 | 27,846(0.15%)#54 | 416,418(0.01%)#1,059 |
| 55. | Eatonton | 39 | 27,846(0.14%)#55 | 416,418(0.01%)#1,098 |
| 56. | Hampton | 37 | 27,846(0.13%)#56 | 416,418(0.01%)#1,126 |
| 57. | Georgetown | 33 | 27,846(0.12%)#57 | 416,418(0.01%)#1,194 |
| 58. | Cusseta Chattahoochee County Unified Government | 33 | 27,846(0.12%)#58 | 416,418(0.01%)#1,198 |
| 59. | Savannah | 23 | 27,846(0.08%)#59 | 416,418(0.01%)#1,383 |
| 60. | Barnesville | 23 | 27,846(0.08%)#60 | 416,418(0.01%)#1,407 |
| 61. | College Park | 21 | 27,846(0.08%)#61 | 416,418(0.01%)#1,454 |
| 62. | Raoul | 20 | 27,846(0.07%)#62 | 416,418(0.00%)#1,488 |
| 63. | Vinings | 18 | 27,846(0.06%)#63 | 416,418(0.00%)#1,538 |
| 64. | Hinesville | 17 | 27,846(0.06%)#64 | 416,418(0.00%)#1,558 |
| 65. | Gainesville | 14 | 27,846(0.05%)#65 | 416,418(0.00%)#1,661 |
| 66. | Villa Rica | 14 | 27,846(0.05%)#66 | 416,418(0.00%)#1,673 |
| 67. | Douglas | 14 | 27,846(0.05%)#67 | 416,418(0.00%)#1,682 |
| 68. | Winterville | 13 | 27,846(0.05%)#68 | 416,418(0.00%)#1,726 |
| 69. | Fort Valley | 11 | 27,846(0.04%)#69 | 416,418(0.00%)#1,801 |
| 70. | Braselton | 10 | 27,846(0.04%)#70 | 416,418(0.00%)#1,840 |
| 71. | Martinez | 9 | 27,846(0.03%)#71 | 416,418(0.00%)#1,876 |
| 72. | Thomasville | 9 | 27,846(0.03%)#72 | 416,418(0.00%)#1,885 |
| 73. | Mcrae Helena | 9 | 27,846(0.03%)#73 | 416,418(0.00%)#1,903 |
| 74. | Loganville | 8 | 27,846(0.03%)#74 | 416,418(0.00%)#1,939 |
| 75. | Dalton | 7 | 27,846(0.03%)#75 | 416,418(0.00%)#1,976 |
| 76. | Georgetown Quitman County Unified Government | 4 | 27,846(0.01%)#76 | 416,418(0.00%)#2,118 |
| 77. | Dunwoody | 3 | 27,846(0.01%)#77 | 416,418(0.00%)#2,136 |
Common Questions
What are the Top 10 Cities with the Most Immigrants from Nigeria in Georgia?
Top 10 Cities with the Most Immigrants from Nigeria in Georgia are:
#1
1,473
#2
1,088
#3
711
#4
674
#5
645
#6
503
#7
484
#8
444
#9
429
#10
366
What city has the Most Immigrants from Nigeria in Georgia?
Redan has the Most Immigrants from Nigeria in Georgia with 1,473.
What is the Total Immigrants from Nigeria in the State of Georgia?
Total Immigrants from Nigeria in Georgia is 27,846.
What is the Total Immigrants from Nigeria in the United States?
Total Immigrants from Nigeria in the United States is 416,418.