Cities with the Lowest Percentage of Births to Unmarried Women in Delaware

RELATED REPORTS & OPTIONS

Lowest Illegitimacy | All Women
Population
Families and Households
Female Fertility
Female Fertility (Unmarried)
Race (Community Size)
Race (Percentage)
Ancestry (Community Size)
AfghanAfricanAlaska NativeAlaskan AthabascanAlbanianAleutAlsatianAmericanApacheArabArapahoArgentineanArmenianAssyrian / Chaldean / SyriacAustralianAustrianBahamianBangladeshiBarbadianBasqueBelgianBelizeanBermudanBhutaneseBlackfeetBolivianBrazilianBritishBritish West IndianBulgarianBurmeseCajunCambodianCanadianCape VerdeanCarpatho RusynCelticCentral AmericanCentral American IndianCherokeeCheyenneChickasawChileanChineseChippewaChoctawColombianColvilleComancheCosta RicanCreeCreekCroatianCrowCubanCypriotCzechCzechoslovakianDanishDelawareDominicanDutchDutch West IndianEastern EuropeanEcuadorianEgyptianEnglishEstonianEthiopianEuropeanFijianFilipinoFinnishFrenchFrench American IndianFrench CanadianGermanGerman RussianGhanaianGreekGuamanian / ChamorroGuatemalanGuyaneseHaitianHmongHonduranHopiHoumaHungarianIcelanderIndian (Asian)IndonesianInupiatIranianIraqiIrishIroquoisIsraeliItalianJamaicanJapaneseJordanianKenyanKiowaKoreanLaotianLatvianLebaneseLiberianLithuanianLumbeeLuxembourgerMacedonianMalaysianMalteseMarshalleseMenomineeMexicanMexican American IndianMongolianMoroccanNative HawaiianNavajoNepaleseNew ZealanderNicaraguanNigerianNorthern EuropeanNorwegianOkinawanOsageOttawaPaiutePakistaniPalestinianPanamanianParaguayanPennsylvania GermanPeruvianPimaPolishPortuguesePotawatomiPuebloPuerto RicanPuget Sound SalishRomanianRussianSalvadoranSamoanScandinavianScotch-IrishScottishSeminoleSenegaleseSerbianShoshoneSierra LeoneanSiouxSlavicSlovakSloveneSomaliSouth AfricanSouth AmericanSouth American IndianSoviet UnionSpaniardSpanishSpanish AmericanSpanish American IndianSri LankanSubsaharan AfricanSudaneseSwedishSwissSyrianTaiwaneseThaiTlingit-HaidaTohono O'OdhamTonganTrinidadian and TobagonianTsimshianTurkishU.S. Virgin IslanderUgandanUkrainianUruguayanUteVenezuelanVietnameseWelshWest IndianYakamaYaquiYugoslavianYumanYup'ikZimbabwean
Ancestry (Percentage)
AfghanAfricanAlaska NativeAlaskan AthabascanAlbanianAleutAlsatianAmericanApacheArabArapahoArgentineanArmenianAssyrian / Chaldean / SyriacAustralianAustrianBahamianBangladeshiBarbadianBasqueBelgianBelizeanBermudanBhutaneseBlackfeetBolivianBrazilianBritishBritish West IndianBulgarianBurmeseCajunCambodianCanadianCape VerdeanCarpatho RusynCelticCentral AmericanCentral American IndianCherokeeCheyenneChickasawChileanChineseChippewaChoctawColombianColvilleComancheCosta RicanCreeCreekCroatianCrowCubanCypriotCzechCzechoslovakianDanishDelawareDominicanDutchDutch West IndianEastern EuropeanEcuadorianEgyptianEnglishEstonianEthiopianEuropeanFijianFilipinoFinnishFrenchFrench American IndianFrench CanadianGermanGerman RussianGhanaianGreekGuamanian / ChamorroGuatemalanGuyaneseHaitianHmongHonduranHopiHoumaHungarianIcelanderIndian (Asian)IndonesianInupiatIranianIraqiIrishIroquoisIsraeliItalianJamaicanJapaneseJordanianKenyanKiowaKoreanLaotianLatvianLebaneseLiberianLithuanianLumbeeLuxembourgerMacedonianMalaysianMalteseMarshalleseMenomineeMexicanMexican American IndianMongolianMoroccanNative HawaiianNavajoNepaleseNew ZealanderNicaraguanNigerianNorthern EuropeanNorwegianOkinawanOsageOttawaPaiutePakistaniPalestinianPanamanianParaguayanPennsylvania GermanPeruvianPimaPolishPortuguesePotawatomiPuebloPuerto RicanPuget Sound SalishRomanianRussianSalvadoranSamoanScandinavianScotch-IrishScottishSeminoleSenegaleseSerbianShoshoneSierra LeoneanSiouxSlavicSlovakSloveneSomaliSouth AfricanSouth AmericanSouth American IndianSoviet UnionSpaniardSpanishSpanish AmericanSpanish American IndianSri LankanSubsaharan AfricanSudaneseSwedishSwissSyrianTaiwaneseThaiTlingit-HaidaTohono O'OdhamTonganTrinidadian and TobagonianTsimshianTurkishU.S. Virgin IslanderUgandanUkrainianUruguayanUteVenezuelanVietnameseWelshWest IndianYakamaYaquiYugoslavianYumanYup'ikZimbabwean
Immigrant Origin (Total)
AfghanistanAfricaAlbaniaArgentinaArmeniaAsiaAustraliaAustriaAzoresBahamasBangladeshBarbadosBelarusBelgiumBelizeBoliviaBosnia and HerzegovinaBrazilBulgariaBurma / MyanmarCabo VerdeCambodiaCameroonCanadaCaribbeanCentral AmericaChileChinaColombiaCongoCosta RicaCroatiaCubaCzechoslovakiaDenmarkDominicaDominican RepublicEastern AfricaEastern AsiaEastern EuropeEcuadorEgyptEl SalvadorEnglandEritreaEthiopiaEuropeFijiFranceGermanyGhanaGreeceGrenadaGuatemalaGuyanaHaitiHondurasHong KongHungaryIndiaIndonesiaIranIraqIrelandIsraelItalyJamaicaJapanJordanKazakhstanKenyaKoreaKuwaitLaosLatin AmericaLatviaLebanonLiberiaLithuaniaMalaysiaMexicoMicronesiaMiddle AfricaMoldovaMoroccoNepalNetherlandsNicaraguaNigeriaNorth MacedoniaNorthern AfricaNorthern EuropeNorwayOceaniaPakistanPanamaPeruPhilippinesPolandPortugalRomaniaRussiaSaudi ArabiaScotlandSenegalSerbiaSierra LeoneSingaporeSomaliaSouth AfricaSouth AmericaSouth Central AsiaSouth Eastern AsiaSouthern EuropeSpainSri LankaSt. Vincent and the GrenadinesSudanSwedenSwitzerlandSyriaTaiwanThailandTrinidad and TobagoTurkeyUgandaUkraineUruguayUzbekistanVenezuelaVietnamWest IndiesWestern AfricaWestern AsiaWestern EuropeYemenZaireZimbabwe
Immigrant Origin (Percentage)
AfghanistanAfricaAlbaniaArgentinaArmeniaAsiaAustraliaAustriaAzoresBahamasBangladeshBarbadosBelarusBelgiumBelizeBoliviaBosnia and HerzegovinaBrazilBulgariaBurma / MyanmarCabo VerdeCambodiaCameroonCanadaCaribbeanCentral AmericaChileChinaColombiaCongoCosta RicaCroatiaCubaCzechoslovakiaDenmarkDominicaDominican RepublicEastern AfricaEastern AsiaEastern EuropeEcuadorEgyptEl SalvadorEnglandEritreaEthiopiaEuropeFijiFranceGermanyGhanaGreeceGrenadaGuatemalaGuyanaHaitiHondurasHong KongHungaryIndiaIndonesiaIranIraqIrelandIsraelItalyJamaicaJapanJordanKazakhstanKenyaKoreaKuwaitLaosLatin AmericaLatviaLebanonLiberiaLithuaniaMalaysiaMexicoMicronesiaMiddle AfricaMoldovaMoroccoNepalNetherlandsNicaraguaNigeriaNorth MacedoniaNorthern AfricaNorthern EuropeNorwayOceaniaPakistanPanamaPeruPhilippinesPolandPortugalRomaniaRussiaSaudi ArabiaScotlandSenegalSerbiaSierra LeoneSingaporeSomaliaSouth AfricaSouth AmericaSouth Central AsiaSouth Eastern AsiaSouthern EuropeSpainSri LankaSt. Vincent and the GrenadinesSudanSwedenSwitzerlandSyriaTaiwanThailandTrinidad and TobagoTurkeyUgandaUkraineUruguayUzbekistanVenezuelaVietnamWest IndiesWestern AfricaWestern AsiaWestern EuropeYemenZaireZimbabwe
Income
Income (Families)
Income (Households)
Poverty
Poverty (Families)
Unemployment
Employment Occupations
Employment Industries
Employer Class
Commute Time
Commute Means
School Enrollment
Education by Degree Field
Occupancy
Finances
Physical Characteristics
Delaware
Compare Cities
Comparison Subject

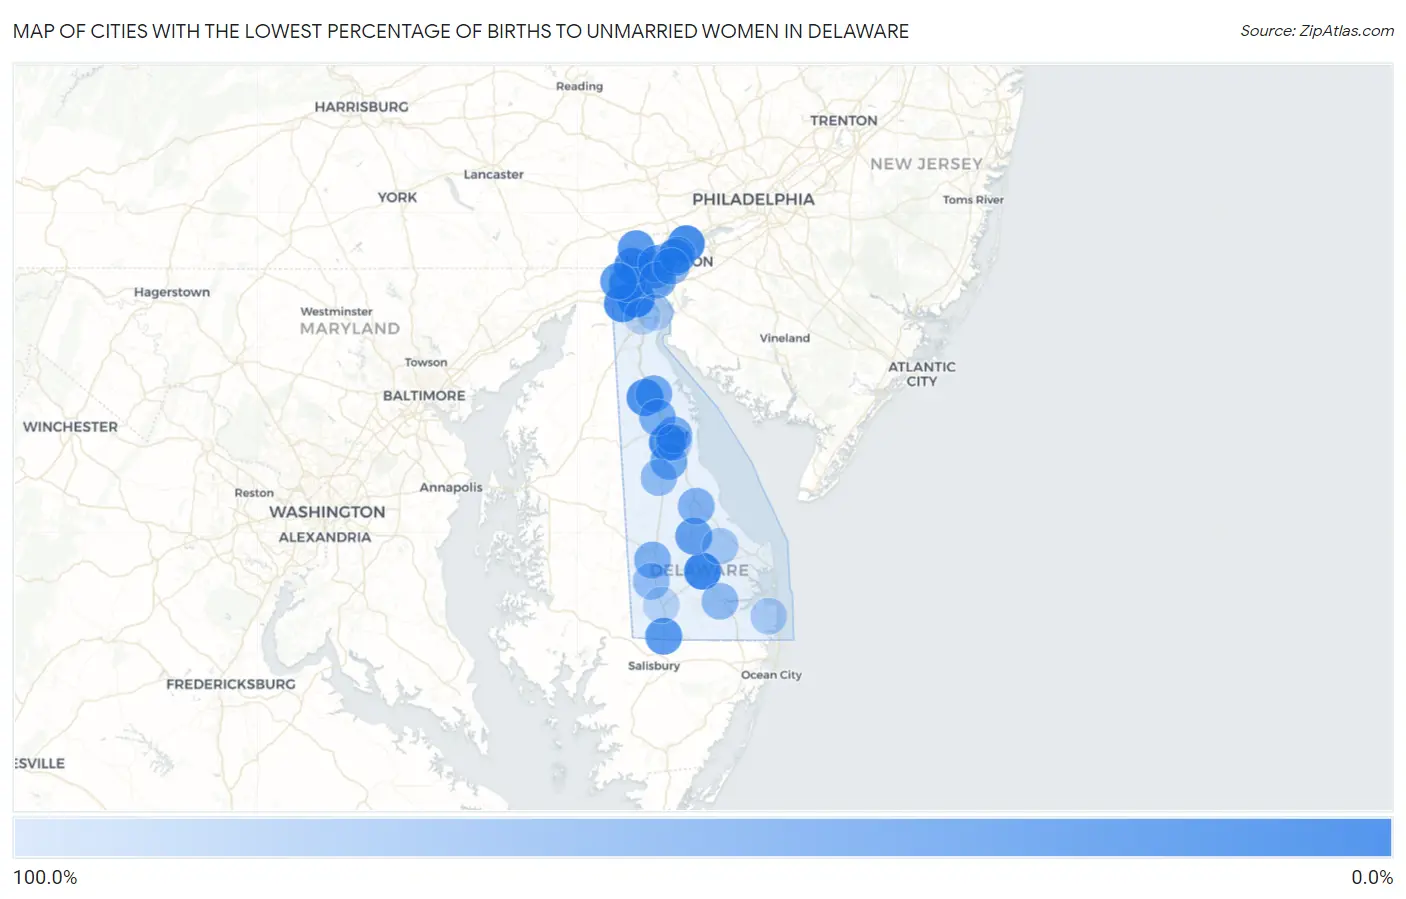
Map of Cities with the Lowest Percentage of Births to Unmarried Women in Delaware

100.0%
0.0%
Cities with the Lowest Percentage of Births to Unmarried Women in Delaware Map

Cities with the Lowest Percentage of Births to Unmarried Women in Delaware

City % Unmarried vs State vs National
1.Bear5.9%36.1%(-30.2)#132.1%(-26.2)#332
2.Georgetown10.6%36.1%(-25.5)#232.1%(-21.5)#860
3.Claymont15.2%36.1%(-20.9)#332.1%(-16.9)#1,459
4.Rodney Village15.3%36.1%(-20.8)#432.1%(-16.8)#1,472
5.Glasgow17.2%36.1%(-18.9)#532.1%(-14.9)#1,750
6.Clayton22.9%36.1%(-13.2)#632.1%(-9.20)#2,561
7.Newport25.9%36.1%(-10.2)#732.1%(-6.20)#3,000
8.Brookside26.4%36.1%(-9.70)#832.1%(-5.70)#3,073
9.Pike Creek Valley28.6%36.1%(-7.50)#932.1%(-3.50)#3,388
10.Hockessin29.5%36.1%(-6.60)#1032.1%(-2.60)#3,546
11.Delmar31.4%36.1%(-4.70)#1132.1%(-0.700)#3,839
12.Newark32.7%36.1%(-3.40)#1232.1%(+0.600)#4,006
13.Elsmere39.8%36.1%(+3.70)#1332.1%(+7.70)#5,048
14.Ellendale40.0%36.1%(+3.90)#1432.1%(+7.90)#5,130
15.Edgemoor40.2%36.1%(+4.10)#1532.1%(+8.10)#5,178
16.Wilmington Manor49.3%36.1%(+13.2)#1632.1%(+17.2)#6,269
17.Woodside East50.0%36.1%(+13.9)#1732.1%(+17.9)#6,371
18.Smyrna51.4%36.1%(+15.3)#1832.1%(+19.3)#6,690
19.Dover53.4%36.1%(+17.3)#1932.1%(+21.3)#6,888
20.Cheswold56.8%36.1%(+20.7)#2032.1%(+24.7)#7,186
21.Bridgeville58.8%36.1%(+22.7)#2132.1%(+26.7)#7,401
22.Milford61.0%36.1%(+24.9)#2232.1%(+28.9)#7,686
23.Bellefonte63.6%36.1%(+27.5)#2332.1%(+31.5)#7,916
24.Wilmington67.3%36.1%(+31.2)#2432.1%(+35.2)#8,294
25.Millsboro72.4%36.1%(+36.3)#2532.1%(+40.3)#8,687
26.Felton72.7%36.1%(+36.6)#2632.1%(+40.6)#8,719
27.Seaford74.8%36.1%(+38.7)#2732.1%(+42.7)#8,828
28.Milton85.3%36.1%(+49.2)#2832.1%(+53.2)#9,506
29.Ocean View90.5%36.1%(+54.4)#2932.1%(+58.4)#9,725
30.Kent Acres90.7%36.1%(+54.6)#3032.1%(+58.6)#9,730
31.Laurel100.0%36.1%(+63.9)#3132.1%(+67.9)#10,145
32.Delaware City100.0%36.1%(+63.9)#3232.1%(+67.9)#10,555
33.St Georges100.0%36.1%(+63.9)#3332.1%(+67.9)#10,820

Common Questions

What are the Top 10 Cities with the Lowest Percentage of Births to Unmarried Women in Delaware?
Top 10 Cities with the Lowest Percentage of Births to Unmarried Women in Delaware are:
What city has the Lowest Percentage of Births to Unmarried Women in Delaware?
Bear has the Lowest Percentage of Births to Unmarried Women in Delaware with 5.9%.
What is the Percentage of Births to Unmarried Women in the State of Delaware?
Percentage of Births to Unmarried Women in Delaware is 36.1%.
What is the Percentage of Births to Unmarried Women in the United States?
Percentage of Births to Unmarried Women in the United States is 32.1%.