Cities with the Lowest Percentage of Births to Unmarried Women in Georgia
RELATED REPORTS & OPTIONS
Lowest Illegitimacy | All Women
Georgia
Compare Cities
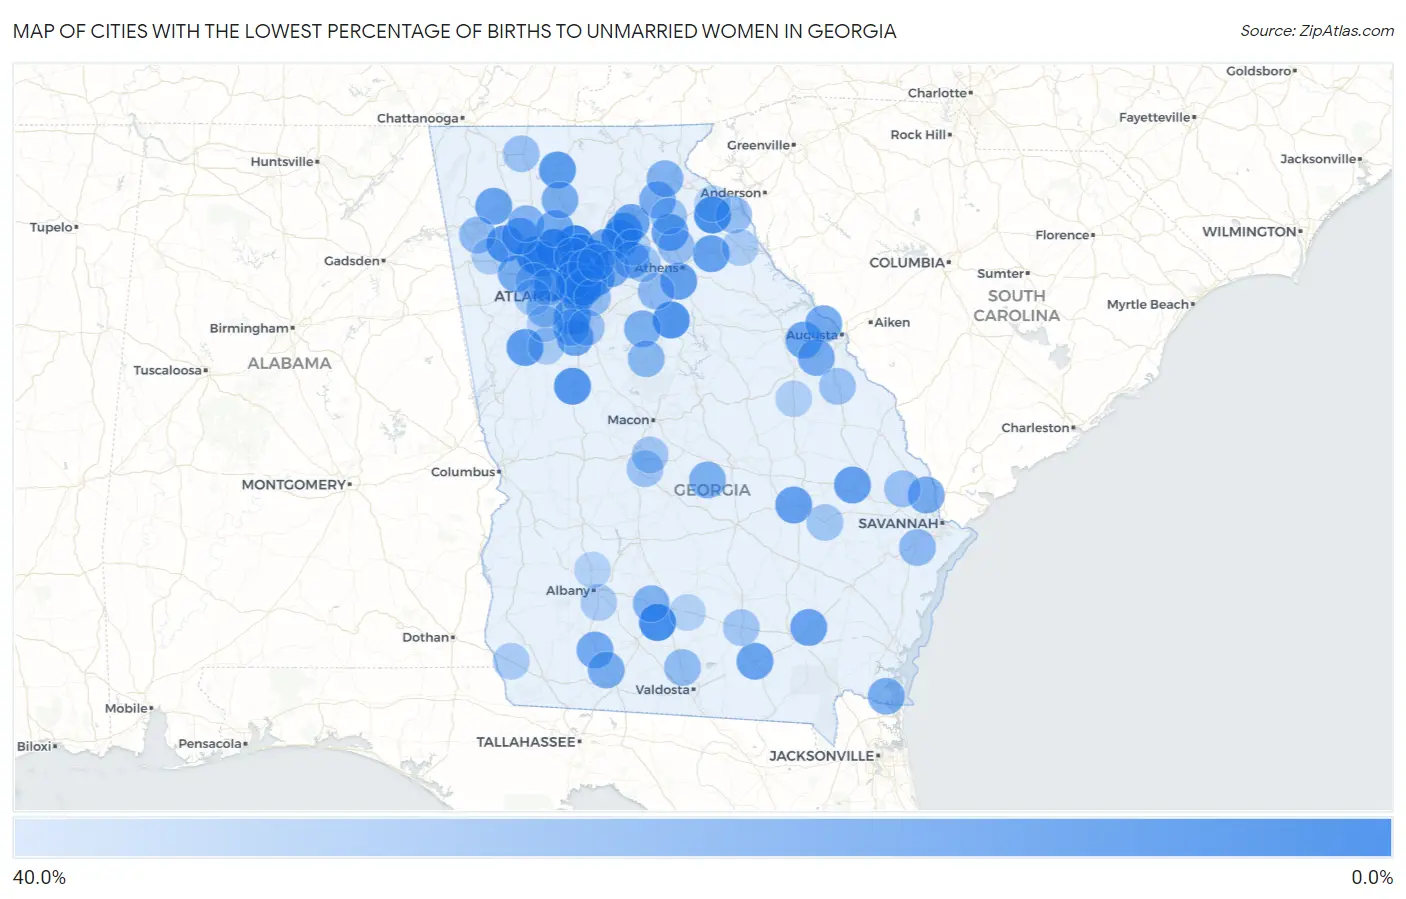
Map of Cities with the Lowest Percentage of Births to Unmarried Women in Georgia
40.0%
0.0%
Cities with the Lowest Percentage of Births to Unmarried Women in Georgia
| City | % Unmarried | vs State | vs National | |
| 1. | Cusseta Chattahoochee County Unified Government | 0.50% | 36.1%(-35.6)#1 | 32.1%(-31.6)#9 |
| 2. | Johns Creek | 1.0% | 36.1%(-35.1)#2 | 32.1%(-31.1)#20 |
| 3. | Milton | 1.8% | 36.1%(-34.3)#3 | 32.1%(-30.3)#53 |
| 4. | Acworth | 2.9% | 36.1%(-33.2)#4 | 32.1%(-29.2)#117 |
| 5. | Alpharetta | 3.3% | 36.1%(-32.8)#5 | 32.1%(-28.8)#143 |
| 6. | Omega | 4.2% | 36.1%(-31.9)#6 | 32.1%(-27.9)#195 |
| 7. | Woodstock | 4.4% | 36.1%(-31.7)#7 | 32.1%(-27.7)#212 |
| 8. | Canon | 5.6% | 36.1%(-30.5)#8 | 32.1%(-26.5)#318 |
| 9. | Echols County Consolidated Government | 6.1% | 36.1%(-30.0)#9 | 32.1%(-26.0)#363 |
| 10. | Flowery Branch | 6.2% | 36.1%(-29.9)#10 | 32.1%(-25.9)#370 |
| 11. | Chamblee | 6.4% | 36.1%(-29.7)#11 | 32.1%(-25.7)#386 |
| 12. | North Decatur | 6.7% | 36.1%(-29.4)#12 | 32.1%(-25.4)#413 |
| 13. | Madison | 7.7% | 36.1%(-28.4)#13 | 32.1%(-24.4)#519 |
| 14. | Smyrna | 7.9% | 36.1%(-28.2)#14 | 32.1%(-24.2)#537 |
| 15. | Euharlee | 9.1% | 36.1%(-27.0)#15 | 32.1%(-23.0)#677 |
| 16. | Zebulon | 9.1% | 36.1%(-27.0)#16 | 32.1%(-23.0)#681 |
| 17. | Norcross | 10.0% | 36.1%(-26.1)#17 | 32.1%(-22.1)#782 |
| 18. | Sandy Springs | 10.1% | 36.1%(-26.0)#18 | 32.1%(-22.0)#804 |
| 19. | Newnan | 10.9% | 36.1%(-25.2)#19 | 32.1%(-21.2)#891 |
| 20. | East Ellijay | 11.1% | 36.1%(-25.0)#20 | 32.1%(-21.0)#927 |
| 21. | Lilburn | 11.8% | 36.1%(-24.3)#21 | 32.1%(-20.3)#1,004 |
| 22. | Oakwood | 11.9% | 36.1%(-24.2)#22 | 32.1%(-20.2)#1,021 |
| 23. | Lake City | 12.1% | 36.1%(-24.0)#23 | 32.1%(-20.0)#1,047 |
| 24. | Kennesaw | 12.7% | 36.1%(-23.4)#24 | 32.1%(-19.4)#1,134 |
| 25. | Vidalia | 13.0% | 36.1%(-23.1)#25 | 32.1%(-19.1)#1,169 |
| 26. | Watkinsville | 13.3% | 36.1%(-22.8)#26 | 32.1%(-18.8)#1,214 |
| 27. | Comer | 13.3% | 36.1%(-22.8)#27 | 32.1%(-18.8)#1,219 |
| 28. | Register | 13.3% | 36.1%(-22.8)#28 | 32.1%(-18.8)#1,229 |
| 29. | Commerce | 13.5% | 36.1%(-22.6)#29 | 32.1%(-18.6)#1,241 |
| 30. | Blackshear | 13.9% | 36.1%(-22.2)#30 | 32.1%(-18.2)#1,286 |
| 31. | Plainville | 14.3% | 36.1%(-21.8)#31 | 32.1%(-17.8)#1,354 |
| 32. | Gainesville | 14.5% | 36.1%(-21.6)#32 | 32.1%(-17.6)#1,368 |
| 33. | Lovejoy | 14.6% | 36.1%(-21.5)#33 | 32.1%(-17.5)#1,392 |
| 34. | Homerville | 14.8% | 36.1%(-21.3)#34 | 32.1%(-17.3)#1,418 |
| 35. | Dunwoody | 15.1% | 36.1%(-21.0)#35 | 32.1%(-17.0)#1,450 |
| 36. | North Druid Hills | 15.2% | 36.1%(-20.9)#36 | 32.1%(-16.9)#1,457 |
| 37. | Harlem | 15.6% | 36.1%(-20.5)#37 | 32.1%(-16.5)#1,520 |
| 38. | Doraville | 16.5% | 36.1%(-19.6)#38 | 32.1%(-15.6)#1,636 |
| 39. | Cartersville | 16.8% | 36.1%(-19.3)#39 | 32.1%(-15.3)#1,710 |
| 40. | Evans | 17.0% | 36.1%(-19.1)#40 | 32.1%(-15.1)#1,726 |
| 41. | Canton | 17.1% | 36.1%(-19.0)#41 | 32.1%(-15.0)#1,737 |
| 42. | Pelham | 17.7% | 36.1%(-18.4)#42 | 32.1%(-14.4)#1,826 |
| 43. | Bemiss | 17.8% | 36.1%(-18.3)#43 | 32.1%(-14.3)#1,832 |
| 44. | Sugar Hill | 18.2% | 36.1%(-17.9)#44 | 32.1%(-13.9)#1,869 |
| 45. | Dallas | 18.2% | 36.1%(-17.9)#45 | 32.1%(-13.9)#1,873 |
| 46. | Rincon | 18.2% | 36.1%(-17.9)#46 | 32.1%(-13.9)#1,874 |
| 47. | Auburn | 18.2% | 36.1%(-17.9)#47 | 32.1%(-13.9)#1,877 |
| 48. | Blythe | 18.2% | 36.1%(-17.9)#48 | 32.1%(-13.9)#1,897 |
| 49. | Decatur | 18.5% | 36.1%(-17.6)#49 | 32.1%(-13.6)#1,924 |
| 50. | Lawrenceville | 18.8% | 36.1%(-17.3)#50 | 32.1%(-13.3)#1,959 |
| 51. | Ochlocknee | 18.8% | 36.1%(-17.3)#51 | 32.1%(-13.3)#1,987 |
| 52. | Jasper | 19.0% | 36.1%(-17.1)#52 | 32.1%(-13.1)#2,012 |
| 53. | Raoul | 19.2% | 36.1%(-16.9)#53 | 32.1%(-12.9)#2,036 |
| 54. | St Marys | 19.4% | 36.1%(-16.7)#54 | 32.1%(-12.7)#2,052 |
| 55. | Jonesboro | 20.0% | 36.1%(-16.1)#55 | 32.1%(-12.1)#2,126 |
| 56. | Chester | 20.0% | 36.1%(-16.1)#56 | 32.1%(-12.1)#2,142 |
| 57. | Mansfield | 20.0% | 36.1%(-16.1)#57 | 32.1%(-12.1)#2,187 |
| 58. | Roswell | 20.6% | 36.1%(-15.5)#58 | 32.1%(-11.5)#2,249 |
| 59. | Tucker | 20.8% | 36.1%(-15.3)#59 | 32.1%(-11.3)#2,272 |
| 60. | Ty Ty | 21.1% | 36.1%(-15.0)#60 | 32.1%(-11.0)#2,325 |
| 61. | Clarkesville | 21.4% | 36.1%(-14.7)#61 | 32.1%(-10.7)#2,361 |
| 62. | White | 22.2% | 36.1%(-13.9)#62 | 32.1%(-9.90)#2,467 |
| 63. | Brookhaven | 23.3% | 36.1%(-12.8)#63 | 32.1%(-8.80)#2,621 |
| 64. | Clarkston | 23.8% | 36.1%(-12.3)#64 | 32.1%(-8.30)#2,691 |
| 65. | Monticello | 23.8% | 36.1%(-12.3)#65 | 32.1%(-8.30)#2,697 |
| 66. | Peachtree Corners | 24.9% | 36.1%(-11.2)#66 | 32.1%(-7.20)#2,794 |
| 67. | Richmond Hill | 24.9% | 36.1%(-11.2)#67 | 32.1%(-7.20)#2,795 |
| 68. | Good Hope | 25.0% | 36.1%(-11.1)#68 | 32.1%(-7.10)#2,885 |
| 69. | Lindale | 25.7% | 36.1%(-10.4)#69 | 32.1%(-6.40)#2,974 |
| 70. | South Fulton | 26.0% | 36.1%(-10.1)#70 | 32.1%(-6.10)#3,003 |
| 71. | Hahira | 26.3% | 36.1%(-9.80)#71 | 32.1%(-5.80)#3,049 |
| 72. | Redan | 26.4% | 36.1%(-9.70)#72 | 32.1%(-5.70)#3,066 |
| 73. | Hartwell | 27.0% | 36.1%(-9.10)#73 | 32.1%(-5.10)#3,166 |
| 74. | Nicholson | 27.5% | 36.1%(-8.60)#74 | 32.1%(-4.60)#3,256 |
| 75. | Guyton | 27.6% | 36.1%(-8.50)#75 | 32.1%(-4.50)#3,271 |
| 76. | Stockbridge | 28.1% | 36.1%(-8.00)#76 | 32.1%(-4.00)#3,335 |
| 77. | Waynesboro | 28.2% | 36.1%(-7.90)#77 | 32.1%(-3.90)#3,356 |
| 78. | Chatsworth | 28.3% | 36.1%(-7.80)#78 | 32.1%(-3.80)#3,367 |
| 79. | Homer | 28.6% | 36.1%(-7.50)#79 | 32.1%(-3.50)#3,406 |
| 80. | Powder Springs | 29.1% | 36.1%(-7.00)#80 | 32.1%(-3.00)#3,484 |
| 81. | Perry | 29.2% | 36.1%(-6.90)#81 | 32.1%(-2.90)#3,494 |
| 82. | Duluth | 29.4% | 36.1%(-6.70)#82 | 32.1%(-2.70)#3,523 |
| 83. | Winder | 29.8% | 36.1%(-6.30)#83 | 32.1%(-2.30)#3,578 |
| 84. | Warner Robins | 30.0% | 36.1%(-6.10)#84 | 32.1%(-2.10)#3,598 |
| 85. | Mableton | 30.6% | 36.1%(-5.50)#85 | 32.1%(-1.50)#3,713 |
| 86. | Reidsville | 30.8% | 36.1%(-5.30)#86 | 32.1%(-1.30)#3,746 |
| 87. | Pearson | 30.8% | 36.1%(-5.30)#87 | 32.1%(-1.30)#3,748 |
| 88. | Douglasville | 32.7% | 36.1%(-3.40)#88 | 32.1%(+0.600)#4,004 |
| 89. | Peachtree City | 33.1% | 36.1%(-3.00)#89 | 32.1%(+1.00)#4,046 |
| 90. | Elberton | 33.3% | 36.1%(-2.80)#90 | 32.1%(+1.20)#4,089 |
| 91. | Putney | 33.3% | 36.1%(-2.80)#91 | 32.1%(+1.20)#4,098 |
| 92. | Donalsonville | 33.3% | 36.1%(-2.80)#92 | 32.1%(+1.20)#4,105 |
| 93. | Aragon | 33.3% | 36.1%(-2.80)#93 | 32.1%(+1.20)#4,121 |
| 94. | Athens-Clarke County Unified Government (Balance) | 33.5% | 36.1%(-2.60)#94 | 32.1%(+1.40)#4,254 |
| 95. | Louisville | 34.4% | 36.1%(-1.70)#95 | 32.1%(+2.30)#4,356 |
| 96. | Fairburn | 34.6% | 36.1%(-1.50)#96 | 32.1%(+2.50)#4,369 |
| 97. | Braselton | 35.2% | 36.1%(-0.900)#97 | 32.1%(+3.10)#4,446 |
| 98. | Leesburg | 35.5% | 36.1%(-0.600)#98 | 32.1%(+3.40)#4,489 |
| 99. | Enigma | 35.5% | 36.1%(-0.600)#99 | 32.1%(+3.40)#4,492 |
| 100. | Lavonia | 36.2% | 36.1%(+0.100)#100 | 32.1%(+4.10)#4,564 |
Common Questions
What are the Top 10 Cities with the Lowest Percentage of Births to Unmarried Women in Georgia?
Top 10 Cities with the Lowest Percentage of Births to Unmarried Women in Georgia are:
#1
1.0%
#2
1.8%
#3
2.9%
#4
3.3%
#5
4.2%
#6
4.4%
#7
5.6%
#8
6.2%
#9
6.4%
#10
6.7%
What city has the Lowest Percentage of Births to Unmarried Women in Georgia?
Johns Creek has the Lowest Percentage of Births to Unmarried Women in Georgia with 1.0%.
What is the Percentage of Births to Unmarried Women in the State of Georgia?
Percentage of Births to Unmarried Women in Georgia is 36.1%.
What is the Percentage of Births to Unmarried Women in the United States?
Percentage of Births to Unmarried Women in the United States is 32.1%.