Zip Codes with the Highest Percentage of Population Taking Taxi / Cab to Work in Haverhill, MA
RELATED REPORTS & OPTIONS
Taxi / Cab
Haverhill
Compare Zip Codes
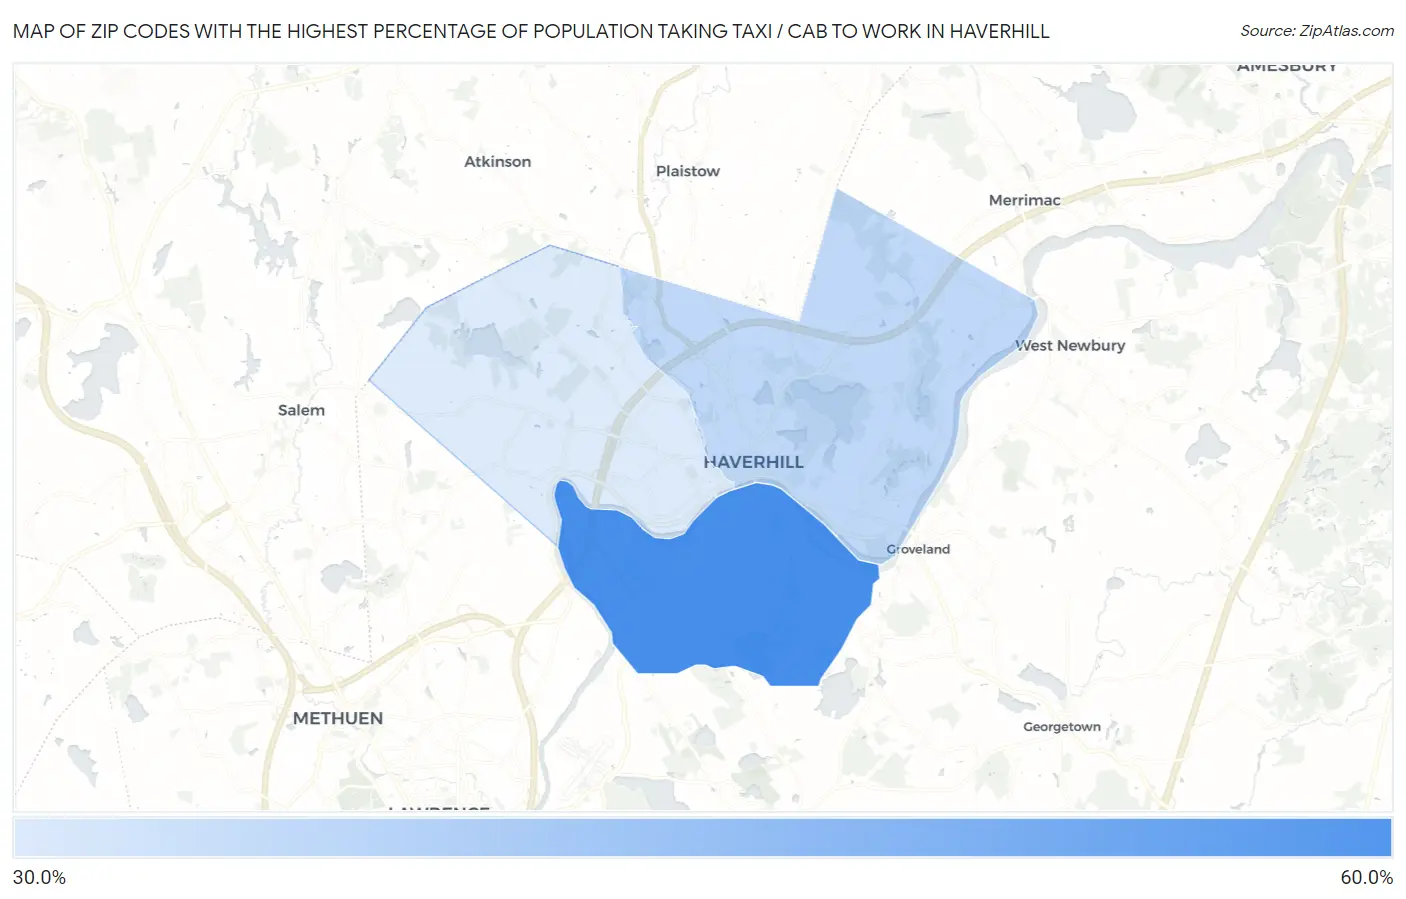
Map of Zip Codes with the Highest Percentage of Population Taking Taxi / Cab to Work in Haverhill
30.1%
52.1%
Zip Codes with the Highest Percentage of Population Taking Taxi / Cab to Work in Haverhill, MA
| Zip Code | % Take Taxi / Cab | vs State | vs National | |
| 1. | 01835 | 52.1% | 35.1%(+17.0)#48 | 38.2%(+13.9)#2,356 |
| 2. | 01830 | 34.2% | 35.1%(-0.900)#173 | 38.2%(-4.00)#9,272 |
| 3. | 01832 | 30.1% | 35.1%(-5.00)#225 | 38.2%(-8.10)#10,880 |
1
Common Questions
What are the Top Zip Codes with the Highest Percentage of Population Taking Taxi / Cab to Work in Haverhill, MA?
Top Zip Codes with the Highest Percentage of Population Taking Taxi / Cab to Work in Haverhill, MA are:
What zip code has the Highest Percentage of Population Taking Taxi / Cab to Work in Haverhill, MA?
01835 has the Highest Percentage of Population Taking Taxi / Cab to Work in Haverhill, MA with 52.1%.
What is the Percentage of Population Taking Taxi / Cab to Work in Haverhill, MA?
Percentage of Population Taking Taxi / Cab to Work in Haverhill is 30.8%.
What is the Percentage of Population Taking Taxi / Cab to Work in Massachusetts?
Percentage of Population Taking Taxi / Cab to Work in Massachusetts is 35.1%.
What is the Percentage of Population Taking Taxi / Cab to Work in the United States?
Percentage of Population Taking Taxi / Cab to Work in the United States is 38.2%.