Zip Codes with the Highest Percentage of Population Taking Taxi / Cab to Work in New Bedford, MA
RELATED REPORTS & OPTIONS
Taxi / Cab
New Bedford
Compare Zip Codes
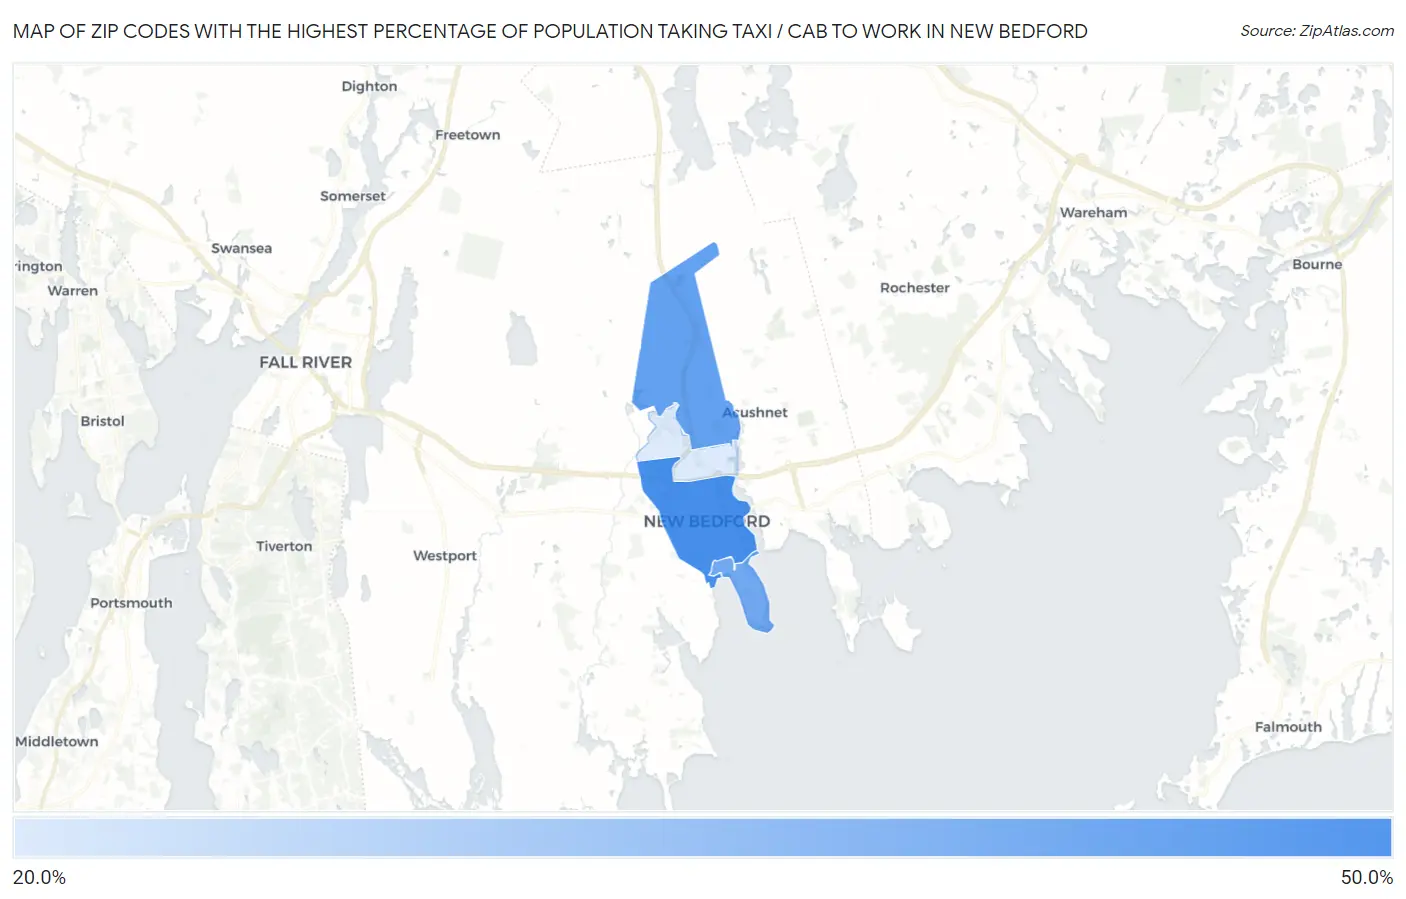
Map of Zip Codes with the Highest Percentage of Population Taking Taxi / Cab to Work in New Bedford
23.8%
41.6%
Zip Codes with the Highest Percentage of Population Taking Taxi / Cab to Work in New Bedford, MA
| Zip Code | % Take Taxi / Cab | vs State | vs National | |
| 1. | 02740 | 41.6% | 35.1%(+6.50)#104 | 38.2%(+3.40)#5,893 |
| 2. | 02745 | 38.0% | 35.1%(+2.90)#138 | 38.2%(-0.200)#7,488 |
| 3. | 02744 | 36.4% | 35.1%(+1.30)#155 | 38.2%(-1.80)#8,276 |
| 4. | 02746 | 23.8% | 35.1%(-11.3)#271 | 38.2%(-14.4)#12,491 |
1
Common Questions
What are the Top 3 Zip Codes with the Highest Percentage of Population Taking Taxi / Cab to Work in New Bedford, MA?
Top 3 Zip Codes with the Highest Percentage of Population Taking Taxi / Cab to Work in New Bedford, MA are:
What zip code has the Highest Percentage of Population Taking Taxi / Cab to Work in New Bedford, MA?
02740 has the Highest Percentage of Population Taking Taxi / Cab to Work in New Bedford, MA with 41.6%.
What is the Percentage of Population Taking Taxi / Cab to Work in New Bedford, MA?
Percentage of Population Taking Taxi / Cab to Work in New Bedford is 33.1%.
What is the Percentage of Population Taking Taxi / Cab to Work in Massachusetts?
Percentage of Population Taking Taxi / Cab to Work in Massachusetts is 35.1%.
What is the Percentage of Population Taking Taxi / Cab to Work in the United States?
Percentage of Population Taking Taxi / Cab to Work in the United States is 38.2%.