Zip Codes with the Highest Percentage of Population Employed in Health Diagnosing & Treating in Hartford, CT
RELATED REPORTS & OPTIONS
Health Diagnosing & Treating
Hartford
Compare Zip Codes
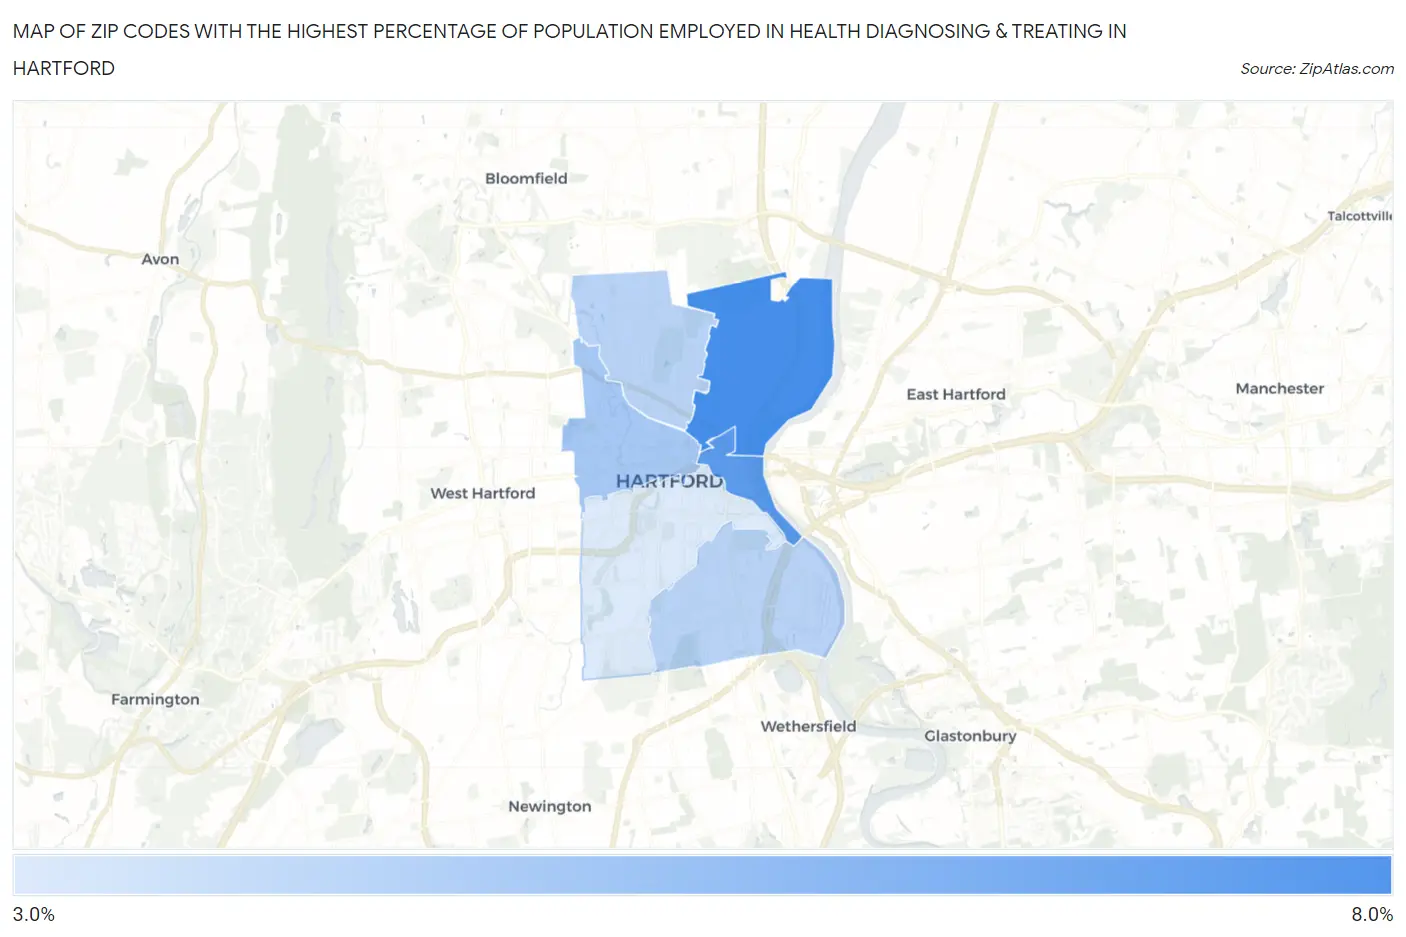
Map of Zip Codes with the Highest Percentage of Population Employed in Health Diagnosing & Treating in Hartford
3.7%
7.1%
Zip Codes with the Highest Percentage of Population Employed in Health Diagnosing & Treating in Hartford, CT
| Zip Code | % Employed | vs State | vs National | |
| 1. | 06120 | 7.1% | 6.7%(+0.427)#99 | 6.2%(+0.861)#10,015 |
| 2. | 06103 | 6.7% | 6.7%(+0.010)#125 | 6.2%(+0.443)#11,350 |
| 3. | 06105 | 4.9% | 6.7%(-1.75)#189 | 6.2%(-1.32)#17,977 |
| 4. | 06114 | 4.5% | 6.7%(-2.13)#207 | 6.2%(-1.70)#19,453 |
| 5. | 06112 | 4.5% | 6.7%(-2.16)#208 | 6.2%(-1.73)#19,569 |
| 6. | 06106 | 3.7% | 6.7%(-2.97)#235 | 6.2%(-2.54)#22,294 |
1
Common Questions
What are the Top 5 Zip Codes with the Highest Percentage of Population Employed in Health Diagnosing & Treating in Hartford, CT?
Top 5 Zip Codes with the Highest Percentage of Population Employed in Health Diagnosing & Treating in Hartford, CT are:
What zip code has the Highest Percentage of Population Employed in Health Diagnosing & Treating in Hartford, CT?
06120 has the Highest Percentage of Population Employed in Health Diagnosing & Treating in Hartford, CT with 7.1%.
What is the Percentage of Population Employed in Health Diagnosing & Treating in Hartford, CT?
Percentage of Population Employed in Health Diagnosing & Treating in Hartford is 4.6%.
What is the Percentage of Population Employed in Health Diagnosing & Treating in Connecticut?
Percentage of Population Employed in Health Diagnosing & Treating in Connecticut is 6.7%.
What is the Percentage of Population Employed in Health Diagnosing & Treating in the United States?
Percentage of Population Employed in Health Diagnosing & Treating in the United States is 6.2%.