Melissa, TX Map & Demographics
Melissa Map
Melissa Overview
$46,407
PER CAPITA INCOME
$141,071
AVG FAMILY INCOME
$138,465
AVG HOUSEHOLD INCOME
31.7%
WAGE / INCOME GAP [ % ]
68.3¢/ $1
WAGE / INCOME GAP [ $ ]
0.32
INEQUALITY / GINI INDEX
15,244
TOTAL POPULATION
7,537
MALE POPULATION
7,707
FEMALE POPULATION
97.79
MALES / 100 FEMALES
102.26
FEMALES / 100 MALES
35.3
MEDIAN AGE
3.4
AVG FAMILY SIZE
3.2
AVG HOUSEHOLD SIZE
7,797
LABOR FORCE [ PEOPLE ]
71.6%
PERCENT IN LABOR FORCE
4.1%
UNEMPLOYMENT RATE
Melissa Zip Codes
Income in Melissa
Income Overview in Melissa
Per Capita Income in Melissa is $46,407, while median incomes of families and households are $141,071 and $138,465 respectively.
| Characteristic | Number | Measure |
| Per Capita Income | 15,244 | $46,407 |
| Median Family Income | 4,276 | $141,071 |
| Mean Family Income | 4,276 | $149,522 |
| Median Household Income | 4,815 | $138,465 |
| Mean Household Income | 4,815 | $143,243 |
| Income Deficit | 4,276 | $0 |
| Wage / Income Gap (%) | 15,244 | 31.75% |
| Wage / Income Gap ($) | 15,244 | 68.25¢ per $1 |
| Gini / Inequality Index | 15,244 | 0.32 |
Earnings by Sex in Melissa
Average Earnings in Melissa are $62,810, $81,123 for men and $55,367 for women, a difference of 31.8%.
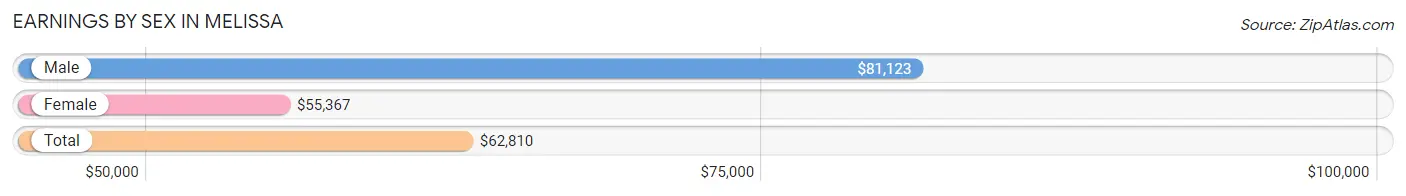
| Sex | Number | Average Earnings |
| Male | 4,247 (54.4%) | $81,123 |
| Female | 3,559 (45.6%) | $55,367 |
| Total | 7,806 (100.0%) | $62,810 |
Earnings by Sex by Income Bracket in Melissa
The most common earnings brackets in Melissa are $100,000+ for men (1,527 | 35.9%) and $100,000+ for women (896 | 25.2%).
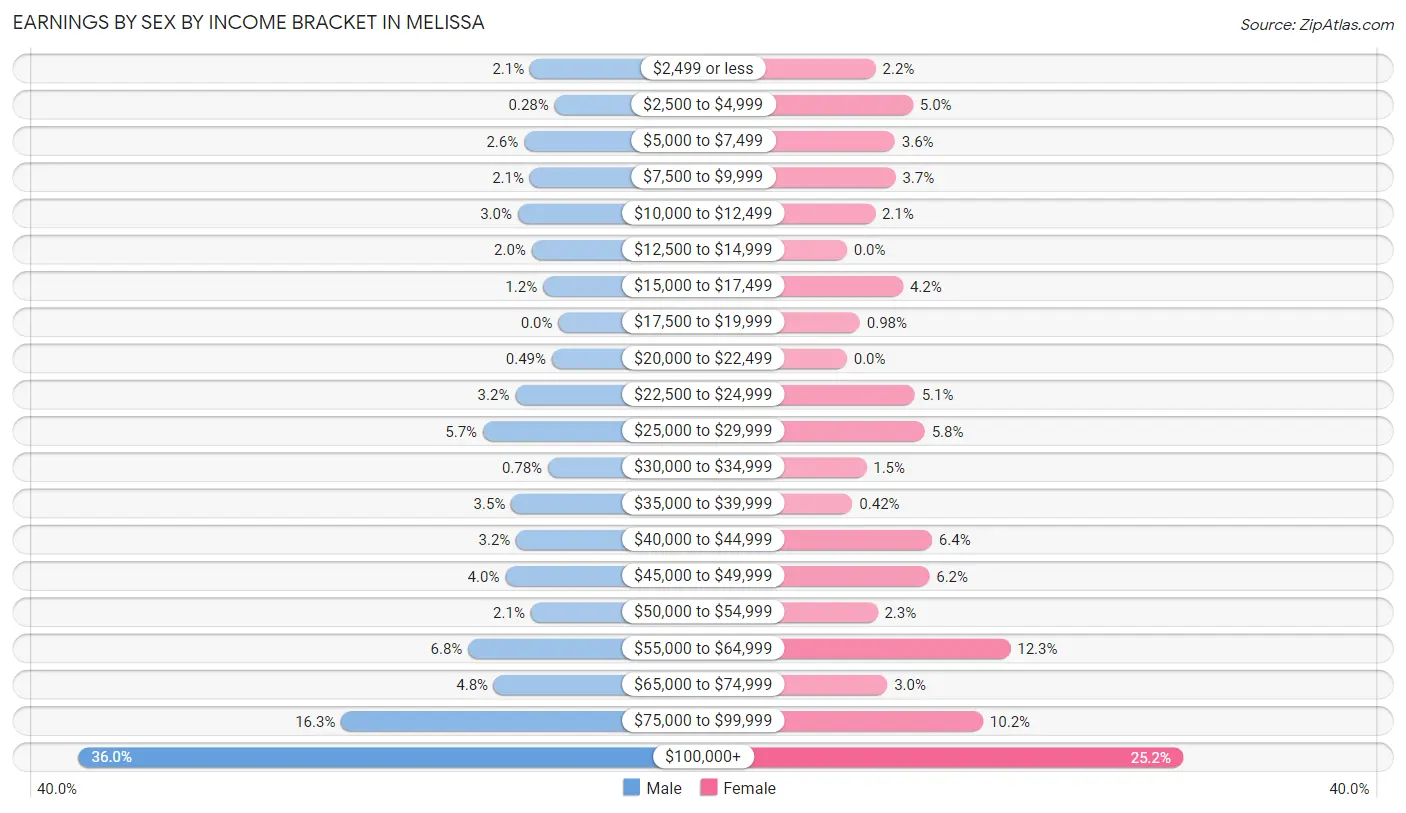
| Income | Male | Female |
| $2,499 or less | 90 (2.1%) | 77 (2.2%) |
| $2,500 to $4,999 | 12 (0.3%) | 176 (5.0%) |
| $5,000 to $7,499 | 109 (2.6%) | 128 (3.6%) |
| $7,500 to $9,999 | 91 (2.1%) | 130 (3.6%) |
| $10,000 to $12,499 | 129 (3.0%) | 75 (2.1%) |
| $12,500 to $14,999 | 85 (2.0%) | 0 (0.0%) |
| $15,000 to $17,499 | 49 (1.1%) | 150 (4.2%) |
| $17,500 to $19,999 | 0 (0.0%) | 35 (1.0%) |
| $20,000 to $22,499 | 21 (0.5%) | 0 (0.0%) |
| $22,500 to $24,999 | 137 (3.2%) | 181 (5.1%) |
| $25,000 to $29,999 | 240 (5.7%) | 208 (5.8%) |
| $30,000 to $34,999 | 33 (0.8%) | 52 (1.5%) |
| $35,000 to $39,999 | 150 (3.5%) | 15 (0.4%) |
| $40,000 to $44,999 | 134 (3.2%) | 227 (6.4%) |
| $45,000 to $49,999 | 169 (4.0%) | 220 (6.2%) |
| $50,000 to $54,999 | 88 (2.1%) | 82 (2.3%) |
| $55,000 to $64,999 | 287 (6.8%) | 436 (12.2%) |
| $65,000 to $74,999 | 205 (4.8%) | 108 (3.0%) |
| $75,000 to $99,999 | 691 (16.3%) | 363 (10.2%) |
| $100,000+ | 1,527 (35.9%) | 896 (25.2%) |
| Total | 4,247 (100.0%) | 3,559 (100.0%) |
Earnings by Sex by Educational Attainment in Melissa
Average earnings in Melissa are $88,014 for men and $59,078 for women, a difference of 32.9%. Men with an educational attainment of graduate degree enjoy the highest average annual earnings of $98,922, while those with less than high school education earn the least with $41,302. Women with an educational attainment of graduate degree earn the most with the average annual earnings of $93,063, while those with college or associate's degree education have the smallest earnings of $41,071.
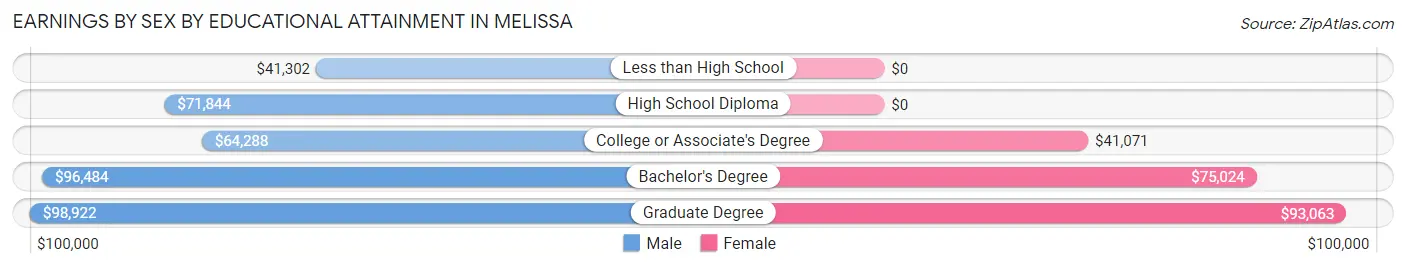
| Educational Attainment | Male Income | Female Income |
| Less than High School | $41,302 | $0 |
| High School Diploma | $71,844 | $0 |
| College or Associate's Degree | $64,288 | $41,071 |
| Bachelor's Degree | $96,484 | $75,024 |
| Graduate Degree | $98,922 | $93,063 |
| Total | $88,014 | $59,078 |
Family Income in Melissa
Family Income Brackets in Melissa
According to the Melissa family income data, there are 1,428 families falling into the $100,000 to $149,999 income range, which is the most common income bracket and makes up 33.4% of all families.
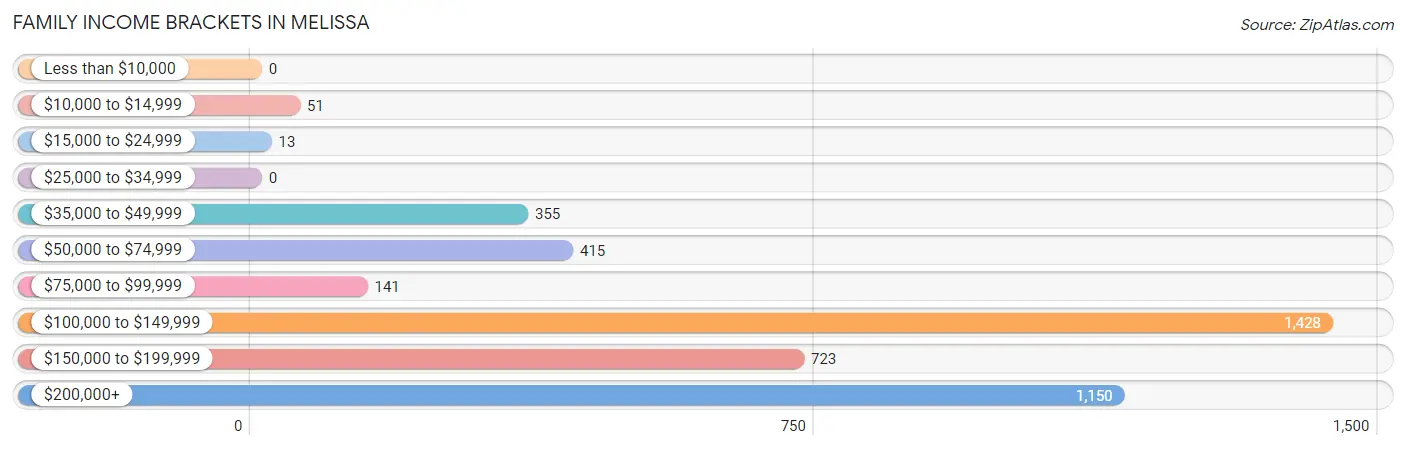
| Income Bracket | # Families | % Families |
| Less than $10,000 | 0 | 0.0% |
| $10,000 to $14,999 | 51 | 1.2% |
| $15,000 to $24,999 | 13 | 0.3% |
| $25,000 to $34,999 | 0 | 0.0% |
| $35,000 to $49,999 | 355 | 8.3% |
| $50,000 to $74,999 | 415 | 9.7% |
| $75,000 to $99,999 | 141 | 3.3% |
| $100,000 to $149,999 | 1,428 | 33.4% |
| $150,000 to $199,999 | 723 | 16.9% |
| $200,000+ | 1,150 | 26.9% |
Family Income by Famaliy Size in Melissa
6-person families (190 | 4.4%) account for the highest median family income in Melissa with $212,939 per family, while 2-person families (893 | 20.9%) have the highest median income of $77,403 per family member.
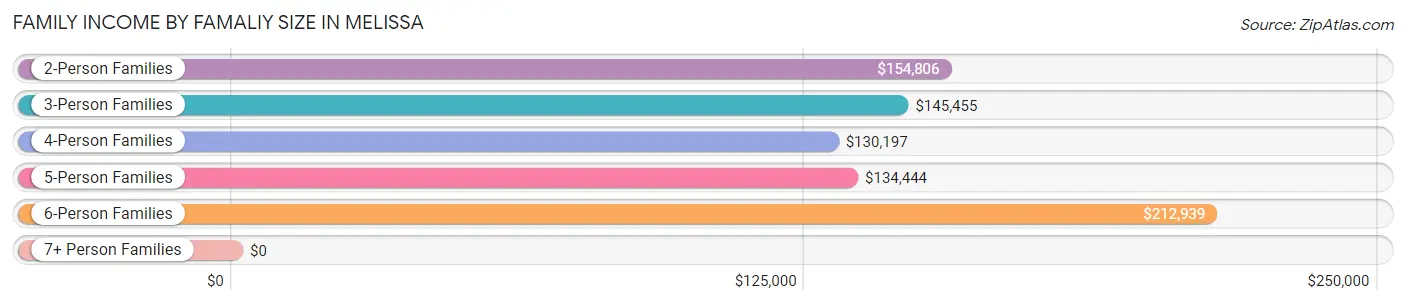
| Income Bracket | # Families | Median Income |
| 2-Person Families | 893 (20.9%) | $154,806 |
| 3-Person Families | 1,574 (36.8%) | $145,455 |
| 4-Person Families | 1,149 (26.9%) | $130,197 |
| 5-Person Families | 470 (11.0%) | $134,444 |
| 6-Person Families | 190 (4.4%) | $212,939 |
| 7+ Person Families | 0 (0.0%) | $0 |
| Total | 4,276 (100.0%) | $141,071 |
Family Income by Number of Earners in Melissa
The median family income in Melissa is $141,071, with families comprising no earners (277) having the highest median family income of $249,003, while families with 1 earner (1,458) have the lowest median family income of $104,318, accounting for 6.5% and 34.1% of families, respectively.
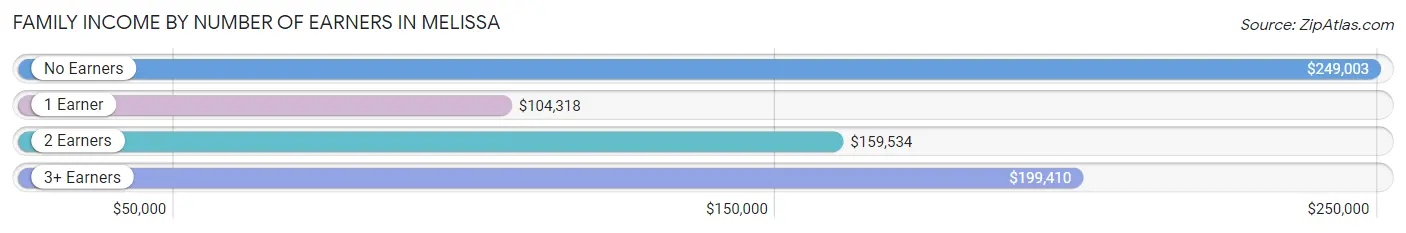
| Number of Earners | # Families | Median Income |
| No Earners | 277 (6.5%) | $249,003 |
| 1 Earner | 1,458 (34.1%) | $104,318 |
| 2 Earners | 2,010 (47.0%) | $159,534 |
| 3+ Earners | 531 (12.4%) | $199,410 |
| Total | 4,276 (100.0%) | $141,071 |
Household Income in Melissa
Household Income Brackets in Melissa
With 1,444 households falling in the category, the $100,000 to $149,999 income range is the most frequent in Melissa, accounting for 30.0% of all households.
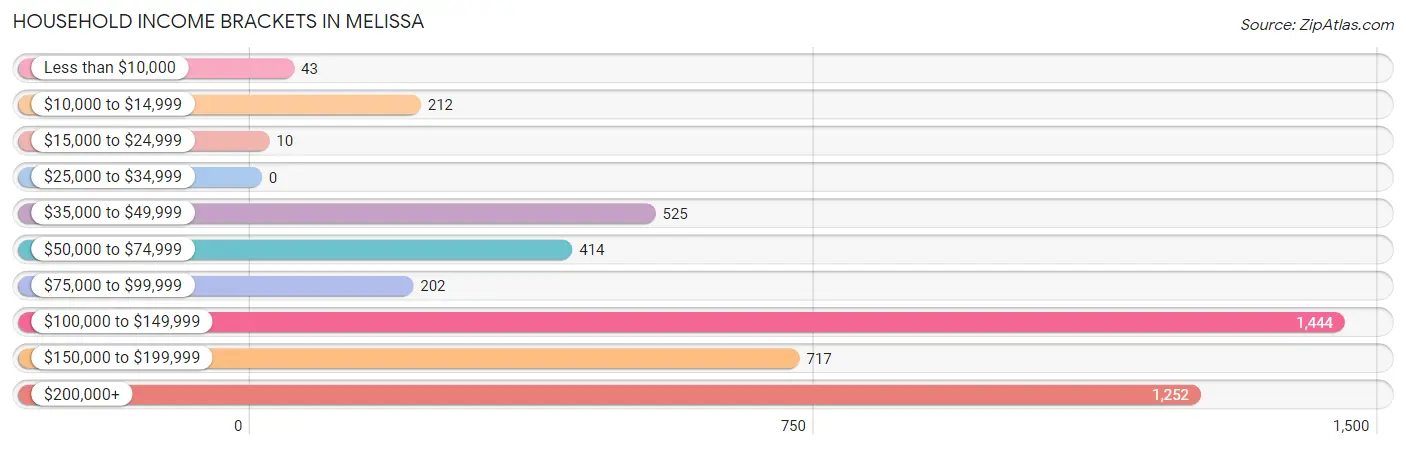
| Income Bracket | # Households | % Households |
| Less than $10,000 | 43 | 0.9% |
| $10,000 to $14,999 | 212 | 4.4% |
| $15,000 to $24,999 | 10 | 0.2% |
| $25,000 to $34,999 | 0 | 0.0% |
| $35,000 to $49,999 | 525 | 10.9% |
| $50,000 to $74,999 | 414 | 8.6% |
| $75,000 to $99,999 | 202 | 4.2% |
| $100,000 to $149,999 | 1,444 | 30.0% |
| $150,000 to $199,999 | 717 | 14.9% |
| $200,000+ | 1,252 | 26.0% |
Household Income by Householder Age in Melissa
The median household income in Melissa is $138,465, with the highest median household income of $149,148 found in the 45 to 64 years age bracket for the primary householder. A total of 1,976 households (41.0%) fall into this category.
| Income Bracket | # Households | Median Income |
| 15 to 24 Years | 0 (0.0%) | $0 |
| 25 to 44 Years | 2,182 (45.3%) | $130,606 |
| 45 to 64 Years | 1,976 (41.0%) | $149,148 |
| 65+ Years | 657 (13.6%) | $0 |
| Total | 4,815 (100.0%) | $138,465 |
Poverty in Melissa
Income Below Poverty by Sex and Age in Melissa
With 3.8% poverty level for males and 1.6% for females among the residents of Melissa, 75 year old and over males and 75 year old and over females are the most vulnerable to poverty, with 82 males (23.7%) and 41 females (28.9%) in their respective age groups living below the poverty level.
| Age Bracket | Male | Female |
| Under 5 Years | 0 (0.0%) | 11 (1.4%) |
| 5 Years | 0 (0.0%) | 0 (0.0%) |
| 6 to 11 Years | 66 (7.8%) | 41 (6.2%) |
| 12 to 14 Years | 0 (0.0%) | 0 (0.0%) |
| 15 Years | 0 (0.0%) | 0 (0.0%) |
| 16 and 17 Years | 0 (0.0%) | 0 (0.0%) |
| 18 to 24 Years | 0 (0.0%) | 0 (0.0%) |
| 25 to 34 Years | 0 (0.0%) | 0 (0.0%) |
| 35 to 44 Years | 63 (4.2%) | 12 (0.9%) |
| 45 to 54 Years | 0 (0.0%) | 0 (0.0%) |
| 55 to 64 Years | 78 (13.1%) | 0 (0.0%) |
| 65 to 74 Years | 0 (0.0%) | 18 (5.1%) |
| 75 Years and over | 82 (23.7%) | 41 (28.9%) |
| Total | 289 (3.8%) | 123 (1.6%) |
Income Above Poverty by Sex and Age in Melissa
According to the poverty statistics in Melissa, males aged under 5 years and females aged 5 years are the age groups that are most secure financially, with 100.0% of males and 100.0% of females in these age groups living above the poverty line.
| Age Bracket | Male | Female |
| Under 5 Years | 578 (100.0%) | 776 (98.6%) |
| 5 Years | 145 (100.0%) | 250 (100.0%) |
| 6 to 11 Years | 777 (92.2%) | 624 (93.8%) |
| 12 to 14 Years | 532 (100.0%) | 337 (100.0%) |
| 15 Years | 16 (100.0%) | 201 (100.0%) |
| 16 and 17 Years | 280 (100.0%) | 204 (100.0%) |
| 18 to 24 Years | 257 (100.0%) | 688 (100.0%) |
| 25 to 34 Years | 737 (100.0%) | 1,044 (100.0%) |
| 35 to 44 Years | 1,438 (95.8%) | 1,375 (99.1%) |
| 45 to 54 Years | 1,352 (100.0%) | 1,043 (100.0%) |
| 55 to 64 Years | 518 (86.9%) | 609 (100.0%) |
| 65 to 74 Years | 354 (100.0%) | 332 (94.9%) |
| 75 Years and over | 264 (76.3%) | 101 (71.1%) |
| Total | 7,248 (96.2%) | 7,584 (98.4%) |
Income Below Poverty Among Married-Couple Families in Melissa
The poverty statistics for married-couple families in Melissa show that 0.3% or 12 of the total 3,689 families live below the poverty line. Families with 3 or 4 children have the highest poverty rate of 3.0%, comprising of 12 families. On the other hand, families with no children have the lowest poverty rate of 0.0%, which includes 0 families.
| Children | Above Poverty | Below Poverty |
| No Children | 1,369 (100.0%) | 0 (0.0%) |
| 1 or 2 Children | 1,914 (100.0%) | 0 (0.0%) |
| 3 or 4 Children | 394 (97.0%) | 12 (3.0%) |
| 5 or more Children | 0 (0.0%) | 0 (0.0%) |
| Total | 3,677 (99.7%) | 12 (0.3%) |
Income Below Poverty Among Single-Parent Households in Melissa
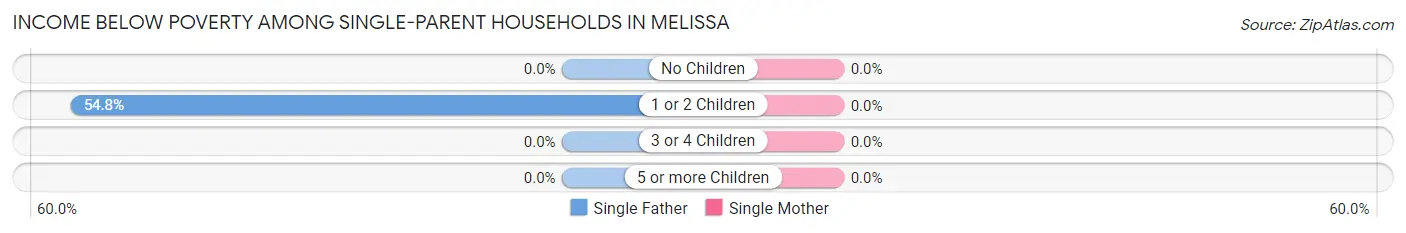
| Children | Single Father | Single Mother |
| No Children | 0 (0.0%) | 0 (0.0%) |
| 1 or 2 Children | 51 (54.8%) | 0 (0.0%) |
| 3 or 4 Children | 0 (0.0%) | 0 (0.0%) |
| 5 or more Children | 0 (0.0%) | 0 (0.0%) |
| Total | 51 (28.0%) | 0 (0.0%) |
Income Below Poverty Among Married-Couple vs Single-Parent Households in Melissa
The poverty data for Melissa shows that 12 of the married-couple family households (0.3%) and 51 of the single-parent households (8.7%) are living below the poverty level. Within the married-couple family households, those with 3 or 4 children have the highest poverty rate, with 12 households (3.0%) falling below the poverty line. Among the single-parent households, those with 1 or 2 children have the highest poverty rate, with 51 household (23.0%) living below poverty.
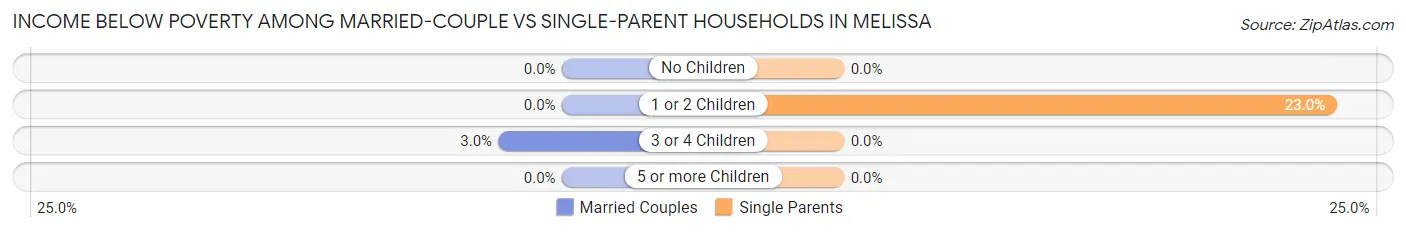
| Children | Married-Couple Families | Single-Parent Households |
| No Children | 0 (0.0%) | 0 (0.0%) |
| 1 or 2 Children | 0 (0.0%) | 51 (23.0%) |
| 3 or 4 Children | 12 (3.0%) | 0 (0.0%) |
| 5 or more Children | 0 (0.0%) | 0 (0.0%) |
| Total | 12 (0.3%) | 51 (8.7%) |
Race in Melissa
The most populous races in Melissa are White / Caucasian (10,524 | 69.0%), Black / African American (2,086 | 13.7%), and Two or more Races (1,591 | 10.4%).
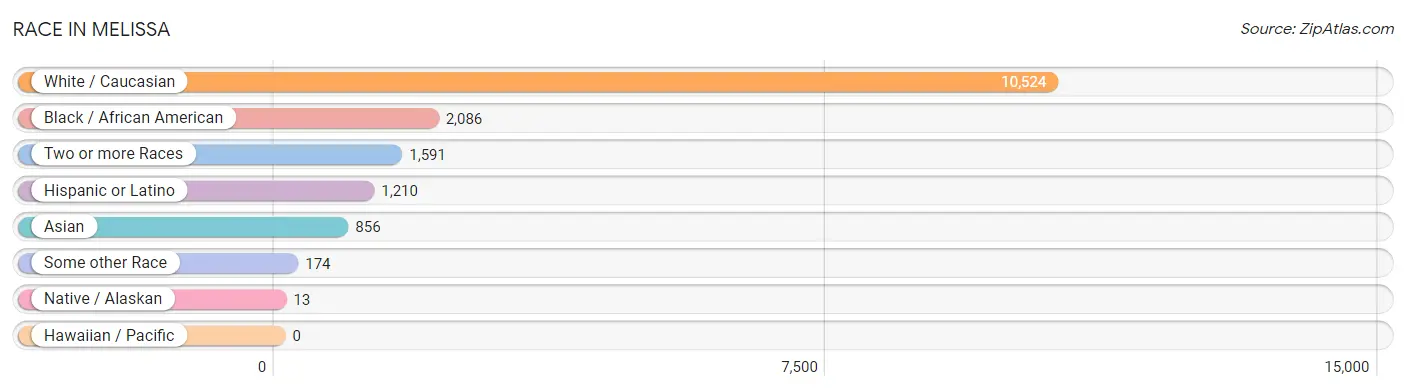
| Race | # Population | % Population |
| Asian | 856 | 5.6% |
| Black / African American | 2,086 | 13.7% |
| Hawaiian / Pacific | 0 | 0.0% |
| Hispanic or Latino | 1,210 | 7.9% |
| Native / Alaskan | 13 | 0.1% |
| White / Caucasian | 10,524 | 69.0% |
| Two or more Races | 1,591 | 10.4% |
| Some other Race | 174 | 1.1% |
| Total | 15,244 | 100.0% |
Ancestry in Melissa
The most populous ancestries reported in Melissa are English (2,332 | 15.3%), Irish (2,271 | 14.9%), German (1,759 | 11.5%), American (1,676 | 11.0%), and Mexican (806 | 5.3%), together accounting for 58.0% of all Melissa residents.
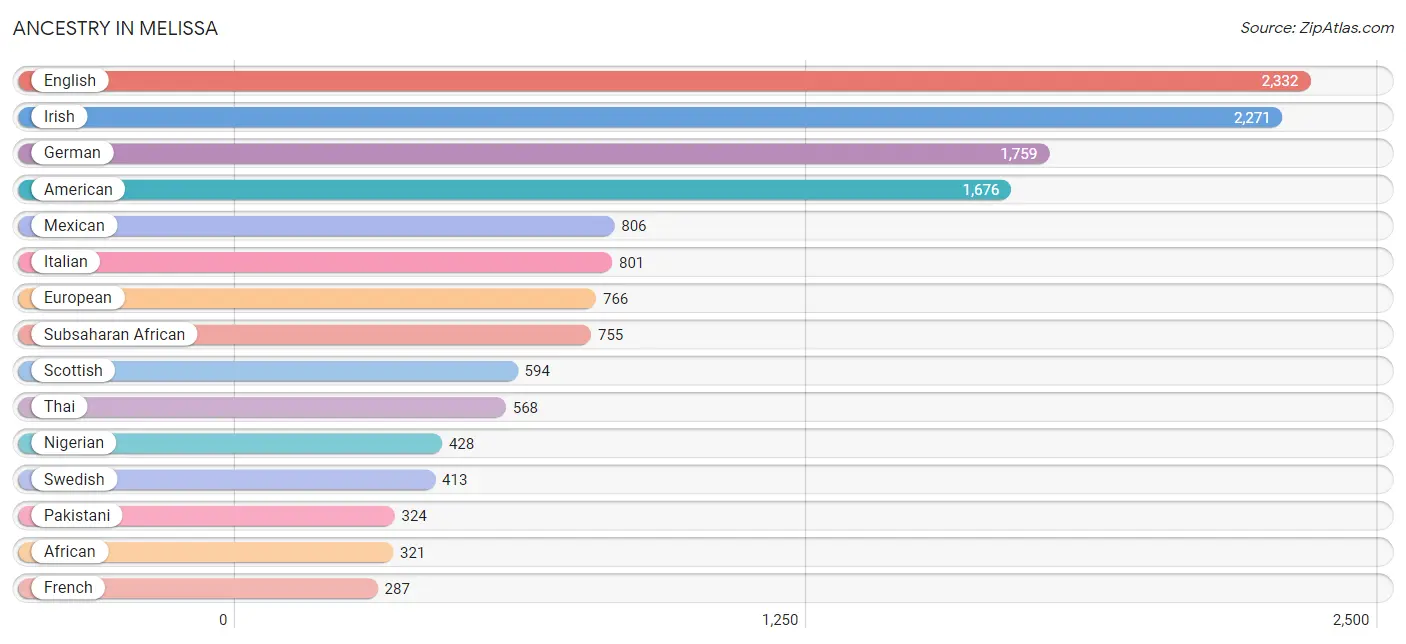
| Ancestry | # Population | % Population |
| African | 321 | 2.1% |
| American | 1,676 | 11.0% |
| Arab | 73 | 0.5% |
| Austrian | 67 | 0.4% |
| Bhutanese | 54 | 0.4% |
| British | 164 | 1.1% |
| Burmese | 78 | 0.5% |
| Canadian | 78 | 0.5% |
| Central American | 77 | 0.5% |
| Cherokee | 15 | 0.1% |
| Choctaw | 4 | 0.0% |
| Croatian | 40 | 0.3% |
| Dutch | 8 | 0.1% |
| English | 2,332 | 15.3% |
| European | 766 | 5.0% |
| French | 287 | 1.9% |
| German | 1,759 | 11.5% |
| Indian (Asian) | 193 | 1.3% |
| Irish | 2,271 | 14.9% |
| Italian | 801 | 5.2% |
| Lebanese | 73 | 0.5% |
| Lithuanian | 35 | 0.2% |
| Mexican | 806 | 5.3% |
| Mexican American Indian | 68 | 0.4% |
| Nigerian | 428 | 2.8% |
| Norwegian | 144 | 0.9% |
| Pakistani | 324 | 2.1% |
| Polish | 283 | 1.9% |
| Puerto Rican | 144 | 0.9% |
| Salvadoran | 77 | 0.5% |
| Scottish | 594 | 3.9% |
| South American | 145 | 0.9% |
| Spaniard | 38 | 0.3% |
| Sri Lankan | 81 | 0.5% |
| Subsaharan African | 755 | 5.0% |
| Swedish | 413 | 2.7% |
| Thai | 568 | 3.7% |
| Welsh | 131 | 0.9% | View All 38 Rows |
Immigrants in Melissa
The most numerous immigrant groups reported in Melissa came from Asia (822 | 5.4%), South Central Asia (448 | 2.9%), Latin America (403 | 2.6%), Africa (309 | 2.0%), and India (275 | 1.8%), together accounting for 14.8% of all Melissa residents.
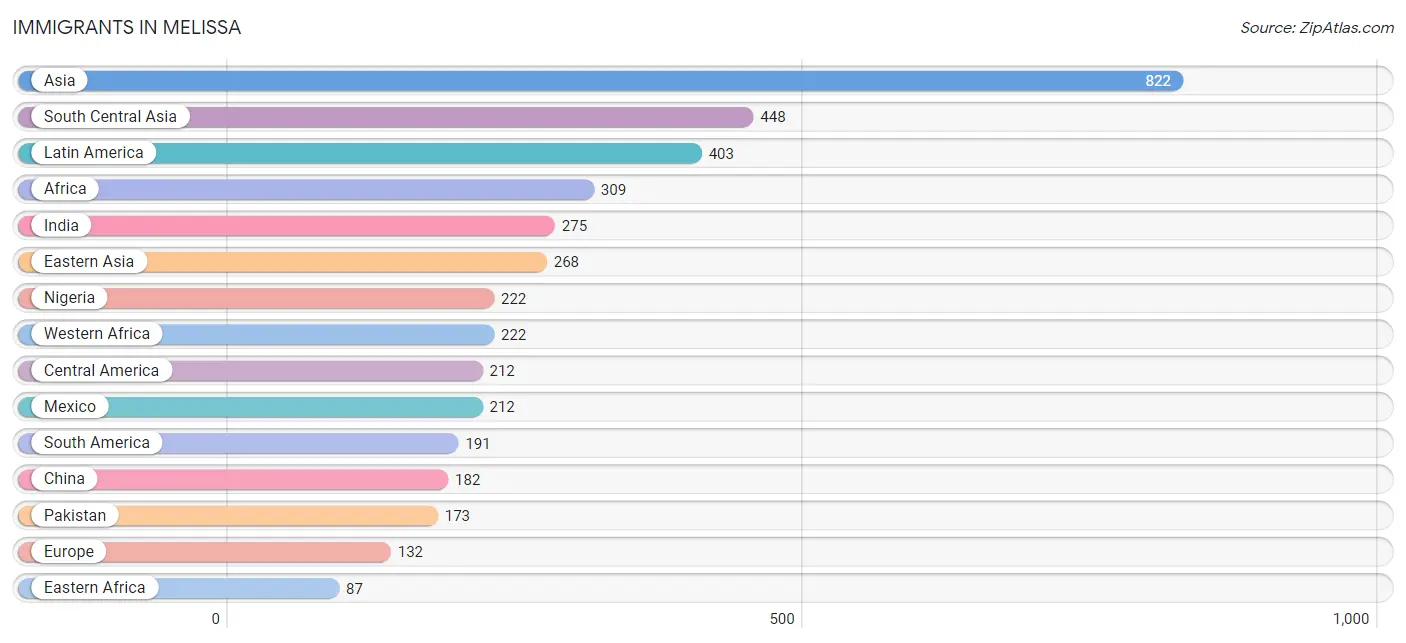
| Immigration Origin | # Population | % Population |
| Africa | 309 | 2.0% |
| Asia | 822 | 5.4% |
| Brazil | 46 | 0.3% |
| Central America | 212 | 1.4% |
| China | 182 | 1.2% |
| Eastern Africa | 87 | 0.6% |
| Eastern Asia | 268 | 1.8% |
| Europe | 132 | 0.9% |
| France | 32 | 0.2% |
| India | 275 | 1.8% |
| Japan | 86 | 0.6% |
| Kenya | 81 | 0.5% |
| Latin America | 403 | 2.6% |
| Lebanon | 25 | 0.2% |
| Mexico | 212 | 1.4% |
| Nigeria | 222 | 1.5% |
| Northern Europe | 62 | 0.4% |
| Pakistan | 173 | 1.1% |
| Philippines | 52 | 0.3% |
| South America | 191 | 1.3% |
| South Central Asia | 448 | 2.9% |
| South Eastern Asia | 81 | 0.5% |
| Southern Europe | 38 | 0.3% |
| Spain | 38 | 0.3% |
| Sweden | 36 | 0.2% |
| Vietnam | 29 | 0.2% |
| Western Africa | 222 | 1.5% |
| Western Asia | 25 | 0.2% |
| Western Europe | 32 | 0.2% | View All 29 Rows |
Sex and Age in Melissa
Sex and Age in Melissa
The most populous age groups in Melissa are 35 to 39 Years (904 | 12.0%) for men and 40 to 44 Years (941 | 12.2%) for women.
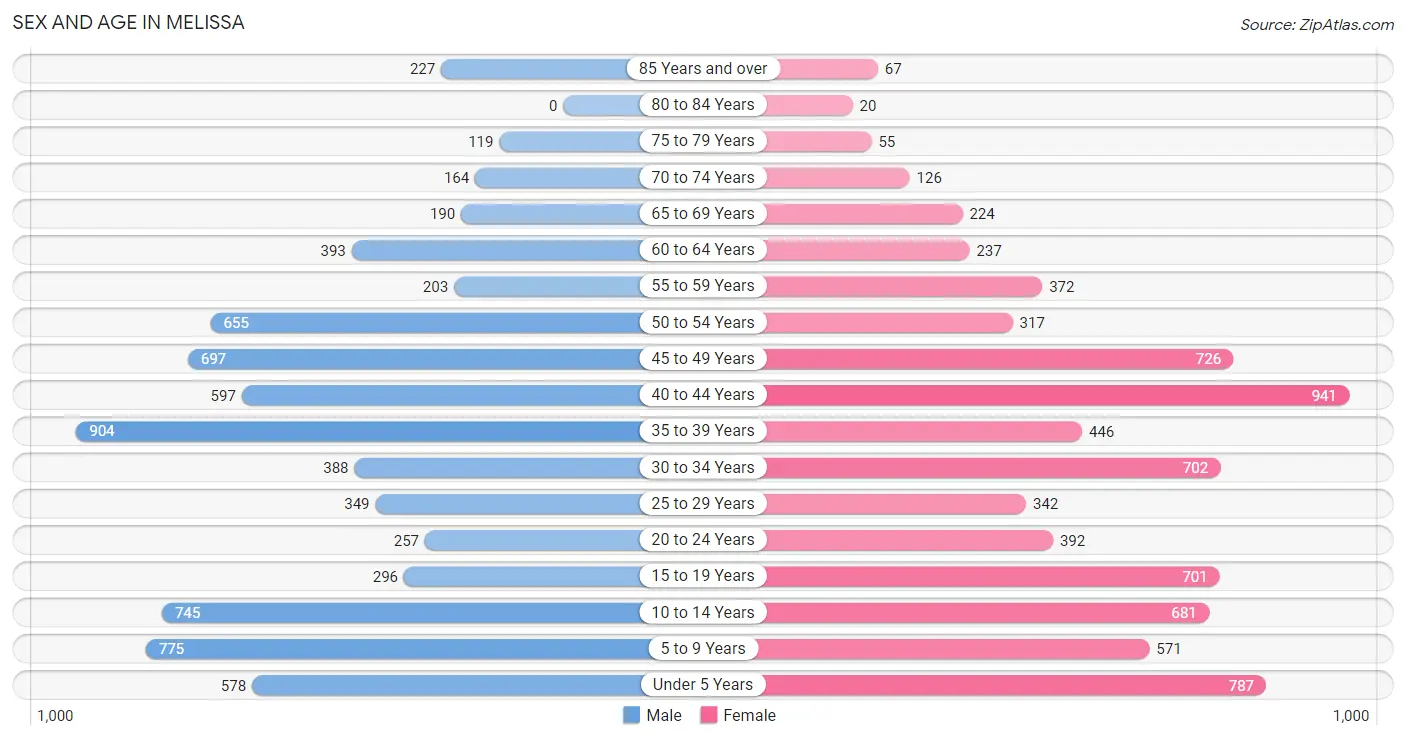
| Age Bracket | Male | Female |
| Under 5 Years | 578 (7.7%) | 787 (10.2%) |
| 5 to 9 Years | 775 (10.3%) | 571 (7.4%) |
| 10 to 14 Years | 745 (9.9%) | 681 (8.8%) |
| 15 to 19 Years | 296 (3.9%) | 701 (9.1%) |
| 20 to 24 Years | 257 (3.4%) | 392 (5.1%) |
| 25 to 29 Years | 349 (4.6%) | 342 (4.4%) |
| 30 to 34 Years | 388 (5.1%) | 702 (9.1%) |
| 35 to 39 Years | 904 (12.0%) | 446 (5.8%) |
| 40 to 44 Years | 597 (7.9%) | 941 (12.2%) |
| 45 to 49 Years | 697 (9.2%) | 726 (9.4%) |
| 50 to 54 Years | 655 (8.7%) | 317 (4.1%) |
| 55 to 59 Years | 203 (2.7%) | 372 (4.8%) |
| 60 to 64 Years | 393 (5.2%) | 237 (3.1%) |
| 65 to 69 Years | 190 (2.5%) | 224 (2.9%) |
| 70 to 74 Years | 164 (2.2%) | 126 (1.6%) |
| 75 to 79 Years | 119 (1.6%) | 55 (0.7%) |
| 80 to 84 Years | 0 (0.0%) | 20 (0.3%) |
| 85 Years and over | 227 (3.0%) | 67 (0.9%) |
| Total | 7,537 (100.0%) | 7,707 (100.0%) |
Families and Households in Melissa
Median Family Size in Melissa
The median family size in Melissa is 3.40 persons per family, with married-couple families (3,689 | 86.3%) accounting for the largest median family size of 3.45 persons per family. On the other hand, single female/mother families (405 | 9.5%) represent the smallest median family size with 2.99 persons per family.
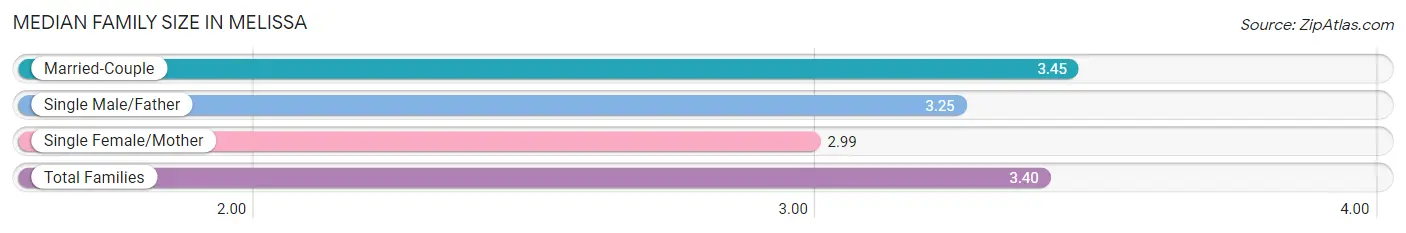
| Family Type | # Families | Family Size |
| Married-Couple | 3,689 (86.3%) | 3.45 |
| Single Male/Father | 182 (4.3%) | 3.25 |
| Single Female/Mother | 405 (9.5%) | 2.99 |
| Total Families | 4,276 (100.0%) | 3.40 |
Median Household Size in Melissa
The median household size in Melissa is 3.17 persons per household, with married-couple households (3,689 | 76.6%) accounting for the largest median household size of 3.45 persons per household. non-family households (539 | 11.2%) represent the smallest median household size with 1.24 persons per household.
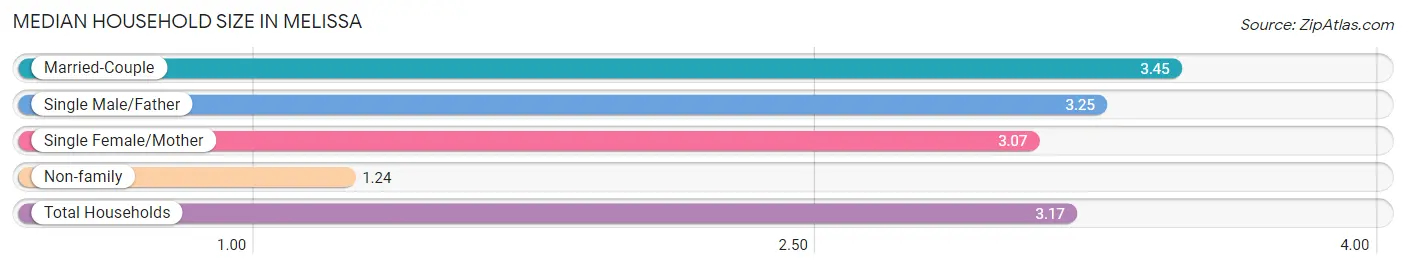
| Household Type | # Households | Household Size |
| Married-Couple | 3,689 (76.6%) | 3.45 |
| Single Male/Father | 182 (3.8%) | 3.25 |
| Single Female/Mother | 405 (8.4%) | 3.07 |
| Non-family | 539 (11.2%) | 1.24 |
| Total Households | 4,815 (100.0%) | 3.17 |
Household Size by Marriage Status in Melissa
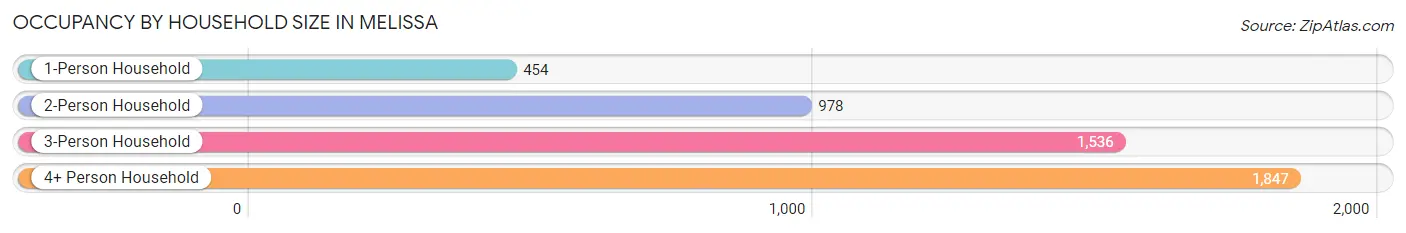
Out of a total of 4,815 households in Melissa, 4,276 (88.8%) are family households, while 539 (11.2%) are nonfamily households. The most numerous type of family households are 3-person households, comprising 1,536, and the most common type of nonfamily households are 1-person households, comprising 454.
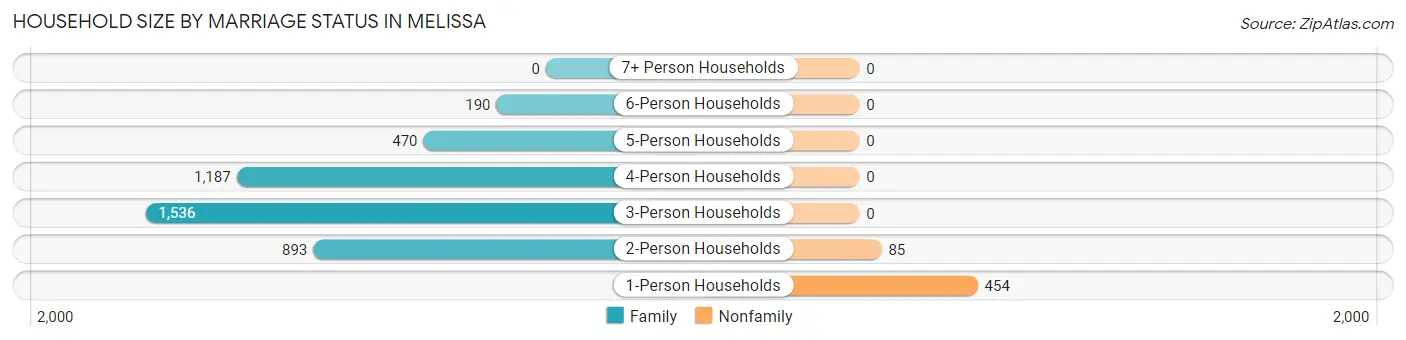
| Household Size | Family Households | Nonfamily Households |
| 1-Person Households | - | 454 (9.4%) |
| 2-Person Households | 893 (18.5%) | 85 (1.8%) |
| 3-Person Households | 1,536 (31.9%) | 0 (0.0%) |
| 4-Person Households | 1,187 (24.6%) | 0 (0.0%) |
| 5-Person Households | 470 (9.8%) | 0 (0.0%) |
| 6-Person Households | 190 (4.0%) | 0 (0.0%) |
| 7+ Person Households | 0 (0.0%) | 0 (0.0%) |
| Total | 4,276 (88.8%) | 539 (11.2%) |
Female Fertility in Melissa
Fertility by Age in Melissa
Average fertility rate in Melissa is 29.0 births per 1,000 women. Women in the age bracket of 20 to 34 years have the highest fertility rate with 86.0 births per 1,000 women. Women in the age bracket of 20 to 34 years acount for 100.0% of all women with births.
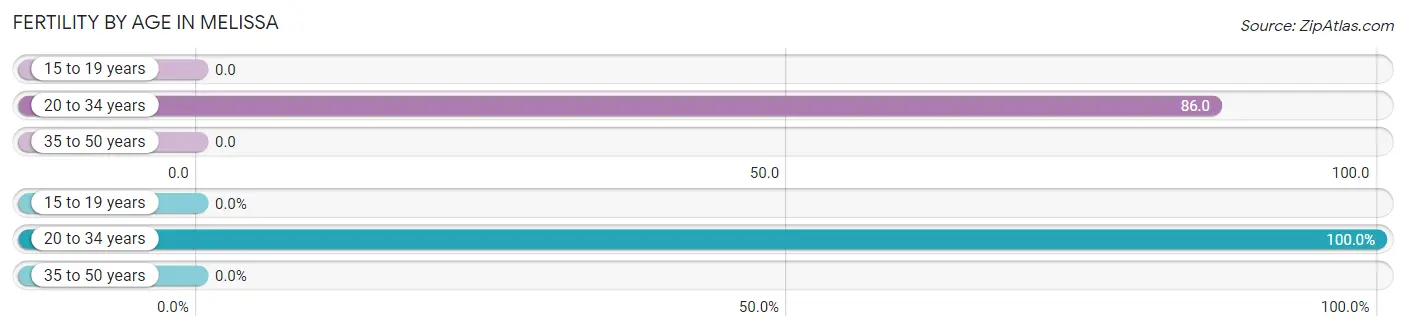
| Age Bracket | Women with Births | Births / 1,000 Women |
| 15 to 19 years | 0 (0.0%) | 0.0 |
| 20 to 34 years | 124 (100.0%) | 86.0 |
| 35 to 50 years | 0 (0.0%) | 0.0 |
| Total | 124 (100.0%) | 29.0 |
Fertility by Age by Marriage Status in Melissa
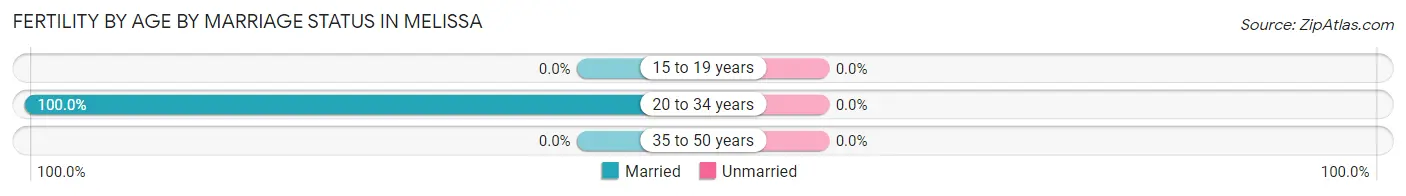
| Age Bracket | Married | Unmarried |
| 15 to 19 years | 0 (0.0%) | 0 (0.0%) |
| 20 to 34 years | 124 (100.0%) | 0 (0.0%) |
| 35 to 50 years | 0 (0.0%) | 0 (0.0%) |
| Total | 124 (100.0%) | 0 (0.0%) |
Fertility by Education in Melissa
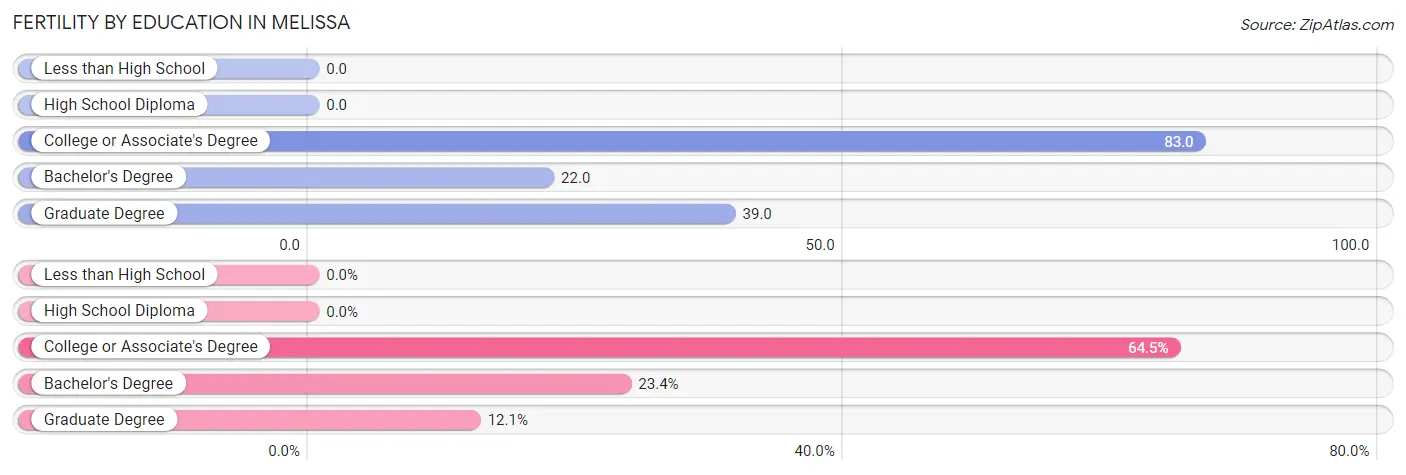
| Educational Attainment | Women with Births | Births / 1,000 Women |
| Less than High School | 0 (0.0%) | 0.0 |
| High School Diploma | 0 (0.0%) | 0.0 |
| College or Associate's Degree | 80 (64.5%) | 83.0 |
| Bachelor's Degree | 29 (23.4%) | 22.0 |
| Graduate Degree | 15 (12.1%) | 39.0 |
| Total | 124 (100.0%) | 29.0 |
Fertility by Education by Marriage Status in Melissa
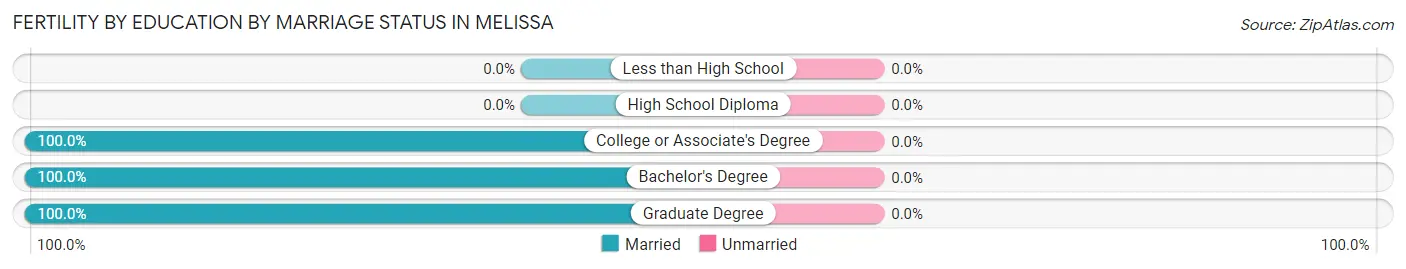
| Educational Attainment | Married | Unmarried |
| Less than High School | 0 (0.0%) | 0 (0.0%) |
| High School Diploma | 0 (0.0%) | 0 (0.0%) |
| College or Associate's Degree | 80 (100.0%) | 0 (0.0%) |
| Bachelor's Degree | 29 (100.0%) | 0 (0.0%) |
| Graduate Degree | 15 (100.0%) | 0 (0.0%) |
| Total | 124 (100.0%) | 0 (0.0%) |
Employment Characteristics in Melissa
Employment by Class of Employer in Melissa
Among the 7,471 employed individuals in Melissa, private company employees (5,827 | 78.0%), local government employees (825 | 11.0%), and not-for-profit organizations (290 | 3.9%) make up the most common classes of employment.
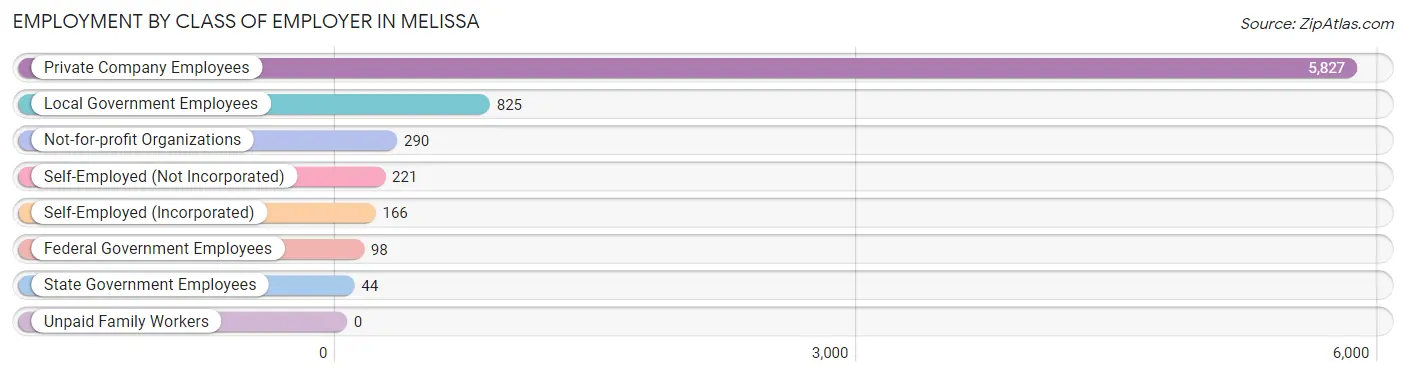
| Employer Class | # Employees | % Employees |
| Private Company Employees | 5,827 | 78.0% |
| Self-Employed (Incorporated) | 166 | 2.2% |
| Self-Employed (Not Incorporated) | 221 | 3.0% |
| Not-for-profit Organizations | 290 | 3.9% |
| Local Government Employees | 825 | 11.0% |
| State Government Employees | 44 | 0.6% |
| Federal Government Employees | 98 | 1.3% |
| Unpaid Family Workers | 0 | 0.0% |
| Total | 7,471 | 100.0% |
Employment Status by Age in Melissa
According to the labor force statistics for Melissa, out of the total population over 16 years of age (10,890), 71.6% or 7,797 individuals are in the labor force, with 4.1% or 320 of them unemployed. The age group with the highest labor force participation rate is 25 to 29 years, with 96.5% or 667 individuals in the labor force. Within the labor force, the 60 to 64 years age range has the highest percentage of unemployed individuals, with 23.3% or 104 of them being unemployed.
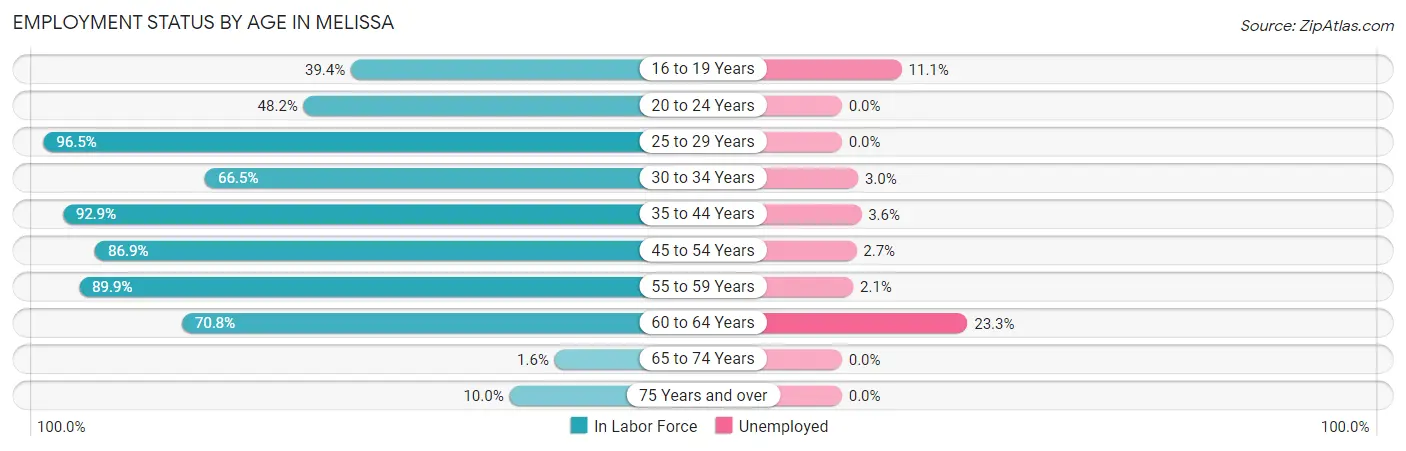
| Age Bracket | In Labor Force | Unemployed |
| 16 to 19 Years | 307 (39.4%) | 34 (11.1%) |
| 20 to 24 Years | 313 (48.2%) | 0 (0.0%) |
| 25 to 29 Years | 667 (96.5%) | 0 (0.0%) |
| 30 to 34 Years | 725 (66.5%) | 22 (3.0%) |
| 35 to 44 Years | 2,683 (92.9%) | 97 (3.6%) |
| 45 to 54 Years | 2,081 (86.9%) | 56 (2.7%) |
| 55 to 59 Years | 517 (89.9%) | 11 (2.1%) |
| 60 to 64 Years | 446 (70.8%) | 104 (23.3%) |
| 65 to 74 Years | 11 (1.6%) | 0 (0.0%) |
| 75 Years and over | 49 (10.0%) | 0 (0.0%) |
| Total | 7,797 (71.6%) | 320 (4.1%) |
Employment Status by Educational Attainment in Melissa
According to labor force statistics for Melissa, 86.1% of individuals (7,120) out of the total population between 25 and 64 years of age (8,269) are in the labor force, with 4.1% or 292 of them being unemployed. The group with the highest labor force participation rate are those with the educational attainment of bachelor's degree or higher, with 89.1% or 3,749 individuals in the labor force. Within the labor force, individuals with less than high school education have the highest percentage of unemployment, with 8.5% or 11 of them being unemployed.
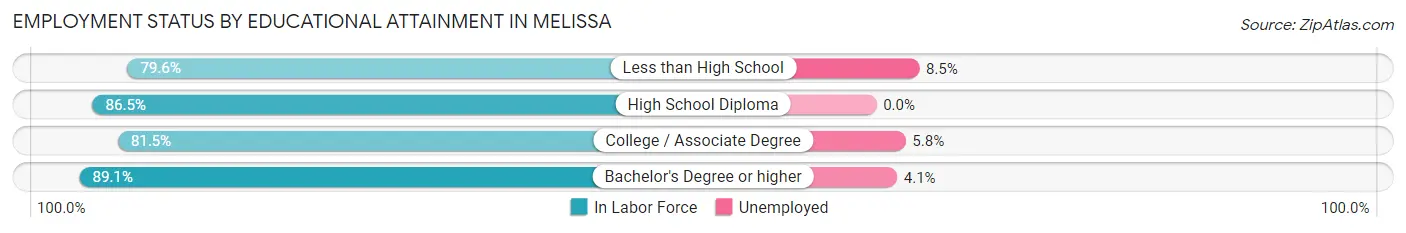
| Educational Attainment | In Labor Force | Unemployed |
| Less than High School | 129 (79.6%) | 14 (8.5%) |
| High School Diploma | 1,102 (86.5%) | 0 (0.0%) |
| College / Associate Degree | 2,139 (81.5%) | 152 (5.8%) |
| Bachelor's Degree or higher | 3,749 (89.1%) | 173 (4.1%) |
| Total | 7,120 (86.1%) | 339 (4.1%) |
Employment Occupations by Sex in Melissa
Management, Business, Science and Arts Occupations
The most common Management, Business, Science and Arts occupations in Melissa are Computers, Engineering & Science (1,211 | 16.2%), Management (879 | 11.8%), Community & Social Service (777 | 10.4%), Business & Financial (758 | 10.1%), and Computers & Mathematics (704 | 9.4%).
Management, Business, Science and Arts Occupations by Sex
Within the Management, Business, Science and Arts occupations in Melissa, the most male-oriented occupations are Architecture & Engineering (100.0%), Education, Arts & Media (77.3%), and Business & Financial (74.8%), while the most female-oriented occupations are Legal Services & Support (100.0%), Education Instruction & Library (93.9%), and Health Diagnosing & Treating (87.8%).
| Occupation | Male | Female |
| Management | 644 (73.3%) | 235 (26.7%) |
| Business & Financial | 567 (74.8%) | 191 (25.2%) |
| Computers, Engineering & Science | 900 (74.3%) | 311 (25.7%) |
| Computers & Mathematics | 495 (70.3%) | 209 (29.7%) |
| Architecture & Engineering | 213 (100.0%) | 0 (0.0%) |
| Life, Physical & Social Science | 192 (65.3%) | 102 (34.7%) |
| Community & Social Service | 139 (17.9%) | 638 (82.1%) |
| Education, Arts & Media | 58 (77.3%) | 17 (22.7%) |
| Legal Services & Support | 0 (0.0%) | 26 (100.0%) |
| Education Instruction & Library | 35 (6.1%) | 540 (93.9%) |
| Arts, Media & Entertainment | 46 (45.5%) | 55 (54.5%) |
| Health Diagnosing & Treating | 76 (12.2%) | 545 (87.8%) |
| Health Technologists | 76 (14.4%) | 451 (85.6%) |
| Total (Category) | 2,326 (54.8%) | 1,920 (45.2%) |
| Total (Overall) | 4,069 (54.4%) | 3,408 (45.6%) |
Services Occupations
The most common Services occupations in Melissa are Food Preparation & Serving (321 | 4.3%), Personal Care & Service (195 | 2.6%), Security & Protection (140 | 1.9%), Firefighting & Prevention (110 | 1.5%), and Cleaning & Maintenance (97 | 1.3%).
Services Occupations by Sex
Within the Services occupations in Melissa, the most male-oriented occupations are Law Enforcement (100.0%), Cleaning & Maintenance (84.5%), and Security & Protection (71.4%), while the most female-oriented occupations are Healthcare Support (85.4%), Personal Care & Service (51.3%), and Food Preparation & Serving (39.6%).
| Occupation | Male | Female |
| Healthcare Support | 12 (14.6%) | 70 (85.4%) |
| Security & Protection | 100 (71.4%) | 40 (28.6%) |
| Firefighting & Prevention | 70 (63.6%) | 40 (36.4%) |
| Law Enforcement | 30 (100.0%) | 0 (0.0%) |
| Food Preparation & Serving | 194 (60.4%) | 127 (39.6%) |
| Cleaning & Maintenance | 82 (84.5%) | 15 (15.5%) |
| Personal Care & Service | 95 (48.7%) | 100 (51.3%) |
| Total (Category) | 483 (57.8%) | 352 (42.2%) |
| Total (Overall) | 4,069 (54.4%) | 3,408 (45.6%) |
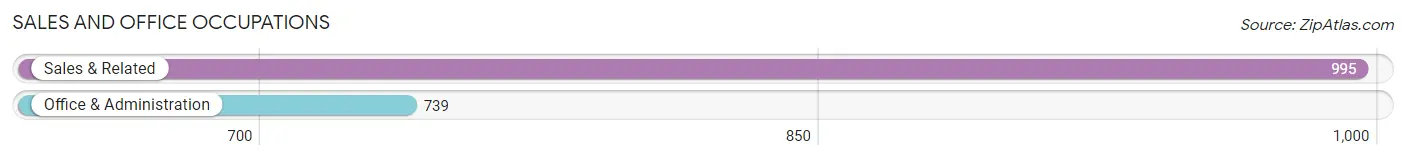
Sales and Office Occupations
The most common Sales and Office occupations in Melissa are Sales & Related (995 | 13.3%), and Office & Administration (739 | 9.9%).
Sales and Office Occupations by Sex
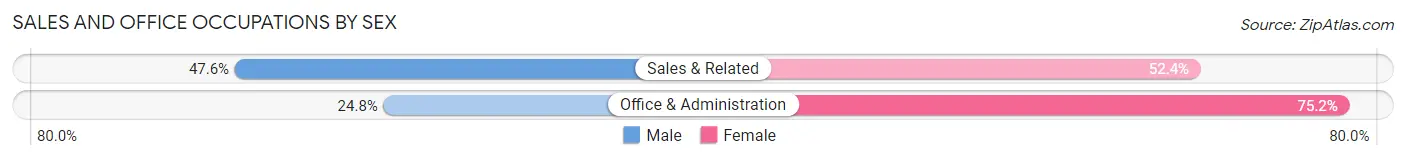
| Occupation | Male | Female |
| Sales & Related | 474 (47.6%) | 521 (52.4%) |
| Office & Administration | 183 (24.8%) | 556 (75.2%) |
| Total (Category) | 657 (37.9%) | 1,077 (62.1%) |
| Total (Overall) | 4,069 (54.4%) | 3,408 (45.6%) |
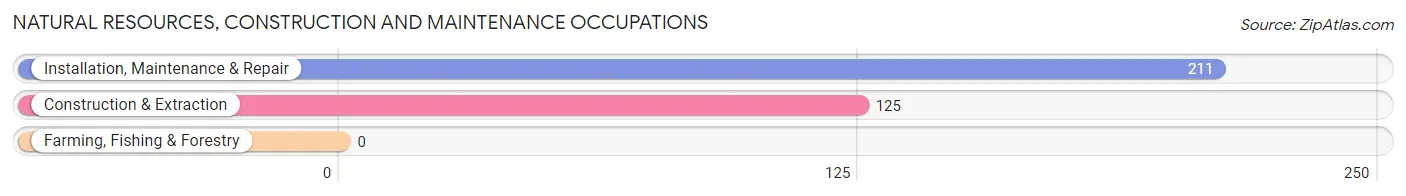
Natural Resources, Construction and Maintenance Occupations
The most common Natural Resources, Construction and Maintenance occupations in Melissa are Installation, Maintenance & Repair (211 | 2.8%), and Construction & Extraction (125 | 1.7%).
Natural Resources, Construction and Maintenance Occupations by Sex
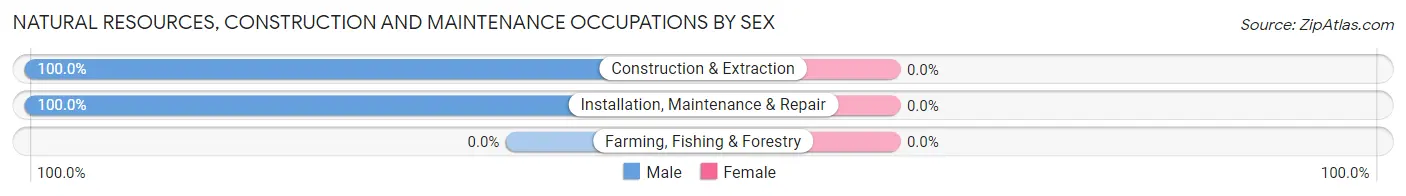
| Occupation | Male | Female |
| Farming, Fishing & Forestry | 0 (0.0%) | 0 (0.0%) |
| Construction & Extraction | 125 (100.0%) | 0 (0.0%) |
| Installation, Maintenance & Repair | 211 (100.0%) | 0 (0.0%) |
| Total (Category) | 336 (100.0%) | 0 (0.0%) |
| Total (Overall) | 4,069 (54.4%) | 3,408 (45.6%) |
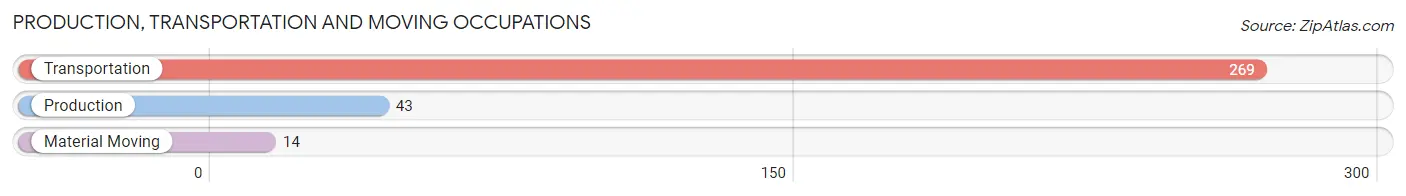
Production, Transportation and Moving Occupations
The most common Production, Transportation and Moving occupations in Melissa are Transportation (269 | 3.6%), Production (43 | 0.6%), and Material Moving (14 | 0.2%).
Production, Transportation and Moving Occupations by Sex
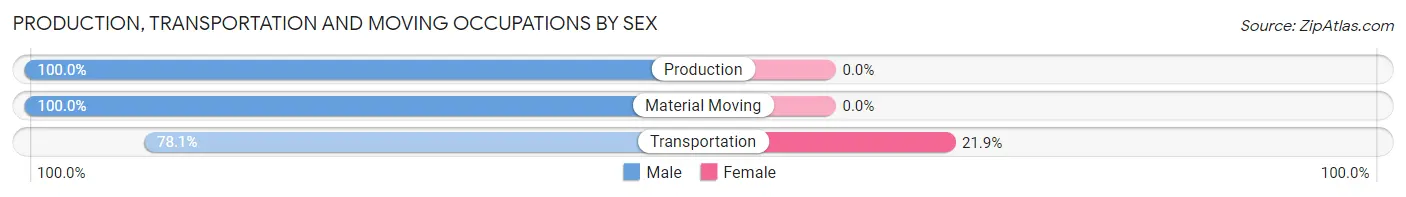
| Occupation | Male | Female |
| Production | 43 (100.0%) | 0 (0.0%) |
| Transportation | 210 (78.1%) | 59 (21.9%) |
| Material Moving | 14 (100.0%) | 0 (0.0%) |
| Total (Category) | 267 (81.9%) | 59 (18.1%) |
| Total (Overall) | 4,069 (54.4%) | 3,408 (45.6%) |
Employment Industries by Sex in Melissa
Employment Industries in Melissa
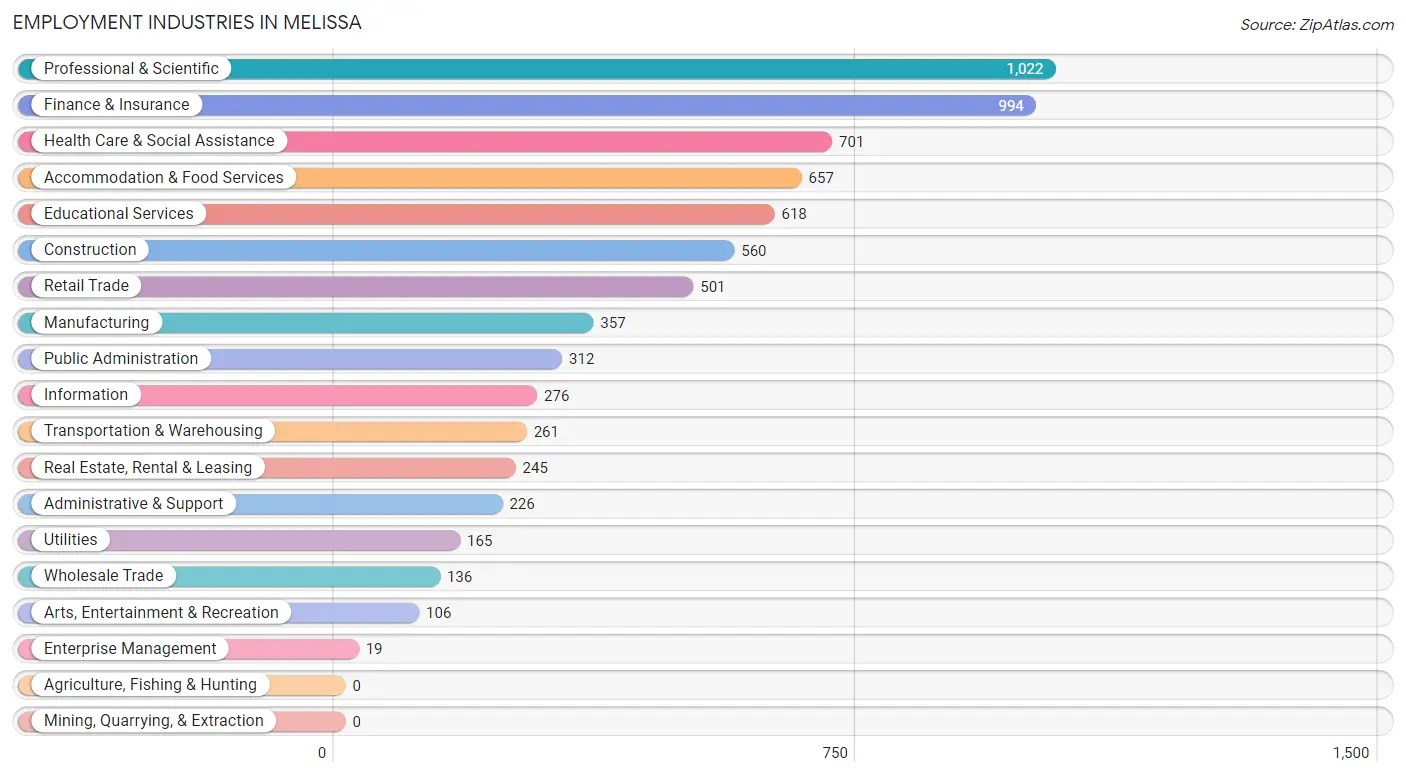
The major employment industries in Melissa include Professional & Scientific (1,022 | 13.7%), Finance & Insurance (994 | 13.3%), Health Care & Social Assistance (701 | 9.4%), Accommodation & Food Services (657 | 8.8%), and Educational Services (618 | 8.3%).
Employment Industries by Sex in Melissa
The Melissa industries that see more men than women are Utilities (100.0%), Enterprise Management (100.0%), and Wholesale Trade (89.7%), whereas the industries that tend to have a higher number of women are Arts, Entertainment & Recreation (100.0%), Health Care & Social Assistance (86.3%), and Educational Services (84.0%).
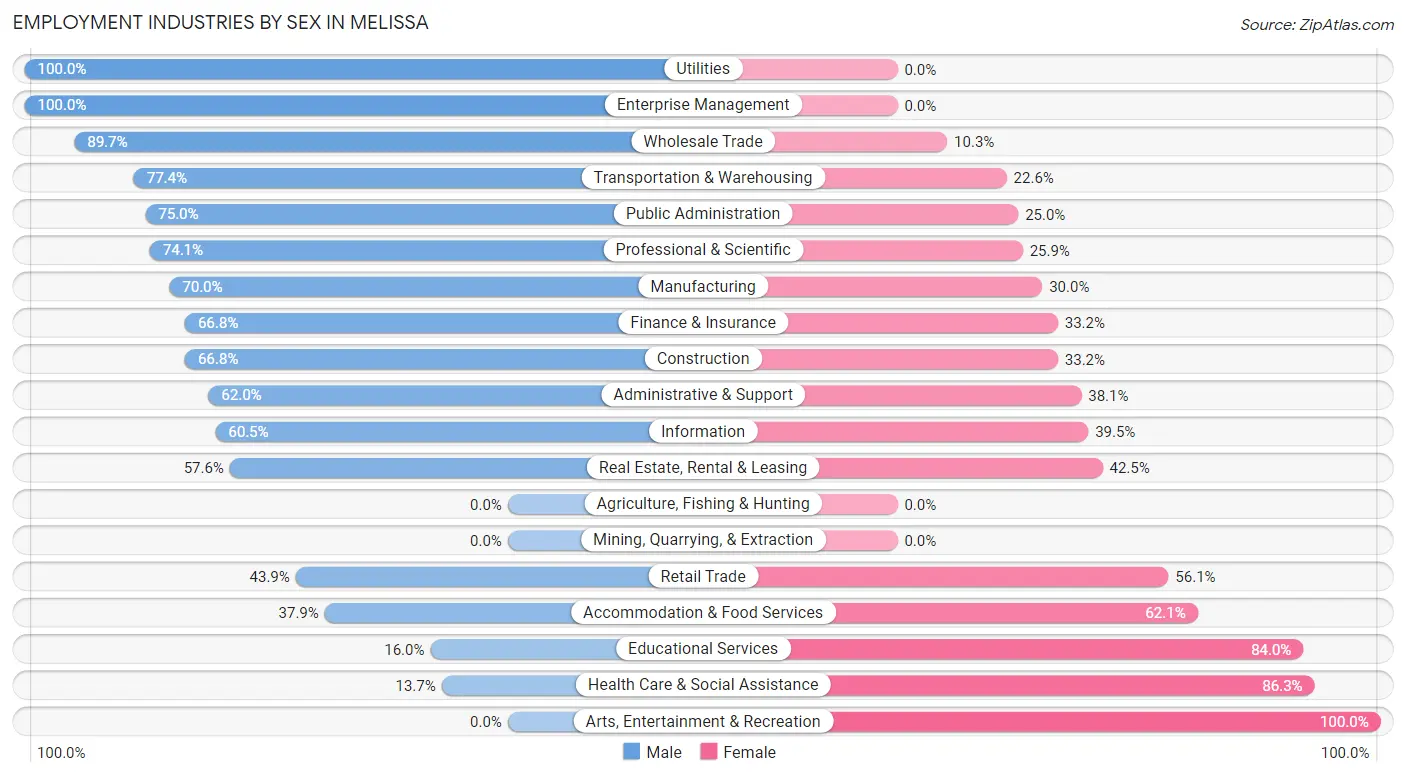
| Industry | Male | Female |
| Agriculture, Fishing & Hunting | 0 (0.0%) | 0 (0.0%) |
| Mining, Quarrying, & Extraction | 0 (0.0%) | 0 (0.0%) |
| Construction | 374 (66.8%) | 186 (33.2%) |
| Manufacturing | 250 (70.0%) | 107 (30.0%) |
| Wholesale Trade | 122 (89.7%) | 14 (10.3%) |
| Retail Trade | 220 (43.9%) | 281 (56.1%) |
| Transportation & Warehousing | 202 (77.4%) | 59 (22.6%) |
| Utilities | 165 (100.0%) | 0 (0.0%) |
| Information | 167 (60.5%) | 109 (39.5%) |
| Finance & Insurance | 664 (66.8%) | 330 (33.2%) |
| Real Estate, Rental & Leasing | 141 (57.6%) | 104 (42.4%) |
| Professional & Scientific | 757 (74.1%) | 265 (25.9%) |
| Enterprise Management | 19 (100.0%) | 0 (0.0%) |
| Administrative & Support | 140 (62.0%) | 86 (38.1%) |
| Educational Services | 99 (16.0%) | 519 (84.0%) |
| Health Care & Social Assistance | 96 (13.7%) | 605 (86.3%) |
| Arts, Entertainment & Recreation | 0 (0.0%) | 106 (100.0%) |
| Accommodation & Food Services | 249 (37.9%) | 408 (62.1%) |
| Public Administration | 234 (75.0%) | 78 (25.0%) |
| Total | 4,069 (54.4%) | 3,408 (45.6%) |
Education in Melissa
School Enrollment in Melissa
The most common levels of schooling among the 4,844 students in Melissa are middle school (1,174 | 24.2%), elementary school (1,119 | 23.1%), and high school (916 | 18.9%).
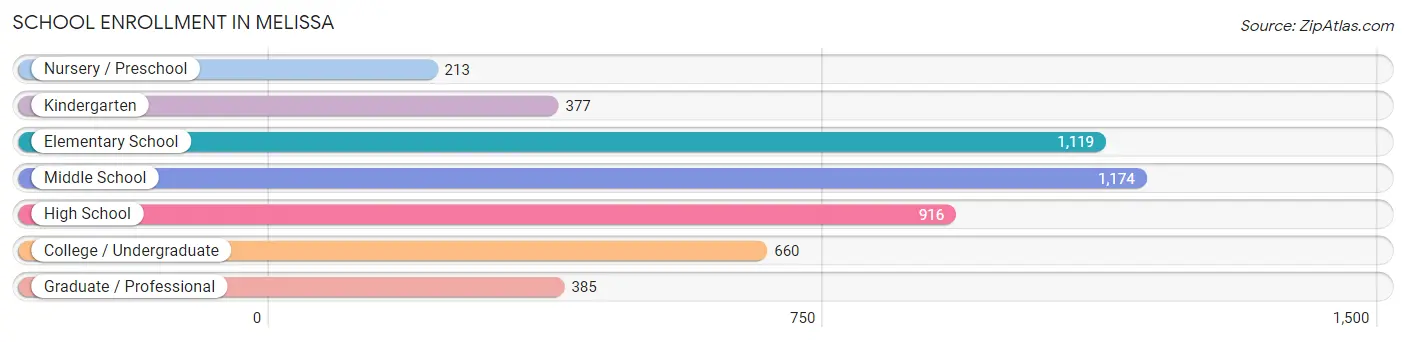
| School Level | # Students | % Students |
| Nursery / Preschool | 213 | 4.4% |
| Kindergarten | 377 | 7.8% |
| Elementary School | 1,119 | 23.1% |
| Middle School | 1,174 | 24.2% |
| High School | 916 | 18.9% |
| College / Undergraduate | 660 | 13.6% |
| Graduate / Professional | 385 | 8.0% |
| Total | 4,844 | 100.0% |
School Enrollment by Age by Funding Source in Melissa
Out of a total of 4,844 students who are enrolled in schools in Melissa, 867 (17.9%) attend a private institution, while the remaining 3,977 (82.1%) are enrolled in public schools. The age group of 35 years and over has the highest likelihood of being enrolled in private schools, with 349 (71.5% in the age bracket) enrolled. Conversely, the age group of 18 to 19 year olds has the lowest likelihood of being enrolled in a private school, with 91 (100.0% in the age bracket) attending a public institution.
| Age Bracket | Public School | Private School |
| 3 to 4 Year Olds | 245 (85.7%) | 41 (14.3%) |
| 5 to 9 Year Old | 1,092 (81.1%) | 254 (18.9%) |
| 10 to 14 Year Olds | 1,316 (92.3%) | 110 (7.7%) |
| 15 to 17 Year Olds | 681 (99.0%) | 7 (1.0%) |
| 18 to 19 Year Olds | 91 (100.0%) | 0 (0.0%) |
| 20 to 24 Year Olds | 222 (100.0%) | 0 (0.0%) |
| 25 to 34 Year Olds | 192 (64.6%) | 105 (35.3%) |
| 35 Years and over | 139 (28.5%) | 349 (71.5%) |
| Total | 3,977 (82.1%) | 867 (17.9%) |
Educational Attainment by Field of Study in Melissa
Business (1,033 | 19.4%), arts & humanities (889 | 16.7%), science & technology (750 | 14.1%), computers & mathematics (638 | 12.0%), and education (453 | 8.5%) are the most common fields of study among 5,324 individuals in Melissa who have obtained a bachelor's degree or higher.
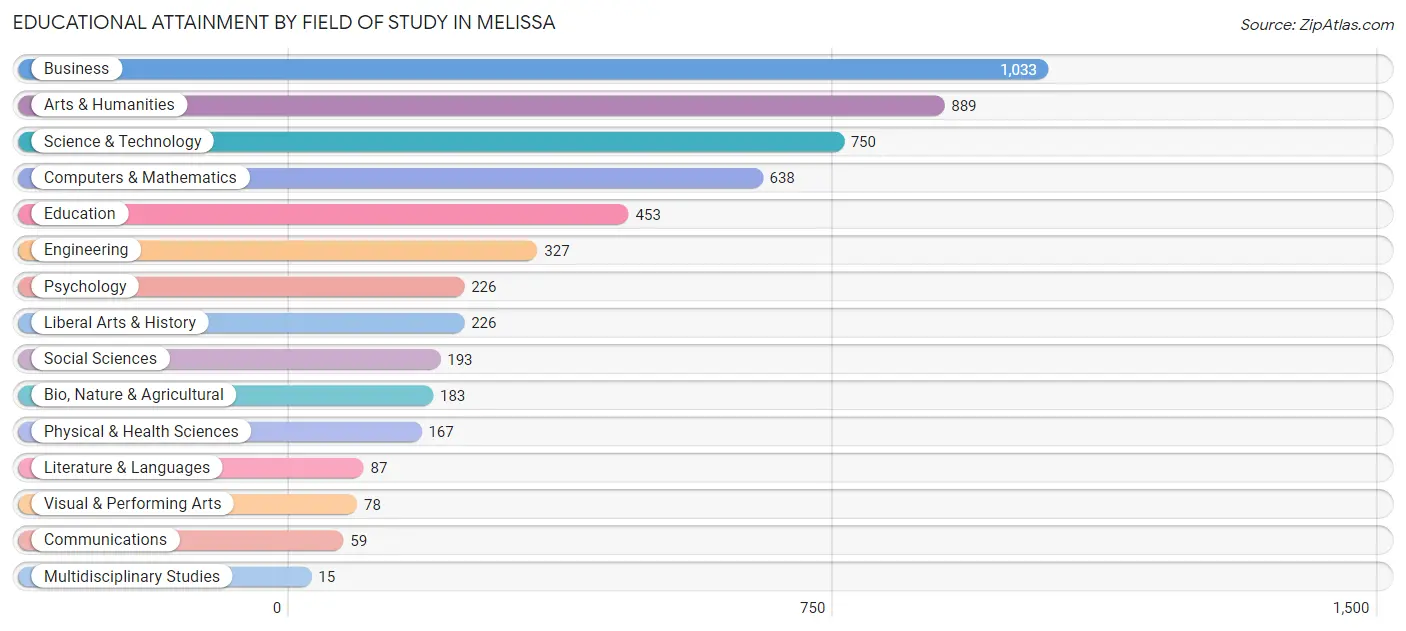
| Field of Study | # Graduates | % Graduates |
| Computers & Mathematics | 638 | 12.0% |
| Bio, Nature & Agricultural | 183 | 3.4% |
| Physical & Health Sciences | 167 | 3.1% |
| Psychology | 226 | 4.2% |
| Social Sciences | 193 | 3.6% |
| Engineering | 327 | 6.1% |
| Multidisciplinary Studies | 15 | 0.3% |
| Science & Technology | 750 | 14.1% |
| Business | 1,033 | 19.4% |
| Education | 453 | 8.5% |
| Literature & Languages | 87 | 1.6% |
| Liberal Arts & History | 226 | 4.2% |
| Visual & Performing Arts | 78 | 1.5% |
| Communications | 59 | 1.1% |
| Arts & Humanities | 889 | 16.7% |
| Total | 5,324 | 100.0% |
Transportation & Commute in Melissa
Vehicle Availability by Sex in Melissa
The most prevalent vehicle ownership categories in Melissa are males with 2 vehicles (1,759, accounting for 43.2%) and females with 2 vehicles (1,010, making up 51.7%).
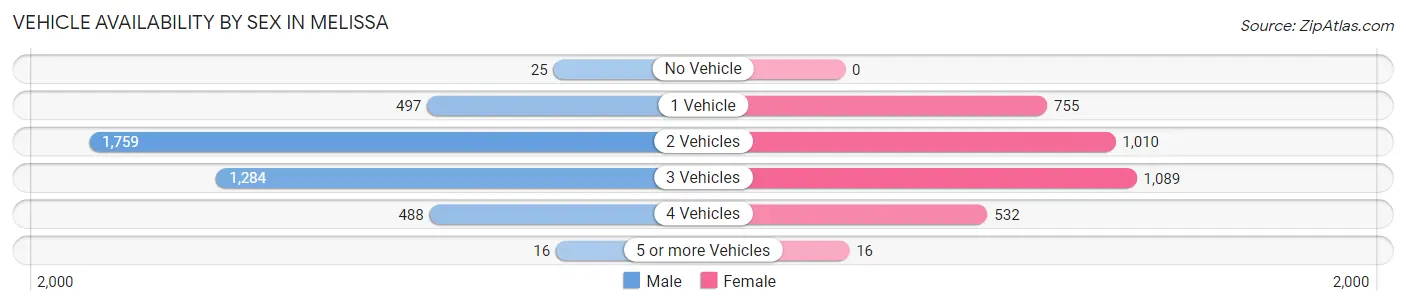
| Vehicles Available | Male | Female |
| No Vehicle | 25 (0.6%) | 0 (0.0%) |
| 1 Vehicle | 497 (12.2%) | 755 (22.2%) |
| 2 Vehicles | 1,759 (43.2%) | 1,010 (29.7%) |
| 3 Vehicles | 1,284 (31.6%) | 1,089 (32.0%) |
| 4 Vehicles | 488 (12.0%) | 532 (15.6%) |
| 5 or more Vehicles | 16 (0.4%) | 16 (0.5%) |
| Total | 4,069 (100.0%) | 3,402 (100.0%) |
Commute Time in Melissa
The most frequently occuring commute durations in Melissa are 30 to 34 minutes (1,151 commuters, 20.2%), 45 to 59 minutes (998 commuters, 17.5%), and 60 to 89 minutes (682 commuters, 12.0%).
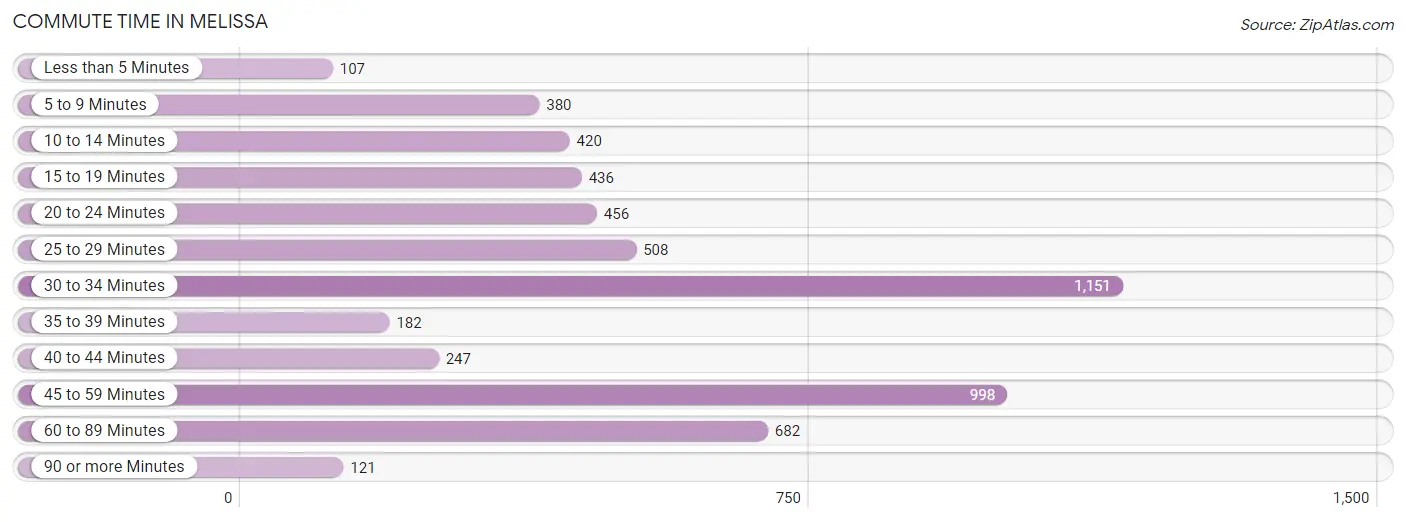
| Commute Time | # Commuters | % Commuters |
| Less than 5 Minutes | 107 | 1.9% |
| 5 to 9 Minutes | 380 | 6.7% |
| 10 to 14 Minutes | 420 | 7.4% |
| 15 to 19 Minutes | 436 | 7.7% |
| 20 to 24 Minutes | 456 | 8.0% |
| 25 to 29 Minutes | 508 | 8.9% |
| 30 to 34 Minutes | 1,151 | 20.2% |
| 35 to 39 Minutes | 182 | 3.2% |
| 40 to 44 Minutes | 247 | 4.3% |
| 45 to 59 Minutes | 998 | 17.5% |
| 60 to 89 Minutes | 682 | 12.0% |
| 90 or more Minutes | 121 | 2.1% |
Commute Time by Sex in Melissa
The most common commute times in Melissa are 30 to 34 minutes (750 commuters, 25.8%) for males and 45 to 59 minutes (504 commuters, 18.1%) for females.
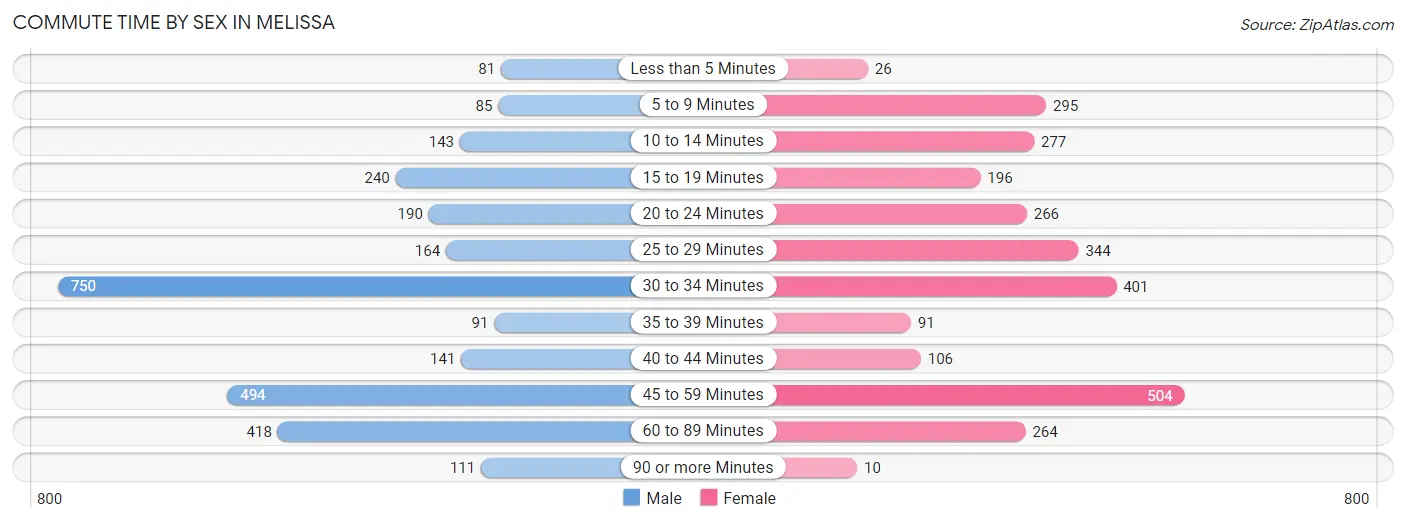
| Commute Time | Male | Female |
| Less than 5 Minutes | 81 (2.8%) | 26 (0.9%) |
| 5 to 9 Minutes | 85 (2.9%) | 295 (10.6%) |
| 10 to 14 Minutes | 143 (4.9%) | 277 (10.0%) |
| 15 to 19 Minutes | 240 (8.3%) | 196 (7.0%) |
| 20 to 24 Minutes | 190 (6.5%) | 266 (9.6%) |
| 25 to 29 Minutes | 164 (5.6%) | 344 (12.4%) |
| 30 to 34 Minutes | 750 (25.8%) | 401 (14.4%) |
| 35 to 39 Minutes | 91 (3.1%) | 91 (3.3%) |
| 40 to 44 Minutes | 141 (4.9%) | 106 (3.8%) |
| 45 to 59 Minutes | 494 (17.0%) | 504 (18.1%) |
| 60 to 89 Minutes | 418 (14.4%) | 264 (9.5%) |
| 90 or more Minutes | 111 (3.8%) | 10 (0.4%) |
Time of Departure to Work by Sex in Melissa
The most frequent times of departure to work in Melissa are 7:00 AM to 7:29 AM (789, 27.1%) for males and 6:30 AM to 6:59 AM (544, 19.6%) for females.
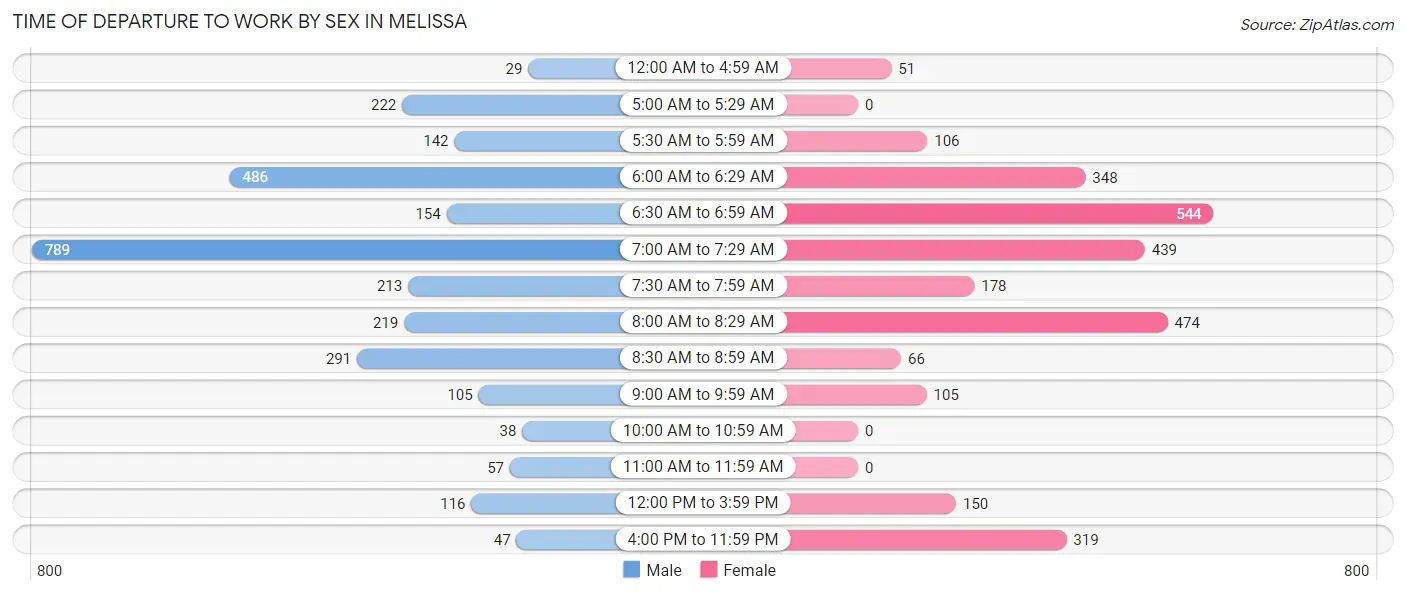
| Time of Departure | Male | Female |
| 12:00 AM to 4:59 AM | 29 (1.0%) | 51 (1.8%) |
| 5:00 AM to 5:29 AM | 222 (7.6%) | 0 (0.0%) |
| 5:30 AM to 5:59 AM | 142 (4.9%) | 106 (3.8%) |
| 6:00 AM to 6:29 AM | 486 (16.7%) | 348 (12.5%) |
| 6:30 AM to 6:59 AM | 154 (5.3%) | 544 (19.6%) |
| 7:00 AM to 7:29 AM | 789 (27.1%) | 439 (15.8%) |
| 7:30 AM to 7:59 AM | 213 (7.3%) | 178 (6.4%) |
| 8:00 AM to 8:29 AM | 219 (7.5%) | 474 (17.1%) |
| 8:30 AM to 8:59 AM | 291 (10.0%) | 66 (2.4%) |
| 9:00 AM to 9:59 AM | 105 (3.6%) | 105 (3.8%) |
| 10:00 AM to 10:59 AM | 38 (1.3%) | 0 (0.0%) |
| 11:00 AM to 11:59 AM | 57 (2.0%) | 0 (0.0%) |
| 12:00 PM to 3:59 PM | 116 (4.0%) | 150 (5.4%) |
| 4:00 PM to 11:59 PM | 47 (1.6%) | 319 (11.5%) |
| Total | 2,908 (100.0%) | 2,780 (100.0%) |
Housing Occupancy in Melissa
Occupancy by Ownership in Melissa
Of the total 4,815 dwellings in Melissa, owner-occupied units account for 4,330 (89.9%), while renter-occupied units make up 485 (10.1%).
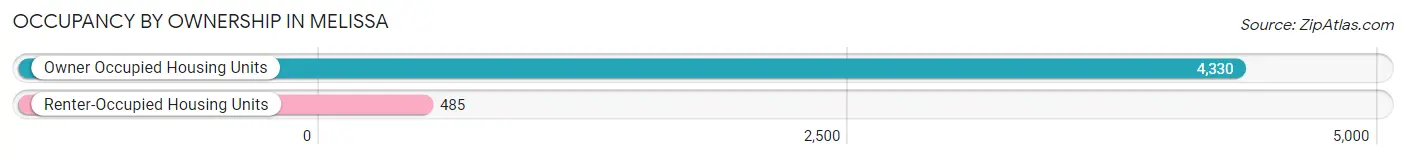
| Occupancy | # Housing Units | % Housing Units |
| Owner Occupied Housing Units | 4,330 | 89.9% |
| Renter-Occupied Housing Units | 485 | 10.1% |
| Total Occupied Housing Units | 4,815 | 100.0% |
Occupancy by Household Size in Melissa
| Household Size | # Housing Units | % Housing Units |
| 1-Person Household | 454 | 9.4% |
| 2-Person Household | 978 | 20.3% |
| 3-Person Household | 1,536 | 31.9% |
| 4+ Person Household | 1,847 | 38.4% |
| Total Housing Units | 4,815 | 100.0% |
Occupancy by Ownership by Household Size in Melissa
| Household Size | Owner-occupied | Renter-occupied |
| 1-Person Household | 404 (89.0%) | 50 (11.0%) |
| 2-Person Household | 881 (90.1%) | 97 (9.9%) |
| 3-Person Household | 1,371 (89.3%) | 165 (10.7%) |
| 4+ Person Household | 1,674 (90.6%) | 173 (9.4%) |
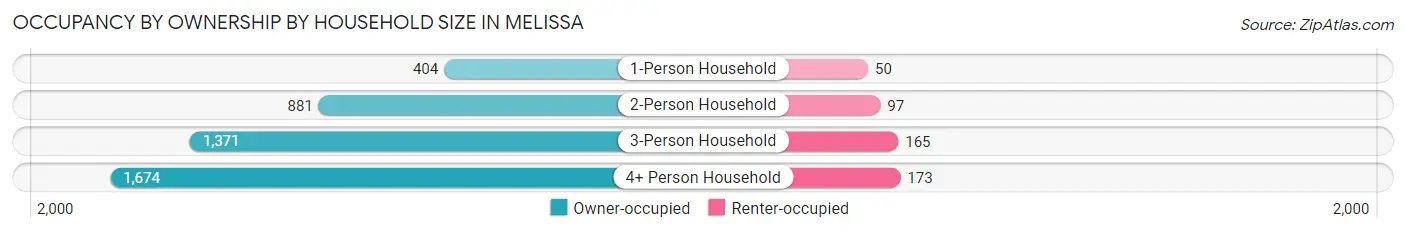
| Total Housing Units | 4,330 (89.9%) | 485 (10.1%) |
Occupancy by Educational Attainment in Melissa
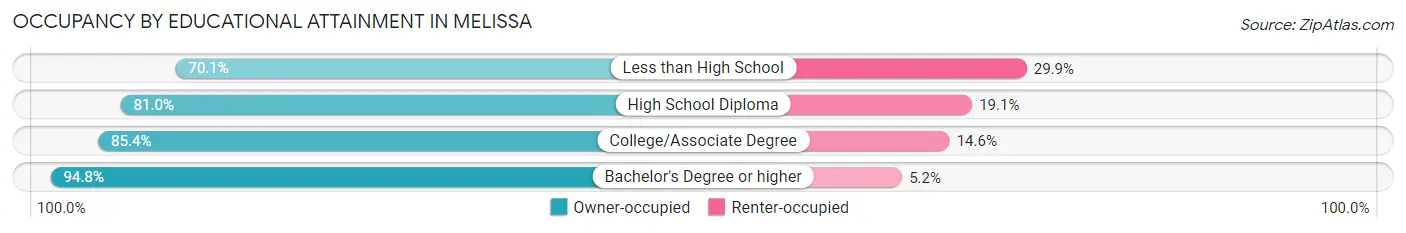
| Household Size | Owner-occupied | Renter-occupied |
| Less than High School | 169 (70.1%) | 72 (29.9%) |
| High School Diploma | 391 (80.9%) | 92 (19.1%) |
| College/Associate Degree | 995 (85.4%) | 170 (14.6%) |
| Bachelor's Degree or higher | 2,775 (94.8%) | 151 (5.2%) |
Occupancy by Age of Householder in Melissa
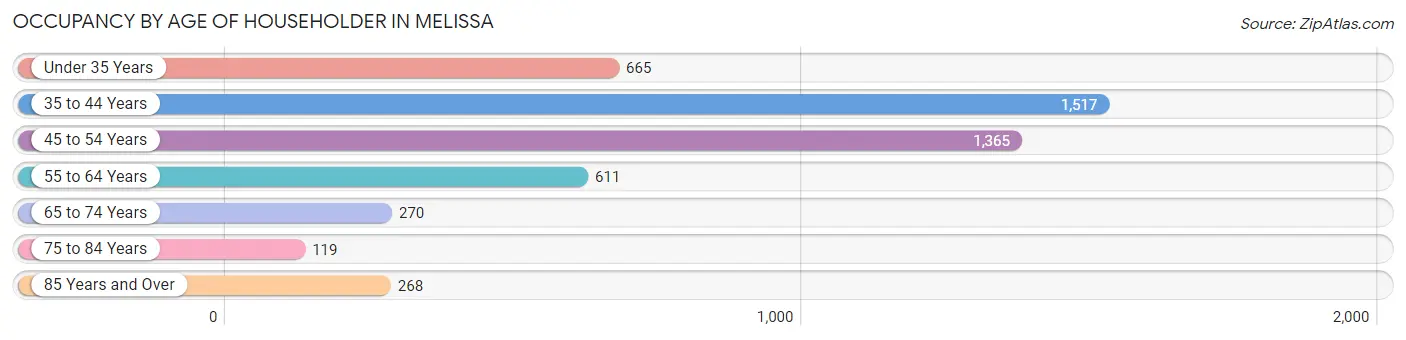
| Age Bracket | # Households | % Households |
| Under 35 Years | 665 | 13.8% |
| 35 to 44 Years | 1,517 | 31.5% |
| 45 to 54 Years | 1,365 | 28.3% |
| 55 to 64 Years | 611 | 12.7% |
| 65 to 74 Years | 270 | 5.6% |
| 75 to 84 Years | 119 | 2.5% |
| 85 Years and Over | 268 | 5.6% |
| Total | 4,815 | 100.0% |
Housing Finances in Melissa
Median Income by Occupancy in Melissa
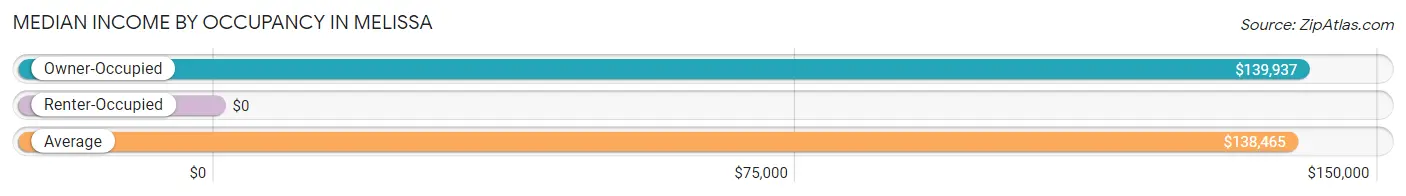
| Occupancy Type | # Households | Median Income |
| Owner-Occupied | 4,330 (89.9%) | $139,937 |
| Renter-Occupied | 485 (10.1%) | $0 |
| Average | 4,815 (100.0%) | $138,465 |
Occupancy by Householder Income Bracket in Melissa
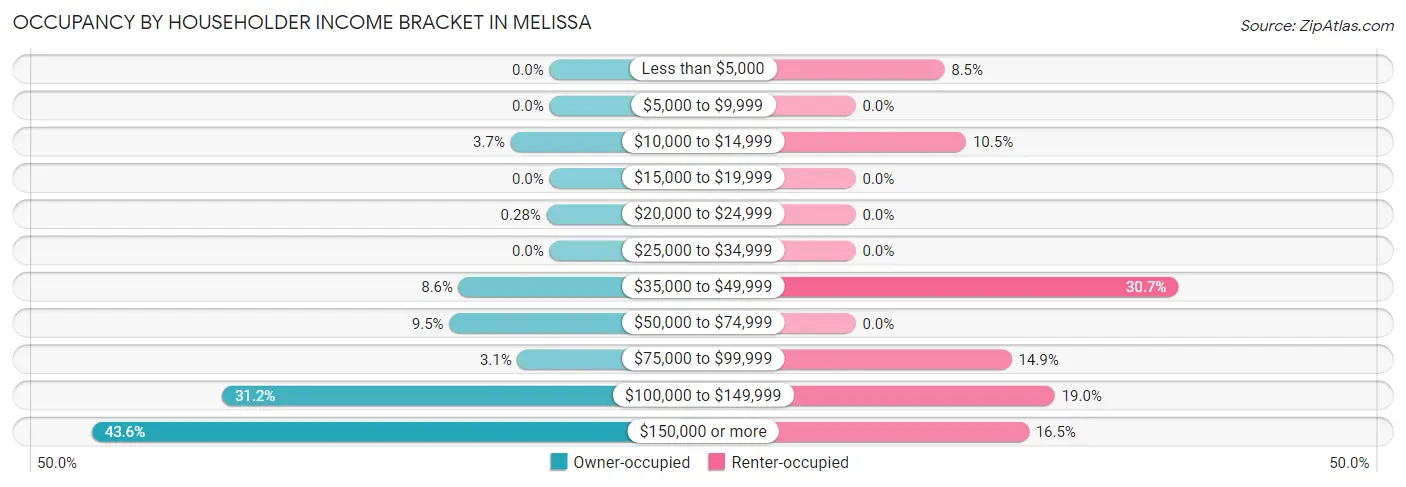
| Income Bracket | Owner-occupied | Renter-occupied |
| Less than $5,000 | 0 (0.0%) | 41 (8.5%) |
| $5,000 to $9,999 | 0 (0.0%) | 0 (0.0%) |
| $10,000 to $14,999 | 160 (3.7%) | 51 (10.5%) |
| $15,000 to $19,999 | 0 (0.0%) | 0 (0.0%) |
| $20,000 to $24,999 | 12 (0.3%) | 0 (0.0%) |
| $25,000 to $34,999 | 0 (0.0%) | 0 (0.0%) |
| $35,000 to $49,999 | 374 (8.6%) | 149 (30.7%) |
| $50,000 to $74,999 | 413 (9.5%) | 0 (0.0%) |
| $75,000 to $99,999 | 132 (3.0%) | 72 (14.8%) |
| $100,000 to $149,999 | 1,351 (31.2%) | 92 (19.0%) |
| $150,000 or more | 1,888 (43.6%) | 80 (16.5%) |
| Total | 4,330 (100.0%) | 485 (100.0%) |
Monthly Housing Cost Tiers in Melissa
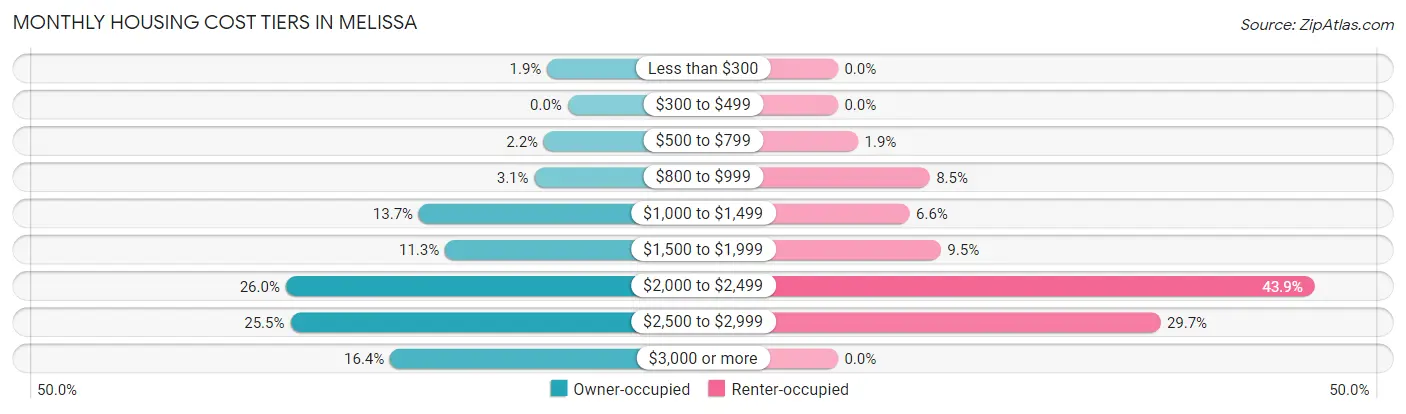
| Monthly Cost | Owner-occupied | Renter-occupied |
| Less than $300 | 82 (1.9%) | 0 (0.0%) |
| $300 to $499 | 0 (0.0%) | 0 (0.0%) |
| $500 to $799 | 95 (2.2%) | 9 (1.9%) |
| $800 to $999 | 133 (3.1%) | 41 (8.5%) |
| $1,000 to $1,499 | 593 (13.7%) | 32 (6.6%) |
| $1,500 to $1,999 | 489 (11.3%) | 46 (9.5%) |
| $2,000 to $2,499 | 1,124 (26.0%) | 213 (43.9%) |
| $2,500 to $2,999 | 1,106 (25.5%) | 144 (29.7%) |
| $3,000 or more | 708 (16.4%) | 0 (0.0%) |
| Total | 4,330 (100.0%) | 485 (100.0%) |
Physical Housing Characteristics in Melissa
Housing Structures in Melissa
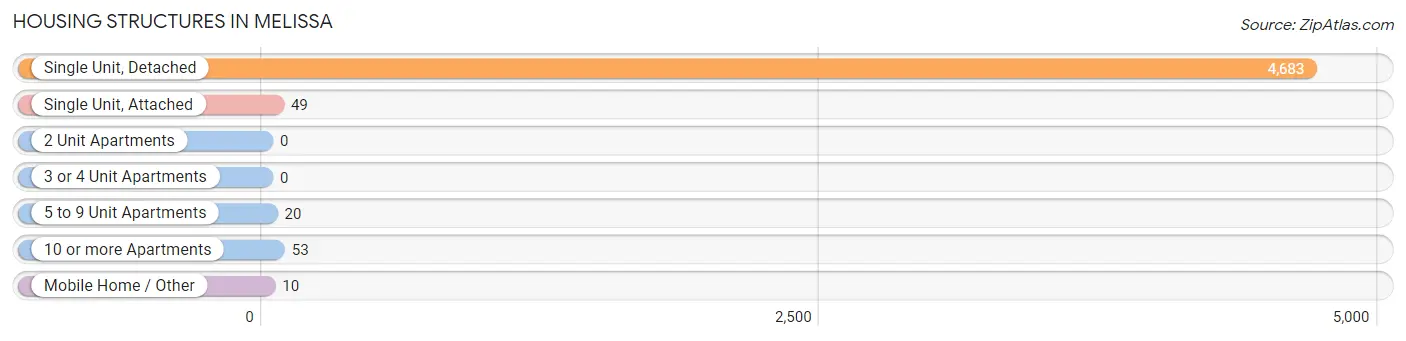
| Structure Type | # Housing Units | % Housing Units |
| Single Unit, Detached | 4,683 | 97.3% |
| Single Unit, Attached | 49 | 1.0% |
| 2 Unit Apartments | 0 | 0.0% |
| 3 or 4 Unit Apartments | 0 | 0.0% |
| 5 to 9 Unit Apartments | 20 | 0.4% |
| 10 or more Apartments | 53 | 1.1% |
| Mobile Home / Other | 10 | 0.2% |
| Total | 4,815 | 100.0% |
Housing Structures by Occupancy in Melissa
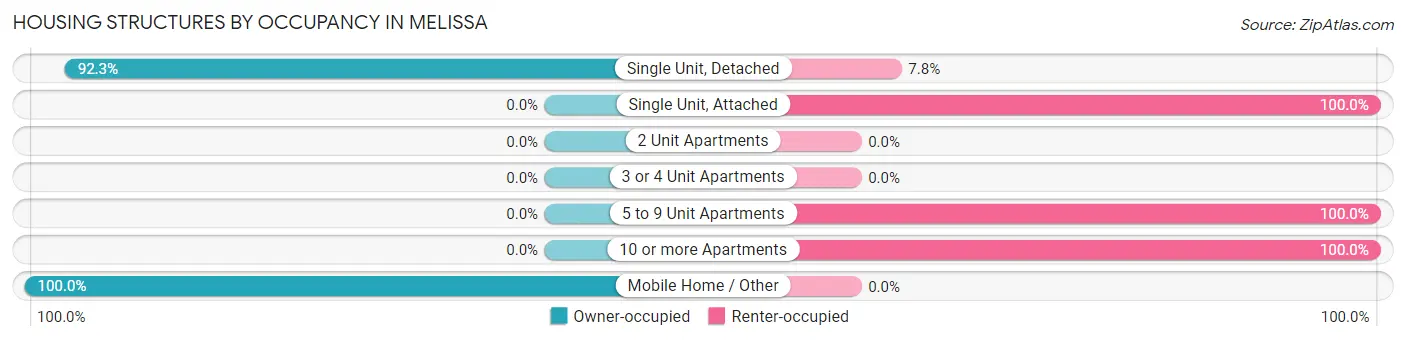
| Structure Type | Owner-occupied | Renter-occupied |
| Single Unit, Detached | 4,320 (92.2%) | 363 (7.7%) |
| Single Unit, Attached | 0 (0.0%) | 49 (100.0%) |
| 2 Unit Apartments | 0 (0.0%) | 0 (0.0%) |
| 3 or 4 Unit Apartments | 0 (0.0%) | 0 (0.0%) |
| 5 to 9 Unit Apartments | 0 (0.0%) | 20 (100.0%) |
| 10 or more Apartments | 0 (0.0%) | 53 (100.0%) |
| Mobile Home / Other | 10 (100.0%) | 0 (0.0%) |
| Total | 4,330 (89.9%) | 485 (10.1%) |
Housing Structures by Number of Rooms in Melissa
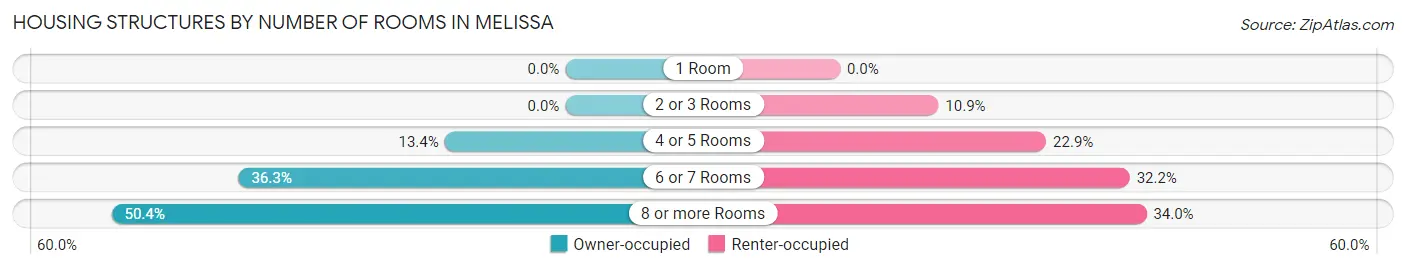
| Number of Rooms | Owner-occupied | Renter-occupied |
| 1 Room | 0 (0.0%) | 0 (0.0%) |
| 2 or 3 Rooms | 0 (0.0%) | 53 (10.9%) |
| 4 or 5 Rooms | 580 (13.4%) | 111 (22.9%) |
| 6 or 7 Rooms | 1,570 (36.3%) | 156 (32.2%) |
| 8 or more Rooms | 2,180 (50.3%) | 165 (34.0%) |
| Total | 4,330 (100.0%) | 485 (100.0%) |
Housing Structure by Heating Type in Melissa
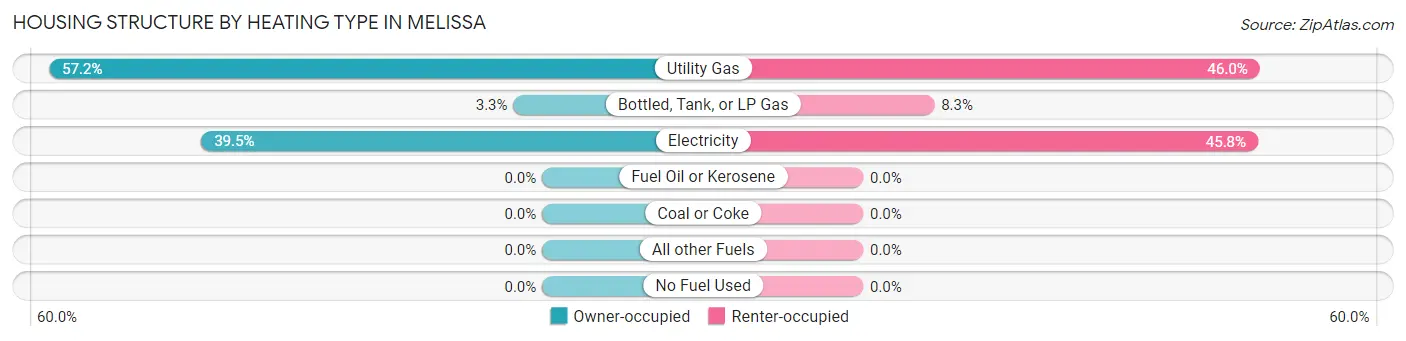
| Heating Type | Owner-occupied | Renter-occupied |
| Utility Gas | 2,475 (57.2%) | 223 (46.0%) |
| Bottled, Tank, or LP Gas | 144 (3.3%) | 40 (8.3%) |
| Electricity | 1,711 (39.5%) | 222 (45.8%) |
| Fuel Oil or Kerosene | 0 (0.0%) | 0 (0.0%) |
| Coal or Coke | 0 (0.0%) | 0 (0.0%) |
| All other Fuels | 0 (0.0%) | 0 (0.0%) |
| No Fuel Used | 0 (0.0%) | 0 (0.0%) |
| Total | 4,330 (100.0%) | 485 (100.0%) |
Household Vehicle Usage in Melissa
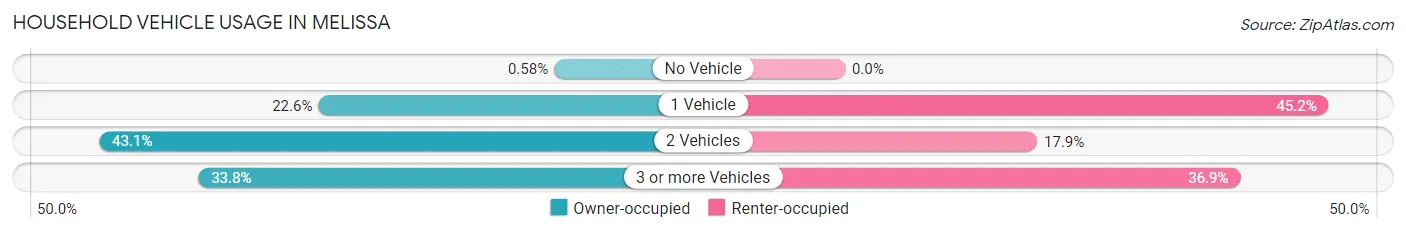
| Vehicles per Household | Owner-occupied | Renter-occupied |
| No Vehicle | 25 (0.6%) | 0 (0.0%) |
| 1 Vehicle | 978 (22.6%) | 219 (45.2%) |
| 2 Vehicles | 1,864 (43.0%) | 87 (17.9%) |
| 3 or more Vehicles | 1,463 (33.8%) | 179 (36.9%) |
| Total | 4,330 (100.0%) | 485 (100.0%) |
Real Estate & Mortgages in Melissa
Real Estate and Mortgage Overview in Melissa
| Characteristic | Without Mortgage | With Mortgage |
| Housing Units | 690 | 3,640 |
| Median Property Value | $347,700 | $376,500 |
| Median Household Income | $59,038 | $1,743 |
| Monthly Housing Costs | $1,122 | $708 |
| Real Estate Taxes | $6,290 | $76 |
Property Value by Mortgage Status in Melissa
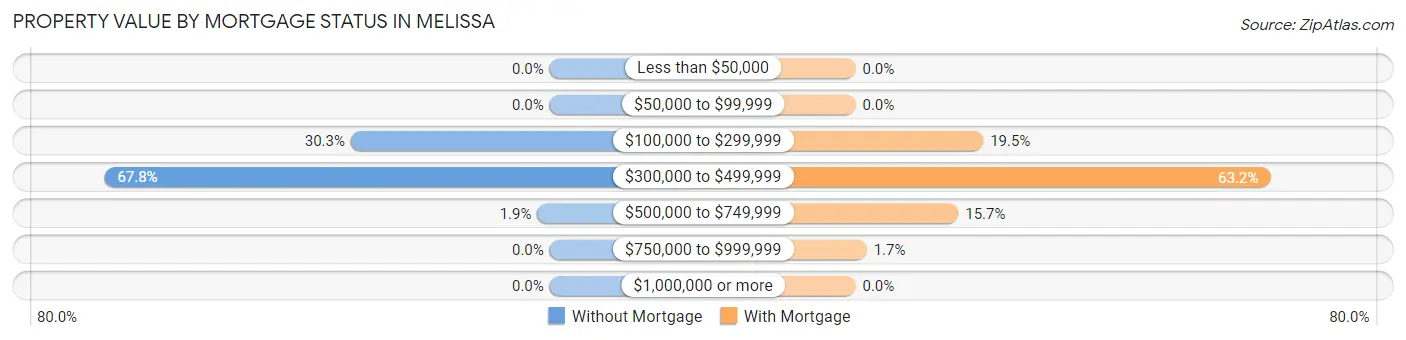
| Property Value | Without Mortgage | With Mortgage |
| Less than $50,000 | 0 (0.0%) | 0 (0.0%) |
| $50,000 to $99,999 | 0 (0.0%) | 0 (0.0%) |
| $100,000 to $299,999 | 209 (30.3%) | 708 (19.5%) |
| $300,000 to $499,999 | 468 (67.8%) | 2,300 (63.2%) |
| $500,000 to $749,999 | 13 (1.9%) | 570 (15.7%) |
| $750,000 to $999,999 | 0 (0.0%) | 62 (1.7%) |
| $1,000,000 or more | 0 (0.0%) | 0 (0.0%) |
| Total | 690 (100.0%) | 3,640 (100.0%) |
Household Income by Mortgage Status in Melissa
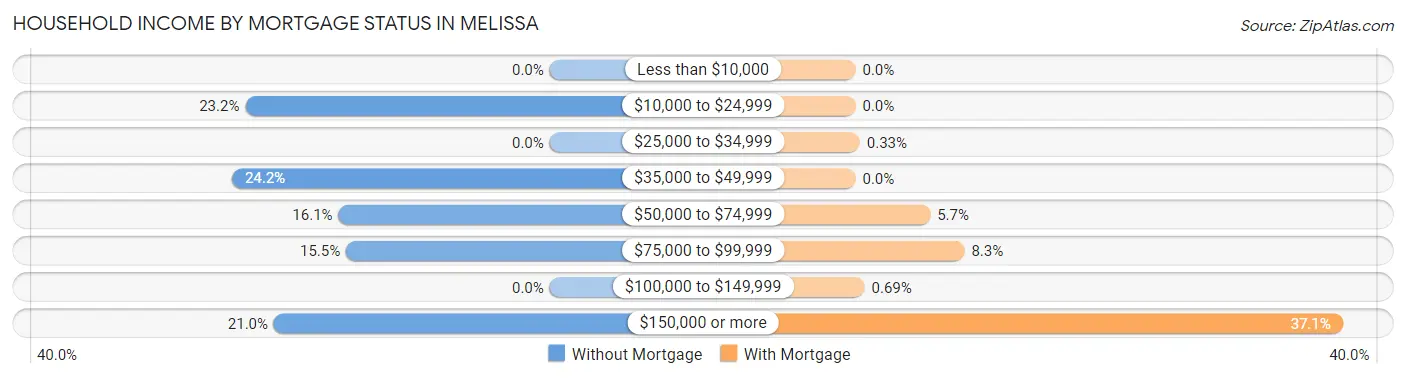
| Household Income | Without Mortgage | With Mortgage |
| Less than $10,000 | 0 (0.0%) | 0 (0.0%) |
| $10,000 to $24,999 | 160 (23.2%) | 0 (0.0%) |
| $25,000 to $34,999 | 0 (0.0%) | 12 (0.3%) |
| $35,000 to $49,999 | 167 (24.2%) | 0 (0.0%) |
| $50,000 to $74,999 | 111 (16.1%) | 207 (5.7%) |
| $75,000 to $99,999 | 107 (15.5%) | 302 (8.3%) |
| $100,000 to $149,999 | 0 (0.0%) | 25 (0.7%) |
| $150,000 or more | 145 (21.0%) | 1,351 (37.1%) |
| Total | 690 (100.0%) | 3,640 (100.0%) |
Property Value to Household Income Ratio in Melissa
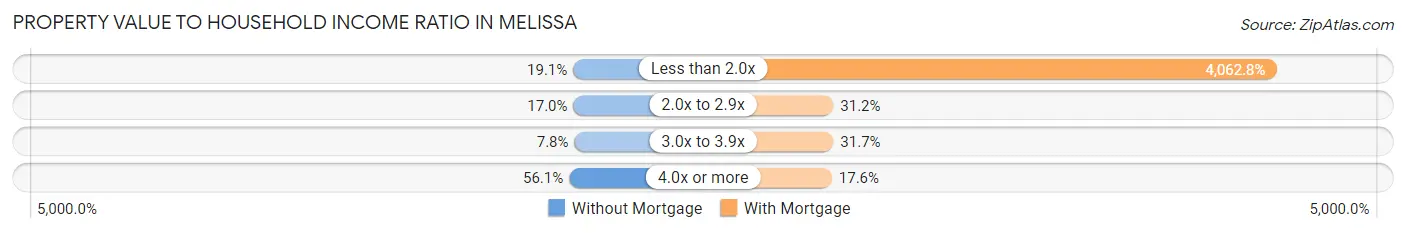
| Value-to-Income Ratio | Without Mortgage | With Mortgage |
| Less than 2.0x | 132 (19.1%) | 147,885 (4,062.8%) |
| 2.0x to 2.9x | 117 (17.0%) | 1,136 (31.2%) |
| 3.0x to 3.9x | 54 (7.8%) | 1,154 (31.7%) |
| 4.0x or more | 387 (56.1%) | 639 (17.5%) |
| Total | 690 (100.0%) | 3,640 (100.0%) |
Real Estate Taxes by Mortgage Status in Melissa

| Property Taxes | Without Mortgage | With Mortgage |
| Less than $800 | 82 (11.9%) | 0 (0.0%) |
| $800 to $1,499 | 0 (0.0%) | 0 (0.0%) |
| $800 to $1,499 | 608 (88.1%) | 0 (0.0%) |
| Total | 690 (100.0%) | 3,640 (100.0%) |
Health & Disability in Melissa
Health Insurance Coverage by Age in Melissa
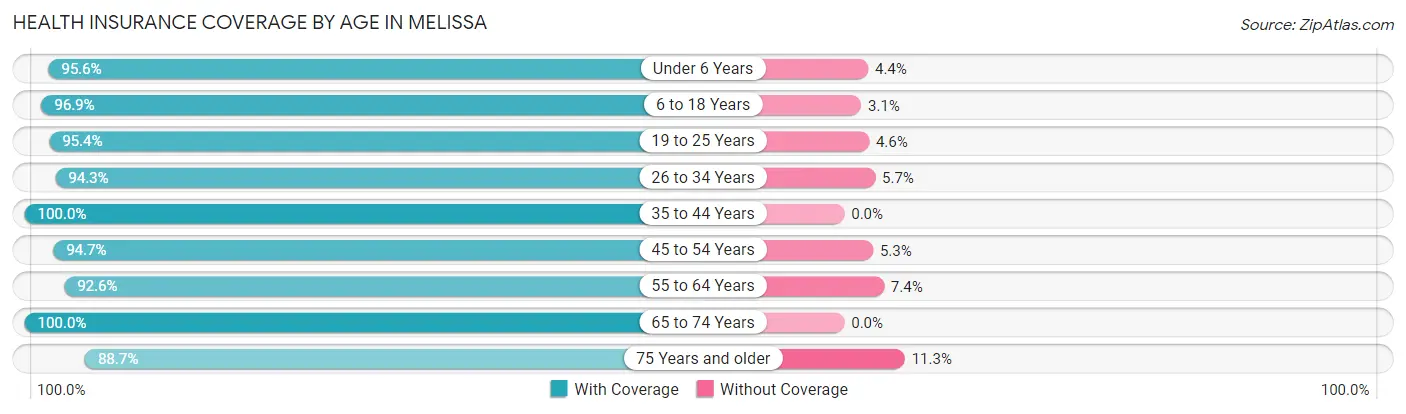
| Age Bracket | With Coverage | Without Coverage |
| Under 6 Years | 1,682 (95.6%) | 78 (4.4%) |
| 6 to 18 Years | 3,033 (96.9%) | 98 (3.1%) |
| 19 to 25 Years | 871 (95.4%) | 42 (4.6%) |
| 26 to 34 Years | 1,659 (94.3%) | 101 (5.7%) |
| 35 to 44 Years | 2,888 (100.0%) | 0 (0.0%) |
| 45 to 54 Years | 2,267 (94.7%) | 128 (5.3%) |
| 55 to 64 Years | 1,116 (92.6%) | 89 (7.4%) |
| 65 to 74 Years | 704 (100.0%) | 0 (0.0%) |
| 75 Years and older | 433 (88.7%) | 55 (11.3%) |
| Total | 14,653 (96.1%) | 591 (3.9%) |
Health Insurance Coverage by Citizenship Status in Melissa
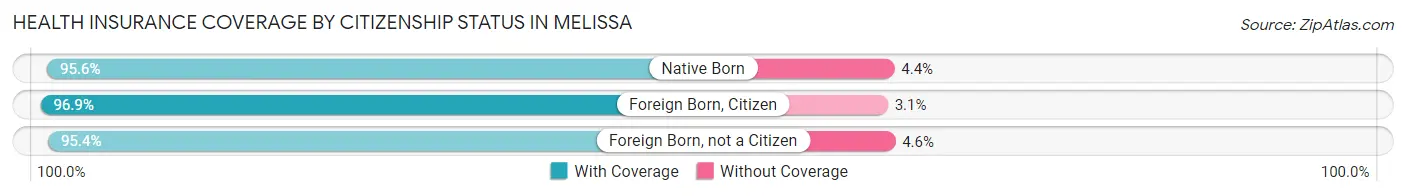
| Citizenship Status | With Coverage | Without Coverage |
| Native Born | 1,682 (95.6%) | 78 (4.4%) |
| Foreign Born, Citizen | 3,033 (96.9%) | 98 (3.1%) |
| Foreign Born, not a Citizen | 871 (95.4%) | 42 (4.6%) |
Health Insurance Coverage by Household Income in Melissa
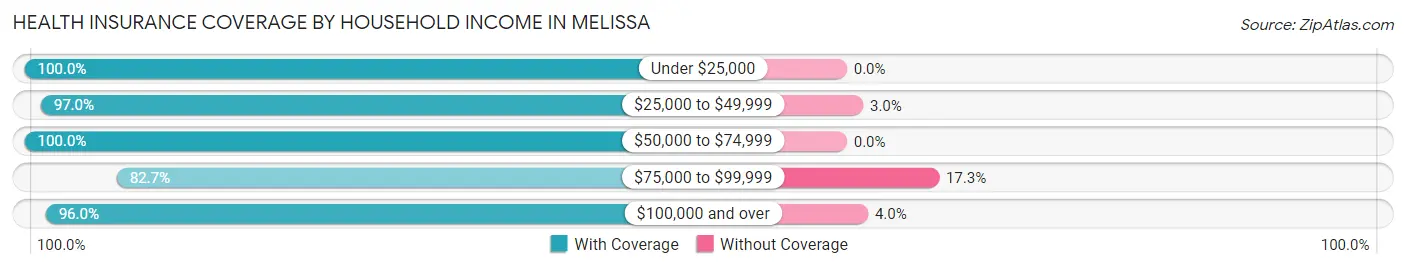
| Household Income | With Coverage | Without Coverage |
| Under $25,000 | 394 (100.0%) | 0 (0.0%) |
| $25,000 to $49,999 | 1,435 (97.0%) | 45 (3.0%) |
| $50,000 to $74,999 | 1,295 (100.0%) | 0 (0.0%) |
| $75,000 to $99,999 | 412 (82.7%) | 86 (17.3%) |
| $100,000 and over | 11,117 (96.0%) | 460 (4.0%) |
Public vs Private Health Insurance Coverage by Age in Melissa
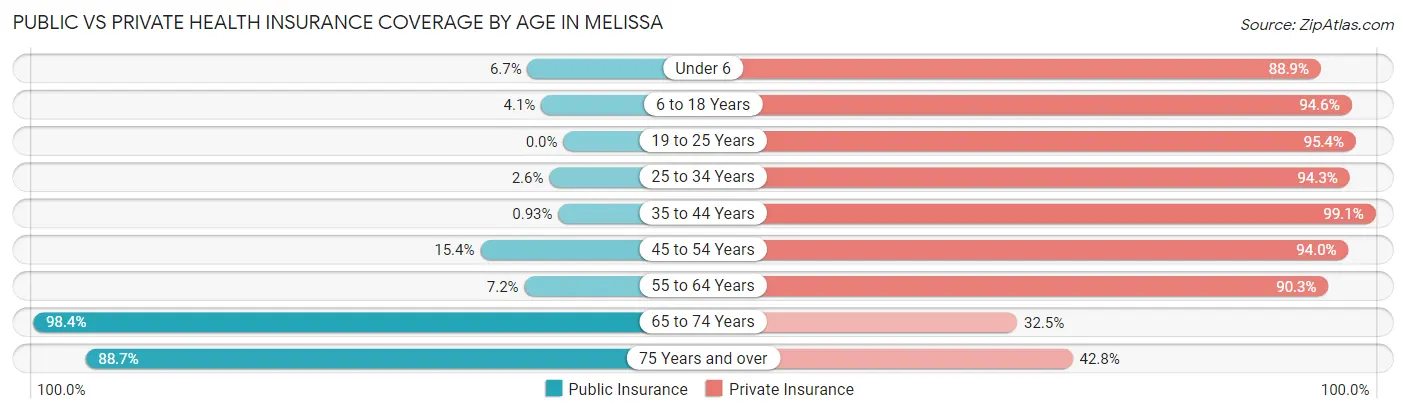
| Age Bracket | Public Insurance | Private Insurance |
| Under 6 | 117 (6.7%) | 1,565 (88.9%) |
| 6 to 18 Years | 129 (4.1%) | 2,962 (94.6%) |
| 19 to 25 Years | 0 (0.0%) | 871 (95.4%) |
| 25 to 34 Years | 46 (2.6%) | 1,659 (94.3%) |
| 35 to 44 Years | 27 (0.9%) | 2,861 (99.1%) |
| 45 to 54 Years | 369 (15.4%) | 2,252 (94.0%) |
| 55 to 64 Years | 87 (7.2%) | 1,088 (90.3%) |
| 65 to 74 Years | 693 (98.4%) | 229 (32.5%) |
| 75 Years and over | 433 (88.7%) | 209 (42.8%) |
| Total | 1,901 (12.5%) | 13,696 (89.8%) |
Disability Status by Sex by Age in Melissa
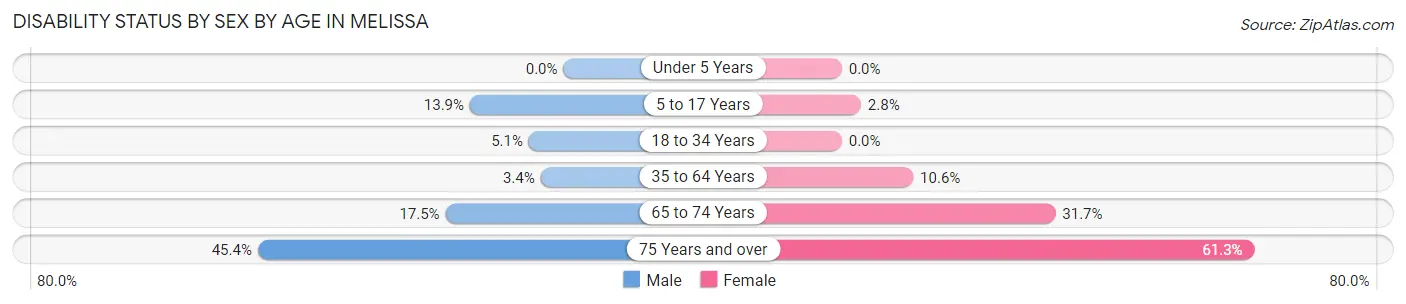
| Age Bracket | Male | Female |
| Under 5 Years | 0 (0.0%) | 0 (0.0%) |
| 5 to 17 Years | 252 (13.9%) | 47 (2.8%) |
| 18 to 34 Years | 51 (5.1%) | 0 (0.0%) |
| 35 to 64 Years | 117 (3.4%) | 322 (10.6%) |
| 65 to 74 Years | 62 (17.5%) | 111 (31.7%) |
| 75 Years and over | 157 (45.4%) | 87 (61.3%) |
Disability Class by Sex by Age in Melissa
Disability Class: Hearing Difficulty
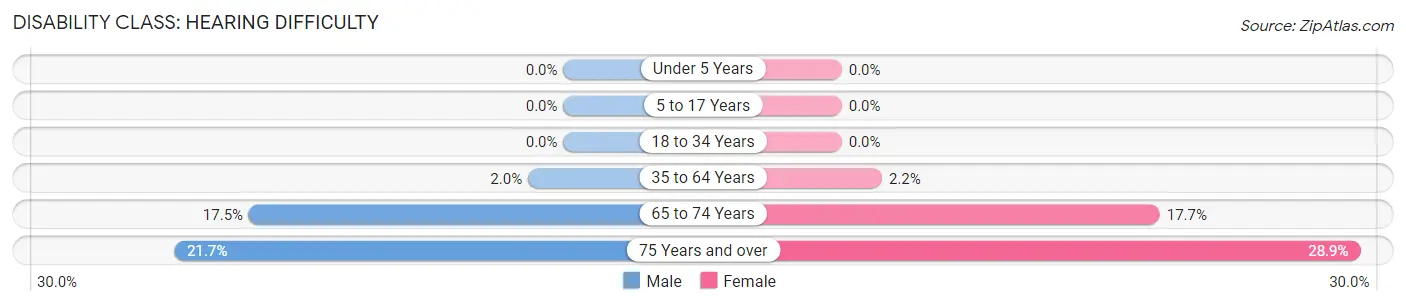
| Age Bracket | Male | Female |
| Under 5 Years | 0 (0.0%) | 0 (0.0%) |
| 5 to 17 Years | 0 (0.0%) | 0 (0.0%) |
| 18 to 34 Years | 0 (0.0%) | 0 (0.0%) |
| 35 to 64 Years | 68 (2.0%) | 68 (2.2%) |
| 65 to 74 Years | 62 (17.5%) | 62 (17.7%) |
| 75 Years and over | 75 (21.7%) | 41 (28.9%) |
Disability Class: Vision Difficulty
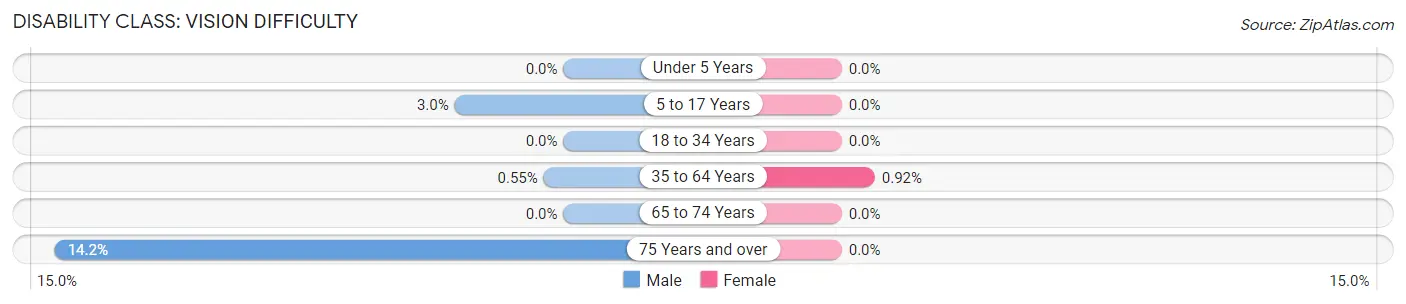
| Age Bracket | Male | Female |
| Under 5 Years | 0 (0.0%) | 0 (0.0%) |
| 5 to 17 Years | 55 (3.0%) | 0 (0.0%) |
| 18 to 34 Years | 0 (0.0%) | 0 (0.0%) |
| 35 to 64 Years | 19 (0.5%) | 28 (0.9%) |
| 65 to 74 Years | 0 (0.0%) | 0 (0.0%) |
| 75 Years and over | 49 (14.2%) | 0 (0.0%) |
Disability Class: Cognitive Difficulty
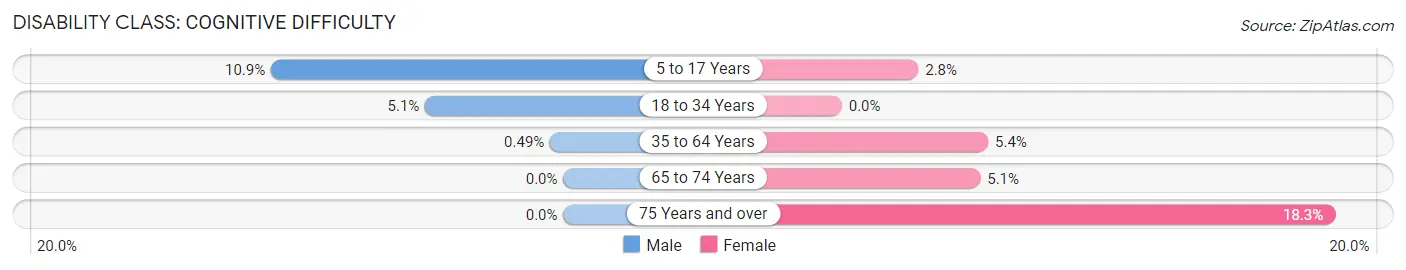
| Age Bracket | Male | Female |
| 5 to 17 Years | 197 (10.8%) | 47 (2.8%) |
| 18 to 34 Years | 51 (5.1%) | 0 (0.0%) |
| 35 to 64 Years | 17 (0.5%) | 165 (5.4%) |
| 65 to 74 Years | 0 (0.0%) | 18 (5.1%) |
| 75 Years and over | 0 (0.0%) | 26 (18.3%) |
Disability Class: Ambulatory Difficulty
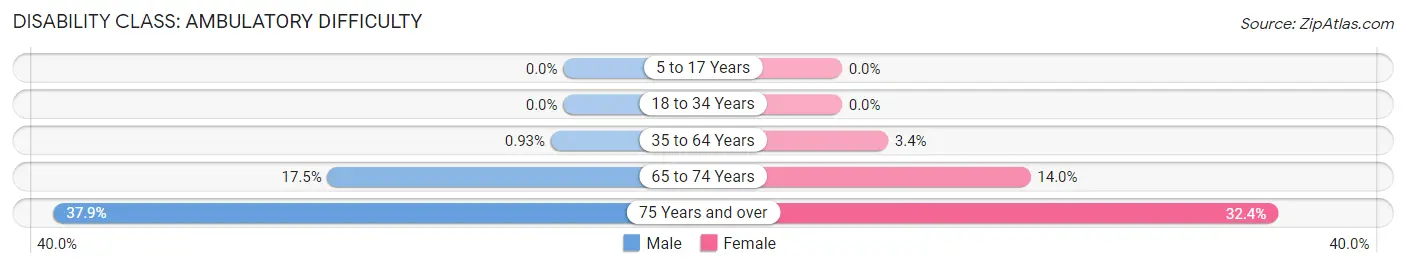
| Age Bracket | Male | Female |
| 5 to 17 Years | 0 (0.0%) | 0 (0.0%) |
| 18 to 34 Years | 0 (0.0%) | 0 (0.0%) |
| 35 to 64 Years | 32 (0.9%) | 104 (3.4%) |
| 65 to 74 Years | 62 (17.5%) | 49 (14.0%) |
| 75 Years and over | 131 (37.9%) | 46 (32.4%) |
Disability Class: Self-Care Difficulty
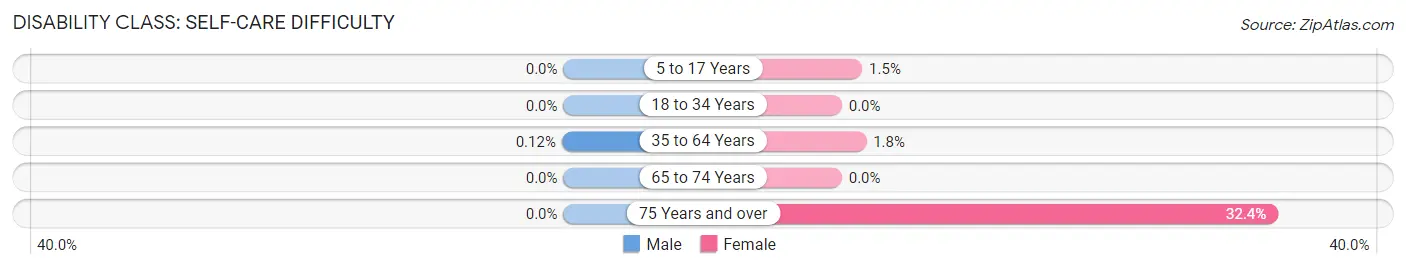
| Age Bracket | Male | Female |
| 5 to 17 Years | 0 (0.0%) | 25 (1.5%) |
| 18 to 34 Years | 0 (0.0%) | 0 (0.0%) |
| 35 to 64 Years | 4 (0.1%) | 55 (1.8%) |
| 65 to 74 Years | 0 (0.0%) | 0 (0.0%) |
| 75 Years and over | 0 (0.0%) | 46 (32.4%) |
Technology Access in Melissa
Computing Device Access in Melissa
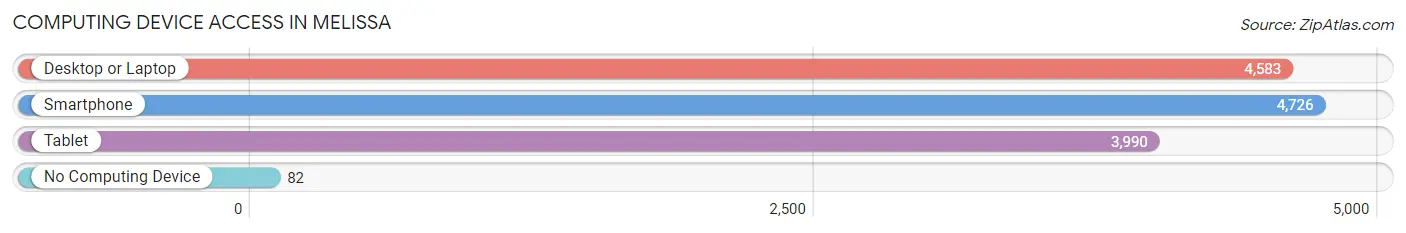
| Device Type | # Households | % Households |
| Desktop or Laptop | 4,583 | 95.2% |
| Smartphone | 4,726 | 98.2% |
| Tablet | 3,990 | 82.9% |
| No Computing Device | 82 | 1.7% |
| Total | 4,815 | 100.0% |
Internet Access in Melissa
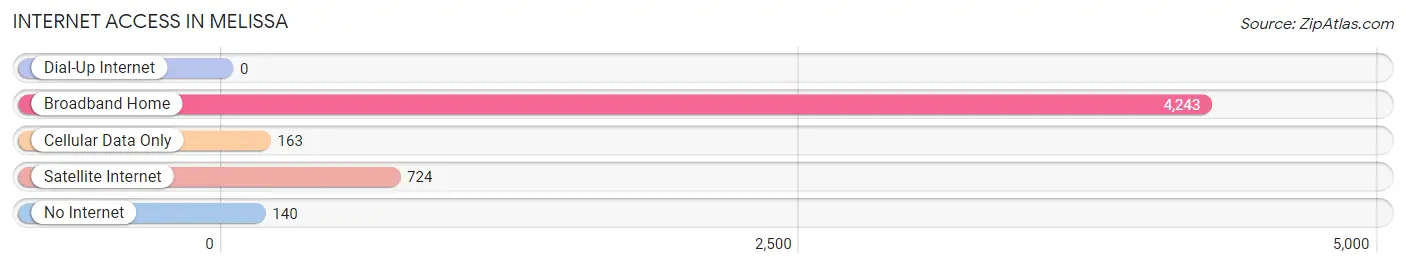
| Internet Type | # Households | % Households |
| Dial-Up Internet | 0 | 0.0% |
| Broadband Home | 4,243 | 88.1% |
| Cellular Data Only | 163 | 3.4% |
| Satellite Internet | 724 | 15.0% |
| No Internet | 140 | 2.9% |
| Total | 4,815 | 100.0% |
Melissa Summary
Melissa, Texas is a small town located in Collin County, Texas, about 40 miles north of Dallas. It is part of the Dallas-Fort Worth-Arlington metropolitan area. The population of Melissa was 2,811 at the 2010 census, up from 1,890 at the 2000 census.
Geography
Melissa is located at 33°17'25" North, 96°37'45" West (33.290278, -96.629167). According to the United States Census Bureau, the town has a total area of 2.2 square miles, all of it land.
History
The area that is now Melissa was first settled in the 1840s by a group of settlers from Kentucky. The town was originally known as "Cottonwood", but was renamed Melissa in 1873 after the daughter of one of the settlers. The town was officially incorporated in 1876.
In the early 1900s, Melissa was a thriving agricultural community, with cotton, corn, and wheat being the main crops. The town also had a cotton gin, a grist mill, and a blacksmith shop.
In the 1950s, the town began to experience a population boom, as people moved to the area from other parts of the state. This growth continued into the 1960s and 1970s, and by the 1980s, Melissa had become a bedroom community for Dallas.
Economy
The economy of Melissa is largely based on agriculture and light manufacturing. The town is home to several large farms, as well as a number of small businesses. The town also has a number of retail stores, restaurants, and other services.
Demographics
As of the 2010 census, there were 2,811 people, 990 households, and 790 families residing in Melissa. The population density was 1,269.2 people per square mile. The racial makeup of the town was 81.2% White, 11.2% African American, 0.3% Native American, 0.7% Asian, 0.1% Pacific Islander, 4.7% from other races, and 2.0% from two or more races. Hispanic or Latino of any race were 11.2% of the population.
The median income for a household in Melissa was $60,938, and the median income for a family was $68,750. Males had a median income of $50,000 versus $35,000 for females. The per capita income for the town was $25,945. About 4.2% of families and 5.3% of the population were below the poverty line, including 6.2% of those under age 18 and 4.2% of those age 65 or over.
Conclusion
Melissa, Texas is a small town located in Collin County, Texas, about 40 miles north of Dallas. It is part of the Dallas-Fort Worth-Arlington metropolitan area. The town has a long history, dating back to the 1840s, and has experienced a population boom in recent decades. The economy of Melissa is largely based on agriculture and light manufacturing, and the town is home to several large farms, as well as a number of small businesses. The population of Melissa was 2,811 at the 2010 census, up from 1,890 at the 2000 census. The median income for a household in Melissa was $60,938, and the median income for a family was $68,750. Melissa is a small town with a rich history and a bright future.
Common Questions
What is Per Capita Income in Melissa?
Per Capita income in Melissa is $46,407.
What is the Median Family Income in Melissa?
Median Family Income in Melissa is $141,071.
What is the Median Household income in Melissa?
Median Household Income in Melissa is $138,465.
What is Income or Wage Gap in Melissa?
Income or Wage Gap in Melissa is 31.7%.
Women in Melissa earn 68.3 cents for every dollar earned by a man.
What is Inequality or Gini Index in Melissa?
Inequality or Gini Index in Melissa is 0.32.
What is the Total Population of Melissa?
Total Population of Melissa is 15,244.
What is the Total Male Population of Melissa?
Total Male Population of Melissa is 7,537.
What is the Total Female Population of Melissa?
Total Female Population of Melissa is 7,707.
What is the Ratio of Males per 100 Females in Melissa?
There are 97.79 Males per 100 Females in Melissa.
What is the Ratio of Females per 100 Males in Melissa?
There are 102.26 Females per 100 Males in Melissa.
What is the Median Population Age in Melissa?
Median Population Age in Melissa is 35.3 Years.
What is the Average Family Size in Melissa
Average Family Size in Melissa is 3.4 People.
What is the Average Household Size in Melissa
Average Household Size in Melissa is 3.2 People.
How Large is the Labor Force in Melissa?
There are 7,797 People in the Labor Forcein in Melissa.
What is the Percentage of People in the Labor Force in Melissa?
71.6% of People are in the Labor Force in Melissa.
What is the Unemployment Rate in Melissa?
Unemployment Rate in Melissa is 4.1%.