Clarkdale, AZ Map & Demographics
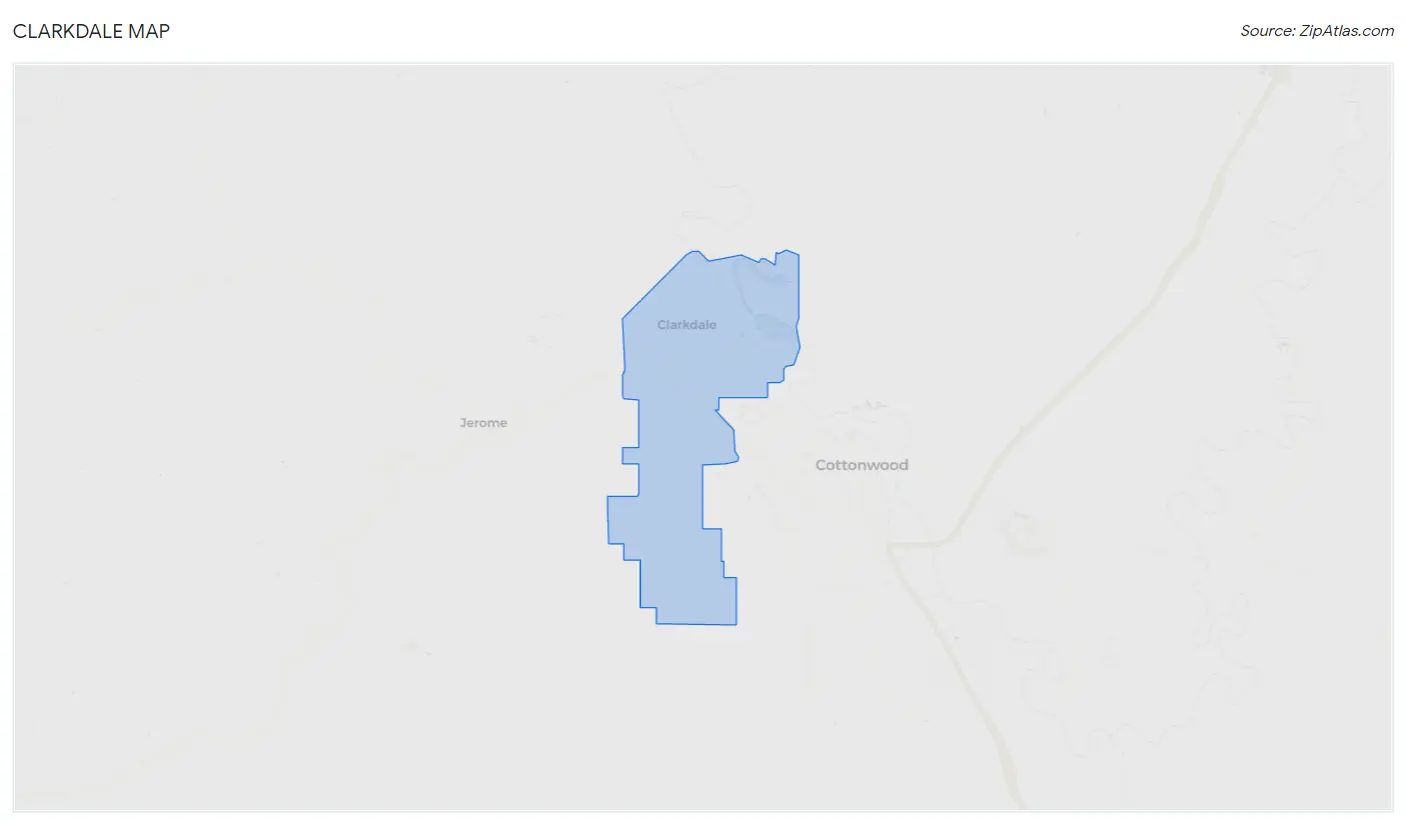
Clarkdale Map
Clarkdale Overview
$32,743
PER CAPITA INCOME
$59,227
AVG FAMILY INCOME
$40,313
AVG HOUSEHOLD INCOME
0.46
INEQUALITY / GINI INDEX
4,528
TOTAL POPULATION
1,922
MALE POPULATION
2,606
FEMALE POPULATION
73.75
MALES / 100 FEMALES
135.59
FEMALES / 100 MALES
59.9
MEDIAN AGE
2.6
AVG FAMILY SIZE
1.9
AVG HOUSEHOLD SIZE
2,011
LABOR FORCE [ PEOPLE ]
51.3%
PERCENT IN LABOR FORCE
0.2%
UNEMPLOYMENT RATE
Clarkdale Zip Codes
Clarkdale Area Codes
Income in Clarkdale
Income Overview in Clarkdale
Per Capita Income in Clarkdale is $32,743, while median incomes of families and households are $59,227 and $40,313 respectively.
| Characteristic | Number | Measure |
| Per Capita Income | 4,528 | $32,743 |
| Median Family Income | 1,301 | $59,227 |
| Mean Family Income | 1,301 | $81,929 |
| Median Household Income | 2,400 | $40,313 |
| Mean Household Income | 2,400 | $61,167 |
| Income Deficit | 1,301 | $0 |
| Wage / Income Gap (%) | 4,528 | 0.00% |
| Wage / Income Gap ($) | 4,528 | 100.00¢ per $1 |
| Gini / Inequality Index | 4,528 | 0.46 |
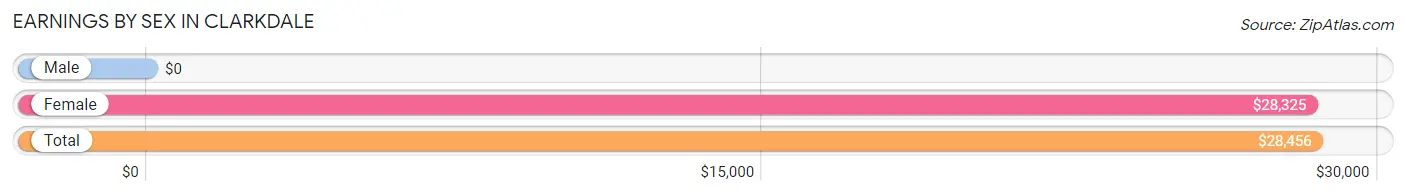
Earnings by Sex in Clarkdale
| Sex | Number | Average Earnings |
| Male | 882 (39.9%) | $0 |
| Female | 1,328 (60.1%) | $28,325 |
| Total | 2,210 (100.0%) | $28,456 |
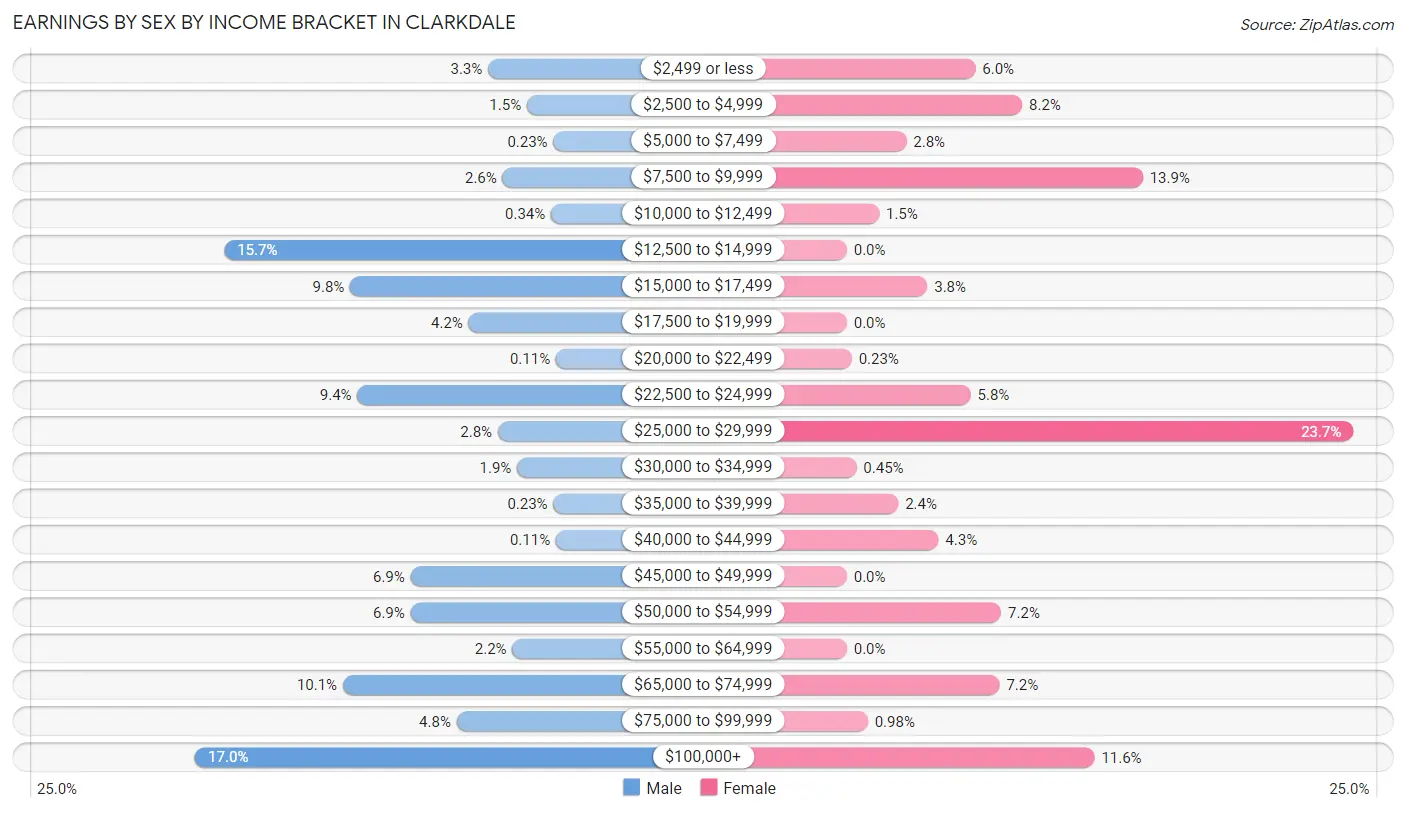
Earnings by Sex by Income Bracket in Clarkdale
The most common earnings brackets in Clarkdale are $100,000+ for men (150 | 17.0%) and $25,000 to $29,999 for women (315 | 23.7%).
| Income | Male | Female |
| $2,499 or less | 29 (3.3%) | 80 (6.0%) |
| $2,500 to $4,999 | 13 (1.5%) | 109 (8.2%) |
| $5,000 to $7,499 | 2 (0.2%) | 37 (2.8%) |
| $7,500 to $9,999 | 23 (2.6%) | 184 (13.9%) |
| $10,000 to $12,499 | 3 (0.3%) | 20 (1.5%) |
| $12,500 to $14,999 | 138 (15.7%) | 0 (0.0%) |
| $15,000 to $17,499 | 86 (9.8%) | 50 (3.8%) |
| $17,500 to $19,999 | 37 (4.2%) | 0 (0.0%) |
| $20,000 to $22,499 | 1 (0.1%) | 3 (0.2%) |
| $22,500 to $24,999 | 83 (9.4%) | 77 (5.8%) |
| $25,000 to $29,999 | 25 (2.8%) | 315 (23.7%) |
| $30,000 to $34,999 | 17 (1.9%) | 6 (0.4%) |
| $35,000 to $39,999 | 2 (0.2%) | 32 (2.4%) |
| $40,000 to $44,999 | 1 (0.1%) | 57 (4.3%) |
| $45,000 to $49,999 | 61 (6.9%) | 0 (0.0%) |
| $50,000 to $54,999 | 61 (6.9%) | 96 (7.2%) |
| $55,000 to $64,999 | 19 (2.1%) | 0 (0.0%) |
| $65,000 to $74,999 | 89 (10.1%) | 95 (7.1%) |
| $75,000 to $99,999 | 42 (4.8%) | 13 (1.0%) |
| $100,000+ | 150 (17.0%) | 154 (11.6%) |
| Total | 882 (100.0%) | 1,328 (100.0%) |
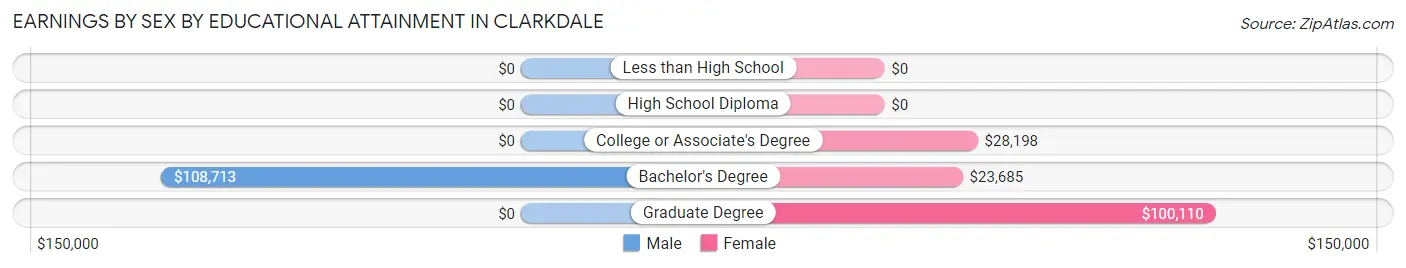
Earnings by Sex by Educational Attainment in Clarkdale
Average earnings in Clarkdale are $40,000 for men and $28,329 for women, a difference of 29.2%. Men with an educational attainment of bachelor's degree enjoy the highest average annual earnings of $108,713, while those with bachelor's degree education earn the least with $108,713. Women with an educational attainment of graduate degree earn the most with the average annual earnings of $100,110, while those with bachelor's degree education have the smallest earnings of $23,685.
| Educational Attainment | Male Income | Female Income |
| Less than High School | - | - |
| High School Diploma | - | - |
| College or Associate's Degree | - | - |
| Bachelor's Degree | $108,713 | $23,685 |
| Graduate Degree | - | - |
| Total | $40,000 | $28,329 |
Family Income in Clarkdale
Family Income Brackets in Clarkdale
According to the Clarkdale family income data, there are 359 families falling into the $25,000 to $34,999 income range, which is the most common income bracket and makes up 27.6% of all families.
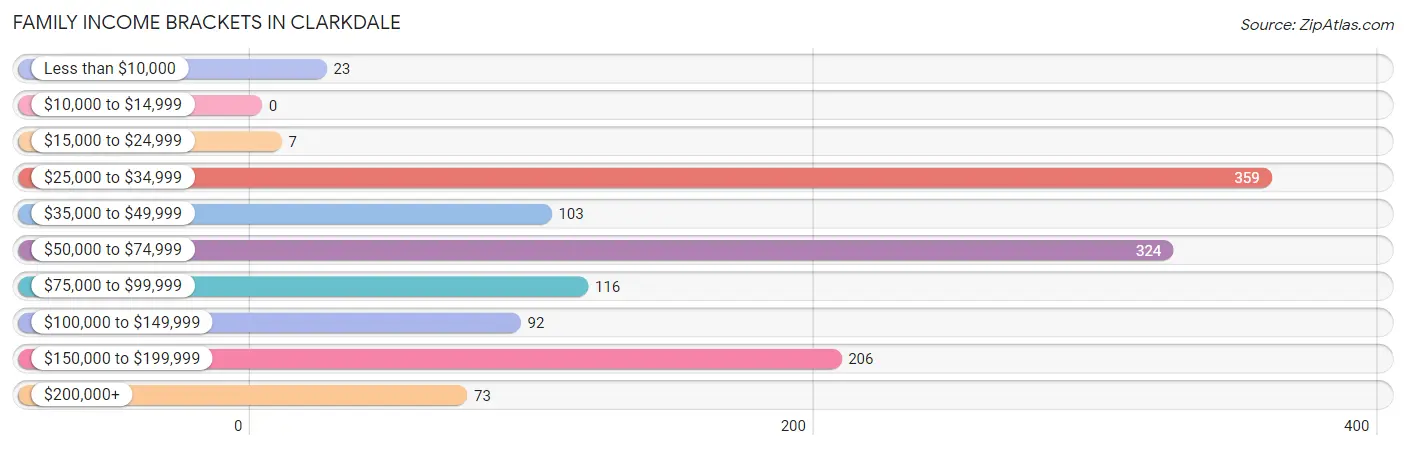
| Income Bracket | # Families | % Families |
| Less than $10,000 | 23 | 1.8% |
| $10,000 to $14,999 | 0 | 0.0% |
| $15,000 to $24,999 | 7 | 0.5% |
| $25,000 to $34,999 | 359 | 27.6% |
| $35,000 to $49,999 | 103 | 7.9% |
| $50,000 to $74,999 | 324 | 24.9% |
| $75,000 to $99,999 | 116 | 8.9% |
| $100,000 to $149,999 | 92 | 7.1% |
| $150,000 to $199,999 | 206 | 15.8% |
| $200,000+ | 73 | 5.6% |
Family Income by Famaliy Size in Clarkdale
2-person families (1,019 | 78.3%) account for the highest median family income in Clarkdale with $58,750 per family, while 2-person families (1,019 | 78.3%) have the highest median income of $29,375 per family member.
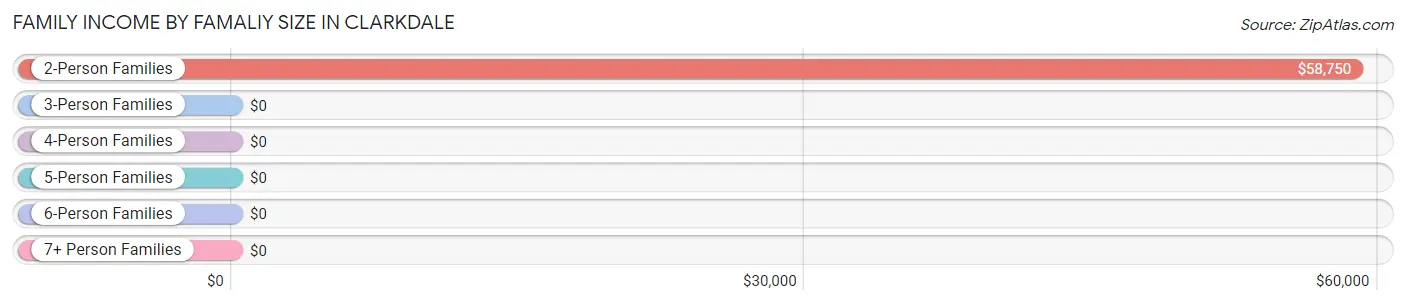
| Income Bracket | # Families | Median Income |
| 2-Person Families | 1,019 (78.3%) | $58,750 |
| 3-Person Families | 78 (6.0%) | $0 |
| 4-Person Families | 65 (5.0%) | $0 |
| 5-Person Families | 103 (7.9%) | $0 |
| 6-Person Families | 35 (2.7%) | $0 |
| 7+ Person Families | 1 (0.1%) | $0 |
| Total | 1,301 (100.0%) | $59,227 |
Family Income by Number of Earners in Clarkdale
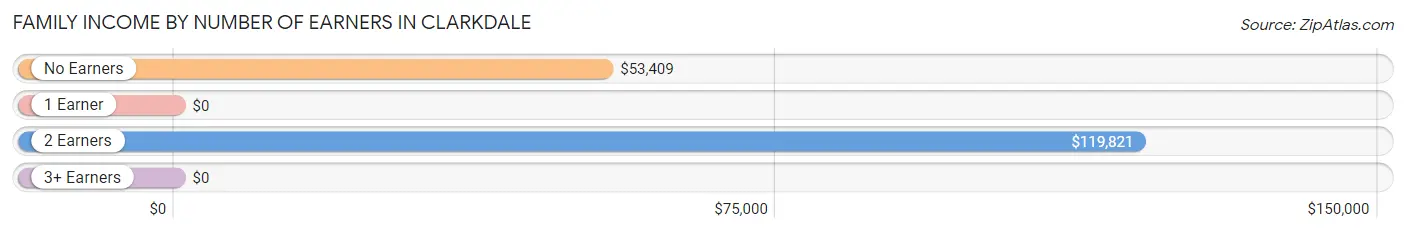
| Number of Earners | # Families | Median Income |
| No Earners | 296 (22.8%) | $53,409 |
| 1 Earner | 437 (33.6%) | $0 |
| 2 Earners | 561 (43.1%) | $119,821 |
| 3+ Earners | 7 (0.5%) | $0 |
| Total | 1,301 (100.0%) | $59,227 |
Household Income in Clarkdale
Household Income Brackets in Clarkdale
With 492 households falling in the category, the $25,000 to $34,999 income range is the most frequent in Clarkdale, accounting for 20.5% of all households. In contrast, only 7 households (0.3%) fall into the $10,000 to $14,999 income bracket, making it the least populous group.
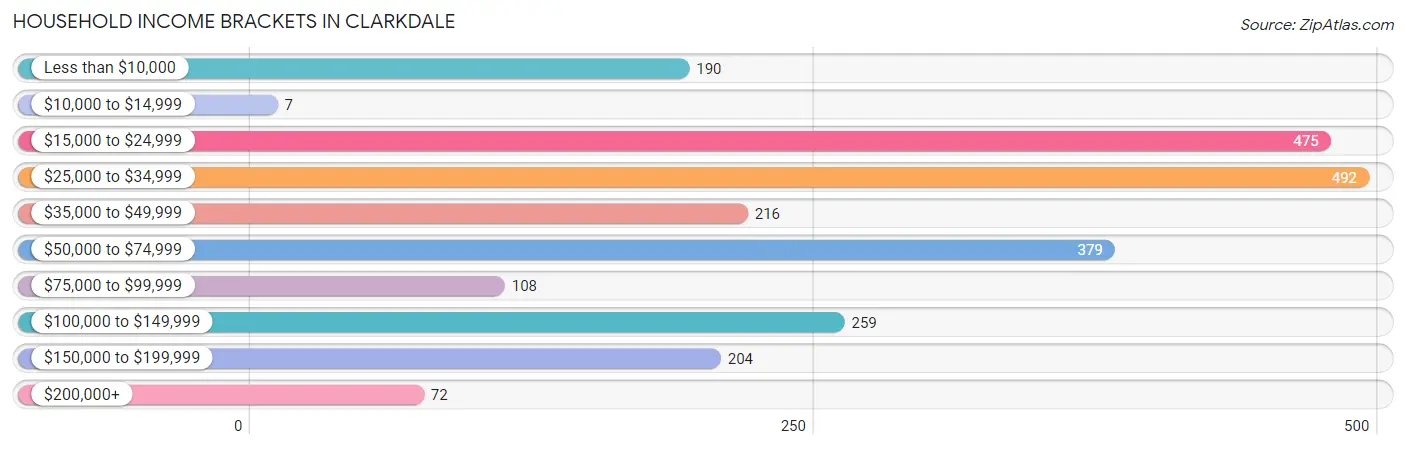
| Income Bracket | # Households | % Households |
| Less than $10,000 | 190 | 7.9% |
| $10,000 to $14,999 | 7 | 0.3% |
| $15,000 to $24,999 | 475 | 19.8% |
| $25,000 to $34,999 | 492 | 20.5% |
| $35,000 to $49,999 | 216 | 9.0% |
| $50,000 to $74,999 | 379 | 15.8% |
| $75,000 to $99,999 | 108 | 4.5% |
| $100,000 to $149,999 | 259 | 10.8% |
| $150,000 to $199,999 | 204 | 8.5% |
| $200,000+ | 72 | 3.0% |
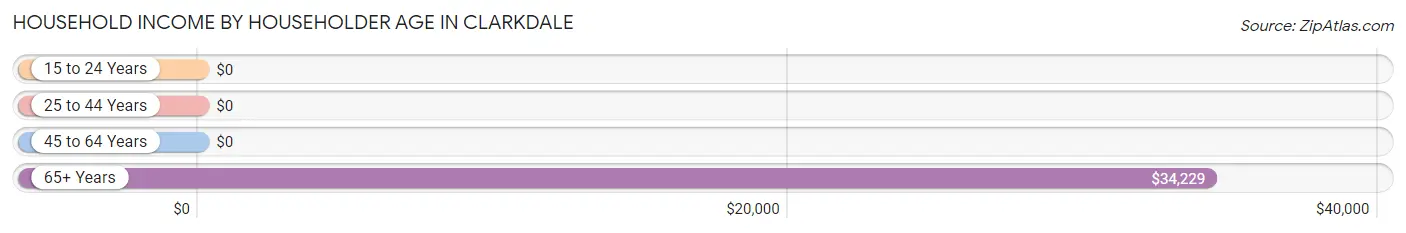
Household Income by Householder Age in Clarkdale
The median household income in Clarkdale is $40,313, with the highest median household income of $34,229 found in the 65+ years age bracket for the primary householder. A total of 1,297 households (54.0%) fall into this category. Meanwhile, the 15 to 24 years age bracket for the primary householder has the lowest median household income of $0, with 7 households (0.3%) in this group.
| Income Bracket | # Households | Median Income |
| 15 to 24 Years | 7 (0.3%) | $0 |
| 25 to 44 Years | 242 (10.1%) | $0 |
| 45 to 64 Years | 854 (35.6%) | $0 |
| 65+ Years | 1,297 (54.0%) | $34,229 |
| Total | 2,400 (100.0%) | $40,313 |
Poverty in Clarkdale
Income Below Poverty by Sex and Age in Clarkdale
With 3.7% poverty level for males and 10.0% for females among the residents of Clarkdale, 16 and 17 year old males and 5 year old females are the most vulnerable to poverty, with 28 males (100.0%) and 1 females (100.0%) in their respective age groups living below the poverty level.
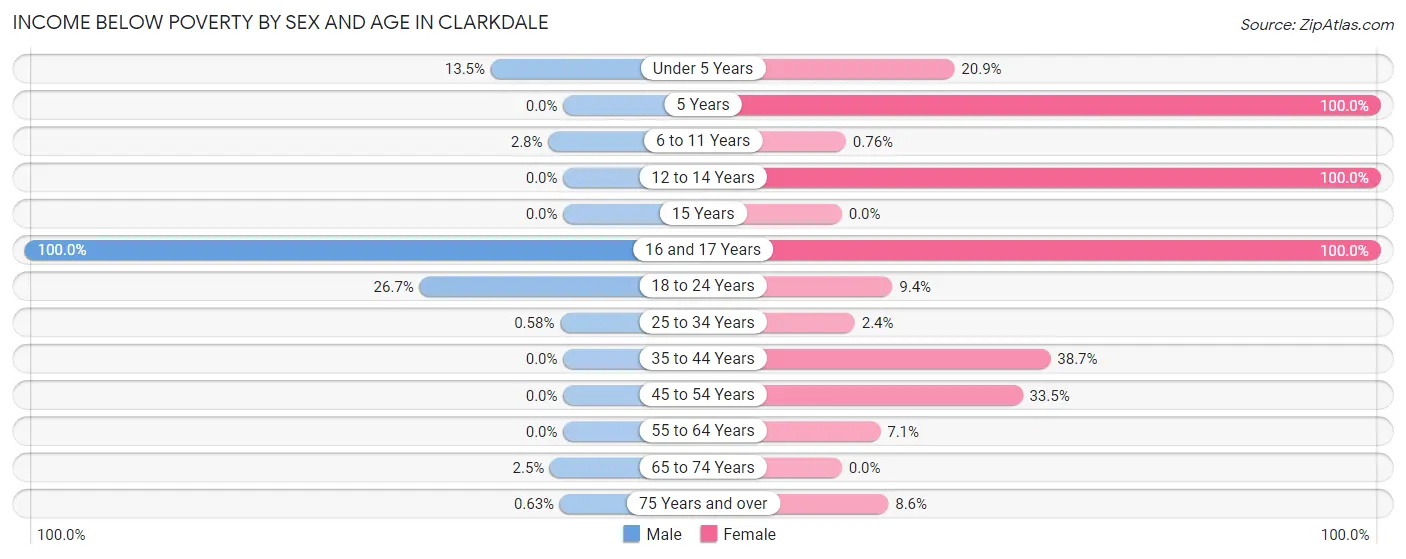
| Age Bracket | Male | Female |
| Under 5 Years | 28 (13.5%) | 28 (20.9%) |
| 5 Years | 0 (0.0%) | 1 (100.0%) |
| 6 to 11 Years | 2 (2.8%) | 1 (0.8%) |
| 12 to 14 Years | 0 (0.0%) | 1 (100.0%) |
| 15 Years | 0 (0.0%) | 0 (0.0%) |
| 16 and 17 Years | 28 (100.0%) | 2 (100.0%) |
| 18 to 24 Years | 4 (26.7%) | 3 (9.4%) |
| 25 to 34 Years | 2 (0.6%) | 4 (2.4%) |
| 35 to 44 Years | 0 (0.0%) | 24 (38.7%) |
| 45 to 54 Years | 0 (0.0%) | 106 (33.5%) |
| 55 to 64 Years | 0 (0.0%) | 43 (7.1%) |
| 65 to 74 Years | 6 (2.5%) | 0 (0.0%) |
| 75 Years and over | 2 (0.6%) | 44 (8.6%) |
| Total | 72 (3.7%) | 257 (10.0%) |
Income Above Poverty by Sex and Age in Clarkdale
According to the poverty statistics in Clarkdale, males aged 12 to 14 years and females aged 65 to 74 years are the age groups that are most secure financially, with 100.0% of males and 100.0% of females in these age groups living above the poverty line.
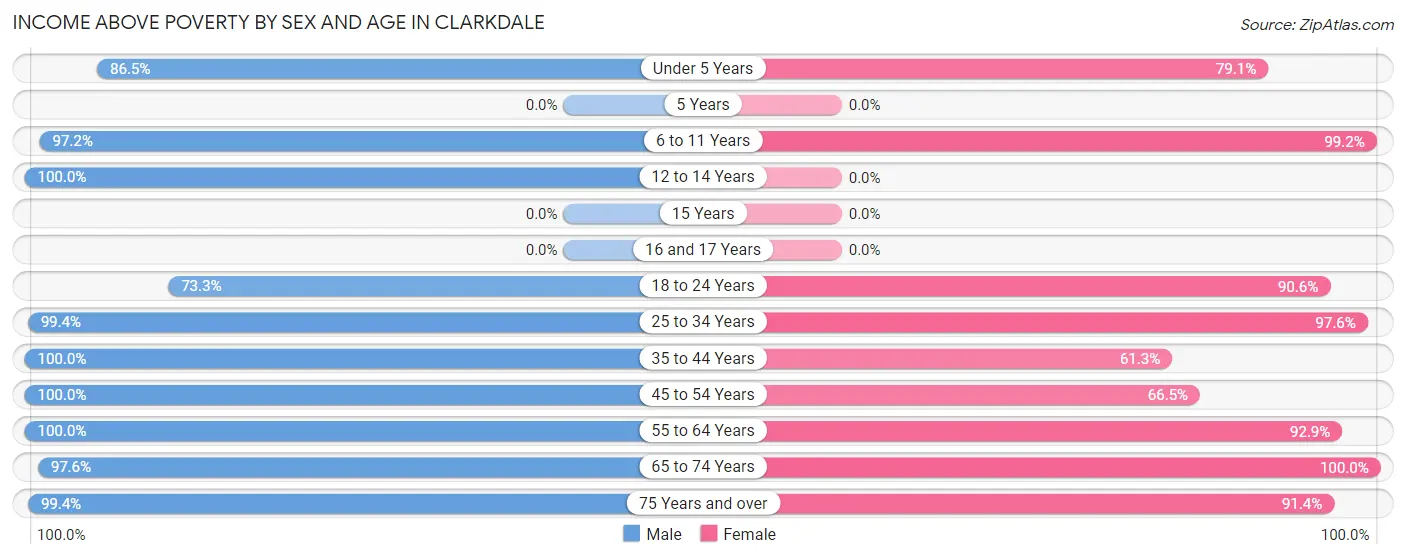
| Age Bracket | Male | Female |
| Under 5 Years | 180 (86.5%) | 106 (79.1%) |
| 5 Years | 0 (0.0%) | 0 (0.0%) |
| 6 to 11 Years | 70 (97.2%) | 130 (99.2%) |
| 12 to 14 Years | 35 (100.0%) | 0 (0.0%) |
| 15 Years | 0 (0.0%) | 0 (0.0%) |
| 16 and 17 Years | 0 (0.0%) | 0 (0.0%) |
| 18 to 24 Years | 11 (73.3%) | 29 (90.6%) |
| 25 to 34 Years | 341 (99.4%) | 162 (97.6%) |
| 35 to 44 Years | 66 (100.0%) | 38 (61.3%) |
| 45 to 54 Years | 35 (100.0%) | 210 (66.5%) |
| 55 to 64 Years | 556 (100.0%) | 559 (92.9%) |
| 65 to 74 Years | 239 (97.6%) | 623 (100.0%) |
| 75 Years and over | 317 (99.4%) | 466 (91.4%) |
| Total | 1,850 (96.3%) | 2,323 (90.0%) |
Income Below Poverty Among Married-Couple Families in Clarkdale
The poverty statistics for married-couple families in Clarkdale show that 0.2% or 2 of the total 1,070 families live below the poverty line. Families with no children have the highest poverty rate of 0.2%, comprising of 2 families. On the other hand, families with 1 or 2 children have the lowest poverty rate of 0.0%, which includes 0 families.
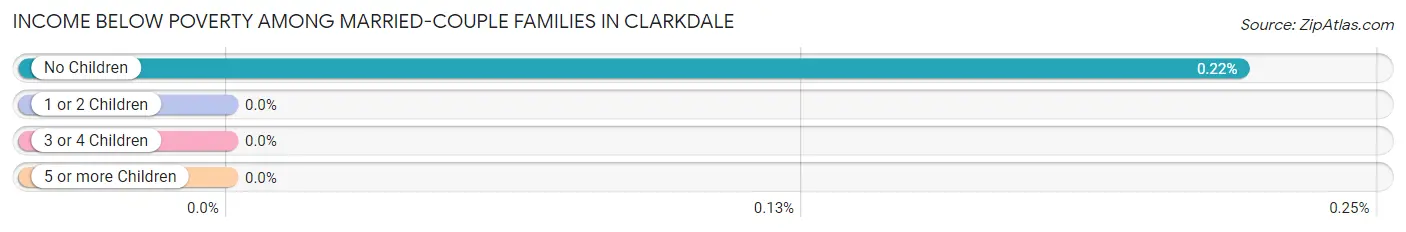
| Children | Above Poverty | Below Poverty |
| No Children | 919 (99.8%) | 2 (0.2%) |
| 1 or 2 Children | 14 (100.0%) | 0 (0.0%) |
| 3 or 4 Children | 135 (100.0%) | 0 (0.0%) |
| 5 or more Children | 0 (0.0%) | 0 (0.0%) |
| Total | 1,068 (99.8%) | 2 (0.2%) |
Income Below Poverty Among Single-Parent Households in Clarkdale
According to the poverty data in Clarkdale, 1.4% or 1 single-father households and 16.5% or 26 single-mother households are living below the poverty line. Among single-father households, those with 3 or 4 children have the highest poverty rate, with 1 households (100.0%) experiencing poverty. Likewise, among single-mother households, those with 1 or 2 children have the highest poverty rate, with 1 households (100.0%) falling below the poverty line.
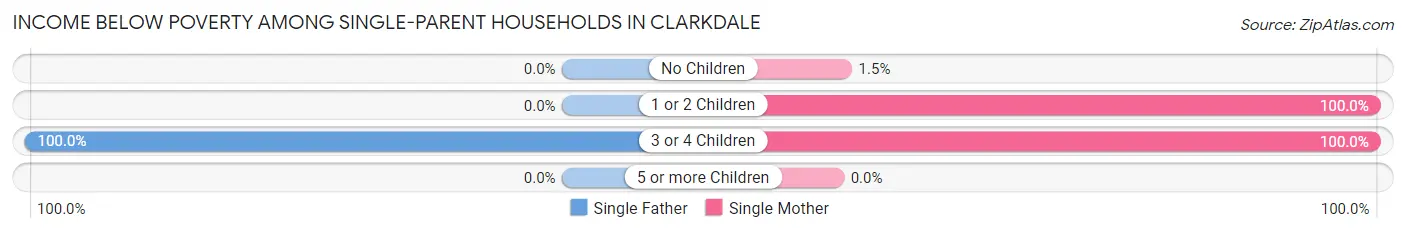
| Children | Single Father | Single Mother |
| No Children | 0 (0.0%) | 2 (1.5%) |
| 1 or 2 Children | 0 (0.0%) | 1 (100.0%) |
| 3 or 4 Children | 1 (100.0%) | 23 (100.0%) |
| 5 or more Children | 0 (0.0%) | 0 (0.0%) |
| Total | 1 (1.4%) | 26 (16.5%) |
Income Below Poverty Among Married-Couple vs Single-Parent Households in Clarkdale
The poverty data for Clarkdale shows that 2 of the married-couple family households (0.2%) and 27 of the single-parent households (11.7%) are living below the poverty level. Within the married-couple family households, those with no children have the highest poverty rate, with 2 households (0.2%) falling below the poverty line. Among the single-parent households, those with 3 or 4 children have the highest poverty rate, with 24 household (100.0%) living below poverty.
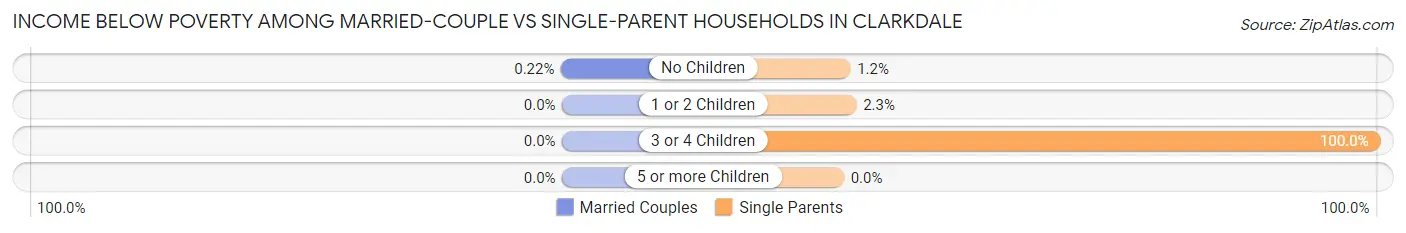
| Children | Married-Couple Families | Single-Parent Households |
| No Children | 2 (0.2%) | 2 (1.2%) |
| 1 or 2 Children | 0 (0.0%) | 1 (2.3%) |
| 3 or 4 Children | 0 (0.0%) | 24 (100.0%) |
| 5 or more Children | 0 (0.0%) | 0 (0.0%) |
| Total | 2 (0.2%) | 27 (11.7%) |
Race in Clarkdale
The most populous races in Clarkdale are White / Caucasian (4,065 | 89.8%), Hispanic or Latino (484 | 10.7%), and Two or more Races (242 | 5.3%).
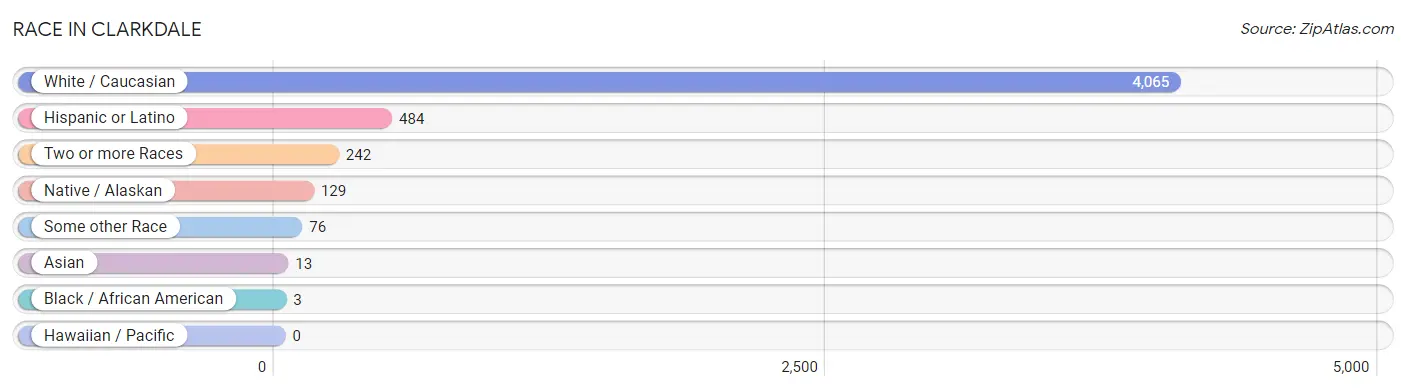
| Race | # Population | % Population |
| Asian | 13 | 0.3% |
| Black / African American | 3 | 0.1% |
| Hawaiian / Pacific | 0 | 0.0% |
| Hispanic or Latino | 484 | 10.7% |
| Native / Alaskan | 129 | 2.9% |
| White / Caucasian | 4,065 | 89.8% |
| Two or more Races | 242 | 5.3% |
| Some other Race | 76 | 1.7% |
| Total | 4,528 | 100.0% |
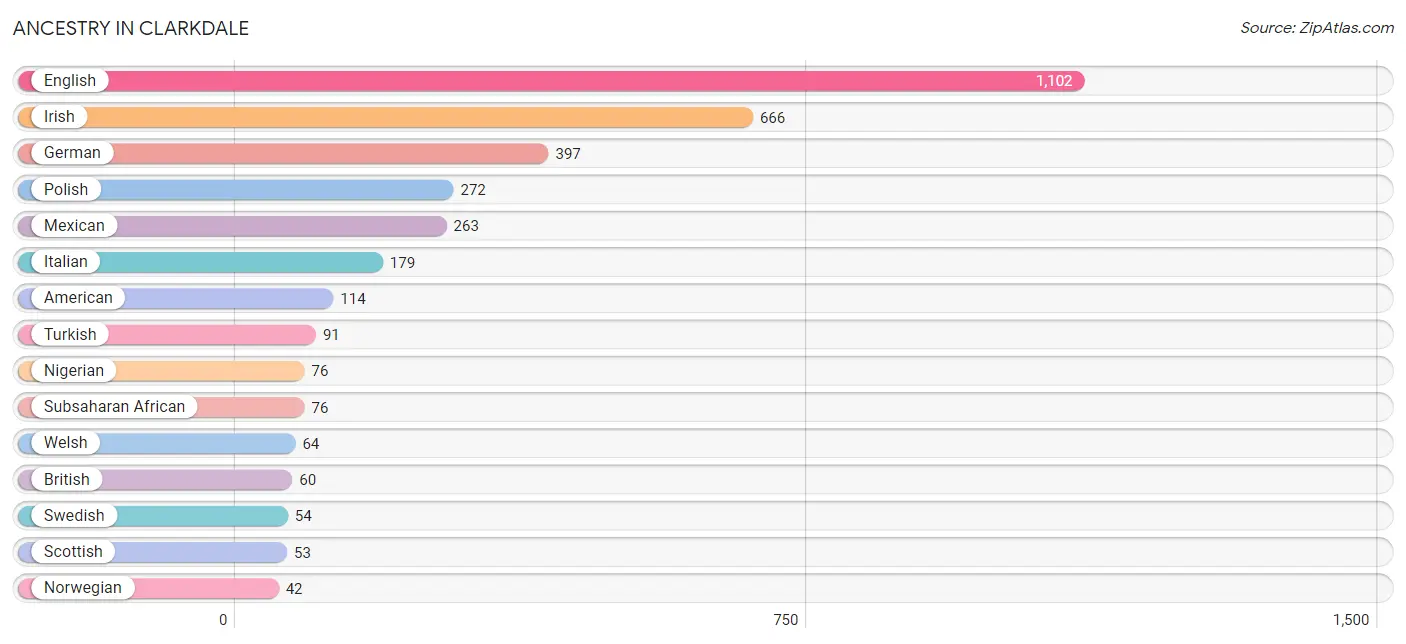
Ancestry in Clarkdale
The most populous ancestries reported in Clarkdale are English (1,102 | 24.3%), Irish (666 | 14.7%), German (397 | 8.8%), Polish (272 | 6.0%), and Mexican (263 | 5.8%), together accounting for 59.6% of all Clarkdale residents.
| Ancestry | # Population | % Population |
| American | 114 | 2.5% |
| Apache | 29 | 0.6% |
| Belgian | 37 | 0.8% |
| Bhutanese | 10 | 0.2% |
| British | 60 | 1.3% |
| Central American | 26 | 0.6% |
| Cherokee | 20 | 0.4% |
| Dutch | 35 | 0.8% |
| English | 1,102 | 24.3% |
| European | 30 | 0.7% |
| French | 31 | 0.7% |
| German | 397 | 8.8% |
| Iranian | 35 | 0.8% |
| Irish | 666 | 14.7% |
| Italian | 179 | 4.0% |
| Mexican | 263 | 5.8% |
| Mexican American Indian | 11 | 0.2% |
| Nigerian | 76 | 1.7% |
| Norwegian | 42 | 0.9% |
| Pima | 5 | 0.1% |
| Polish | 272 | 6.0% |
| Salvadoran | 26 | 0.6% |
| Scandinavian | 17 | 0.4% |
| Scotch-Irish | 23 | 0.5% |
| Scottish | 53 | 1.2% |
| Subsaharan African | 76 | 1.7% |
| Swedish | 54 | 1.2% |
| Thai | 3 | 0.1% |
| Turkish | 91 | 2.0% |
| Welsh | 64 | 1.4% |
| Yuman | 12 | 0.3% | View All 31 Rows |
Immigrants in Clarkdale
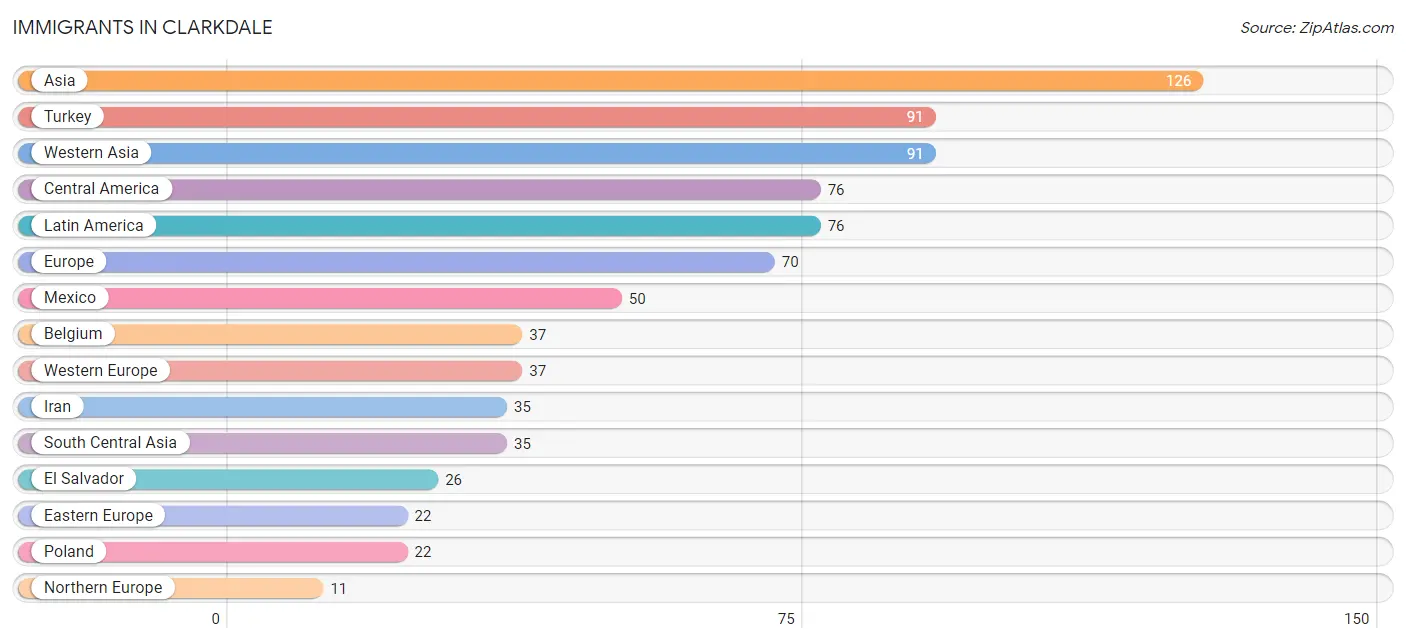
The most numerous immigrant groups reported in Clarkdale came from Asia (126 | 2.8%), Turkey (91 | 2.0%), Western Asia (91 | 2.0%), Central America (76 | 1.7%), and Latin America (76 | 1.7%), together accounting for 10.2% of all Clarkdale residents.
| Immigration Origin | # Population | % Population |
| Asia | 126 | 2.8% |
| Belgium | 37 | 0.8% |
| Central America | 76 | 1.7% |
| Eastern Europe | 22 | 0.5% |
| El Salvador | 26 | 0.6% |
| Europe | 70 | 1.5% |
| Iran | 35 | 0.8% |
| Latin America | 76 | 1.7% |
| Mexico | 50 | 1.1% |
| Northern Europe | 11 | 0.2% |
| Poland | 22 | 0.5% |
| South Central Asia | 35 | 0.8% |
| Turkey | 91 | 2.0% |
| Western Asia | 91 | 2.0% |
| Western Europe | 37 | 0.8% | View All 15 Rows |
Sex and Age in Clarkdale
Sex and Age in Clarkdale
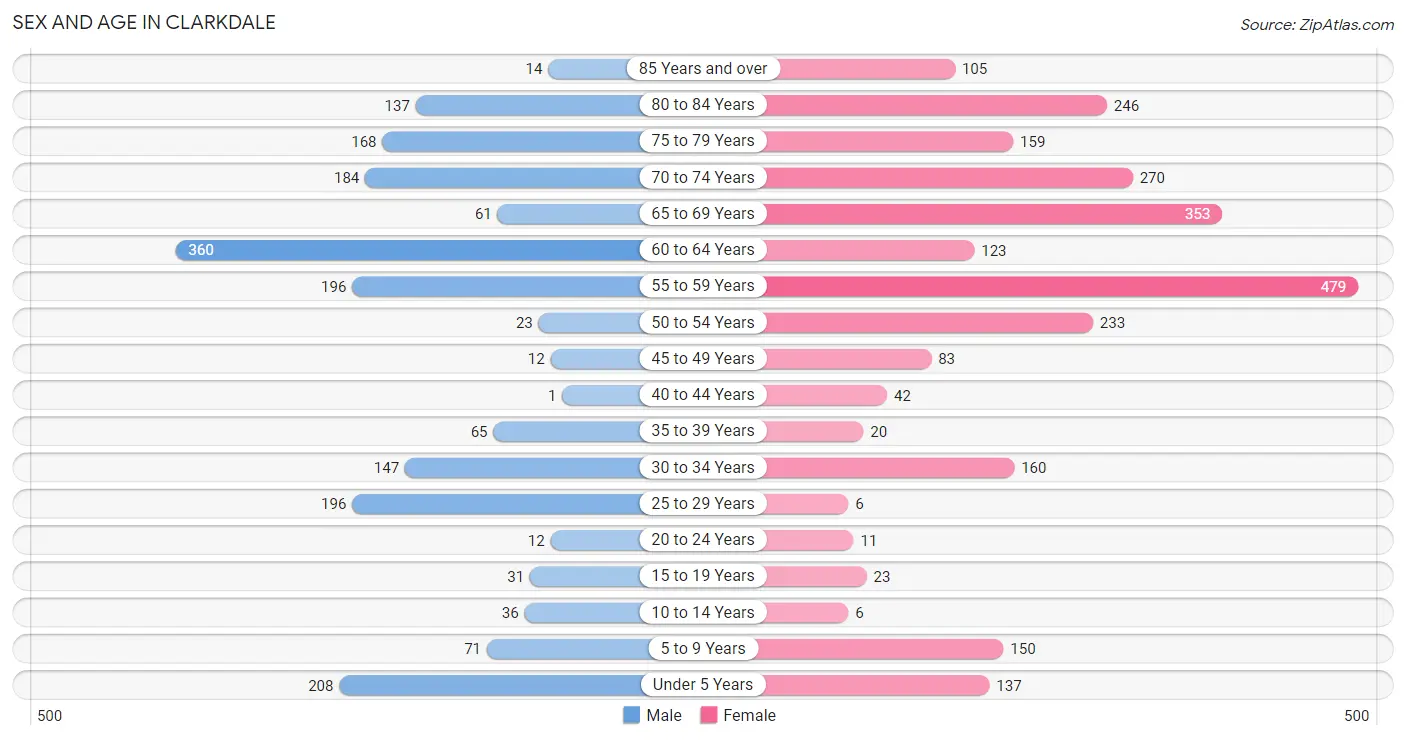
The most populous age groups in Clarkdale are 60 to 64 Years (360 | 18.7%) for men and 55 to 59 Years (479 | 18.4%) for women.
| Age Bracket | Male | Female |
| Under 5 Years | 208 (10.8%) | 137 (5.3%) |
| 5 to 9 Years | 71 (3.7%) | 150 (5.8%) |
| 10 to 14 Years | 36 (1.9%) | 6 (0.2%) |
| 15 to 19 Years | 31 (1.6%) | 23 (0.9%) |
| 20 to 24 Years | 12 (0.6%) | 11 (0.4%) |
| 25 to 29 Years | 196 (10.2%) | 6 (0.2%) |
| 30 to 34 Years | 147 (7.6%) | 160 (6.1%) |
| 35 to 39 Years | 65 (3.4%) | 20 (0.8%) |
| 40 to 44 Years | 1 (0.1%) | 42 (1.6%) |
| 45 to 49 Years | 12 (0.6%) | 83 (3.2%) |
| 50 to 54 Years | 23 (1.2%) | 233 (8.9%) |
| 55 to 59 Years | 196 (10.2%) | 479 (18.4%) |
| 60 to 64 Years | 360 (18.7%) | 123 (4.7%) |
| 65 to 69 Years | 61 (3.2%) | 353 (13.6%) |
| 70 to 74 Years | 184 (9.6%) | 270 (10.4%) |
| 75 to 79 Years | 168 (8.7%) | 159 (6.1%) |
| 80 to 84 Years | 137 (7.1%) | 246 (9.4%) |
| 85 Years and over | 14 (0.7%) | 105 (4.0%) |
| Total | 1,922 (100.0%) | 2,606 (100.0%) |
Families and Households in Clarkdale
Median Family Size in Clarkdale
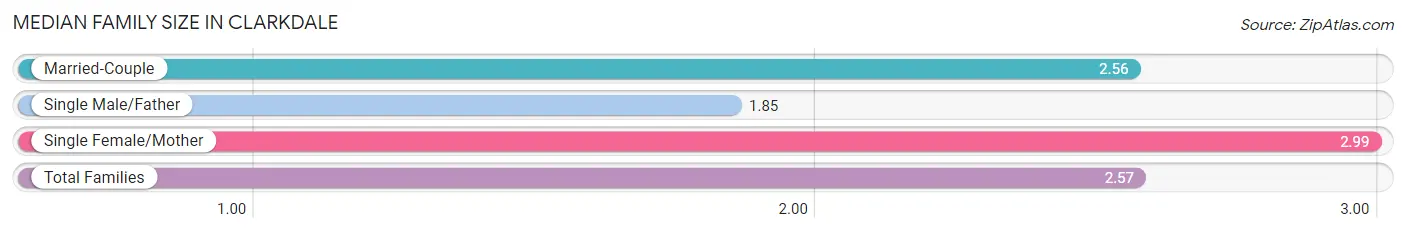
The median family size in Clarkdale is 2.57 persons per family, with single female/mother families (158 | 12.1%) accounting for the largest median family size of 2.99 persons per family. On the other hand, single male/father families (73 | 5.6%) represent the smallest median family size with 1.85 persons per family.
| Family Type | # Families | Family Size |
| Married-Couple | 1,070 (82.2%) | 2.56 |
| Single Male/Father | 73 (5.6%) | 1.85 |
| Single Female/Mother | 158 (12.1%) | 2.99 |
| Total Families | 1,301 (100.0%) | 2.57 |
Median Household Size in Clarkdale
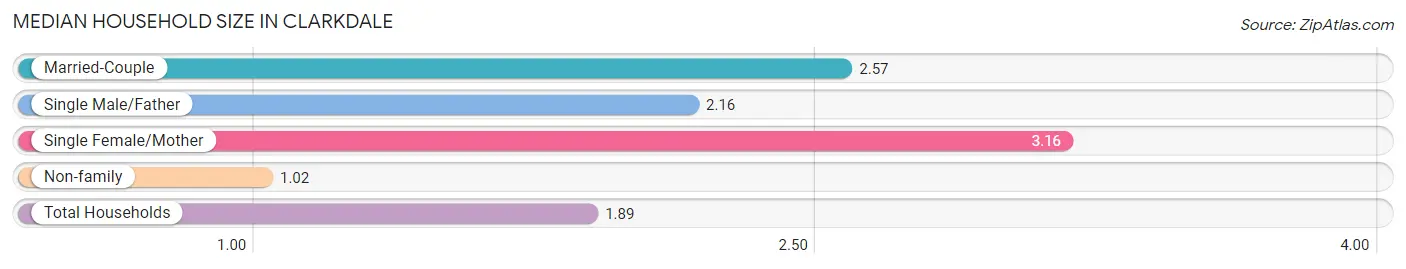
The median household size in Clarkdale is 1.89 persons per household, with single female/mother households (158 | 6.6%) accounting for the largest median household size of 3.16 persons per household. non-family households (1,099 | 45.8%) represent the smallest median household size with 1.02 persons per household.
| Household Type | # Households | Household Size |
| Married-Couple | 1,070 (44.6%) | 2.57 |
| Single Male/Father | 73 (3.0%) | 2.16 |
| Single Female/Mother | 158 (6.6%) | 3.16 |
| Non-family | 1,099 (45.8%) | 1.02 |
| Total Households | 2,400 (100.0%) | 1.89 |
Household Size by Marriage Status in Clarkdale
Out of a total of 2,400 households in Clarkdale, 1,301 (54.2%) are family households, while 1,099 (45.8%) are nonfamily households. The most numerous type of family households are 2-person households, comprising 977, and the most common type of nonfamily households are 1-person households, comprising 1,079.
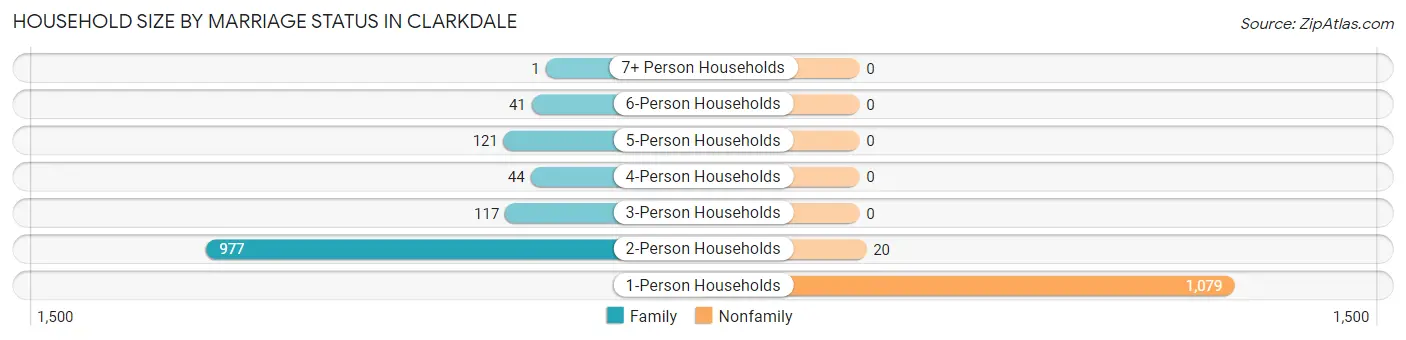
| Household Size | Family Households | Nonfamily Households |
| 1-Person Households | - | 1,079 (45.0%) |
| 2-Person Households | 977 (40.7%) | 20 (0.8%) |
| 3-Person Households | 117 (4.9%) | 0 (0.0%) |
| 4-Person Households | 44 (1.8%) | 0 (0.0%) |
| 5-Person Households | 121 (5.0%) | 0 (0.0%) |
| 6-Person Households | 41 (1.7%) | 0 (0.0%) |
| 7+ Person Households | 1 (0.0%) | 0 (0.0%) |
| Total | 1,301 (54.2%) | 1,099 (45.8%) |
Female Fertility in Clarkdale
Fertility by Age in Clarkdale
Average fertility rate in Clarkdale is 76.0 births per 1,000 women. Women in the age bracket of 20 to 34 years have the highest fertility rate with 232.0 births per 1,000 women. Women in the age bracket of 20 to 34 years acount for 100.0% of all women with births.
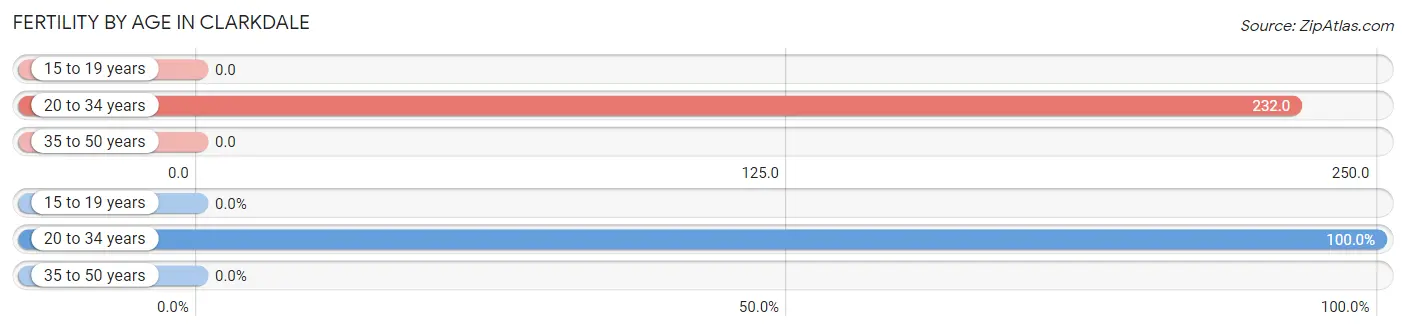
| Age Bracket | Women with Births | Births / 1,000 Women |
| 15 to 19 years | 0 (0.0%) | 0.0 |
| 20 to 34 years | 41 (100.0%) | 232.0 |
| 35 to 50 years | 0 (0.0%) | 0.0 |
| Total | 41 (100.0%) | 76.0 |
Fertility by Age by Marriage Status in Clarkdale
85.4% of women with births (41) in Clarkdale are married. The highest percentage of unmarried women with births falls into 20 to 34 years age bracket with 14.6% of them unmarried at the time of birth, while the lowest percentage of unmarried women with births belong to 20 to 34 years age bracket with 14.6% of them unmarried.
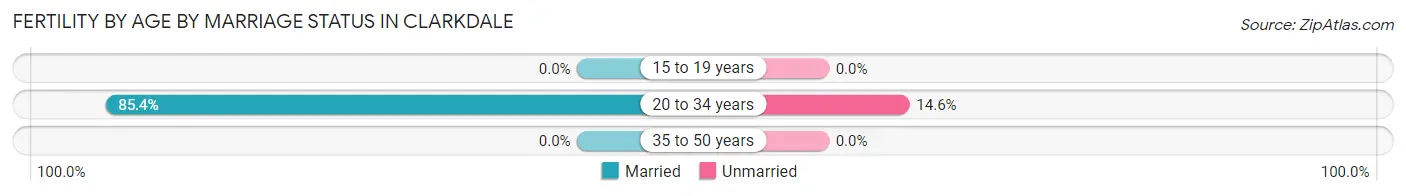
| Age Bracket | Married | Unmarried |
| 15 to 19 years | 0 (0.0%) | 0 (0.0%) |
| 20 to 34 years | 35 (85.4%) | 6 (14.6%) |
| 35 to 50 years | 0 (0.0%) | 0 (0.0%) |
| Total | 35 (85.4%) | 6 (14.6%) |
Fertility by Education in Clarkdale
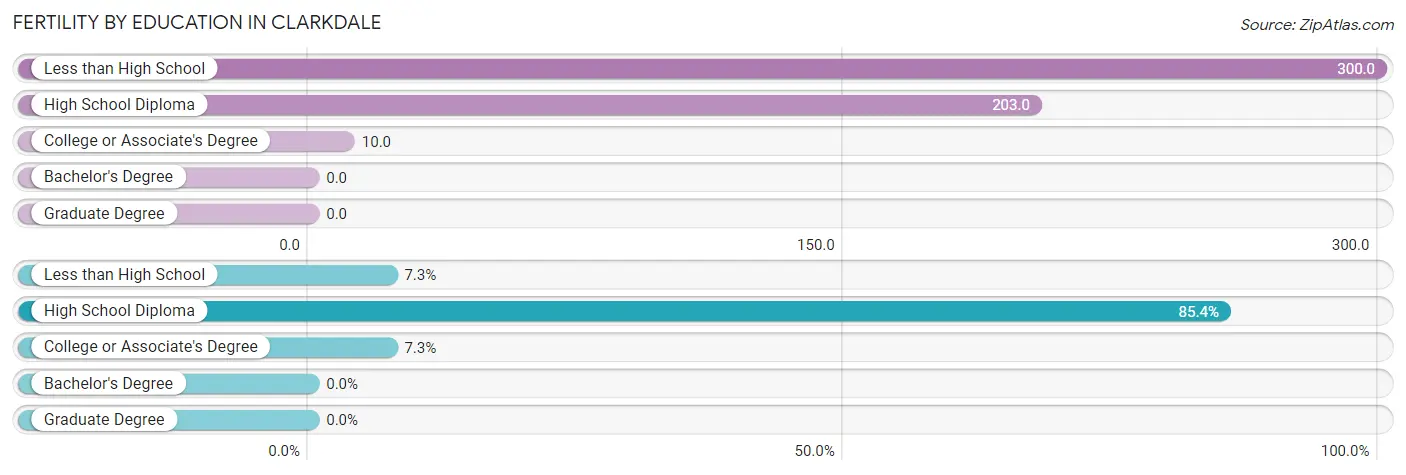
| Educational Attainment | Women with Births | Births / 1,000 Women |
| Less than High School | 3 (7.3%) | 300.0 |
| High School Diploma | 35 (85.4%) | 203.0 |
| College or Associate's Degree | 3 (7.3%) | 10.0 |
| Bachelor's Degree | 0 (0.0%) | 0.0 |
| Graduate Degree | 0 (0.0%) | 0.0 |
| Total | 41 (100.0%) | 76.0 |
Fertility by Education by Marriage Status in Clarkdale
14.6% of women with births in Clarkdale are unmarried. Women with the educational attainment of high school diploma are most likely to be married with 100.0% of them married at childbirth, while women with the educational attainment of less than high school are least likely to be married with 100.0% of them unmarried at childbirth.
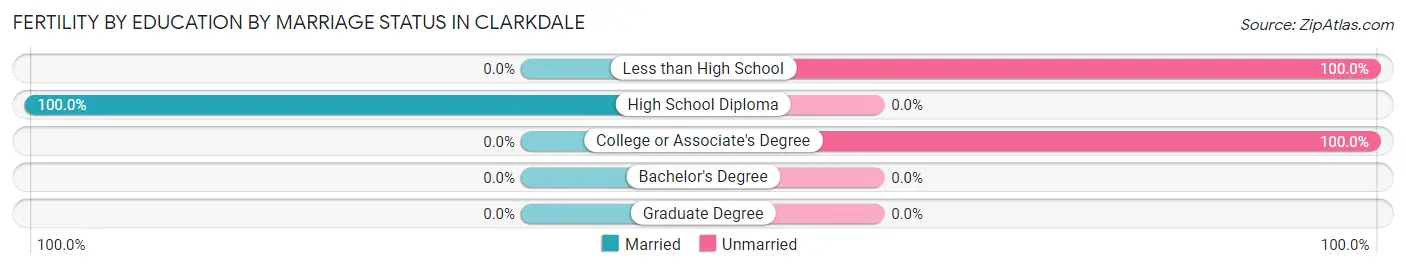
| Educational Attainment | Married | Unmarried |
| Less than High School | 0 (0.0%) | 3 (100.0%) |
| High School Diploma | 35 (100.0%) | 0 (0.0%) |
| College or Associate's Degree | 0 (0.0%) | 3 (100.0%) |
| Bachelor's Degree | 0 (0.0%) | 0 (0.0%) |
| Graduate Degree | 0 (0.0%) | 0 (0.0%) |
| Total | 35 (85.4%) | 6 (14.6%) |
Employment Characteristics in Clarkdale
Employment by Class of Employer in Clarkdale
Among the 2,004 employed individuals in Clarkdale, private company employees (779 | 38.9%), self-employed (not incorporated) (471 | 23.5%), and local government employees (463 | 23.1%) make up the most common classes of employment.
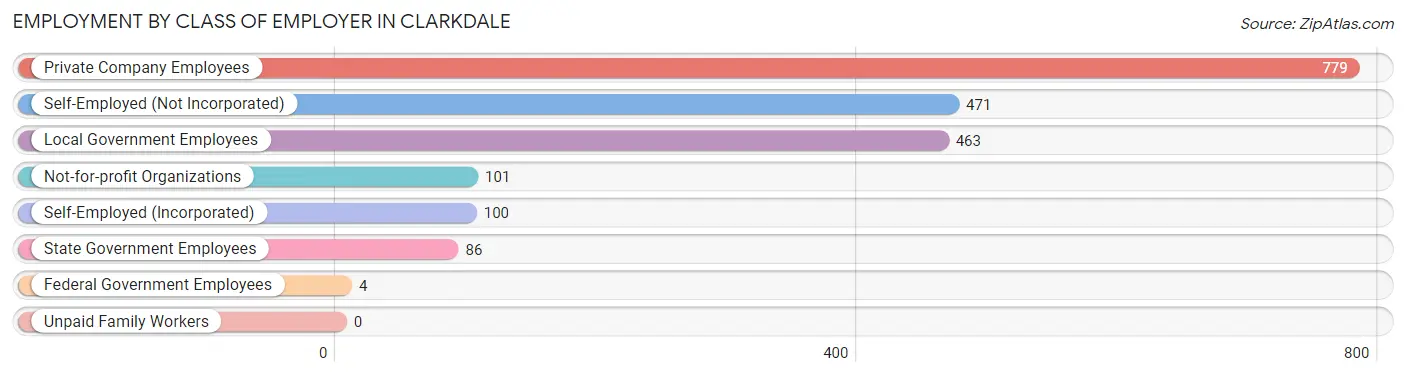
| Employer Class | # Employees | % Employees |
| Private Company Employees | 779 | 38.9% |
| Self-Employed (Incorporated) | 100 | 5.0% |
| Self-Employed (Not Incorporated) | 471 | 23.5% |
| Not-for-profit Organizations | 101 | 5.0% |
| Local Government Employees | 463 | 23.1% |
| State Government Employees | 86 | 4.3% |
| Federal Government Employees | 4 | 0.2% |
| Unpaid Family Workers | 0 | 0.0% |
| Total | 2,004 | 100.0% |
Employment Status by Age in Clarkdale
According to the labor force statistics for Clarkdale, out of the total population over 16 years of age (3,920), 51.3% or 2,011 individuals are in the labor force, with 0.2% or 4 of them unemployed. The age group with the highest labor force participation rate is 55 to 59 years, with 95.6% or 645 individuals in the labor force. Within the labor force, the 20 to 24 years age range has the highest percentage of unemployed individuals, with 33.3% or 3 of them being unemployed.
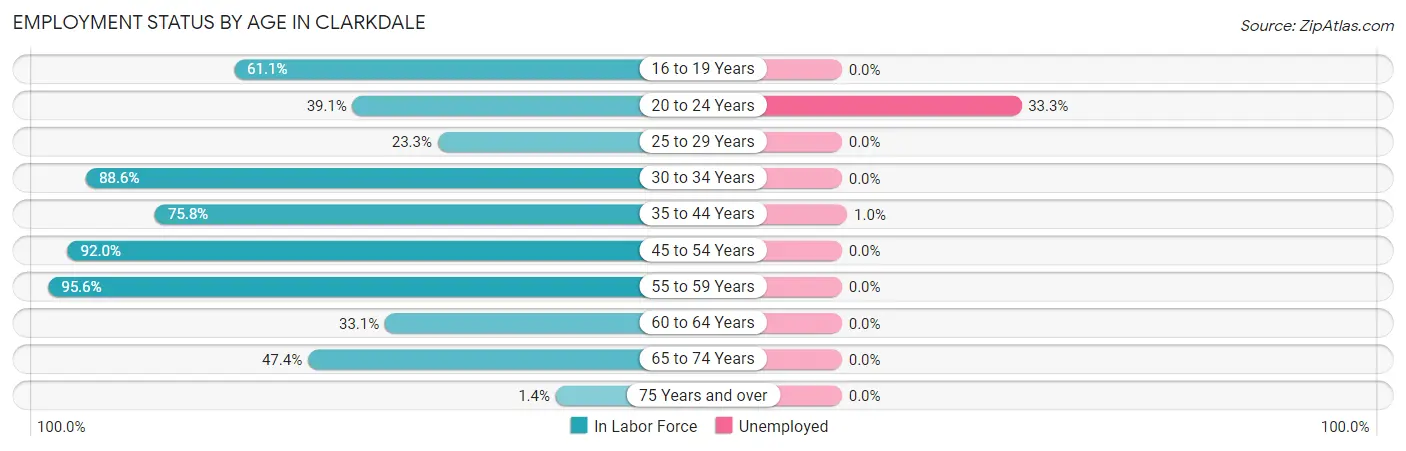
| Age Bracket | In Labor Force | Unemployed |
| 16 to 19 Years | 33 (61.1%) | 0 (0.0%) |
| 20 to 24 Years | 9 (39.1%) | 3 (33.3%) |
| 25 to 29 Years | 47 (23.3%) | 0 (0.0%) |
| 30 to 34 Years | 272 (88.6%) | 0 (0.0%) |
| 35 to 44 Years | 97 (75.8%) | 1 (1.0%) |
| 45 to 54 Years | 323 (92.0%) | 0 (0.0%) |
| 55 to 59 Years | 645 (95.6%) | 0 (0.0%) |
| 60 to 64 Years | 160 (33.1%) | 0 (0.0%) |
| 65 to 74 Years | 411 (47.4%) | 0 (0.0%) |
| 75 Years and over | 12 (1.4%) | 0 (0.0%) |
| Total | 2,011 (51.3%) | 4 (0.2%) |
Employment Status by Educational Attainment in Clarkdale
According to labor force statistics for Clarkdale, 71.9% of individuals (1,543) out of the total population between 25 and 64 years of age (2,146) are in the labor force, with 0.1% or 2 of them being unemployed. The group with the highest labor force participation rate are those with the educational attainment of bachelor's degree or higher, with 97.6% or 438 individuals in the labor force. Within the labor force, individuals with college / associate degree education have the highest percentage of unemployment, with 0.1% or 1 of them being unemployed.
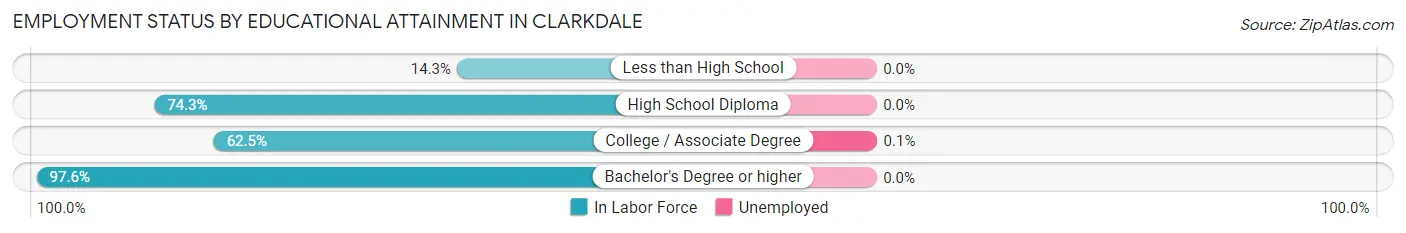
| Educational Attainment | In Labor Force | Unemployed |
| Less than High School | 1 (14.3%) | 0 (0.0%) |
| High School Diploma | 304 (74.3%) | 0 (0.0%) |
| College / Associate Degree | 801 (62.5%) | 1 (0.1%) |
| Bachelor's Degree or higher | 438 (97.6%) | 0 (0.0%) |
| Total | 1,543 (71.9%) | 2 (0.1%) |
Employment Occupations by Sex in Clarkdale
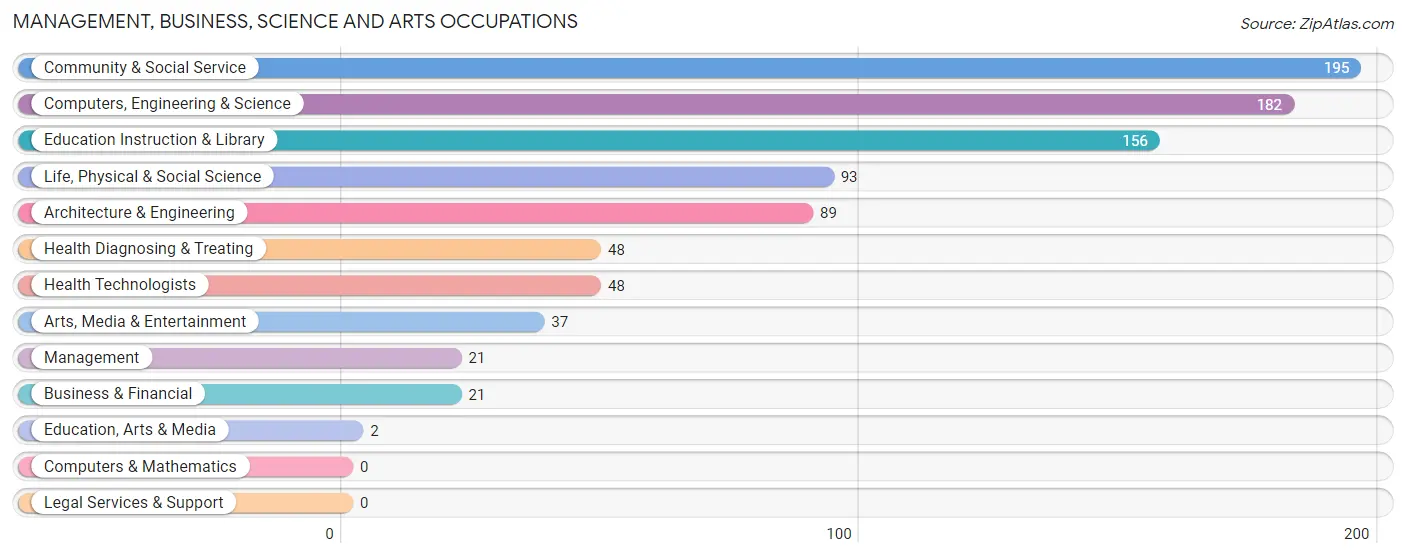
Management, Business, Science and Arts Occupations
The most common Management, Business, Science and Arts occupations in Clarkdale are Community & Social Service (195 | 9.7%), Computers, Engineering & Science (182 | 9.1%), Education Instruction & Library (156 | 7.8%), Life, Physical & Social Science (93 | 4.6%), and Architecture & Engineering (89 | 4.4%).
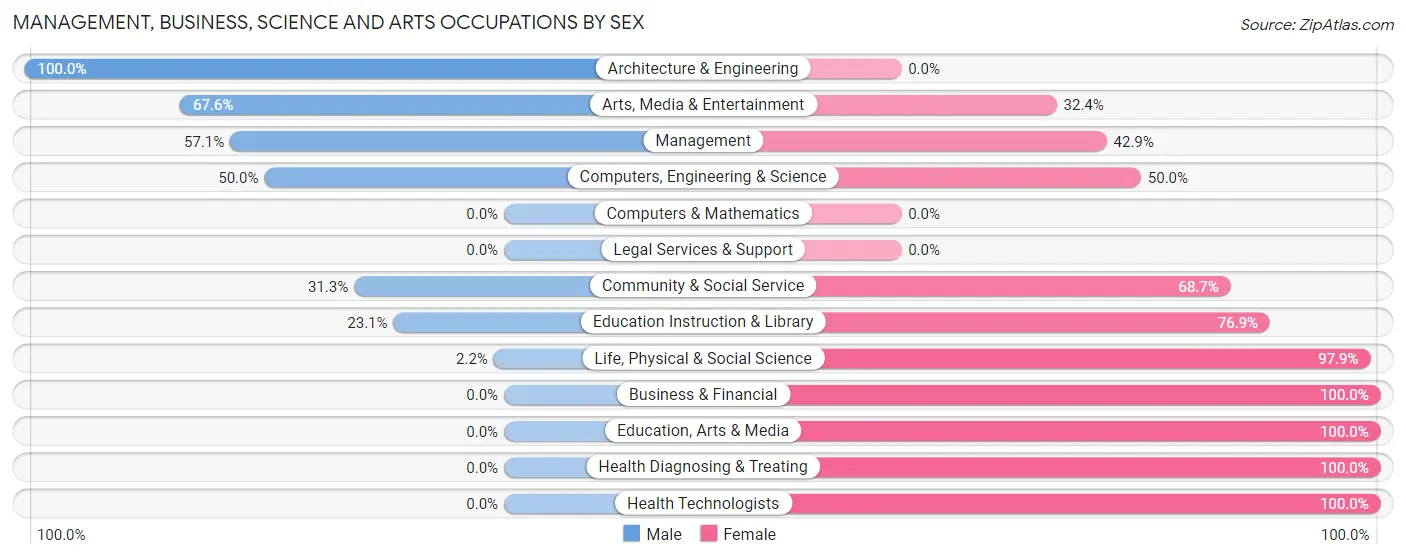
Management, Business, Science and Arts Occupations by Sex
Within the Management, Business, Science and Arts occupations in Clarkdale, the most male-oriented occupations are Architecture & Engineering (100.0%), Arts, Media & Entertainment (67.6%), and Management (57.1%), while the most female-oriented occupations are Business & Financial (100.0%), Education, Arts & Media (100.0%), and Health Diagnosing & Treating (100.0%).
| Occupation | Male | Female |
| Management | 12 (57.1%) | 9 (42.9%) |
| Business & Financial | 0 (0.0%) | 21 (100.0%) |
| Computers, Engineering & Science | 91 (50.0%) | 91 (50.0%) |
| Computers & Mathematics | 0 (0.0%) | 0 (0.0%) |
| Architecture & Engineering | 89 (100.0%) | 0 (0.0%) |
| Life, Physical & Social Science | 2 (2.1%) | 91 (97.9%) |
| Community & Social Service | 61 (31.3%) | 134 (68.7%) |
| Education, Arts & Media | 0 (0.0%) | 2 (100.0%) |
| Legal Services & Support | 0 (0.0%) | 0 (0.0%) |
| Education Instruction & Library | 36 (23.1%) | 120 (76.9%) |
| Arts, Media & Entertainment | 25 (67.6%) | 12 (32.4%) |
| Health Diagnosing & Treating | 0 (0.0%) | 48 (100.0%) |
| Health Technologists | 0 (0.0%) | 48 (100.0%) |
| Total (Category) | 164 (35.1%) | 303 (64.9%) |
| Total (Overall) | 742 (37.0%) | 1,263 (63.0%) |
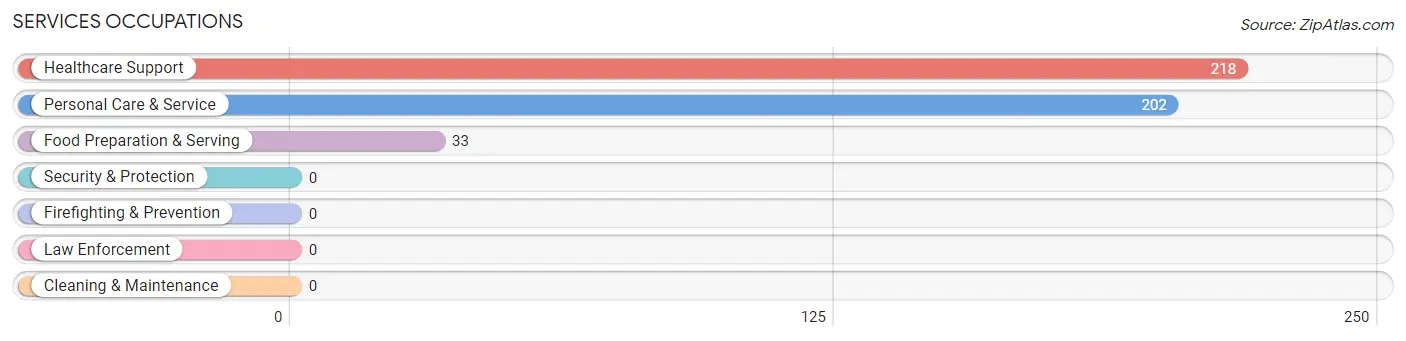
Services Occupations
The most common Services occupations in Clarkdale are Healthcare Support (218 | 10.9%), Personal Care & Service (202 | 10.1%), and Food Preparation & Serving (33 | 1.7%).
Services Occupations by Sex
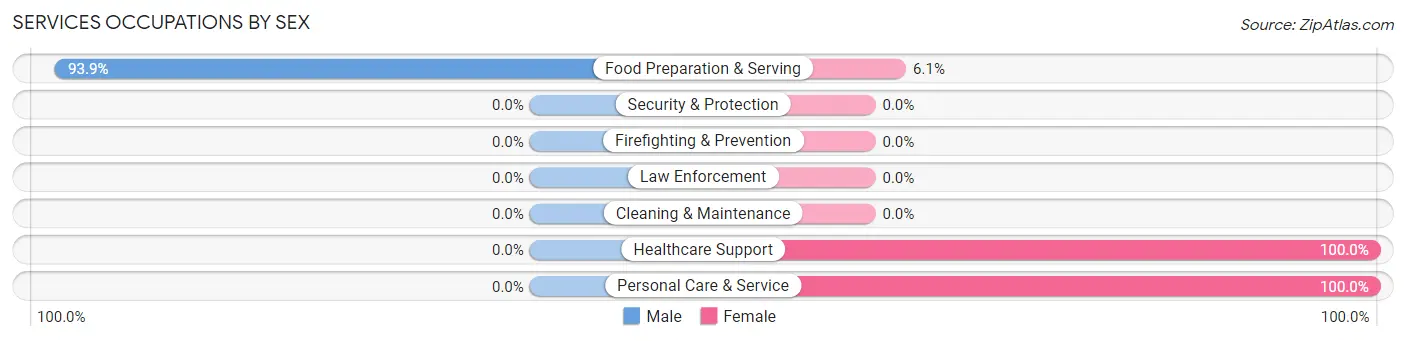
| Occupation | Male | Female |
| Healthcare Support | 0 (0.0%) | 218 (100.0%) |
| Security & Protection | 0 (0.0%) | 0 (0.0%) |
| Firefighting & Prevention | 0 (0.0%) | 0 (0.0%) |
| Law Enforcement | 0 (0.0%) | 0 (0.0%) |
| Food Preparation & Serving | 31 (93.9%) | 2 (6.1%) |
| Cleaning & Maintenance | 0 (0.0%) | 0 (0.0%) |
| Personal Care & Service | 0 (0.0%) | 202 (100.0%) |
| Total (Category) | 31 (6.8%) | 422 (93.2%) |
| Total (Overall) | 742 (37.0%) | 1,263 (63.0%) |
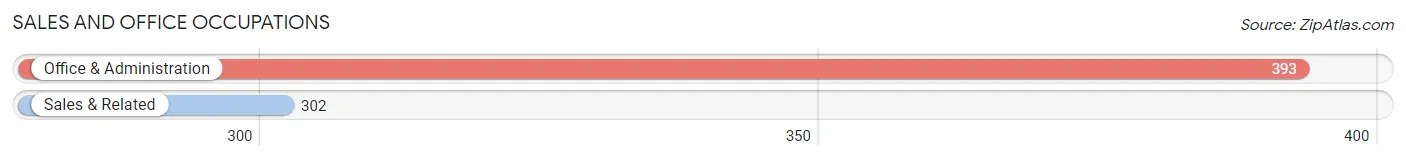
Sales and Office Occupations
The most common Sales and Office occupations in Clarkdale are Office & Administration (393 | 19.6%), and Sales & Related (302 | 15.1%).
Sales and Office Occupations by Sex
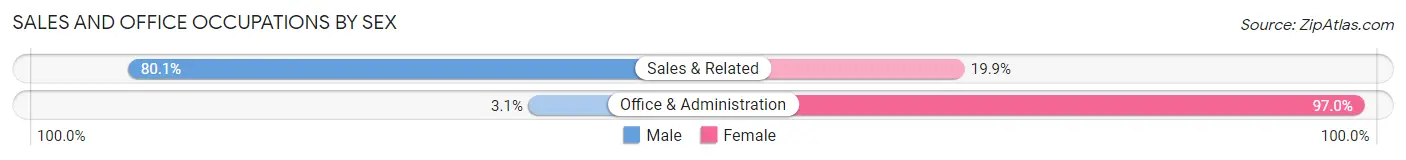
| Occupation | Male | Female |
| Sales & Related | 242 (80.1%) | 60 (19.9%) |
| Office & Administration | 12 (3.0%) | 381 (97.0%) |
| Total (Category) | 254 (36.5%) | 441 (63.4%) |
| Total (Overall) | 742 (37.0%) | 1,263 (63.0%) |
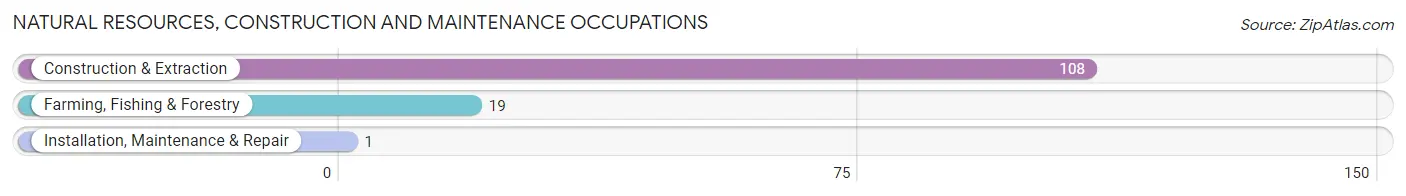
Natural Resources, Construction and Maintenance Occupations
The most common Natural Resources, Construction and Maintenance occupations in Clarkdale are Construction & Extraction (108 | 5.4%), Farming, Fishing & Forestry (19 | 0.9%), and Installation, Maintenance & Repair (1 | 0.1%).
Natural Resources, Construction and Maintenance Occupations by Sex
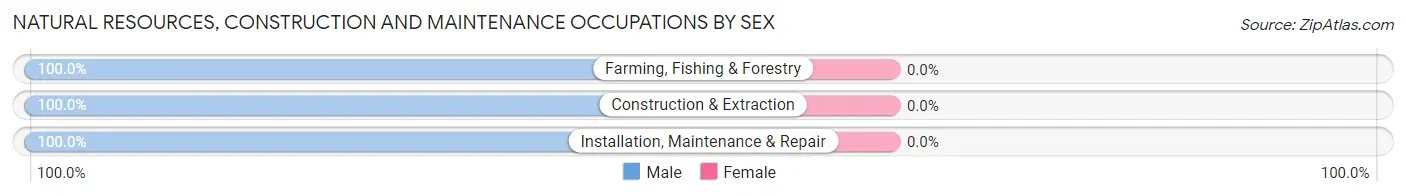
| Occupation | Male | Female |
| Farming, Fishing & Forestry | 19 (100.0%) | 0 (0.0%) |
| Construction & Extraction | 108 (100.0%) | 0 (0.0%) |
| Installation, Maintenance & Repair | 1 (100.0%) | 0 (0.0%) |
| Total (Category) | 128 (100.0%) | 0 (0.0%) |
| Total (Overall) | 742 (37.0%) | 1,263 (63.0%) |
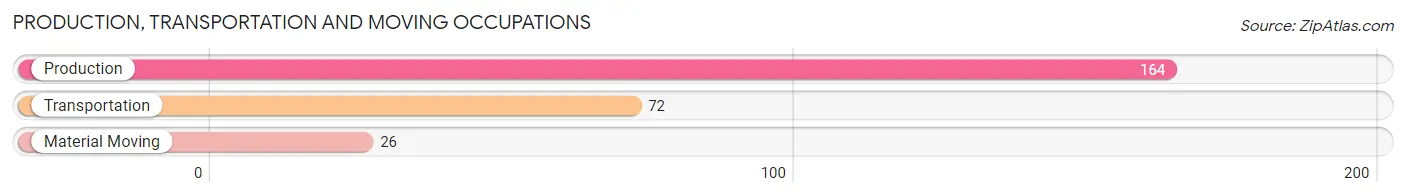
Production, Transportation and Moving Occupations
The most common Production, Transportation and Moving occupations in Clarkdale are Production (164 | 8.2%), Transportation (72 | 3.6%), and Material Moving (26 | 1.3%).
Production, Transportation and Moving Occupations by Sex
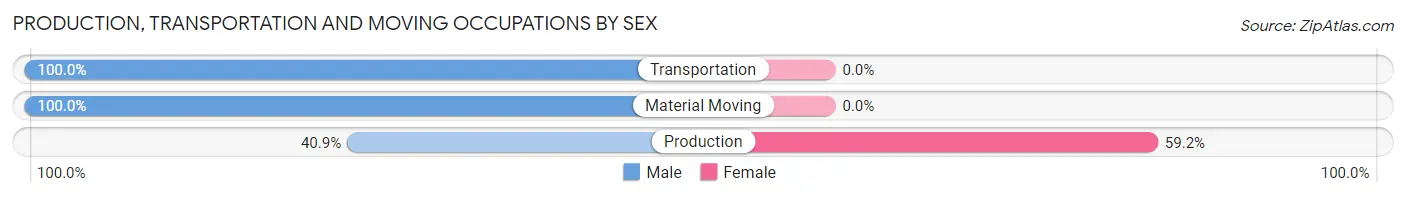
| Occupation | Male | Female |
| Production | 67 (40.8%) | 97 (59.2%) |
| Transportation | 72 (100.0%) | 0 (0.0%) |
| Material Moving | 26 (100.0%) | 0 (0.0%) |
| Total (Category) | 165 (63.0%) | 97 (37.0%) |
| Total (Overall) | 742 (37.0%) | 1,263 (63.0%) |
Employment Industries by Sex in Clarkdale
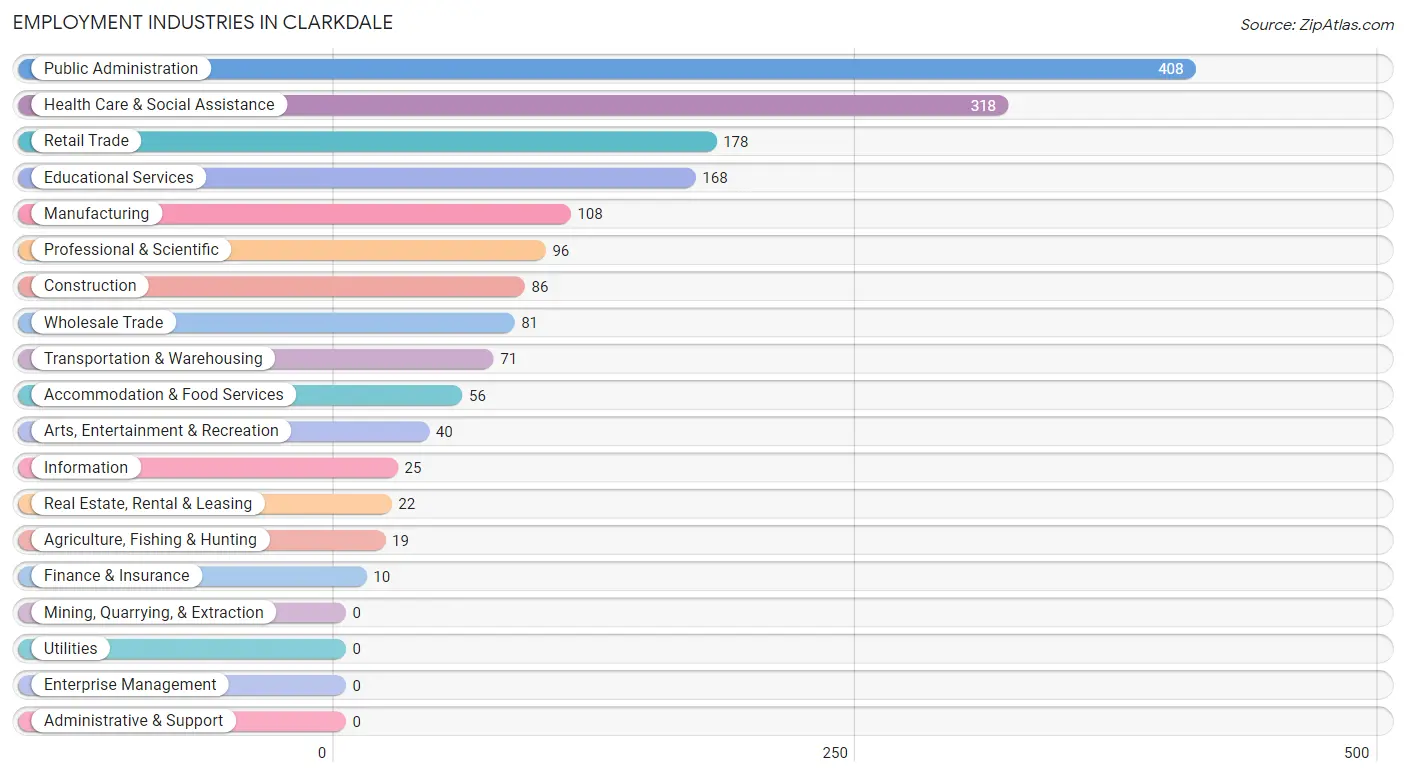
Employment Industries in Clarkdale
The major employment industries in Clarkdale include Public Administration (408 | 20.3%), Health Care & Social Assistance (318 | 15.9%), Retail Trade (178 | 8.9%), Educational Services (168 | 8.4%), and Manufacturing (108 | 5.4%).
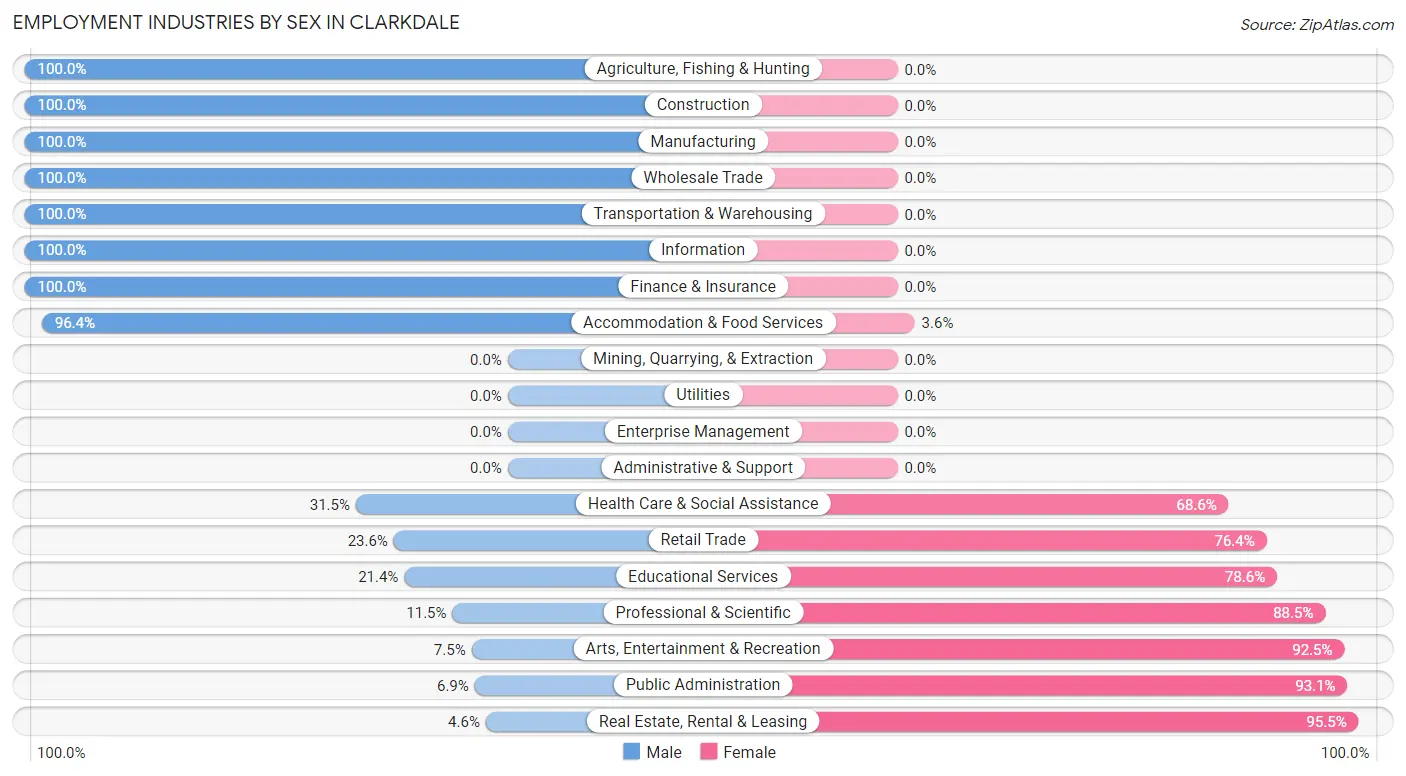
Employment Industries by Sex in Clarkdale
The Clarkdale industries that see more men than women are Agriculture, Fishing & Hunting (100.0%), Construction (100.0%), and Manufacturing (100.0%), whereas the industries that tend to have a higher number of women are Real Estate, Rental & Leasing (95.5%), Public Administration (93.1%), and Arts, Entertainment & Recreation (92.5%).
| Industry | Male | Female |
| Agriculture, Fishing & Hunting | 19 (100.0%) | 0 (0.0%) |
| Mining, Quarrying, & Extraction | 0 (0.0%) | 0 (0.0%) |
| Construction | 86 (100.0%) | 0 (0.0%) |
| Manufacturing | 108 (100.0%) | 0 (0.0%) |
| Wholesale Trade | 81 (100.0%) | 0 (0.0%) |
| Retail Trade | 42 (23.6%) | 136 (76.4%) |
| Transportation & Warehousing | 71 (100.0%) | 0 (0.0%) |
| Utilities | 0 (0.0%) | 0 (0.0%) |
| Information | 25 (100.0%) | 0 (0.0%) |
| Finance & Insurance | 10 (100.0%) | 0 (0.0%) |
| Real Estate, Rental & Leasing | 1 (4.5%) | 21 (95.5%) |
| Professional & Scientific | 11 (11.5%) | 85 (88.5%) |
| Enterprise Management | 0 (0.0%) | 0 (0.0%) |
| Administrative & Support | 0 (0.0%) | 0 (0.0%) |
| Educational Services | 36 (21.4%) | 132 (78.6%) |
| Health Care & Social Assistance | 100 (31.5%) | 218 (68.5%) |
| Arts, Entertainment & Recreation | 3 (7.5%) | 37 (92.5%) |
| Accommodation & Food Services | 54 (96.4%) | 2 (3.6%) |
| Public Administration | 28 (6.9%) | 380 (93.1%) |
| Total | 742 (37.0%) | 1,263 (63.0%) |
Education in Clarkdale
School Enrollment in Clarkdale
The most common levels of schooling among the 615 students in Clarkdale are college / undergraduate (181 | 29.4%), nursery / preschool (141 | 22.9%), and elementary school (119 | 19.4%).
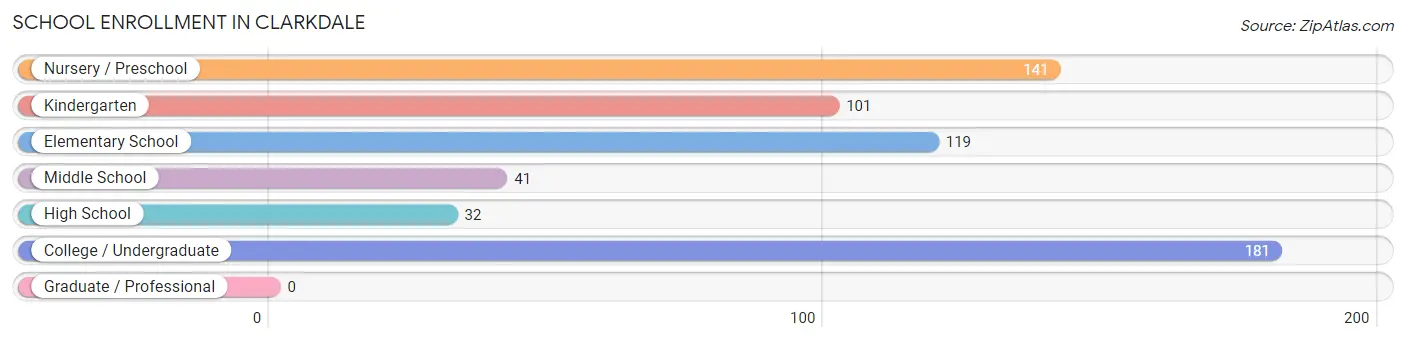
| School Level | # Students | % Students |
| Nursery / Preschool | 141 | 22.9% |
| Kindergarten | 101 | 16.4% |
| Elementary School | 119 | 19.4% |
| Middle School | 41 | 6.7% |
| High School | 32 | 5.2% |
| College / Undergraduate | 181 | 29.4% |
| Graduate / Professional | 0 | 0.0% |
| Total | 615 | 100.0% |
School Enrollment by Age by Funding Source in Clarkdale
Out of a total of 615 students who are enrolled in schools in Clarkdale, 4 (0.7%) attend a private institution, while the remaining 611 (99.3%) are enrolled in public schools. The age group of 20 to 24 year olds has the highest likelihood of being enrolled in private schools, with 3 (60.0% in the age bracket) enrolled. Conversely, the age group of 3 to 4 year olds has the lowest likelihood of being enrolled in a private school, with 140 (100.0% in the age bracket) attending a public institution.
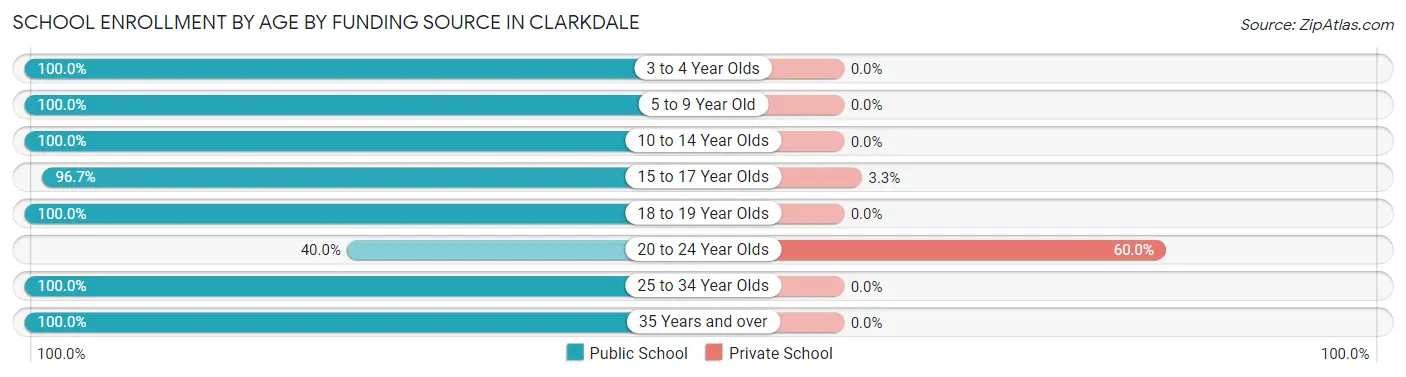
| Age Bracket | Public School | Private School |
| 3 to 4 Year Olds | 140 (100.0%) | 0 (0.0%) |
| 5 to 9 Year Old | 221 (100.0%) | 0 (0.0%) |
| 10 to 14 Year Olds | 41 (100.0%) | 0 (0.0%) |
| 15 to 17 Year Olds | 29 (96.7%) | 1 (3.3%) |
| 18 to 19 Year Olds | 21 (100.0%) | 0 (0.0%) |
| 20 to 24 Year Olds | 2 (40.0%) | 3 (60.0%) |
| 25 to 34 Year Olds | 51 (100.0%) | 0 (0.0%) |
| 35 Years and over | 106 (100.0%) | 0 (0.0%) |
| Total | 611 (99.3%) | 4 (0.7%) |
Educational Attainment by Field of Study in Clarkdale
Business (226 | 21.9%), bio, nature & agricultural (191 | 18.5%), science & technology (189 | 18.3%), education (98 | 9.5%), and visual & performing arts (77 | 7.5%) are the most common fields of study among 1,031 individuals in Clarkdale who have obtained a bachelor's degree or higher.
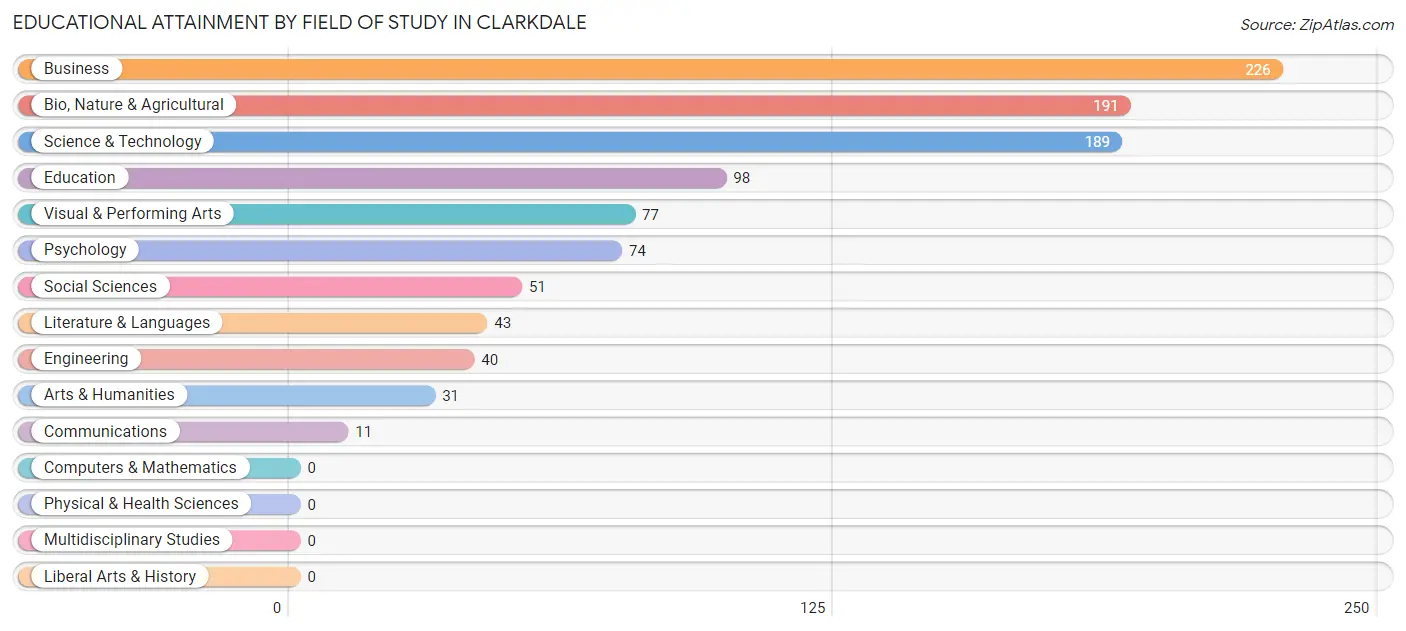
| Field of Study | # Graduates | % Graduates |
| Computers & Mathematics | 0 | 0.0% |
| Bio, Nature & Agricultural | 191 | 18.5% |
| Physical & Health Sciences | 0 | 0.0% |
| Psychology | 74 | 7.2% |
| Social Sciences | 51 | 5.0% |
| Engineering | 40 | 3.9% |
| Multidisciplinary Studies | 0 | 0.0% |
| Science & Technology | 189 | 18.3% |
| Business | 226 | 21.9% |
| Education | 98 | 9.5% |
| Literature & Languages | 43 | 4.2% |
| Liberal Arts & History | 0 | 0.0% |
| Visual & Performing Arts | 77 | 7.5% |
| Communications | 11 | 1.1% |
| Arts & Humanities | 31 | 3.0% |
| Total | 1,031 | 100.0% |
Transportation & Commute in Clarkdale
Vehicle Availability by Sex in Clarkdale
The most prevalent vehicle ownership categories in Clarkdale are males with 2 vehicles (460, accounting for 62.1%) and females with 2 vehicles (670, making up 36.4%).
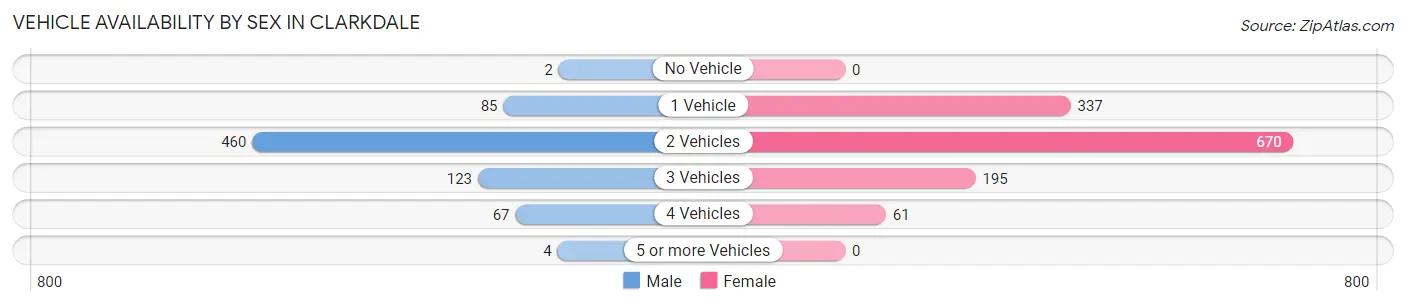
| Vehicles Available | Male | Female |
| No Vehicle | 2 (0.3%) | 0 (0.0%) |
| 1 Vehicle | 85 (11.5%) | 337 (26.7%) |
| 2 Vehicles | 460 (62.1%) | 670 (53.0%) |
| 3 Vehicles | 123 (16.6%) | 195 (15.4%) |
| 4 Vehicles | 67 (9.0%) | 61 (4.8%) |
| 5 or more Vehicles | 4 (0.5%) | 0 (0.0%) |
| Total | 741 (100.0%) | 1,263 (100.0%) |
Commute Time in Clarkdale
The most frequently occuring commute durations in Clarkdale are 5 to 9 minutes (697 commuters, 39.5%), 30 to 34 minutes (263 commuters, 14.9%), and 15 to 19 minutes (220 commuters, 12.5%).
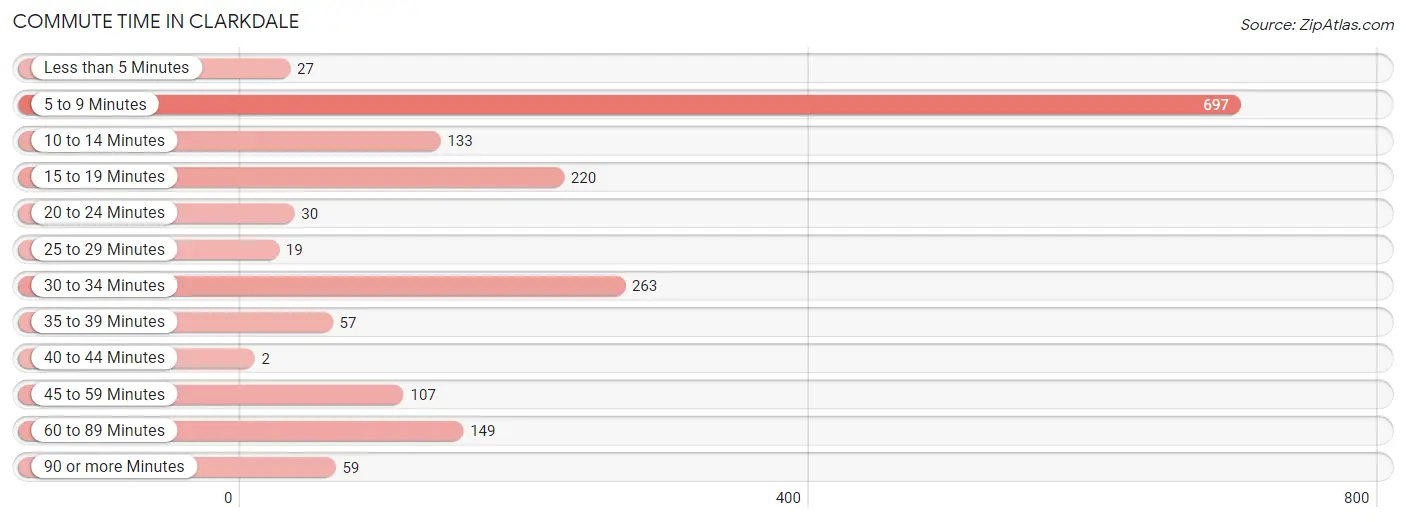
| Commute Time | # Commuters | % Commuters |
| Less than 5 Minutes | 27 | 1.5% |
| 5 to 9 Minutes | 697 | 39.5% |
| 10 to 14 Minutes | 133 | 7.5% |
| 15 to 19 Minutes | 220 | 12.5% |
| 20 to 24 Minutes | 30 | 1.7% |
| 25 to 29 Minutes | 19 | 1.1% |
| 30 to 34 Minutes | 263 | 14.9% |
| 35 to 39 Minutes | 57 | 3.2% |
| 40 to 44 Minutes | 2 | 0.1% |
| 45 to 59 Minutes | 107 | 6.1% |
| 60 to 89 Minutes | 149 | 8.5% |
| 90 or more Minutes | 59 | 3.4% |
Commute Time by Sex in Clarkdale
The most common commute times in Clarkdale are 30 to 34 minutes (143 commuters, 23.2%) for males and 5 to 9 minutes (611 commuters, 53.3%) for females.
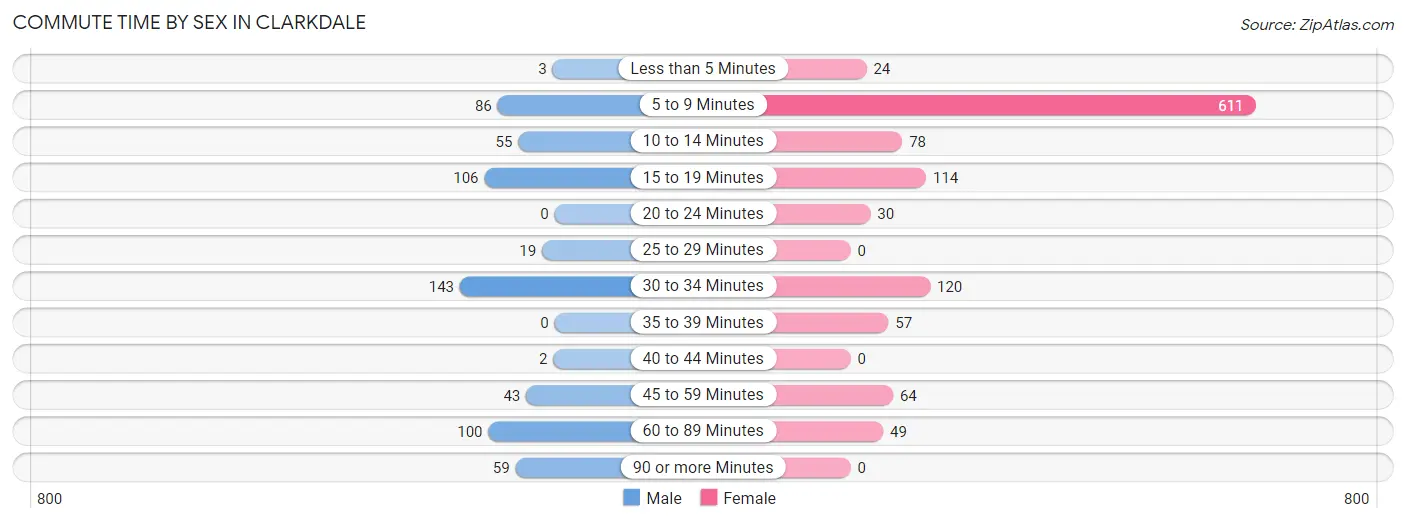
| Commute Time | Male | Female |
| Less than 5 Minutes | 3 (0.5%) | 24 (2.1%) |
| 5 to 9 Minutes | 86 (14.0%) | 611 (53.3%) |
| 10 to 14 Minutes | 55 (8.9%) | 78 (6.8%) |
| 15 to 19 Minutes | 106 (17.2%) | 114 (9.9%) |
| 20 to 24 Minutes | 0 (0.0%) | 30 (2.6%) |
| 25 to 29 Minutes | 19 (3.1%) | 0 (0.0%) |
| 30 to 34 Minutes | 143 (23.2%) | 120 (10.5%) |
| 35 to 39 Minutes | 0 (0.0%) | 57 (5.0%) |
| 40 to 44 Minutes | 2 (0.3%) | 0 (0.0%) |
| 45 to 59 Minutes | 43 (7.0%) | 64 (5.6%) |
| 60 to 89 Minutes | 100 (16.2%) | 49 (4.3%) |
| 90 or more Minutes | 59 (9.6%) | 0 (0.0%) |
Time of Departure to Work by Sex in Clarkdale
The most frequent times of departure to work in Clarkdale are 6:30 AM to 6:59 AM (200, 32.5%) for males and 7:30 AM to 7:59 AM (400, 34.9%) for females.
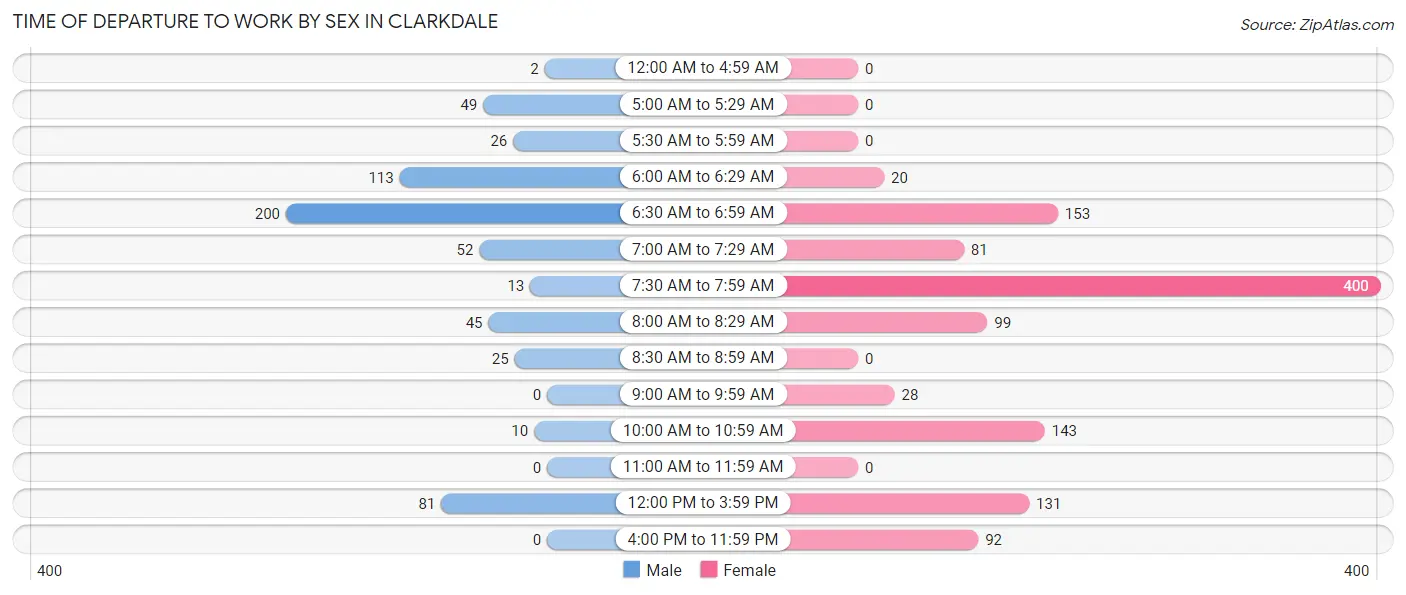
| Time of Departure | Male | Female |
| 12:00 AM to 4:59 AM | 2 (0.3%) | 0 (0.0%) |
| 5:00 AM to 5:29 AM | 49 (8.0%) | 0 (0.0%) |
| 5:30 AM to 5:59 AM | 26 (4.2%) | 0 (0.0%) |
| 6:00 AM to 6:29 AM | 113 (18.3%) | 20 (1.7%) |
| 6:30 AM to 6:59 AM | 200 (32.5%) | 153 (13.3%) |
| 7:00 AM to 7:29 AM | 52 (8.4%) | 81 (7.1%) |
| 7:30 AM to 7:59 AM | 13 (2.1%) | 400 (34.9%) |
| 8:00 AM to 8:29 AM | 45 (7.3%) | 99 (8.6%) |
| 8:30 AM to 8:59 AM | 25 (4.1%) | 0 (0.0%) |
| 9:00 AM to 9:59 AM | 0 (0.0%) | 28 (2.4%) |
| 10:00 AM to 10:59 AM | 10 (1.6%) | 143 (12.5%) |
| 11:00 AM to 11:59 AM | 0 (0.0%) | 0 (0.0%) |
| 12:00 PM to 3:59 PM | 81 (13.2%) | 131 (11.4%) |
| 4:00 PM to 11:59 PM | 0 (0.0%) | 92 (8.0%) |
| Total | 616 (100.0%) | 1,147 (100.0%) |
Housing Occupancy in Clarkdale
Occupancy by Ownership in Clarkdale
Of the total 2,400 dwellings in Clarkdale, owner-occupied units account for 2,025 (84.4%), while renter-occupied units make up 375 (15.6%).
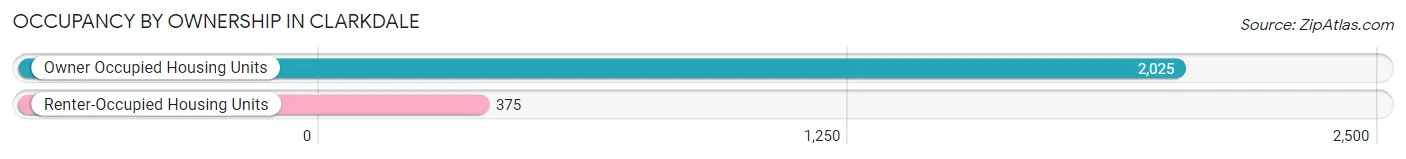
| Occupancy | # Housing Units | % Housing Units |
| Owner Occupied Housing Units | 2,025 | 84.4% |
| Renter-Occupied Housing Units | 375 | 15.6% |
| Total Occupied Housing Units | 2,400 | 100.0% |
Occupancy by Household Size in Clarkdale
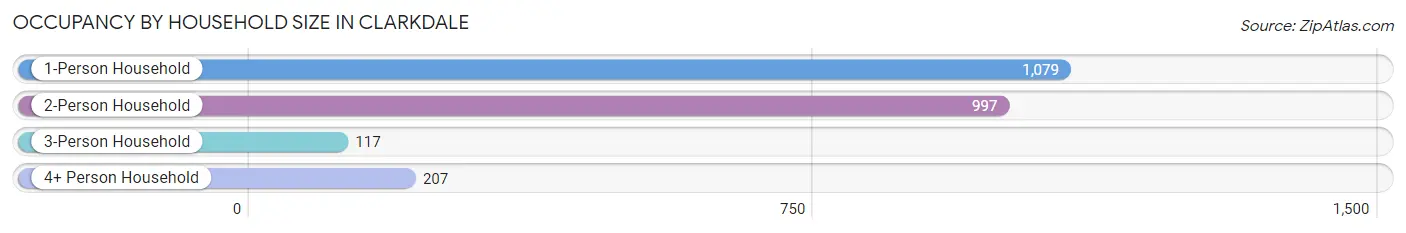
| Household Size | # Housing Units | % Housing Units |
| 1-Person Household | 1,079 | 45.0% |
| 2-Person Household | 997 | 41.5% |
| 3-Person Household | 117 | 4.9% |
| 4+ Person Household | 207 | 8.6% |
| Total Housing Units | 2,400 | 100.0% |
Occupancy by Ownership by Household Size in Clarkdale
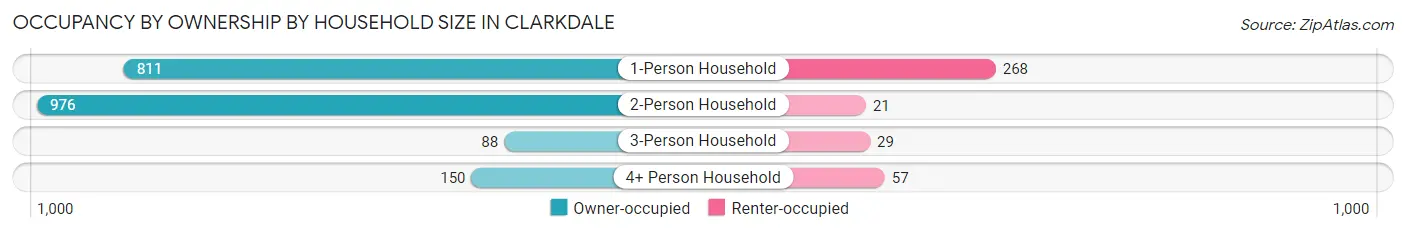
| Household Size | Owner-occupied | Renter-occupied |
| 1-Person Household | 811 (75.2%) | 268 (24.8%) |
| 2-Person Household | 976 (97.9%) | 21 (2.1%) |
| 3-Person Household | 88 (75.2%) | 29 (24.8%) |
| 4+ Person Household | 150 (72.5%) | 57 (27.5%) |
| Total Housing Units | 2,025 (84.4%) | 375 (15.6%) |
Occupancy by Educational Attainment in Clarkdale
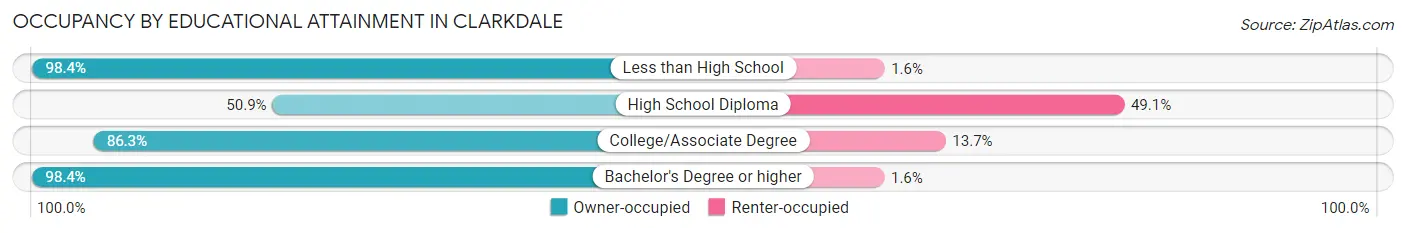
| Household Size | Owner-occupied | Renter-occupied |
| Less than High School | 185 (98.4%) | 3 (1.6%) |
| High School Diploma | 233 (50.9%) | 225 (49.1%) |
| College/Associate Degree | 848 (86.3%) | 135 (13.7%) |
| Bachelor's Degree or higher | 759 (98.4%) | 12 (1.6%) |
Occupancy by Age of Householder in Clarkdale
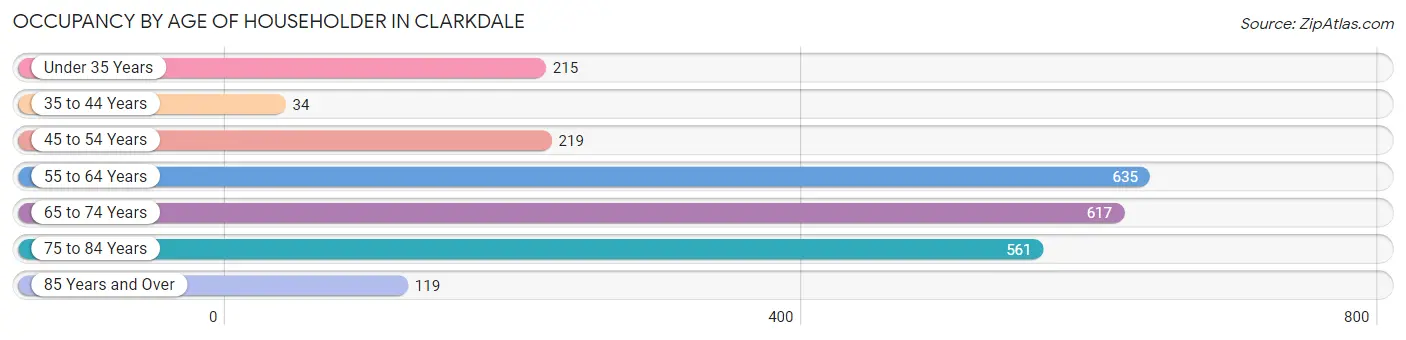
| Age Bracket | # Households | % Households |
| Under 35 Years | 215 | 9.0% |
| 35 to 44 Years | 34 | 1.4% |
| 45 to 54 Years | 219 | 9.1% |
| 55 to 64 Years | 635 | 26.5% |
| 65 to 74 Years | 617 | 25.7% |
| 75 to 84 Years | 561 | 23.4% |
| 85 Years and Over | 119 | 5.0% |
| Total | 2,400 | 100.0% |
Housing Finances in Clarkdale
Median Income by Occupancy in Clarkdale
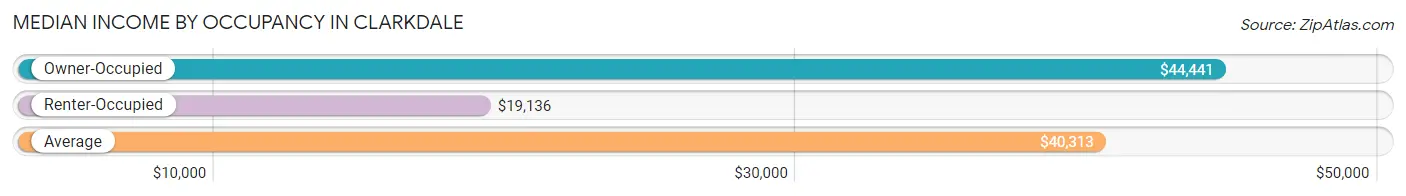
| Occupancy Type | # Households | Median Income |
| Owner-Occupied | 2,025 (84.4%) | $44,441 |
| Renter-Occupied | 375 (15.6%) | $19,136 |
| Average | 2,400 (100.0%) | $40,313 |
Occupancy by Householder Income Bracket in Clarkdale
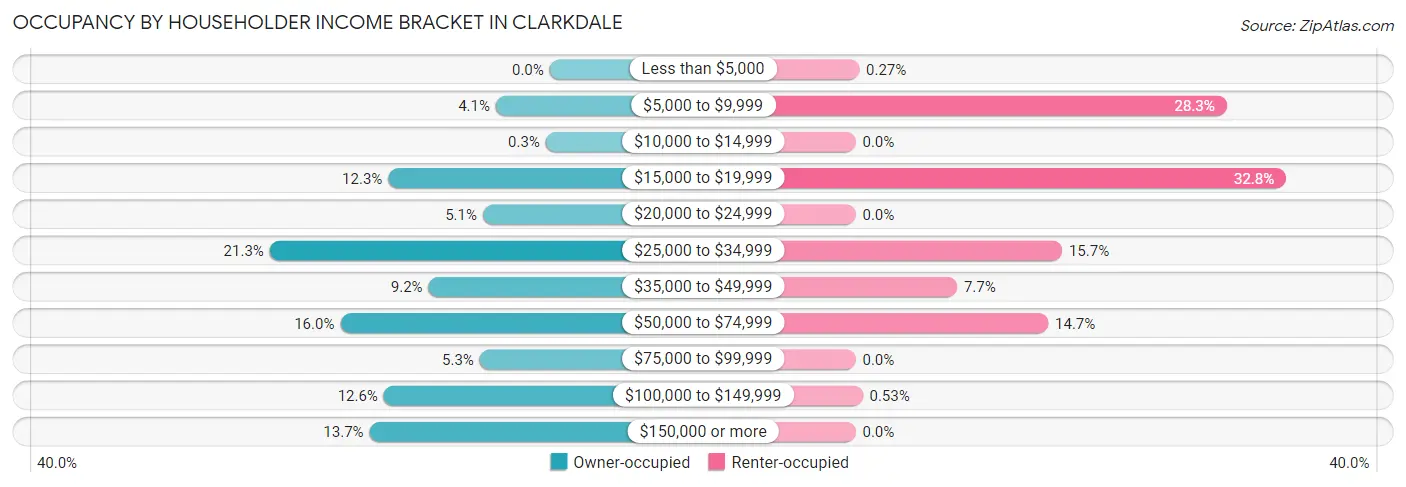
| Income Bracket | Owner-occupied | Renter-occupied |
| Less than $5,000 | 0 (0.0%) | 1 (0.3%) |
| $5,000 to $9,999 | 83 (4.1%) | 106 (28.3%) |
| $10,000 to $14,999 | 6 (0.3%) | 0 (0.0%) |
| $15,000 to $19,999 | 249 (12.3%) | 123 (32.8%) |
| $20,000 to $24,999 | 103 (5.1%) | 0 (0.0%) |
| $25,000 to $34,999 | 432 (21.3%) | 59 (15.7%) |
| $35,000 to $49,999 | 187 (9.2%) | 29 (7.7%) |
| $50,000 to $74,999 | 323 (16.0%) | 55 (14.7%) |
| $75,000 to $99,999 | 108 (5.3%) | 0 (0.0%) |
| $100,000 to $149,999 | 256 (12.6%) | 2 (0.5%) |
| $150,000 or more | 278 (13.7%) | 0 (0.0%) |
| Total | 2,025 (100.0%) | 375 (100.0%) |
Monthly Housing Cost Tiers in Clarkdale
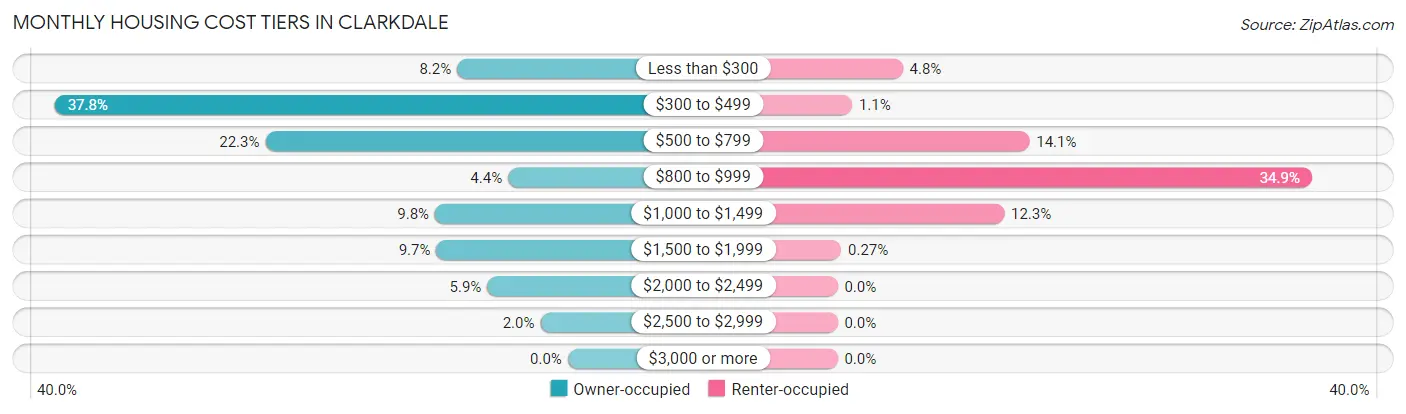
| Monthly Cost | Owner-occupied | Renter-occupied |
| Less than $300 | 165 (8.2%) | 18 (4.8%) |
| $300 to $499 | 765 (37.8%) | 4 (1.1%) |
| $500 to $799 | 451 (22.3%) | 53 (14.1%) |
| $800 to $999 | 89 (4.4%) | 131 (34.9%) |
| $1,000 to $1,499 | 198 (9.8%) | 46 (12.3%) |
| $1,500 to $1,999 | 196 (9.7%) | 1 (0.3%) |
| $2,000 to $2,499 | 120 (5.9%) | 0 (0.0%) |
| $2,500 to $2,999 | 41 (2.0%) | 0 (0.0%) |
| $3,000 or more | 0 (0.0%) | 0 (0.0%) |
| Total | 2,025 (100.0%) | 375 (100.0%) |
Physical Housing Characteristics in Clarkdale
Housing Structures in Clarkdale
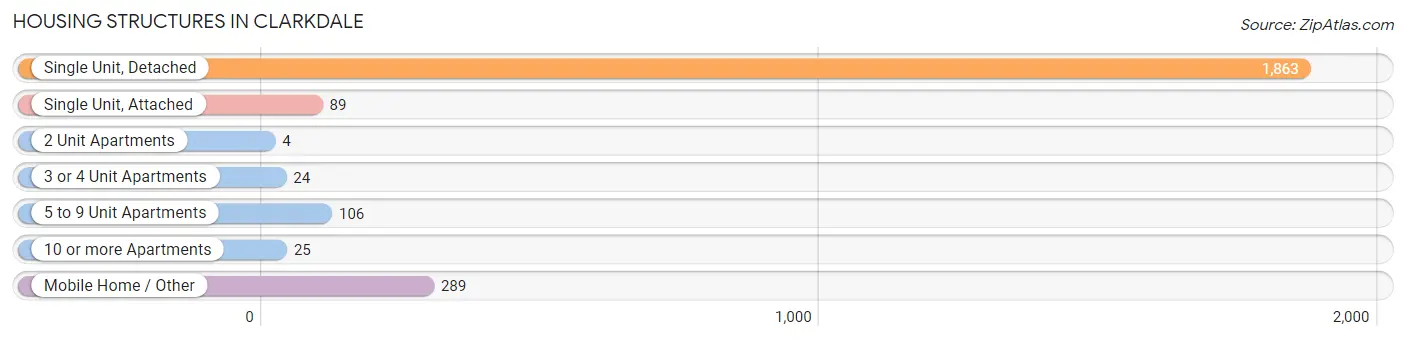
| Structure Type | # Housing Units | % Housing Units |
| Single Unit, Detached | 1,863 | 77.6% |
| Single Unit, Attached | 89 | 3.7% |
| 2 Unit Apartments | 4 | 0.2% |
| 3 or 4 Unit Apartments | 24 | 1.0% |
| 5 to 9 Unit Apartments | 106 | 4.4% |
| 10 or more Apartments | 25 | 1.0% |
| Mobile Home / Other | 289 | 12.0% |
| Total | 2,400 | 100.0% |
Housing Structures by Occupancy in Clarkdale
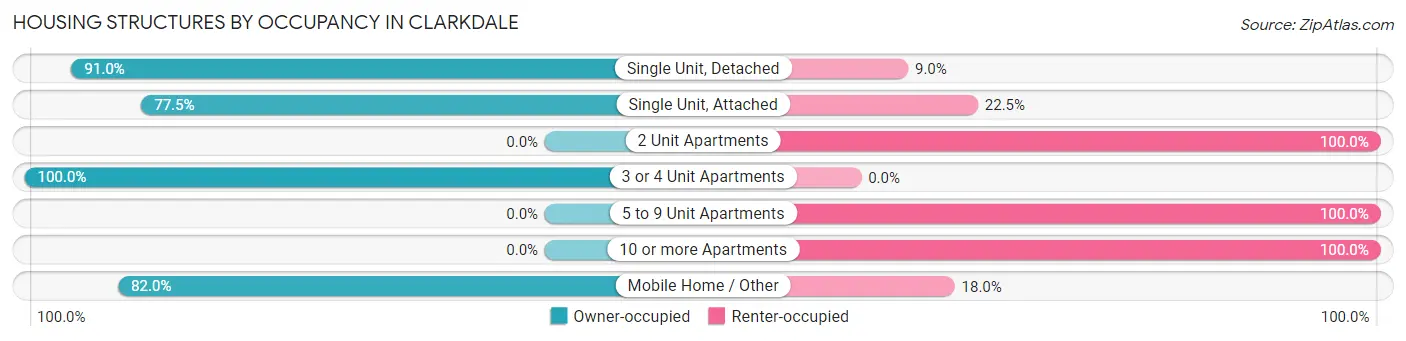
| Structure Type | Owner-occupied | Renter-occupied |
| Single Unit, Detached | 1,695 (91.0%) | 168 (9.0%) |
| Single Unit, Attached | 69 (77.5%) | 20 (22.5%) |
| 2 Unit Apartments | 0 (0.0%) | 4 (100.0%) |
| 3 or 4 Unit Apartments | 24 (100.0%) | 0 (0.0%) |
| 5 to 9 Unit Apartments | 0 (0.0%) | 106 (100.0%) |
| 10 or more Apartments | 0 (0.0%) | 25 (100.0%) |
| Mobile Home / Other | 237 (82.0%) | 52 (18.0%) |
| Total | 2,025 (84.4%) | 375 (15.6%) |
Housing Structures by Number of Rooms in Clarkdale
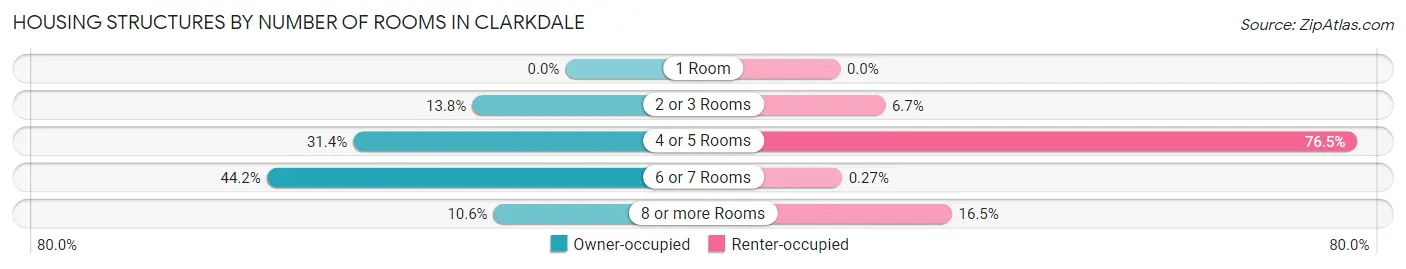
| Number of Rooms | Owner-occupied | Renter-occupied |
| 1 Room | 0 (0.0%) | 0 (0.0%) |
| 2 or 3 Rooms | 279 (13.8%) | 25 (6.7%) |
| 4 or 5 Rooms | 636 (31.4%) | 287 (76.5%) |
| 6 or 7 Rooms | 895 (44.2%) | 1 (0.3%) |
| 8 or more Rooms | 215 (10.6%) | 62 (16.5%) |
| Total | 2,025 (100.0%) | 375 (100.0%) |
Housing Structure by Heating Type in Clarkdale
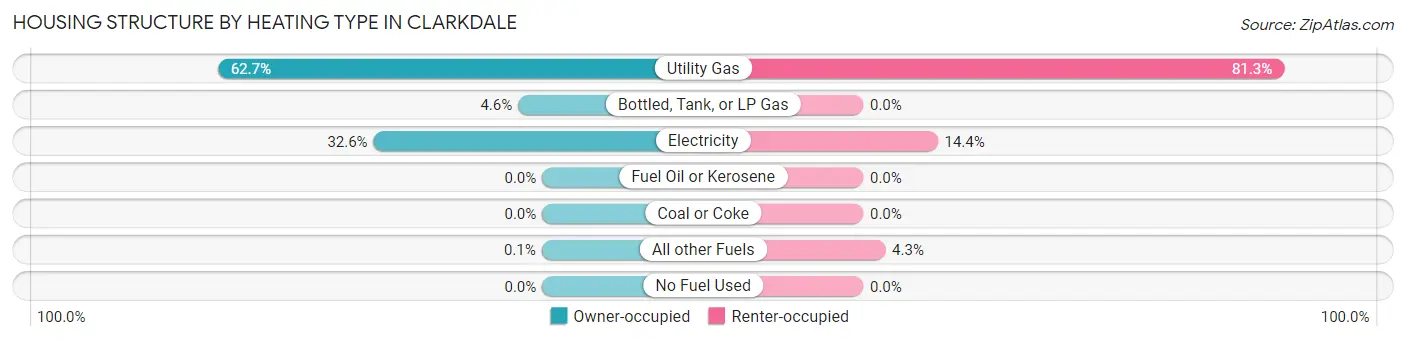
| Heating Type | Owner-occupied | Renter-occupied |
| Utility Gas | 1,269 (62.7%) | 305 (81.3%) |
| Bottled, Tank, or LP Gas | 94 (4.6%) | 0 (0.0%) |
| Electricity | 660 (32.6%) | 54 (14.4%) |
| Fuel Oil or Kerosene | 0 (0.0%) | 0 (0.0%) |
| Coal or Coke | 0 (0.0%) | 0 (0.0%) |
| All other Fuels | 2 (0.1%) | 16 (4.3%) |
| No Fuel Used | 0 (0.0%) | 0 (0.0%) |
| Total | 2,025 (100.0%) | 375 (100.0%) |
Household Vehicle Usage in Clarkdale
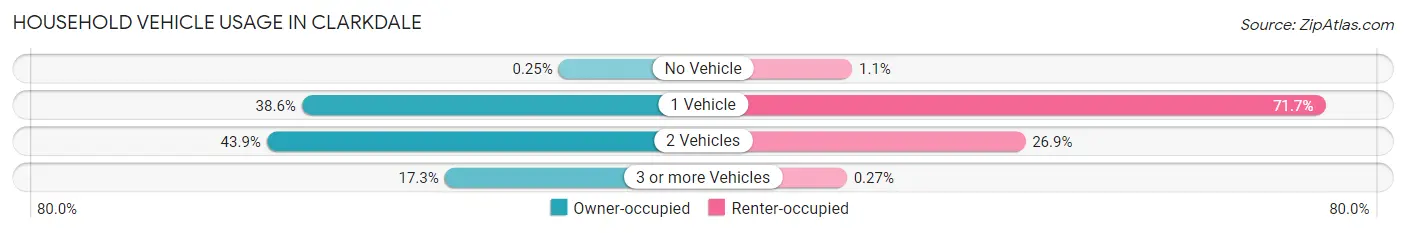
| Vehicles per Household | Owner-occupied | Renter-occupied |
| No Vehicle | 5 (0.3%) | 4 (1.1%) |
| 1 Vehicle | 782 (38.6%) | 269 (71.7%) |
| 2 Vehicles | 888 (43.9%) | 101 (26.9%) |
| 3 or more Vehicles | 350 (17.3%) | 1 (0.3%) |
| Total | 2,025 (100.0%) | 375 (100.0%) |
Real Estate & Mortgages in Clarkdale
Real Estate and Mortgage Overview in Clarkdale
| Characteristic | Without Mortgage | With Mortgage |
| Housing Units | 1,342 | 683 |
| Median Property Value | $266,500 | $338,000 |
| Median Household Income | $31,017 | $38 |
| Monthly Housing Costs | $429 | $0 |
| Real Estate Taxes | $1,575 | $4 |
Property Value by Mortgage Status in Clarkdale
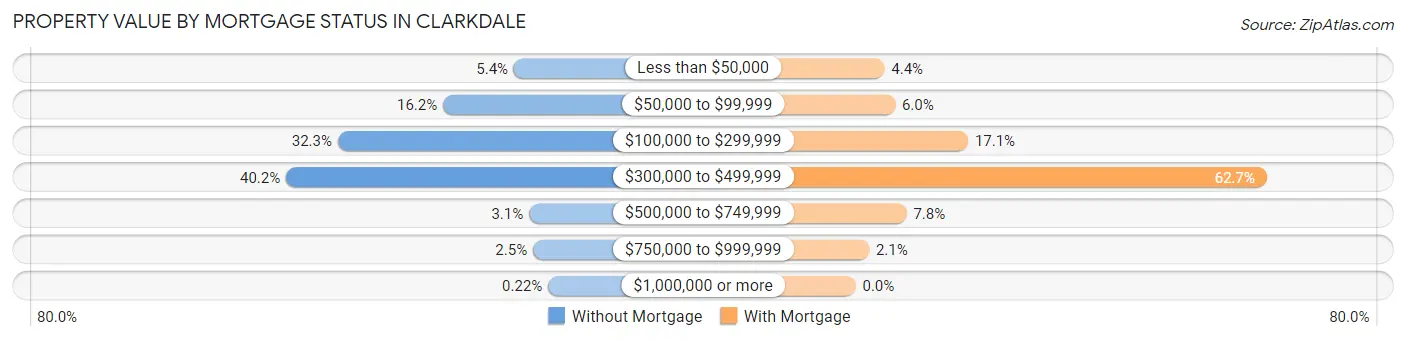
| Property Value | Without Mortgage | With Mortgage |
| Less than $50,000 | 73 (5.4%) | 30 (4.4%) |
| $50,000 to $99,999 | 218 (16.2%) | 41 (6.0%) |
| $100,000 to $299,999 | 433 (32.3%) | 117 (17.1%) |
| $300,000 to $499,999 | 539 (40.2%) | 428 (62.7%) |
| $500,000 to $749,999 | 42 (3.1%) | 53 (7.8%) |
| $750,000 to $999,999 | 34 (2.5%) | 14 (2.1%) |
| $1,000,000 or more | 3 (0.2%) | 0 (0.0%) |
| Total | 1,342 (100.0%) | 683 (100.0%) |
Household Income by Mortgage Status in Clarkdale
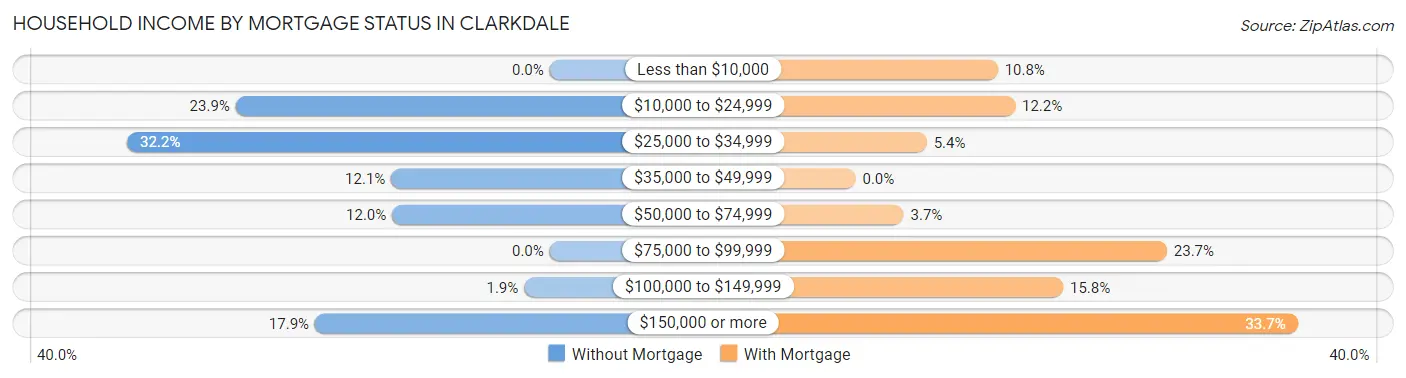
| Household Income | Without Mortgage | With Mortgage |
| Less than $10,000 | 0 (0.0%) | 74 (10.8%) |
| $10,000 to $24,999 | 321 (23.9%) | 83 (12.1%) |
| $25,000 to $34,999 | 432 (32.2%) | 37 (5.4%) |
| $35,000 to $49,999 | 162 (12.1%) | 0 (0.0%) |
| $50,000 to $74,999 | 161 (12.0%) | 25 (3.7%) |
| $75,000 to $99,999 | 0 (0.0%) | 162 (23.7%) |
| $100,000 to $149,999 | 26 (1.9%) | 108 (15.8%) |
| $150,000 or more | 240 (17.9%) | 230 (33.7%) |
| Total | 1,342 (100.0%) | 683 (100.0%) |
Property Value to Household Income Ratio in Clarkdale
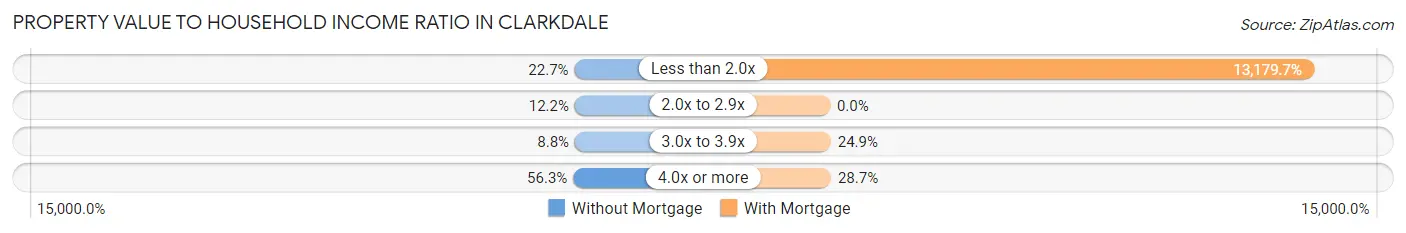
| Value-to-Income Ratio | Without Mortgage | With Mortgage |
| Less than 2.0x | 305 (22.7%) | 90,017 (13,179.7%) |
| 2.0x to 2.9x | 163 (12.1%) | 0 (0.0%) |
| 3.0x to 3.9x | 118 (8.8%) | 170 (24.9%) |
| 4.0x or more | 756 (56.3%) | 196 (28.7%) |
| Total | 1,342 (100.0%) | 683 (100.0%) |
Real Estate Taxes by Mortgage Status in Clarkdale
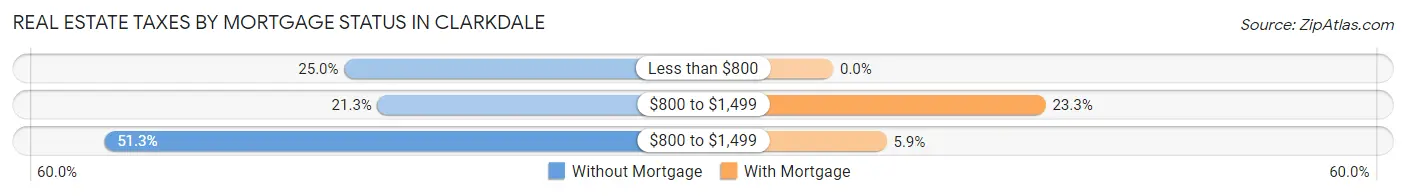
| Property Taxes | Without Mortgage | With Mortgage |
| Less than $800 | 335 (25.0%) | 0 (0.0%) |
| $800 to $1,499 | 286 (21.3%) | 159 (23.3%) |
| $800 to $1,499 | 688 (51.3%) | 40 (5.9%) |
| Total | 1,342 (100.0%) | 683 (100.0%) |
Health & Disability in Clarkdale
Health Insurance Coverage by Age in Clarkdale
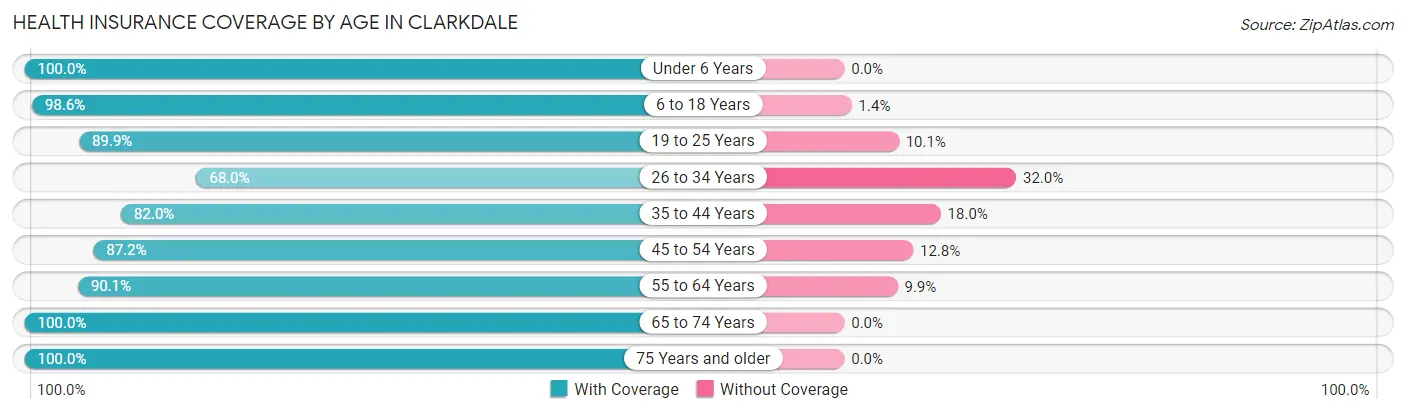
| Age Bracket | With Coverage | Without Coverage |
| Under 6 Years | 346 (100.0%) | 0 (0.0%) |
| 6 to 18 Years | 288 (98.6%) | 4 (1.4%) |
| 19 to 25 Years | 62 (89.9%) | 7 (10.1%) |
| 26 to 34 Years | 331 (68.0%) | 156 (32.0%) |
| 35 to 44 Years | 105 (82.0%) | 23 (18.0%) |
| 45 to 54 Years | 306 (87.2%) | 45 (12.8%) |
| 55 to 64 Years | 1,043 (90.1%) | 115 (9.9%) |
| 65 to 74 Years | 868 (100.0%) | 0 (0.0%) |
| 75 Years and older | 829 (100.0%) | 0 (0.0%) |
| Total | 4,178 (92.3%) | 350 (7.7%) |
Health Insurance Coverage by Citizenship Status in Clarkdale
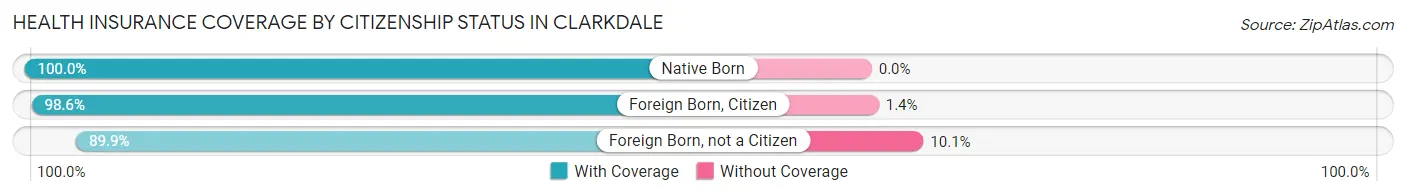
| Citizenship Status | With Coverage | Without Coverage |
| Native Born | 346 (100.0%) | 0 (0.0%) |
| Foreign Born, Citizen | 288 (98.6%) | 4 (1.4%) |
| Foreign Born, not a Citizen | 62 (89.9%) | 7 (10.1%) |
Health Insurance Coverage by Household Income in Clarkdale
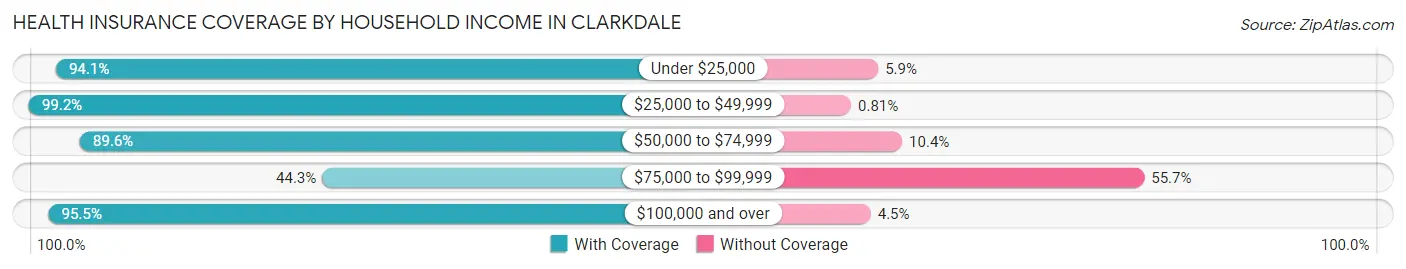
| Household Income | With Coverage | Without Coverage |
| Under $25,000 | 671 (94.1%) | 42 (5.9%) |
| $25,000 to $49,999 | 1,217 (99.2%) | 10 (0.8%) |
| $50,000 to $74,999 | 864 (89.6%) | 100 (10.4%) |
| $75,000 to $99,999 | 108 (44.3%) | 136 (55.7%) |
| $100,000 and over | 1,317 (95.5%) | 62 (4.5%) |
Public vs Private Health Insurance Coverage by Age in Clarkdale
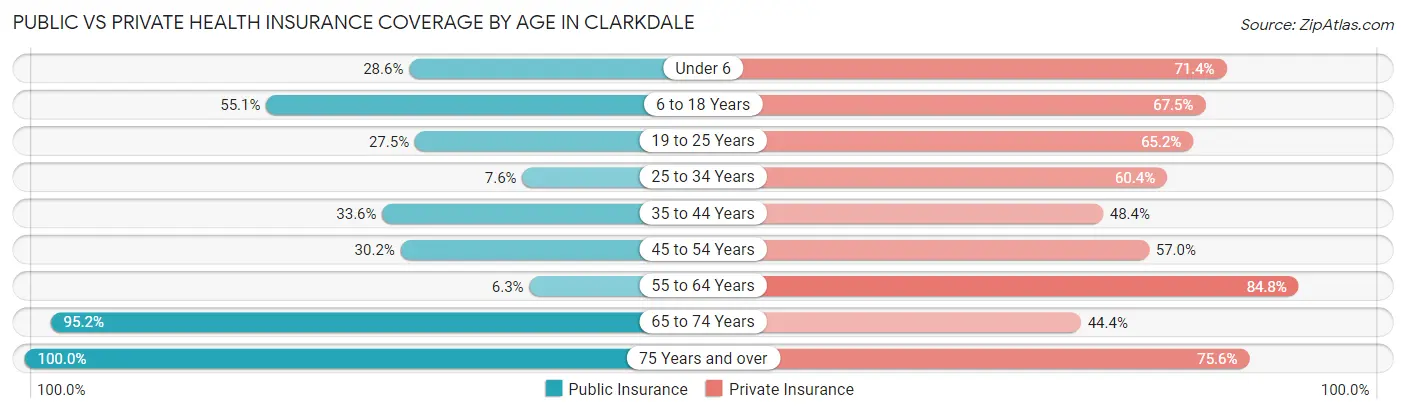
| Age Bracket | Public Insurance | Private Insurance |
| Under 6 | 99 (28.6%) | 247 (71.4%) |
| 6 to 18 Years | 161 (55.1%) | 197 (67.5%) |
| 19 to 25 Years | 19 (27.5%) | 45 (65.2%) |
| 25 to 34 Years | 37 (7.6%) | 294 (60.4%) |
| 35 to 44 Years | 43 (33.6%) | 62 (48.4%) |
| 45 to 54 Years | 106 (30.2%) | 200 (57.0%) |
| 55 to 64 Years | 73 (6.3%) | 982 (84.8%) |
| 65 to 74 Years | 826 (95.2%) | 385 (44.4%) |
| 75 Years and over | 829 (100.0%) | 627 (75.6%) |
| Total | 2,193 (48.4%) | 3,039 (67.1%) |
Disability Status by Sex by Age in Clarkdale
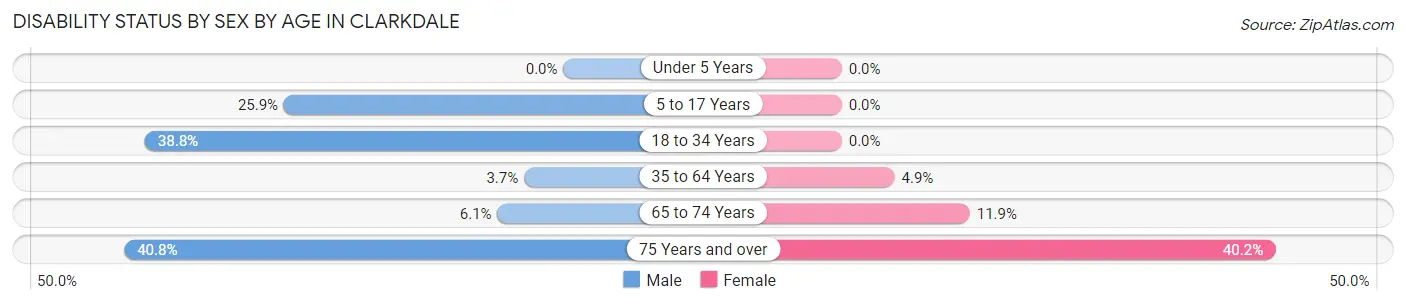
| Age Bracket | Male | Female |
| Under 5 Years | 0 (0.0%) | 0 (0.0%) |
| 5 to 17 Years | 35 (25.9%) | 0 (0.0%) |
| 18 to 34 Years | 139 (38.8%) | 0 (0.0%) |
| 35 to 64 Years | 24 (3.6%) | 48 (4.9%) |
| 65 to 74 Years | 15 (6.1%) | 74 (11.9%) |
| 75 Years and over | 130 (40.7%) | 205 (40.2%) |
Disability Class by Sex by Age in Clarkdale
Disability Class: Hearing Difficulty
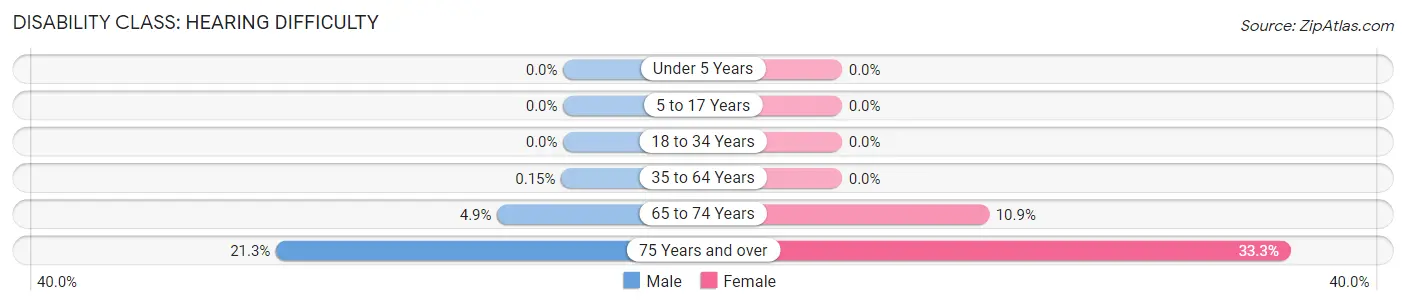
| Age Bracket | Male | Female |
| Under 5 Years | 0 (0.0%) | 0 (0.0%) |
| 5 to 17 Years | 0 (0.0%) | 0 (0.0%) |
| 18 to 34 Years | 0 (0.0%) | 0 (0.0%) |
| 35 to 64 Years | 1 (0.2%) | 0 (0.0%) |
| 65 to 74 Years | 12 (4.9%) | 68 (10.9%) |
| 75 Years and over | 68 (21.3%) | 170 (33.3%) |
Disability Class: Vision Difficulty
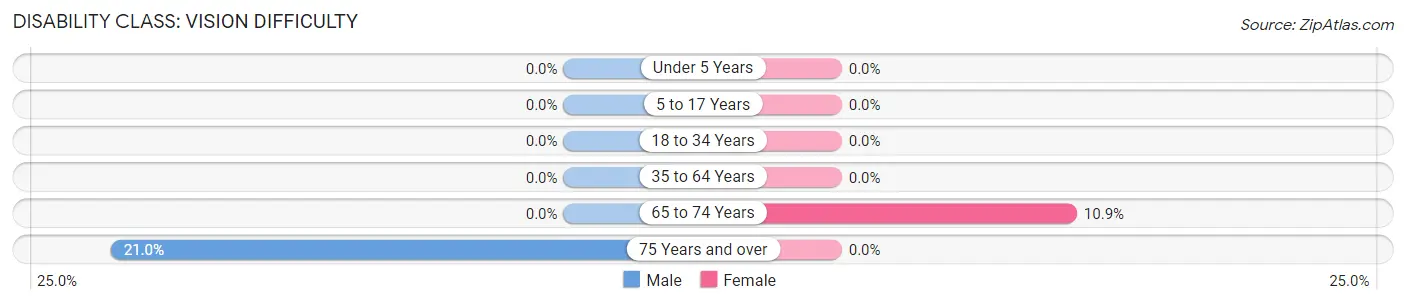
| Age Bracket | Male | Female |
| Under 5 Years | 0 (0.0%) | 0 (0.0%) |
| 5 to 17 Years | 0 (0.0%) | 0 (0.0%) |
| 18 to 34 Years | 0 (0.0%) | 0 (0.0%) |
| 35 to 64 Years | 0 (0.0%) | 0 (0.0%) |
| 65 to 74 Years | 0 (0.0%) | 68 (10.9%) |
| 75 Years and over | 67 (21.0%) | 0 (0.0%) |
Disability Class: Cognitive Difficulty
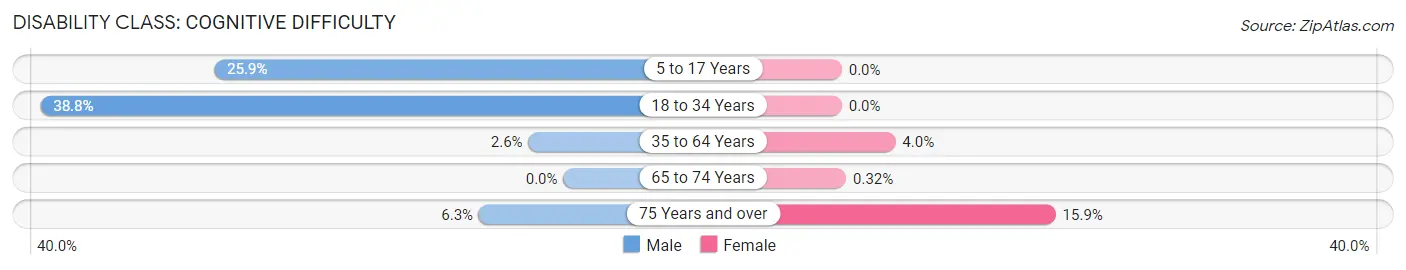
| Age Bracket | Male | Female |
| 5 to 17 Years | 35 (25.9%) | 0 (0.0%) |
| 18 to 34 Years | 139 (38.8%) | 0 (0.0%) |
| 35 to 64 Years | 17 (2.6%) | 39 (4.0%) |
| 65 to 74 Years | 0 (0.0%) | 2 (0.3%) |
| 75 Years and over | 20 (6.3%) | 81 (15.9%) |
Disability Class: Ambulatory Difficulty
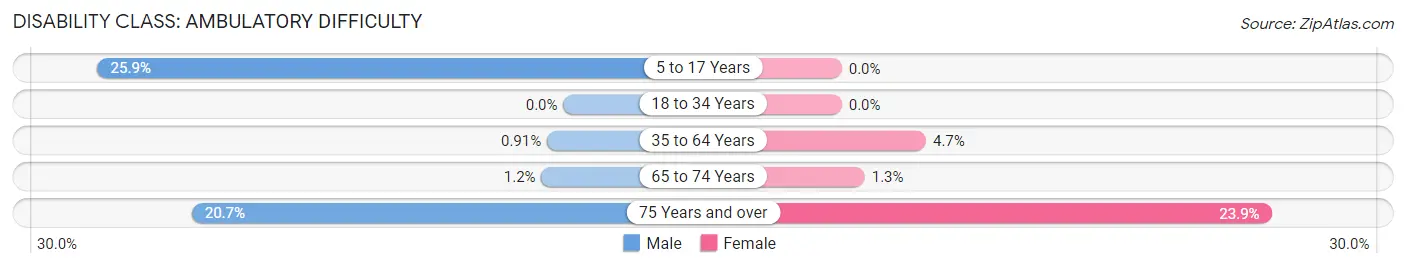
| Age Bracket | Male | Female |
| 5 to 17 Years | 35 (25.9%) | 0 (0.0%) |
| 18 to 34 Years | 0 (0.0%) | 0 (0.0%) |
| 35 to 64 Years | 6 (0.9%) | 46 (4.7%) |
| 65 to 74 Years | 3 (1.2%) | 8 (1.3%) |
| 75 Years and over | 66 (20.7%) | 122 (23.9%) |
Disability Class: Self-Care Difficulty
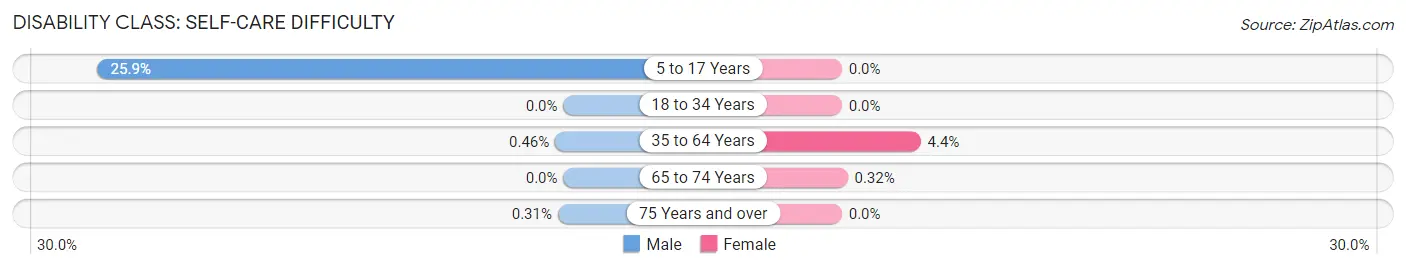
| Age Bracket | Male | Female |
| 5 to 17 Years | 35 (25.9%) | 0 (0.0%) |
| 18 to 34 Years | 0 (0.0%) | 0 (0.0%) |
| 35 to 64 Years | 3 (0.5%) | 43 (4.4%) |
| 65 to 74 Years | 0 (0.0%) | 2 (0.3%) |
| 75 Years and over | 1 (0.3%) | 0 (0.0%) |
Technology Access in Clarkdale
Computing Device Access in Clarkdale
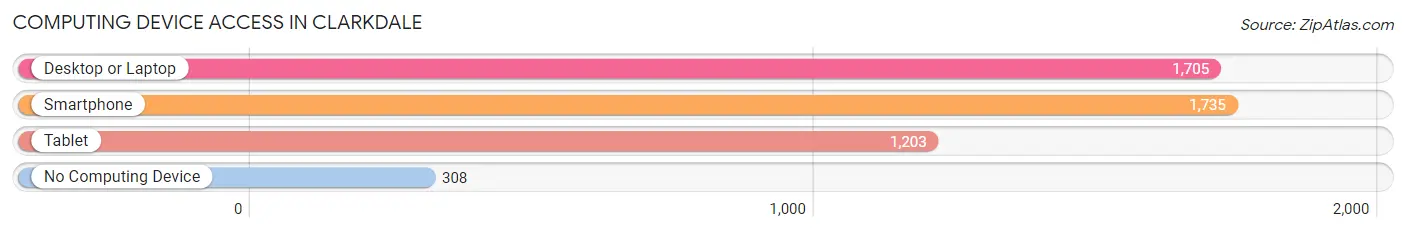
| Device Type | # Households | % Households |
| Desktop or Laptop | 1,705 | 71.0% |
| Smartphone | 1,735 | 72.3% |
| Tablet | 1,203 | 50.1% |
| No Computing Device | 308 | 12.8% |
| Total | 2,400 | 100.0% |
Internet Access in Clarkdale
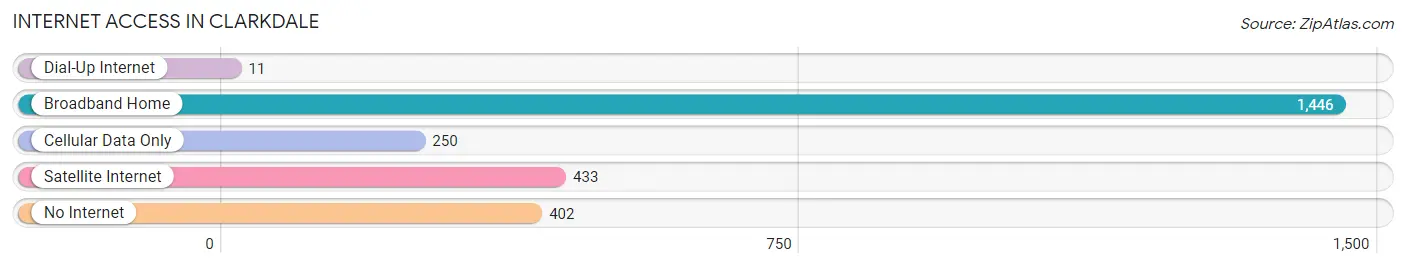
| Internet Type | # Households | % Households |
| Dial-Up Internet | 11 | 0.5% |
| Broadband Home | 1,446 | 60.3% |
| Cellular Data Only | 250 | 10.4% |
| Satellite Internet | 433 | 18.0% |
| No Internet | 402 | 16.8% |
| Total | 2,400 | 100.0% |
Clarkdale Summary
History
The town of Clarkdale, Arizona is located in Yavapai County in the Verde Valley region of the state. It is situated in the foothills of the Mingus Mountains, about 100 miles north of Phoenix. The town was founded in 1912 by the United Verde Copper Company, which was owned by William A. Clark, a prominent mining magnate. The town was named after him.
The town was originally a company town, with the company providing housing, stores, and other services to its employees. The company also built a smelter in the town, which was used to process copper ore from the nearby mines. The smelter was in operation until 1953, when it was closed due to the declining demand for copper.
The town was incorporated in 1957, and the population has grown steadily since then. In 2000, the population was 3,422.
Geography
Clarkdale is located in the Verde Valley region of Arizona, in the foothills of the Mingus Mountains. The town is situated at an elevation of 3,400 feet, and is surrounded by the Tuzigoot National Monument, the Coconino National Forest, and the Prescott National Forest.
The town is located along the Verde River, which is a major tributary of the Colorado River. The Verde River provides irrigation water for the area, and is also a popular destination for recreational activities such as fishing, boating, and swimming.
The climate in Clarkdale is semi-arid, with hot summers and mild winters. The average annual temperature is 68 degrees Fahrenheit, and the average annual precipitation is 12.5 inches.
Economy
The economy of Clarkdale is largely based on tourism and retirement. The town is a popular destination for retirees, due to its mild climate and scenic beauty. The town also attracts tourists who come to visit the nearby Tuzigoot National Monument, the Coconino National Forest, and the Prescott National Forest.
The town is also home to several businesses, including a winery, a brewery, and a distillery. The town also has a number of restaurants, shops, and other services.
Demographics
As of the 2010 census, the population of Clarkdale was 3,820. The racial makeup of the town was 91.3% White, 0.7% African American, 0.7% Native American, 0.7% Asian, 0.2% Pacific Islander, 4.2% from other races, and 2.1% from two or more races. Hispanic or Latino of any race were 8.3% of the population.
The median income for a household in the town was $41,250, and the median income for a family was $50,000. The per capita income for the town was $21,945. About 11.2% of families and 14.2% of the population were below the poverty line, including 19.2% of those under age 18 and 8.2% of those age 65 or over.
Common Questions
What is Per Capita Income in Clarkdale?
Per Capita income in Clarkdale is $32,743.
What is the Median Family Income in Clarkdale?
Median Family Income in Clarkdale is $59,227.
What is the Median Household income in Clarkdale?
Median Household Income in Clarkdale is $40,313.
What is Inequality or Gini Index in Clarkdale?
Inequality or Gini Index in Clarkdale is 0.46.
What is the Total Population of Clarkdale?
Total Population of Clarkdale is 4,528.
What is the Total Male Population of Clarkdale?
Total Male Population of Clarkdale is 1,922.
What is the Total Female Population of Clarkdale?
Total Female Population of Clarkdale is 2,606.
What is the Ratio of Males per 100 Females in Clarkdale?
There are 73.75 Males per 100 Females in Clarkdale.
What is the Ratio of Females per 100 Males in Clarkdale?
There are 135.59 Females per 100 Males in Clarkdale.
What is the Median Population Age in Clarkdale?
Median Population Age in Clarkdale is 59.9 Years.
What is the Average Family Size in Clarkdale
Average Family Size in Clarkdale is 2.6 People.
What is the Average Household Size in Clarkdale
Average Household Size in Clarkdale is 1.9 People.
How Large is the Labor Force in Clarkdale?
There are 2,011 People in the Labor Forcein in Clarkdale.
What is the Percentage of People in the Labor Force in Clarkdale?
51.3% of People are in the Labor Force in Clarkdale.
What is the Unemployment Rate in Clarkdale?
Unemployment Rate in Clarkdale is 0.2%.