Fremont Hills, MO Map & Demographics
Fremont Hills Map
Fremont Hills Overview
$59,792
PER CAPITA INCOME
$160,500
AVG FAMILY INCOME
$128,333
AVG HOUSEHOLD INCOME
47.2%
WAGE / INCOME GAP [ % ]
52.8¢/ $1
WAGE / INCOME GAP [ $ ]
0.45
INEQUALITY / GINI INDEX
1,272
TOTAL POPULATION
565
MALE POPULATION
707
FEMALE POPULATION
79.92
MALES / 100 FEMALES
125.13
FEMALES / 100 MALES
40.5
MEDIAN AGE
3.1
AVG FAMILY SIZE
2.9
AVG HOUSEHOLD SIZE
558
LABOR FORCE [ PEOPLE ]
58.0%
PERCENT IN LABOR FORCE
2.9%
UNEMPLOYMENT RATE
Income in Fremont Hills
Income Overview in Fremont Hills
Per Capita Income in Fremont Hills is $59,792, while median incomes of families and households are $160,500 and $128,333 respectively.
| Characteristic | Number | Measure |
| Per Capita Income | 1,272 | $59,792 |
| Median Family Income | 368 | $160,500 |
| Mean Family Income | 368 | $189,941 |
| Median Household Income | 446 | $128,333 |
| Mean Household Income | 446 | $170,128 |
| Income Deficit | 368 | $0 |
| Wage / Income Gap (%) | 1,272 | 47.24% |
| Wage / Income Gap ($) | 1,272 | 52.76¢ per $1 |
| Gini / Inequality Index | 1,272 | 0.45 |
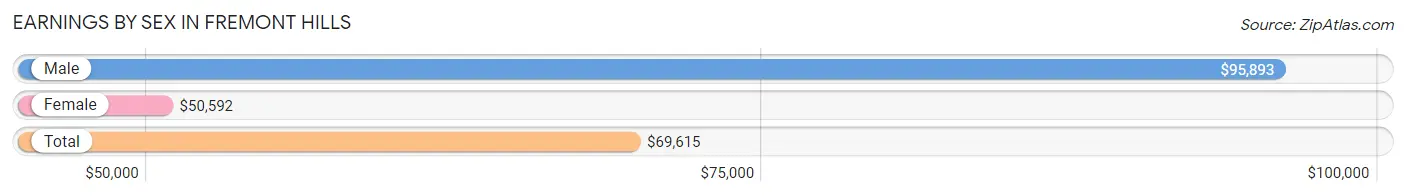
Earnings by Sex in Fremont Hills
Average Earnings in Fremont Hills are $69,615, $95,893 for men and $50,592 for women, a difference of 47.2%.
| Sex | Number | Average Earnings |
| Male | 289 (50.3%) | $95,893 |
| Female | 285 (49.6%) | $50,592 |
| Total | 574 (100.0%) | $69,615 |
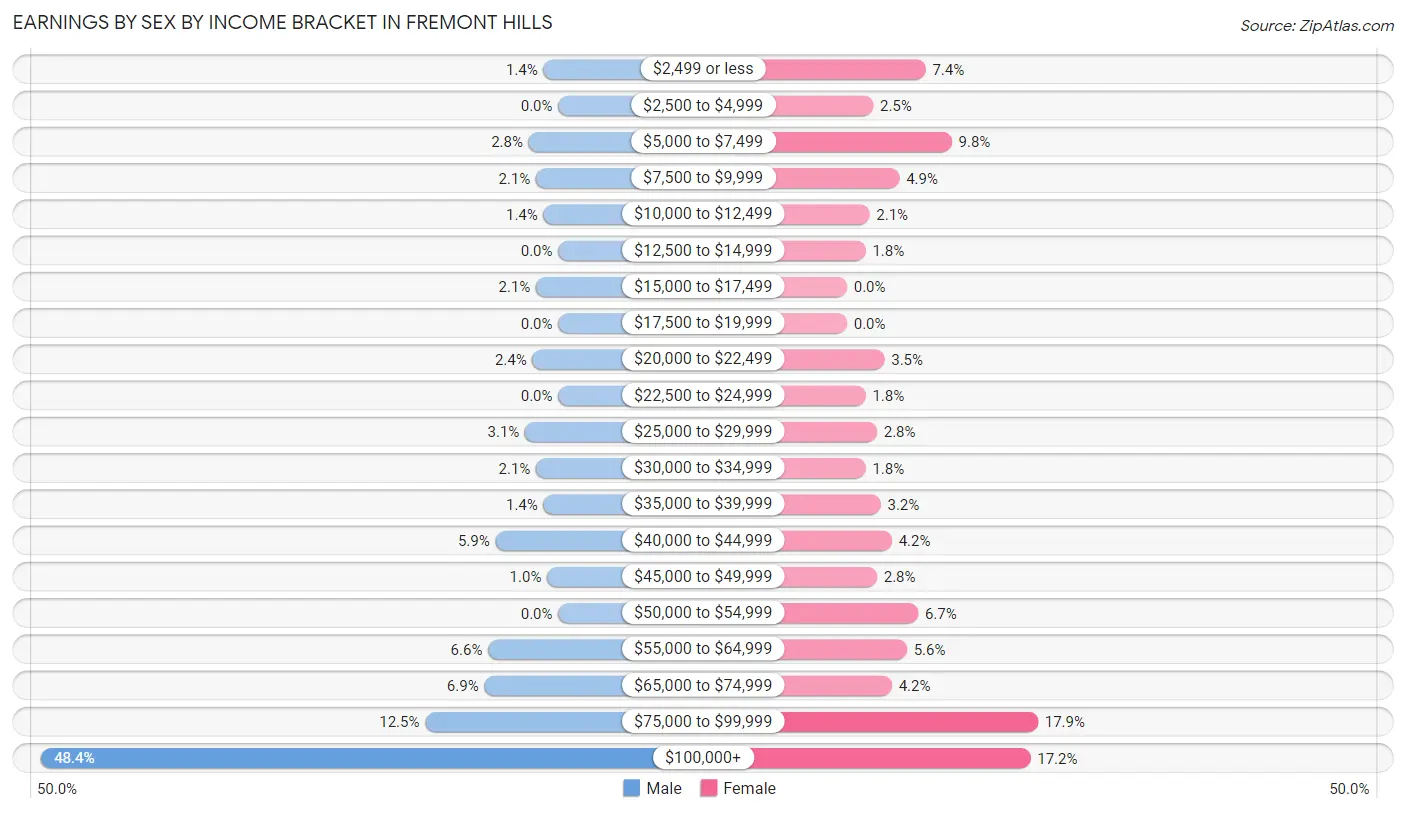
Earnings by Sex by Income Bracket in Fremont Hills
The most common earnings brackets in Fremont Hills are $100,000+ for men (140 | 48.4%) and $75,000 to $99,999 for women (51 | 17.9%).
| Income | Male | Female |
| $2,499 or less | 4 (1.4%) | 21 (7.4%) |
| $2,500 to $4,999 | 0 (0.0%) | 7 (2.5%) |
| $5,000 to $7,499 | 8 (2.8%) | 28 (9.8%) |
| $7,500 to $9,999 | 6 (2.1%) | 14 (4.9%) |
| $10,000 to $12,499 | 4 (1.4%) | 6 (2.1%) |
| $12,500 to $14,999 | 0 (0.0%) | 5 (1.8%) |
| $15,000 to $17,499 | 6 (2.1%) | 0 (0.0%) |
| $17,500 to $19,999 | 0 (0.0%) | 0 (0.0%) |
| $20,000 to $22,499 | 7 (2.4%) | 10 (3.5%) |
| $22,500 to $24,999 | 0 (0.0%) | 5 (1.8%) |
| $25,000 to $29,999 | 9 (3.1%) | 8 (2.8%) |
| $30,000 to $34,999 | 6 (2.1%) | 5 (1.8%) |
| $35,000 to $39,999 | 4 (1.4%) | 9 (3.2%) |
| $40,000 to $44,999 | 17 (5.9%) | 12 (4.2%) |
| $45,000 to $49,999 | 3 (1.0%) | 8 (2.8%) |
| $50,000 to $54,999 | 0 (0.0%) | 19 (6.7%) |
| $55,000 to $64,999 | 19 (6.6%) | 16 (5.6%) |
| $65,000 to $74,999 | 20 (6.9%) | 12 (4.2%) |
| $75,000 to $99,999 | 36 (12.5%) | 51 (17.9%) |
| $100,000+ | 140 (48.4%) | 49 (17.2%) |
| Total | 289 (100.0%) | 285 (100.0%) |
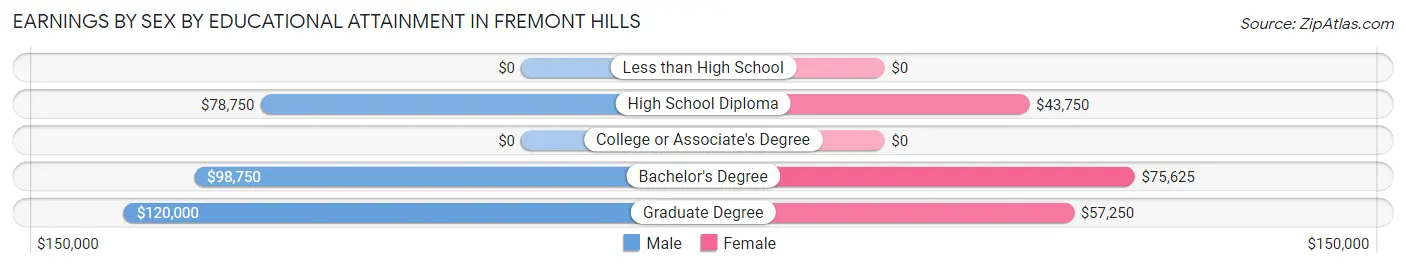
Earnings by Sex by Educational Attainment in Fremont Hills
Average earnings in Fremont Hills are $106,071 for men and $51,776 for women, a difference of 51.2%. Men with an educational attainment of graduate degree enjoy the highest average annual earnings of $120,000, while those with high school diploma education earn the least with $78,750. Women with an educational attainment of bachelor's degree earn the most with the average annual earnings of $75,625, while those with high school diploma education have the smallest earnings of $43,750.
| Educational Attainment | Male Income | Female Income |
| Less than High School | - | - |
| High School Diploma | $78,750 | $43,750 |
| College or Associate's Degree | - | - |
| Bachelor's Degree | $98,750 | $75,625 |
| Graduate Degree | $120,000 | $57,250 |
| Total | $106,071 | $51,776 |
Family Income in Fremont Hills
Family Income Brackets in Fremont Hills
According to the Fremont Hills family income data, there are 142 families falling into the $200,000+ income range, which is the most common income bracket and makes up 38.6% of all families.
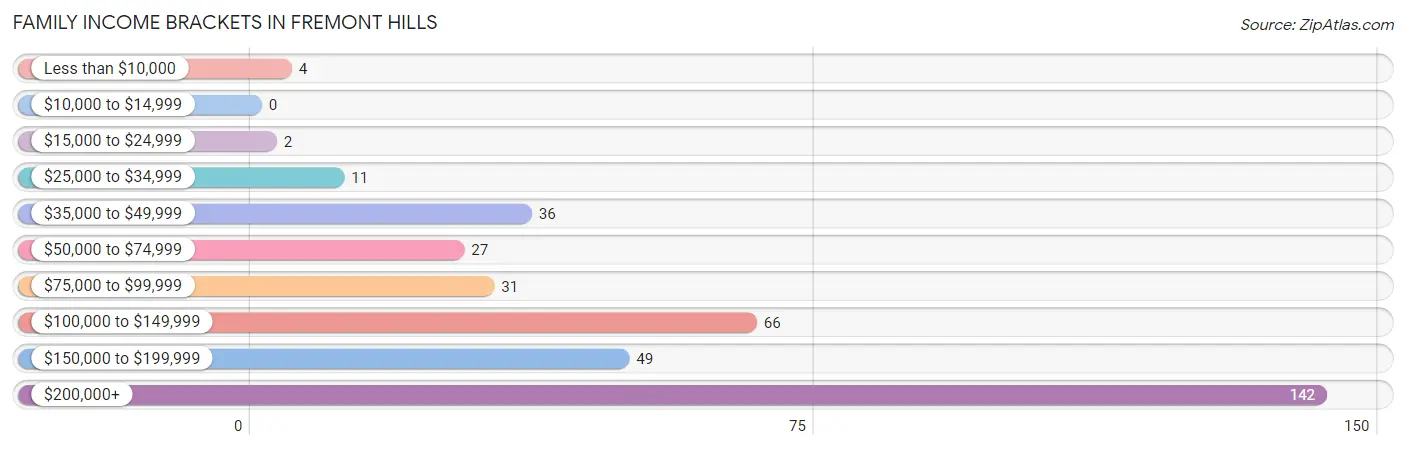
| Income Bracket | # Families | % Families |
| Less than $10,000 | 4 | 1.1% |
| $10,000 to $14,999 | 0 | 0.0% |
| $15,000 to $24,999 | 2 | 0.5% |
| $25,000 to $34,999 | 11 | 3.0% |
| $35,000 to $49,999 | 36 | 9.8% |
| $50,000 to $74,999 | 27 | 7.3% |
| $75,000 to $99,999 | 31 | 8.4% |
| $100,000 to $149,999 | 66 | 17.9% |
| $150,000 to $199,999 | 49 | 13.3% |
| $200,000+ | 142 | 38.6% |
Family Income by Famaliy Size in Fremont Hills
5-person families (36 | 9.8%) account for the highest median family income in Fremont Hills with $191,250 per family, while 2-person families (187 | 50.8%) have the highest median income of $57,188 per family member.
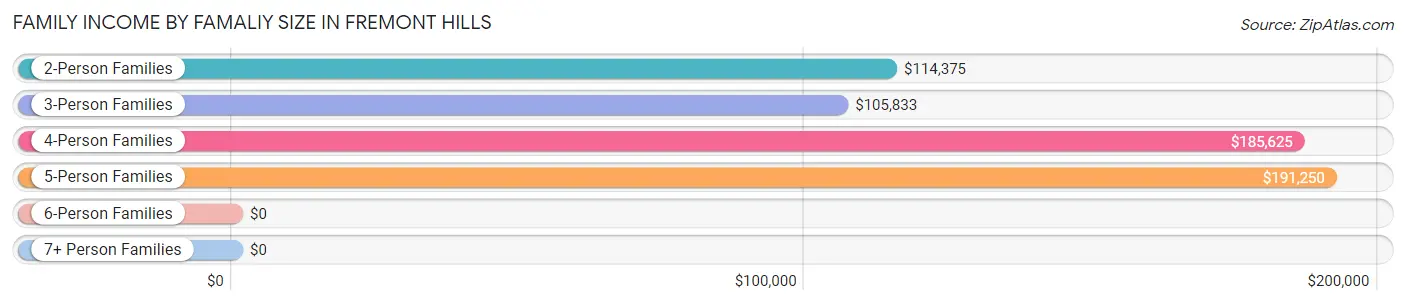
| Income Bracket | # Families | Median Income |
| 2-Person Families | 187 (50.8%) | $114,375 |
| 3-Person Families | 20 (5.4%) | $105,833 |
| 4-Person Families | 119 (32.3%) | $185,625 |
| 5-Person Families | 36 (9.8%) | $191,250 |
| 6-Person Families | 0 (0.0%) | $0 |
| 7+ Person Families | 6 (1.6%) | $0 |
| Total | 368 (100.0%) | $160,500 |
Family Income by Number of Earners in Fremont Hills
The median family income in Fremont Hills is $160,500, with families comprising 2 earners (201) having the highest median family income of $210,221, while families with no earners (83) have the lowest median family income of $53,750, accounting for 54.6% and 22.6% of families, respectively.
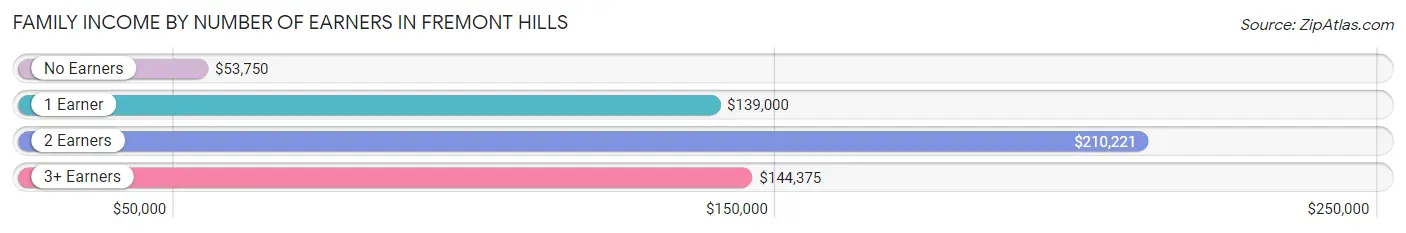
| Number of Earners | # Families | Median Income |
| No Earners | 83 (22.6%) | $53,750 |
| 1 Earner | 72 (19.6%) | $139,000 |
| 2 Earners | 201 (54.6%) | $210,221 |
| 3+ Earners | 12 (3.3%) | $144,375 |
| Total | 368 (100.0%) | $160,500 |
Household Income in Fremont Hills
Household Income Brackets in Fremont Hills
With 144 households falling in the category, the $200,000+ income range is the most frequent in Fremont Hills, accounting for 32.3% of all households. In contrast, only 5 households (1.1%) fall into the less than $10,000 income bracket, making it the least populous group.
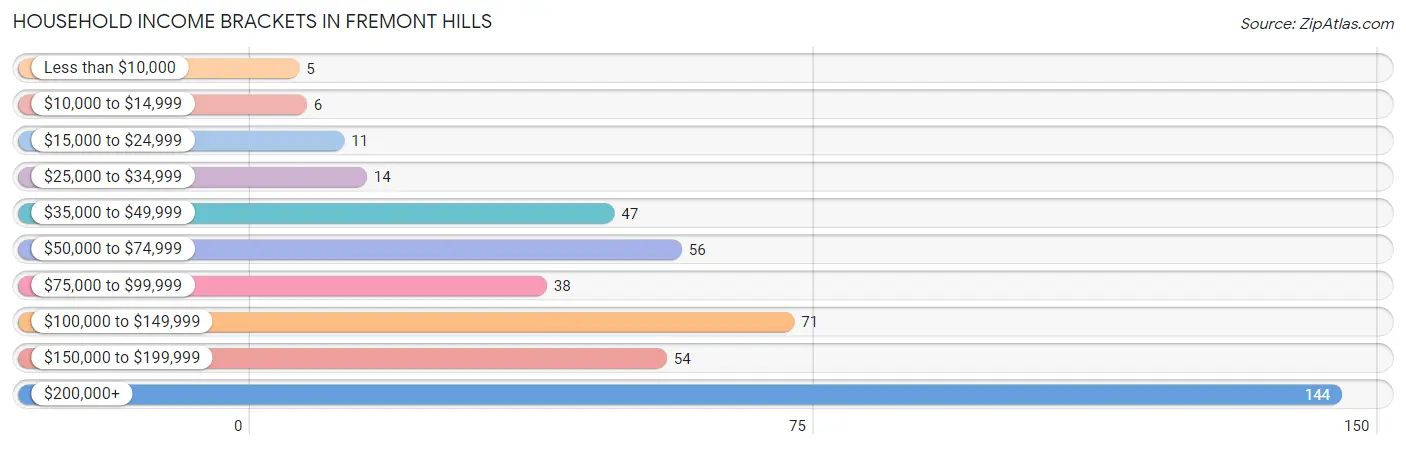
| Income Bracket | # Households | % Households |
| Less than $10,000 | 5 | 1.1% |
| $10,000 to $14,999 | 6 | 1.3% |
| $15,000 to $24,999 | 11 | 2.5% |
| $25,000 to $34,999 | 14 | 3.1% |
| $35,000 to $49,999 | 47 | 10.5% |
| $50,000 to $74,999 | 56 | 12.6% |
| $75,000 to $99,999 | 38 | 8.5% |
| $100,000 to $149,999 | 71 | 15.9% |
| $150,000 to $199,999 | 54 | 12.1% |
| $200,000+ | 144 | 32.3% |
Household Income by Householder Age in Fremont Hills
The median household income in Fremont Hills is $128,333, with the highest median household income of $186,875 found in the 25 to 44 years age bracket for the primary householder. A total of 167 households (37.4%) fall into this category. Meanwhile, the 15 to 24 years age bracket for the primary householder has the lowest median household income of $0, with 1 households (0.2%) in this group.
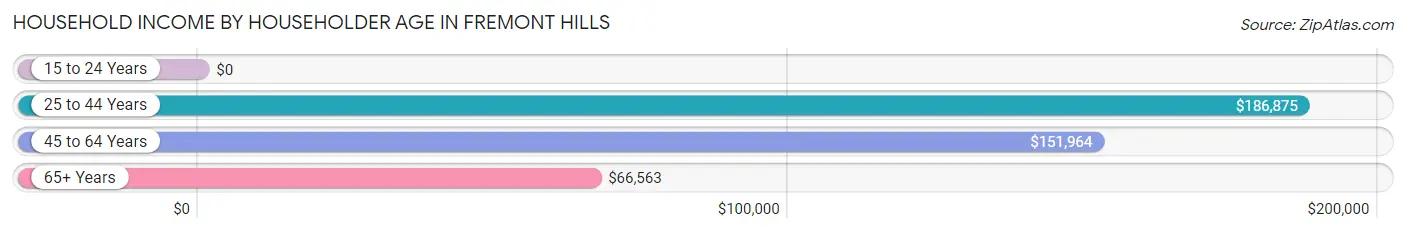
| Income Bracket | # Households | Median Income |
| 15 to 24 Years | 1 (0.2%) | $0 |
| 25 to 44 Years | 167 (37.4%) | $186,875 |
| 45 to 64 Years | 121 (27.1%) | $151,964 |
| 65+ Years | 157 (35.2%) | $66,563 |
| Total | 446 (100.0%) | $128,333 |
Poverty in Fremont Hills
Income Below Poverty by Sex and Age in Fremont Hills
With 0.7% poverty level for males and 4.5% for females among the residents of Fremont Hills, 12 to 14 year old males and 15 year old females are the most vulnerable to poverty, with 2 males (6.2%) and 3 females (25.0%) in their respective age groups living below the poverty level.
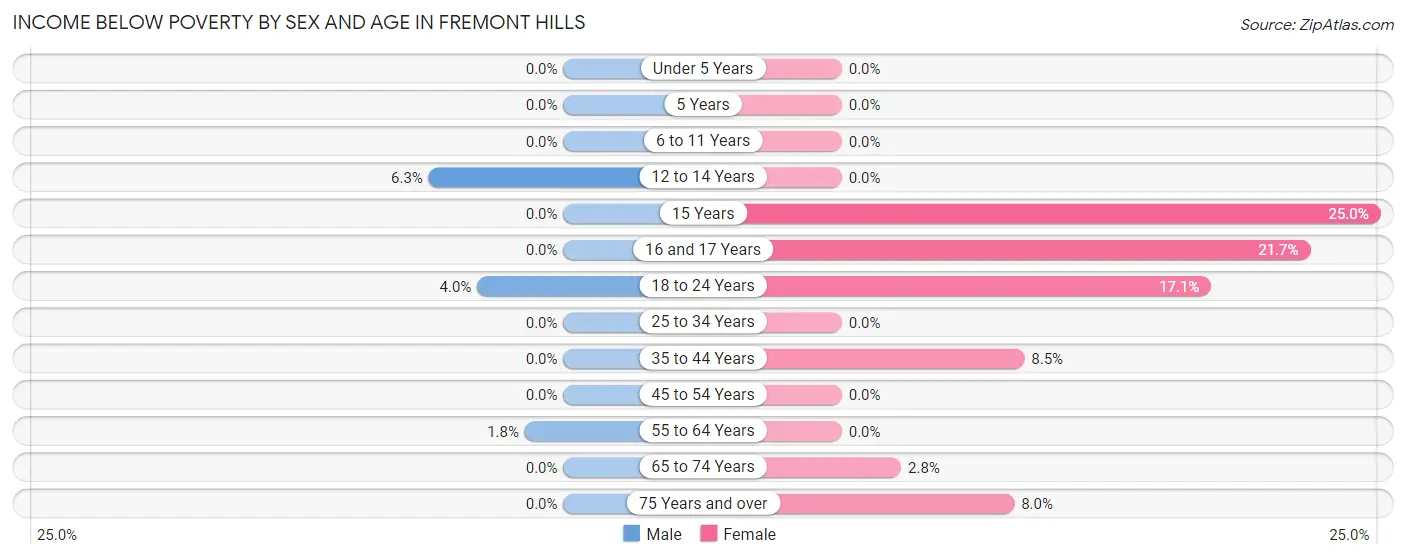
| Age Bracket | Male | Female |
| Under 5 Years | 0 (0.0%) | 0 (0.0%) |
| 5 Years | 0 (0.0%) | 0 (0.0%) |
| 6 to 11 Years | 0 (0.0%) | 0 (0.0%) |
| 12 to 14 Years | 2 (6.2%) | 0 (0.0%) |
| 15 Years | 0 (0.0%) | 3 (25.0%) |
| 16 and 17 Years | 0 (0.0%) | 5 (21.7%) |
| 18 to 24 Years | 1 (4.0%) | 6 (17.1%) |
| 25 to 34 Years | 0 (0.0%) | 0 (0.0%) |
| 35 to 44 Years | 0 (0.0%) | 10 (8.5%) |
| 45 to 54 Years | 0 (0.0%) | 0 (0.0%) |
| 55 to 64 Years | 1 (1.8%) | 0 (0.0%) |
| 65 to 74 Years | 0 (0.0%) | 3 (2.8%) |
| 75 Years and over | 0 (0.0%) | 4 (8.0%) |
| Total | 4 (0.7%) | 31 (4.5%) |
Income Above Poverty by Sex and Age in Fremont Hills
According to the poverty statistics in Fremont Hills, males aged under 5 years and females aged under 5 years are the age groups that are most secure financially, with 100.0% of males and 100.0% of females in these age groups living above the poverty line.
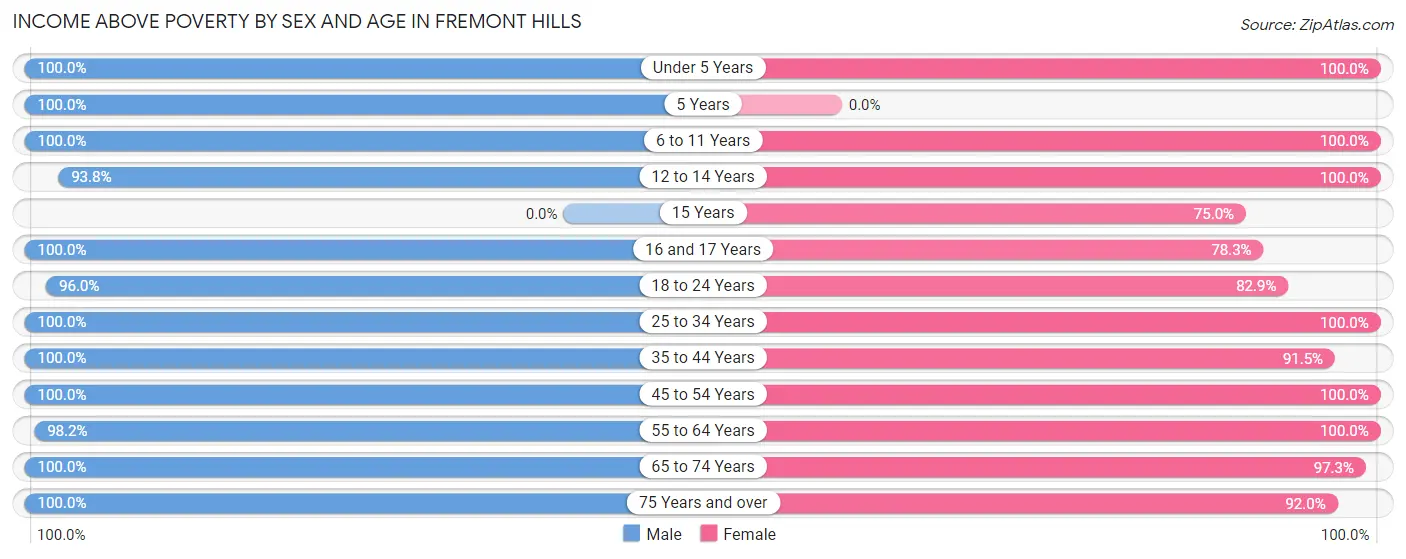
| Age Bracket | Male | Female |
| Under 5 Years | 43 (100.0%) | 46 (100.0%) |
| 5 Years | 2 (100.0%) | 0 (0.0%) |
| 6 to 11 Years | 50 (100.0%) | 80 (100.0%) |
| 12 to 14 Years | 30 (93.8%) | 29 (100.0%) |
| 15 Years | 0 (0.0%) | 9 (75.0%) |
| 16 and 17 Years | 26 (100.0%) | 18 (78.3%) |
| 18 to 24 Years | 24 (96.0%) | 29 (82.9%) |
| 25 to 34 Years | 35 (100.0%) | 61 (100.0%) |
| 35 to 44 Years | 103 (100.0%) | 108 (91.5%) |
| 45 to 54 Years | 76 (100.0%) | 64 (100.0%) |
| 55 to 64 Years | 55 (98.2%) | 64 (100.0%) |
| 65 to 74 Years | 66 (100.0%) | 106 (97.3%) |
| 75 Years and over | 51 (100.0%) | 46 (92.0%) |
| Total | 561 (99.3%) | 660 (95.5%) |
Income Below Poverty Among Married-Couple Families in Fremont Hills
The poverty statistics for married-couple families in Fremont Hills show that 0.3% or 1 of the total 344 families live below the poverty line. Families with no children have the highest poverty rate of 0.5%, comprising of 1 families. On the other hand, families with 1 or 2 children have the lowest poverty rate of 0.0%, which includes 0 families.
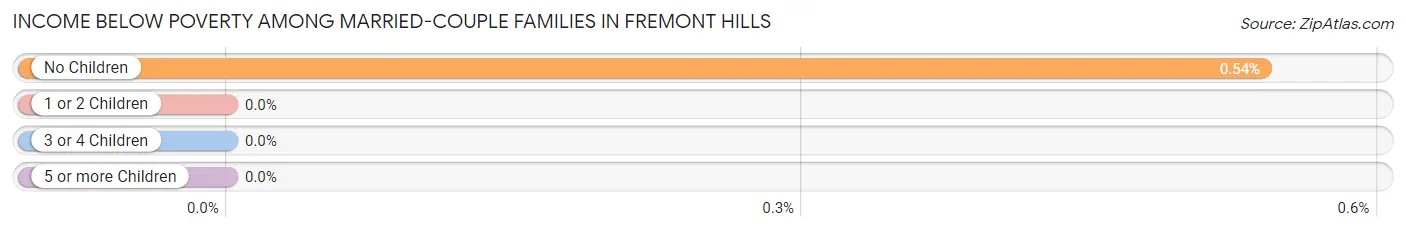
| Children | Above Poverty | Below Poverty |
| No Children | 183 (99.5%) | 1 (0.5%) |
| 1 or 2 Children | 127 (100.0%) | 0 (0.0%) |
| 3 or 4 Children | 27 (100.0%) | 0 (0.0%) |
| 5 or more Children | 6 (100.0%) | 0 (0.0%) |
| Total | 343 (99.7%) | 1 (0.3%) |
Income Below Poverty Among Single-Parent Households in Fremont Hills
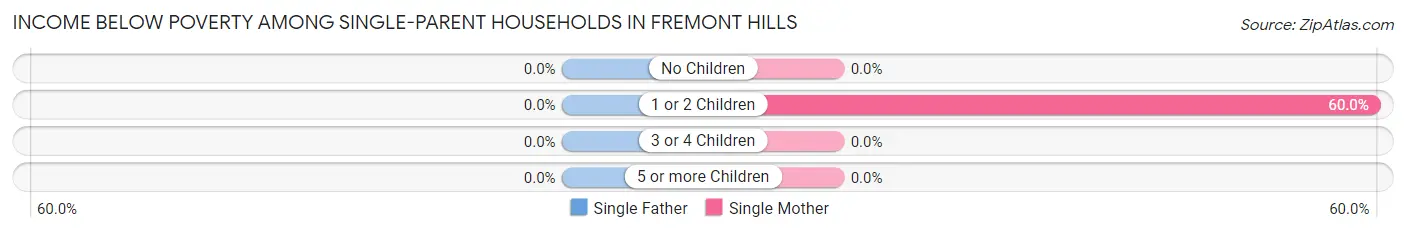
| Children | Single Father | Single Mother |
| No Children | 0 (0.0%) | 0 (0.0%) |
| 1 or 2 Children | 0 (0.0%) | 3 (60.0%) |
| 3 or 4 Children | 0 (0.0%) | 0 (0.0%) |
| 5 or more Children | 0 (0.0%) | 0 (0.0%) |
| Total | 0 (0.0%) | 3 (20.0%) |
Income Below Poverty Among Married-Couple vs Single-Parent Households in Fremont Hills
The poverty data for Fremont Hills shows that 1 of the married-couple family households (0.3%) and 3 of the single-parent households (12.5%) are living below the poverty level. Within the married-couple family households, those with no children have the highest poverty rate, with 1 households (0.5%) falling below the poverty line. Among the single-parent households, those with 1 or 2 children have the highest poverty rate, with 3 household (25.0%) living below poverty.
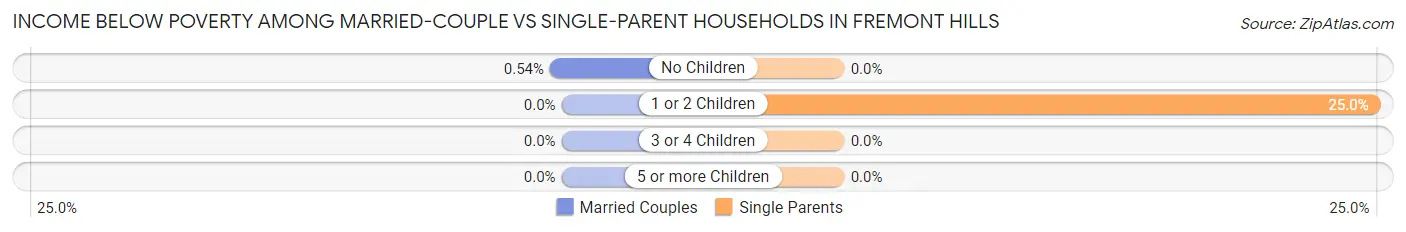
| Children | Married-Couple Families | Single-Parent Households |
| No Children | 1 (0.5%) | 0 (0.0%) |
| 1 or 2 Children | 0 (0.0%) | 3 (25.0%) |
| 3 or 4 Children | 0 (0.0%) | 0 (0.0%) |
| 5 or more Children | 0 (0.0%) | 0 (0.0%) |
| Total | 1 (0.3%) | 3 (12.5%) |
Race in Fremont Hills
The most populous races in Fremont Hills are White / Caucasian (1,203 | 94.6%), Two or more Races (52 | 4.1%), and Hispanic or Latino (30 | 2.4%).
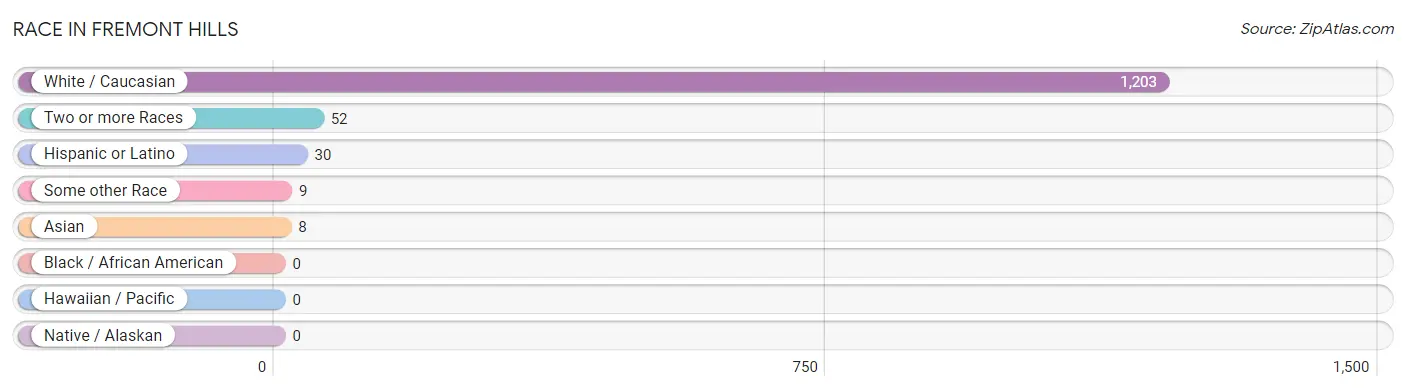
| Race | # Population | % Population |
| Asian | 8 | 0.6% |
| Black / African American | 0 | 0.0% |
| Hawaiian / Pacific | 0 | 0.0% |
| Hispanic or Latino | 30 | 2.4% |
| Native / Alaskan | 0 | 0.0% |
| White / Caucasian | 1,203 | 94.6% |
| Two or more Races | 52 | 4.1% |
| Some other Race | 9 | 0.7% |
| Total | 1,272 | 100.0% |
Ancestry in Fremont Hills
The most populous ancestries reported in Fremont Hills are English (241 | 19.0%), German (198 | 15.6%), American (129 | 10.1%), Irish (113 | 8.9%), and European (63 | 5.0%), together accounting for 58.5% of all Fremont Hills residents.
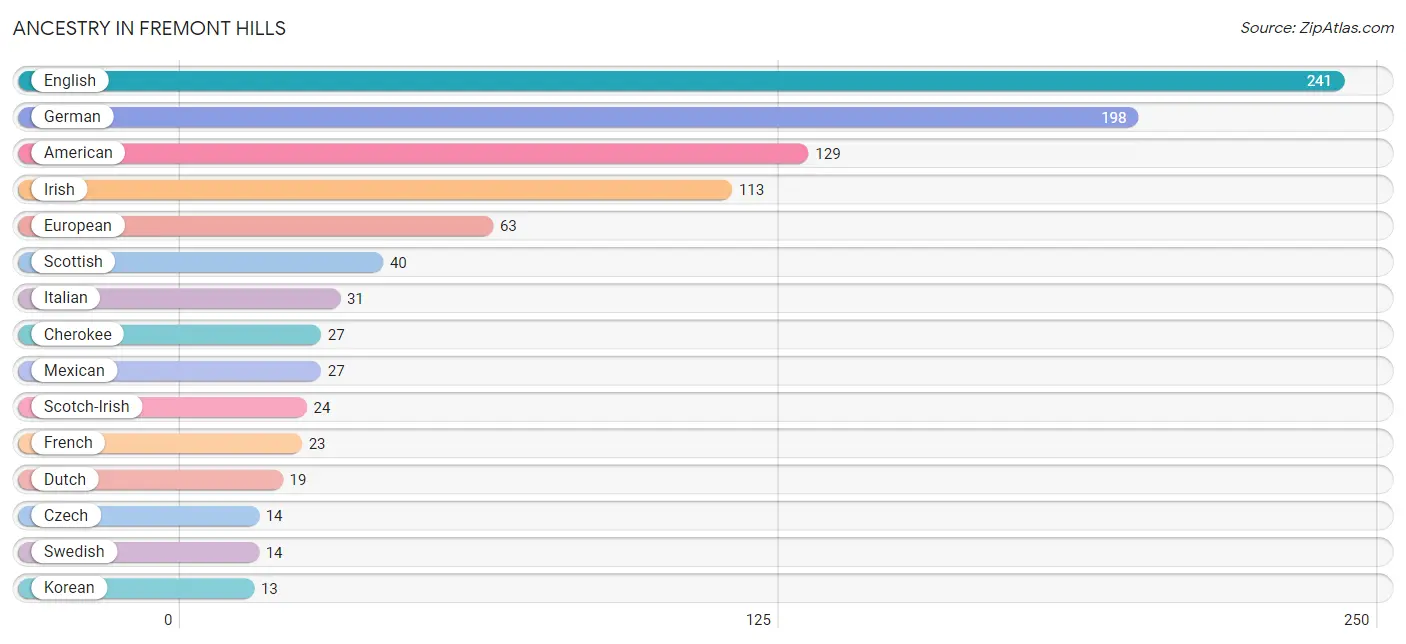
| Ancestry | # Population | % Population |
| American | 129 | 10.1% |
| Bhutanese | 4 | 0.3% |
| British | 3 | 0.2% |
| Central American | 3 | 0.2% |
| Cherokee | 27 | 2.1% |
| Czech | 14 | 1.1% |
| Danish | 7 | 0.5% |
| Dutch | 19 | 1.5% |
| English | 241 | 19.0% |
| European | 63 | 5.0% |
| French | 23 | 1.8% |
| French Canadian | 3 | 0.2% |
| German | 198 | 15.6% |
| Guatemalan | 3 | 0.2% |
| Hungarian | 2 | 0.2% |
| Irish | 113 | 8.9% |
| Iroquois | 2 | 0.2% |
| Italian | 31 | 2.4% |
| Korean | 13 | 1.0% |
| Latvian | 3 | 0.2% |
| Mexican | 27 | 2.1% |
| Norwegian | 5 | 0.4% |
| Polish | 3 | 0.2% |
| Potawatomi | 1 | 0.1% |
| Scandinavian | 9 | 0.7% |
| Scotch-Irish | 24 | 1.9% |
| Scottish | 40 | 3.1% |
| Slovak | 1 | 0.1% |
| Swedish | 14 | 1.1% |
| Swiss | 4 | 0.3% |
| Thai | 2 | 0.2% |
| Ukrainian | 1 | 0.1% |
| Welsh | 6 | 0.5% | View All 33 Rows |
Immigrants in Fremont Hills
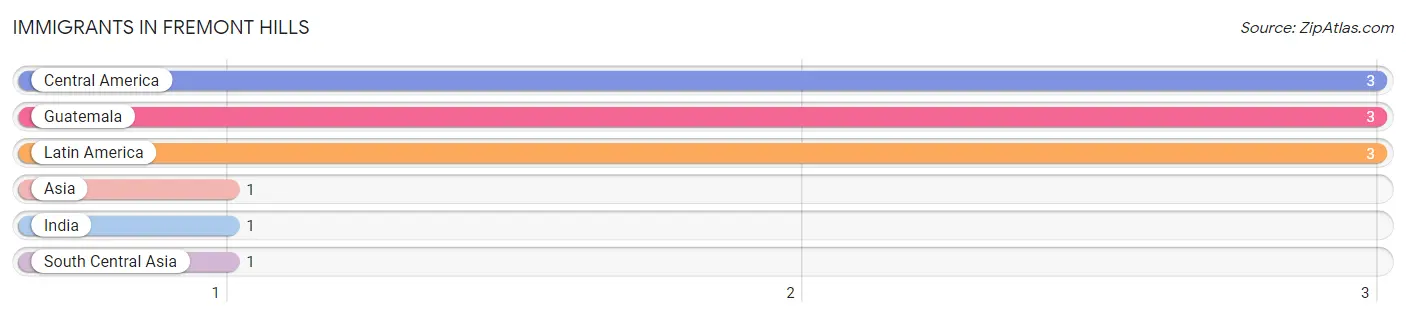
The most numerous immigrant groups reported in Fremont Hills came from Central America (3 | 0.2%), Guatemala (3 | 0.2%), Latin America (3 | 0.2%), Asia (1 | 0.1%), and India (1 | 0.1%), together accounting for 0.9% of all Fremont Hills residents.
| Immigration Origin | # Population | % Population |
| Asia | 1 | 0.1% |
| Central America | 3 | 0.2% |
| Guatemala | 3 | 0.2% |
| India | 1 | 0.1% |
| Latin America | 3 | 0.2% |
| South Central Asia | 1 | 0.1% | View All 6 Rows |
Sex and Age in Fremont Hills
Sex and Age in Fremont Hills
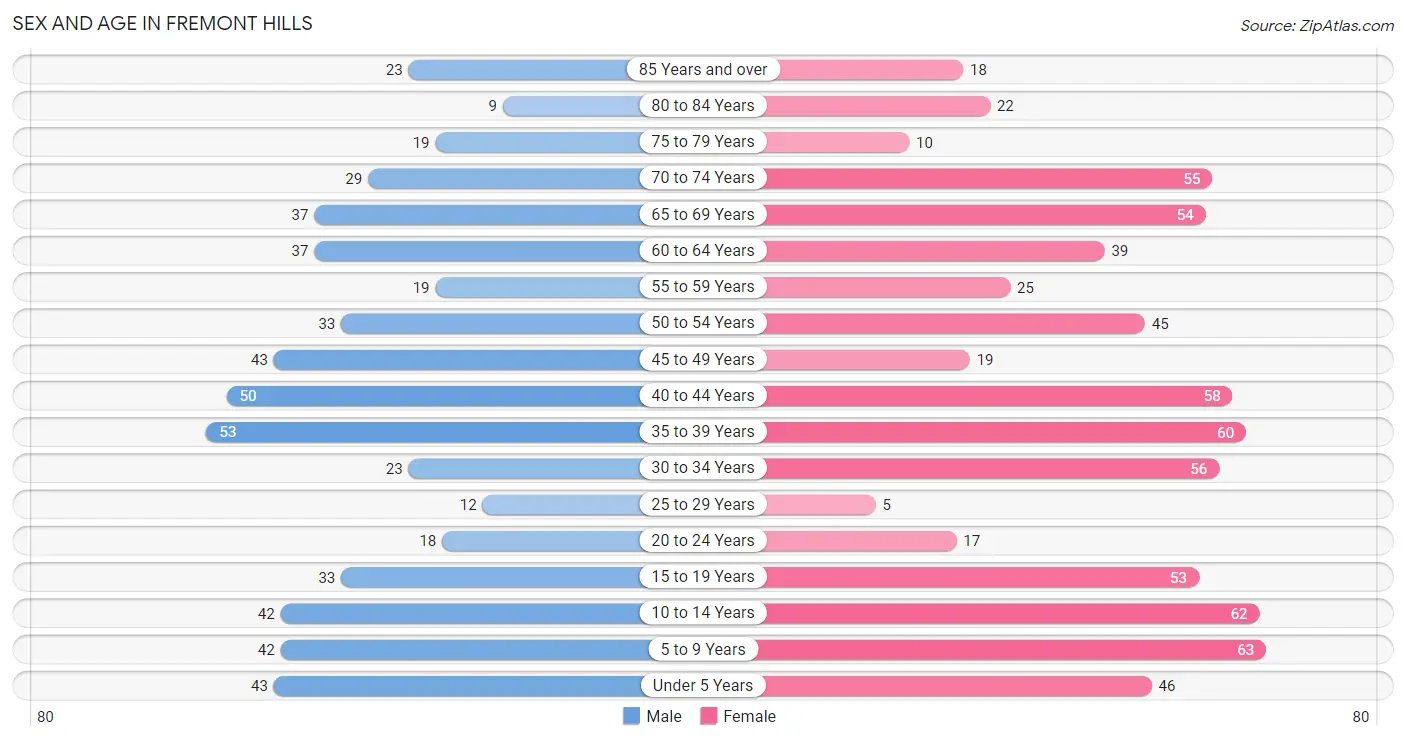
The most populous age groups in Fremont Hills are 35 to 39 Years (53 | 9.4%) for men and 5 to 9 Years (63 | 8.9%) for women.
| Age Bracket | Male | Female |
| Under 5 Years | 43 (7.6%) | 46 (6.5%) |
| 5 to 9 Years | 42 (7.4%) | 63 (8.9%) |
| 10 to 14 Years | 42 (7.4%) | 62 (8.8%) |
| 15 to 19 Years | 33 (5.8%) | 53 (7.5%) |
| 20 to 24 Years | 18 (3.2%) | 17 (2.4%) |
| 25 to 29 Years | 12 (2.1%) | 5 (0.7%) |
| 30 to 34 Years | 23 (4.1%) | 56 (7.9%) |
| 35 to 39 Years | 53 (9.4%) | 60 (8.5%) |
| 40 to 44 Years | 50 (8.8%) | 58 (8.2%) |
| 45 to 49 Years | 43 (7.6%) | 19 (2.7%) |
| 50 to 54 Years | 33 (5.8%) | 45 (6.4%) |
| 55 to 59 Years | 19 (3.4%) | 25 (3.5%) |
| 60 to 64 Years | 37 (6.6%) | 39 (5.5%) |
| 65 to 69 Years | 37 (6.6%) | 54 (7.6%) |
| 70 to 74 Years | 29 (5.1%) | 55 (7.8%) |
| 75 to 79 Years | 19 (3.4%) | 10 (1.4%) |
| 80 to 84 Years | 9 (1.6%) | 22 (3.1%) |
| 85 Years and over | 23 (4.1%) | 18 (2.5%) |
| Total | 565 (100.0%) | 707 (100.0%) |
Families and Households in Fremont Hills
Median Family Size in Fremont Hills
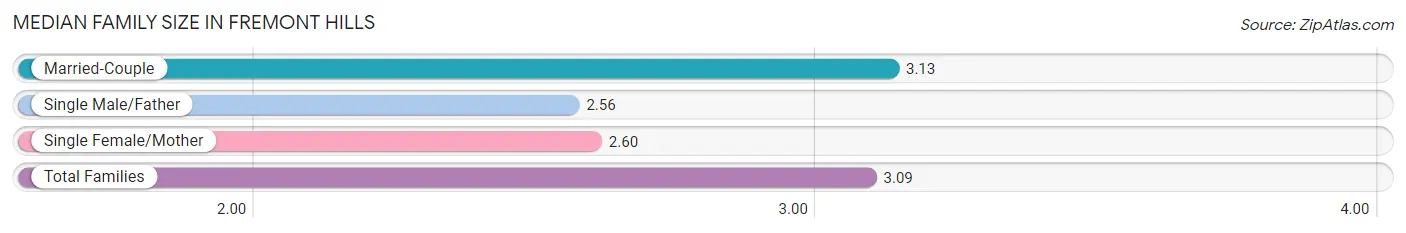
The median family size in Fremont Hills is 3.09 persons per family, with married-couple families (344 | 93.5%) accounting for the largest median family size of 3.13 persons per family. On the other hand, single male/father families (9 | 2.5%) represent the smallest median family size with 2.56 persons per family.
| Family Type | # Families | Family Size |
| Married-Couple | 344 (93.5%) | 3.13 |
| Single Male/Father | 9 (2.5%) | 2.56 |
| Single Female/Mother | 15 (4.1%) | 2.60 |
| Total Families | 368 (100.0%) | 3.09 |
Median Household Size in Fremont Hills
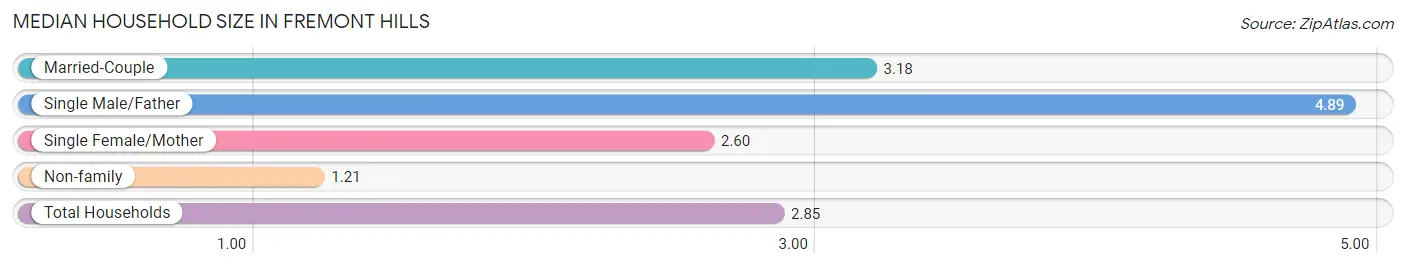
The median household size in Fremont Hills is 2.85 persons per household, with single male/father households (9 | 2.0%) accounting for the largest median household size of 4.89 persons per household. non-family households (78 | 17.5%) represent the smallest median household size with 1.21 persons per household.
| Household Type | # Households | Household Size |
| Married-Couple | 344 (77.1%) | 3.18 |
| Single Male/Father | 9 (2.0%) | 4.89 |
| Single Female/Mother | 15 (3.4%) | 2.60 |
| Non-family | 78 (17.5%) | 1.21 |
| Total Households | 446 (100.0%) | 2.85 |
Household Size by Marriage Status in Fremont Hills
Out of a total of 446 households in Fremont Hills, 368 (82.5%) are family households, while 78 (17.5%) are nonfamily households. The most numerous type of family households are 2-person households, comprising 180, and the most common type of nonfamily households are 1-person households, comprising 67.
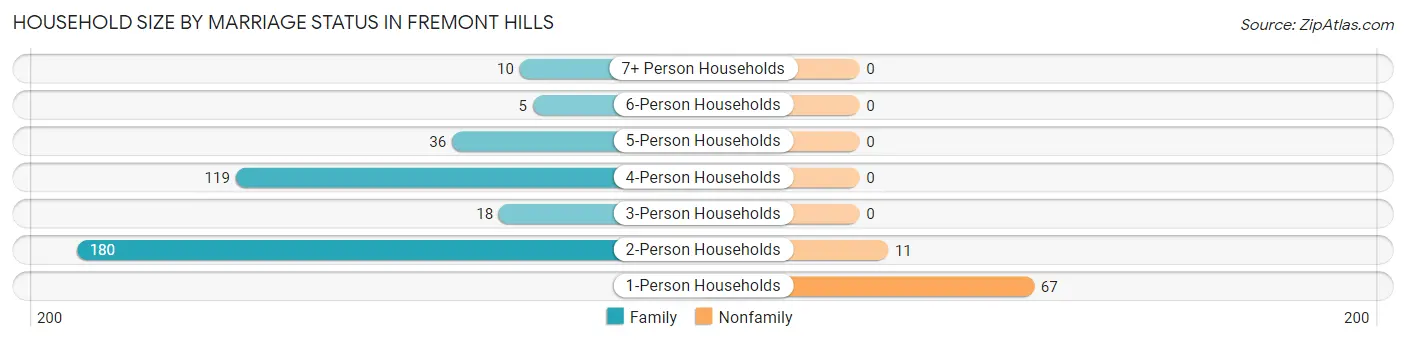
| Household Size | Family Households | Nonfamily Households |
| 1-Person Households | - | 67 (15.0%) |
| 2-Person Households | 180 (40.4%) | 11 (2.5%) |
| 3-Person Households | 18 (4.0%) | 0 (0.0%) |
| 4-Person Households | 119 (26.7%) | 0 (0.0%) |
| 5-Person Households | 36 (8.1%) | 0 (0.0%) |
| 6-Person Households | 5 (1.1%) | 0 (0.0%) |
| 7+ Person Households | 10 (2.2%) | 0 (0.0%) |
| Total | 368 (82.5%) | 78 (17.5%) |
Female Fertility in Fremont Hills
Fertility by Age in Fremont Hills
Average fertility rate in Fremont Hills is 44.0 births per 1,000 women. Women in the age bracket of 20 to 34 years have the highest fertility rate with 154.0 births per 1,000 women. Women in the age bracket of 20 to 34 years acount for 100.0% of all women with births.
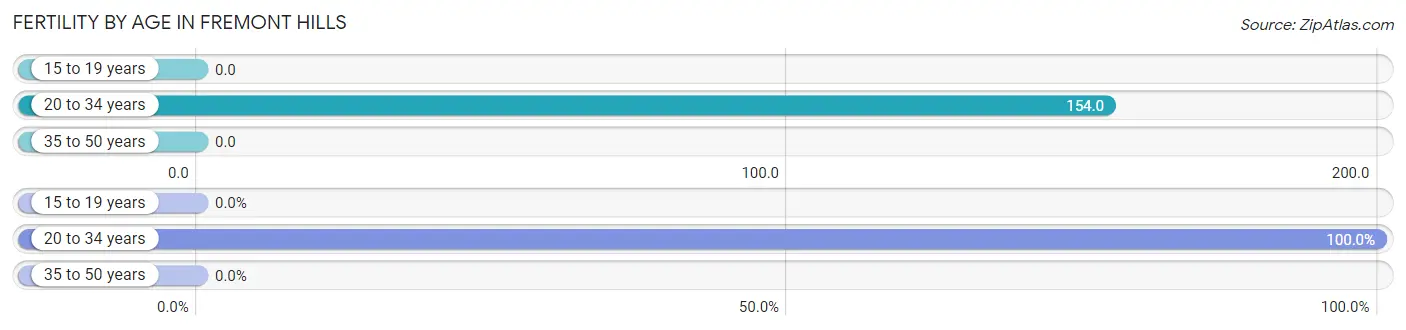
| Age Bracket | Women with Births | Births / 1,000 Women |
| 15 to 19 years | 0 (0.0%) | 0.0 |
| 20 to 34 years | 12 (100.0%) | 154.0 |
| 35 to 50 years | 0 (0.0%) | 0.0 |
| Total | 12 (100.0%) | 44.0 |
Fertility by Age by Marriage Status in Fremont Hills
83.3% of women with births (12) in Fremont Hills are married. The highest percentage of unmarried women with births falls into 20 to 34 years age bracket with 16.7% of them unmarried at the time of birth, while the lowest percentage of unmarried women with births belong to 20 to 34 years age bracket with 16.7% of them unmarried.
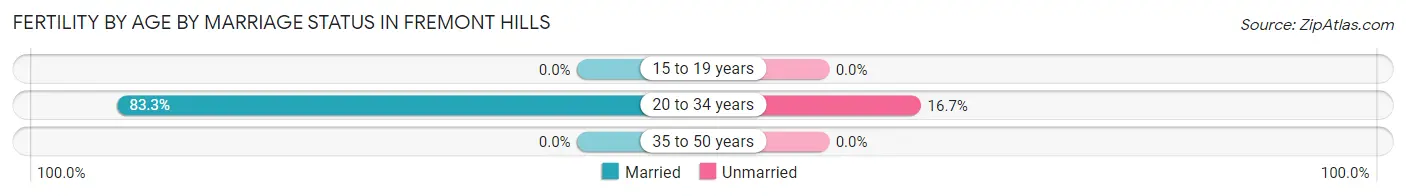
| Age Bracket | Married | Unmarried |
| 15 to 19 years | 0 (0.0%) | 0 (0.0%) |
| 20 to 34 years | 10 (83.3%) | 2 (16.7%) |
| 35 to 50 years | 0 (0.0%) | 0 (0.0%) |
| Total | 10 (83.3%) | 2 (16.7%) |
Fertility by Education in Fremont Hills
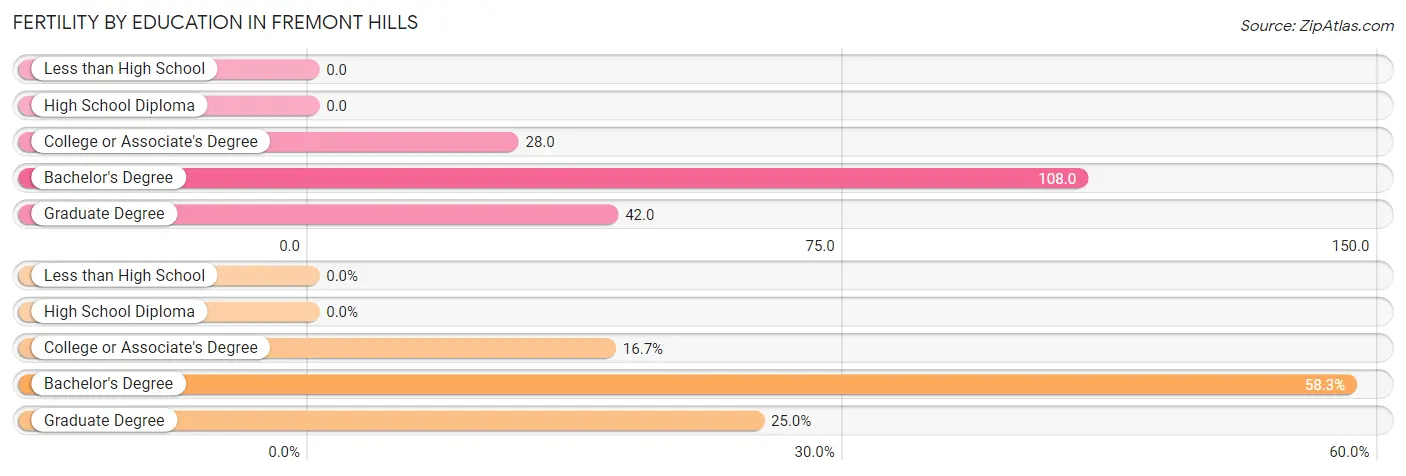
| Educational Attainment | Women with Births | Births / 1,000 Women |
| Less than High School | 0 (0.0%) | 0.0 |
| High School Diploma | 0 (0.0%) | 0.0 |
| College or Associate's Degree | 2 (16.7%) | 28.0 |
| Bachelor's Degree | 7 (58.3%) | 108.0 |
| Graduate Degree | 3 (25.0%) | 42.0 |
| Total | 12 (100.0%) | 44.0 |
Fertility by Education by Marriage Status in Fremont Hills
16.7% of women with births in Fremont Hills are unmarried. Women with the educational attainment of bachelor's degree are most likely to be married with 100.0% of them married at childbirth, while women with the educational attainment of college or associate's degree are least likely to be married with 100.0% of them unmarried at childbirth.
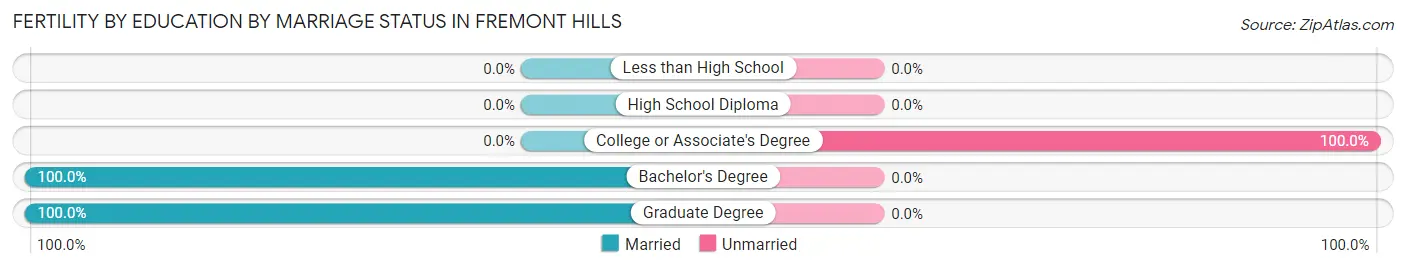
| Educational Attainment | Married | Unmarried |
| Less than High School | 0 (0.0%) | 0 (0.0%) |
| High School Diploma | 0 (0.0%) | 0 (0.0%) |
| College or Associate's Degree | 0 (0.0%) | 2 (100.0%) |
| Bachelor's Degree | 7 (100.0%) | 0 (0.0%) |
| Graduate Degree | 3 (100.0%) | 0 (0.0%) |
| Total | 10 (83.3%) | 2 (16.7%) |
Employment Characteristics in Fremont Hills
Employment by Class of Employer in Fremont Hills
Among the 541 employed individuals in Fremont Hills, private company employees (278 | 51.4%), not-for-profit organizations (133 | 24.6%), and self-employed (incorporated) (48 | 8.9%) make up the most common classes of employment.
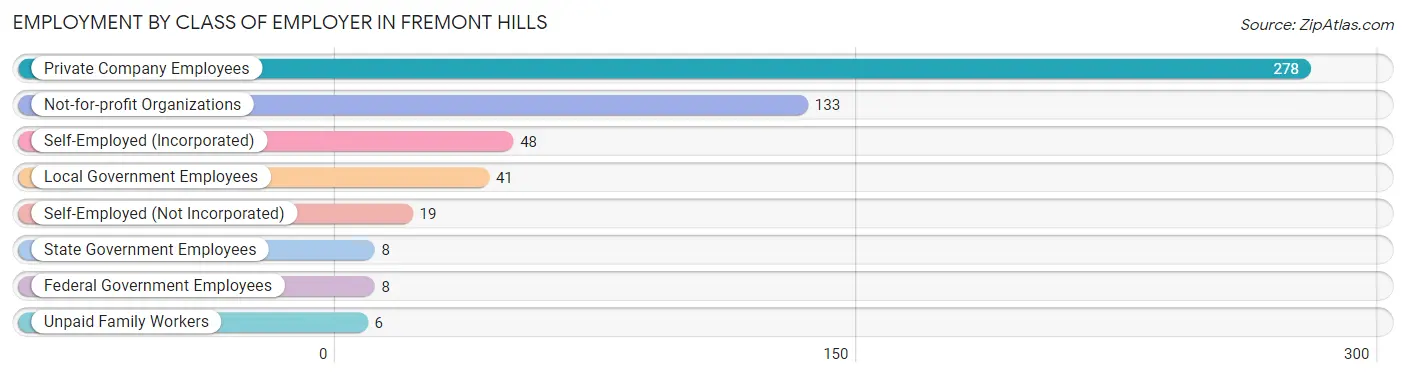
| Employer Class | # Employees | % Employees |
| Private Company Employees | 278 | 51.4% |
| Self-Employed (Incorporated) | 48 | 8.9% |
| Self-Employed (Not Incorporated) | 19 | 3.5% |
| Not-for-profit Organizations | 133 | 24.6% |
| Local Government Employees | 41 | 7.6% |
| State Government Employees | 8 | 1.5% |
| Federal Government Employees | 8 | 1.5% |
| Unpaid Family Workers | 6 | 1.1% |
| Total | 541 | 100.0% |
Employment Status by Age in Fremont Hills
According to the labor force statistics for Fremont Hills, out of the total population over 16 years of age (962), 58.0% or 558 individuals are in the labor force, with 2.9% or 16 of them unemployed. The age group with the highest labor force participation rate is 55 to 59 years, with 93.2% or 41 individuals in the labor force. Within the labor force, the 20 to 24 years age range has the highest percentage of unemployed individuals, with 46.2% or 6 of them being unemployed.
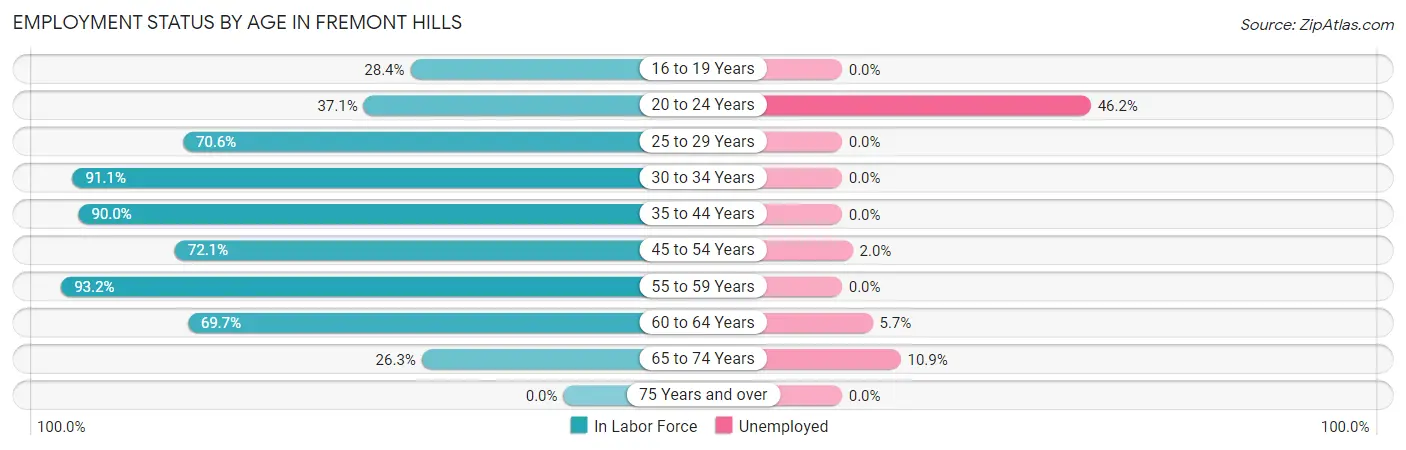
| Age Bracket | In Labor Force | Unemployed |
| 16 to 19 Years | 21 (28.4%) | 0 (0.0%) |
| 20 to 24 Years | 13 (37.1%) | 6 (46.2%) |
| 25 to 29 Years | 12 (70.6%) | 0 (0.0%) |
| 30 to 34 Years | 72 (91.1%) | 0 (0.0%) |
| 35 to 44 Years | 199 (90.0%) | 0 (0.0%) |
| 45 to 54 Years | 101 (72.1%) | 2 (2.0%) |
| 55 to 59 Years | 41 (93.2%) | 0 (0.0%) |
| 60 to 64 Years | 53 (69.7%) | 3 (5.7%) |
| 65 to 74 Years | 46 (26.3%) | 5 (10.9%) |
| 75 Years and over | 0 (0.0%) | 0 (0.0%) |
| Total | 558 (58.0%) | 16 (2.9%) |
Employment Status by Educational Attainment in Fremont Hills
According to labor force statistics for Fremont Hills, 82.8% of individuals (478) out of the total population between 25 and 64 years of age (577) are in the labor force, with 1.0% or 5 of them being unemployed. The group with the highest labor force participation rate are those with the educational attainment of bachelor's degree or higher, with 85.2% or 304 individuals in the labor force. Within the labor force, individuals with college / associate degree education have the highest percentage of unemployment, with 2.2% or 3 of them being unemployed.
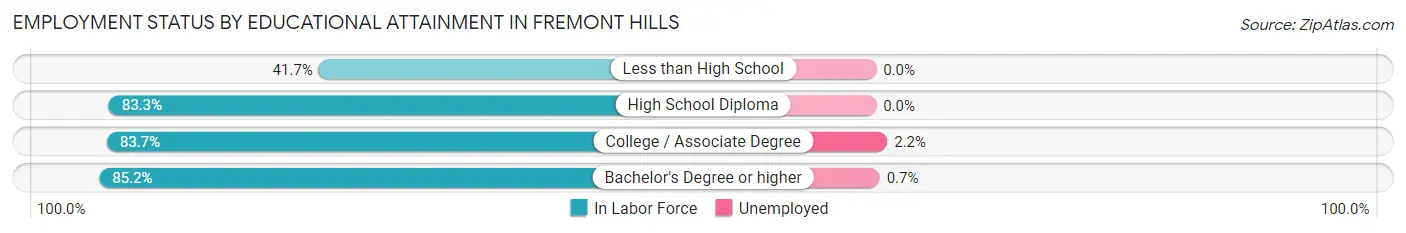
| Educational Attainment | In Labor Force | Unemployed |
| Less than High School | 10 (41.7%) | 0 (0.0%) |
| High School Diploma | 25 (83.3%) | 0 (0.0%) |
| College / Associate Degree | 139 (83.7%) | 4 (2.2%) |
| Bachelor's Degree or higher | 304 (85.2%) | 2 (0.7%) |
| Total | 478 (82.8%) | 6 (1.0%) |
Employment Occupations by Sex in Fremont Hills
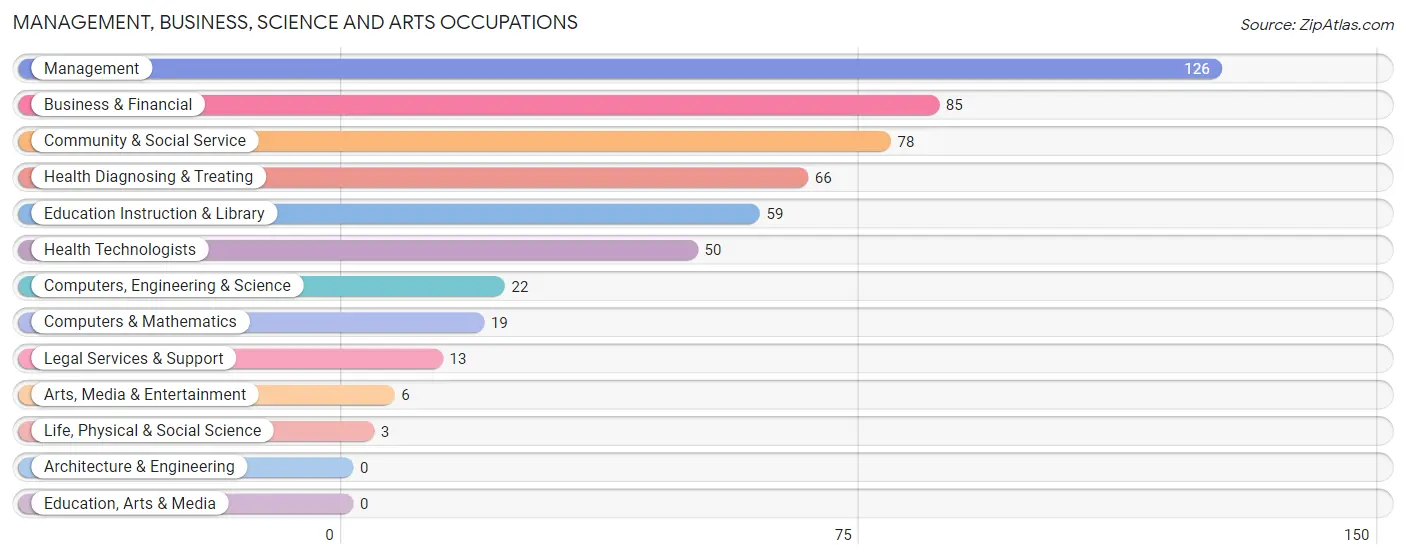
Management, Business, Science and Arts Occupations
The most common Management, Business, Science and Arts occupations in Fremont Hills are Management (126 | 23.3%), Business & Financial (85 | 15.7%), Community & Social Service (78 | 14.4%), Health Diagnosing & Treating (66 | 12.2%), and Education Instruction & Library (59 | 10.9%).
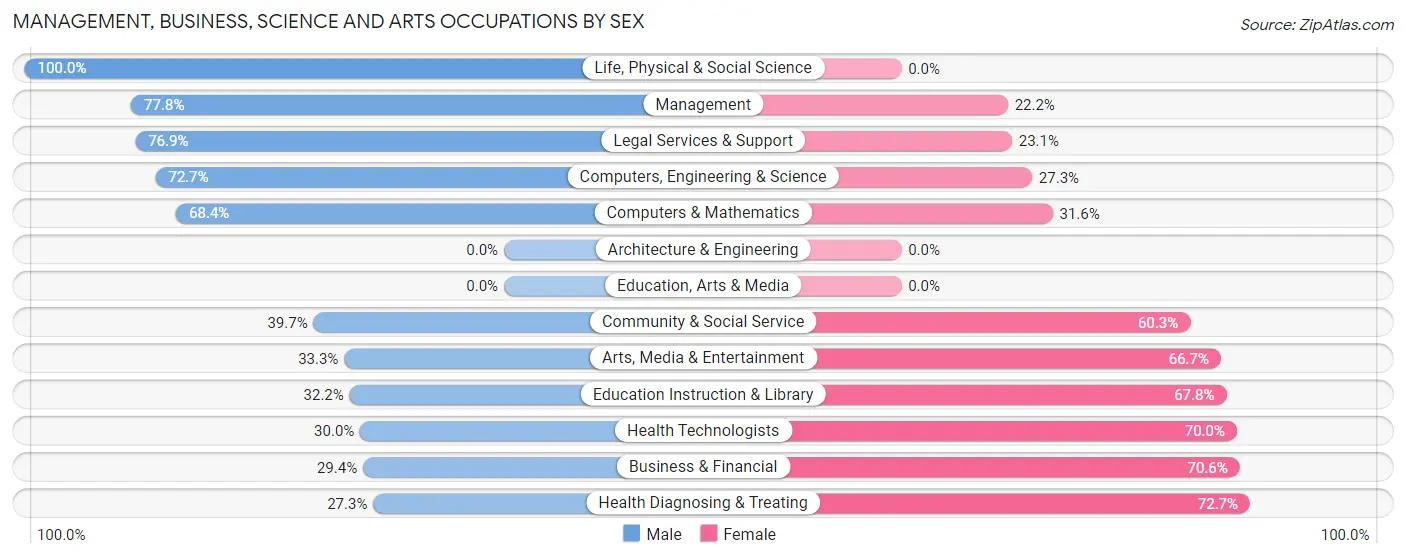
Management, Business, Science and Arts Occupations by Sex
Within the Management, Business, Science and Arts occupations in Fremont Hills, the most male-oriented occupations are Life, Physical & Social Science (100.0%), Management (77.8%), and Legal Services & Support (76.9%), while the most female-oriented occupations are Health Diagnosing & Treating (72.7%), Business & Financial (70.6%), and Health Technologists (70.0%).
| Occupation | Male | Female |
| Management | 98 (77.8%) | 28 (22.2%) |
| Business & Financial | 25 (29.4%) | 60 (70.6%) |
| Computers, Engineering & Science | 16 (72.7%) | 6 (27.3%) |
| Computers & Mathematics | 13 (68.4%) | 6 (31.6%) |
| Architecture & Engineering | 0 (0.0%) | 0 (0.0%) |
| Life, Physical & Social Science | 3 (100.0%) | 0 (0.0%) |
| Community & Social Service | 31 (39.7%) | 47 (60.3%) |
| Education, Arts & Media | 0 (0.0%) | 0 (0.0%) |
| Legal Services & Support | 10 (76.9%) | 3 (23.1%) |
| Education Instruction & Library | 19 (32.2%) | 40 (67.8%) |
| Arts, Media & Entertainment | 2 (33.3%) | 4 (66.7%) |
| Health Diagnosing & Treating | 18 (27.3%) | 48 (72.7%) |
| Health Technologists | 15 (30.0%) | 35 (70.0%) |
| Total (Category) | 188 (49.9%) | 189 (50.1%) |
| Total (Overall) | 275 (50.7%) | 267 (49.3%) |
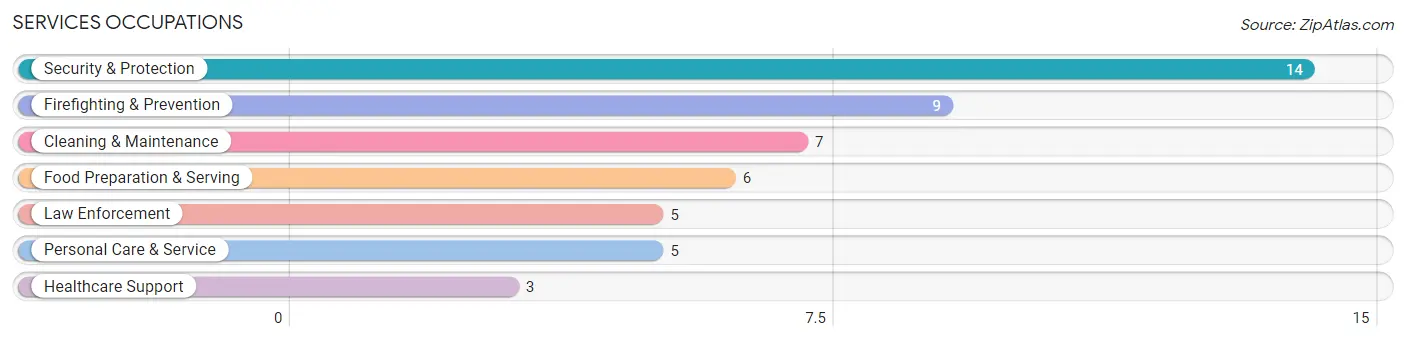
Services Occupations
The most common Services occupations in Fremont Hills are Security & Protection (14 | 2.6%), Firefighting & Prevention (9 | 1.7%), Cleaning & Maintenance (7 | 1.3%), Food Preparation & Serving (6 | 1.1%), and Law Enforcement (5 | 0.9%).
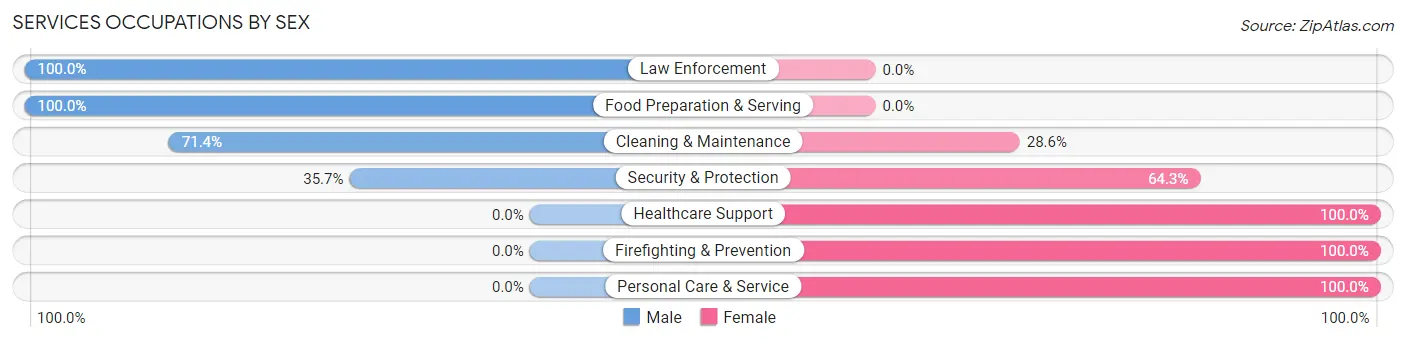
Services Occupations by Sex
Within the Services occupations in Fremont Hills, the most male-oriented occupations are Law Enforcement (100.0%), Food Preparation & Serving (100.0%), and Cleaning & Maintenance (71.4%), while the most female-oriented occupations are Healthcare Support (100.0%), Firefighting & Prevention (100.0%), and Personal Care & Service (100.0%).
| Occupation | Male | Female |
| Healthcare Support | 0 (0.0%) | 3 (100.0%) |
| Security & Protection | 5 (35.7%) | 9 (64.3%) |
| Firefighting & Prevention | 0 (0.0%) | 9 (100.0%) |
| Law Enforcement | 5 (100.0%) | 0 (0.0%) |
| Food Preparation & Serving | 6 (100.0%) | 0 (0.0%) |
| Cleaning & Maintenance | 5 (71.4%) | 2 (28.6%) |
| Personal Care & Service | 0 (0.0%) | 5 (100.0%) |
| Total (Category) | 16 (45.7%) | 19 (54.3%) |
| Total (Overall) | 275 (50.7%) | 267 (49.3%) |
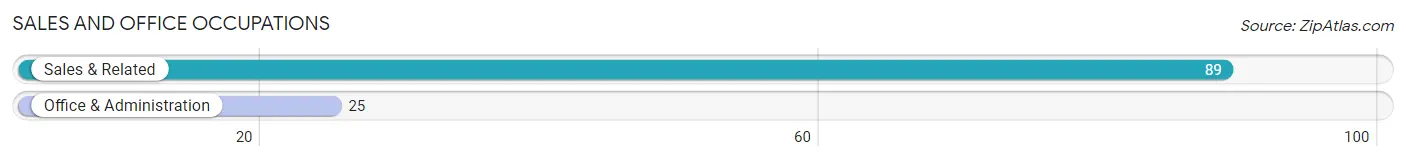
Sales and Office Occupations
The most common Sales and Office occupations in Fremont Hills are Sales & Related (89 | 16.4%), and Office & Administration (25 | 4.6%).
Sales and Office Occupations by Sex
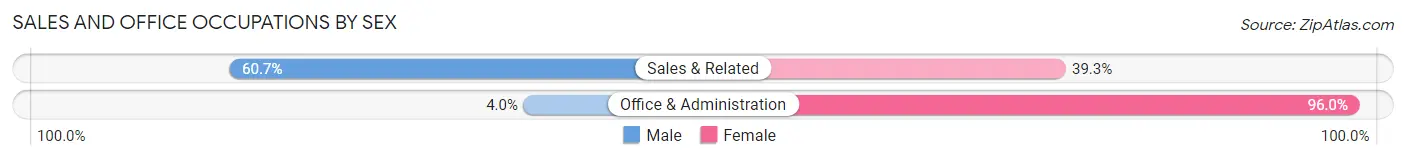
| Occupation | Male | Female |
| Sales & Related | 54 (60.7%) | 35 (39.3%) |
| Office & Administration | 1 (4.0%) | 24 (96.0%) |
| Total (Category) | 55 (48.2%) | 59 (51.7%) |
| Total (Overall) | 275 (50.7%) | 267 (49.3%) |
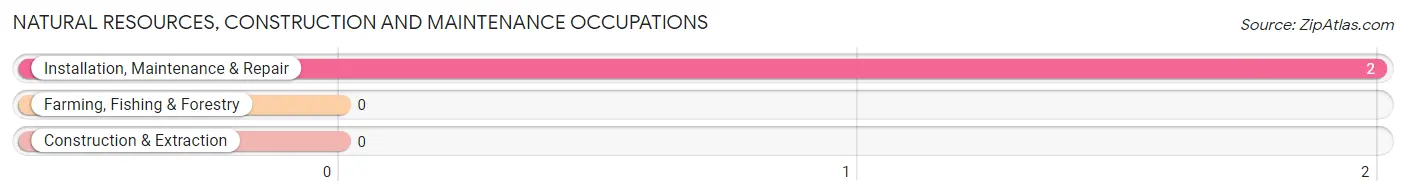
Natural Resources, Construction and Maintenance Occupations
The most common Natural Resources, Construction and Maintenance occupations in Fremont Hills are , and Installation, Maintenance & Repair (2 | 0.4%).
Natural Resources, Construction and Maintenance Occupations by Sex
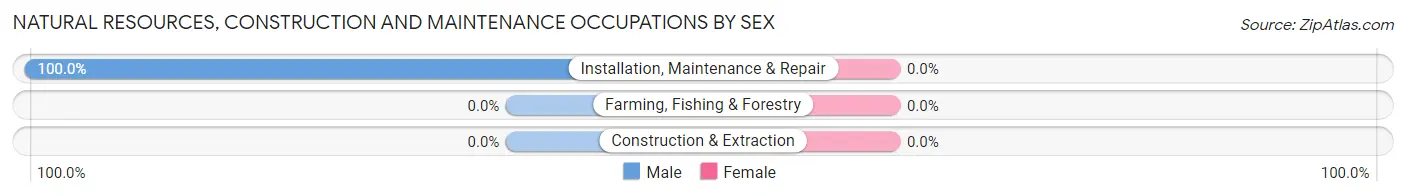
| Occupation | Male | Female |
| Farming, Fishing & Forestry | 0 (0.0%) | 0 (0.0%) |
| Construction & Extraction | 0 (0.0%) | 0 (0.0%) |
| Installation, Maintenance & Repair | 2 (100.0%) | 0 (0.0%) |
| Total (Category) | 2 (100.0%) | 0 (0.0%) |
| Total (Overall) | 275 (50.7%) | 267 (49.3%) |
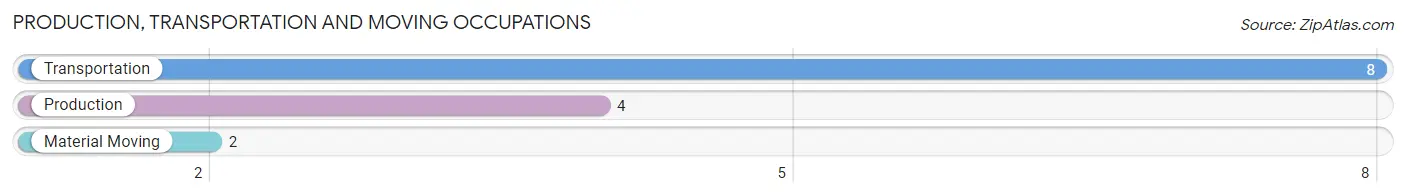
Production, Transportation and Moving Occupations
The most common Production, Transportation and Moving occupations in Fremont Hills are Transportation (8 | 1.5%), Production (4 | 0.7%), and Material Moving (2 | 0.4%).
Production, Transportation and Moving Occupations by Sex
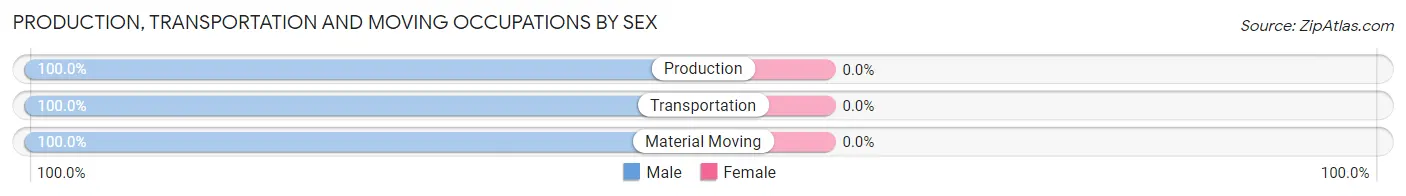
| Occupation | Male | Female |
| Production | 4 (100.0%) | 0 (0.0%) |
| Transportation | 8 (100.0%) | 0 (0.0%) |
| Material Moving | 2 (100.0%) | 0 (0.0%) |
| Total (Category) | 14 (100.0%) | 0 (0.0%) |
| Total (Overall) | 275 (50.7%) | 267 (49.3%) |
Employment Industries by Sex in Fremont Hills
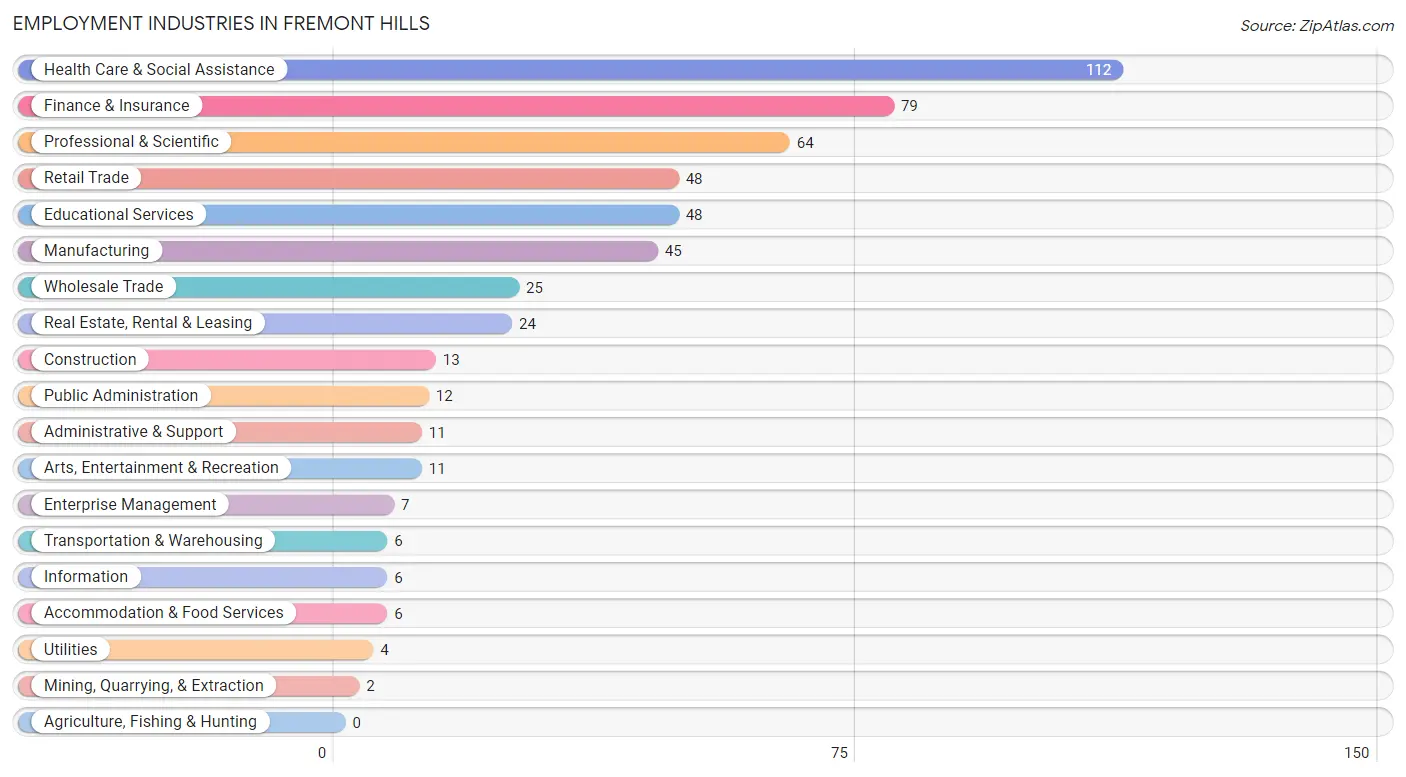
Employment Industries in Fremont Hills
The major employment industries in Fremont Hills include Health Care & Social Assistance (112 | 20.7%), Finance & Insurance (79 | 14.6%), Professional & Scientific (64 | 11.8%), Retail Trade (48 | 8.9%), and Educational Services (48 | 8.9%).
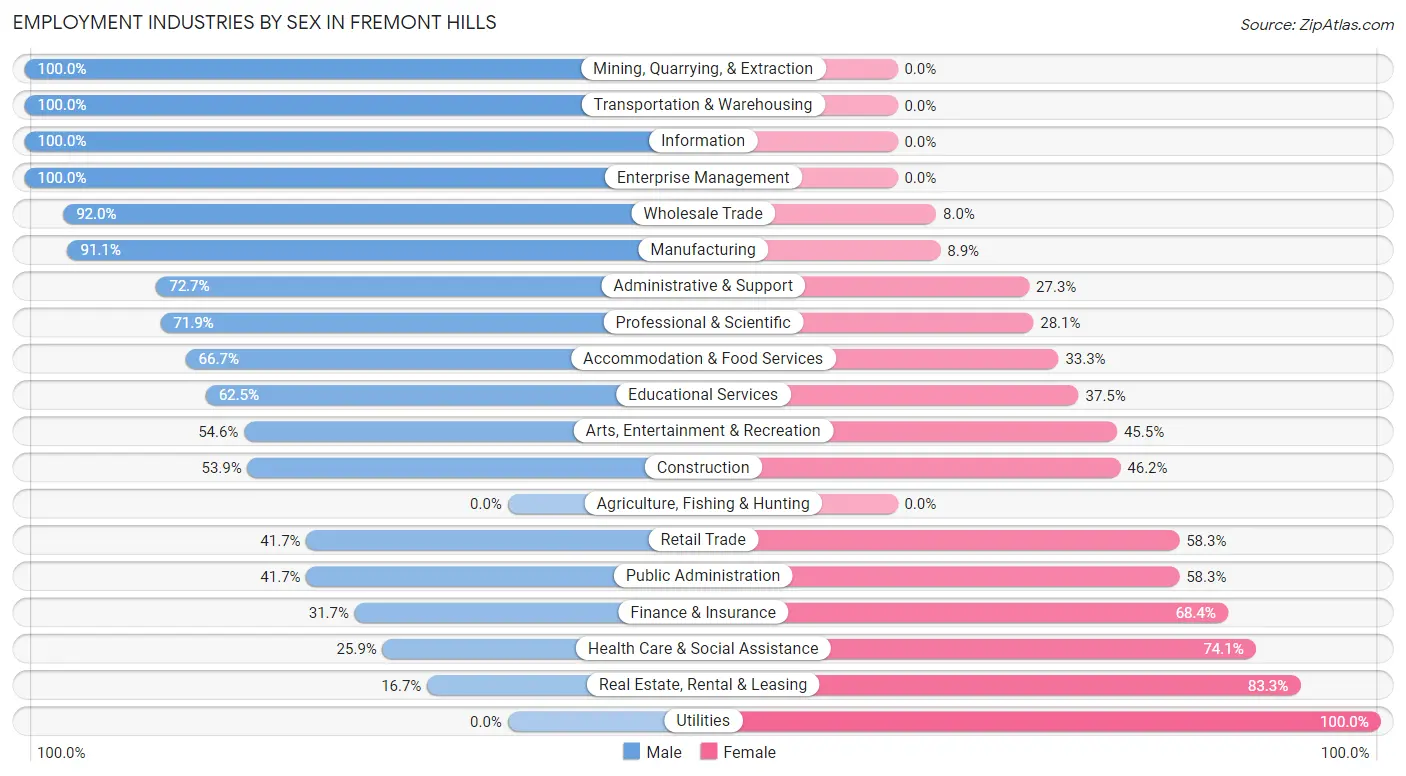
Employment Industries by Sex in Fremont Hills
The Fremont Hills industries that see more men than women are Mining, Quarrying, & Extraction (100.0%), Transportation & Warehousing (100.0%), and Information (100.0%), whereas the industries that tend to have a higher number of women are Utilities (100.0%), Real Estate, Rental & Leasing (83.3%), and Health Care & Social Assistance (74.1%).
| Industry | Male | Female |
| Agriculture, Fishing & Hunting | 0 (0.0%) | 0 (0.0%) |
| Mining, Quarrying, & Extraction | 2 (100.0%) | 0 (0.0%) |
| Construction | 7 (53.8%) | 6 (46.2%) |
| Manufacturing | 41 (91.1%) | 4 (8.9%) |
| Wholesale Trade | 23 (92.0%) | 2 (8.0%) |
| Retail Trade | 20 (41.7%) | 28 (58.3%) |
| Transportation & Warehousing | 6 (100.0%) | 0 (0.0%) |
| Utilities | 0 (0.0%) | 4 (100.0%) |
| Information | 6 (100.0%) | 0 (0.0%) |
| Finance & Insurance | 25 (31.7%) | 54 (68.3%) |
| Real Estate, Rental & Leasing | 4 (16.7%) | 20 (83.3%) |
| Professional & Scientific | 46 (71.9%) | 18 (28.1%) |
| Enterprise Management | 7 (100.0%) | 0 (0.0%) |
| Administrative & Support | 8 (72.7%) | 3 (27.3%) |
| Educational Services | 30 (62.5%) | 18 (37.5%) |
| Health Care & Social Assistance | 29 (25.9%) | 83 (74.1%) |
| Arts, Entertainment & Recreation | 6 (54.5%) | 5 (45.5%) |
| Accommodation & Food Services | 4 (66.7%) | 2 (33.3%) |
| Public Administration | 5 (41.7%) | 7 (58.3%) |
| Total | 275 (50.7%) | 267 (49.3%) |
Education in Fremont Hills
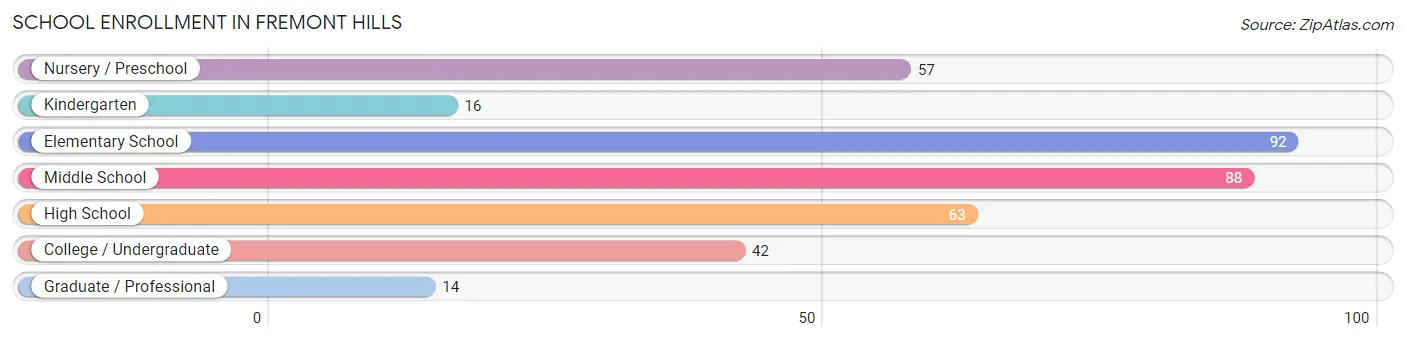
School Enrollment in Fremont Hills
The most common levels of schooling among the 372 students in Fremont Hills are elementary school (92 | 24.7%), middle school (88 | 23.7%), and high school (63 | 16.9%).
| School Level | # Students | % Students |
| Nursery / Preschool | 57 | 15.3% |
| Kindergarten | 16 | 4.3% |
| Elementary School | 92 | 24.7% |
| Middle School | 88 | 23.7% |
| High School | 63 | 16.9% |
| College / Undergraduate | 42 | 11.3% |
| Graduate / Professional | 14 | 3.8% |
| Total | 372 | 100.0% |
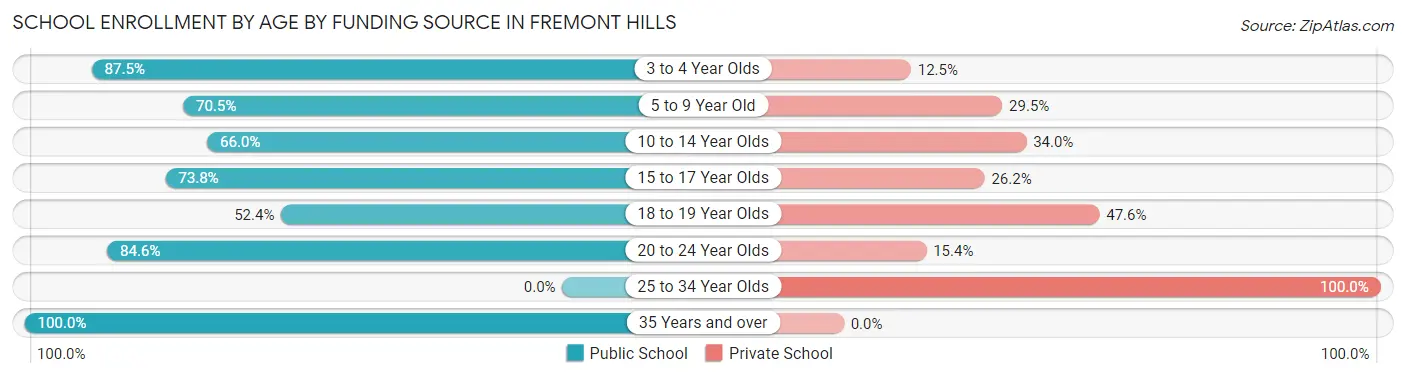
School Enrollment by Age by Funding Source in Fremont Hills
Out of a total of 372 students who are enrolled in schools in Fremont Hills, 104 (28.0%) attend a private institution, while the remaining 268 (72.0%) are enrolled in public schools. The age group of 25 to 34 year olds has the highest likelihood of being enrolled in private schools, with 3 (100.0% in the age bracket) enrolled. Conversely, the age group of 35 years and over has the lowest likelihood of being enrolled in a private school, with 8 (100.0% in the age bracket) attending a public institution.
| Age Bracket | Public School | Private School |
| 3 to 4 Year Olds | 42 (87.5%) | 6 (12.5%) |
| 5 to 9 Year Old | 74 (70.5%) | 31 (29.5%) |
| 10 to 14 Year Olds | 66 (66.0%) | 34 (34.0%) |
| 15 to 17 Year Olds | 45 (73.8%) | 16 (26.2%) |
| 18 to 19 Year Olds | 11 (52.4%) | 10 (47.6%) |
| 20 to 24 Year Olds | 22 (84.6%) | 4 (15.4%) |
| 25 to 34 Year Olds | 0 (0.0%) | 3 (100.0%) |
| 35 Years and over | 8 (100.0%) | 0 (0.0%) |
| Total | 268 (72.0%) | 104 (28.0%) |
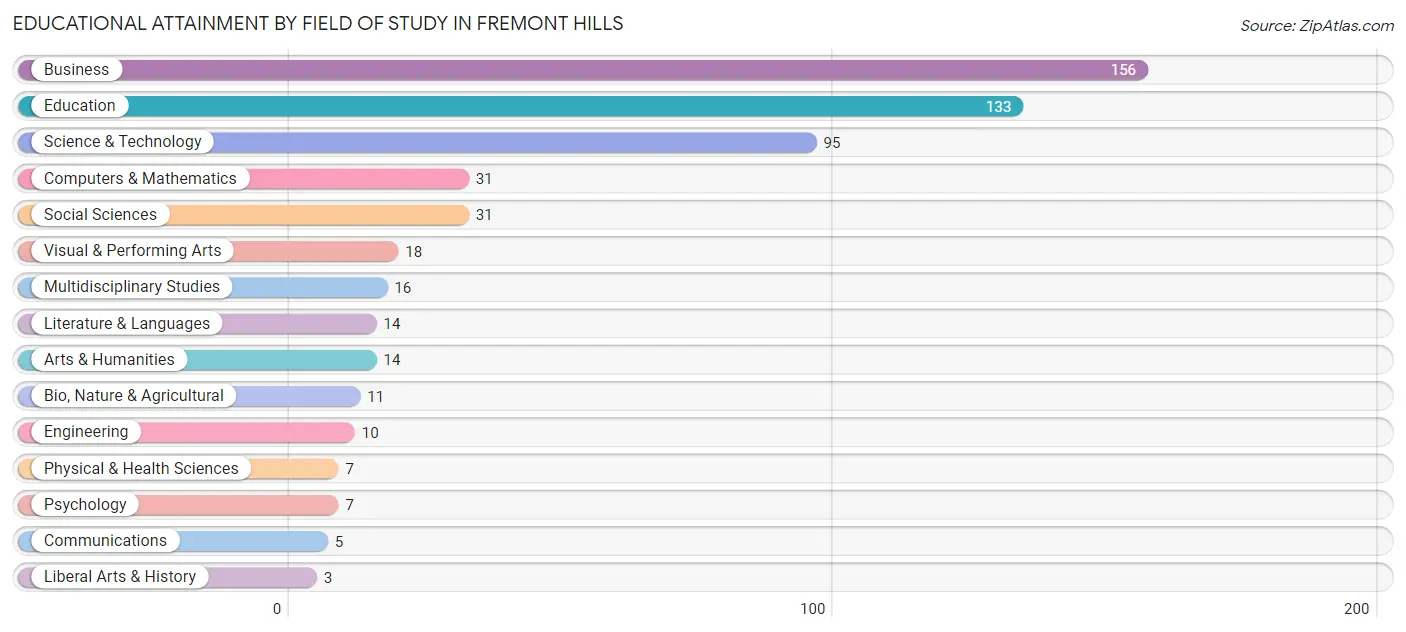
Educational Attainment by Field of Study in Fremont Hills
Business (156 | 28.3%), education (133 | 24.1%), science & technology (95 | 17.2%), computers & mathematics (31 | 5.6%), and social sciences (31 | 5.6%) are the most common fields of study among 551 individuals in Fremont Hills who have obtained a bachelor's degree or higher.
| Field of Study | # Graduates | % Graduates |
| Computers & Mathematics | 31 | 5.6% |
| Bio, Nature & Agricultural | 11 | 2.0% |
| Physical & Health Sciences | 7 | 1.3% |
| Psychology | 7 | 1.3% |
| Social Sciences | 31 | 5.6% |
| Engineering | 10 | 1.8% |
| Multidisciplinary Studies | 16 | 2.9% |
| Science & Technology | 95 | 17.2% |
| Business | 156 | 28.3% |
| Education | 133 | 24.1% |
| Literature & Languages | 14 | 2.5% |
| Liberal Arts & History | 3 | 0.5% |
| Visual & Performing Arts | 18 | 3.3% |
| Communications | 5 | 0.9% |
| Arts & Humanities | 14 | 2.5% |
| Total | 551 | 100.0% |
Transportation & Commute in Fremont Hills
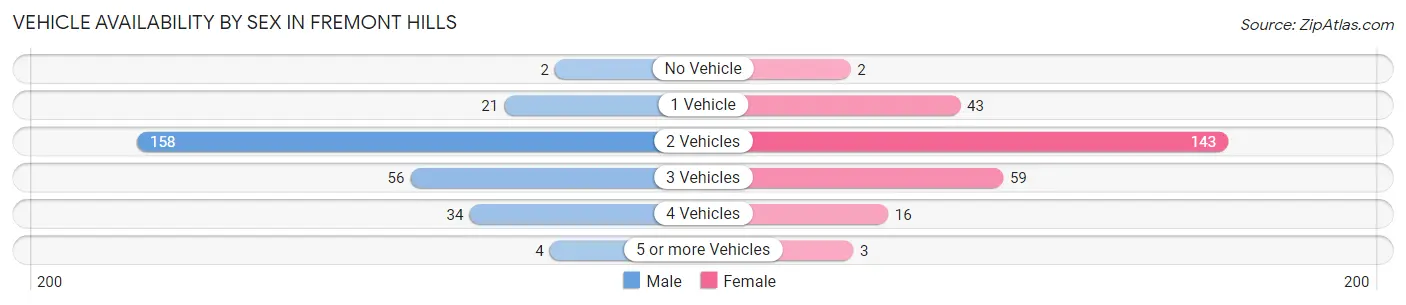
Vehicle Availability by Sex in Fremont Hills
The most prevalent vehicle ownership categories in Fremont Hills are males with 2 vehicles (158, accounting for 57.5%) and females with 2 vehicles (143, making up 59.4%).
| Vehicles Available | Male | Female |
| No Vehicle | 2 (0.7%) | 2 (0.7%) |
| 1 Vehicle | 21 (7.6%) | 43 (16.2%) |
| 2 Vehicles | 158 (57.5%) | 143 (53.8%) |
| 3 Vehicles | 56 (20.4%) | 59 (22.2%) |
| 4 Vehicles | 34 (12.4%) | 16 (6.0%) |
| 5 or more Vehicles | 4 (1.5%) | 3 (1.1%) |
| Total | 275 (100.0%) | 266 (100.0%) |
Commute Time in Fremont Hills
The most frequently occuring commute durations in Fremont Hills are 20 to 24 minutes (129 commuters, 28.5%), 15 to 19 minutes (67 commuters, 14.8%), and 5 to 9 minutes (59 commuters, 13.0%).
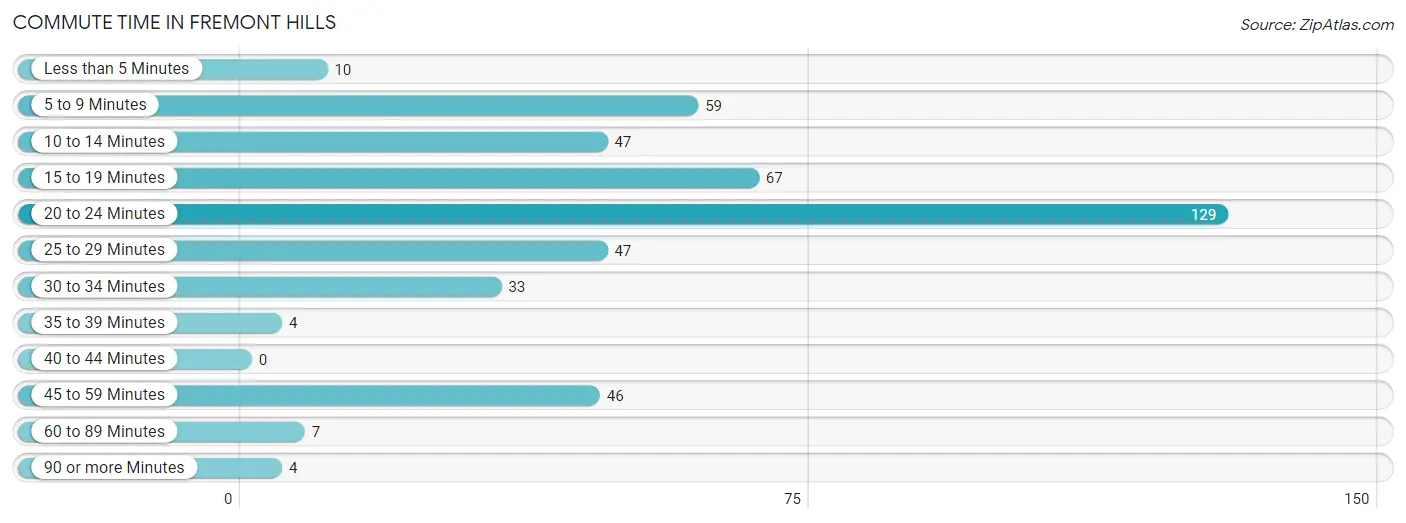
| Commute Time | # Commuters | % Commuters |
| Less than 5 Minutes | 10 | 2.2% |
| 5 to 9 Minutes | 59 | 13.0% |
| 10 to 14 Minutes | 47 | 10.4% |
| 15 to 19 Minutes | 67 | 14.8% |
| 20 to 24 Minutes | 129 | 28.5% |
| 25 to 29 Minutes | 47 | 10.4% |
| 30 to 34 Minutes | 33 | 7.3% |
| 35 to 39 Minutes | 4 | 0.9% |
| 40 to 44 Minutes | 0 | 0.0% |
| 45 to 59 Minutes | 46 | 10.2% |
| 60 to 89 Minutes | 7 | 1.5% |
| 90 or more Minutes | 4 | 0.9% |
Commute Time by Sex in Fremont Hills
The most common commute times in Fremont Hills are 20 to 24 minutes (45 commuters, 20.2%) for males and 20 to 24 minutes (84 commuters, 36.5%) for females.
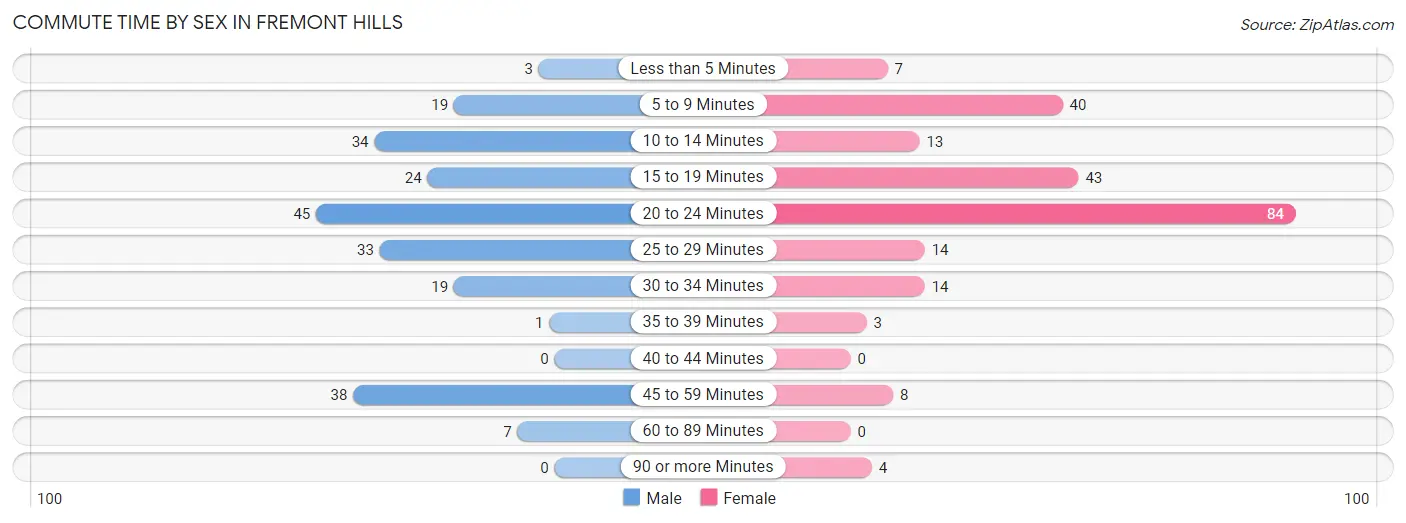
| Commute Time | Male | Female |
| Less than 5 Minutes | 3 (1.3%) | 7 (3.0%) |
| 5 to 9 Minutes | 19 (8.5%) | 40 (17.4%) |
| 10 to 14 Minutes | 34 (15.2%) | 13 (5.7%) |
| 15 to 19 Minutes | 24 (10.8%) | 43 (18.7%) |
| 20 to 24 Minutes | 45 (20.2%) | 84 (36.5%) |
| 25 to 29 Minutes | 33 (14.8%) | 14 (6.1%) |
| 30 to 34 Minutes | 19 (8.5%) | 14 (6.1%) |
| 35 to 39 Minutes | 1 (0.4%) | 3 (1.3%) |
| 40 to 44 Minutes | 0 (0.0%) | 0 (0.0%) |
| 45 to 59 Minutes | 38 (17.0%) | 8 (3.5%) |
| 60 to 89 Minutes | 7 (3.1%) | 0 (0.0%) |
| 90 or more Minutes | 0 (0.0%) | 4 (1.7%) |
Time of Departure to Work by Sex in Fremont Hills
The most frequent times of departure to work in Fremont Hills are 7:00 AM to 7:29 AM (45, 20.2%) for males and 7:30 AM to 7:59 AM (55, 23.9%) for females.
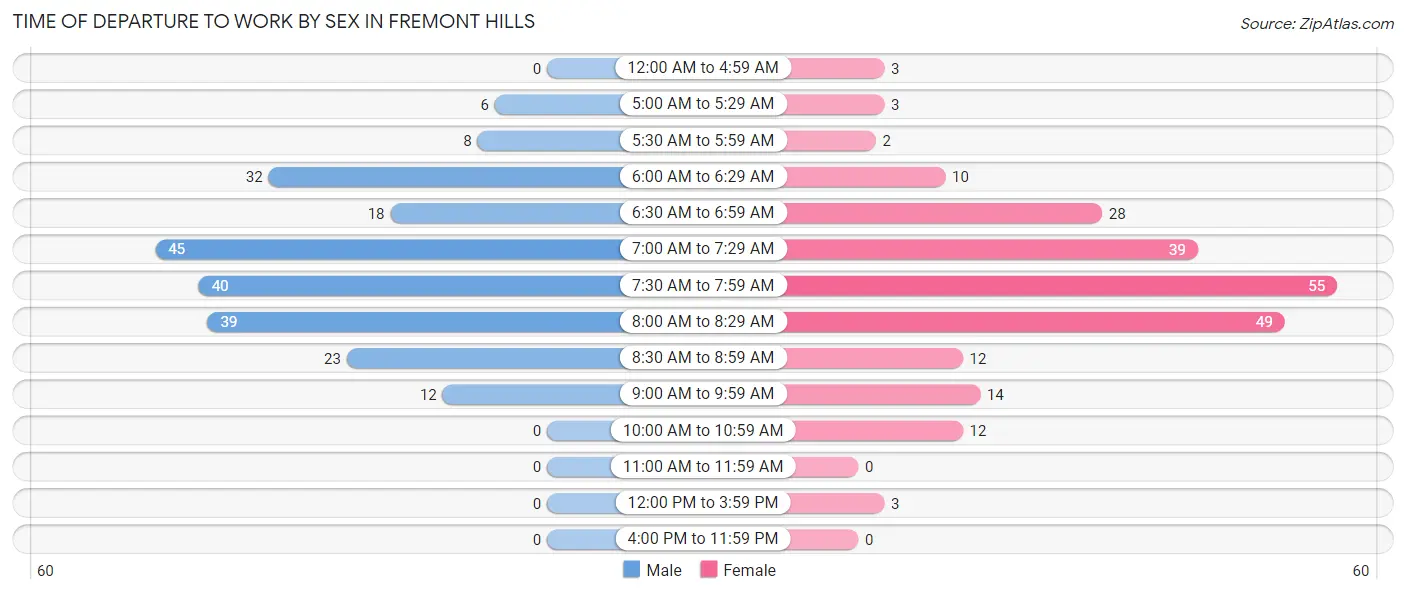
| Time of Departure | Male | Female |
| 12:00 AM to 4:59 AM | 0 (0.0%) | 3 (1.3%) |
| 5:00 AM to 5:29 AM | 6 (2.7%) | 3 (1.3%) |
| 5:30 AM to 5:59 AM | 8 (3.6%) | 2 (0.9%) |
| 6:00 AM to 6:29 AM | 32 (14.3%) | 10 (4.3%) |
| 6:30 AM to 6:59 AM | 18 (8.1%) | 28 (12.2%) |
| 7:00 AM to 7:29 AM | 45 (20.2%) | 39 (17.0%) |
| 7:30 AM to 7:59 AM | 40 (17.9%) | 55 (23.9%) |
| 8:00 AM to 8:29 AM | 39 (17.5%) | 49 (21.3%) |
| 8:30 AM to 8:59 AM | 23 (10.3%) | 12 (5.2%) |
| 9:00 AM to 9:59 AM | 12 (5.4%) | 14 (6.1%) |
| 10:00 AM to 10:59 AM | 0 (0.0%) | 12 (5.2%) |
| 11:00 AM to 11:59 AM | 0 (0.0%) | 0 (0.0%) |
| 12:00 PM to 3:59 PM | 0 (0.0%) | 3 (1.3%) |
| 4:00 PM to 11:59 PM | 0 (0.0%) | 0 (0.0%) |
| Total | 223 (100.0%) | 230 (100.0%) |
Housing Occupancy in Fremont Hills
Occupancy by Ownership in Fremont Hills
Of the total 446 dwellings in Fremont Hills, owner-occupied units account for 406 (91.0%), while renter-occupied units make up 40 (9.0%).
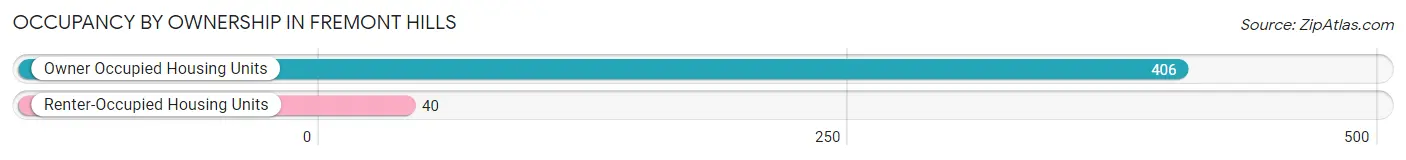
| Occupancy | # Housing Units | % Housing Units |
| Owner Occupied Housing Units | 406 | 91.0% |
| Renter-Occupied Housing Units | 40 | 9.0% |
| Total Occupied Housing Units | 446 | 100.0% |
Occupancy by Household Size in Fremont Hills
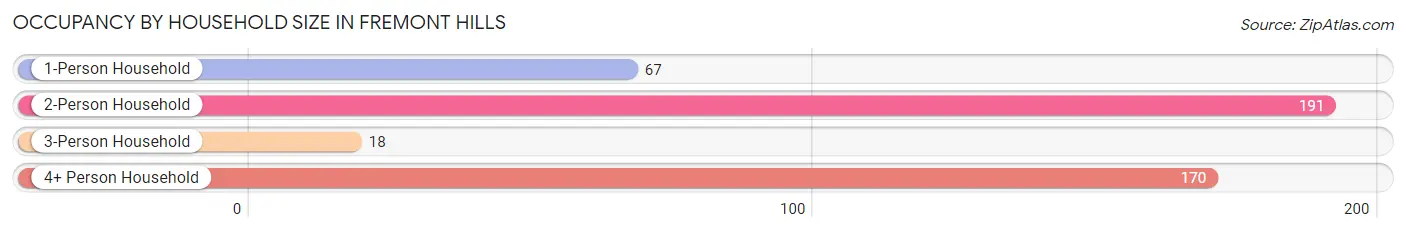
| Household Size | # Housing Units | % Housing Units |
| 1-Person Household | 67 | 15.0% |
| 2-Person Household | 191 | 42.8% |
| 3-Person Household | 18 | 4.0% |
| 4+ Person Household | 170 | 38.1% |
| Total Housing Units | 446 | 100.0% |
Occupancy by Ownership by Household Size in Fremont Hills
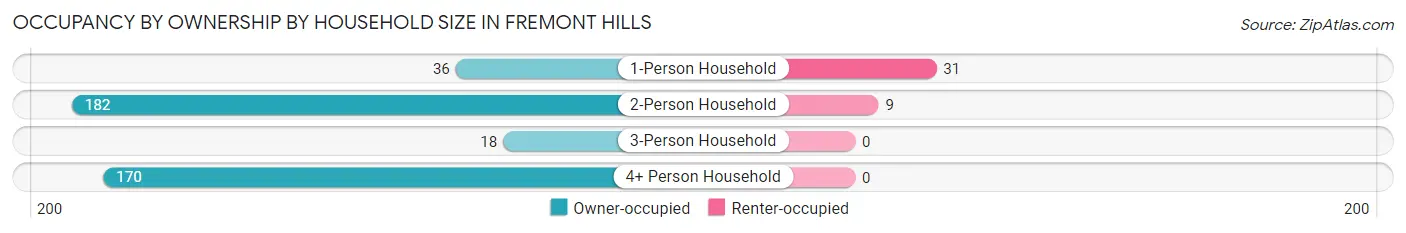
| Household Size | Owner-occupied | Renter-occupied |
| 1-Person Household | 36 (53.7%) | 31 (46.3%) |
| 2-Person Household | 182 (95.3%) | 9 (4.7%) |
| 3-Person Household | 18 (100.0%) | 0 (0.0%) |
| 4+ Person Household | 170 (100.0%) | 0 (0.0%) |
| Total Housing Units | 406 (91.0%) | 40 (9.0%) |
Occupancy by Educational Attainment in Fremont Hills
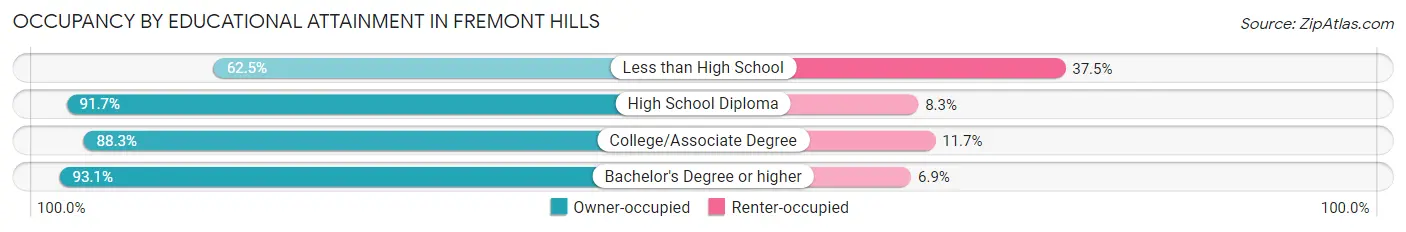
| Household Size | Owner-occupied | Renter-occupied |
| Less than High School | 5 (62.5%) | 3 (37.5%) |
| High School Diploma | 33 (91.7%) | 3 (8.3%) |
| College/Associate Degree | 113 (88.3%) | 15 (11.7%) |
| Bachelor's Degree or higher | 255 (93.1%) | 19 (6.9%) |
Occupancy by Age of Householder in Fremont Hills
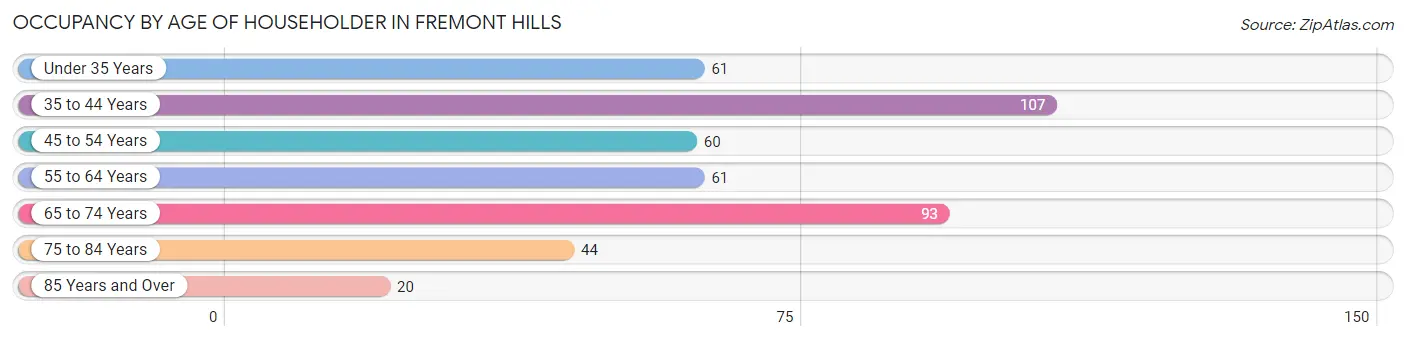
| Age Bracket | # Households | % Households |
| Under 35 Years | 61 | 13.7% |
| 35 to 44 Years | 107 | 24.0% |
| 45 to 54 Years | 60 | 13.5% |
| 55 to 64 Years | 61 | 13.7% |
| 65 to 74 Years | 93 | 20.8% |
| 75 to 84 Years | 44 | 9.9% |
| 85 Years and Over | 20 | 4.5% |
| Total | 446 | 100.0% |
Housing Finances in Fremont Hills
Median Income by Occupancy in Fremont Hills
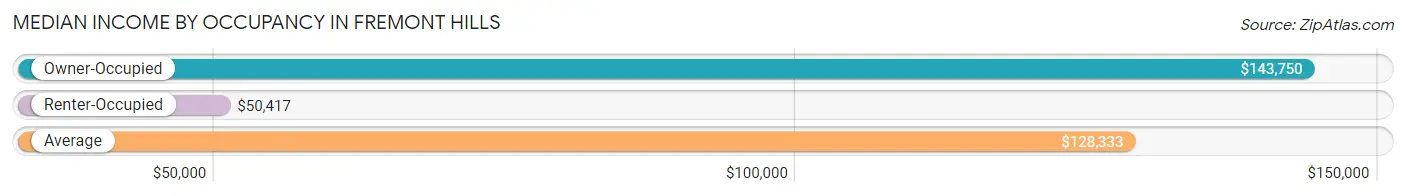
| Occupancy Type | # Households | Median Income |
| Owner-Occupied | 406 (91.0%) | $143,750 |
| Renter-Occupied | 40 (9.0%) | $50,417 |
| Average | 446 (100.0%) | $128,333 |
Occupancy by Householder Income Bracket in Fremont Hills
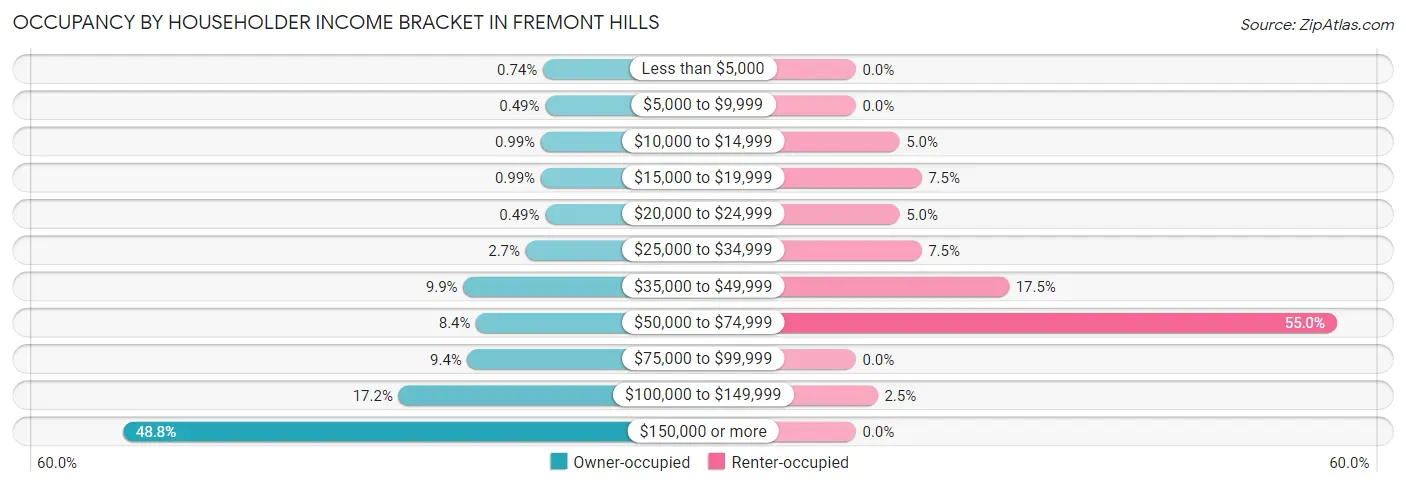
| Income Bracket | Owner-occupied | Renter-occupied |
| Less than $5,000 | 3 (0.7%) | 0 (0.0%) |
| $5,000 to $9,999 | 2 (0.5%) | 0 (0.0%) |
| $10,000 to $14,999 | 4 (1.0%) | 2 (5.0%) |
| $15,000 to $19,999 | 4 (1.0%) | 3 (7.5%) |
| $20,000 to $24,999 | 2 (0.5%) | 2 (5.0%) |
| $25,000 to $34,999 | 11 (2.7%) | 3 (7.5%) |
| $35,000 to $49,999 | 40 (9.9%) | 7 (17.5%) |
| $50,000 to $74,999 | 34 (8.4%) | 22 (55.0%) |
| $75,000 to $99,999 | 38 (9.4%) | 0 (0.0%) |
| $100,000 to $149,999 | 70 (17.2%) | 1 (2.5%) |
| $150,000 or more | 198 (48.8%) | 0 (0.0%) |
| Total | 406 (100.0%) | 40 (100.0%) |
Monthly Housing Cost Tiers in Fremont Hills
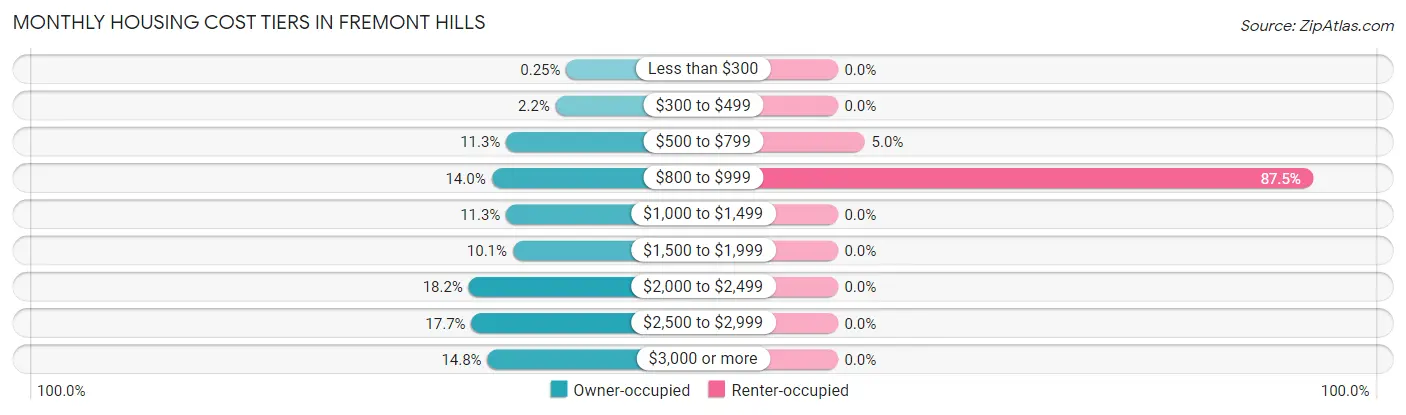
| Monthly Cost | Owner-occupied | Renter-occupied |
| Less than $300 | 1 (0.3%) | 0 (0.0%) |
| $300 to $499 | 9 (2.2%) | 0 (0.0%) |
| $500 to $799 | 46 (11.3%) | 2 (5.0%) |
| $800 to $999 | 57 (14.0%) | 35 (87.5%) |
| $1,000 to $1,499 | 46 (11.3%) | 0 (0.0%) |
| $1,500 to $1,999 | 41 (10.1%) | 0 (0.0%) |
| $2,000 to $2,499 | 74 (18.2%) | 0 (0.0%) |
| $2,500 to $2,999 | 72 (17.7%) | 0 (0.0%) |
| $3,000 or more | 60 (14.8%) | 0 (0.0%) |
| Total | 406 (100.0%) | 40 (100.0%) |
Physical Housing Characteristics in Fremont Hills
Housing Structures in Fremont Hills
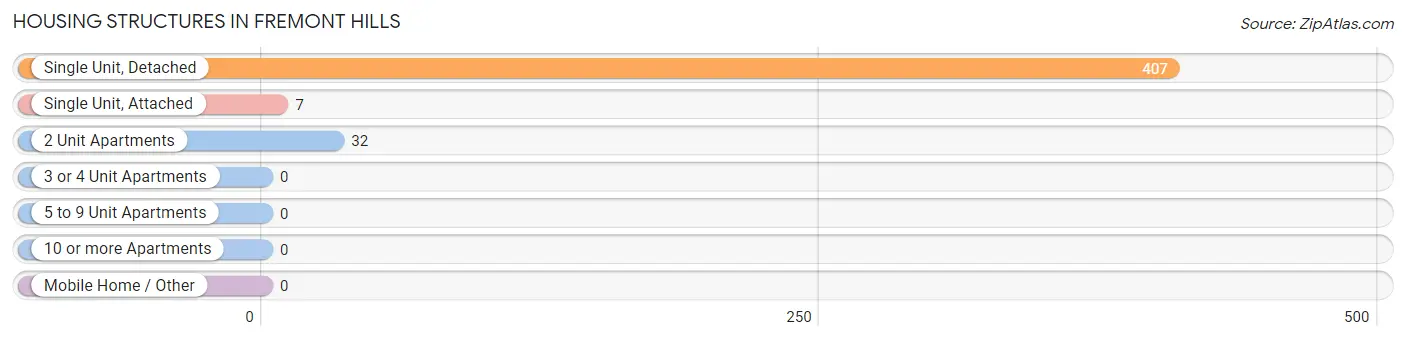
| Structure Type | # Housing Units | % Housing Units |
| Single Unit, Detached | 407 | 91.3% |
| Single Unit, Attached | 7 | 1.6% |
| 2 Unit Apartments | 32 | 7.2% |
| 3 or 4 Unit Apartments | 0 | 0.0% |
| 5 to 9 Unit Apartments | 0 | 0.0% |
| 10 or more Apartments | 0 | 0.0% |
| Mobile Home / Other | 0 | 0.0% |
| Total | 446 | 100.0% |
Housing Structures by Occupancy in Fremont Hills
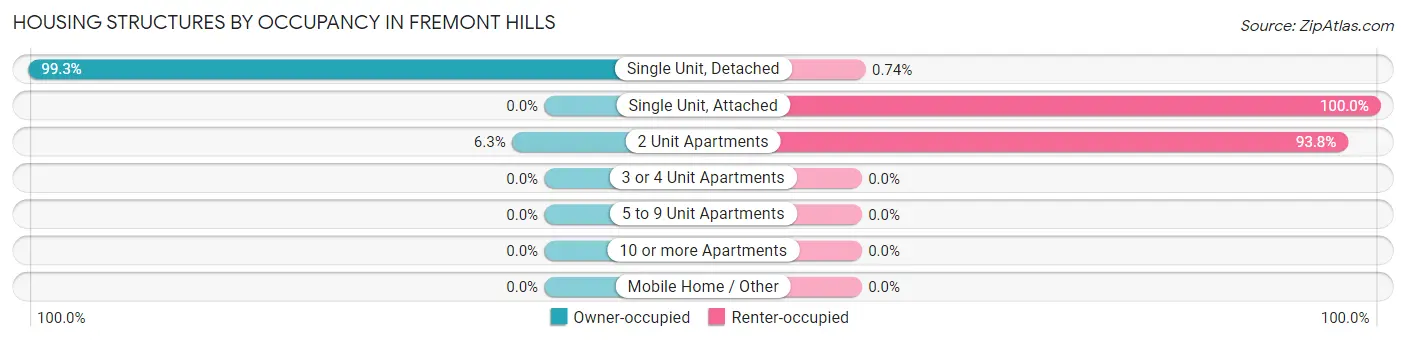
| Structure Type | Owner-occupied | Renter-occupied |
| Single Unit, Detached | 404 (99.3%) | 3 (0.7%) |
| Single Unit, Attached | 0 (0.0%) | 7 (100.0%) |
| 2 Unit Apartments | 2 (6.2%) | 30 (93.8%) |
| 3 or 4 Unit Apartments | 0 (0.0%) | 0 (0.0%) |
| 5 to 9 Unit Apartments | 0 (0.0%) | 0 (0.0%) |
| 10 or more Apartments | 0 (0.0%) | 0 (0.0%) |
| Mobile Home / Other | 0 (0.0%) | 0 (0.0%) |
| Total | 406 (91.0%) | 40 (9.0%) |
Housing Structures by Number of Rooms in Fremont Hills
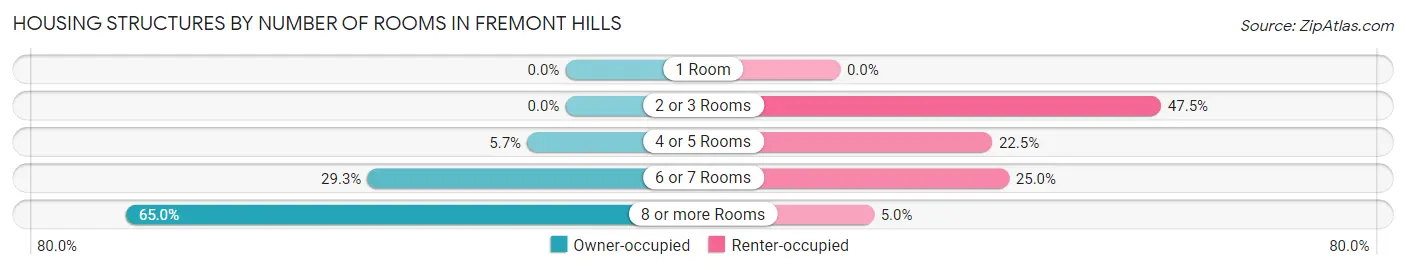
| Number of Rooms | Owner-occupied | Renter-occupied |
| 1 Room | 0 (0.0%) | 0 (0.0%) |
| 2 or 3 Rooms | 0 (0.0%) | 19 (47.5%) |
| 4 or 5 Rooms | 23 (5.7%) | 9 (22.5%) |
| 6 or 7 Rooms | 119 (29.3%) | 10 (25.0%) |
| 8 or more Rooms | 264 (65.0%) | 2 (5.0%) |
| Total | 406 (100.0%) | 40 (100.0%) |
Housing Structure by Heating Type in Fremont Hills
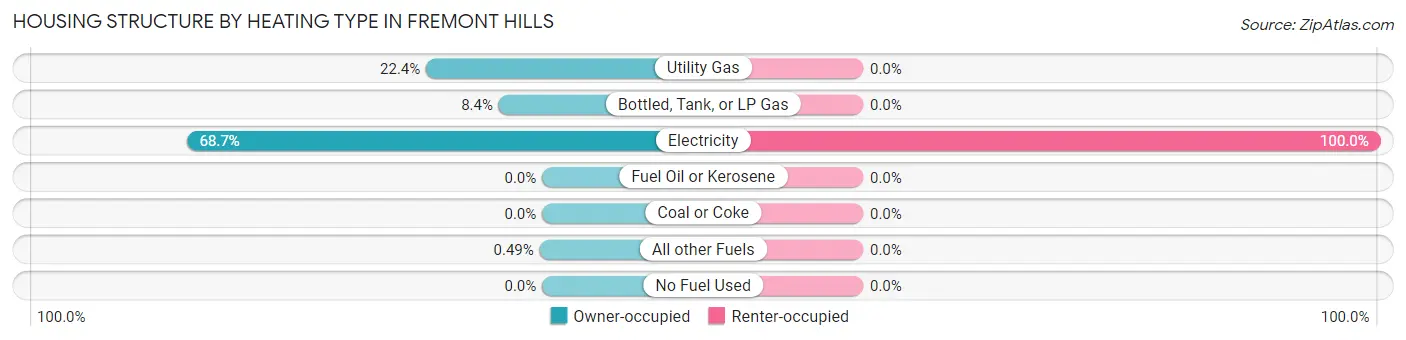
| Heating Type | Owner-occupied | Renter-occupied |
| Utility Gas | 91 (22.4%) | 0 (0.0%) |
| Bottled, Tank, or LP Gas | 34 (8.4%) | 0 (0.0%) |
| Electricity | 279 (68.7%) | 40 (100.0%) |
| Fuel Oil or Kerosene | 0 (0.0%) | 0 (0.0%) |
| Coal or Coke | 0 (0.0%) | 0 (0.0%) |
| All other Fuels | 2 (0.5%) | 0 (0.0%) |
| No Fuel Used | 0 (0.0%) | 0 (0.0%) |
| Total | 406 (100.0%) | 40 (100.0%) |
Household Vehicle Usage in Fremont Hills
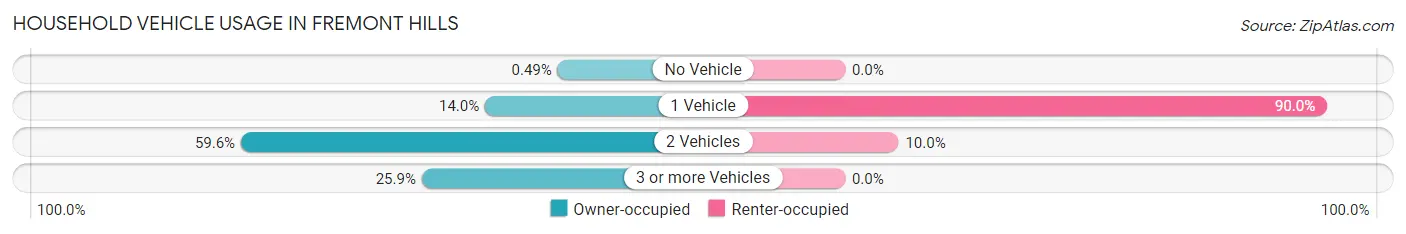
| Vehicles per Household | Owner-occupied | Renter-occupied |
| No Vehicle | 2 (0.5%) | 0 (0.0%) |
| 1 Vehicle | 57 (14.0%) | 36 (90.0%) |
| 2 Vehicles | 242 (59.6%) | 4 (10.0%) |
| 3 or more Vehicles | 105 (25.9%) | 0 (0.0%) |
| Total | 406 (100.0%) | 40 (100.0%) |
Real Estate & Mortgages in Fremont Hills
Real Estate and Mortgage Overview in Fremont Hills
| Characteristic | Without Mortgage | With Mortgage |
| Housing Units | 139 | 267 |
| Median Property Value | $393,200 | $443,300 |
| Median Household Income | $81,563 | $168 |
| Monthly Housing Costs | $846 | $60 |
| Real Estate Taxes | $3,889 | $0 |
Property Value by Mortgage Status in Fremont Hills
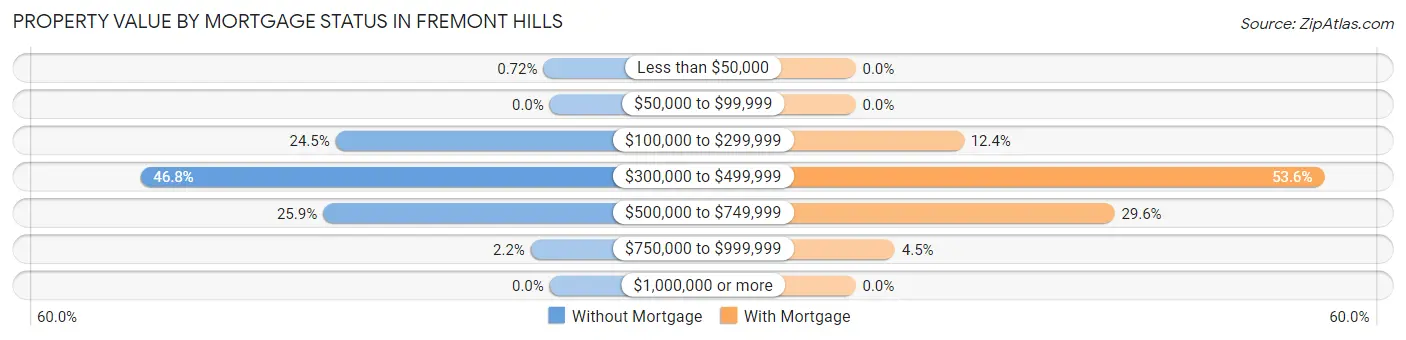
| Property Value | Without Mortgage | With Mortgage |
| Less than $50,000 | 1 (0.7%) | 0 (0.0%) |
| $50,000 to $99,999 | 0 (0.0%) | 0 (0.0%) |
| $100,000 to $299,999 | 34 (24.5%) | 33 (12.4%) |
| $300,000 to $499,999 | 65 (46.8%) | 143 (53.6%) |
| $500,000 to $749,999 | 36 (25.9%) | 79 (29.6%) |
| $750,000 to $999,999 | 3 (2.2%) | 12 (4.5%) |
| $1,000,000 or more | 0 (0.0%) | 0 (0.0%) |
| Total | 139 (100.0%) | 267 (100.0%) |
Household Income by Mortgage Status in Fremont Hills
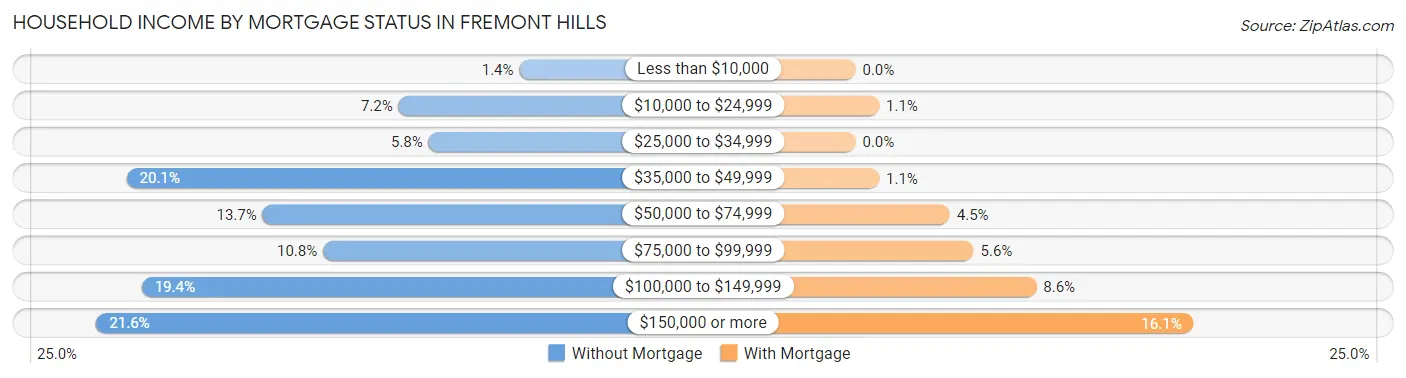
| Household Income | Without Mortgage | With Mortgage |
| Less than $10,000 | 2 (1.4%) | 0 (0.0%) |
| $10,000 to $24,999 | 10 (7.2%) | 3 (1.1%) |
| $25,000 to $34,999 | 8 (5.8%) | 0 (0.0%) |
| $35,000 to $49,999 | 28 (20.1%) | 3 (1.1%) |
| $50,000 to $74,999 | 19 (13.7%) | 12 (4.5%) |
| $75,000 to $99,999 | 15 (10.8%) | 15 (5.6%) |
| $100,000 to $149,999 | 27 (19.4%) | 23 (8.6%) |
| $150,000 or more | 30 (21.6%) | 43 (16.1%) |
| Total | 139 (100.0%) | 267 (100.0%) |
Property Value to Household Income Ratio in Fremont Hills
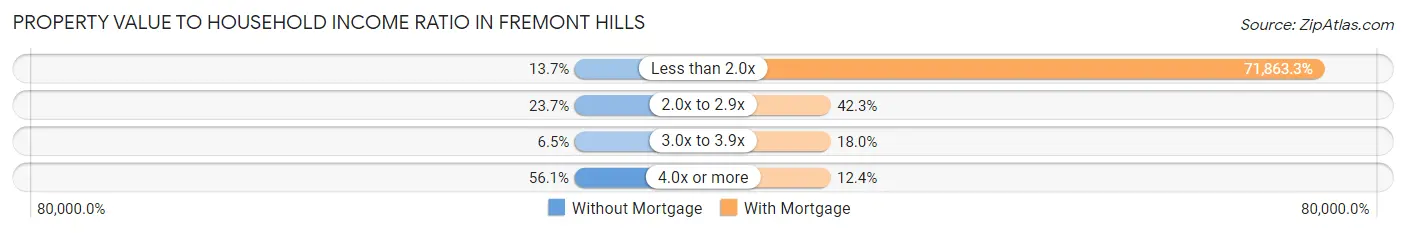
| Value-to-Income Ratio | Without Mortgage | With Mortgage |
| Less than 2.0x | 19 (13.7%) | 191,875 (71,863.3%) |
| 2.0x to 2.9x | 33 (23.7%) | 113 (42.3%) |
| 3.0x to 3.9x | 9 (6.5%) | 48 (18.0%) |
| 4.0x or more | 78 (56.1%) | 33 (12.4%) |
| Total | 139 (100.0%) | 267 (100.0%) |
Real Estate Taxes by Mortgage Status in Fremont Hills
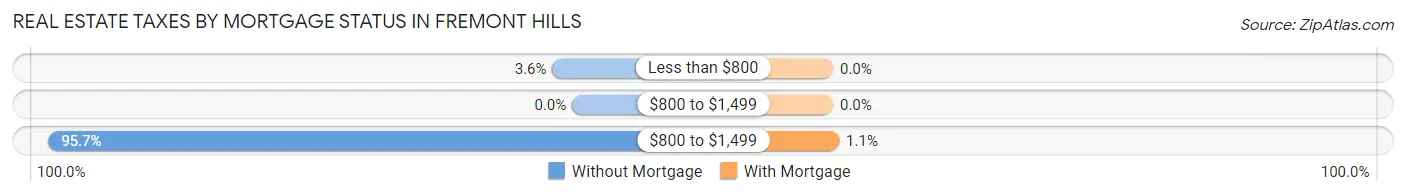
| Property Taxes | Without Mortgage | With Mortgage |
| Less than $800 | 5 (3.6%) | 0 (0.0%) |
| $800 to $1,499 | 0 (0.0%) | 0 (0.0%) |
| $800 to $1,499 | 133 (95.7%) | 3 (1.1%) |
| Total | 139 (100.0%) | 267 (100.0%) |
Health & Disability in Fremont Hills
Health Insurance Coverage by Age in Fremont Hills
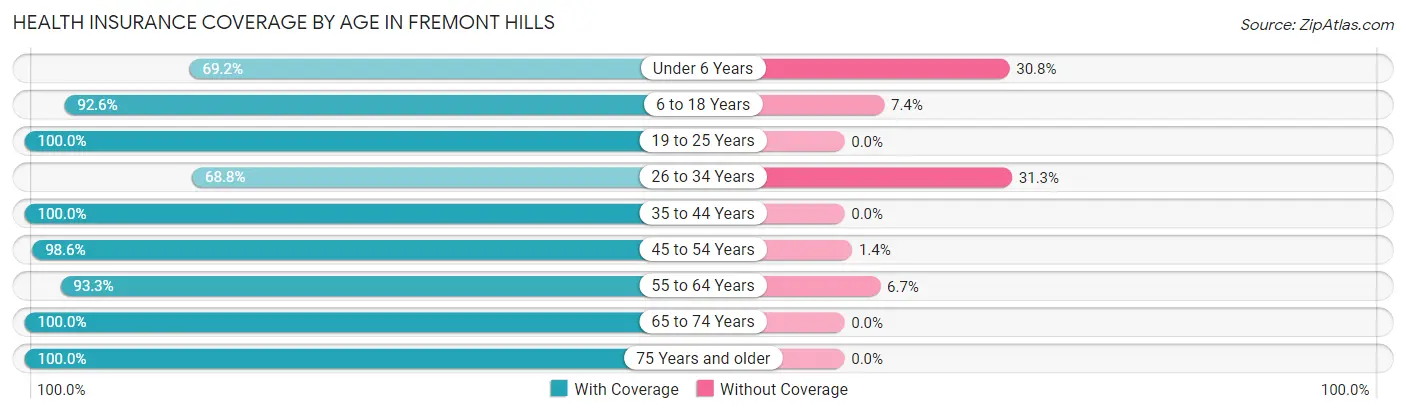
| Age Bracket | With Coverage | Without Coverage |
| Under 6 Years | 63 (69.2%) | 28 (30.8%) |
| 6 to 18 Years | 250 (92.6%) | 20 (7.4%) |
| 19 to 25 Years | 58 (100.0%) | 0 (0.0%) |
| 26 to 34 Years | 66 (68.8%) | 30 (31.2%) |
| 35 to 44 Years | 221 (100.0%) | 0 (0.0%) |
| 45 to 54 Years | 138 (98.6%) | 2 (1.4%) |
| 55 to 64 Years | 112 (93.3%) | 8 (6.7%) |
| 65 to 74 Years | 175 (100.0%) | 0 (0.0%) |
| 75 Years and older | 101 (100.0%) | 0 (0.0%) |
| Total | 1,184 (93.1%) | 88 (6.9%) |
Health Insurance Coverage by Citizenship Status in Fremont Hills
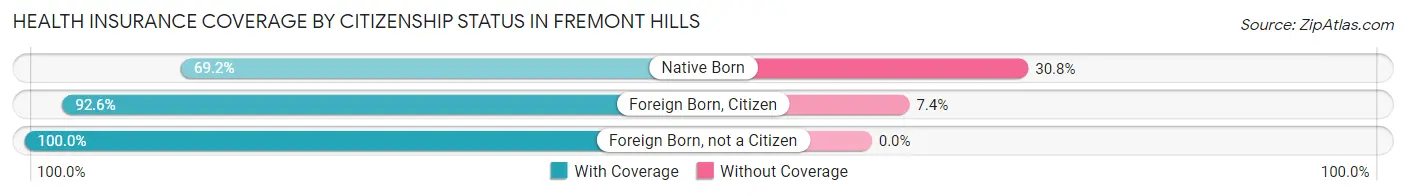
| Citizenship Status | With Coverage | Without Coverage |
| Native Born | 63 (69.2%) | 28 (30.8%) |
| Foreign Born, Citizen | 250 (92.6%) | 20 (7.4%) |
| Foreign Born, not a Citizen | 58 (100.0%) | 0 (0.0%) |
Health Insurance Coverage by Household Income in Fremont Hills
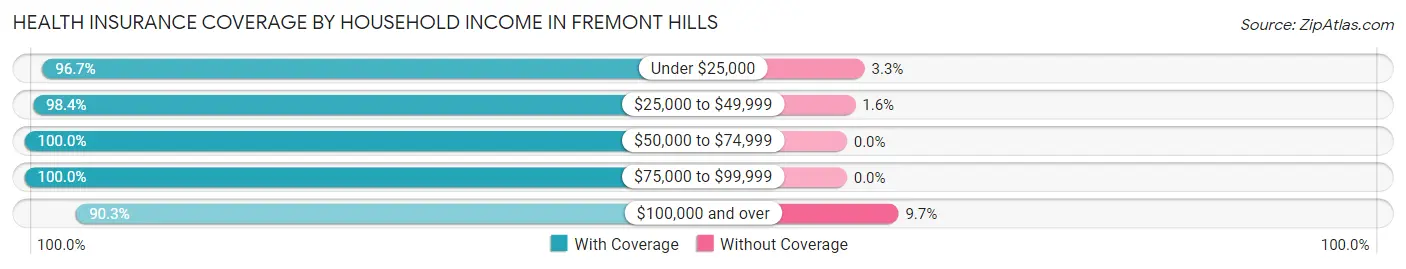
| Household Income | With Coverage | Without Coverage |
| Under $25,000 | 29 (96.7%) | 1 (3.3%) |
| $25,000 to $49,999 | 122 (98.4%) | 2 (1.6%) |
| $50,000 to $74,999 | 96 (100.0%) | 0 (0.0%) |
| $75,000 to $99,999 | 144 (100.0%) | 0 (0.0%) |
| $100,000 and over | 793 (90.3%) | 85 (9.7%) |
Public vs Private Health Insurance Coverage by Age in Fremont Hills
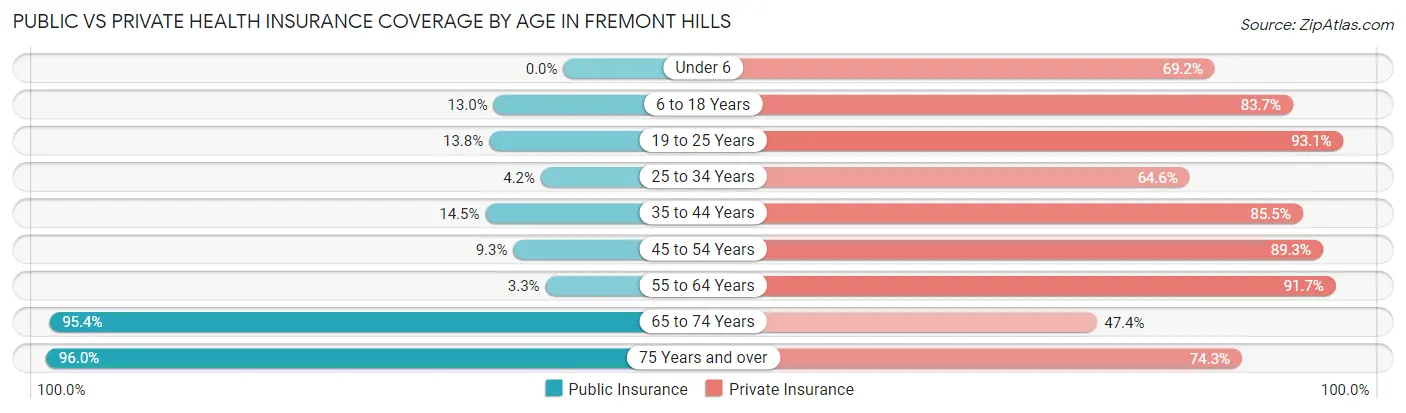
| Age Bracket | Public Insurance | Private Insurance |
| Under 6 | 0 (0.0%) | 63 (69.2%) |
| 6 to 18 Years | 35 (13.0%) | 226 (83.7%) |
| 19 to 25 Years | 8 (13.8%) | 54 (93.1%) |
| 25 to 34 Years | 4 (4.2%) | 62 (64.6%) |
| 35 to 44 Years | 32 (14.5%) | 189 (85.5%) |
| 45 to 54 Years | 13 (9.3%) | 125 (89.3%) |
| 55 to 64 Years | 4 (3.3%) | 110 (91.7%) |
| 65 to 74 Years | 167 (95.4%) | 83 (47.4%) |
| 75 Years and over | 97 (96.0%) | 75 (74.3%) |
| Total | 360 (28.3%) | 987 (77.6%) |
Disability Status by Sex by Age in Fremont Hills
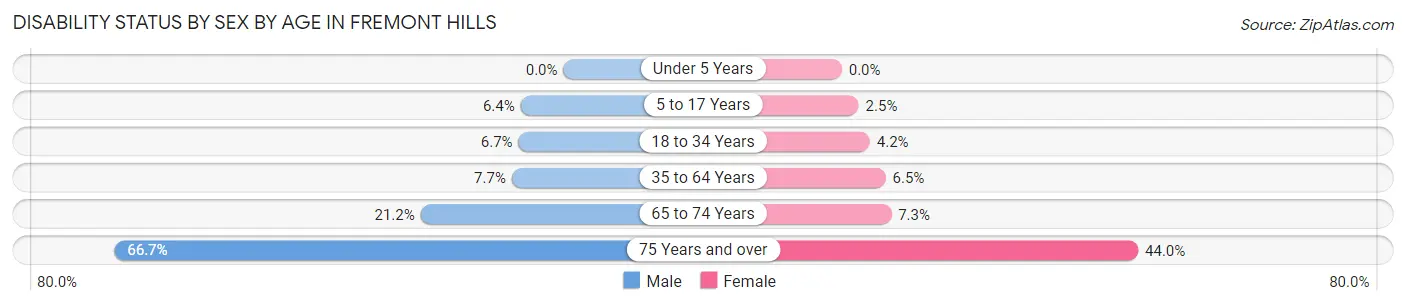
| Age Bracket | Male | Female |
| Under 5 Years | 0 (0.0%) | 0 (0.0%) |
| 5 to 17 Years | 7 (6.4%) | 4 (2.5%) |
| 18 to 34 Years | 4 (6.7%) | 4 (4.2%) |
| 35 to 64 Years | 18 (7.7%) | 16 (6.5%) |
| 65 to 74 Years | 14 (21.2%) | 8 (7.3%) |
| 75 Years and over | 34 (66.7%) | 22 (44.0%) |
Disability Class by Sex by Age in Fremont Hills
Disability Class: Hearing Difficulty
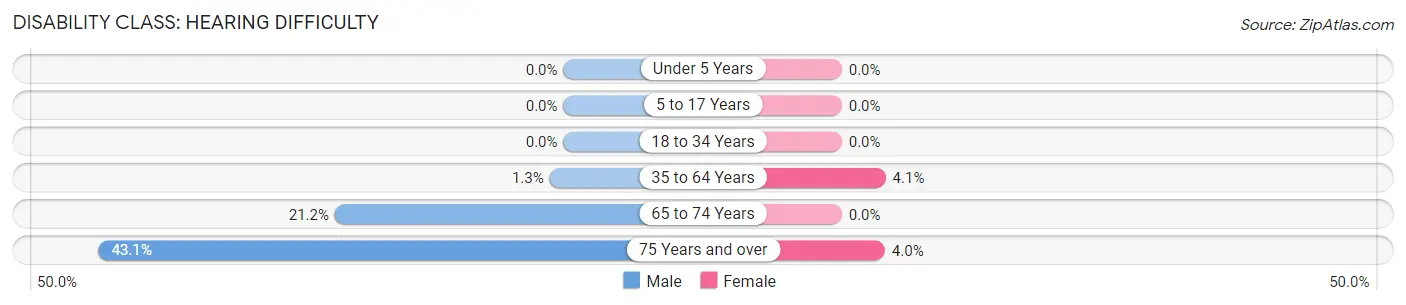
| Age Bracket | Male | Female |
| Under 5 Years | 0 (0.0%) | 0 (0.0%) |
| 5 to 17 Years | 0 (0.0%) | 0 (0.0%) |
| 18 to 34 Years | 0 (0.0%) | 0 (0.0%) |
| 35 to 64 Years | 3 (1.3%) | 10 (4.1%) |
| 65 to 74 Years | 14 (21.2%) | 0 (0.0%) |
| 75 Years and over | 22 (43.1%) | 2 (4.0%) |
Disability Class: Vision Difficulty
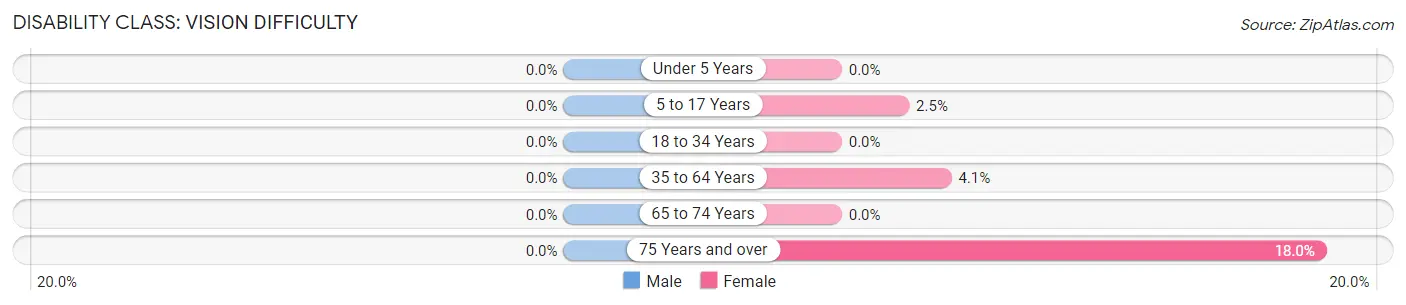
| Age Bracket | Male | Female |
| Under 5 Years | 0 (0.0%) | 0 (0.0%) |
| 5 to 17 Years | 0 (0.0%) | 4 (2.5%) |
| 18 to 34 Years | 0 (0.0%) | 0 (0.0%) |
| 35 to 64 Years | 0 (0.0%) | 10 (4.1%) |
| 65 to 74 Years | 0 (0.0%) | 0 (0.0%) |
| 75 Years and over | 0 (0.0%) | 9 (18.0%) |
Disability Class: Cognitive Difficulty
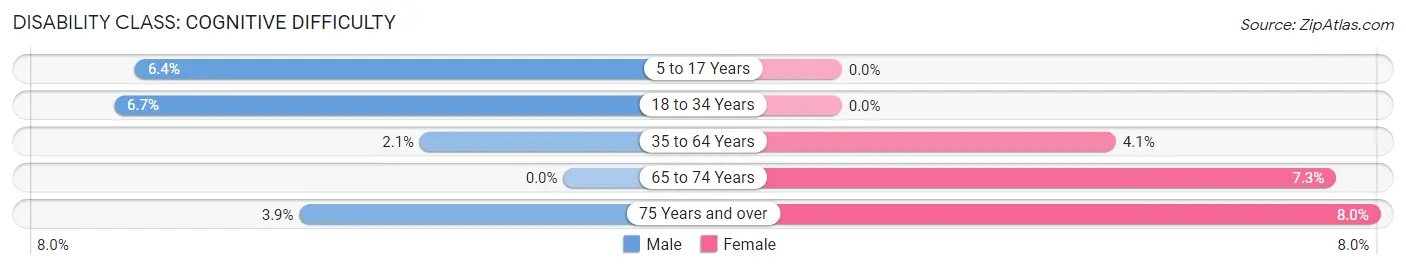
| Age Bracket | Male | Female |
| 5 to 17 Years | 7 (6.4%) | 0 (0.0%) |
| 18 to 34 Years | 4 (6.7%) | 0 (0.0%) |
| 35 to 64 Years | 5 (2.1%) | 10 (4.1%) |
| 65 to 74 Years | 0 (0.0%) | 8 (7.3%) |
| 75 Years and over | 2 (3.9%) | 4 (8.0%) |
Disability Class: Ambulatory Difficulty
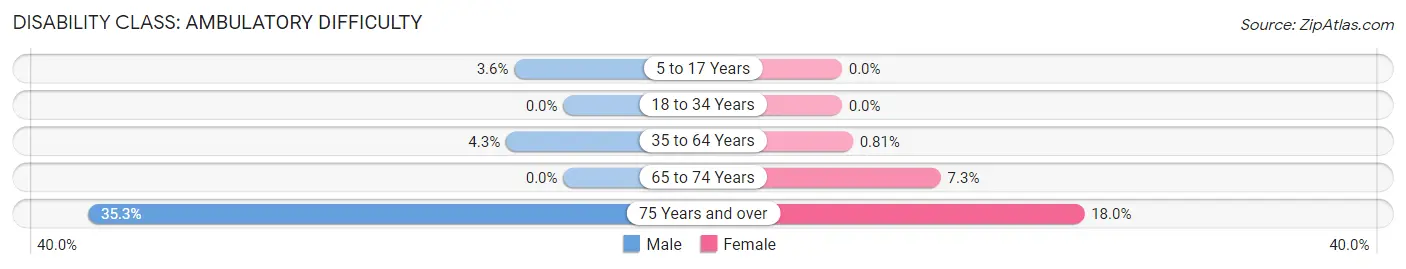
| Age Bracket | Male | Female |
| 5 to 17 Years | 4 (3.6%) | 0 (0.0%) |
| 18 to 34 Years | 0 (0.0%) | 0 (0.0%) |
| 35 to 64 Years | 10 (4.3%) | 2 (0.8%) |
| 65 to 74 Years | 0 (0.0%) | 8 (7.3%) |
| 75 Years and over | 18 (35.3%) | 9 (18.0%) |
Disability Class: Self-Care Difficulty
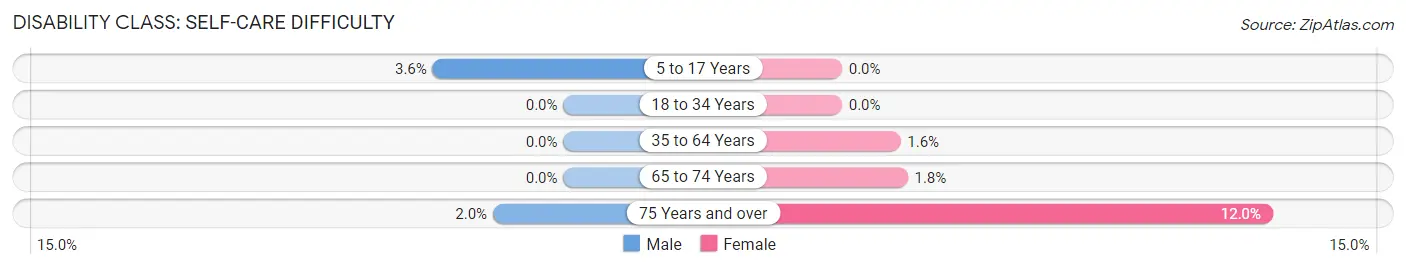
| Age Bracket | Male | Female |
| 5 to 17 Years | 4 (3.6%) | 0 (0.0%) |
| 18 to 34 Years | 0 (0.0%) | 0 (0.0%) |
| 35 to 64 Years | 0 (0.0%) | 4 (1.6%) |
| 65 to 74 Years | 0 (0.0%) | 2 (1.8%) |
| 75 Years and over | 1 (2.0%) | 6 (12.0%) |
Technology Access in Fremont Hills
Computing Device Access in Fremont Hills
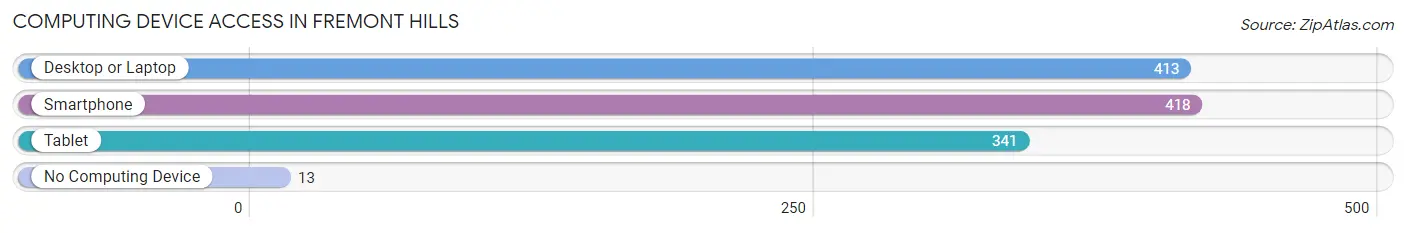
| Device Type | # Households | % Households |
| Desktop or Laptop | 413 | 92.6% |
| Smartphone | 418 | 93.7% |
| Tablet | 341 | 76.5% |
| No Computing Device | 13 | 2.9% |
| Total | 446 | 100.0% |
Internet Access in Fremont Hills
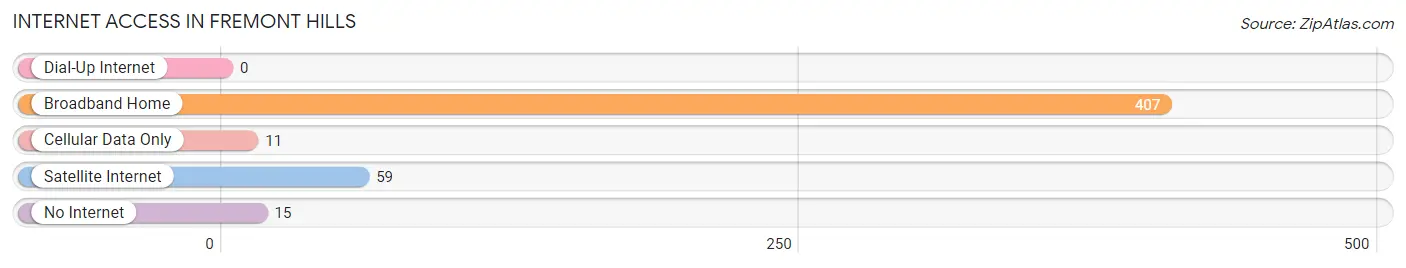
| Internet Type | # Households | % Households |
| Dial-Up Internet | 0 | 0.0% |
| Broadband Home | 407 | 91.3% |
| Cellular Data Only | 11 | 2.5% |
| Satellite Internet | 59 | 13.2% |
| No Internet | 15 | 3.4% |
| Total | 446 | 100.0% |
Fremont Hills Summary
Fremont Hills is a small unincorporated community located in St. Louis County, Missouri. It is situated in the northwest corner of the county, just south of the city of St. Louis. The community is bordered by the Missouri River to the east, the Mississippi River to the west, and the Meramec River to the south.
History
Fremont Hills was first settled in the early 1800s by German immigrants. The area was originally known as “Fremont”, after the explorer John C. Fremont. The name was changed to “Fremont Hills” in the late 1800s when the area was annexed by St. Louis County.
The area was primarily agricultural until the 1950s, when the population began to grow rapidly. This growth was due to the construction of the nearby St. Louis International Airport, which brought many new jobs to the area.
Geography
Fremont Hills is located in the northwest corner of St. Louis County, just south of the city of St. Louis. The community is bordered by the Missouri River to the east, the Mississippi River to the west, and the Meramec River to the south.
The area is mostly flat, with some rolling hills in the northern part of the community. The soil is mostly clay and loam, with some sand and gravel. The climate is humid continental, with hot summers and cold winters.
Economy
Fremont Hills is primarily a residential community, with most of its residents commuting to nearby St. Louis for work. The area is home to several small businesses, including a few restaurants, a grocery store, and a few retail stores.
The area is also home to several industrial parks, which provide jobs in manufacturing, warehousing, and distribution. The largest employer in the area is the St. Louis International Airport, which provides jobs in aviation, transportation, and logistics.
Demographics
As of the 2010 census, the population of Fremont Hills was 4,845. The racial makeup of the community was 79.3% White, 15.2% African American, 0.7% Native American, 1.2% Asian, and 3.6% from other races.
The median household income in Fremont Hills was $50,945, and the median family income was $60,945. The per capita income was $25,945. The poverty rate was 8.3%.
Conclusion
Fremont Hills is a small unincorporated community located in St. Louis County, Missouri. It is situated in the northwest corner of the county, just south of the city of St. Louis. The community is bordered by the Missouri River to the east, the Mississippi River to the west, and the Meramec River to the south. The area was primarily agricultural until the 1950s, when the population began to grow rapidly due to the construction of the nearby St. Louis International Airport. Today, Fremont Hills is primarily a residential community, with most of its residents commuting to nearby St. Louis for work. The area is also home to several small businesses, industrial parks, and the St. Louis International Airport. As of the 2010 census, the population of Fremont Hills was 4,845, with a median household income of $50,945 and a median family income of $60,945.
Common Questions
What is Per Capita Income in Fremont Hills?
Per Capita income in Fremont Hills is $59,792.
What is the Median Family Income in Fremont Hills?
Median Family Income in Fremont Hills is $160,500.
What is the Median Household income in Fremont Hills?
Median Household Income in Fremont Hills is $128,333.
What is Income or Wage Gap in Fremont Hills?
Income or Wage Gap in Fremont Hills is 47.2%.
Women in Fremont Hills earn 52.8 cents for every dollar earned by a man.
What is Inequality or Gini Index in Fremont Hills?
Inequality or Gini Index in Fremont Hills is 0.45.
What is the Total Population of Fremont Hills?
Total Population of Fremont Hills is 1,272.
What is the Total Male Population of Fremont Hills?
Total Male Population of Fremont Hills is 565.
What is the Total Female Population of Fremont Hills?
Total Female Population of Fremont Hills is 707.
What is the Ratio of Males per 100 Females in Fremont Hills?
There are 79.92 Males per 100 Females in Fremont Hills.
What is the Ratio of Females per 100 Males in Fremont Hills?
There are 125.13 Females per 100 Males in Fremont Hills.
What is the Median Population Age in Fremont Hills?
Median Population Age in Fremont Hills is 40.5 Years.
What is the Average Family Size in Fremont Hills
Average Family Size in Fremont Hills is 3.1 People.
What is the Average Household Size in Fremont Hills
Average Household Size in Fremont Hills is 2.9 People.
How Large is the Labor Force in Fremont Hills?
There are 558 People in the Labor Forcein in Fremont Hills.
What is the Percentage of People in the Labor Force in Fremont Hills?
58.0% of People are in the Labor Force in Fremont Hills.
What is the Unemployment Rate in Fremont Hills?
Unemployment Rate in Fremont Hills is 2.9%.