Gateway, AK Map & Demographics
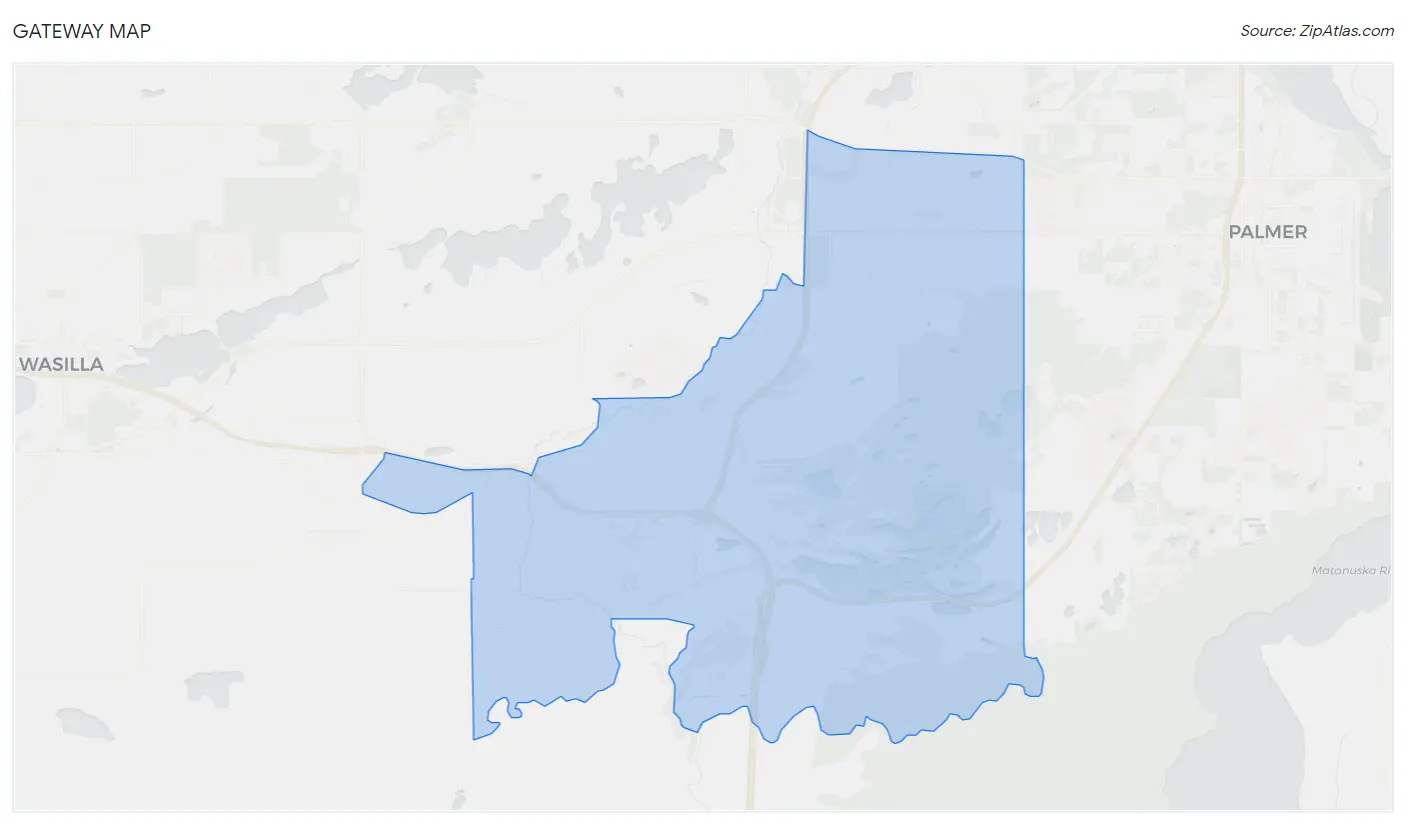
Gateway Map
Gateway Overview
$48,346
PER CAPITA INCOME
$122,336
AVG FAMILY INCOME
$115,735
AVG HOUSEHOLD INCOME
27.0%
WAGE / INCOME GAP [ % ]
73.0¢/ $1
WAGE / INCOME GAP [ $ ]
0.38
INEQUALITY / GINI INDEX
6,241
TOTAL POPULATION
3,071
MALE POPULATION
3,170
FEMALE POPULATION
96.88
MALES / 100 FEMALES
103.22
FEMALES / 100 MALES
33.2
MEDIAN AGE
3.4
AVG FAMILY SIZE
3.1
AVG HOUSEHOLD SIZE
3,141
LABOR FORCE [ PEOPLE ]
73.5%
PERCENT IN LABOR FORCE
5.3%
UNEMPLOYMENT RATE
Income in Gateway
Income Overview in Gateway
Per Capita Income in Gateway is $48,346, while median incomes of families and households are $122,336 and $115,735 respectively.
| Characteristic | Number | Measure |
| Per Capita Income | 6,241 | $48,346 |
| Median Family Income | 1,596 | $122,336 |
| Mean Family Income | 1,596 | $155,113 |
| Median Household Income | 2,004 | $115,735 |
| Mean Household Income | 2,004 | $150,905 |
| Income Deficit | 1,596 | $0 |
| Wage / Income Gap (%) | 6,241 | 27.05% |
| Wage / Income Gap ($) | 6,241 | 72.95¢ per $1 |
| Gini / Inequality Index | 6,241 | 0.38 |
Earnings by Sex in Gateway
Average Earnings in Gateway are $66,422, $75,446 for men and $55,038 for women, a difference of 27.1%.
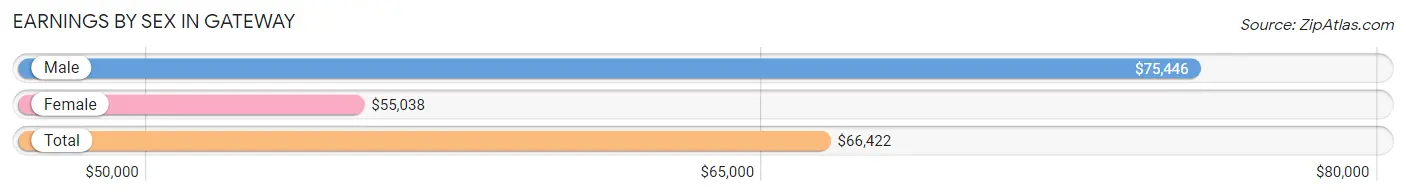
| Sex | Number | Average Earnings |
| Male | 1,638 (51.4%) | $75,446 |
| Female | 1,551 (48.6%) | $55,038 |
| Total | 3,189 (100.0%) | $66,422 |
Earnings by Sex by Income Bracket in Gateway
The most common earnings brackets in Gateway are $100,000+ for men (531 | 32.4%) and $100,000+ for women (323 | 20.8%).
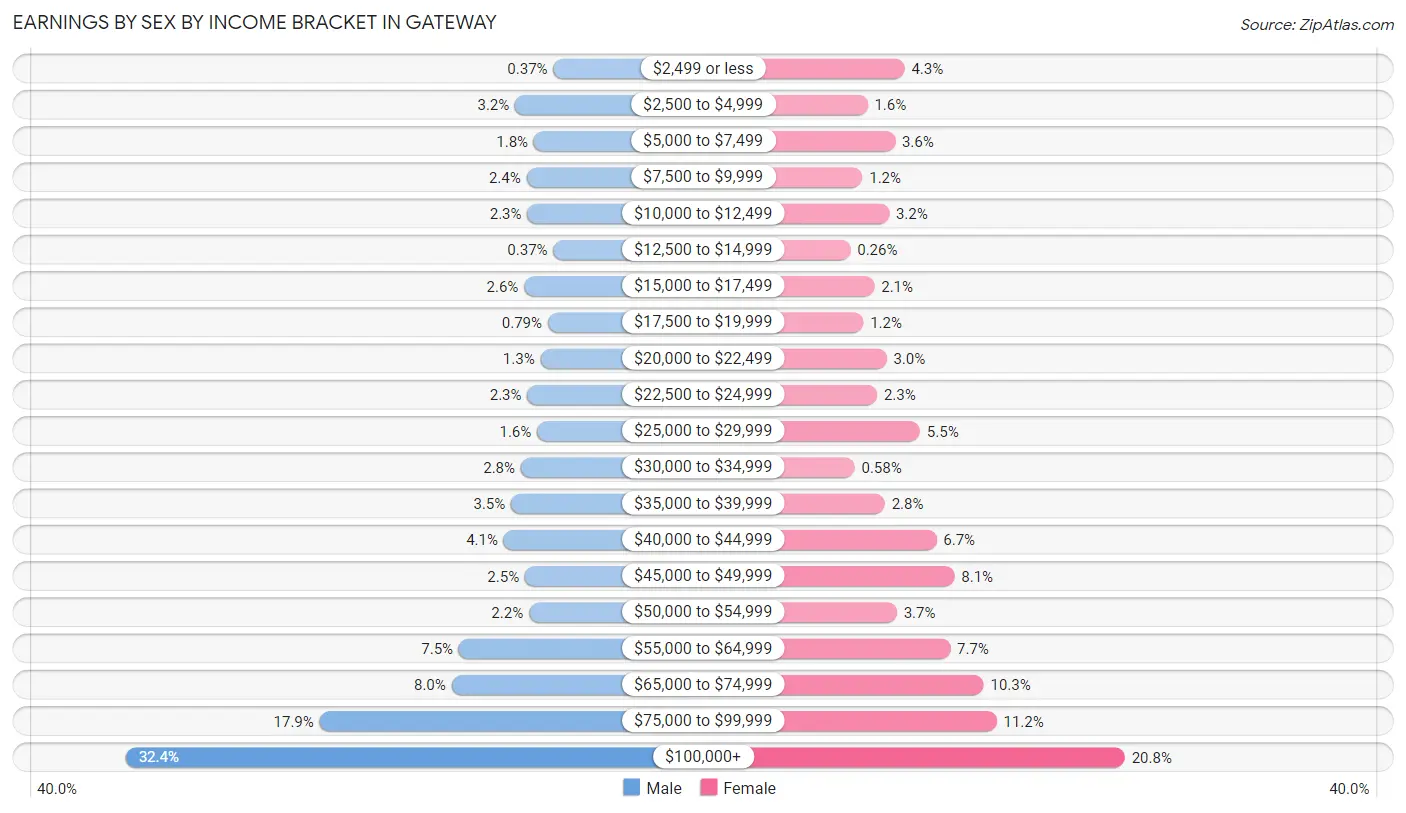
| Income | Male | Female |
| $2,499 or less | 6 (0.4%) | 67 (4.3%) |
| $2,500 to $4,999 | 53 (3.2%) | 24 (1.5%) |
| $5,000 to $7,499 | 30 (1.8%) | 56 (3.6%) |
| $7,500 to $9,999 | 39 (2.4%) | 18 (1.2%) |
| $10,000 to $12,499 | 38 (2.3%) | 49 (3.2%) |
| $12,500 to $14,999 | 6 (0.4%) | 4 (0.3%) |
| $15,000 to $17,499 | 42 (2.6%) | 32 (2.1%) |
| $17,500 to $19,999 | 13 (0.8%) | 19 (1.2%) |
| $20,000 to $22,499 | 22 (1.3%) | 46 (3.0%) |
| $22,500 to $24,999 | 38 (2.3%) | 35 (2.3%) |
| $25,000 to $29,999 | 26 (1.6%) | 85 (5.5%) |
| $30,000 to $34,999 | 46 (2.8%) | 9 (0.6%) |
| $35,000 to $39,999 | 58 (3.5%) | 44 (2.8%) |
| $40,000 to $44,999 | 67 (4.1%) | 104 (6.7%) |
| $45,000 to $49,999 | 41 (2.5%) | 125 (8.1%) |
| $50,000 to $54,999 | 36 (2.2%) | 58 (3.7%) |
| $55,000 to $64,999 | 122 (7.4%) | 120 (7.7%) |
| $65,000 to $74,999 | 131 (8.0%) | 159 (10.2%) |
| $75,000 to $99,999 | 293 (17.9%) | 174 (11.2%) |
| $100,000+ | 531 (32.4%) | 323 (20.8%) |
| Total | 1,638 (100.0%) | 1,551 (100.0%) |
Earnings by Sex by Educational Attainment in Gateway
Average earnings in Gateway are $84,559 for men and $61,750 for women, a difference of 27.0%. Men with an educational attainment of graduate degree enjoy the highest average annual earnings of $147,969, while those with less than high school education earn the least with $50,625. Women with an educational attainment of graduate degree earn the most with the average annual earnings of $98,500, while those with high school diploma education have the smallest earnings of $45,294.
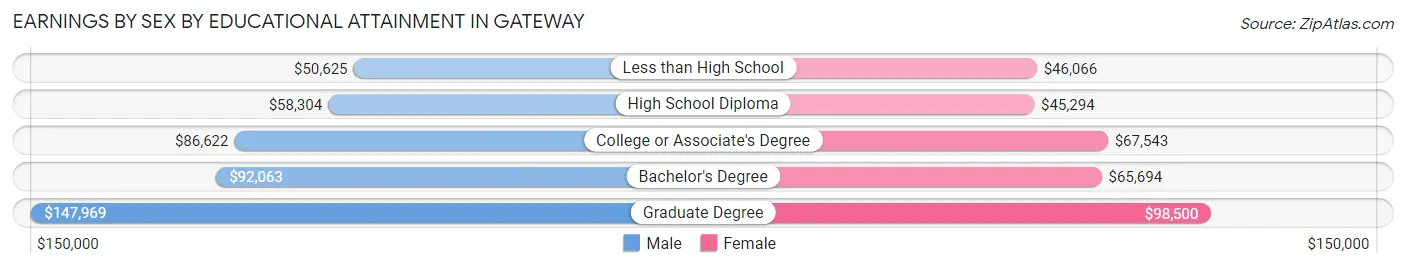
| Educational Attainment | Male Income | Female Income |
| Less than High School | $50,625 | $46,066 |
| High School Diploma | $58,304 | $45,294 |
| College or Associate's Degree | $86,622 | $67,543 |
| Bachelor's Degree | $92,063 | $65,694 |
| Graduate Degree | $147,969 | $98,500 |
| Total | $84,559 | $61,750 |
Family Income in Gateway
Family Income Brackets in Gateway
According to the Gateway family income data, there are 391 families falling into the $200,000+ income range, which is the most common income bracket and makes up 24.5% of all families. Conversely, the $10,000 to $14,999 income bracket is the least frequent group with only 5 families (0.3%) belonging to this category.
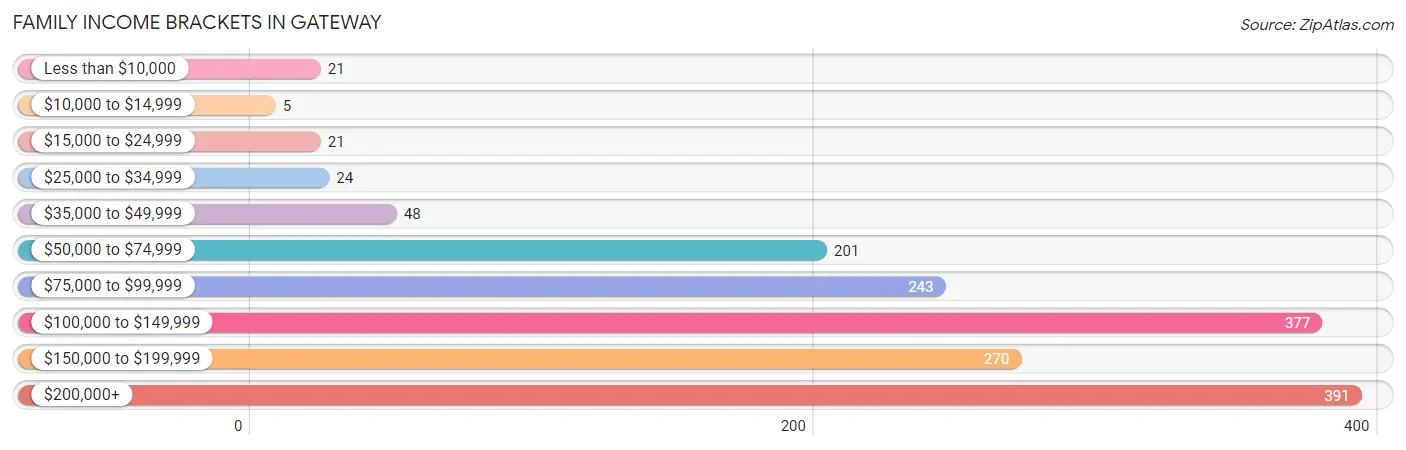
| Income Bracket | # Families | % Families |
| Less than $10,000 | 21 | 1.3% |
| $10,000 to $14,999 | 5 | 0.3% |
| $15,000 to $24,999 | 21 | 1.3% |
| $25,000 to $34,999 | 24 | 1.5% |
| $35,000 to $49,999 | 48 | 3.0% |
| $50,000 to $74,999 | 201 | 12.6% |
| $75,000 to $99,999 | 243 | 15.2% |
| $100,000 to $149,999 | 377 | 23.6% |
| $150,000 to $199,999 | 270 | 16.9% |
| $200,000+ | 391 | 24.5% |
Family Income by Famaliy Size in Gateway
4-person families (381 | 23.9%) account for the highest median family income in Gateway with $167,132 per family, while 2-person families (600 | 37.6%) have the highest median income of $57,308 per family member.
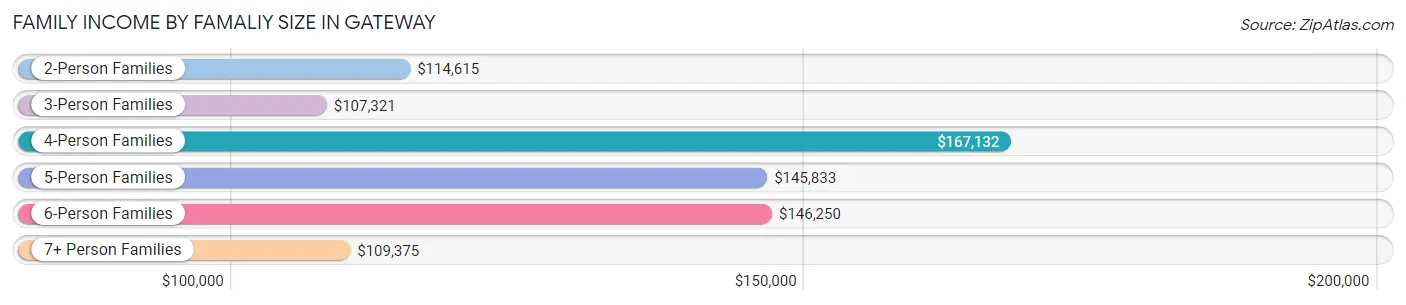
| Income Bracket | # Families | Median Income |
| 2-Person Families | 600 (37.6%) | $114,615 |
| 3-Person Families | 267 (16.7%) | $107,321 |
| 4-Person Families | 381 (23.9%) | $167,132 |
| 5-Person Families | 222 (13.9%) | $145,833 |
| 6-Person Families | 76 (4.8%) | $146,250 |
| 7+ Person Families | 50 (3.1%) | $109,375 |
| Total | 1,596 (100.0%) | $122,336 |
Family Income by Number of Earners in Gateway
The median family income in Gateway is $122,336, with families comprising 3+ earners (167) having the highest median family income of $186,875, while families with no earners (96) have the lowest median family income of $89,500, accounting for 10.5% and 6.0% of families, respectively.
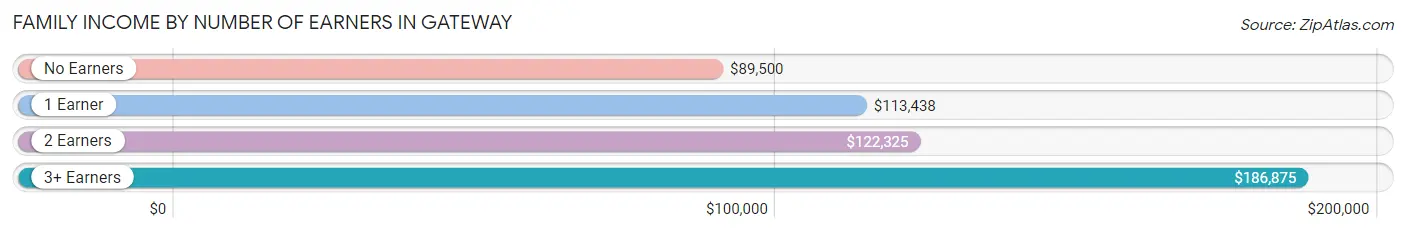
| Number of Earners | # Families | Median Income |
| No Earners | 96 (6.0%) | $89,500 |
| 1 Earner | 495 (31.0%) | $113,438 |
| 2 Earners | 838 (52.5%) | $122,325 |
| 3+ Earners | 167 (10.5%) | $186,875 |
| Total | 1,596 (100.0%) | $122,336 |
Household Income in Gateway
Household Income Brackets in Gateway
With 495 households falling in the category, the $200,000+ income range is the most frequent in Gateway, accounting for 24.7% of all households.
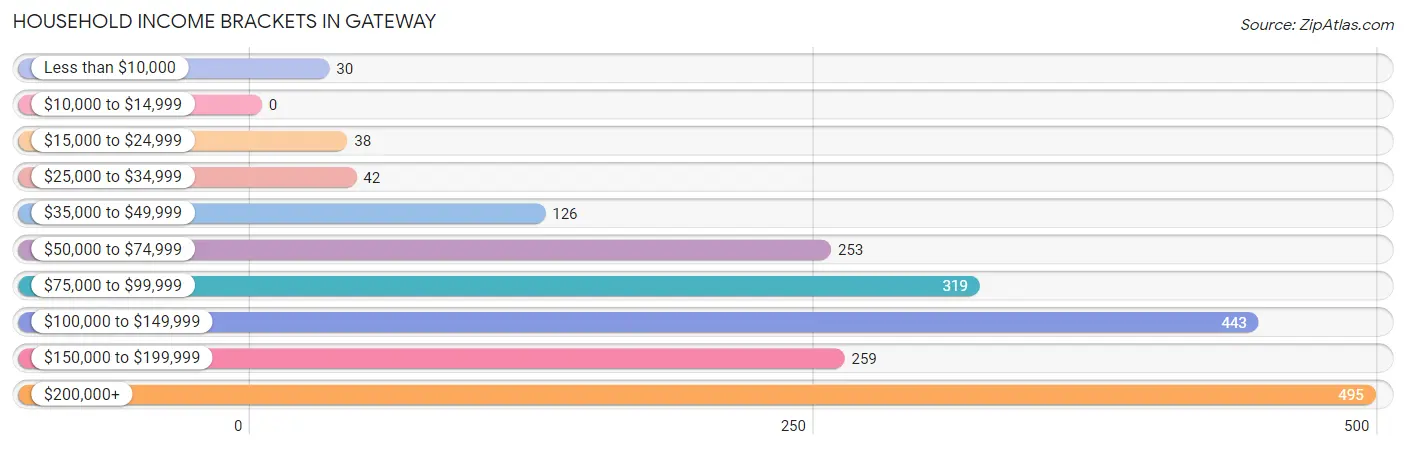
| Income Bracket | # Households | % Households |
| Less than $10,000 | 30 | 1.5% |
| $10,000 to $14,999 | 0 | 0.0% |
| $15,000 to $24,999 | 38 | 1.9% |
| $25,000 to $34,999 | 42 | 2.1% |
| $35,000 to $49,999 | 126 | 6.3% |
| $50,000 to $74,999 | 253 | 12.6% |
| $75,000 to $99,999 | 319 | 15.9% |
| $100,000 to $149,999 | 443 | 22.1% |
| $150,000 to $199,999 | 259 | 12.9% |
| $200,000+ | 495 | 24.7% |
Household Income by Householder Age in Gateway
The median household income in Gateway is $115,735, with the highest median household income of $135,156 found in the 45 to 64 years age bracket for the primary householder. A total of 747 households (37.3%) fall into this category. Meanwhile, the 15 to 24 years age bracket for the primary householder has the lowest median household income of $71,146, with 69 households (3.4%) in this group.
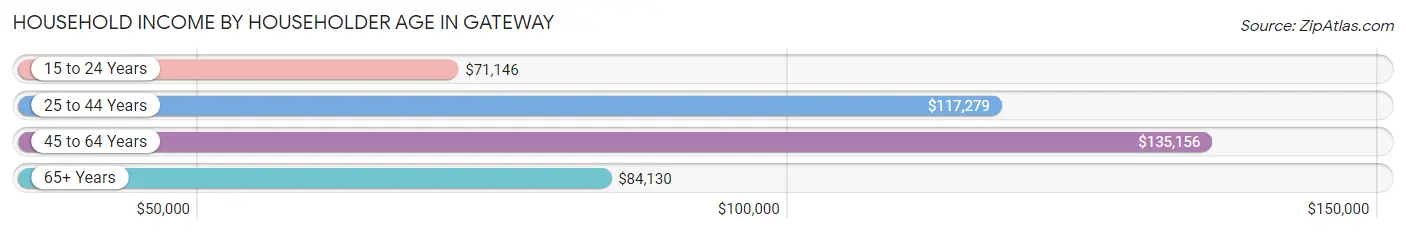
| Income Bracket | # Households | Median Income |
| 15 to 24 Years | 69 (3.4%) | $71,146 |
| 25 to 44 Years | 906 (45.2%) | $117,279 |
| 45 to 64 Years | 747 (37.3%) | $135,156 |
| 65+ Years | 282 (14.1%) | $84,130 |
| Total | 2,004 (100.0%) | $115,735 |
Poverty in Gateway
Income Below Poverty by Sex and Age in Gateway
With 2.1% poverty level for males and 3.5% for females among the residents of Gateway, 16 and 17 year old males and 16 and 17 year old females are the most vulnerable to poverty, with 24 males (21.0%) and 11 females (12.2%) in their respective age groups living below the poverty level.
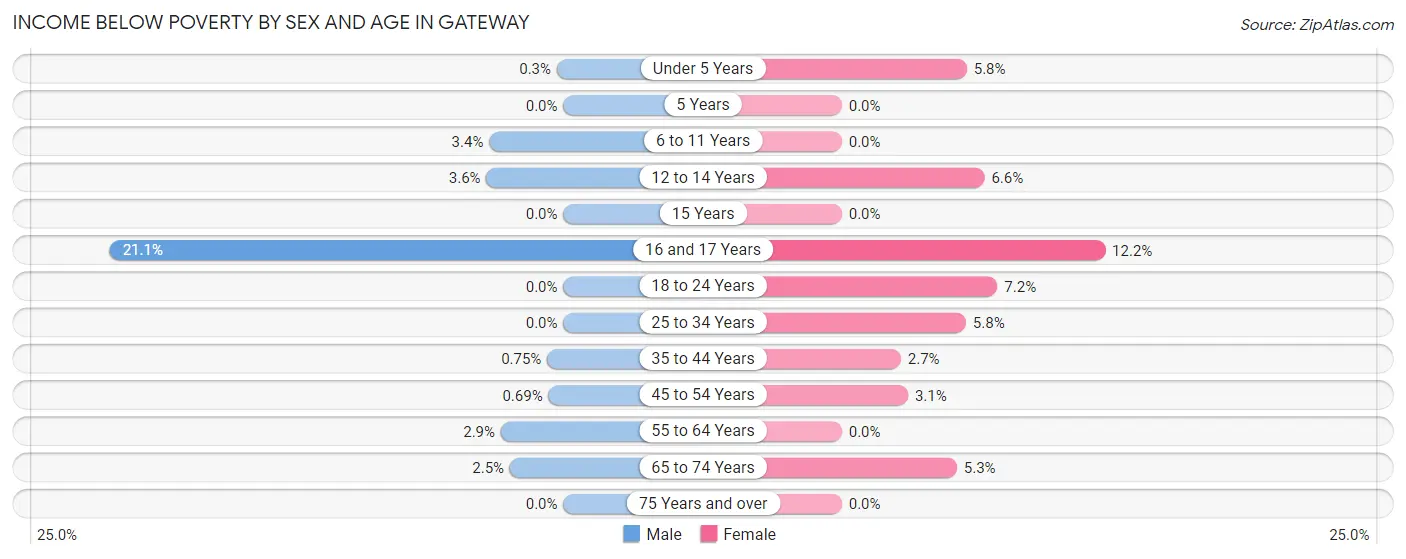
| Age Bracket | Male | Female |
| Under 5 Years | 1 (0.3%) | 13 (5.8%) |
| 5 Years | 0 (0.0%) | 0 (0.0%) |
| 6 to 11 Years | 12 (3.4%) | 0 (0.0%) |
| 12 to 14 Years | 8 (3.6%) | 9 (6.6%) |
| 15 Years | 0 (0.0%) | 0 (0.0%) |
| 16 and 17 Years | 24 (21.0%) | 11 (12.2%) |
| 18 to 24 Years | 0 (0.0%) | 14 (7.2%) |
| 25 to 34 Years | 0 (0.0%) | 25 (5.8%) |
| 35 to 44 Years | 4 (0.7%) | 16 (2.7%) |
| 45 to 54 Years | 2 (0.7%) | 12 (3.1%) |
| 55 to 64 Years | 8 (2.9%) | 0 (0.0%) |
| 65 to 74 Years | 4 (2.5%) | 11 (5.3%) |
| 75 Years and over | 0 (0.0%) | 0 (0.0%) |
| Total | 63 (2.1%) | 111 (3.5%) |
Income Above Poverty by Sex and Age in Gateway
According to the poverty statistics in Gateway, males aged 5 years and females aged 5 years are the age groups that are most secure financially, with 100.0% of males and 100.0% of females in these age groups living above the poverty line.
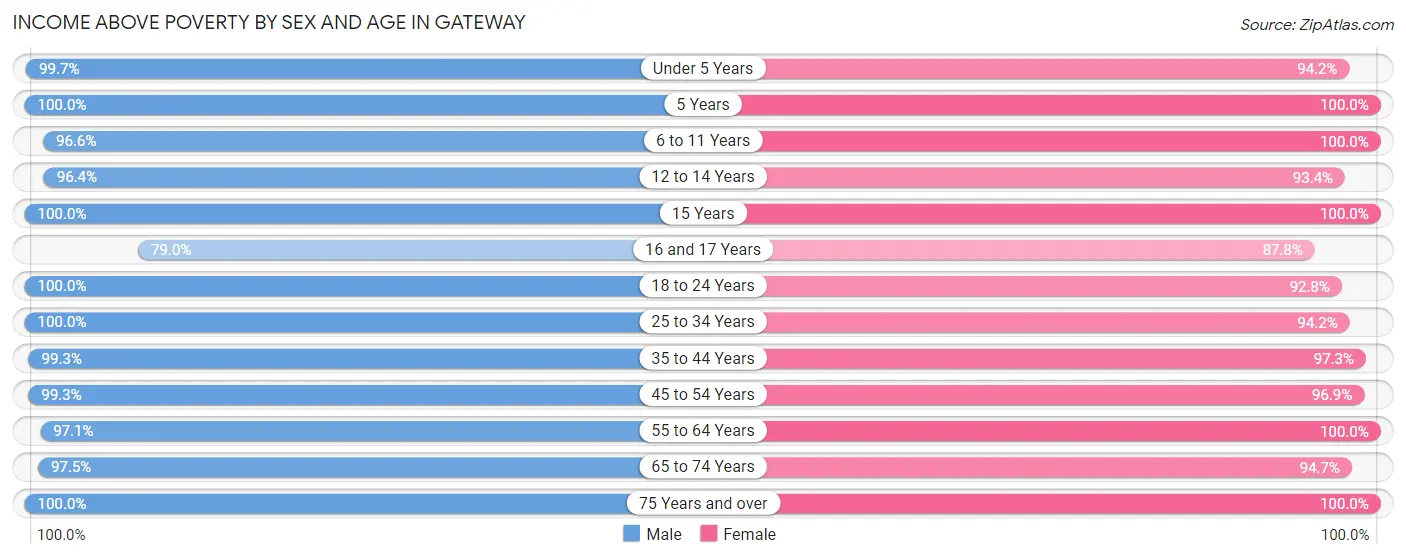
| Age Bracket | Male | Female |
| Under 5 Years | 333 (99.7%) | 211 (94.2%) |
| 5 Years | 78 (100.0%) | 57 (100.0%) |
| 6 to 11 Years | 337 (96.6%) | 419 (100.0%) |
| 12 to 14 Years | 216 (96.4%) | 127 (93.4%) |
| 15 Years | 51 (100.0%) | 35 (100.0%) |
| 16 and 17 Years | 90 (78.9%) | 79 (87.8%) |
| 18 to 24 Years | 119 (100.0%) | 180 (92.8%) |
| 25 to 34 Years | 448 (100.0%) | 409 (94.2%) |
| 35 to 44 Years | 531 (99.3%) | 569 (97.3%) |
| 45 to 54 Years | 288 (99.3%) | 379 (96.9%) |
| 55 to 64 Years | 268 (97.1%) | 275 (100.0%) |
| 65 to 74 Years | 157 (97.5%) | 195 (94.7%) |
| 75 Years and over | 67 (100.0%) | 88 (100.0%) |
| Total | 2,983 (97.9%) | 3,023 (96.5%) |
Income Below Poverty Among Married-Couple Families in Gateway
The poverty statistics for married-couple families in Gateway show that 0.3% or 4 of the total 1,339 families live below the poverty line. Families with no children have the highest poverty rate of 0.6%, comprising of 4 families. On the other hand, families with 1 or 2 children have the lowest poverty rate of 0.0%, which includes 0 families.
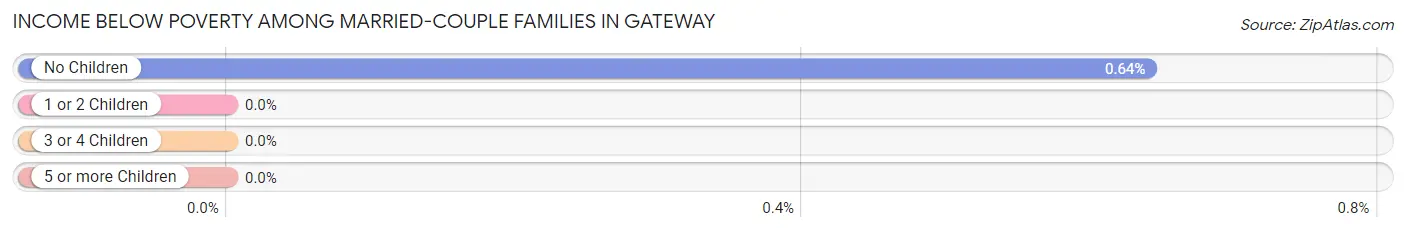
| Children | Above Poverty | Below Poverty |
| No Children | 620 (99.4%) | 4 (0.6%) |
| 1 or 2 Children | 450 (100.0%) | 0 (0.0%) |
| 3 or 4 Children | 220 (100.0%) | 0 (0.0%) |
| 5 or more Children | 45 (100.0%) | 0 (0.0%) |
| Total | 1,335 (99.7%) | 4 (0.3%) |
Income Below Poverty Among Single-Parent Households in Gateway
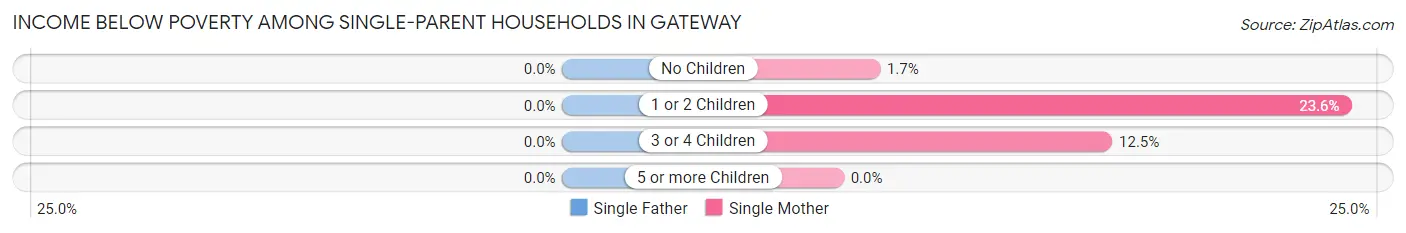
| Children | Single Father | Single Mother |
| No Children | 0 (0.0%) | 1 (1.7%) |
| 1 or 2 Children | 0 (0.0%) | 26 (23.6%) |
| 3 or 4 Children | 0 (0.0%) | 2 (12.5%) |
| 5 or more Children | 0 (0.0%) | 0 (0.0%) |
| Total | 0 (0.0%) | 29 (15.7%) |
Income Below Poverty Among Married-Couple vs Single-Parent Households in Gateway
The poverty data for Gateway shows that 4 of the married-couple family households (0.3%) and 29 of the single-parent households (11.3%) are living below the poverty level. Within the married-couple family households, those with no children have the highest poverty rate, with 4 households (0.6%) falling below the poverty line. Among the single-parent households, those with 1 or 2 children have the highest poverty rate, with 26 household (16.0%) living below poverty.
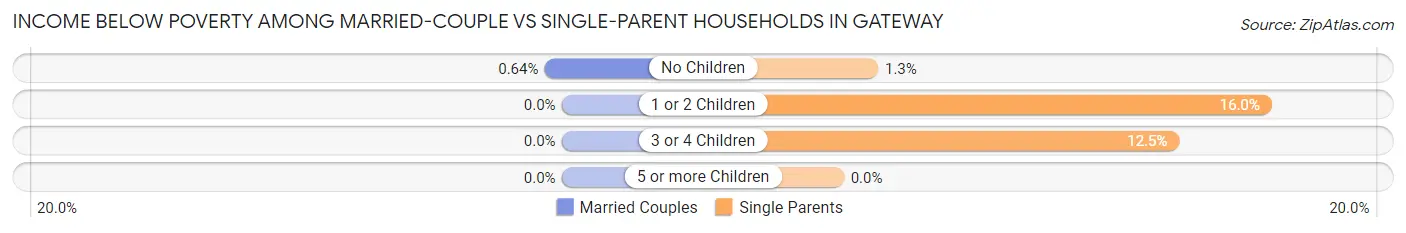
| Children | Married-Couple Families | Single-Parent Households |
| No Children | 4 (0.6%) | 1 (1.3%) |
| 1 or 2 Children | 0 (0.0%) | 26 (16.0%) |
| 3 or 4 Children | 0 (0.0%) | 2 (12.5%) |
| 5 or more Children | 0 (0.0%) | 0 (0.0%) |
| Total | 4 (0.3%) | 29 (11.3%) |
Race in Gateway
The most populous races in Gateway are White / Caucasian (4,709 | 75.4%), Two or more Races (771 | 12.3%), and Hispanic or Latino (688 | 11.0%).
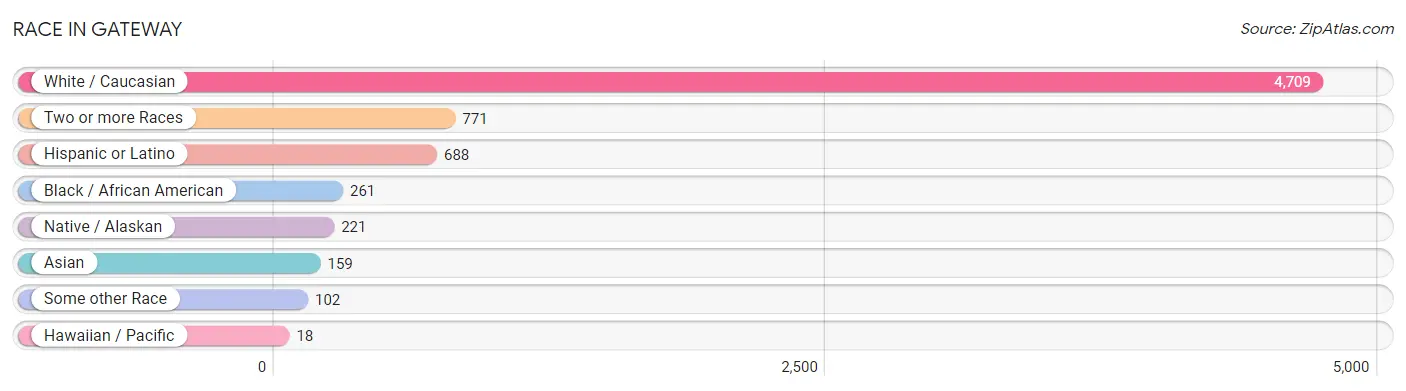
| Race | # Population | % Population |
| Asian | 159 | 2.5% |
| Black / African American | 261 | 4.2% |
| Hawaiian / Pacific | 18 | 0.3% |
| Hispanic or Latino | 688 | 11.0% |
| Native / Alaskan | 221 | 3.5% |
| White / Caucasian | 4,709 | 75.4% |
| Two or more Races | 771 | 12.3% |
| Some other Race | 102 | 1.6% |
| Total | 6,241 | 100.0% |
Ancestry in Gateway
The most populous ancestries reported in Gateway are German (1,043 | 16.7%), English (905 | 14.5%), Irish (890 | 14.3%), Mexican (384 | 6.1%), and Norwegian (300 | 4.8%), together accounting for 56.4% of all Gateway residents.
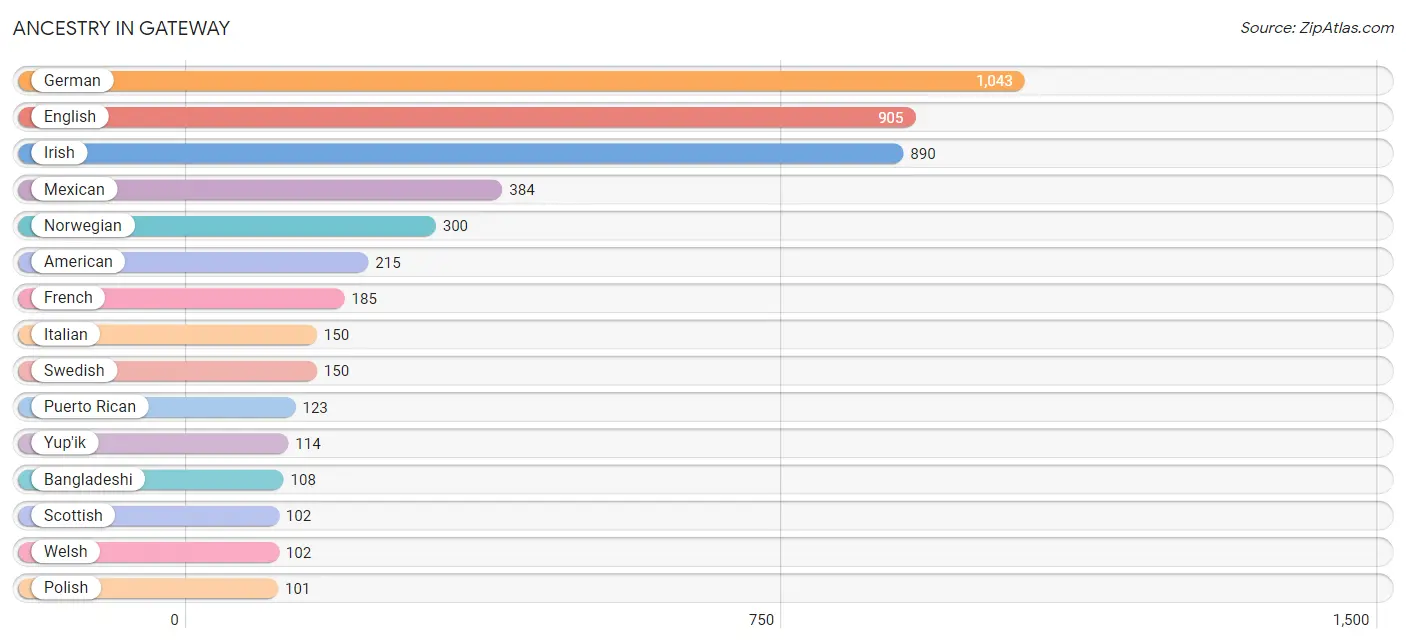
| Ancestry | # Population | % Population |
| African | 4 | 0.1% |
| Alaska Native | 80 | 1.3% |
| Alaskan Athabascan | 77 | 1.2% |
| Aleut | 13 | 0.2% |
| American | 215 | 3.4% |
| Apache | 1 | 0.0% |
| Australian | 4 | 0.1% |
| Bangladeshi | 108 | 1.7% |
| Bhutanese | 9 | 0.1% |
| Blackfeet | 14 | 0.2% |
| British | 62 | 1.0% |
| Burmese | 91 | 1.5% |
| Canadian | 36 | 0.6% |
| Central American | 46 | 0.7% |
| Cherokee | 92 | 1.5% |
| Chippewa | 4 | 0.1% |
| Choctaw | 14 | 0.2% |
| Croatian | 7 | 0.1% |
| Czech | 6 | 0.1% |
| Czechoslovakian | 4 | 0.1% |
| Danish | 62 | 1.0% |
| Dutch | 56 | 0.9% |
| Eastern European | 43 | 0.7% |
| English | 905 | 14.5% |
| European | 73 | 1.2% |
| Finnish | 34 | 0.5% |
| French | 185 | 3.0% |
| French American Indian | 65 | 1.0% |
| French Canadian | 29 | 0.5% |
| German | 1,043 | 16.7% |
| Greek | 20 | 0.3% |
| Guyanese | 15 | 0.2% |
| Hungarian | 17 | 0.3% |
| Icelander | 3 | 0.1% |
| Indian (Asian) | 46 | 0.7% |
| Inupiat | 82 | 1.3% |
| Iranian | 42 | 0.7% |
| Irish | 890 | 14.3% |
| Italian | 150 | 2.4% |
| Korean | 12 | 0.2% |
| Latvian | 3 | 0.1% |
| Lithuanian | 1 | 0.0% |
| Mexican | 384 | 6.1% |
| Northern European | 68 | 1.1% |
| Norwegian | 300 | 4.8% |
| Panamanian | 46 | 0.7% |
| Pennsylvania German | 16 | 0.3% |
| Polish | 101 | 1.6% |
| Portuguese | 20 | 0.3% |
| Puerto Rican | 123 | 2.0% |
| Romanian | 4 | 0.1% |
| Russian | 43 | 0.7% |
| Samoan | 86 | 1.4% |
| Scandinavian | 13 | 0.2% |
| Scotch-Irish | 65 | 1.0% |
| Scottish | 102 | 1.6% |
| Sioux | 7 | 0.1% |
| Spaniard | 9 | 0.1% |
| Spanish | 91 | 1.5% |
| Subsaharan African | 4 | 0.1% |
| Swedish | 150 | 2.4% |
| Swiss | 18 | 0.3% |
| Turkish | 14 | 0.2% |
| Ukrainian | 9 | 0.1% |
| Welsh | 102 | 1.6% |
| Yakama | 15 | 0.2% |
| Yup'ik | 114 | 1.8% | View All 67 Rows |
Immigrants in Gateway
The most numerous immigrant groups reported in Gateway came from Asia (103 | 1.7%), Europe (94 | 1.5%), South Eastern Asia (44 | 0.7%), Western Europe (38 | 0.6%), and Canada (35 | 0.6%), together accounting for 5.0% of all Gateway residents.
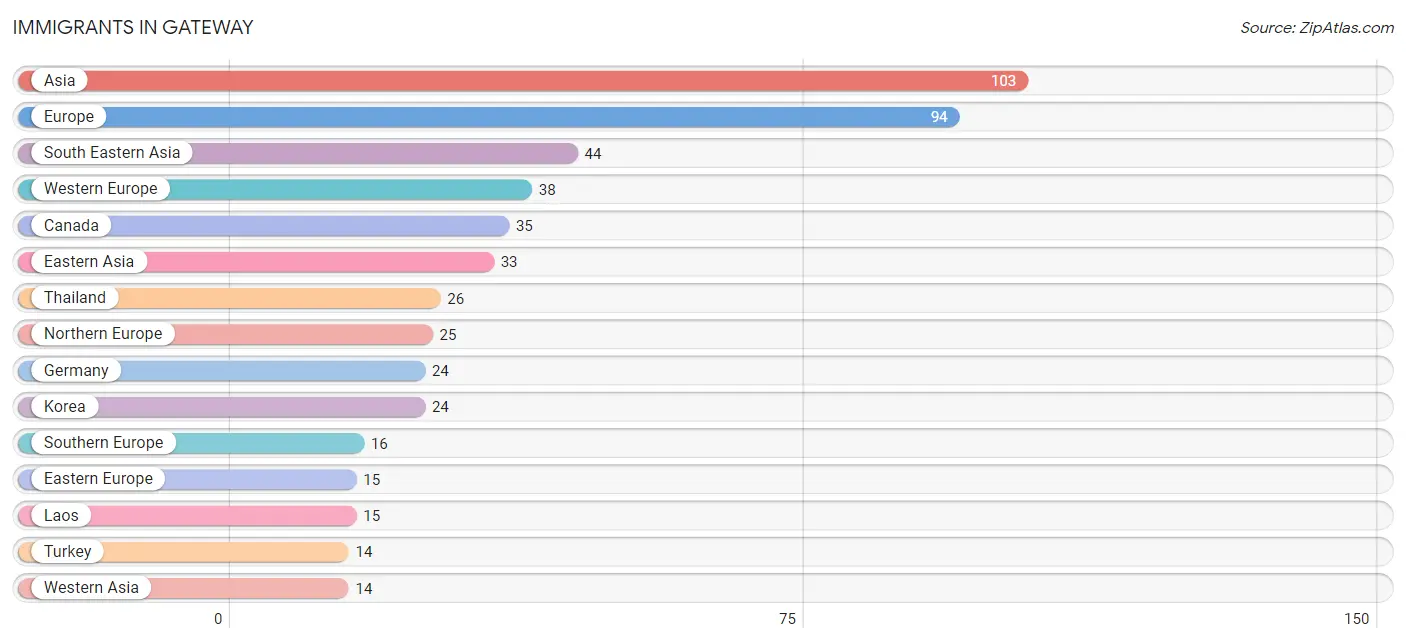
| Immigration Origin | # Population | % Population |
| Asia | 103 | 1.7% |
| Austria | 5 | 0.1% |
| Canada | 35 | 0.6% |
| China | 5 | 0.1% |
| Eastern Asia | 33 | 0.5% |
| Eastern Europe | 15 | 0.2% |
| Europe | 94 | 1.5% |
| France | 9 | 0.1% |
| Germany | 24 | 0.4% |
| Greece | 10 | 0.2% |
| Iran | 12 | 0.2% |
| Japan | 4 | 0.1% |
| Korea | 24 | 0.4% |
| Laos | 15 | 0.2% |
| Northern Europe | 25 | 0.4% |
| Norway | 7 | 0.1% |
| Philippines | 3 | 0.1% |
| Poland | 11 | 0.2% |
| Portugal | 6 | 0.1% |
| Romania | 4 | 0.1% |
| South Central Asia | 12 | 0.2% |
| South Eastern Asia | 44 | 0.7% |
| Southern Europe | 16 | 0.3% |
| Thailand | 26 | 0.4% |
| Turkey | 14 | 0.2% |
| Western Asia | 14 | 0.2% |
| Western Europe | 38 | 0.6% | View All 27 Rows |
Sex and Age in Gateway
Sex and Age in Gateway
The most populous age groups in Gateway are 10 to 14 Years (373 | 12.1%) for men and 5 to 9 Years (371 | 11.7%) for women.
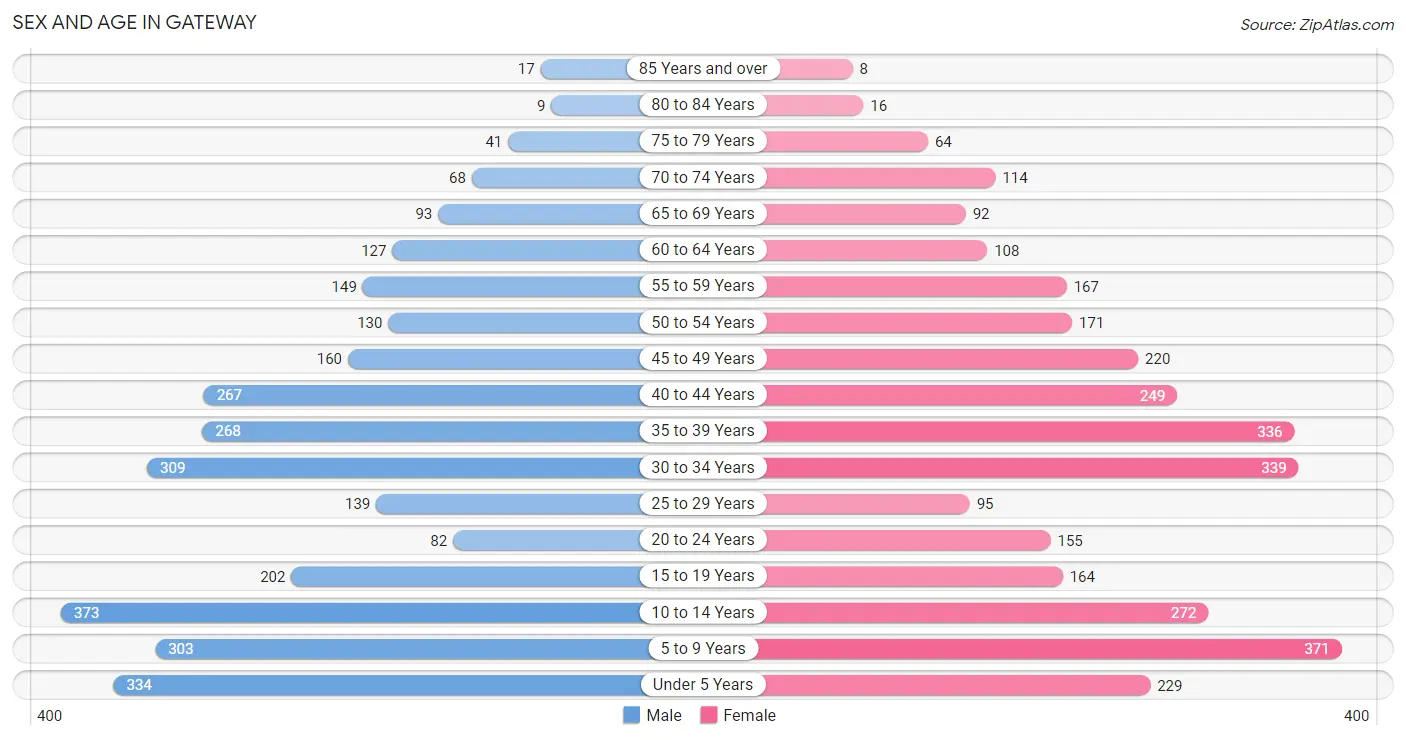
| Age Bracket | Male | Female |
| Under 5 Years | 334 (10.9%) | 229 (7.2%) |
| 5 to 9 Years | 303 (9.9%) | 371 (11.7%) |
| 10 to 14 Years | 373 (12.1%) | 272 (8.6%) |
| 15 to 19 Years | 202 (6.6%) | 164 (5.2%) |
| 20 to 24 Years | 82 (2.7%) | 155 (4.9%) |
| 25 to 29 Years | 139 (4.5%) | 95 (3.0%) |
| 30 to 34 Years | 309 (10.1%) | 339 (10.7%) |
| 35 to 39 Years | 268 (8.7%) | 336 (10.6%) |
| 40 to 44 Years | 267 (8.7%) | 249 (7.9%) |
| 45 to 49 Years | 160 (5.2%) | 220 (6.9%) |
| 50 to 54 Years | 130 (4.2%) | 171 (5.4%) |
| 55 to 59 Years | 149 (4.9%) | 167 (5.3%) |
| 60 to 64 Years | 127 (4.1%) | 108 (3.4%) |
| 65 to 69 Years | 93 (3.0%) | 92 (2.9%) |
| 70 to 74 Years | 68 (2.2%) | 114 (3.6%) |
| 75 to 79 Years | 41 (1.3%) | 64 (2.0%) |
| 80 to 84 Years | 9 (0.3%) | 16 (0.5%) |
| 85 Years and over | 17 (0.5%) | 8 (0.3%) |
| Total | 3,071 (100.0%) | 3,170 (100.0%) |
Families and Households in Gateway
Median Family Size in Gateway
The median family size in Gateway is 3.43 persons per family, with married-couple families (1,339 | 83.9%) accounting for the largest median family size of 3.5 persons per family. On the other hand, single male/father families (72 | 4.5%) represent the smallest median family size with 2.29 persons per family.
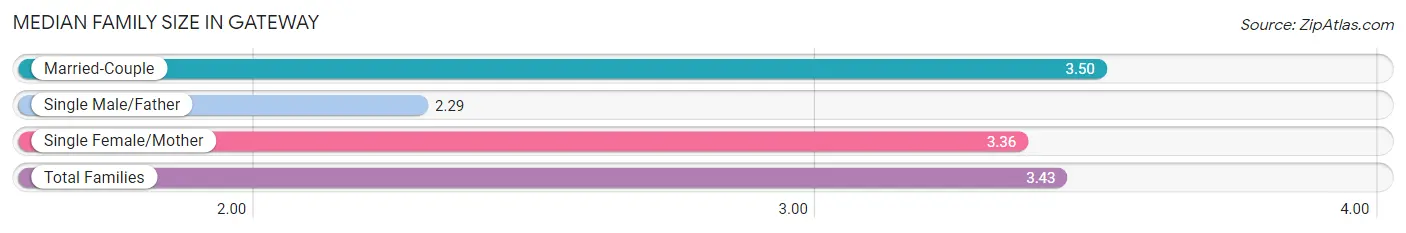
| Family Type | # Families | Family Size |
| Married-Couple | 1,339 (83.9%) | 3.50 |
| Single Male/Father | 72 (4.5%) | 2.29 |
| Single Female/Mother | 185 (11.6%) | 3.36 |
| Total Families | 1,596 (100.0%) | 3.43 |
Median Household Size in Gateway
The median household size in Gateway is 3.11 persons per household, with single female/mother households (185 | 9.2%) accounting for the largest median household size of 3.93 persons per household. non-family households (408 | 20.4%) represent the smallest median household size with 1.28 persons per household.
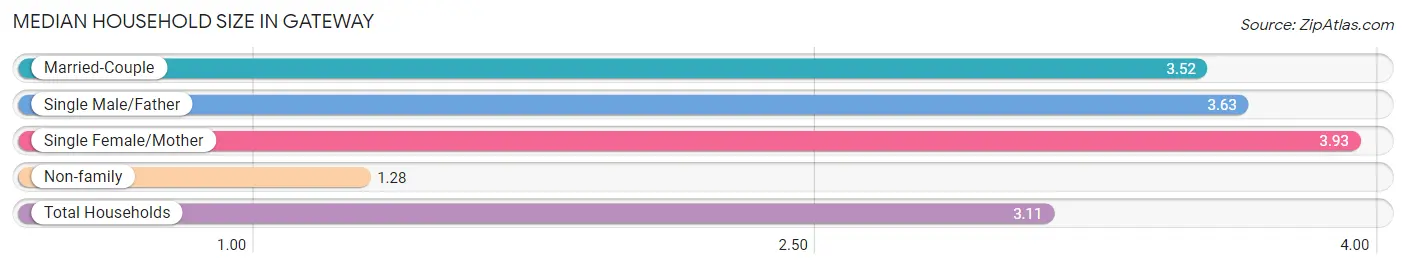
| Household Type | # Households | Household Size |
| Married-Couple | 1,339 (66.8%) | 3.52 |
| Single Male/Father | 72 (3.6%) | 3.63 |
| Single Female/Mother | 185 (9.2%) | 3.93 |
| Non-family | 408 (20.4%) | 1.28 |
| Total Households | 2,004 (100.0%) | 3.11 |
Household Size by Marriage Status in Gateway
Out of a total of 2,004 households in Gateway, 1,596 (79.6%) are family households, while 408 (20.4%) are nonfamily households. The most numerous type of family households are 2-person households, comprising 575, and the most common type of nonfamily households are 1-person households, comprising 306.
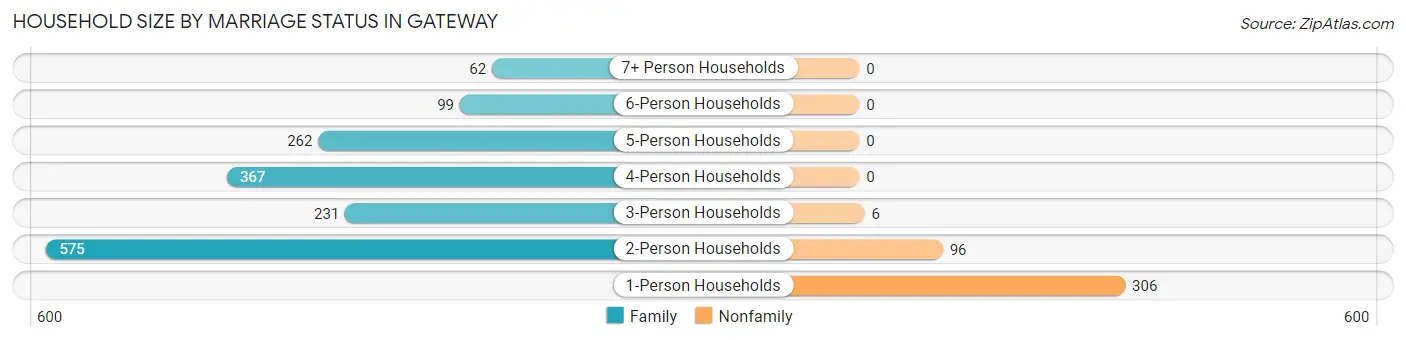
| Household Size | Family Households | Nonfamily Households |
| 1-Person Households | - | 306 (15.3%) |
| 2-Person Households | 575 (28.7%) | 96 (4.8%) |
| 3-Person Households | 231 (11.5%) | 6 (0.3%) |
| 4-Person Households | 367 (18.3%) | 0 (0.0%) |
| 5-Person Households | 262 (13.1%) | 0 (0.0%) |
| 6-Person Households | 99 (4.9%) | 0 (0.0%) |
| 7+ Person Households | 62 (3.1%) | 0 (0.0%) |
| Total | 1,596 (79.6%) | 408 (20.4%) |
Female Fertility in Gateway
Fertility by Age in Gateway
Average fertility rate in Gateway is 59.0 births per 1,000 women. Women in the age bracket of 35 to 50 years have the highest fertility rate with 91.0 births per 1,000 women. Women in the age bracket of 35 to 50 years acount for 82.1% of all women with births.
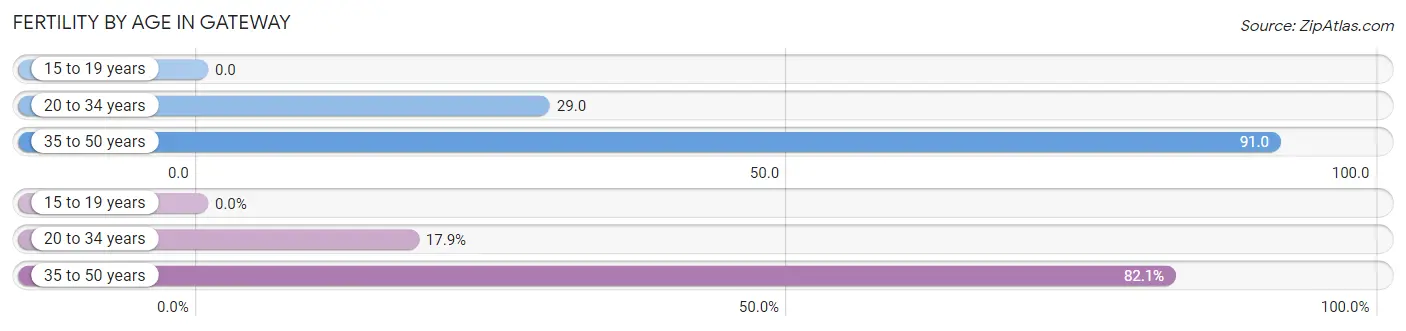
| Age Bracket | Women with Births | Births / 1,000 Women |
| 15 to 19 years | 0 (0.0%) | 0.0 |
| 20 to 34 years | 17 (17.9%) | 29.0 |
| 35 to 50 years | 78 (82.1%) | 91.0 |
| Total | 95 (100.0%) | 59.0 |
Fertility by Age by Marriage Status in Gateway
88.4% of women with births (95) in Gateway are married. The highest percentage of unmarried women with births falls into 20 to 34 years age bracket with 64.7% of them unmarried at the time of birth, while the lowest percentage of unmarried women with births belong to 35 to 50 years age bracket with 0.0% of them unmarried.
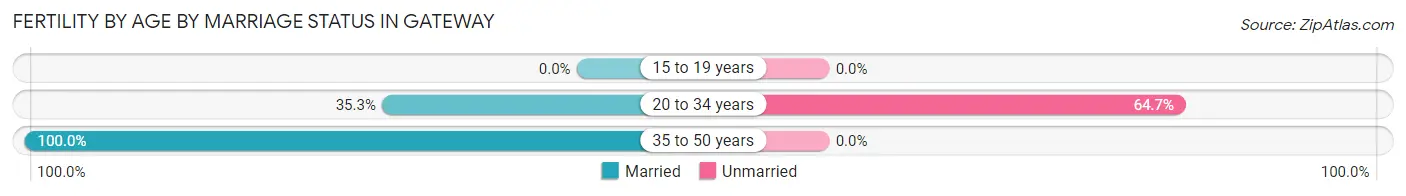
| Age Bracket | Married | Unmarried |
| 15 to 19 years | 0 (0.0%) | 0 (0.0%) |
| 20 to 34 years | 6 (35.3%) | 11 (64.7%) |
| 35 to 50 years | 78 (100.0%) | 0 (0.0%) |
| Total | 84 (88.4%) | 11 (11.6%) |
Fertility by Education in Gateway
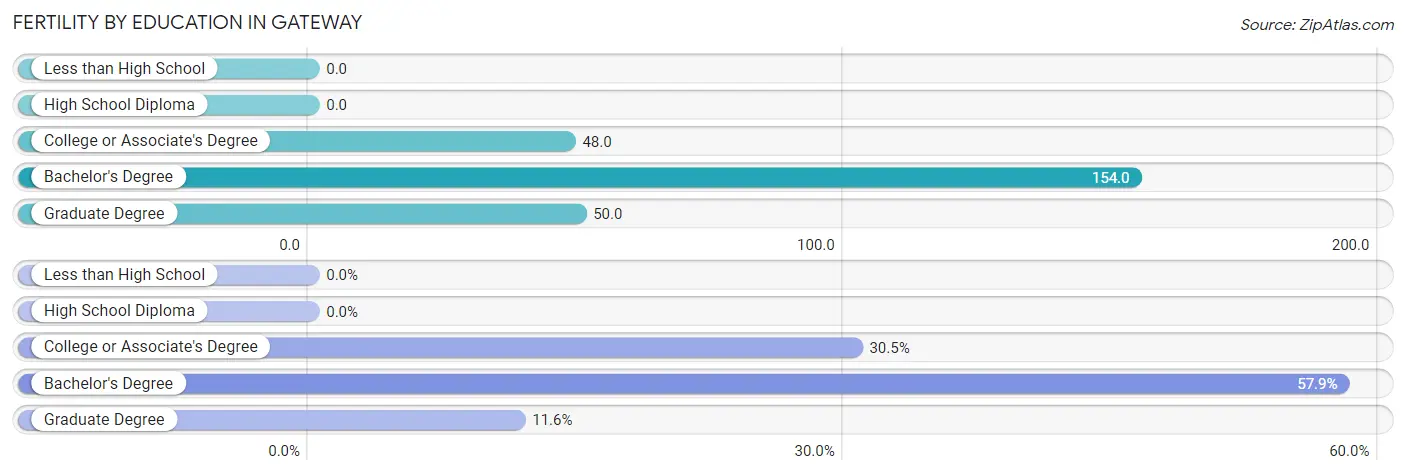
| Educational Attainment | Women with Births | Births / 1,000 Women |
| Less than High School | 0 (0.0%) | 0.0 |
| High School Diploma | 0 (0.0%) | 0.0 |
| College or Associate's Degree | 29 (30.5%) | 48.0 |
| Bachelor's Degree | 55 (57.9%) | 154.0 |
| Graduate Degree | 11 (11.6%) | 50.0 |
| Total | 95 (100.0%) | 59.0 |
Fertility by Education by Marriage Status in Gateway
11.6% of women with births in Gateway are unmarried. Women with the educational attainment of college or associate's degree are most likely to be married with 100.0% of them married at childbirth, while women with the educational attainment of graduate degree are least likely to be married with 100.0% of them unmarried at childbirth.
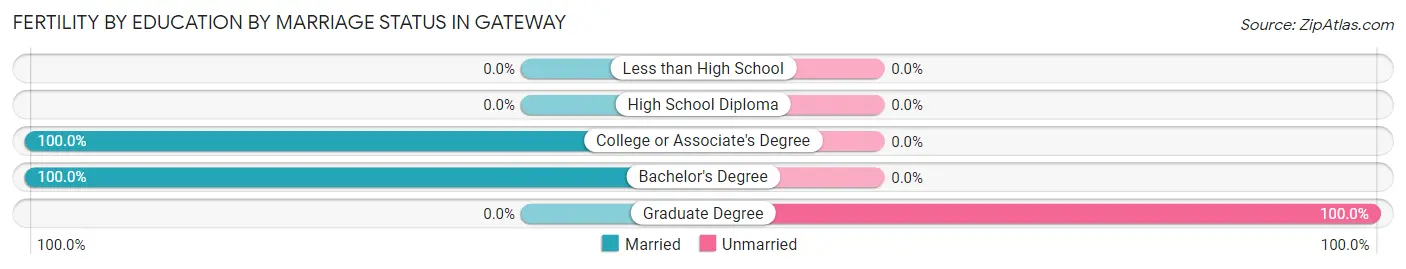
| Educational Attainment | Married | Unmarried |
| Less than High School | 0 (0.0%) | 0 (0.0%) |
| High School Diploma | 0 (0.0%) | 0 (0.0%) |
| College or Associate's Degree | 29 (100.0%) | 0 (0.0%) |
| Bachelor's Degree | 55 (100.0%) | 0 (0.0%) |
| Graduate Degree | 0 (0.0%) | 11 (100.0%) |
| Total | 84 (88.4%) | 11 (11.6%) |
Employment Characteristics in Gateway
Employment by Class of Employer in Gateway
Among the 2,960 employed individuals in Gateway, private company employees (1,525 | 51.5%), federal government employees (405 | 13.7%), and local government employees (303 | 10.2%) make up the most common classes of employment.
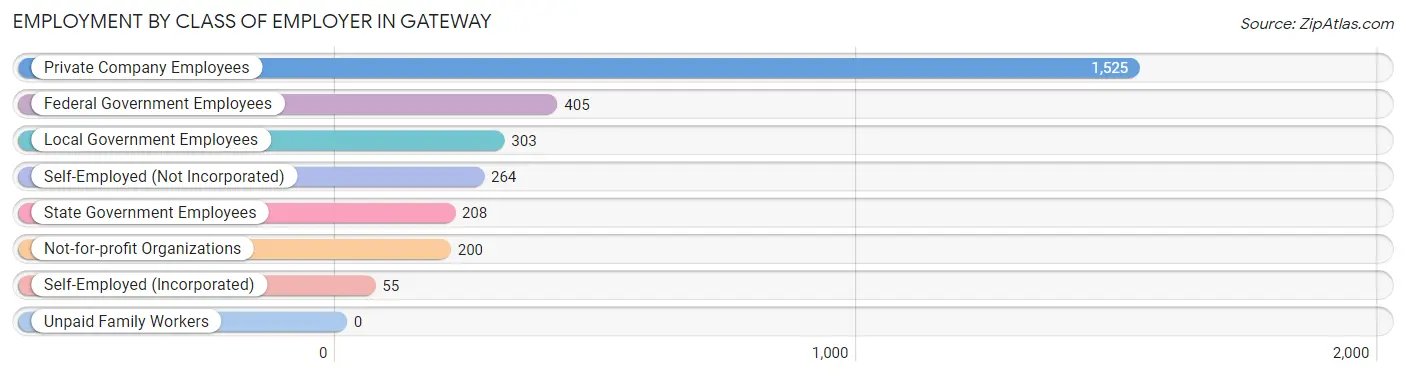
| Employer Class | # Employees | % Employees |
| Private Company Employees | 1,525 | 51.5% |
| Self-Employed (Incorporated) | 55 | 1.9% |
| Self-Employed (Not Incorporated) | 264 | 8.9% |
| Not-for-profit Organizations | 200 | 6.8% |
| Local Government Employees | 303 | 10.2% |
| State Government Employees | 208 | 7.0% |
| Federal Government Employees | 405 | 13.7% |
| Unpaid Family Workers | 0 | 0.0% |
| Total | 2,960 | 100.0% |
Employment Status by Age in Gateway
According to the labor force statistics for Gateway, out of the total population over 16 years of age (4,273), 73.5% or 3,141 individuals are in the labor force, with 5.3% or 166 of them unemployed. The age group with the highest labor force participation rate is 25 to 29 years, with 94.4% or 221 individuals in the labor force. Within the labor force, the 16 to 19 years age range has the highest percentage of unemployed individuals, with 14.5% or 18 of them being unemployed.
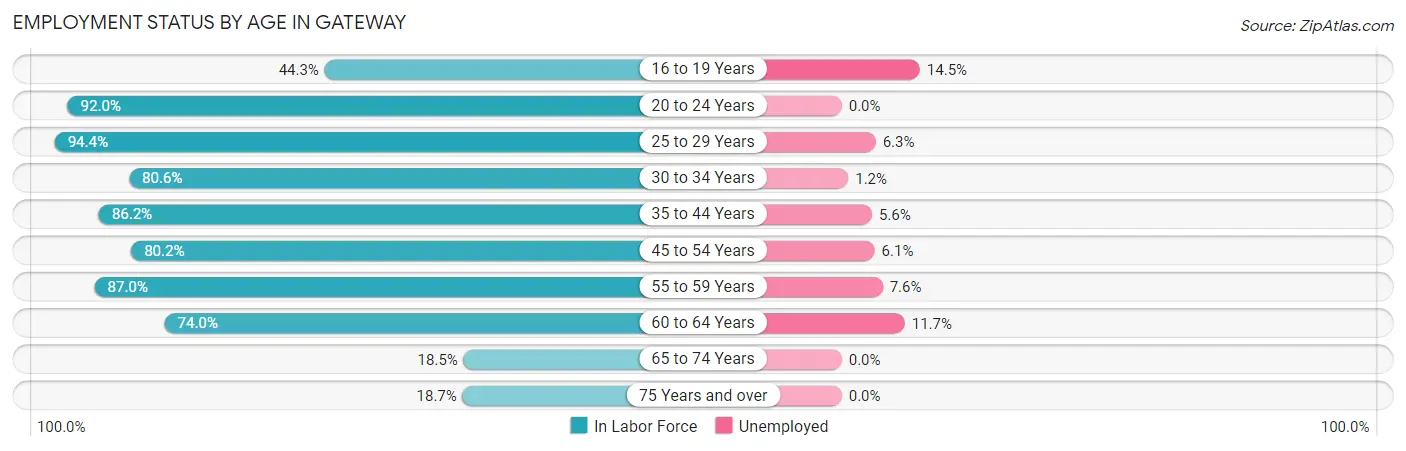
| Age Bracket | In Labor Force | Unemployed |
| 16 to 19 Years | 124 (44.3%) | 18 (14.5%) |
| 20 to 24 Years | 218 (92.0%) | 0 (0.0%) |
| 25 to 29 Years | 221 (94.4%) | 14 (6.3%) |
| 30 to 34 Years | 522 (80.6%) | 6 (1.2%) |
| 35 to 44 Years | 965 (86.2%) | 54 (5.6%) |
| 45 to 54 Years | 546 (80.2%) | 33 (6.1%) |
| 55 to 59 Years | 275 (87.0%) | 21 (7.6%) |
| 60 to 64 Years | 174 (74.0%) | 20 (11.7%) |
| 65 to 74 Years | 68 (18.5%) | 0 (0.0%) |
| 75 Years and over | 29 (18.7%) | 0 (0.0%) |
| Total | 3,141 (73.5%) | 166 (5.3%) |
Employment Status by Educational Attainment in Gateway
According to labor force statistics for Gateway, 83.6% of individuals (2,704) out of the total population between 25 and 64 years of age (3,234) are in the labor force, with 5.5% or 149 of them being unemployed. The group with the highest labor force participation rate are those with the educational attainment of high school diploma, with 89.3% or 553 individuals in the labor force. Within the labor force, individuals with college / associate degree education have the highest percentage of unemployment, with 8.5% or 87 of them being unemployed.
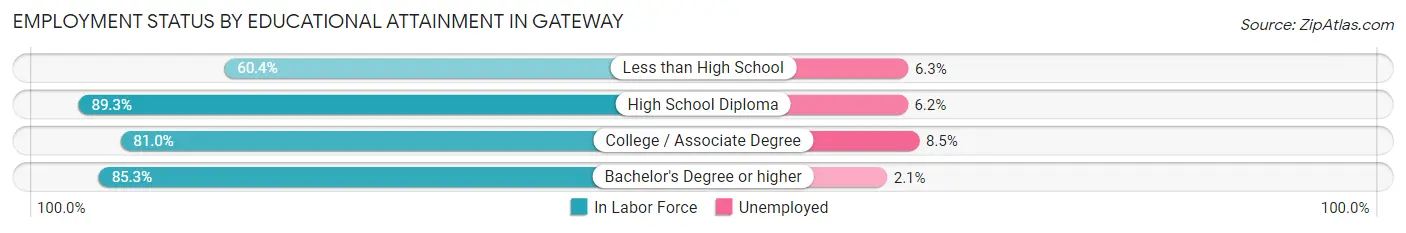
| Educational Attainment | In Labor Force | Unemployed |
| Less than High School | 64 (60.4%) | 7 (6.3%) |
| High School Diploma | 553 (89.3%) | 38 (6.2%) |
| College / Associate Degree | 1,021 (81.0%) | 107 (8.5%) |
| Bachelor's Degree or higher | 1,065 (85.3%) | 26 (2.1%) |
| Total | 2,704 (83.6%) | 178 (5.5%) |
Employment Occupations by Sex in Gateway
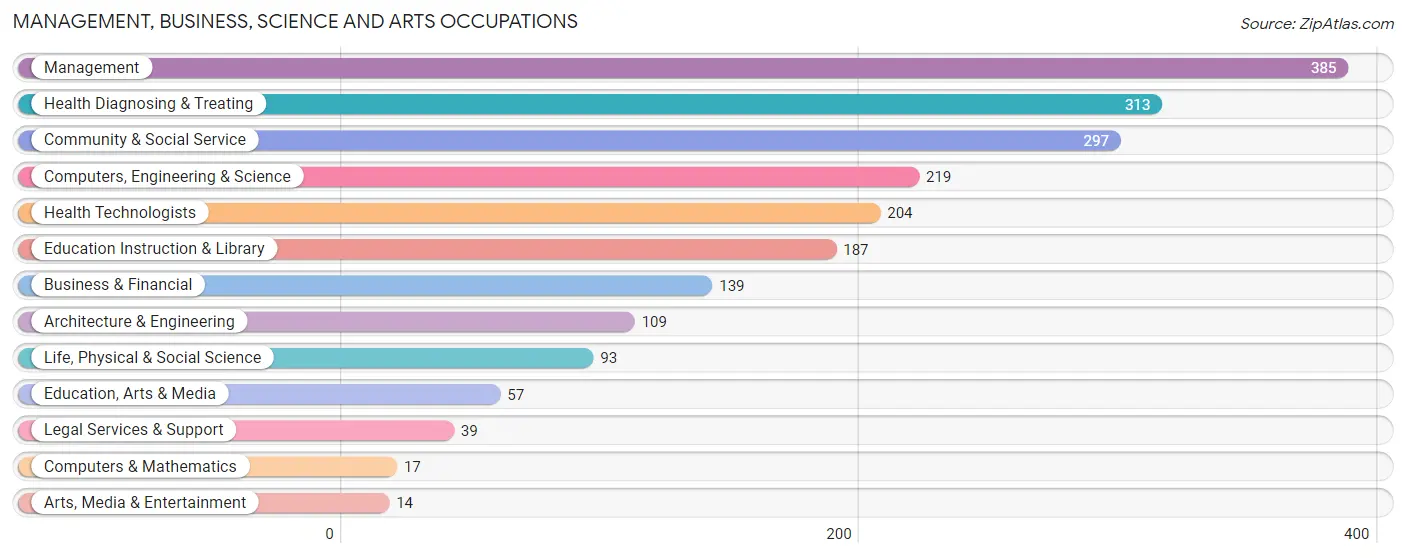
Management, Business, Science and Arts Occupations
The most common Management, Business, Science and Arts occupations in Gateway are Management (385 | 13.7%), Health Diagnosing & Treating (313 | 11.1%), Community & Social Service (297 | 10.5%), Computers, Engineering & Science (219 | 7.8%), and Health Technologists (204 | 7.2%).
Management, Business, Science and Arts Occupations by Sex
Within the Management, Business, Science and Arts occupations in Gateway, the most male-oriented occupations are Computers & Mathematics (100.0%), Architecture & Engineering (95.4%), and Arts, Media & Entertainment (92.9%), while the most female-oriented occupations are Legal Services & Support (97.4%), Education Instruction & Library (91.4%), and Community & Social Service (82.2%).
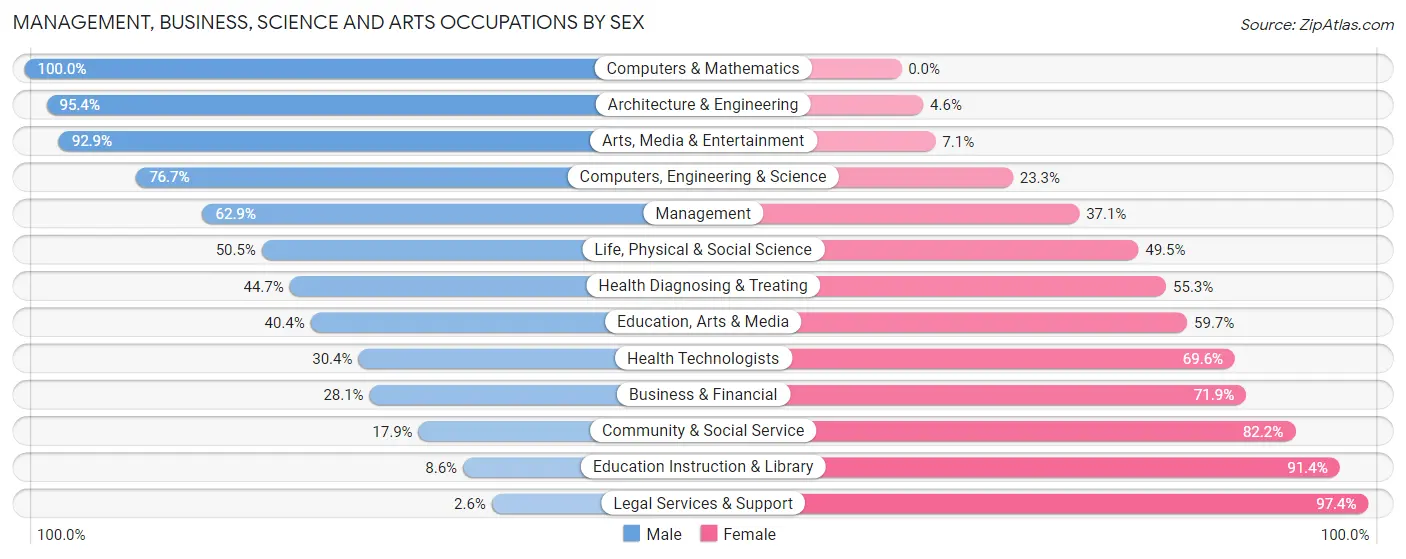
| Occupation | Male | Female |
| Management | 242 (62.9%) | 143 (37.1%) |
| Business & Financial | 39 (28.1%) | 100 (71.9%) |
| Computers, Engineering & Science | 168 (76.7%) | 51 (23.3%) |
| Computers & Mathematics | 17 (100.0%) | 0 (0.0%) |
| Architecture & Engineering | 104 (95.4%) | 5 (4.6%) |
| Life, Physical & Social Science | 47 (50.5%) | 46 (49.5%) |
| Community & Social Service | 53 (17.8%) | 244 (82.2%) |
| Education, Arts & Media | 23 (40.4%) | 34 (59.7%) |
| Legal Services & Support | 1 (2.6%) | 38 (97.4%) |
| Education Instruction & Library | 16 (8.6%) | 171 (91.4%) |
| Arts, Media & Entertainment | 13 (92.9%) | 1 (7.1%) |
| Health Diagnosing & Treating | 140 (44.7%) | 173 (55.3%) |
| Health Technologists | 62 (30.4%) | 142 (69.6%) |
| Total (Category) | 642 (47.4%) | 711 (52.5%) |
| Total (Overall) | 1,448 (51.3%) | 1,373 (48.7%) |
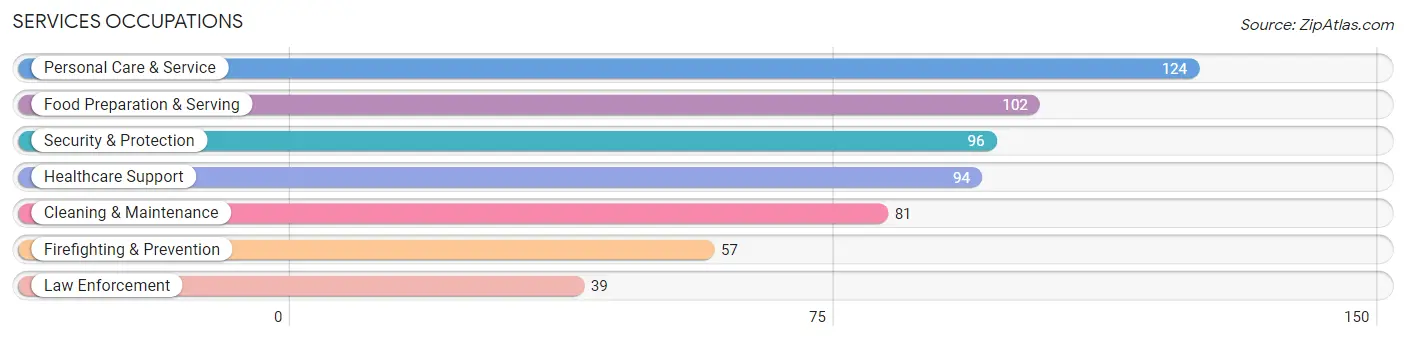
Services Occupations
The most common Services occupations in Gateway are Personal Care & Service (124 | 4.4%), Food Preparation & Serving (102 | 3.6%), Security & Protection (96 | 3.4%), Healthcare Support (94 | 3.3%), and Cleaning & Maintenance (81 | 2.9%).
Services Occupations by Sex
Within the Services occupations in Gateway, the most male-oriented occupations are Law Enforcement (100.0%), Security & Protection (96.9%), and Firefighting & Prevention (94.7%), while the most female-oriented occupations are Personal Care & Service (97.6%), Healthcare Support (85.1%), and Food Preparation & Serving (65.7%).
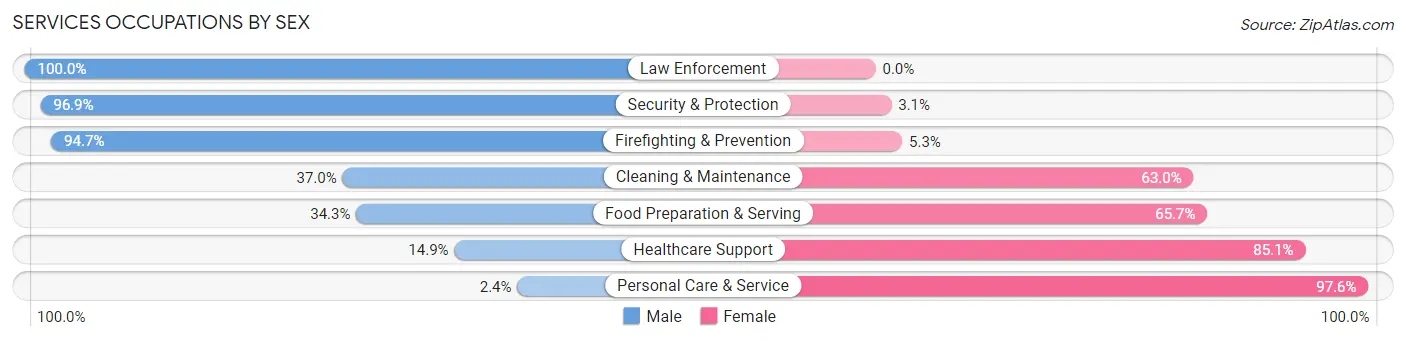
| Occupation | Male | Female |
| Healthcare Support | 14 (14.9%) | 80 (85.1%) |
| Security & Protection | 93 (96.9%) | 3 (3.1%) |
| Firefighting & Prevention | 54 (94.7%) | 3 (5.3%) |
| Law Enforcement | 39 (100.0%) | 0 (0.0%) |
| Food Preparation & Serving | 35 (34.3%) | 67 (65.7%) |
| Cleaning & Maintenance | 30 (37.0%) | 51 (63.0%) |
| Personal Care & Service | 3 (2.4%) | 121 (97.6%) |
| Total (Category) | 175 (35.2%) | 322 (64.8%) |
| Total (Overall) | 1,448 (51.3%) | 1,373 (48.7%) |
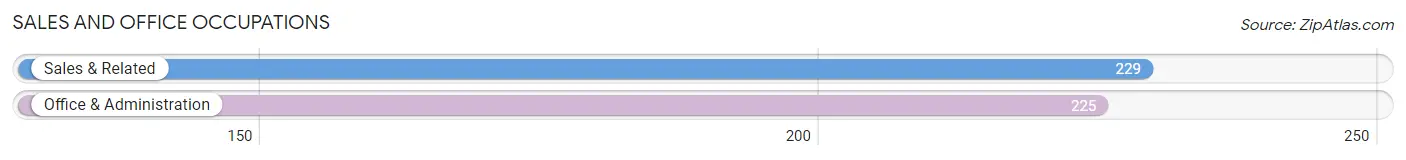
Sales and Office Occupations
The most common Sales and Office occupations in Gateway are Sales & Related (229 | 8.1%), and Office & Administration (225 | 8.0%).
Sales and Office Occupations by Sex
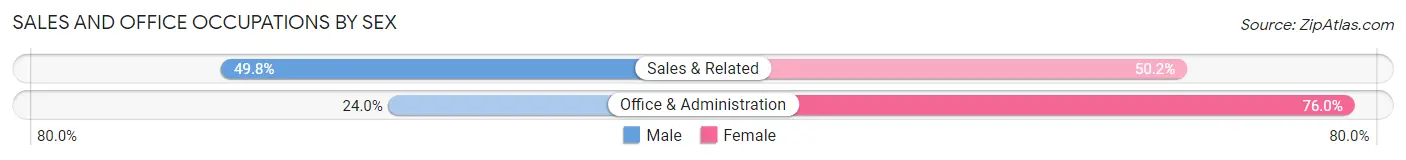
| Occupation | Male | Female |
| Sales & Related | 114 (49.8%) | 115 (50.2%) |
| Office & Administration | 54 (24.0%) | 171 (76.0%) |
| Total (Category) | 168 (37.0%) | 286 (63.0%) |
| Total (Overall) | 1,448 (51.3%) | 1,373 (48.7%) |
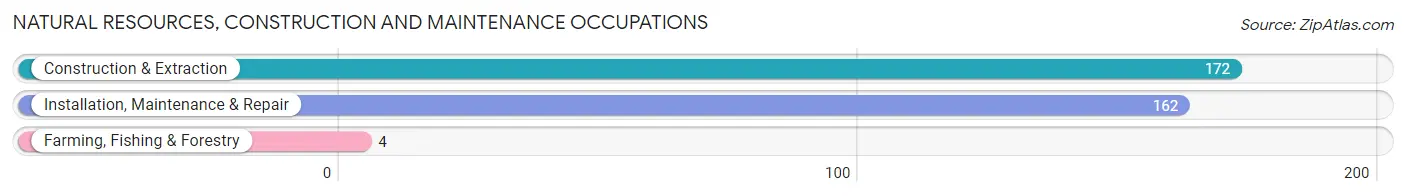
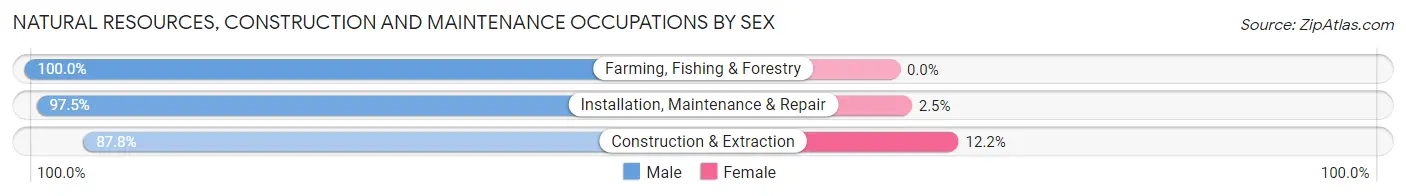
Natural Resources, Construction and Maintenance Occupations
The most common Natural Resources, Construction and Maintenance occupations in Gateway are Construction & Extraction (172 | 6.1%), Installation, Maintenance & Repair (162 | 5.7%), and Farming, Fishing & Forestry (4 | 0.1%).
Natural Resources, Construction and Maintenance Occupations by Sex
| Occupation | Male | Female |
| Farming, Fishing & Forestry | 4 (100.0%) | 0 (0.0%) |
| Construction & Extraction | 151 (87.8%) | 21 (12.2%) |
| Installation, Maintenance & Repair | 158 (97.5%) | 4 (2.5%) |
| Total (Category) | 313 (92.6%) | 25 (7.4%) |
| Total (Overall) | 1,448 (51.3%) | 1,373 (48.7%) |
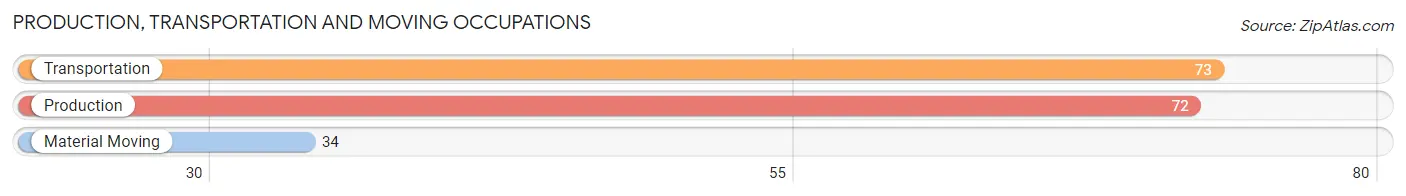
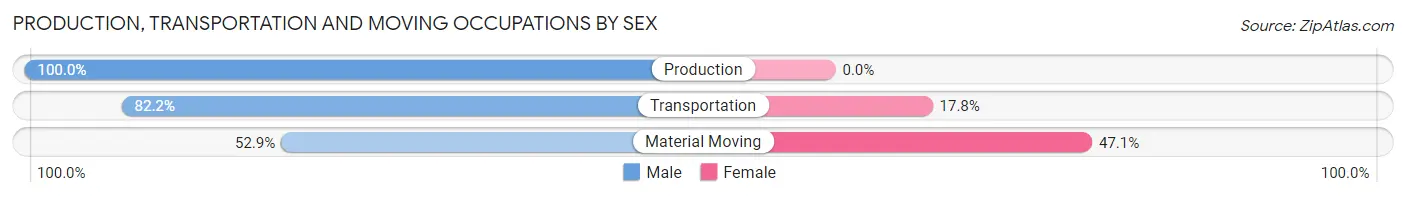
Production, Transportation and Moving Occupations
The most common Production, Transportation and Moving occupations in Gateway are Transportation (73 | 2.6%), Production (72 | 2.5%), and Material Moving (34 | 1.2%).
Production, Transportation and Moving Occupations by Sex
| Occupation | Male | Female |
| Production | 72 (100.0%) | 0 (0.0%) |
| Transportation | 60 (82.2%) | 13 (17.8%) |
| Material Moving | 18 (52.9%) | 16 (47.1%) |
| Total (Category) | 150 (83.8%) | 29 (16.2%) |
| Total (Overall) | 1,448 (51.3%) | 1,373 (48.7%) |
Employment Industries by Sex in Gateway
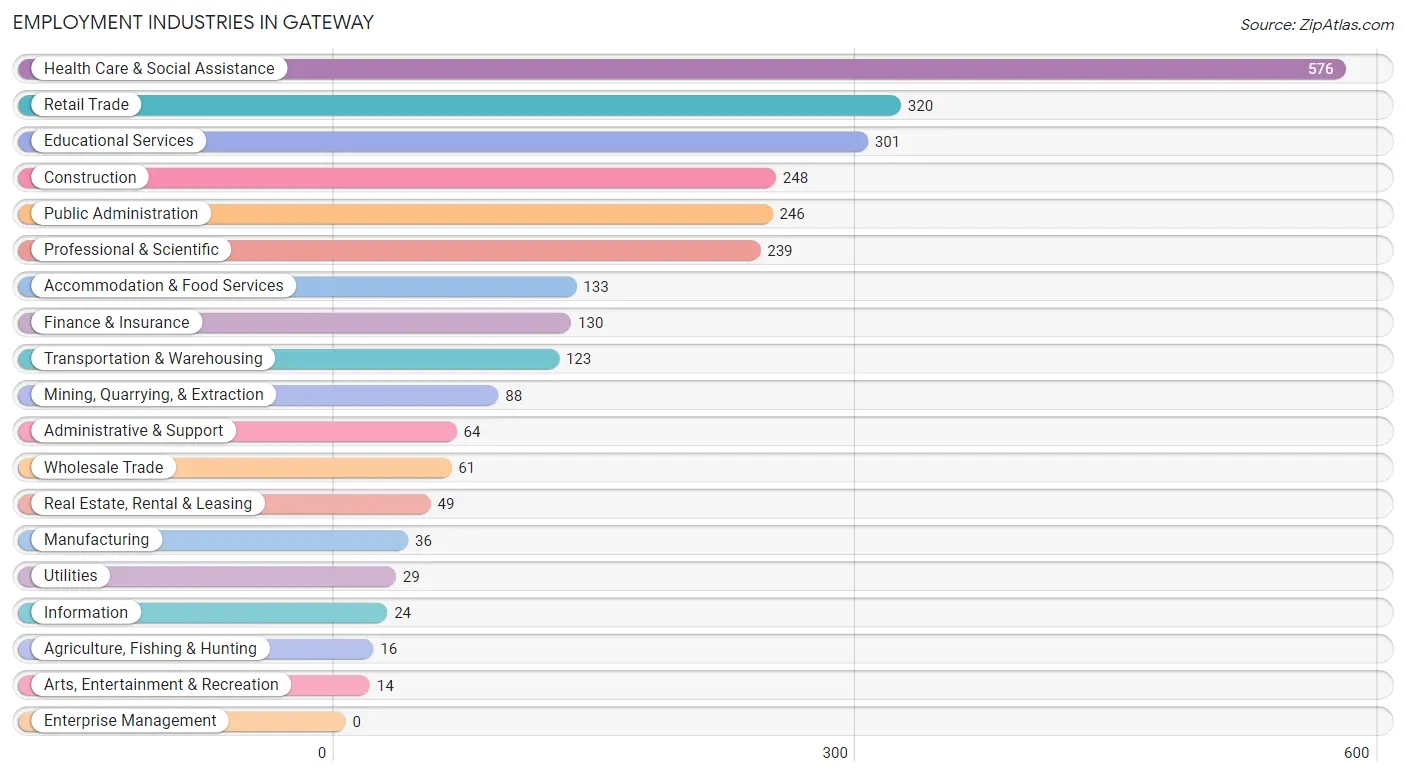
Employment Industries in Gateway
The major employment industries in Gateway include Health Care & Social Assistance (576 | 20.4%), Retail Trade (320 | 11.3%), Educational Services (301 | 10.7%), Construction (248 | 8.8%), and Public Administration (246 | 8.7%).
Employment Industries by Sex in Gateway
The Gateway industries that see more men than women are Utilities (100.0%), Manufacturing (91.7%), and Mining, Quarrying, & Extraction (86.4%), whereas the industries that tend to have a higher number of women are Real Estate, Rental & Leasing (100.0%), Arts, Entertainment & Recreation (100.0%), and Educational Services (73.4%).
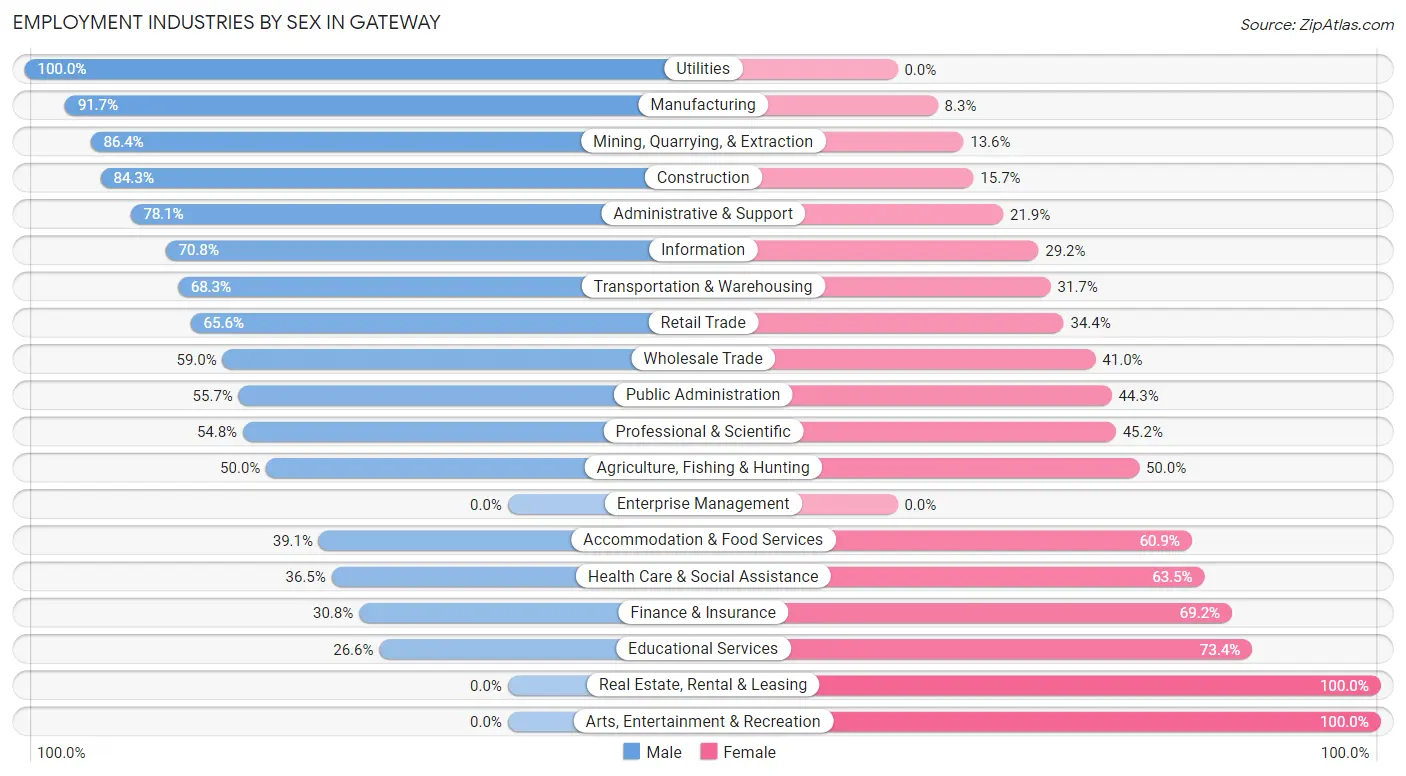
| Industry | Male | Female |
| Agriculture, Fishing & Hunting | 8 (50.0%) | 8 (50.0%) |
| Mining, Quarrying, & Extraction | 76 (86.4%) | 12 (13.6%) |
| Construction | 209 (84.3%) | 39 (15.7%) |
| Manufacturing | 33 (91.7%) | 3 (8.3%) |
| Wholesale Trade | 36 (59.0%) | 25 (41.0%) |
| Retail Trade | 210 (65.6%) | 110 (34.4%) |
| Transportation & Warehousing | 84 (68.3%) | 39 (31.7%) |
| Utilities | 29 (100.0%) | 0 (0.0%) |
| Information | 17 (70.8%) | 7 (29.2%) |
| Finance & Insurance | 40 (30.8%) | 90 (69.2%) |
| Real Estate, Rental & Leasing | 0 (0.0%) | 49 (100.0%) |
| Professional & Scientific | 131 (54.8%) | 108 (45.2%) |
| Enterprise Management | 0 (0.0%) | 0 (0.0%) |
| Administrative & Support | 50 (78.1%) | 14 (21.9%) |
| Educational Services | 80 (26.6%) | 221 (73.4%) |
| Health Care & Social Assistance | 210 (36.5%) | 366 (63.5%) |
| Arts, Entertainment & Recreation | 0 (0.0%) | 14 (100.0%) |
| Accommodation & Food Services | 52 (39.1%) | 81 (60.9%) |
| Public Administration | 137 (55.7%) | 109 (44.3%) |
| Total | 1,448 (51.3%) | 1,373 (48.7%) |
Education in Gateway
School Enrollment in Gateway
The most common levels of schooling among the 1,942 students in Gateway are middle school (513 | 26.4%), elementary school (487 | 25.1%), and high school (404 | 20.8%).
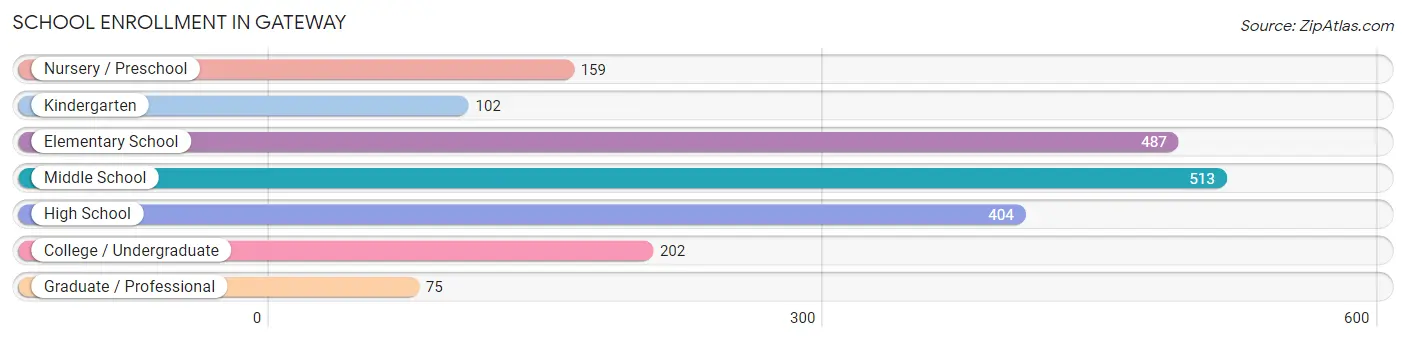
| School Level | # Students | % Students |
| Nursery / Preschool | 159 | 8.2% |
| Kindergarten | 102 | 5.2% |
| Elementary School | 487 | 25.1% |
| Middle School | 513 | 26.4% |
| High School | 404 | 20.8% |
| College / Undergraduate | 202 | 10.4% |
| Graduate / Professional | 75 | 3.9% |
| Total | 1,942 | 100.0% |
School Enrollment by Age by Funding Source in Gateway
Out of a total of 1,942 students who are enrolled in schools in Gateway, 408 (21.0%) attend a private institution, while the remaining 1,534 (79.0%) are enrolled in public schools. The age group of 3 to 4 year olds has the highest likelihood of being enrolled in private schools, with 68 (80.9% in the age bracket) enrolled. Conversely, the age group of 20 to 24 year olds has the lowest likelihood of being enrolled in a private school, with 30 (100.0% in the age bracket) attending a public institution.
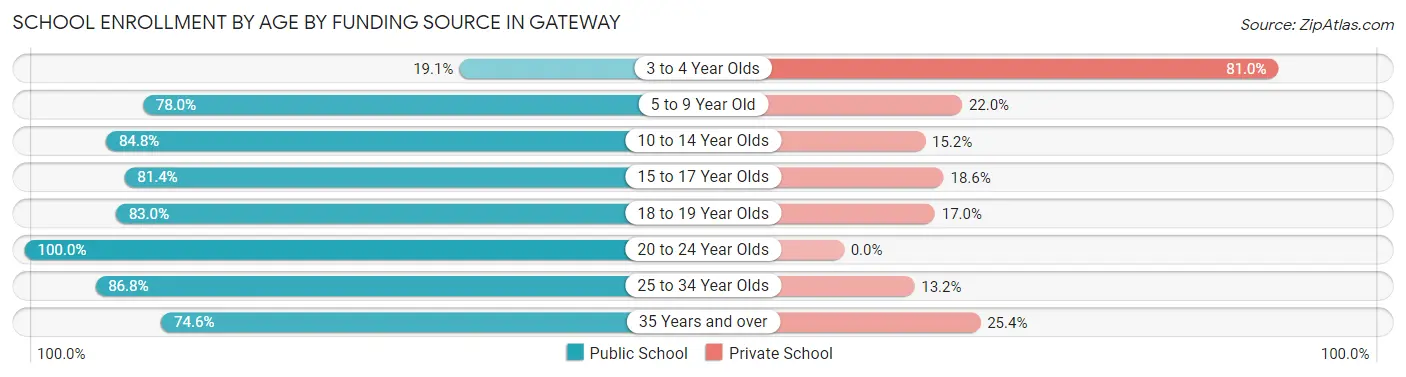
| Age Bracket | Public School | Private School |
| 3 to 4 Year Olds | 16 (19.1%) | 68 (80.9%) |
| 5 to 9 Year Old | 485 (78.0%) | 137 (22.0%) |
| 10 to 14 Year Olds | 543 (84.8%) | 97 (15.2%) |
| 15 to 17 Year Olds | 232 (81.4%) | 53 (18.6%) |
| 18 to 19 Year Olds | 44 (83.0%) | 9 (17.0%) |
| 20 to 24 Year Olds | 30 (100.0%) | 0 (0.0%) |
| 25 to 34 Year Olds | 99 (86.8%) | 15 (13.2%) |
| 35 Years and over | 85 (74.6%) | 29 (25.4%) |
| Total | 1,534 (79.0%) | 408 (21.0%) |
Educational Attainment by Field of Study in Gateway
Business (364 | 23.9%), education (164 | 10.7%), science & technology (162 | 10.6%), arts & humanities (117 | 7.7%), and bio, nature & agricultural (107 | 7.0%) are the most common fields of study among 1,525 individuals in Gateway who have obtained a bachelor's degree or higher.
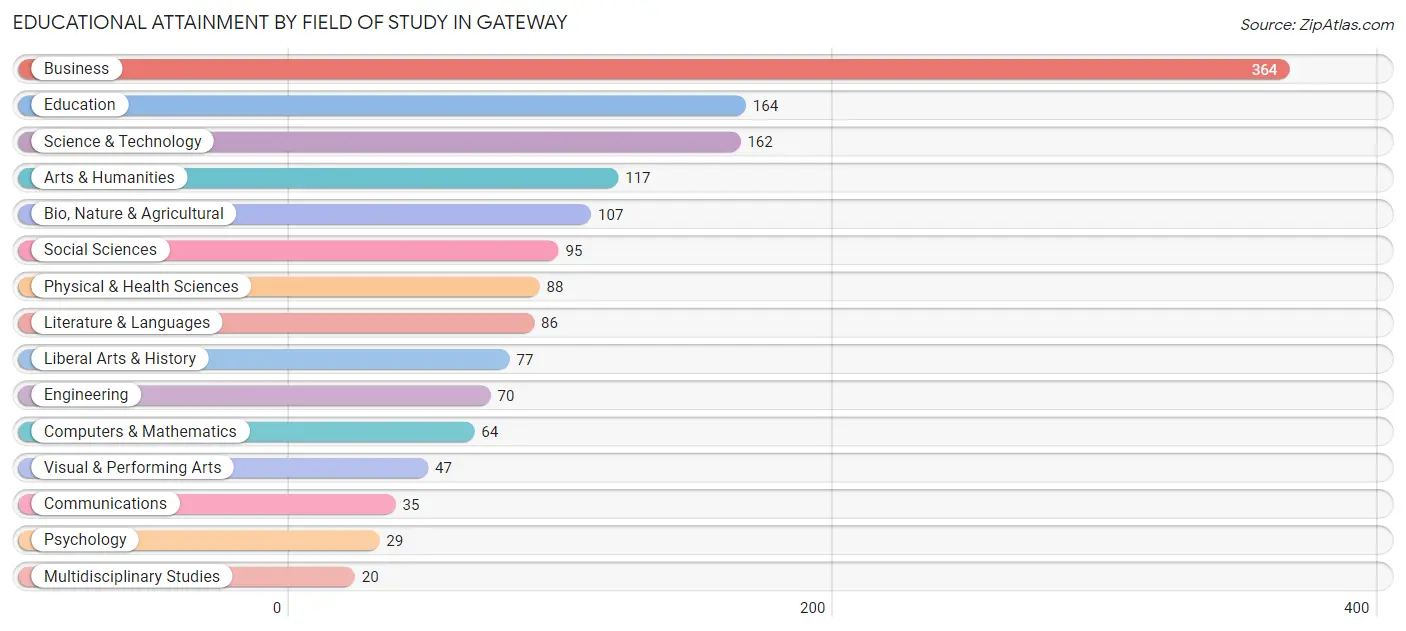
| Field of Study | # Graduates | % Graduates |
| Computers & Mathematics | 64 | 4.2% |
| Bio, Nature & Agricultural | 107 | 7.0% |
| Physical & Health Sciences | 88 | 5.8% |
| Psychology | 29 | 1.9% |
| Social Sciences | 95 | 6.2% |
| Engineering | 70 | 4.6% |
| Multidisciplinary Studies | 20 | 1.3% |
| Science & Technology | 162 | 10.6% |
| Business | 364 | 23.9% |
| Education | 164 | 10.7% |
| Literature & Languages | 86 | 5.6% |
| Liberal Arts & History | 77 | 5.1% |
| Visual & Performing Arts | 47 | 3.1% |
| Communications | 35 | 2.3% |
| Arts & Humanities | 117 | 7.7% |
| Total | 1,525 | 100.0% |
Transportation & Commute in Gateway
Vehicle Availability by Sex in Gateway
The most prevalent vehicle ownership categories in Gateway are males with 2 vehicles (599, accounting for 39.4%) and females with 2 vehicles (431, making up 41.7%).
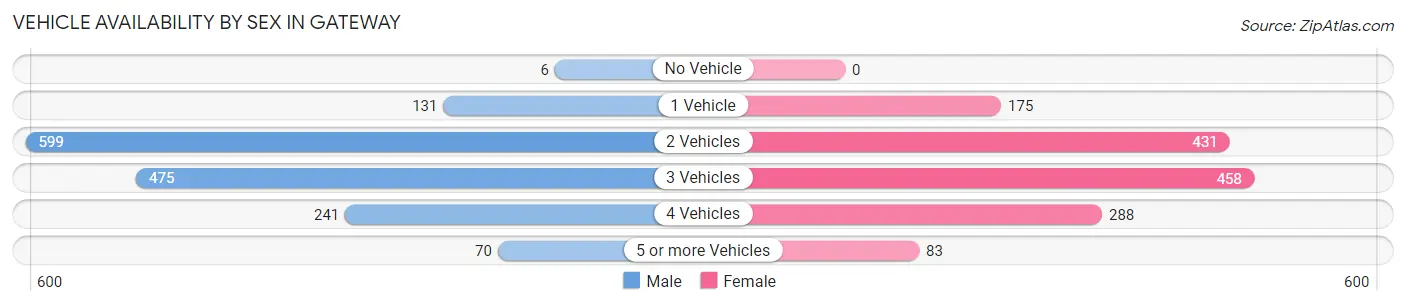
| Vehicles Available | Male | Female |
| No Vehicle | 6 (0.4%) | 0 (0.0%) |
| 1 Vehicle | 131 (8.6%) | 175 (12.2%) |
| 2 Vehicles | 599 (39.4%) | 431 (30.0%) |
| 3 Vehicles | 475 (31.2%) | 458 (31.9%) |
| 4 Vehicles | 241 (15.8%) | 288 (20.1%) |
| 5 or more Vehicles | 70 (4.6%) | 83 (5.8%) |
| Total | 1,522 (100.0%) | 1,435 (100.0%) |
Commute Time in Gateway
The most frequently occuring commute durations in Gateway are 45 to 59 minutes (568 commuters, 21.4%), 10 to 14 minutes (436 commuters, 16.4%), and 15 to 19 minutes (325 commuters, 12.2%).
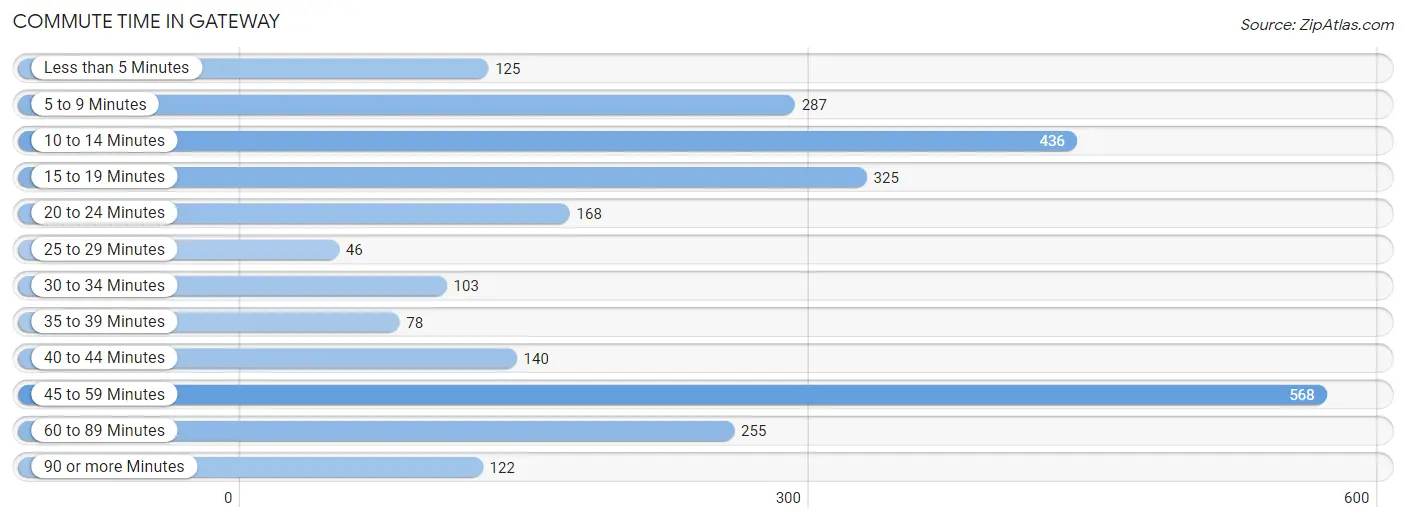
| Commute Time | # Commuters | % Commuters |
| Less than 5 Minutes | 125 | 4.7% |
| 5 to 9 Minutes | 287 | 10.8% |
| 10 to 14 Minutes | 436 | 16.4% |
| 15 to 19 Minutes | 325 | 12.2% |
| 20 to 24 Minutes | 168 | 6.3% |
| 25 to 29 Minutes | 46 | 1.7% |
| 30 to 34 Minutes | 103 | 3.9% |
| 35 to 39 Minutes | 78 | 2.9% |
| 40 to 44 Minutes | 140 | 5.3% |
| 45 to 59 Minutes | 568 | 21.4% |
| 60 to 89 Minutes | 255 | 9.6% |
| 90 or more Minutes | 122 | 4.6% |
Commute Time by Sex in Gateway
The most common commute times in Gateway are 45 to 59 minutes (349 commuters, 24.4%) for males and 10 to 14 minutes (286 commuters, 23.4%) for females.
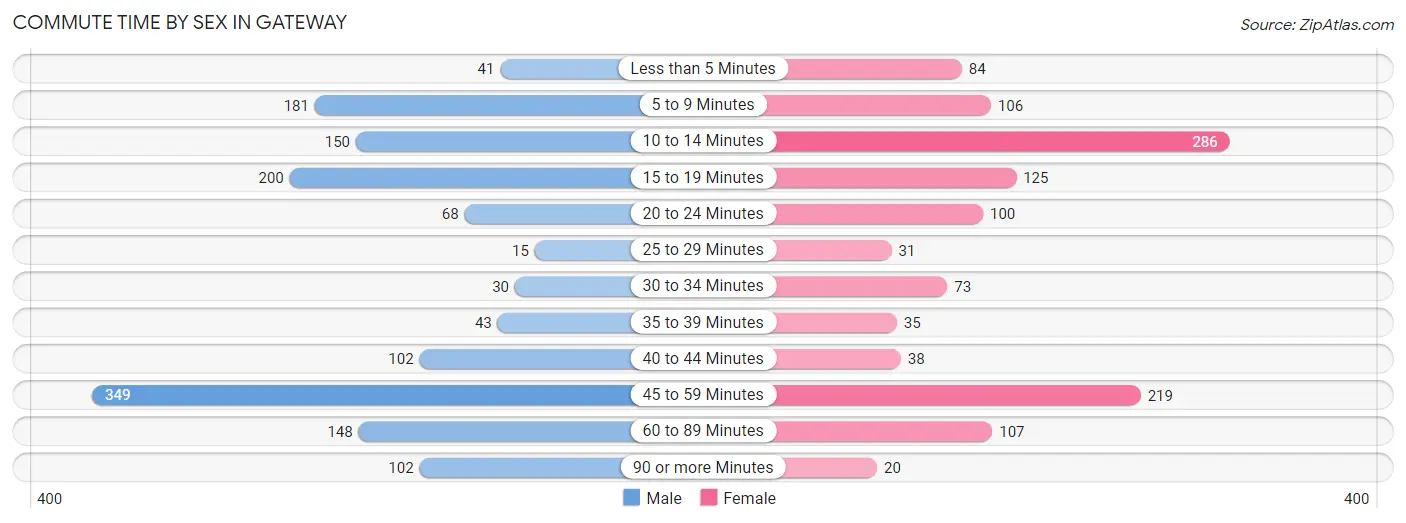
| Commute Time | Male | Female |
| Less than 5 Minutes | 41 (2.9%) | 84 (6.9%) |
| 5 to 9 Minutes | 181 (12.7%) | 106 (8.7%) |
| 10 to 14 Minutes | 150 (10.5%) | 286 (23.4%) |
| 15 to 19 Minutes | 200 (14.0%) | 125 (10.2%) |
| 20 to 24 Minutes | 68 (4.8%) | 100 (8.2%) |
| 25 to 29 Minutes | 15 (1.1%) | 31 (2.5%) |
| 30 to 34 Minutes | 30 (2.1%) | 73 (6.0%) |
| 35 to 39 Minutes | 43 (3.0%) | 35 (2.9%) |
| 40 to 44 Minutes | 102 (7.1%) | 38 (3.1%) |
| 45 to 59 Minutes | 349 (24.4%) | 219 (17.9%) |
| 60 to 89 Minutes | 148 (10.4%) | 107 (8.7%) |
| 90 or more Minutes | 102 (7.1%) | 20 (1.6%) |
Time of Departure to Work by Sex in Gateway
The most frequent times of departure to work in Gateway are 7:00 AM to 7:29 AM (238, 16.7%) for males and 7:30 AM to 7:59 AM (216, 17.6%) for females.
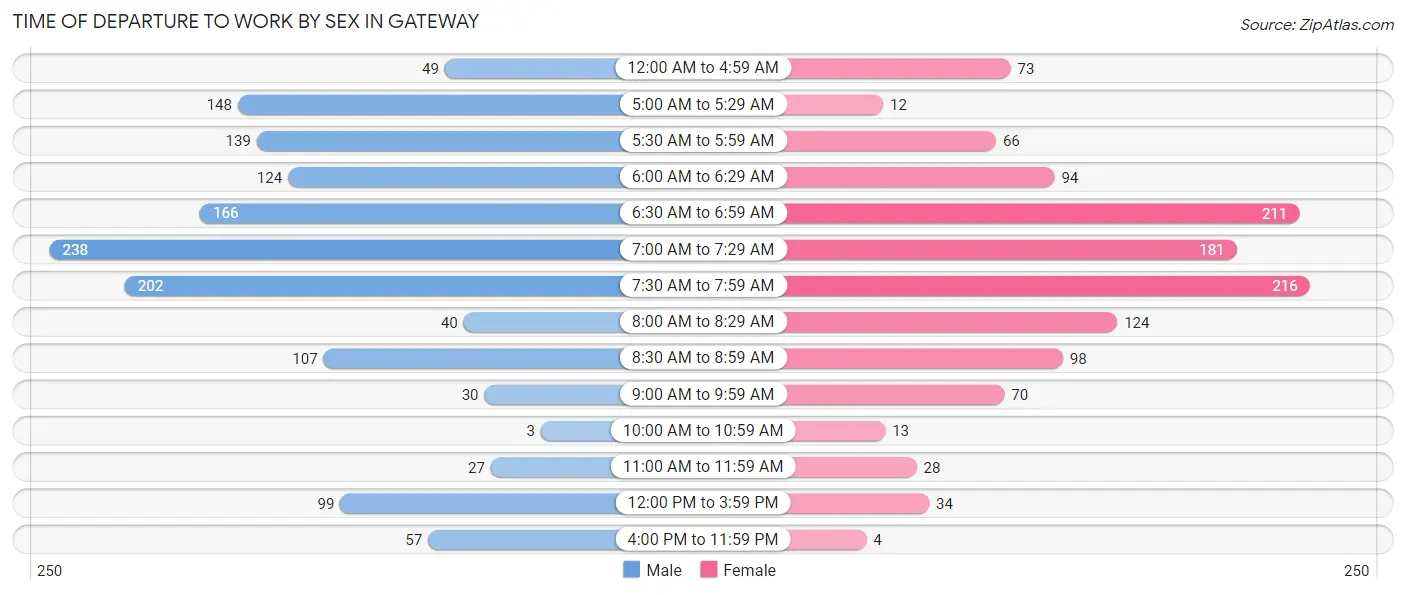
| Time of Departure | Male | Female |
| 12:00 AM to 4:59 AM | 49 (3.4%) | 73 (6.0%) |
| 5:00 AM to 5:29 AM | 148 (10.4%) | 12 (1.0%) |
| 5:30 AM to 5:59 AM | 139 (9.7%) | 66 (5.4%) |
| 6:00 AM to 6:29 AM | 124 (8.7%) | 94 (7.7%) |
| 6:30 AM to 6:59 AM | 166 (11.6%) | 211 (17.2%) |
| 7:00 AM to 7:29 AM | 238 (16.7%) | 181 (14.8%) |
| 7:30 AM to 7:59 AM | 202 (14.1%) | 216 (17.6%) |
| 8:00 AM to 8:29 AM | 40 (2.8%) | 124 (10.1%) |
| 8:30 AM to 8:59 AM | 107 (7.5%) | 98 (8.0%) |
| 9:00 AM to 9:59 AM | 30 (2.1%) | 70 (5.7%) |
| 10:00 AM to 10:59 AM | 3 (0.2%) | 13 (1.1%) |
| 11:00 AM to 11:59 AM | 27 (1.9%) | 28 (2.3%) |
| 12:00 PM to 3:59 PM | 99 (6.9%) | 34 (2.8%) |
| 4:00 PM to 11:59 PM | 57 (4.0%) | 4 (0.3%) |
| Total | 1,429 (100.0%) | 1,224 (100.0%) |
Housing Occupancy in Gateway
Occupancy by Ownership in Gateway
Of the total 2,004 dwellings in Gateway, owner-occupied units account for 1,562 (77.9%), while renter-occupied units make up 442 (22.1%).
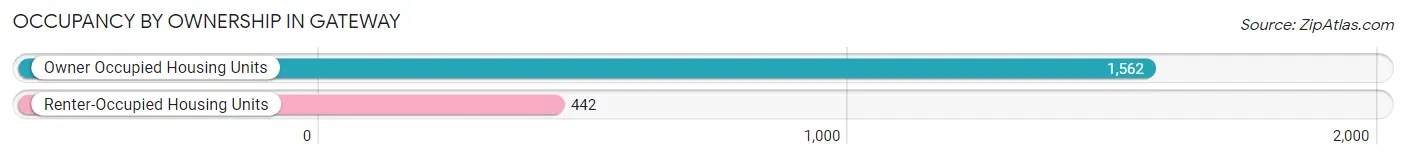
| Occupancy | # Housing Units | % Housing Units |
| Owner Occupied Housing Units | 1,562 | 77.9% |
| Renter-Occupied Housing Units | 442 | 22.1% |
| Total Occupied Housing Units | 2,004 | 100.0% |
Occupancy by Household Size in Gateway
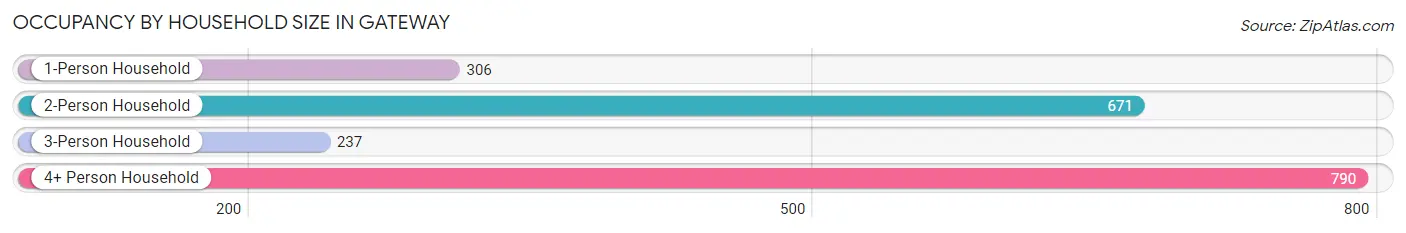
| Household Size | # Housing Units | % Housing Units |
| 1-Person Household | 306 | 15.3% |
| 2-Person Household | 671 | 33.5% |
| 3-Person Household | 237 | 11.8% |
| 4+ Person Household | 790 | 39.4% |
| Total Housing Units | 2,004 | 100.0% |
Occupancy by Ownership by Household Size in Gateway
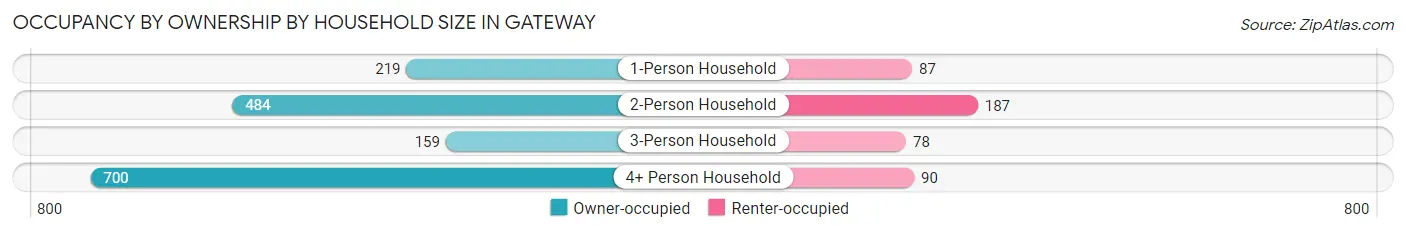
| Household Size | Owner-occupied | Renter-occupied |
| 1-Person Household | 219 (71.6%) | 87 (28.4%) |
| 2-Person Household | 484 (72.1%) | 187 (27.9%) |
| 3-Person Household | 159 (67.1%) | 78 (32.9%) |
| 4+ Person Household | 700 (88.6%) | 90 (11.4%) |
| Total Housing Units | 1,562 (77.9%) | 442 (22.1%) |
Occupancy by Educational Attainment in Gateway
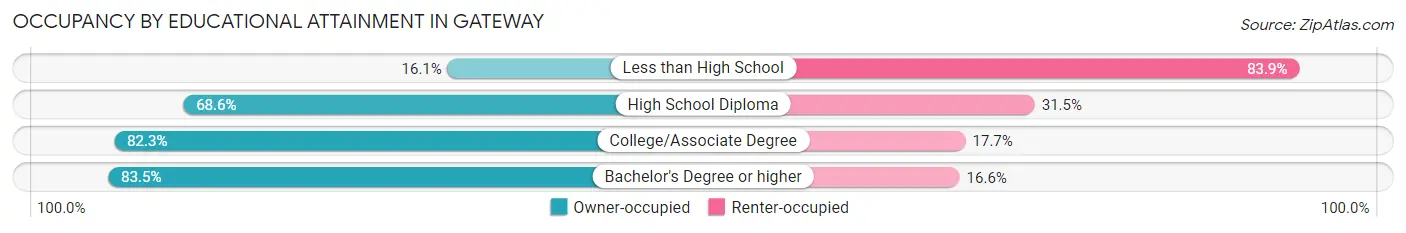
| Household Size | Owner-occupied | Renter-occupied |
| Less than High School | 10 (16.1%) | 52 (83.9%) |
| High School Diploma | 279 (68.5%) | 128 (31.5%) |
| College/Associate Degree | 552 (82.3%) | 119 (17.7%) |
| Bachelor's Degree or higher | 721 (83.5%) | 143 (16.6%) |
Occupancy by Age of Householder in Gateway
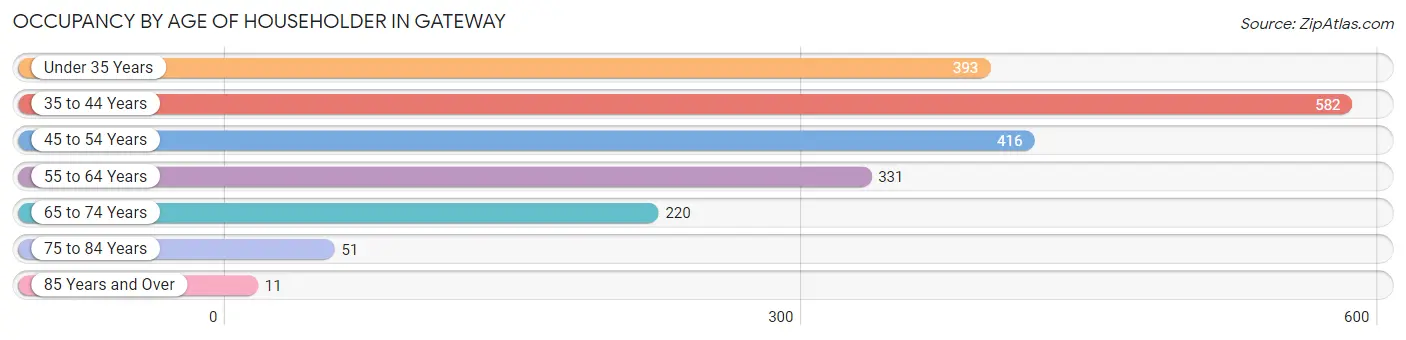
| Age Bracket | # Households | % Households |
| Under 35 Years | 393 | 19.6% |
| 35 to 44 Years | 582 | 29.0% |
| 45 to 54 Years | 416 | 20.8% |
| 55 to 64 Years | 331 | 16.5% |
| 65 to 74 Years | 220 | 11.0% |
| 75 to 84 Years | 51 | 2.5% |
| 85 Years and Over | 11 | 0.5% |
| Total | 2,004 | 100.0% |
Housing Finances in Gateway
Median Income by Occupancy in Gateway
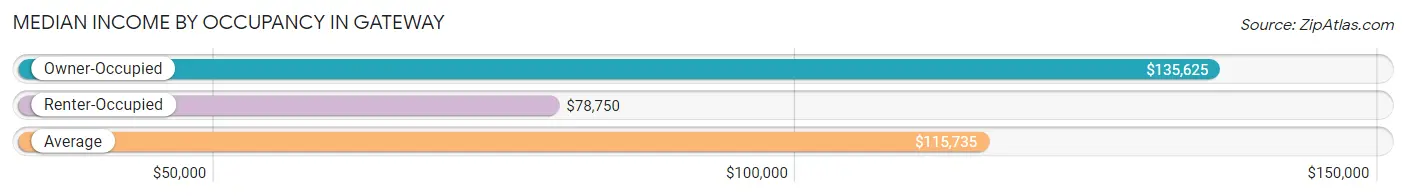
| Occupancy Type | # Households | Median Income |
| Owner-Occupied | 1,562 (77.9%) | $135,625 |
| Renter-Occupied | 442 (22.1%) | $78,750 |
| Average | 2,004 (100.0%) | $115,735 |
Occupancy by Householder Income Bracket in Gateway
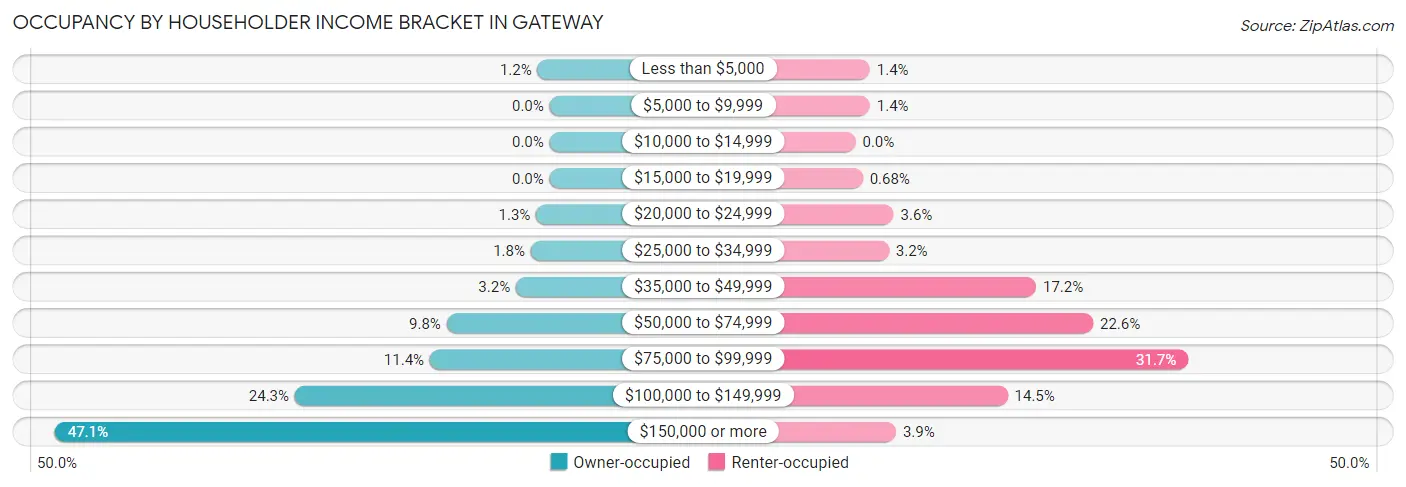
| Income Bracket | Owner-occupied | Renter-occupied |
| Less than $5,000 | 18 (1.1%) | 6 (1.4%) |
| $5,000 to $9,999 | 0 (0.0%) | 6 (1.4%) |
| $10,000 to $14,999 | 0 (0.0%) | 0 (0.0%) |
| $15,000 to $19,999 | 0 (0.0%) | 3 (0.7%) |
| $20,000 to $24,999 | 20 (1.3%) | 16 (3.6%) |
| $25,000 to $34,999 | 28 (1.8%) | 14 (3.2%) |
| $35,000 to $49,999 | 50 (3.2%) | 76 (17.2%) |
| $50,000 to $74,999 | 153 (9.8%) | 100 (22.6%) |
| $75,000 to $99,999 | 178 (11.4%) | 140 (31.7%) |
| $100,000 to $149,999 | 379 (24.3%) | 64 (14.5%) |
| $150,000 or more | 736 (47.1%) | 17 (3.8%) |
| Total | 1,562 (100.0%) | 442 (100.0%) |
Monthly Housing Cost Tiers in Gateway
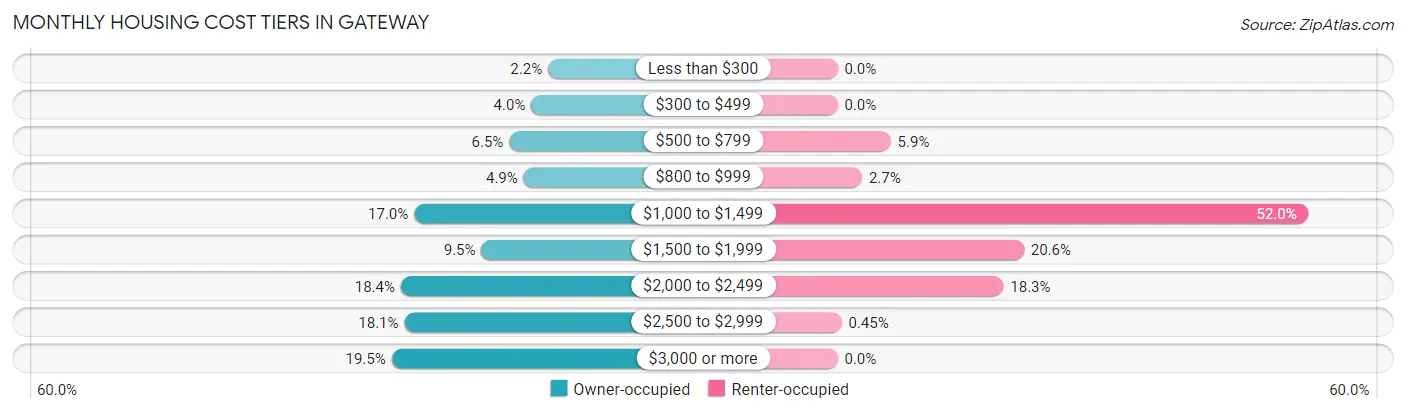
| Monthly Cost | Owner-occupied | Renter-occupied |
| Less than $300 | 34 (2.2%) | 0 (0.0%) |
| $300 to $499 | 63 (4.0%) | 0 (0.0%) |
| $500 to $799 | 101 (6.5%) | 26 (5.9%) |
| $800 to $999 | 76 (4.9%) | 12 (2.7%) |
| $1,000 to $1,499 | 265 (17.0%) | 230 (52.0%) |
| $1,500 to $1,999 | 149 (9.5%) | 91 (20.6%) |
| $2,000 to $2,499 | 288 (18.4%) | 81 (18.3%) |
| $2,500 to $2,999 | 282 (18.0%) | 2 (0.4%) |
| $3,000 or more | 304 (19.5%) | 0 (0.0%) |
| Total | 1,562 (100.0%) | 442 (100.0%) |
Physical Housing Characteristics in Gateway
Housing Structures in Gateway
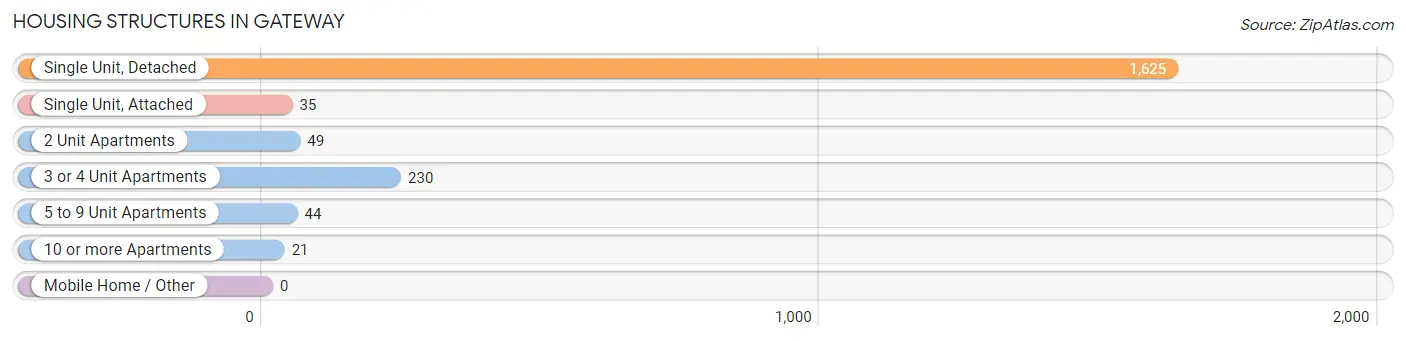
| Structure Type | # Housing Units | % Housing Units |
| Single Unit, Detached | 1,625 | 81.1% |
| Single Unit, Attached | 35 | 1.8% |
| 2 Unit Apartments | 49 | 2.5% |
| 3 or 4 Unit Apartments | 230 | 11.5% |
| 5 to 9 Unit Apartments | 44 | 2.2% |
| 10 or more Apartments | 21 | 1.1% |
| Mobile Home / Other | 0 | 0.0% |
| Total | 2,004 | 100.0% |
Housing Structures by Occupancy in Gateway
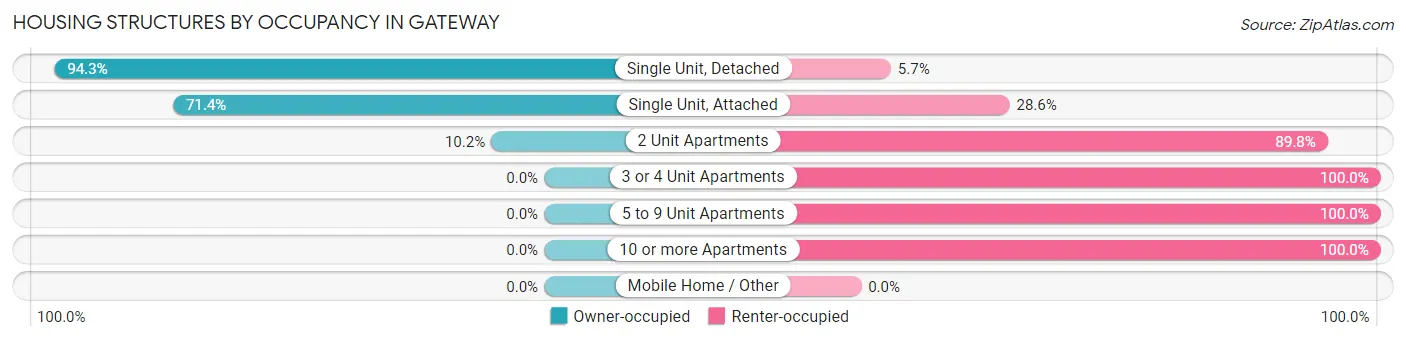
| Structure Type | Owner-occupied | Renter-occupied |
| Single Unit, Detached | 1,532 (94.3%) | 93 (5.7%) |
| Single Unit, Attached | 25 (71.4%) | 10 (28.6%) |
| 2 Unit Apartments | 5 (10.2%) | 44 (89.8%) |
| 3 or 4 Unit Apartments | 0 (0.0%) | 230 (100.0%) |
| 5 to 9 Unit Apartments | 0 (0.0%) | 44 (100.0%) |
| 10 or more Apartments | 0 (0.0%) | 21 (100.0%) |
| Mobile Home / Other | 0 (0.0%) | 0 (0.0%) |
| Total | 1,562 (77.9%) | 442 (22.1%) |
Housing Structures by Number of Rooms in Gateway
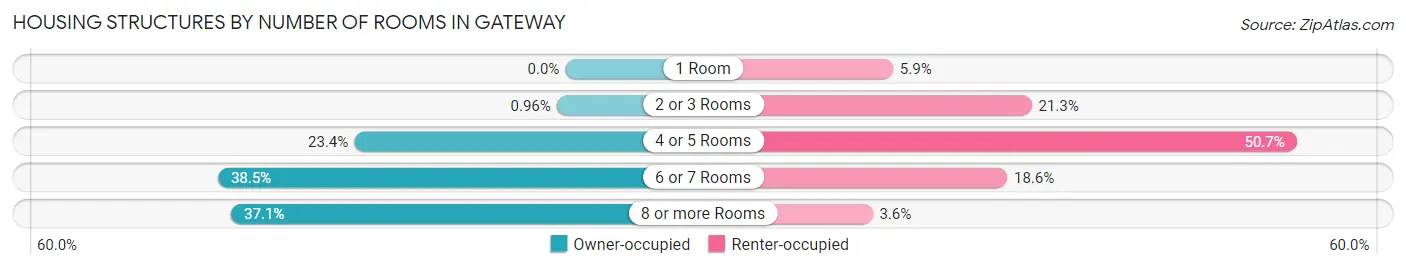
| Number of Rooms | Owner-occupied | Renter-occupied |
| 1 Room | 0 (0.0%) | 26 (5.9%) |
| 2 or 3 Rooms | 15 (1.0%) | 94 (21.3%) |
| 4 or 5 Rooms | 366 (23.4%) | 224 (50.7%) |
| 6 or 7 Rooms | 602 (38.5%) | 82 (18.5%) |
| 8 or more Rooms | 579 (37.1%) | 16 (3.6%) |
| Total | 1,562 (100.0%) | 442 (100.0%) |
Housing Structure by Heating Type in Gateway
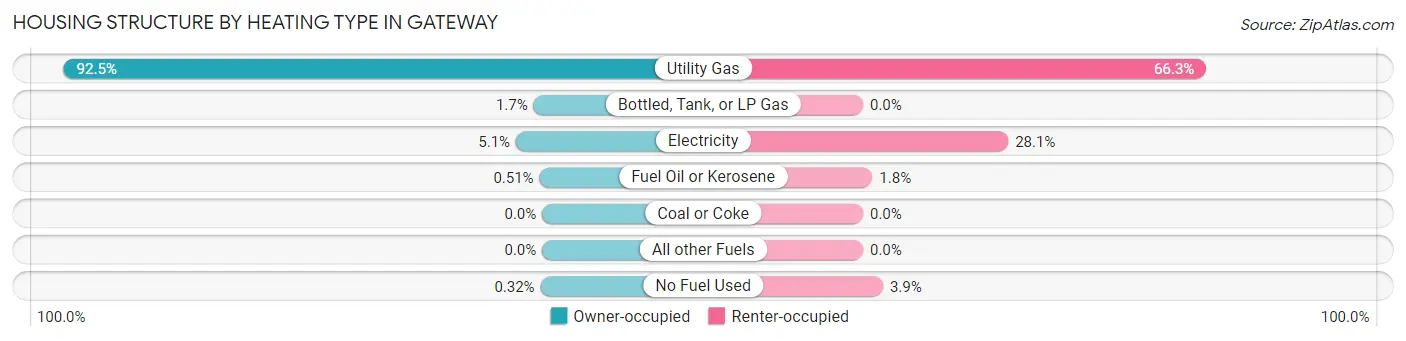
| Heating Type | Owner-occupied | Renter-occupied |
| Utility Gas | 1,444 (92.4%) | 293 (66.3%) |
| Bottled, Tank, or LP Gas | 26 (1.7%) | 0 (0.0%) |
| Electricity | 79 (5.1%) | 124 (28.1%) |
| Fuel Oil or Kerosene | 8 (0.5%) | 8 (1.8%) |
| Coal or Coke | 0 (0.0%) | 0 (0.0%) |
| All other Fuels | 0 (0.0%) | 0 (0.0%) |
| No Fuel Used | 5 (0.3%) | 17 (3.8%) |
| Total | 1,562 (100.0%) | 442 (100.0%) |
Household Vehicle Usage in Gateway
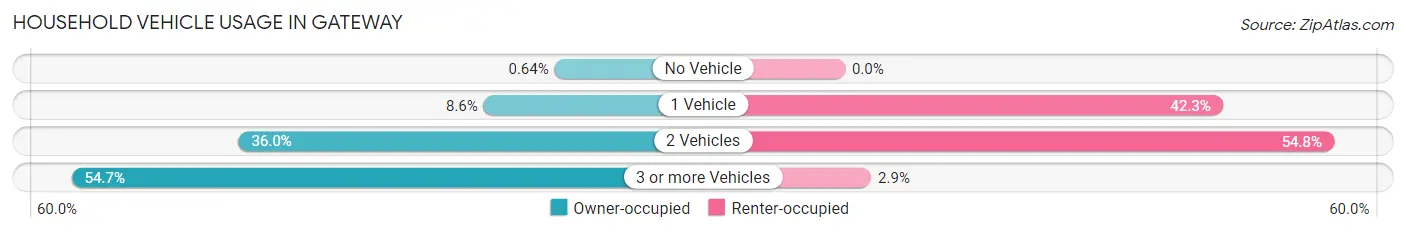
| Vehicles per Household | Owner-occupied | Renter-occupied |
| No Vehicle | 10 (0.6%) | 0 (0.0%) |
| 1 Vehicle | 134 (8.6%) | 187 (42.3%) |
| 2 Vehicles | 563 (36.0%) | 242 (54.7%) |
| 3 or more Vehicles | 855 (54.7%) | 13 (2.9%) |
| Total | 1,562 (100.0%) | 442 (100.0%) |
Real Estate & Mortgages in Gateway
Real Estate and Mortgage Overview in Gateway
| Characteristic | Without Mortgage | With Mortgage |
| Housing Units | 347 | 1,215 |
| Median Property Value | $322,600 | $406,300 |
| Median Household Income | $103,583 | $635 |
| Monthly Housing Costs | $810 | $304 |
| Real Estate Taxes | $4,398 | $81 |
Property Value by Mortgage Status in Gateway
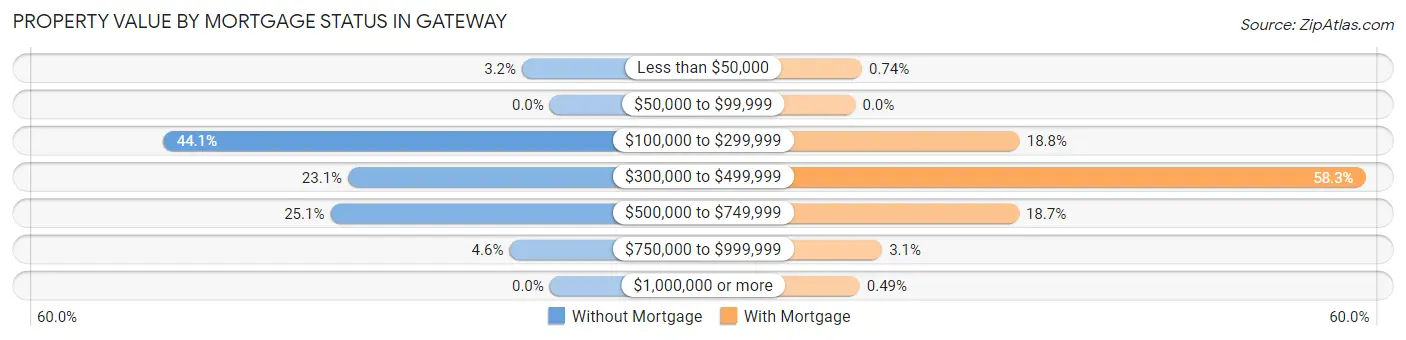
| Property Value | Without Mortgage | With Mortgage |
| Less than $50,000 | 11 (3.2%) | 9 (0.7%) |
| $50,000 to $99,999 | 0 (0.0%) | 0 (0.0%) |
| $100,000 to $299,999 | 153 (44.1%) | 228 (18.8%) |
| $300,000 to $499,999 | 80 (23.1%) | 708 (58.3%) |
| $500,000 to $749,999 | 87 (25.1%) | 227 (18.7%) |
| $750,000 to $999,999 | 16 (4.6%) | 37 (3.0%) |
| $1,000,000 or more | 0 (0.0%) | 6 (0.5%) |
| Total | 347 (100.0%) | 1,215 (100.0%) |
Household Income by Mortgage Status in Gateway
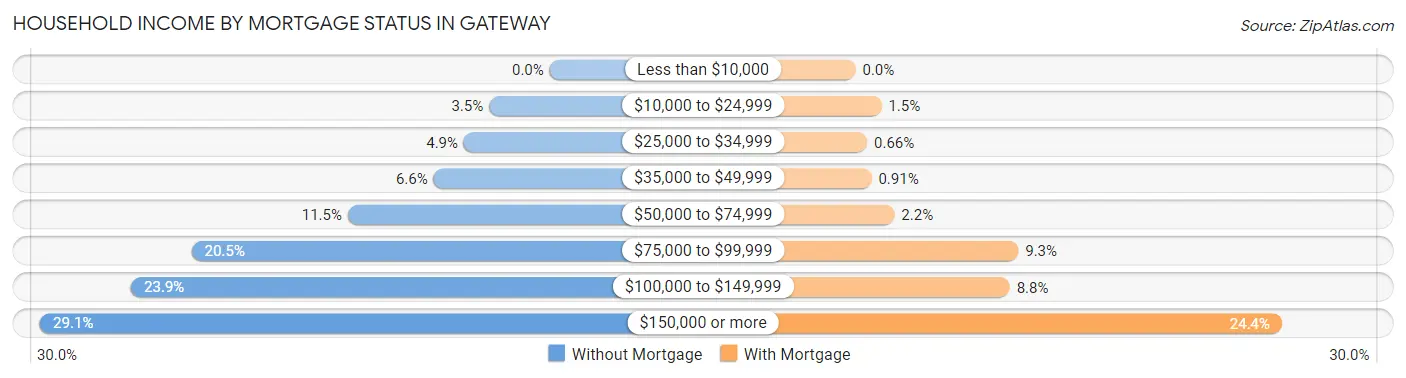
| Household Income | Without Mortgage | With Mortgage |
| Less than $10,000 | 0 (0.0%) | 0 (0.0%) |
| $10,000 to $24,999 | 12 (3.5%) | 18 (1.5%) |
| $25,000 to $34,999 | 17 (4.9%) | 8 (0.7%) |
| $35,000 to $49,999 | 23 (6.6%) | 11 (0.9%) |
| $50,000 to $74,999 | 40 (11.5%) | 27 (2.2%) |
| $75,000 to $99,999 | 71 (20.5%) | 113 (9.3%) |
| $100,000 to $149,999 | 83 (23.9%) | 107 (8.8%) |
| $150,000 or more | 101 (29.1%) | 296 (24.4%) |
| Total | 347 (100.0%) | 1,215 (100.0%) |
Property Value to Household Income Ratio in Gateway
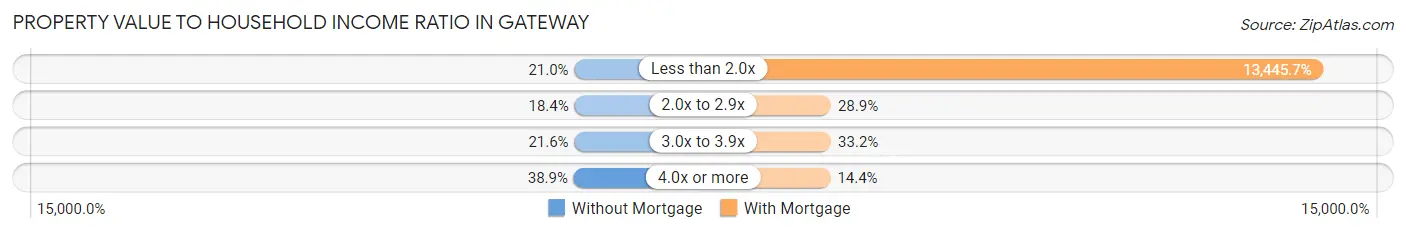
| Value-to-Income Ratio | Without Mortgage | With Mortgage |
| Less than 2.0x | 73 (21.0%) | 163,365 (13,445.7%) |
| 2.0x to 2.9x | 64 (18.4%) | 351 (28.9%) |
| 3.0x to 3.9x | 75 (21.6%) | 403 (33.2%) |
| 4.0x or more | 135 (38.9%) | 175 (14.4%) |
| Total | 347 (100.0%) | 1,215 (100.0%) |
Real Estate Taxes by Mortgage Status in Gateway
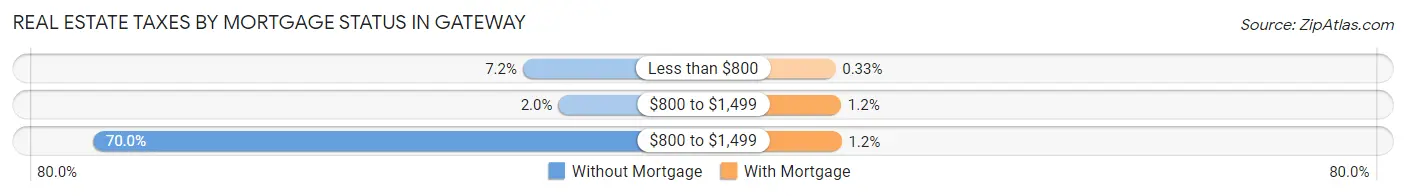
| Property Taxes | Without Mortgage | With Mortgage |
| Less than $800 | 25 (7.2%) | 4 (0.3%) |
| $800 to $1,499 | 7 (2.0%) | 14 (1.1%) |
| $800 to $1,499 | 243 (70.0%) | 15 (1.2%) |
| Total | 347 (100.0%) | 1,215 (100.0%) |
Health & Disability in Gateway
Health Insurance Coverage by Age in Gateway
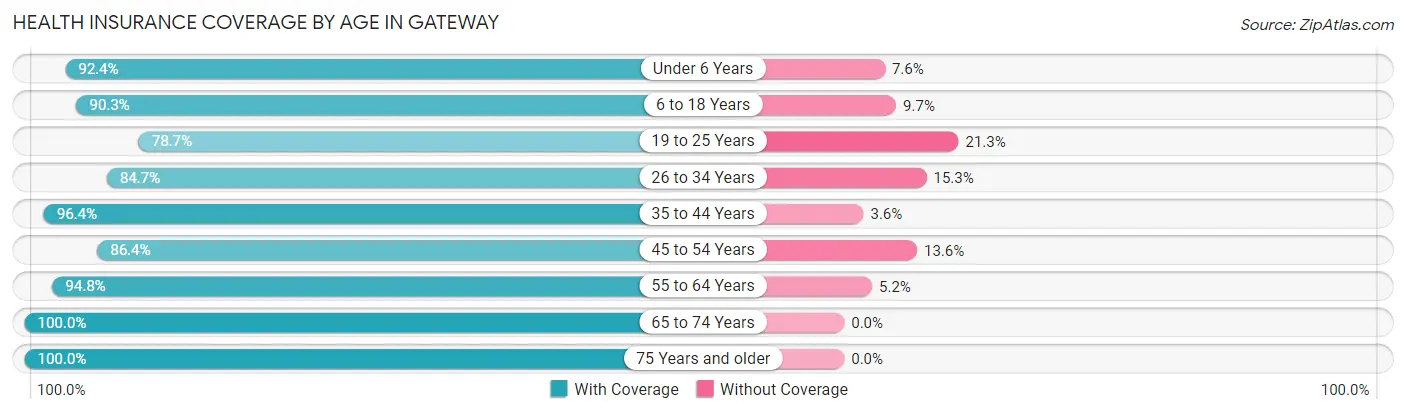
| Age Bracket | With Coverage | Without Coverage |
| Under 6 Years | 645 (92.4%) | 53 (7.6%) |
| 6 to 18 Years | 1,373 (90.3%) | 147 (9.7%) |
| 19 to 25 Years | 240 (78.7%) | 65 (21.3%) |
| 26 to 34 Years | 679 (84.7%) | 123 (15.3%) |
| 35 to 44 Years | 993 (96.4%) | 37 (3.6%) |
| 45 to 54 Years | 573 (86.4%) | 90 (13.6%) |
| 55 to 64 Years | 511 (94.8%) | 28 (5.2%) |
| 65 to 74 Years | 367 (100.0%) | 0 (0.0%) |
| 75 Years and older | 155 (100.0%) | 0 (0.0%) |
| Total | 5,536 (91.1%) | 543 (8.9%) |
Health Insurance Coverage by Citizenship Status in Gateway
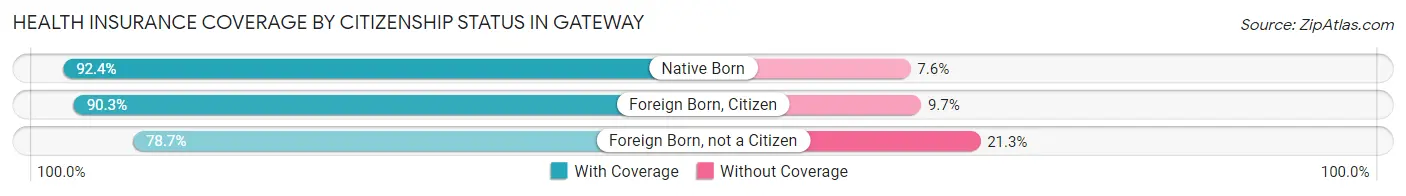
| Citizenship Status | With Coverage | Without Coverage |
| Native Born | 645 (92.4%) | 53 (7.6%) |
| Foreign Born, Citizen | 1,373 (90.3%) | 147 (9.7%) |
| Foreign Born, not a Citizen | 240 (78.7%) | 65 (21.3%) |
Health Insurance Coverage by Household Income in Gateway
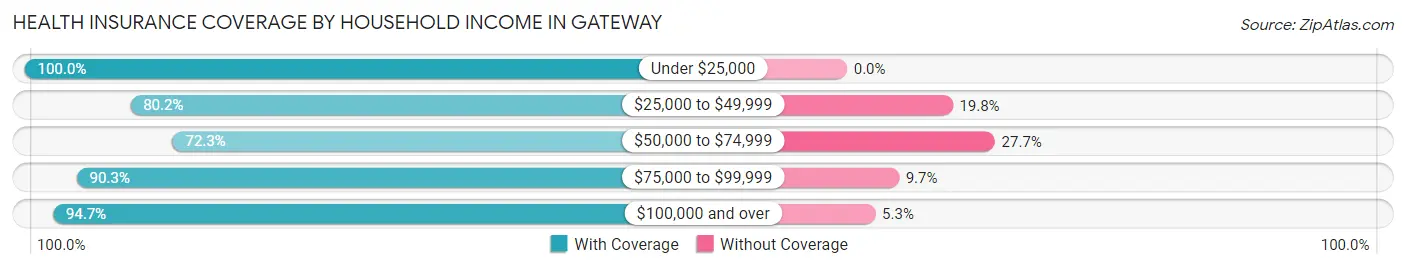
| Household Income | With Coverage | Without Coverage |
| Under $25,000 | 128 (100.0%) | 0 (0.0%) |
| $25,000 to $49,999 | 231 (80.2%) | 57 (19.8%) |
| $50,000 to $74,999 | 449 (72.3%) | 172 (27.7%) |
| $75,000 to $99,999 | 956 (90.3%) | 103 (9.7%) |
| $100,000 and over | 3,762 (94.7%) | 211 (5.3%) |
Public vs Private Health Insurance Coverage by Age in Gateway
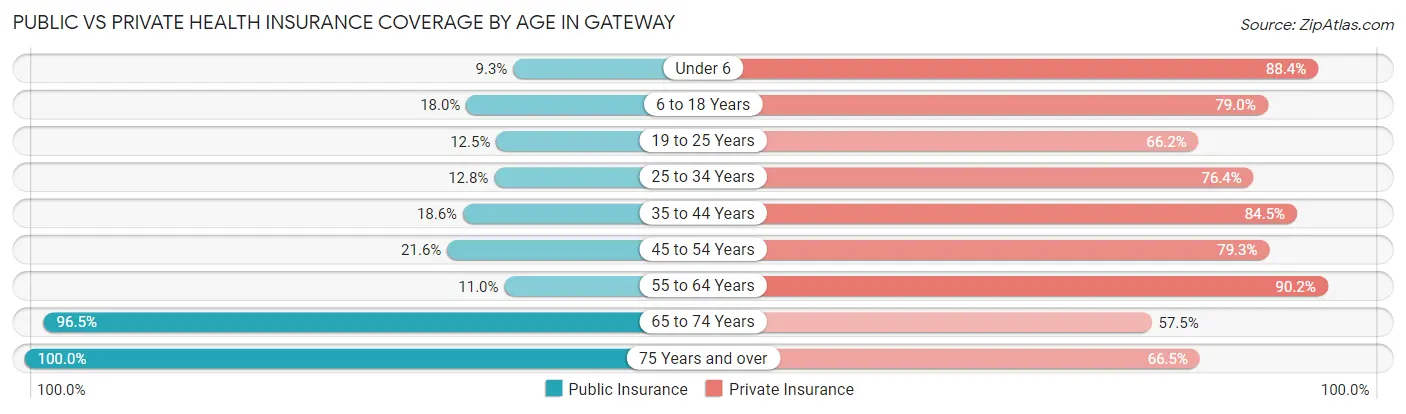
| Age Bracket | Public Insurance | Private Insurance |
| Under 6 | 65 (9.3%) | 617 (88.4%) |
| 6 to 18 Years | 274 (18.0%) | 1,201 (79.0%) |
| 19 to 25 Years | 38 (12.5%) | 202 (66.2%) |
| 25 to 34 Years | 103 (12.8%) | 613 (76.4%) |
| 35 to 44 Years | 192 (18.6%) | 870 (84.5%) |
| 45 to 54 Years | 143 (21.6%) | 526 (79.3%) |
| 55 to 64 Years | 59 (11.0%) | 486 (90.2%) |
| 65 to 74 Years | 354 (96.5%) | 211 (57.5%) |
| 75 Years and over | 155 (100.0%) | 103 (66.4%) |
| Total | 1,383 (22.8%) | 4,829 (79.4%) |
Disability Status by Sex by Age in Gateway
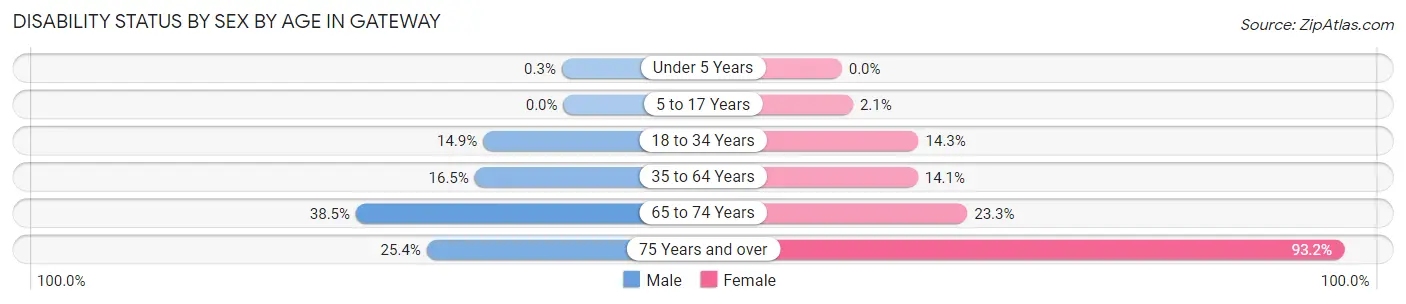
| Age Bracket | Male | Female |
| Under 5 Years | 1 (0.3%) | 0 (0.0%) |
| 5 to 17 Years | 0 (0.0%) | 16 (2.1%) |
| 18 to 34 Years | 82 (14.9%) | 86 (14.3%) |
| 35 to 64 Years | 168 (16.5%) | 171 (14.1%) |
| 65 to 74 Years | 62 (38.5%) | 48 (23.3%) |
| 75 Years and over | 17 (25.4%) | 82 (93.2%) |
Disability Class by Sex by Age in Gateway
Disability Class: Hearing Difficulty
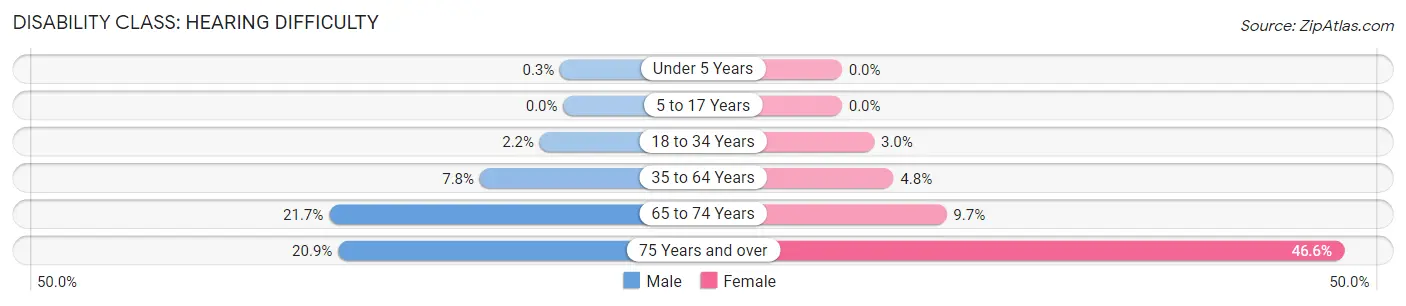
| Age Bracket | Male | Female |
| Under 5 Years | 1 (0.3%) | 0 (0.0%) |
| 5 to 17 Years | 0 (0.0%) | 0 (0.0%) |
| 18 to 34 Years | 12 (2.2%) | 18 (3.0%) |
| 35 to 64 Years | 79 (7.7%) | 58 (4.8%) |
| 65 to 74 Years | 35 (21.7%) | 20 (9.7%) |
| 75 Years and over | 14 (20.9%) | 41 (46.6%) |
Disability Class: Vision Difficulty
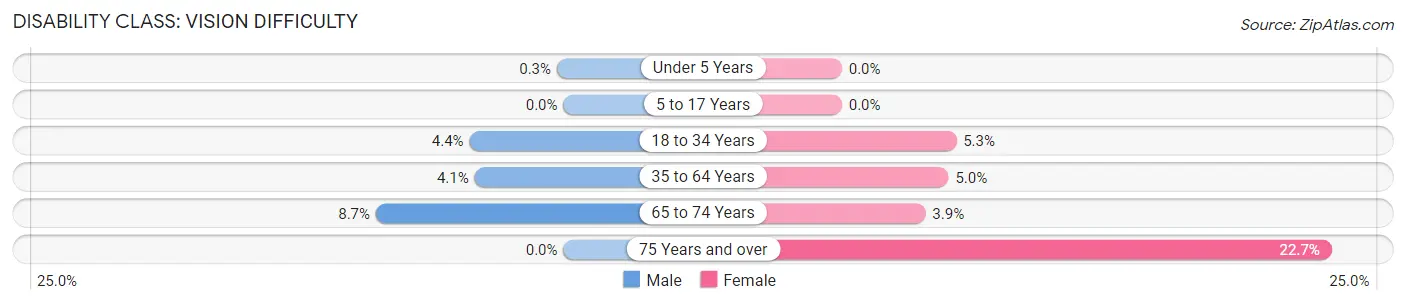
| Age Bracket | Male | Female |
| Under 5 Years | 1 (0.3%) | 0 (0.0%) |
| 5 to 17 Years | 0 (0.0%) | 0 (0.0%) |
| 18 to 34 Years | 24 (4.4%) | 32 (5.3%) |
| 35 to 64 Years | 42 (4.1%) | 60 (5.0%) |
| 65 to 74 Years | 14 (8.7%) | 8 (3.9%) |
| 75 Years and over | 0 (0.0%) | 20 (22.7%) |
Disability Class: Cognitive Difficulty
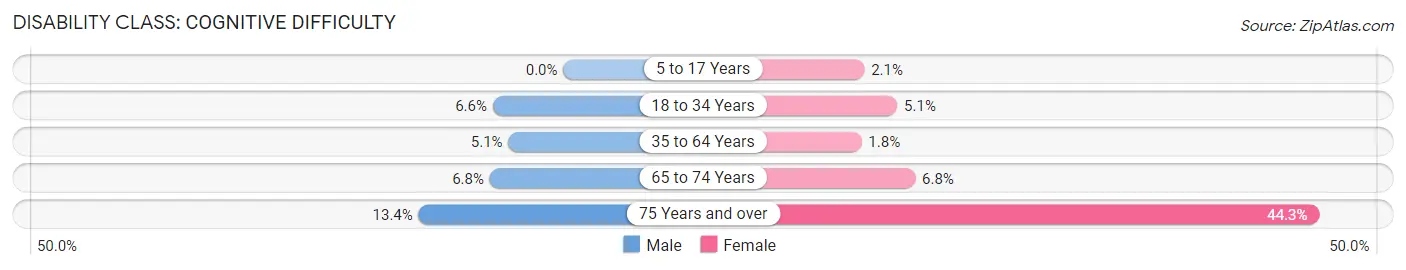
| Age Bracket | Male | Female |
| 5 to 17 Years | 0 (0.0%) | 16 (2.1%) |
| 18 to 34 Years | 36 (6.6%) | 31 (5.1%) |
| 35 to 64 Years | 52 (5.1%) | 22 (1.8%) |
| 65 to 74 Years | 11 (6.8%) | 14 (6.8%) |
| 75 Years and over | 9 (13.4%) | 39 (44.3%) |
Disability Class: Ambulatory Difficulty
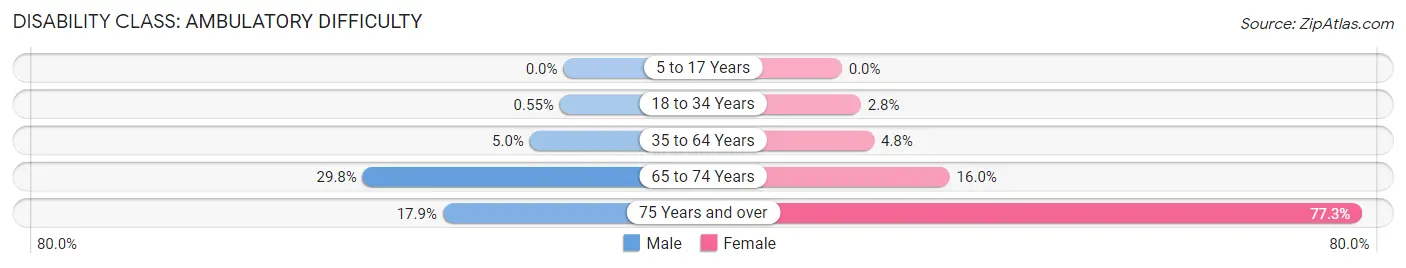
| Age Bracket | Male | Female |
| 5 to 17 Years | 0 (0.0%) | 0 (0.0%) |
| 18 to 34 Years | 3 (0.5%) | 17 (2.8%) |
| 35 to 64 Years | 51 (5.0%) | 58 (4.8%) |
| 65 to 74 Years | 48 (29.8%) | 33 (16.0%) |
| 75 Years and over | 12 (17.9%) | 68 (77.3%) |
Disability Class: Self-Care Difficulty
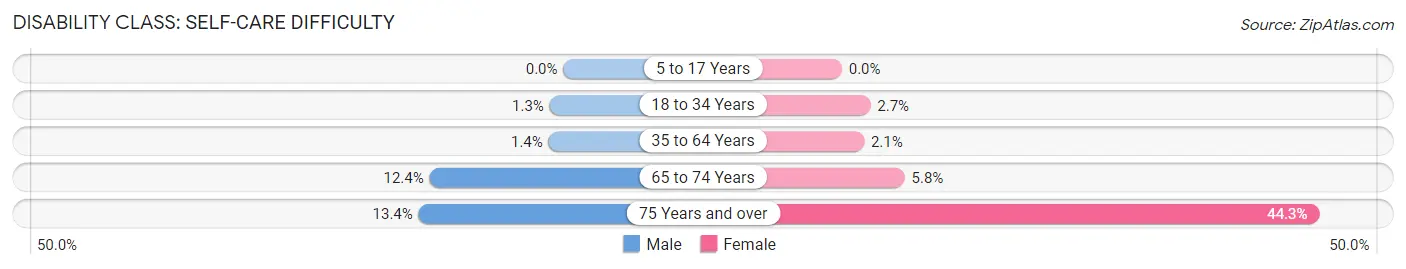
| Age Bracket | Male | Female |
| 5 to 17 Years | 0 (0.0%) | 0 (0.0%) |
| 18 to 34 Years | 7 (1.3%) | 16 (2.6%) |
| 35 to 64 Years | 14 (1.4%) | 25 (2.1%) |
| 65 to 74 Years | 20 (12.4%) | 12 (5.8%) |
| 75 Years and over | 9 (13.4%) | 39 (44.3%) |
Technology Access in Gateway
Computing Device Access in Gateway
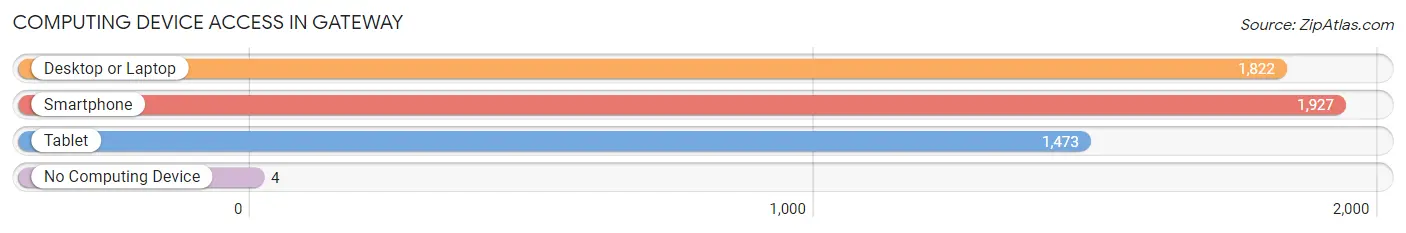
| Device Type | # Households | % Households |
| Desktop or Laptop | 1,822 | 90.9% |
| Smartphone | 1,927 | 96.2% |
| Tablet | 1,473 | 73.5% |
| No Computing Device | 4 | 0.2% |
| Total | 2,004 | 100.0% |
Internet Access in Gateway
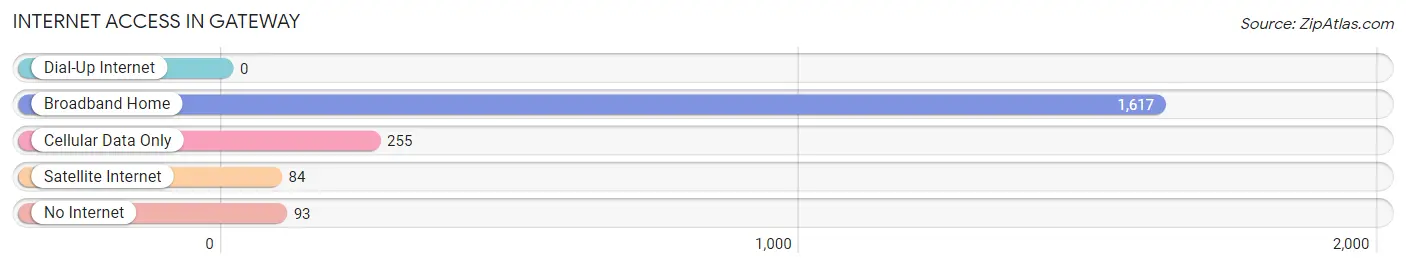
| Internet Type | # Households | % Households |
| Dial-Up Internet | 0 | 0.0% |
| Broadband Home | 1,617 | 80.7% |
| Cellular Data Only | 255 | 12.7% |
| Satellite Internet | 84 | 4.2% |
| No Internet | 93 | 4.6% |
| Total | 2,004 | 100.0% |
Gateway Summary
Gateway, Alaska is a small unincorporated community located in the Yukon-Koyukuk Census Area of the U.S. state of Alaska. It is situated on the south bank of the Yukon River, approximately 40 miles (64 km) east of the city of Galena. The population of Gateway was estimated to be 28 in 2020.
History
The area around Gateway has been inhabited by the Koyukon Athabascan people for thousands of years. The first non-Native settlers arrived in the area in the late 19th century, when gold was discovered in the nearby hills. The settlement was originally known as "Koyukuk City," but was later renamed "Gateway" due to its location at the entrance to the Yukon River.
In the early 20th century, Gateway was a bustling community with a population of over 500 people. It was a major trading post for the Koyukon people, who would come to trade furs and other goods. The town also had a post office, a school, a general store, and a hotel.
In the 1950s, the population of Gateway began to decline as people moved away in search of better economic opportunities. By the 1970s, the population had dropped to just a few dozen people.
Geography
Gateway is located in the Yukon-Koyukuk Census Area of Alaska, approximately 40 miles (64 km) east of the city of Galena. It is situated on the south bank of the Yukon River, at the entrance to the river. The surrounding area is mostly flat, with rolling hills and low mountains in the distance.
The climate in Gateway is subarctic, with long, cold winters and short, mild summers. The average temperature in January is -20°F (-29°C), and the average temperature in July is 60°F (16°C).
Economy
The economy of Gateway is largely based on subsistence activities, such as hunting, fishing, and trapping. The town also has a small tourism industry, with visitors coming to fish, hunt, and enjoy the scenery.
The town is home to a small general store, which sells basic supplies and groceries. There is also a post office, a school, and a hotel.
Demographics
As of 2020, the population of Gateway was estimated to be 28. The majority of the population is Native American, with the majority being Koyukon Athabascan. The median age of the population is 33.5 years, and the median household income is $25,000.
Conclusion
Gateway, Alaska is a small unincorporated community located in the Yukon-Koyukuk Census Area of the U.S. state of Alaska. It has a long history of being inhabited by the Koyukon Athabascan people, and was once a bustling trading post. Today, the economy of Gateway is largely based on subsistence activities, such as hunting, fishing, and trapping. The population of Gateway was estimated to be 28 in 2020, with the majority being Native American.
Common Questions
What is Per Capita Income in Gateway?
Per Capita income in Gateway is $48,346.
What is the Median Family Income in Gateway?
Median Family Income in Gateway is $122,336.
What is the Median Household income in Gateway?
Median Household Income in Gateway is $115,735.
What is Income or Wage Gap in Gateway?
Income or Wage Gap in Gateway is 27.0%.
Women in Gateway earn 73.0 cents for every dollar earned by a man.
What is Inequality or Gini Index in Gateway?
Inequality or Gini Index in Gateway is 0.38.
What is the Total Population of Gateway?
Total Population of Gateway is 6,241.
What is the Total Male Population of Gateway?
Total Male Population of Gateway is 3,071.
What is the Total Female Population of Gateway?
Total Female Population of Gateway is 3,170.
What is the Ratio of Males per 100 Females in Gateway?
There are 96.88 Males per 100 Females in Gateway.
What is the Ratio of Females per 100 Males in Gateway?
There are 103.22 Females per 100 Males in Gateway.
What is the Median Population Age in Gateway?
Median Population Age in Gateway is 33.2 Years.
What is the Average Family Size in Gateway
Average Family Size in Gateway is 3.4 People.
What is the Average Household Size in Gateway
Average Household Size in Gateway is 3.1 People.
How Large is the Labor Force in Gateway?
There are 3,141 People in the Labor Forcein in Gateway.
What is the Percentage of People in the Labor Force in Gateway?
73.5% of People are in the Labor Force in Gateway.
What is the Unemployment Rate in Gateway?
Unemployment Rate in Gateway is 5.3%.