Mission Hills, KS Map & Demographics
Mission Hills Map
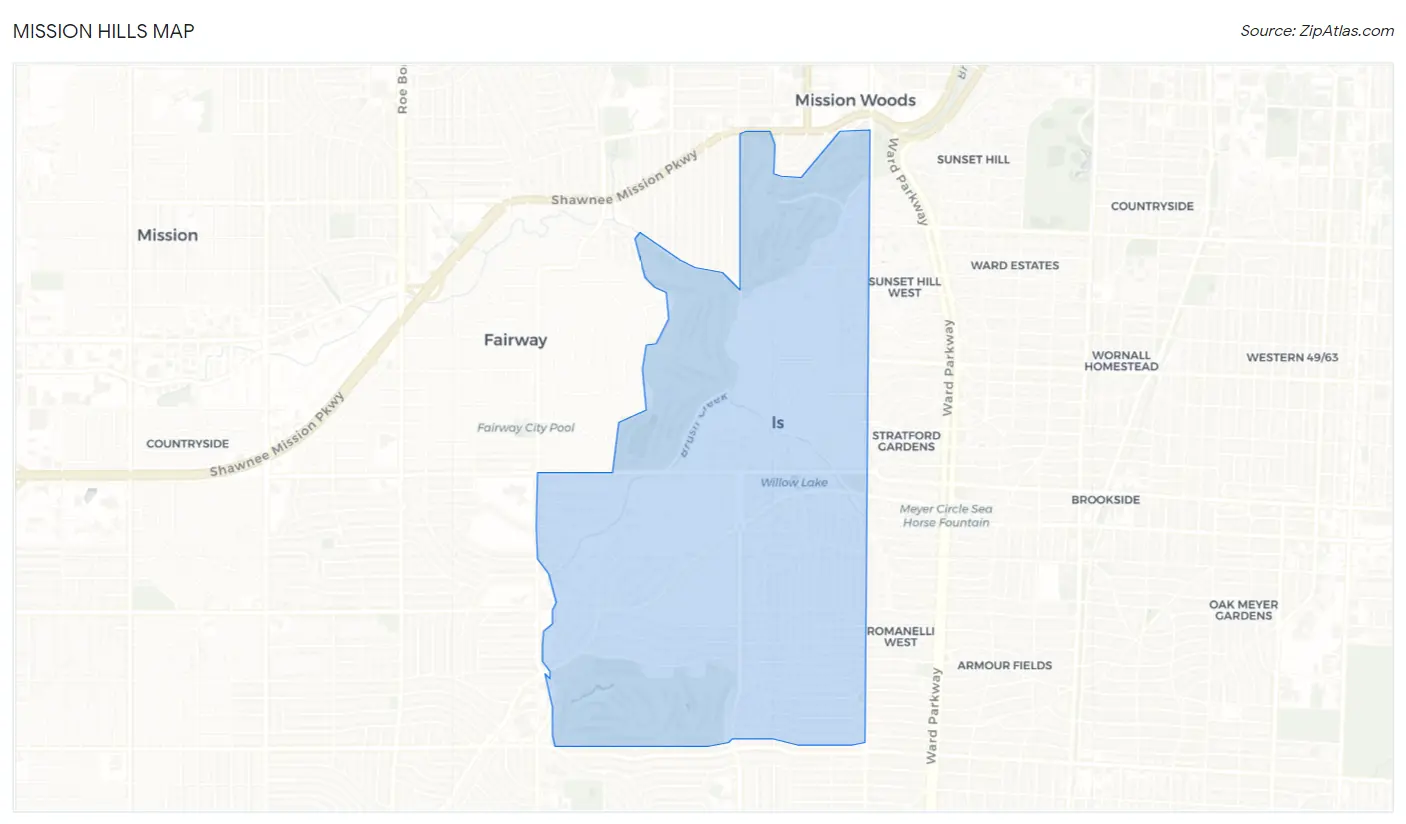
Mission Hills Overview
$235,738
PER CAPITA INCOME
$250,001
AVG FAMILY INCOME
$250,001
AVG HOUSEHOLD INCOME
77.8%
WAGE / INCOME GAP [ % ]
22.2¢/ $1
WAGE / INCOME GAP [ $ ]
0.46
INEQUALITY / GINI INDEX
3,567
TOTAL POPULATION
1,761
MALE POPULATION
1,806
FEMALE POPULATION
97.51
MALES / 100 FEMALES
102.56
FEMALES / 100 MALES
49.8
MEDIAN AGE
3.1
AVG FAMILY SIZE
2.8
AVG HOUSEHOLD SIZE
1,828
LABOR FORCE [ PEOPLE ]
66.5%
PERCENT IN LABOR FORCE
0.5%
UNEMPLOYMENT RATE
Mission Hills Area Codes
Income in Mission Hills
Income Overview in Mission Hills
Per Capita Income in Mission Hills is $235,738, while median incomes of families and households are $250,001 and $250,001 respectively.
| Characteristic | Number | Measure |
| Per Capita Income | 3,567 | $235,738 |
| Median Family Income | 1,071 | $250,001 |
| Mean Family Income | 1,071 | $527,169 |
| Median Household Income | 1,254 | $250,001 |
| Mean Household Income | 1,254 | $483,849 |
| Income Deficit | 1,071 | $0 |
| Wage / Income Gap (%) | 3,567 | 77.76% |
| Wage / Income Gap ($) | 3,567 | 22.24¢ per $1 |
| Gini / Inequality Index | 3,567 | 0.46 |
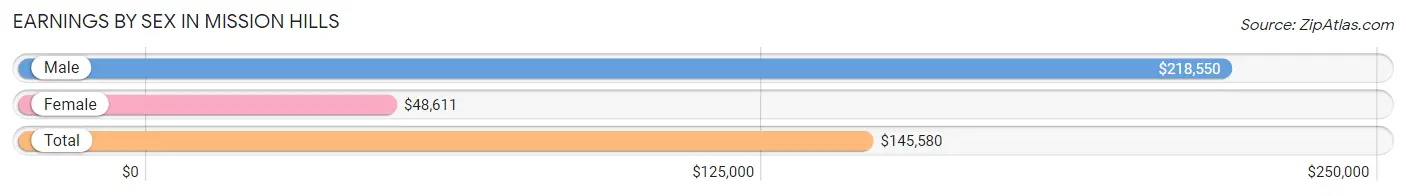
Earnings by Sex in Mission Hills
Average Earnings in Mission Hills are $145,580, $218,550 for men and $48,611 for women, a difference of 77.8%.
| Sex | Number | Average Earnings |
| Male | 1,180 (61.7%) | $218,550 |
| Female | 734 (38.4%) | $48,611 |
| Total | 1,914 (100.0%) | $145,580 |
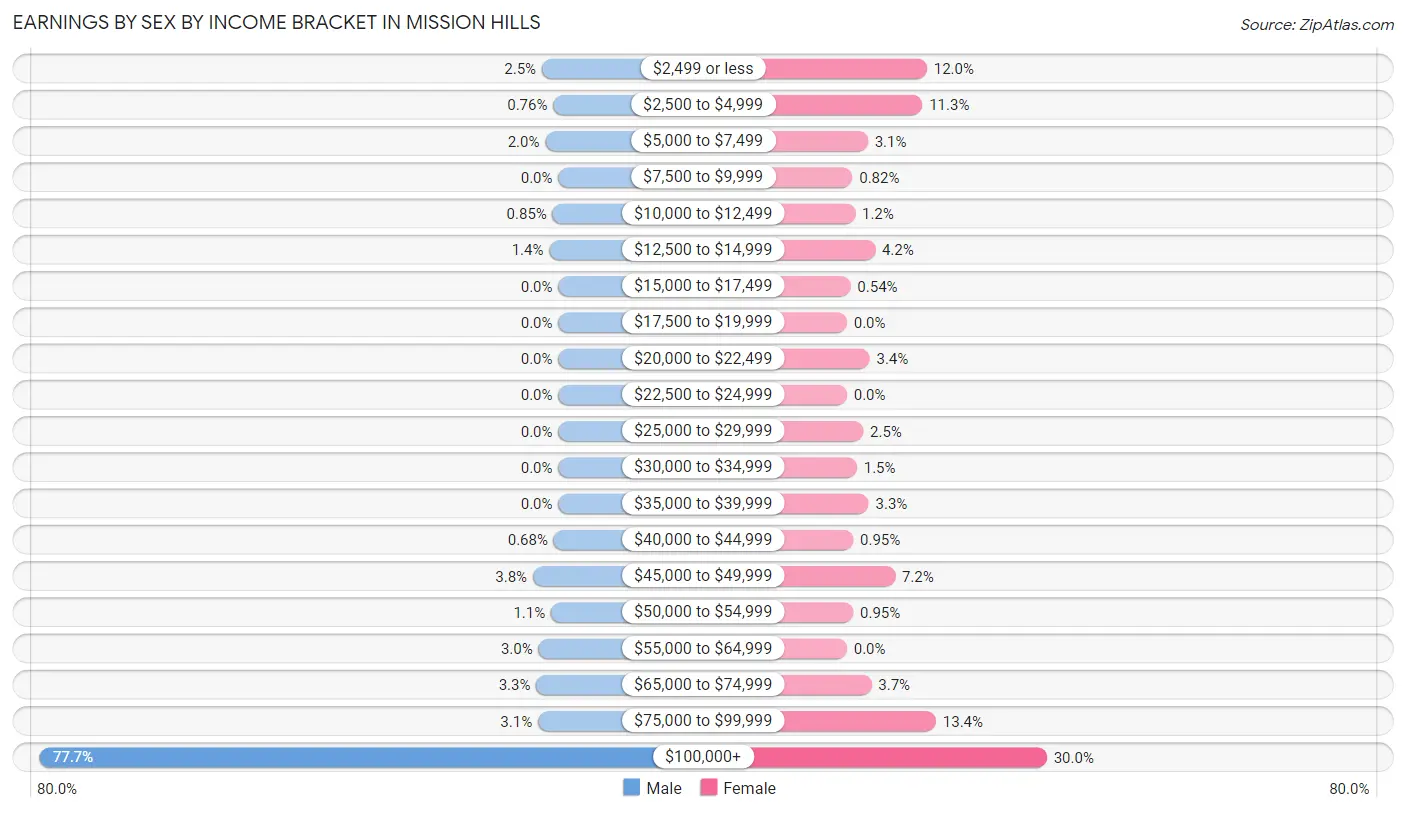
Earnings by Sex by Income Bracket in Mission Hills
The most common earnings brackets in Mission Hills are $100,000+ for men (917 | 77.7%) and $100,000+ for women (220 | 30.0%).
| Income | Male | Female |
| $2,499 or less | 29 (2.5%) | 88 (12.0%) |
| $2,500 to $4,999 | 9 (0.8%) | 83 (11.3%) |
| $5,000 to $7,499 | 23 (1.9%) | 23 (3.1%) |
| $7,500 to $9,999 | 0 (0.0%) | 6 (0.8%) |
| $10,000 to $12,499 | 10 (0.9%) | 9 (1.2%) |
| $12,500 to $14,999 | 16 (1.4%) | 31 (4.2%) |
| $15,000 to $17,499 | 0 (0.0%) | 4 (0.5%) |
| $17,500 to $19,999 | 0 (0.0%) | 0 (0.0%) |
| $20,000 to $22,499 | 0 (0.0%) | 25 (3.4%) |
| $22,500 to $24,999 | 0 (0.0%) | 0 (0.0%) |
| $25,000 to $29,999 | 0 (0.0%) | 18 (2.5%) |
| $30,000 to $34,999 | 0 (0.0%) | 11 (1.5%) |
| $35,000 to $39,999 | 0 (0.0%) | 24 (3.3%) |
| $40,000 to $44,999 | 8 (0.7%) | 7 (0.9%) |
| $45,000 to $49,999 | 45 (3.8%) | 53 (7.2%) |
| $50,000 to $54,999 | 13 (1.1%) | 7 (0.9%) |
| $55,000 to $64,999 | 35 (3.0%) | 0 (0.0%) |
| $65,000 to $74,999 | 39 (3.3%) | 27 (3.7%) |
| $75,000 to $99,999 | 36 (3.0%) | 98 (13.4%) |
| $100,000+ | 917 (77.7%) | 220 (30.0%) |
| Total | 1,180 (100.0%) | 734 (100.0%) |
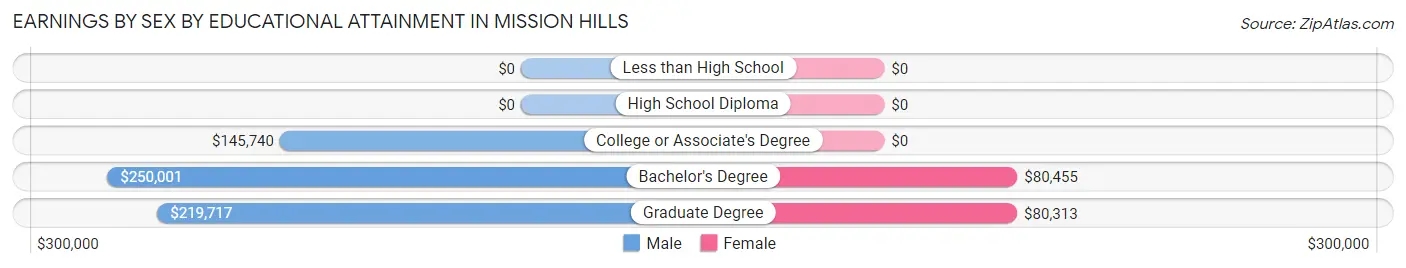
Earnings by Sex by Educational Attainment in Mission Hills
Average earnings in Mission Hills are $218,942 for men and $73,472 for women, a difference of 66.4%. Men with an educational attainment of bachelor's degree enjoy the highest average annual earnings of $250,001, while those with college or associate's degree education earn the least with $145,740. Women with an educational attainment of bachelor's degree earn the most with the average annual earnings of $80,455, while those with graduate degree education have the smallest earnings of $80,313.
| Educational Attainment | Male Income | Female Income |
| Less than High School | - | - |
| High School Diploma | - | - |
| College or Associate's Degree | $145,740 | $0 |
| Bachelor's Degree | $250,001 | $80,455 |
| Graduate Degree | $219,717 | $80,313 |
| Total | $218,942 | $73,472 |
Family Income in Mission Hills
Family Income Brackets in Mission Hills
According to the Mission Hills family income data, there are 810 families falling into the $200,000+ income range, which is the most common income bracket and makes up 75.6% of all families.
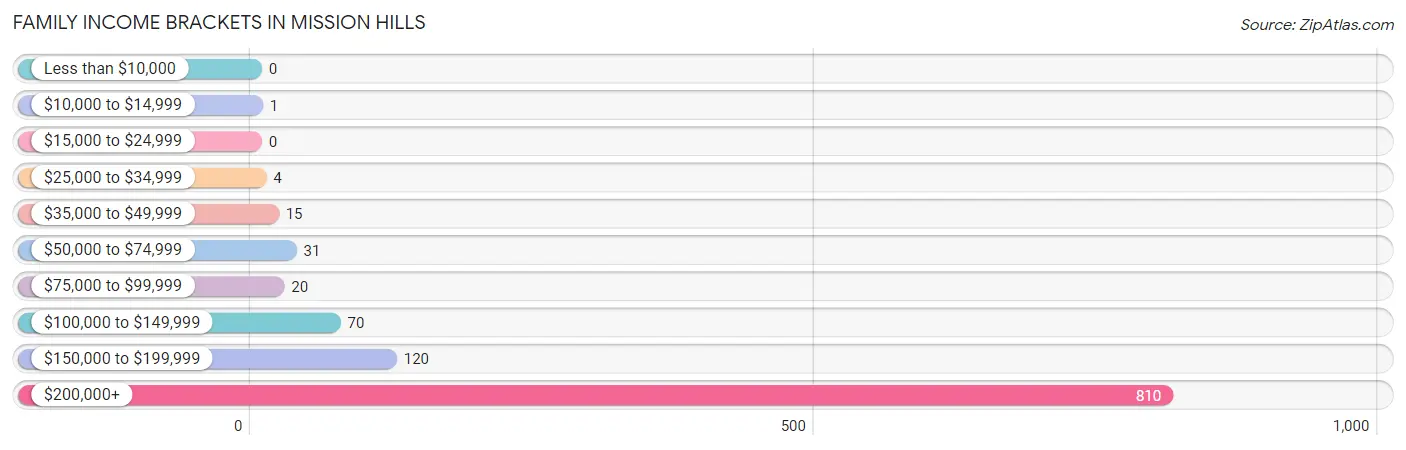
| Income Bracket | # Families | % Families |
| Less than $10,000 | 0 | 0.0% |
| $10,000 to $14,999 | 1 | 0.1% |
| $15,000 to $24,999 | 0 | 0.0% |
| $25,000 to $34,999 | 4 | 0.4% |
| $35,000 to $49,999 | 15 | 1.4% |
| $50,000 to $74,999 | 31 | 2.9% |
| $75,000 to $99,999 | 20 | 1.9% |
| $100,000 to $149,999 | 70 | 6.5% |
| $150,000 to $199,999 | 120 | 11.2% |
| $200,000+ | 810 | 75.6% |
Family Income by Famaliy Size in Mission Hills
2-person families (582 | 54.3%) account for the highest median family income in Mission Hills with $250,001 per family, while 2-person families (582 | 54.3%) have the highest median income of $125,000 per family member.
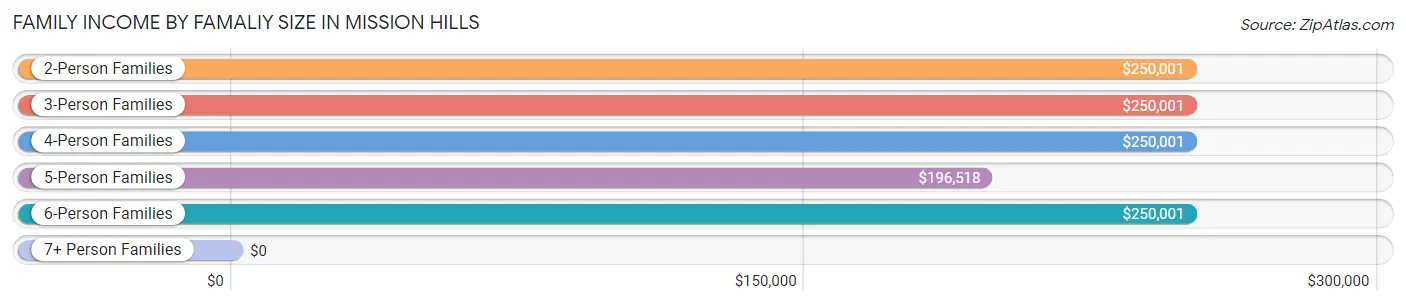
| Income Bracket | # Families | Median Income |
| 2-Person Families | 582 (54.3%) | $250,001 |
| 3-Person Families | 139 (13.0%) | $250,001 |
| 4-Person Families | 213 (19.9%) | $250,001 |
| 5-Person Families | 114 (10.6%) | $196,518 |
| 6-Person Families | 23 (2.1%) | $250,001 |
| 7+ Person Families | 0 (0.0%) | $0 |
| Total | 1,071 (100.0%) | $250,001 |
Family Income by Number of Earners in Mission Hills
The median family income in Mission Hills is $250,001, with families comprising 1 earner (421) having the highest median family income of $250,001, while families with no earners (94) have the lowest median family income of $184,167, accounting for 39.3% and 8.8% of families, respectively.
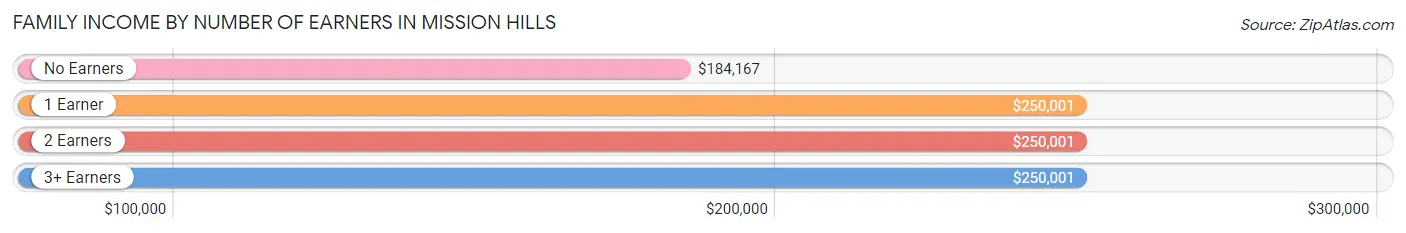
| Number of Earners | # Families | Median Income |
| No Earners | 94 (8.8%) | $184,167 |
| 1 Earner | 421 (39.3%) | $250,001 |
| 2 Earners | 465 (43.4%) | $250,001 |
| 3+ Earners | 91 (8.5%) | $250,001 |
| Total | 1,071 (100.0%) | $250,001 |
Household Income in Mission Hills
Household Income Brackets in Mission Hills
With 855 households falling in the category, the $200,000+ income range is the most frequent in Mission Hills, accounting for 68.2% of all households.
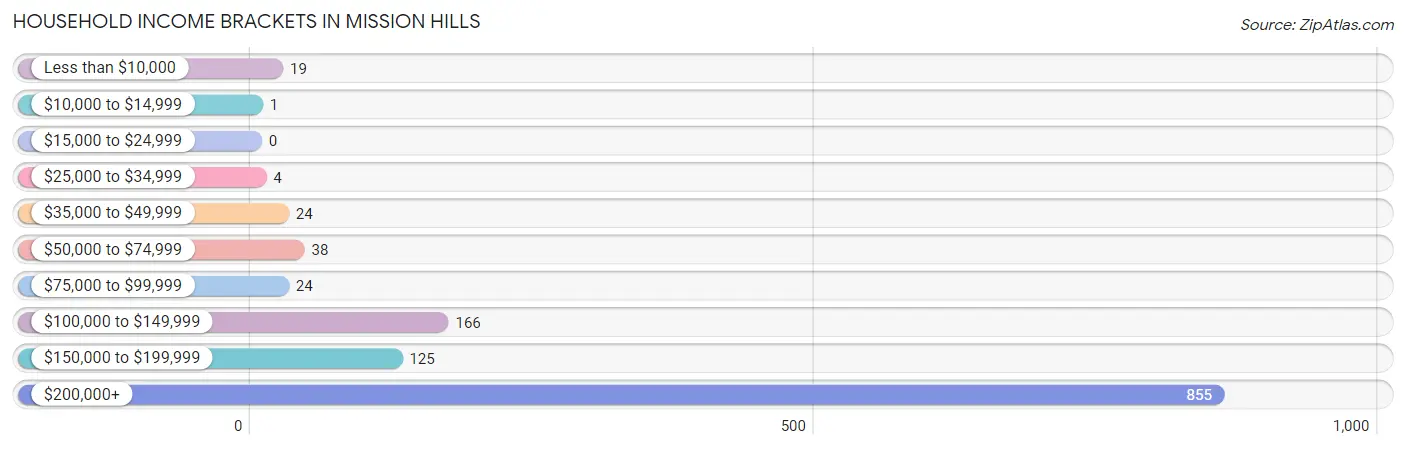
| Income Bracket | # Households | % Households |
| Less than $10,000 | 19 | 1.5% |
| $10,000 to $14,999 | 1 | 0.1% |
| $15,000 to $24,999 | 0 | 0.0% |
| $25,000 to $34,999 | 4 | 0.3% |
| $35,000 to $49,999 | 24 | 1.9% |
| $50,000 to $74,999 | 38 | 3.0% |
| $75,000 to $99,999 | 24 | 1.9% |
| $100,000 to $149,999 | 166 | 13.2% |
| $150,000 to $199,999 | 125 | 10.0% |
| $200,000+ | 855 | 68.2% |
Household Income by Householder Age in Mission Hills
The median household income in Mission Hills is $250,001, with the highest median household income of $250,001 found in the 25 to 44 years age bracket for the primary householder. A total of 278 households (22.2%) fall into this category.
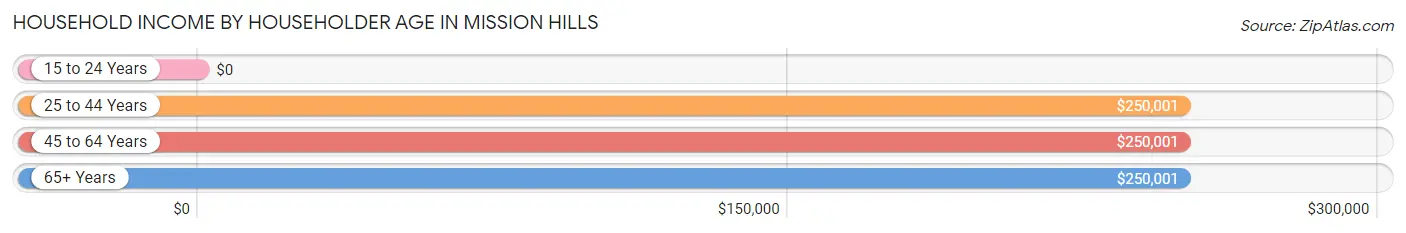
| Income Bracket | # Households | Median Income |
| 15 to 24 Years | 0 (0.0%) | $0 |
| 25 to 44 Years | 278 (22.2%) | $250,001 |
| 45 to 64 Years | 528 (42.1%) | $250,001 |
| 65+ Years | 448 (35.7%) | $250,001 |
| Total | 1,254 (100.0%) | $250,001 |
Poverty in Mission Hills
Income Below Poverty by Sex and Age in Mission Hills
With 0.6% poverty level for males and 1.0% for females among the residents of Mission Hills, 65 to 74 year old males and 18 to 24 year old females are the most vulnerable to poverty, with 10 males (2.3%) and 6 females (6.8%) in their respective age groups living below the poverty level.
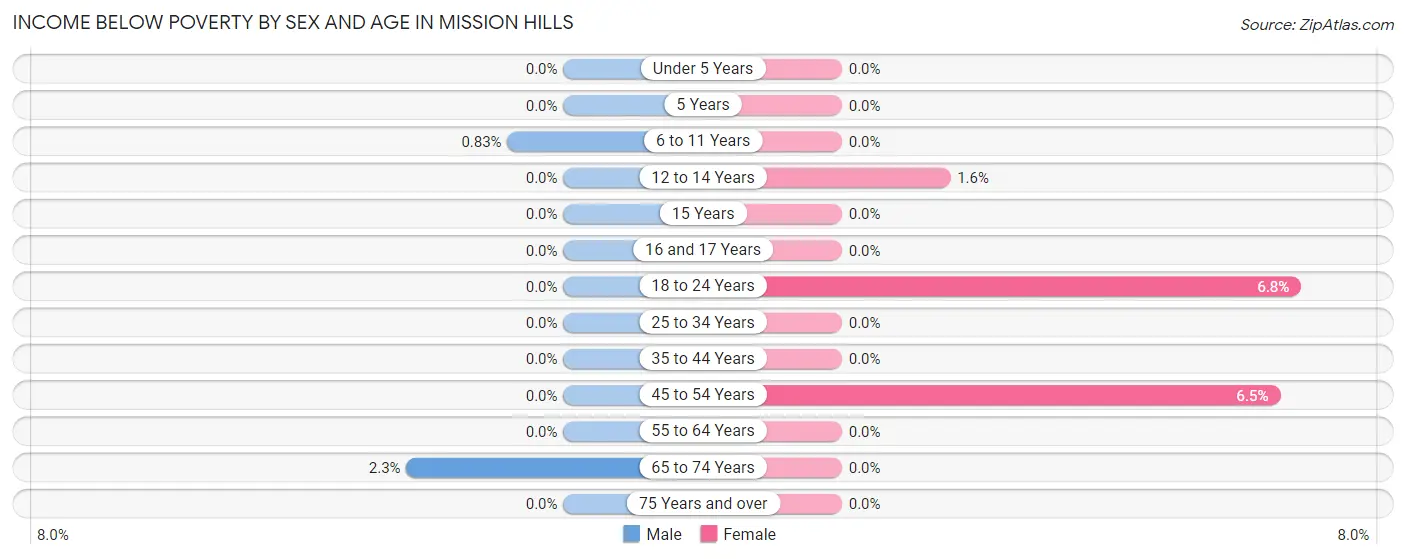
| Age Bracket | Male | Female |
| Under 5 Years | 0 (0.0%) | 0 (0.0%) |
| 5 Years | 0 (0.0%) | 0 (0.0%) |
| 6 to 11 Years | 1 (0.8%) | 0 (0.0%) |
| 12 to 14 Years | 0 (0.0%) | 1 (1.6%) |
| 15 Years | 0 (0.0%) | 0 (0.0%) |
| 16 and 17 Years | 0 (0.0%) | 0 (0.0%) |
| 18 to 24 Years | 0 (0.0%) | 6 (6.8%) |
| 25 to 34 Years | 0 (0.0%) | 0 (0.0%) |
| 35 to 44 Years | 0 (0.0%) | 0 (0.0%) |
| 45 to 54 Years | 0 (0.0%) | 11 (6.5%) |
| 55 to 64 Years | 0 (0.0%) | 0 (0.0%) |
| 65 to 74 Years | 10 (2.3%) | 0 (0.0%) |
| 75 Years and over | 0 (0.0%) | 0 (0.0%) |
| Total | 11 (0.6%) | 18 (1.0%) |
Income Above Poverty by Sex and Age in Mission Hills
According to the poverty statistics in Mission Hills, males aged under 5 years and females aged under 5 years are the age groups that are most secure financially, with 100.0% of males and 100.0% of females in these age groups living above the poverty line.
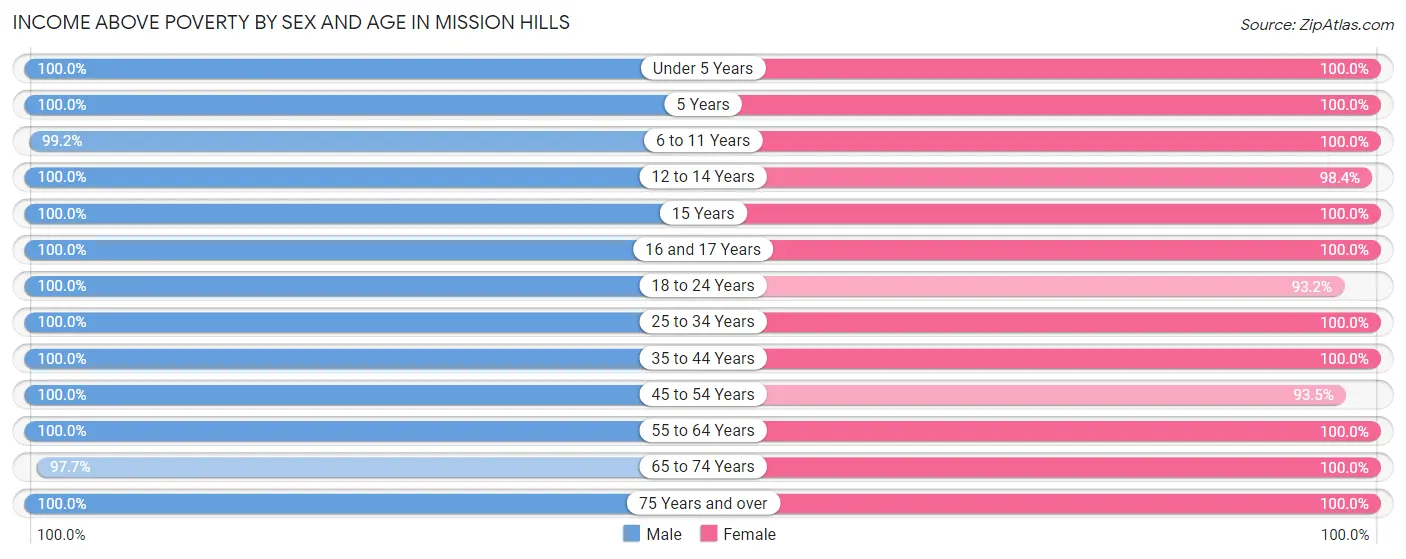
| Age Bracket | Male | Female |
| Under 5 Years | 74 (100.0%) | 88 (100.0%) |
| 5 Years | 67 (100.0%) | 4 (100.0%) |
| 6 to 11 Years | 120 (99.2%) | 262 (100.0%) |
| 12 to 14 Years | 97 (100.0%) | 61 (98.4%) |
| 15 Years | 26 (100.0%) | 17 (100.0%) |
| 16 and 17 Years | 26 (100.0%) | 10 (100.0%) |
| 18 to 24 Years | 38 (100.0%) | 82 (93.2%) |
| 25 to 34 Years | 36 (100.0%) | 113 (100.0%) |
| 35 to 44 Years | 242 (100.0%) | 256 (100.0%) |
| 45 to 54 Years | 151 (100.0%) | 158 (93.5%) |
| 55 to 64 Years | 335 (100.0%) | 366 (100.0%) |
| 65 to 74 Years | 420 (97.7%) | 275 (100.0%) |
| 75 Years and over | 118 (100.0%) | 96 (100.0%) |
| Total | 1,750 (99.4%) | 1,788 (99.0%) |
Income Below Poverty Among Married-Couple Families in Mission Hills
The poverty statistics for married-couple families in Mission Hills show that 0.1% or 1 of the total 1,043 families live below the poverty line. Families with 1 or 2 children have the highest poverty rate of 0.4%, comprising of 1 families. On the other hand, families with no children have the lowest poverty rate of 0.0%, which includes 0 families.
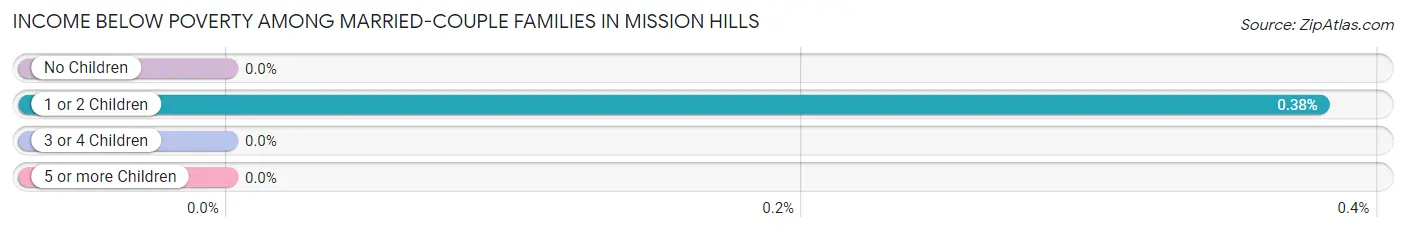
| Children | Above Poverty | Below Poverty |
| No Children | 654 (100.0%) | 0 (0.0%) |
| 1 or 2 Children | 264 (99.6%) | 1 (0.4%) |
| 3 or 4 Children | 124 (100.0%) | 0 (0.0%) |
| 5 or more Children | 0 (0.0%) | 0 (0.0%) |
| Total | 1,042 (99.9%) | 1 (0.1%) |
Income Below Poverty Among Single-Parent Households in Mission Hills
| Children | Single Father | Single Mother |
| No Children | 0 (0.0%) | 0 (0.0%) |
| 1 or 2 Children | 0 (0.0%) | 0 (0.0%) |
| 3 or 4 Children | 0 (0.0%) | 0 (0.0%) |
| 5 or more Children | 0 (0.0%) | 0 (0.0%) |
| Total | 0 (0.0%) | 0 (0.0%) |
Income Below Poverty Among Married-Couple vs Single-Parent Households in Mission Hills
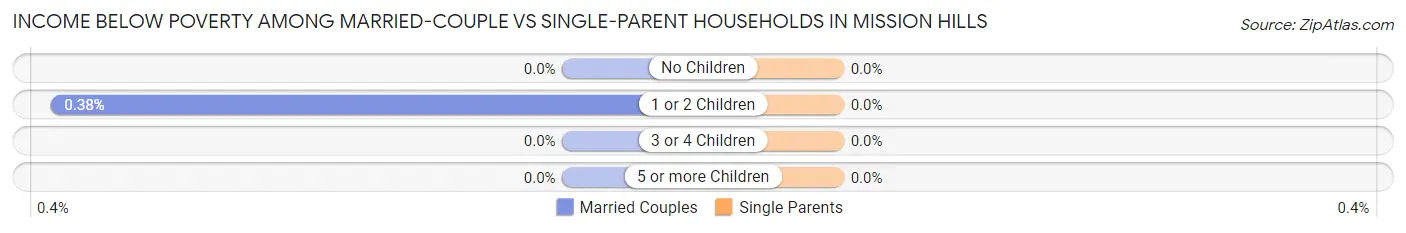
| Children | Married-Couple Families | Single-Parent Households |
| No Children | 0 (0.0%) | 0 (0.0%) |
| 1 or 2 Children | 1 (0.4%) | 0 (0.0%) |
| 3 or 4 Children | 0 (0.0%) | 0 (0.0%) |
| 5 or more Children | 0 (0.0%) | 0 (0.0%) |
| Total | 1 (0.1%) | 0 (0.0%) |
Race in Mission Hills
The most populous races in Mission Hills are White / Caucasian (3,281 | 92.0%), Asian (245 | 6.9%), and Hispanic or Latino (59 | 1.7%).
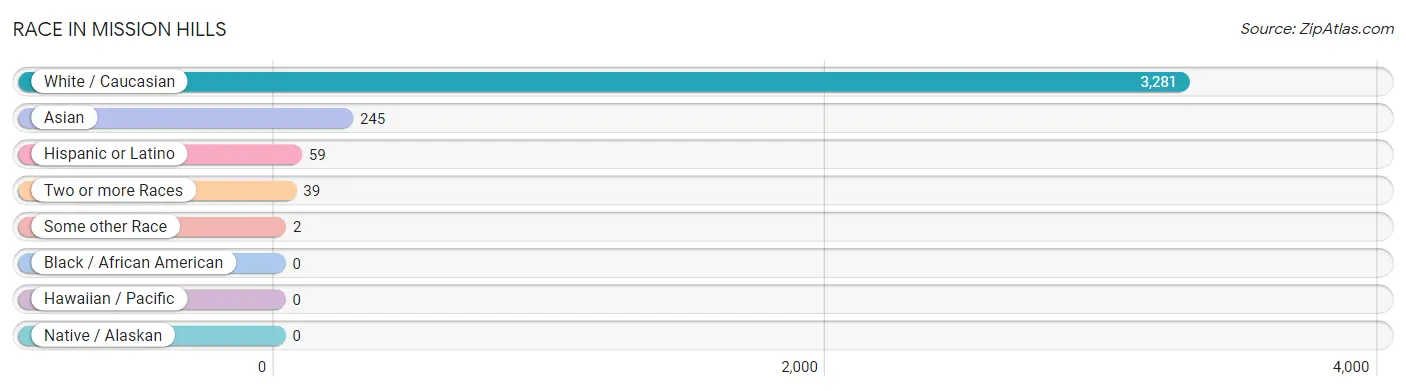
| Race | # Population | % Population |
| Asian | 245 | 6.9% |
| Black / African American | 0 | 0.0% |
| Hawaiian / Pacific | 0 | 0.0% |
| Hispanic or Latino | 59 | 1.7% |
| Native / Alaskan | 0 | 0.0% |
| White / Caucasian | 3,281 | 92.0% |
| Two or more Races | 39 | 1.1% |
| Some other Race | 2 | 0.1% |
| Total | 3,567 | 100.0% |
Ancestry in Mission Hills
The most populous ancestries reported in Mission Hills are English (872 | 24.4%), German (839 | 23.5%), Irish (518 | 14.5%), European (251 | 7.0%), and American (192 | 5.4%), together accounting for 74.9% of all Mission Hills residents.
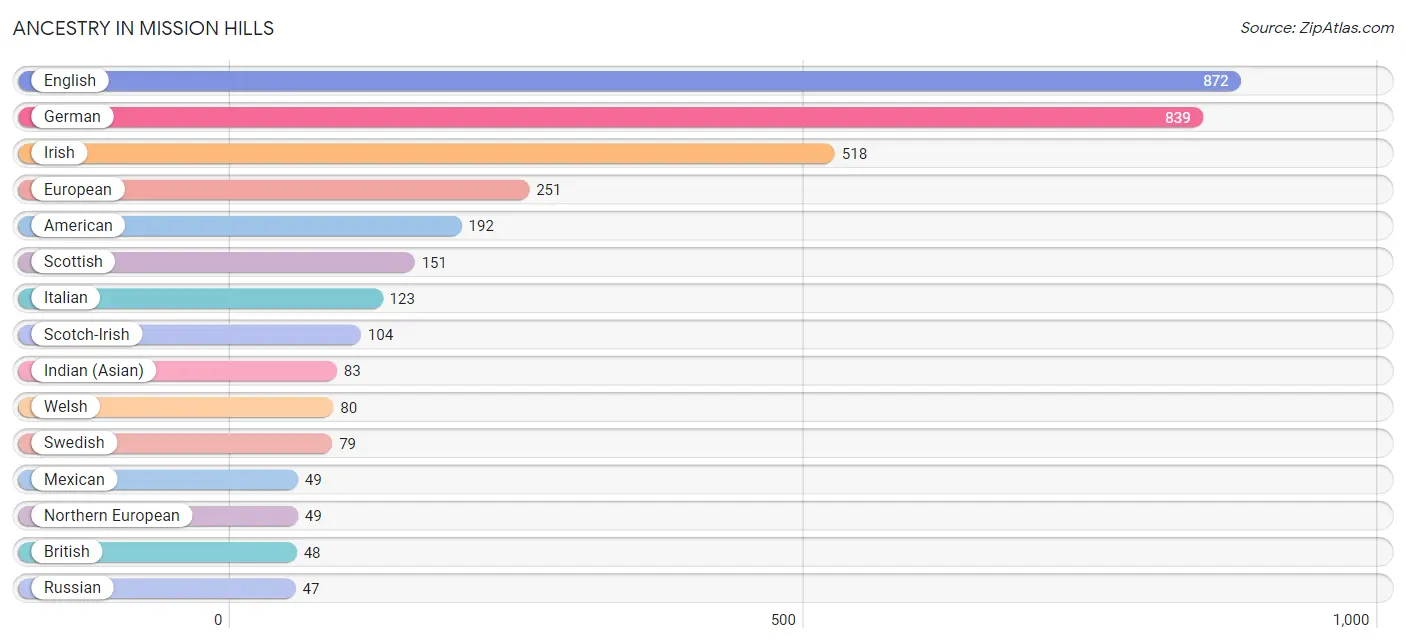
| Ancestry | # Population | % Population |
| American | 192 | 5.4% |
| Arab | 32 | 0.9% |
| Bangladeshi | 19 | 0.5% |
| British | 48 | 1.3% |
| Colombian | 6 | 0.2% |
| Croatian | 27 | 0.8% |
| Czech | 12 | 0.3% |
| Danish | 9 | 0.3% |
| Dutch | 40 | 1.1% |
| Eastern European | 17 | 0.5% |
| English | 872 | 24.4% |
| European | 251 | 7.0% |
| French | 33 | 0.9% |
| German | 839 | 23.5% |
| Greek | 39 | 1.1% |
| Hungarian | 19 | 0.5% |
| Indian (Asian) | 83 | 2.3% |
| Irish | 518 | 14.5% |
| Italian | 123 | 3.5% |
| Jordanian | 15 | 0.4% |
| Lithuanian | 15 | 0.4% |
| Mexican | 49 | 1.4% |
| Northern European | 49 | 1.4% |
| Norwegian | 35 | 1.0% |
| Osage | 3 | 0.1% |
| Palestinian | 15 | 0.4% |
| Peruvian | 4 | 0.1% |
| Polish | 41 | 1.1% |
| Russian | 47 | 1.3% |
| Scandinavian | 14 | 0.4% |
| Scotch-Irish | 104 | 2.9% |
| Scottish | 151 | 4.2% |
| South American | 10 | 0.3% |
| Swedish | 79 | 2.2% |
| Swiss | 46 | 1.3% |
| Thai | 15 | 0.4% |
| Welsh | 80 | 2.2% | View All 37 Rows |
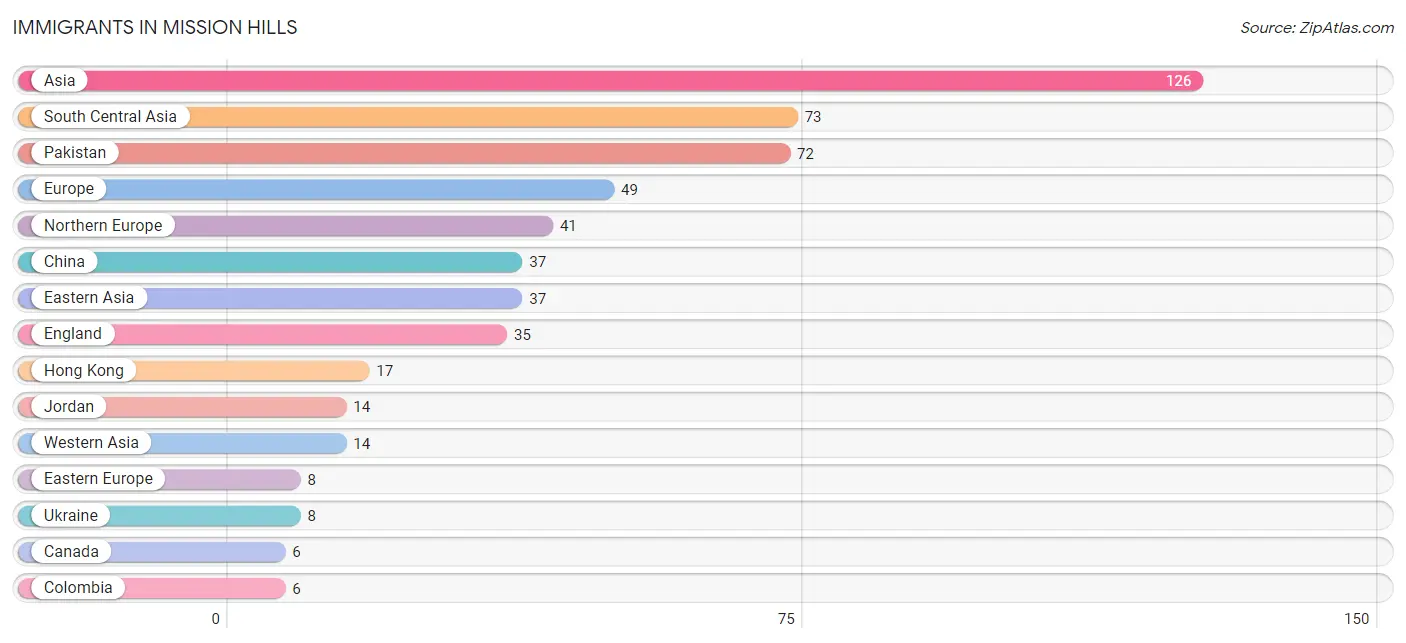
Immigrants in Mission Hills
The most numerous immigrant groups reported in Mission Hills came from Asia (126 | 3.5%), South Central Asia (73 | 2.1%), Pakistan (72 | 2.0%), Europe (49 | 1.4%), and Northern Europe (41 | 1.1%), together accounting for 10.1% of all Mission Hills residents.
| Immigration Origin | # Population | % Population |
| Asia | 126 | 3.5% |
| Canada | 6 | 0.2% |
| China | 37 | 1.0% |
| Colombia | 6 | 0.2% |
| Eastern Asia | 37 | 1.0% |
| Eastern Europe | 8 | 0.2% |
| England | 35 | 1.0% |
| Europe | 49 | 1.4% |
| Hong Kong | 17 | 0.5% |
| Jordan | 14 | 0.4% |
| Latin America | 6 | 0.2% |
| Northern Europe | 41 | 1.1% |
| Pakistan | 72 | 2.0% |
| South America | 6 | 0.2% |
| South Central Asia | 73 | 2.1% |
| South Eastern Asia | 2 | 0.1% |
| Ukraine | 8 | 0.2% |
| Vietnam | 2 | 0.1% |
| Western Asia | 14 | 0.4% | View All 19 Rows |
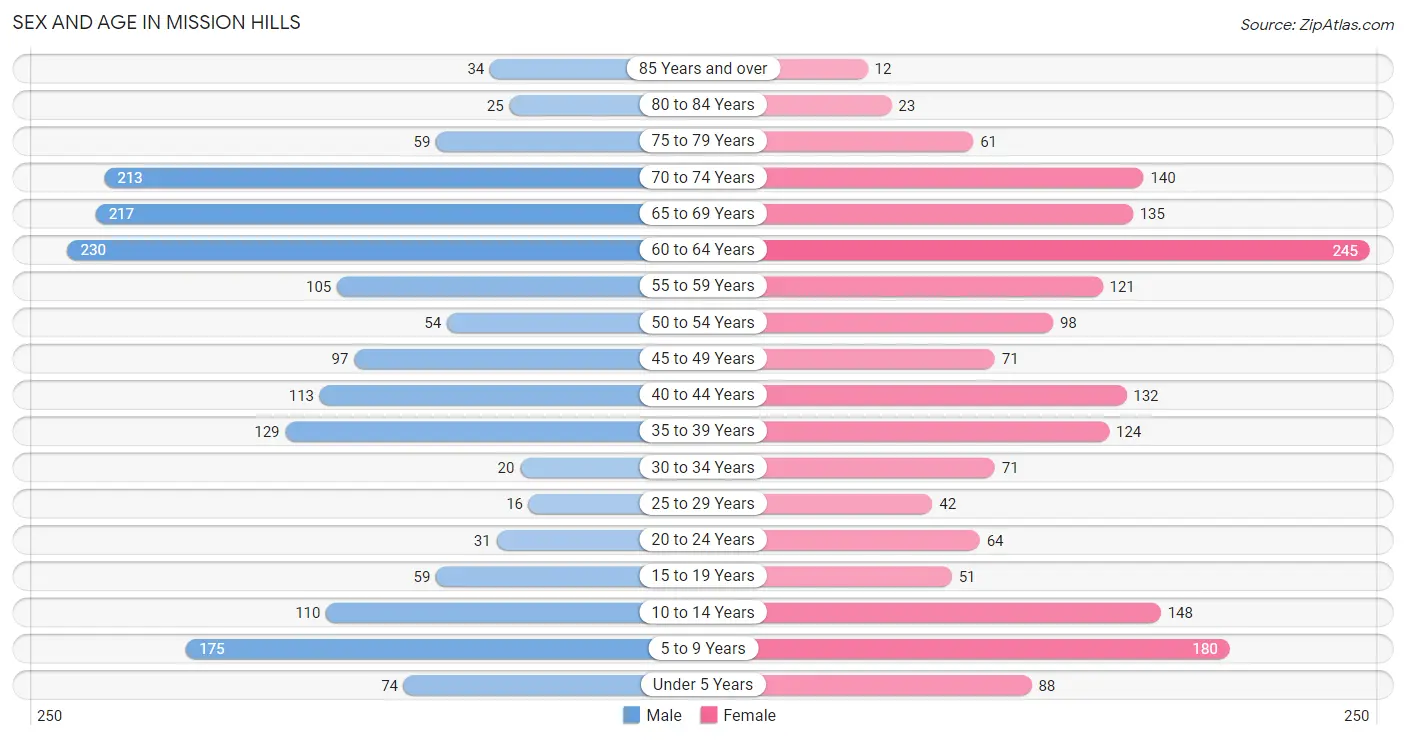
Sex and Age in Mission Hills
Sex and Age in Mission Hills
The most populous age groups in Mission Hills are 60 to 64 Years (230 | 13.1%) for men and 60 to 64 Years (245 | 13.6%) for women.
| Age Bracket | Male | Female |
| Under 5 Years | 74 (4.2%) | 88 (4.9%) |
| 5 to 9 Years | 175 (9.9%) | 180 (10.0%) |
| 10 to 14 Years | 110 (6.2%) | 148 (8.2%) |
| 15 to 19 Years | 59 (3.4%) | 51 (2.8%) |
| 20 to 24 Years | 31 (1.8%) | 64 (3.5%) |
| 25 to 29 Years | 16 (0.9%) | 42 (2.3%) |
| 30 to 34 Years | 20 (1.1%) | 71 (3.9%) |
| 35 to 39 Years | 129 (7.3%) | 124 (6.9%) |
| 40 to 44 Years | 113 (6.4%) | 132 (7.3%) |
| 45 to 49 Years | 97 (5.5%) | 71 (3.9%) |
| 50 to 54 Years | 54 (3.1%) | 98 (5.4%) |
| 55 to 59 Years | 105 (6.0%) | 121 (6.7%) |
| 60 to 64 Years | 230 (13.1%) | 245 (13.6%) |
| 65 to 69 Years | 217 (12.3%) | 135 (7.5%) |
| 70 to 74 Years | 213 (12.1%) | 140 (7.7%) |
| 75 to 79 Years | 59 (3.4%) | 61 (3.4%) |
| 80 to 84 Years | 25 (1.4%) | 23 (1.3%) |
| 85 Years and over | 34 (1.9%) | 12 (0.7%) |
| Total | 1,761 (100.0%) | 1,806 (100.0%) |
Families and Households in Mission Hills
Median Family Size in Mission Hills
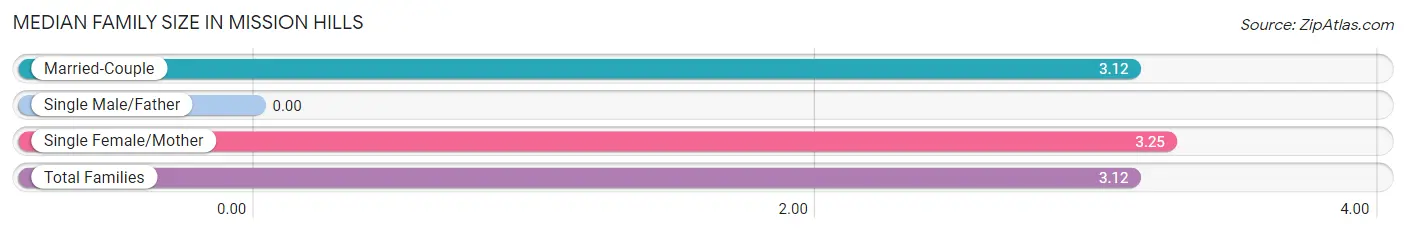
| Family Type | # Families | Family Size |
| Married-Couple | 1,043 (97.4%) | 3.12 |
| Single Male/Father | 0 (0.0%) | - |
| Single Female/Mother | 28 (2.6%) | 3.25 |
| Total Families | 1,071 (100.0%) | 3.12 |
Median Household Size in Mission Hills
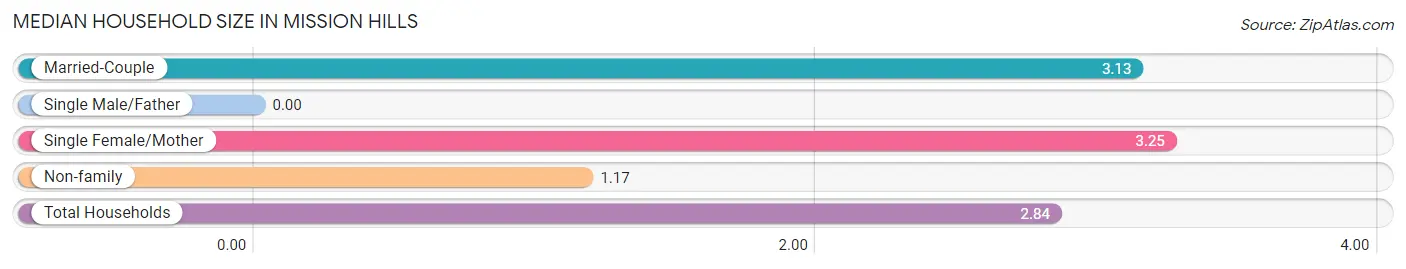
| Household Type | # Households | Household Size |
| Married-Couple | 1,043 (83.2%) | 3.13 |
| Single Male/Father | 0 (0.0%) | - |
| Single Female/Mother | 28 (2.2%) | 3.25 |
| Non-family | 183 (14.6%) | 1.17 |
| Total Households | 1,254 (100.0%) | 2.84 |
Household Size by Marriage Status in Mission Hills
Out of a total of 1,254 households in Mission Hills, 1,071 (85.4%) are family households, while 183 (14.6%) are nonfamily households. The most numerous type of family households are 2-person households, comprising 582, and the most common type of nonfamily households are 1-person households, comprising 167.
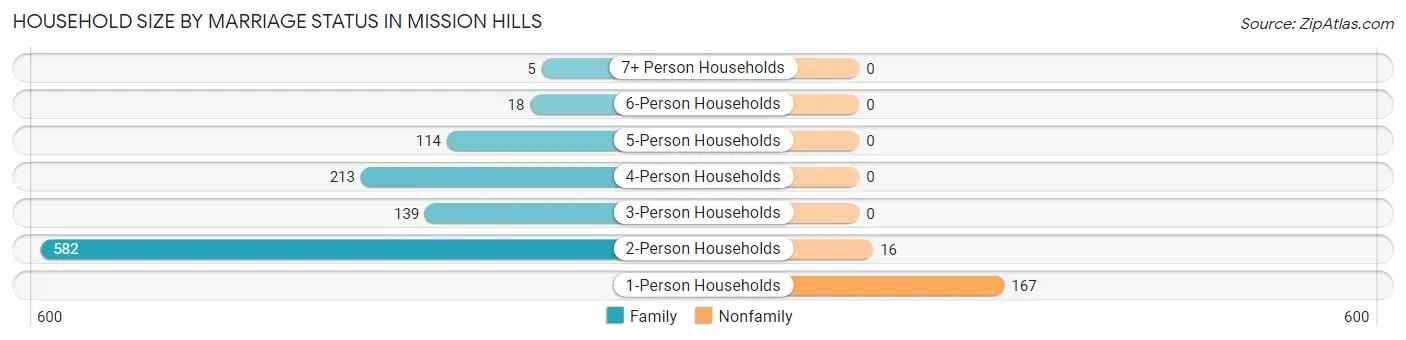
| Household Size | Family Households | Nonfamily Households |
| 1-Person Households | - | 167 (13.3%) |
| 2-Person Households | 582 (46.4%) | 16 (1.3%) |
| 3-Person Households | 139 (11.1%) | 0 (0.0%) |
| 4-Person Households | 213 (17.0%) | 0 (0.0%) |
| 5-Person Households | 114 (9.1%) | 0 (0.0%) |
| 6-Person Households | 18 (1.4%) | 0 (0.0%) |
| 7+ Person Households | 5 (0.4%) | 0 (0.0%) |
| Total | 1,071 (85.4%) | 183 (14.6%) |
Female Fertility in Mission Hills
Fertility by Age in Mission Hills
Average fertility rate in Mission Hills is 100.0 births per 1,000 women. Women in the age bracket of 20 to 34 years have the highest fertility rate with 220.0 births per 1,000 women. Women in the age bracket of 20 to 34 years acount for 69.6% of all women with births.
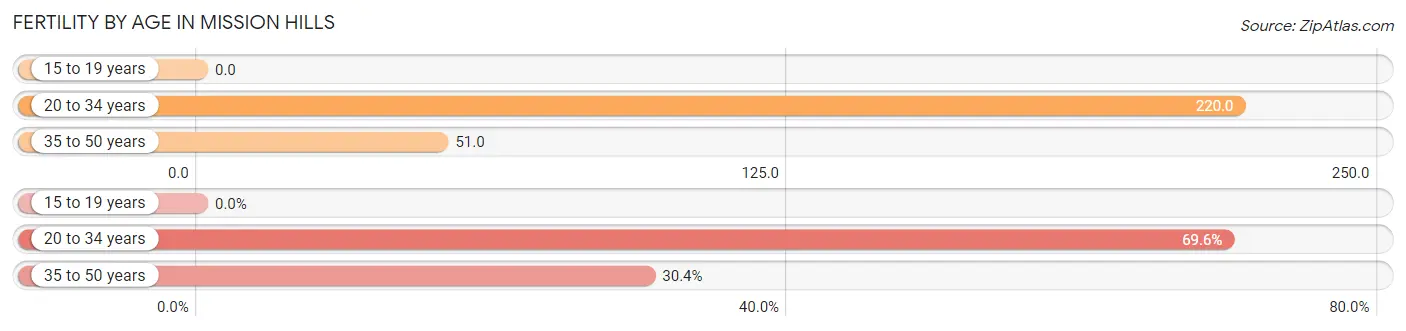
| Age Bracket | Women with Births | Births / 1,000 Women |
| 15 to 19 years | 0 (0.0%) | 0.0 |
| 20 to 34 years | 39 (69.6%) | 220.0 |
| 35 to 50 years | 17 (30.4%) | 51.0 |
| Total | 56 (100.0%) | 100.0 |
Fertility by Age by Marriage Status in Mission Hills
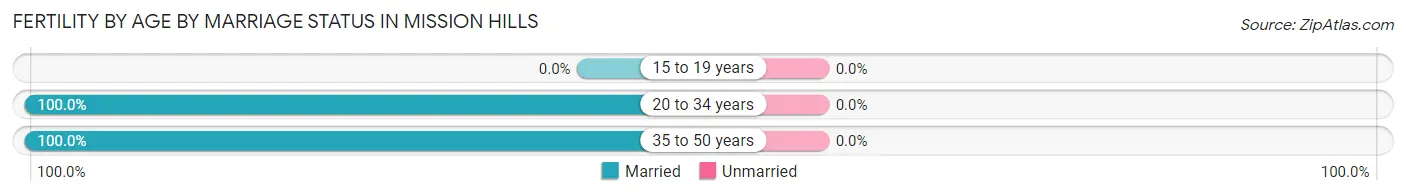
| Age Bracket | Married | Unmarried |
| 15 to 19 years | 0 (0.0%) | 0 (0.0%) |
| 20 to 34 years | 39 (100.0%) | 0 (0.0%) |
| 35 to 50 years | 17 (100.0%) | 0 (0.0%) |
| Total | 56 (100.0%) | 0 (0.0%) |
Fertility by Education in Mission Hills
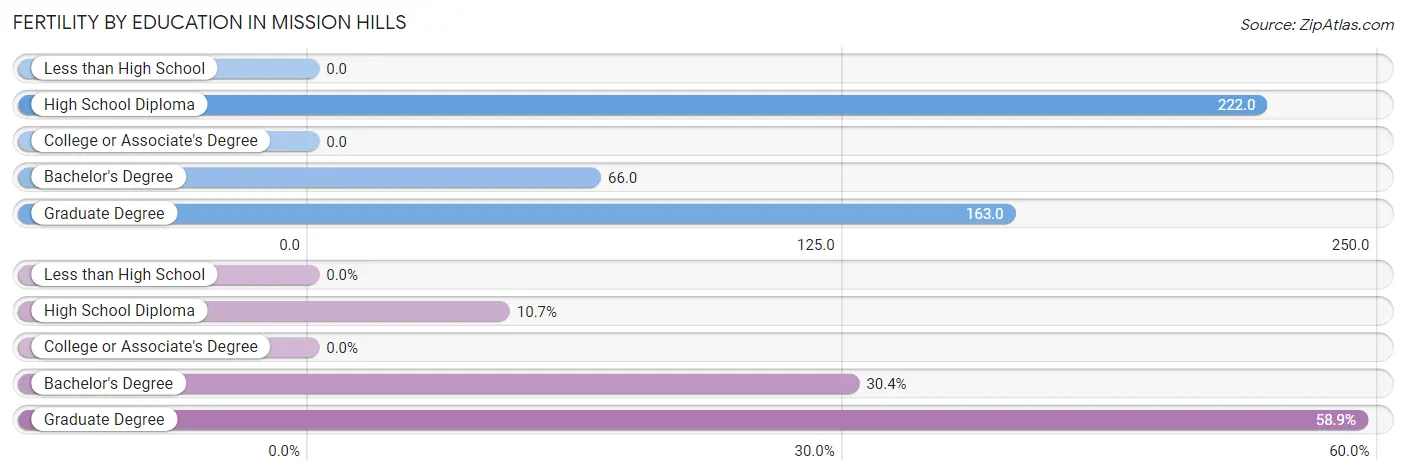
| Educational Attainment | Women with Births | Births / 1,000 Women |
| Less than High School | 0 (0.0%) | 0.0 |
| High School Diploma | 6 (10.7%) | 222.0 |
| College or Associate's Degree | 0 (0.0%) | 0.0 |
| Bachelor's Degree | 17 (30.4%) | 66.0 |
| Graduate Degree | 33 (58.9%) | 163.0 |
| Total | 56 (100.0%) | 100.0 |
Fertility by Education by Marriage Status in Mission Hills
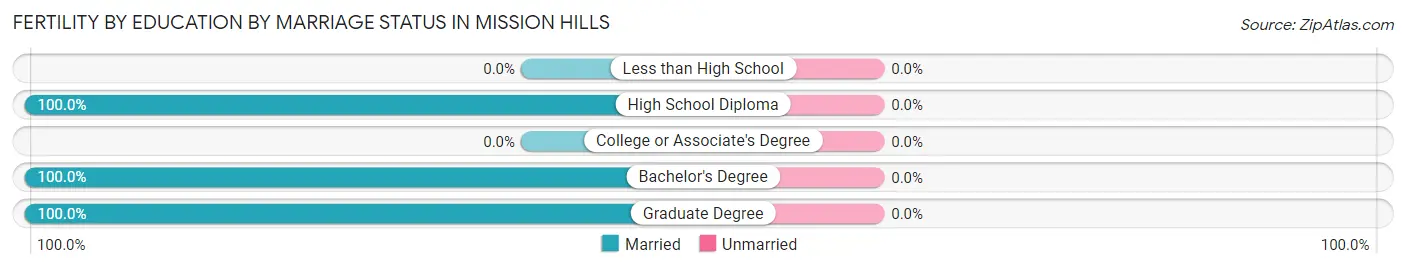
| Educational Attainment | Married | Unmarried |
| Less than High School | 0 (0.0%) | 0 (0.0%) |
| High School Diploma | 6 (100.0%) | 0 (0.0%) |
| College or Associate's Degree | 0 (0.0%) | 0 (0.0%) |
| Bachelor's Degree | 17 (100.0%) | 0 (0.0%) |
| Graduate Degree | 33 (100.0%) | 0 (0.0%) |
| Total | 56 (100.0%) | 0 (0.0%) |
Employment Characteristics in Mission Hills
Employment by Class of Employer in Mission Hills
Among the 1,781 employed individuals in Mission Hills, private company employees (917 | 51.5%), self-employed (incorporated) (432 | 24.3%), and self-employed (not incorporated) (193 | 10.8%) make up the most common classes of employment.
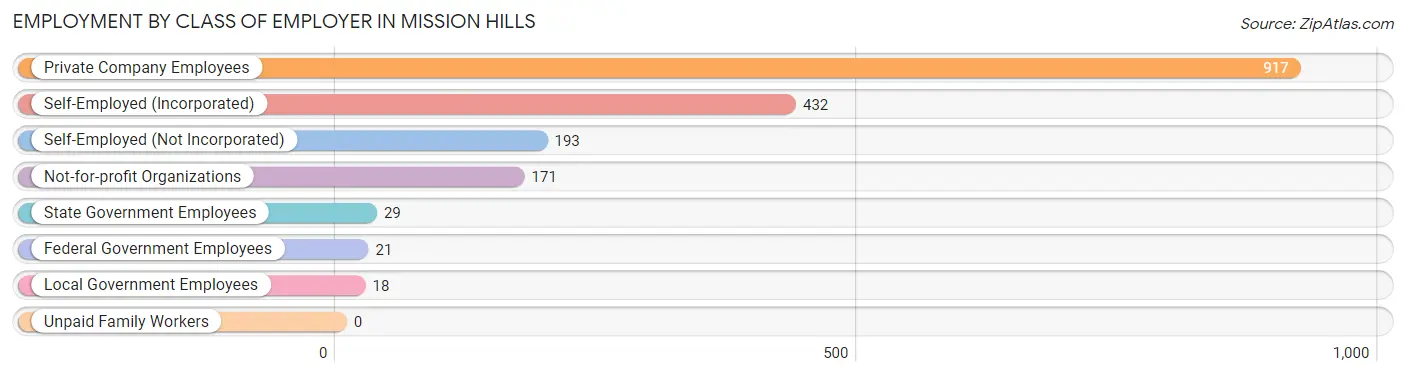
| Employer Class | # Employees | % Employees |
| Private Company Employees | 917 | 51.5% |
| Self-Employed (Incorporated) | 432 | 24.3% |
| Self-Employed (Not Incorporated) | 193 | 10.8% |
| Not-for-profit Organizations | 171 | 9.6% |
| Local Government Employees | 18 | 1.0% |
| State Government Employees | 29 | 1.6% |
| Federal Government Employees | 21 | 1.2% |
| Unpaid Family Workers | 0 | 0.0% |
| Total | 1,781 | 100.0% |
Employment Status by Age in Mission Hills
According to the labor force statistics for Mission Hills, out of the total population over 16 years of age (2,749), 66.5% or 1,828 individuals are in the labor force, with 0.5% or 9 of them unemployed. The age group with the highest labor force participation rate is 30 to 34 years, with 95.6% or 87 individuals in the labor force. Within the labor force, the 45 to 54 years age range has the highest percentage of unemployed individuals, with 3.3% or 9 of them being unemployed.
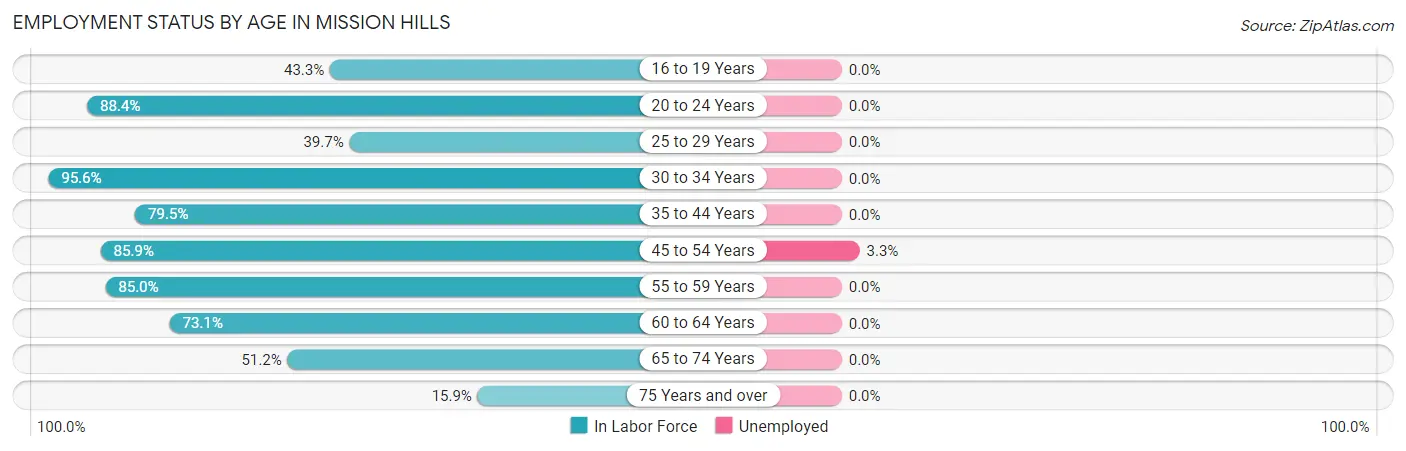
| Age Bracket | In Labor Force | Unemployed |
| 16 to 19 Years | 29 (43.3%) | 0 (0.0%) |
| 20 to 24 Years | 84 (88.4%) | 0 (0.0%) |
| 25 to 29 Years | 23 (39.7%) | 0 (0.0%) |
| 30 to 34 Years | 87 (95.6%) | 0 (0.0%) |
| 35 to 44 Years | 396 (79.5%) | 0 (0.0%) |
| 45 to 54 Years | 275 (85.9%) | 9 (3.3%) |
| 55 to 59 Years | 192 (85.0%) | 0 (0.0%) |
| 60 to 64 Years | 347 (73.1%) | 0 (0.0%) |
| 65 to 74 Years | 361 (51.2%) | 0 (0.0%) |
| 75 Years and over | 34 (15.9%) | 0 (0.0%) |
| Total | 1,828 (66.5%) | 9 (0.5%) |
Employment Status by Educational Attainment in Mission Hills
According to labor force statistics for Mission Hills, 79.1% of individuals (1,319) out of the total population between 25 and 64 years of age (1,668) are in the labor force, with 0.7% or 9 of them being unemployed. The group with the highest labor force participation rate are those with the educational attainment of high school diploma, with 100.0% or 30 individuals in the labor force. Within the labor force, individuals with bachelor's degree or higher education have the highest percentage of unemployment, with 0.7% or 9 of them being unemployed.
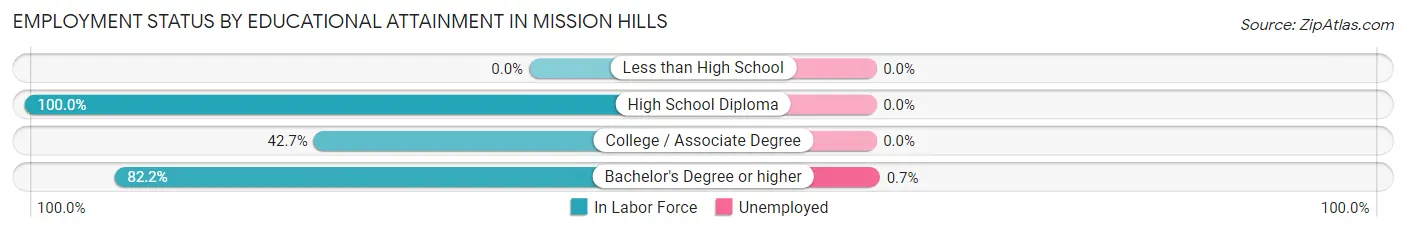
| Educational Attainment | In Labor Force | Unemployed |
| Less than High School | 0 (0.0%) | 0 (0.0%) |
| High School Diploma | 30 (100.0%) | 0 (0.0%) |
| College / Associate Degree | 61 (42.7%) | 0 (0.0%) |
| Bachelor's Degree or higher | 1,229 (82.2%) | 10 (0.7%) |
| Total | 1,319 (79.1%) | 12 (0.7%) |
Employment Occupations by Sex in Mission Hills
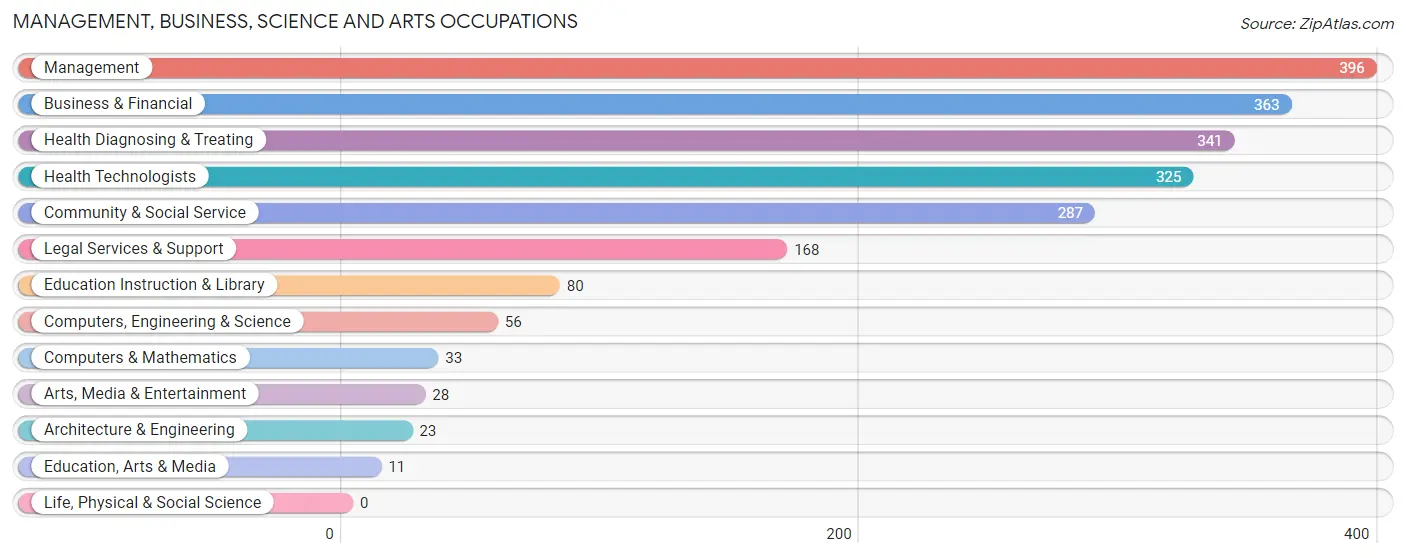
Management, Business, Science and Arts Occupations
The most common Management, Business, Science and Arts occupations in Mission Hills are Management (396 | 21.8%), Business & Financial (363 | 20.0%), Health Diagnosing & Treating (341 | 18.8%), Health Technologists (325 | 17.9%), and Community & Social Service (287 | 15.8%).
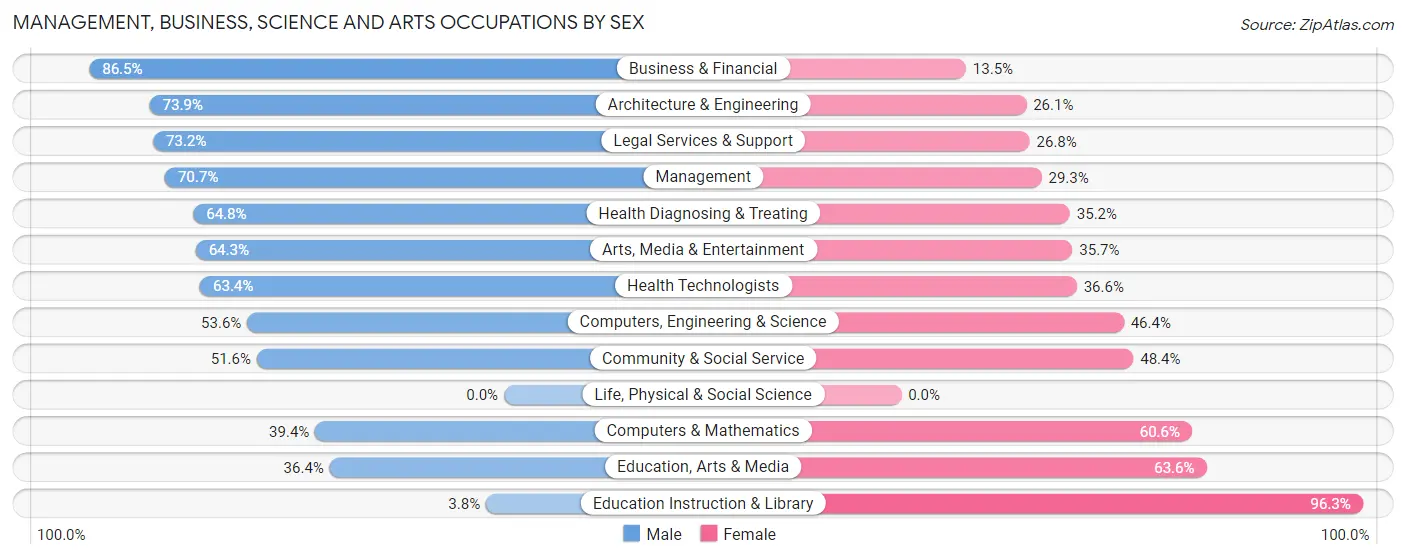
Management, Business, Science and Arts Occupations by Sex
Within the Management, Business, Science and Arts occupations in Mission Hills, the most male-oriented occupations are Business & Financial (86.5%), Architecture & Engineering (73.9%), and Legal Services & Support (73.2%), while the most female-oriented occupations are Education Instruction & Library (96.3%), Education, Arts & Media (63.6%), and Computers & Mathematics (60.6%).
| Occupation | Male | Female |
| Management | 280 (70.7%) | 116 (29.3%) |
| Business & Financial | 314 (86.5%) | 49 (13.5%) |
| Computers, Engineering & Science | 30 (53.6%) | 26 (46.4%) |
| Computers & Mathematics | 13 (39.4%) | 20 (60.6%) |
| Architecture & Engineering | 17 (73.9%) | 6 (26.1%) |
| Life, Physical & Social Science | 0 (0.0%) | 0 (0.0%) |
| Community & Social Service | 148 (51.6%) | 139 (48.4%) |
| Education, Arts & Media | 4 (36.4%) | 7 (63.6%) |
| Legal Services & Support | 123 (73.2%) | 45 (26.8%) |
| Education Instruction & Library | 3 (3.7%) | 77 (96.3%) |
| Arts, Media & Entertainment | 18 (64.3%) | 10 (35.7%) |
| Health Diagnosing & Treating | 221 (64.8%) | 120 (35.2%) |
| Health Technologists | 206 (63.4%) | 119 (36.6%) |
| Total (Category) | 993 (68.8%) | 450 (31.2%) |
| Total (Overall) | 1,145 (62.9%) | 674 (37.0%) |
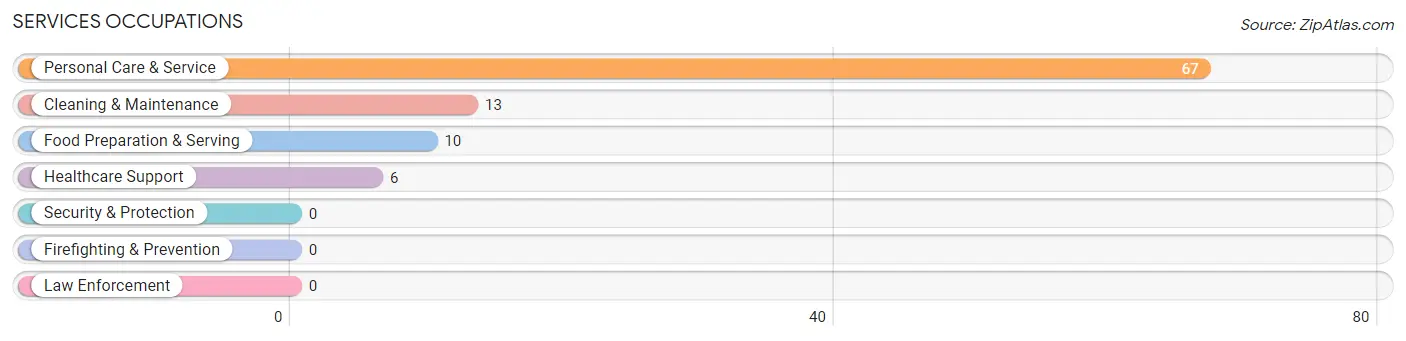
Services Occupations
The most common Services occupations in Mission Hills are Personal Care & Service (67 | 3.7%), Cleaning & Maintenance (13 | 0.7%), Food Preparation & Serving (10 | 0.5%), and Healthcare Support (6 | 0.3%).
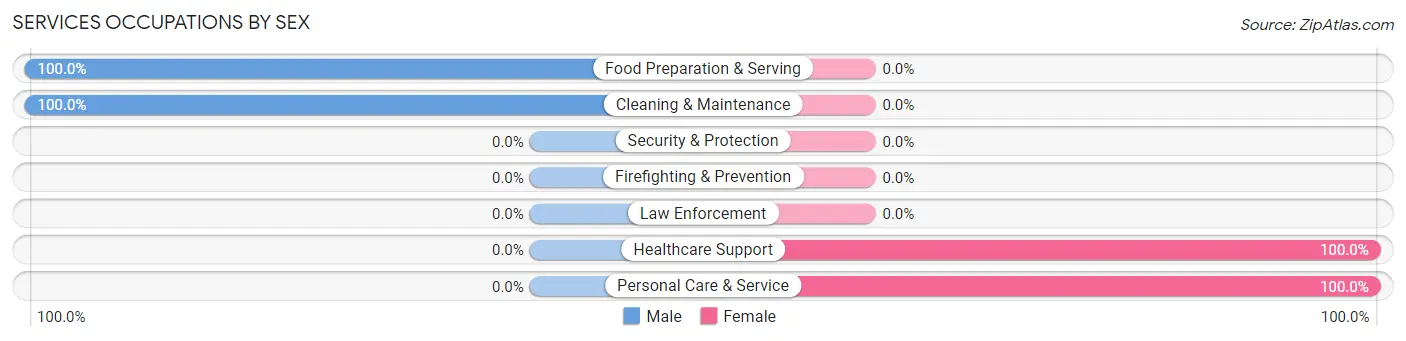
Services Occupations by Sex
Within the Services occupations in Mission Hills, the most male-oriented occupations are Food Preparation & Serving (100.0%), and Cleaning & Maintenance (100.0%), while the most female-oriented occupations are Healthcare Support (100.0%), and Personal Care & Service (100.0%).
| Occupation | Male | Female |
| Healthcare Support | 0 (0.0%) | 6 (100.0%) |
| Security & Protection | 0 (0.0%) | 0 (0.0%) |
| Firefighting & Prevention | 0 (0.0%) | 0 (0.0%) |
| Law Enforcement | 0 (0.0%) | 0 (0.0%) |
| Food Preparation & Serving | 10 (100.0%) | 0 (0.0%) |
| Cleaning & Maintenance | 13 (100.0%) | 0 (0.0%) |
| Personal Care & Service | 0 (0.0%) | 67 (100.0%) |
| Total (Category) | 23 (24.0%) | 73 (76.0%) |
| Total (Overall) | 1,145 (62.9%) | 674 (37.0%) |
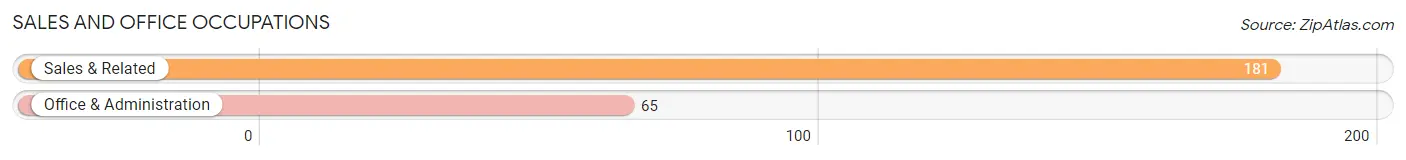
Sales and Office Occupations
The most common Sales and Office occupations in Mission Hills are Sales & Related (181 | 10.0%), and Office & Administration (65 | 3.6%).
Sales and Office Occupations by Sex
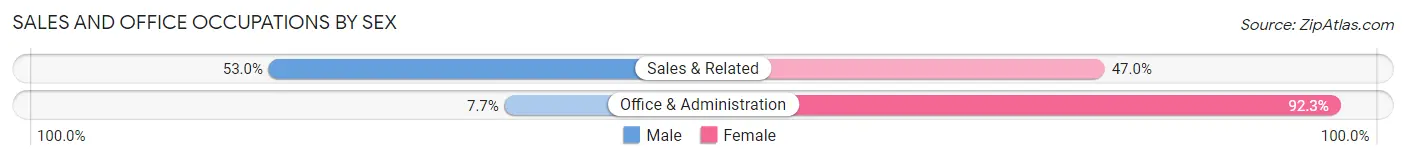
| Occupation | Male | Female |
| Sales & Related | 96 (53.0%) | 85 (47.0%) |
| Office & Administration | 5 (7.7%) | 60 (92.3%) |
| Total (Category) | 101 (41.1%) | 145 (58.9%) |
| Total (Overall) | 1,145 (62.9%) | 674 (37.0%) |
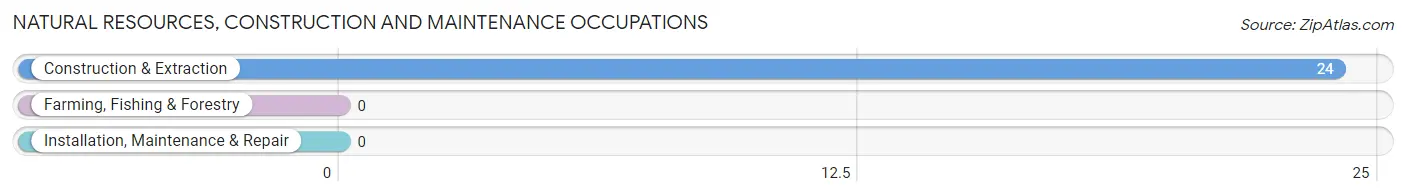
Natural Resources, Construction and Maintenance Occupations
The most common Natural Resources, Construction and Maintenance occupations in Mission Hills are , and Construction & Extraction (24 | 1.3%).
Natural Resources, Construction and Maintenance Occupations by Sex
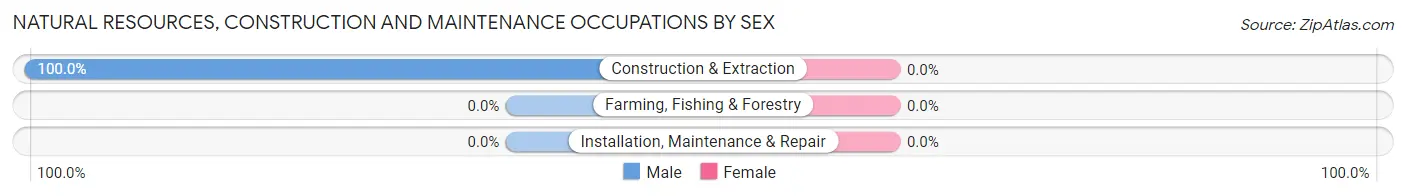
| Occupation | Male | Female |
| Farming, Fishing & Forestry | 0 (0.0%) | 0 (0.0%) |
| Construction & Extraction | 24 (100.0%) | 0 (0.0%) |
| Installation, Maintenance & Repair | 0 (0.0%) | 0 (0.0%) |
| Total (Category) | 24 (100.0%) | 0 (0.0%) |
| Total (Overall) | 1,145 (62.9%) | 674 (37.0%) |
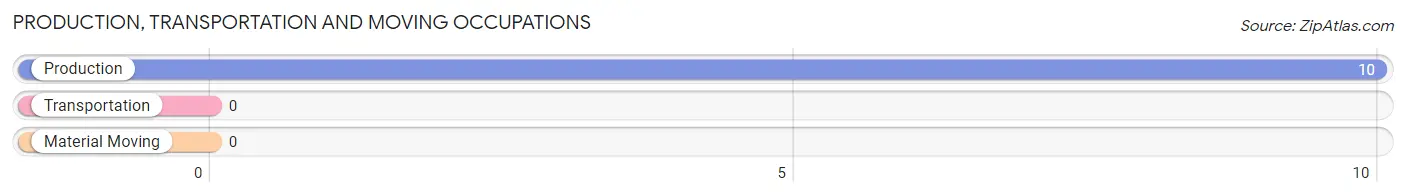
Production, Transportation and Moving Occupations
The most common Production, Transportation and Moving occupations in Mission Hills are , and Production (10 | 0.5%).
Production, Transportation and Moving Occupations by Sex
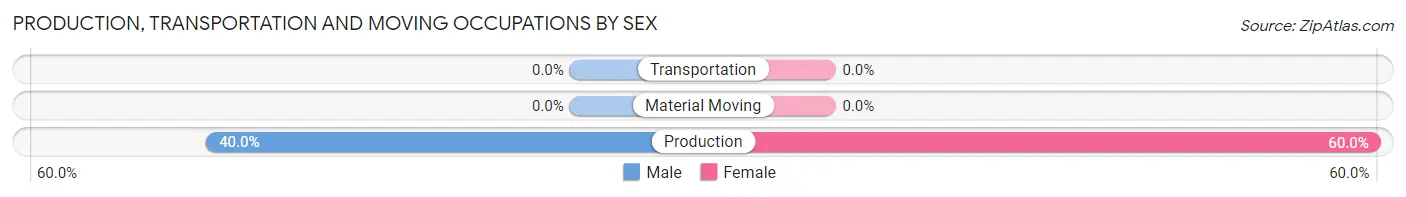
| Occupation | Male | Female |
| Production | 4 (40.0%) | 6 (60.0%) |
| Transportation | 0 (0.0%) | 0 (0.0%) |
| Material Moving | 0 (0.0%) | 0 (0.0%) |
| Total (Category) | 4 (40.0%) | 6 (60.0%) |
| Total (Overall) | 1,145 (62.9%) | 674 (37.0%) |
Employment Industries by Sex in Mission Hills
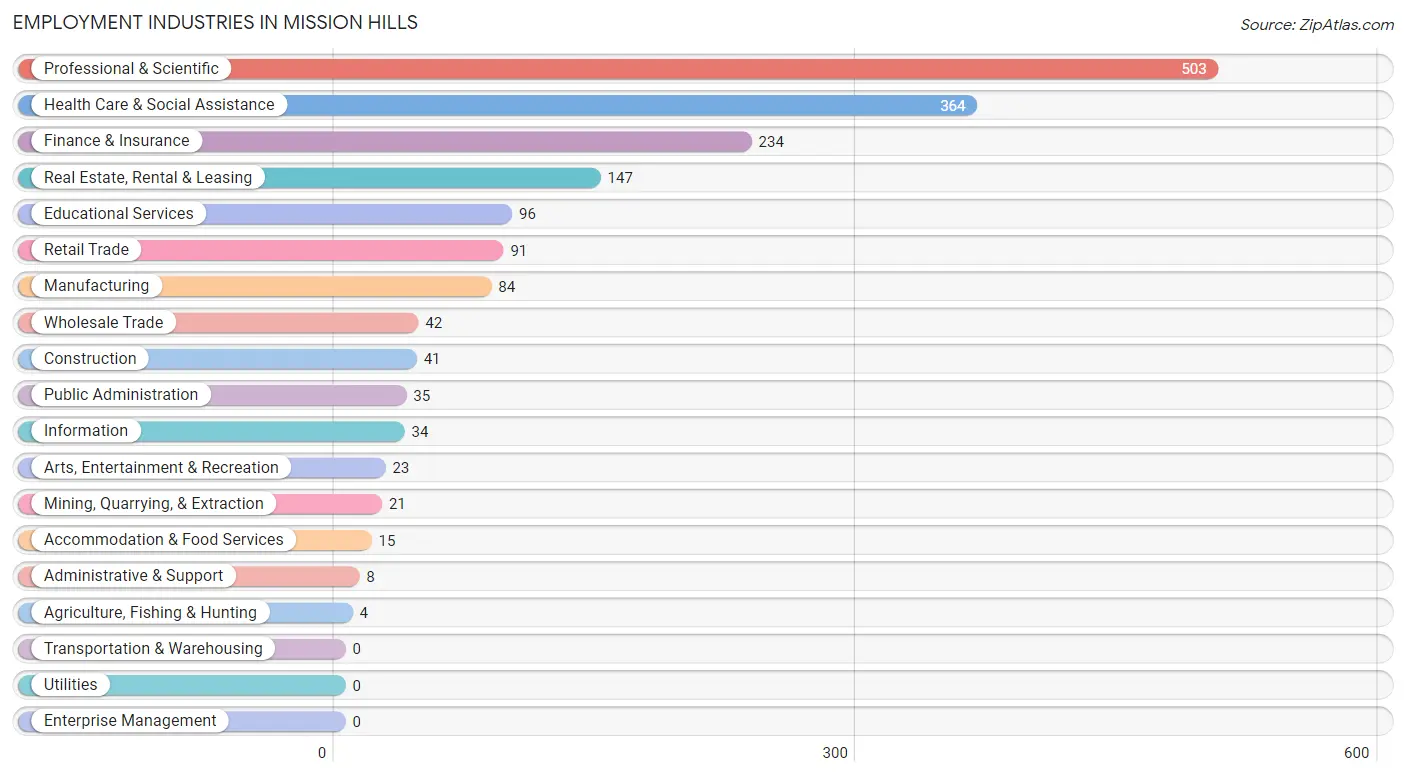
Employment Industries in Mission Hills
The major employment industries in Mission Hills include Professional & Scientific (503 | 27.7%), Health Care & Social Assistance (364 | 20.0%), Finance & Insurance (234 | 12.9%), Real Estate, Rental & Leasing (147 | 8.1%), and Educational Services (96 | 5.3%).
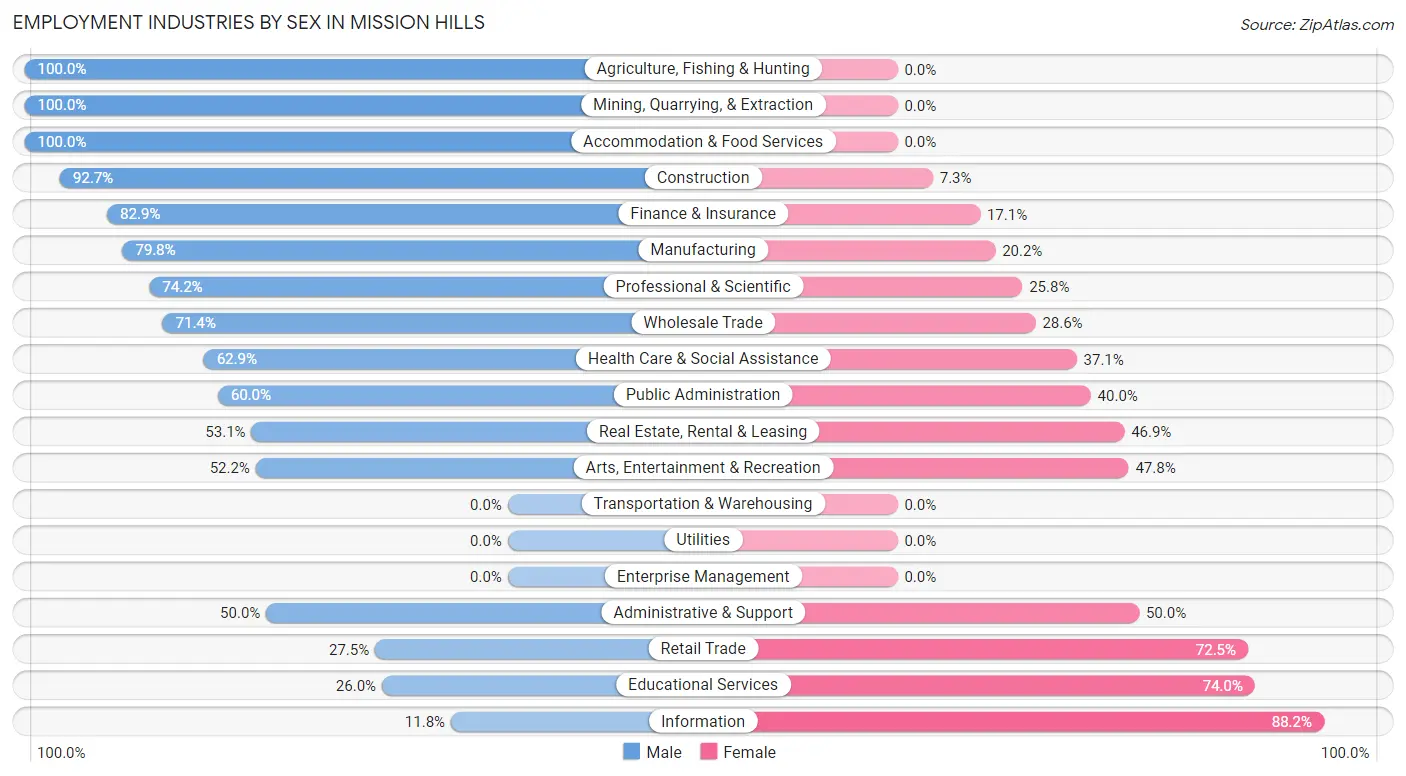
Employment Industries by Sex in Mission Hills
The Mission Hills industries that see more men than women are Agriculture, Fishing & Hunting (100.0%), Mining, Quarrying, & Extraction (100.0%), and Accommodation & Food Services (100.0%), whereas the industries that tend to have a higher number of women are Information (88.2%), Educational Services (74.0%), and Retail Trade (72.5%).
| Industry | Male | Female |
| Agriculture, Fishing & Hunting | 4 (100.0%) | 0 (0.0%) |
| Mining, Quarrying, & Extraction | 21 (100.0%) | 0 (0.0%) |
| Construction | 38 (92.7%) | 3 (7.3%) |
| Manufacturing | 67 (79.8%) | 17 (20.2%) |
| Wholesale Trade | 30 (71.4%) | 12 (28.6%) |
| Retail Trade | 25 (27.5%) | 66 (72.5%) |
| Transportation & Warehousing | 0 (0.0%) | 0 (0.0%) |
| Utilities | 0 (0.0%) | 0 (0.0%) |
| Information | 4 (11.8%) | 30 (88.2%) |
| Finance & Insurance | 194 (82.9%) | 40 (17.1%) |
| Real Estate, Rental & Leasing | 78 (53.1%) | 69 (46.9%) |
| Professional & Scientific | 373 (74.2%) | 130 (25.8%) |
| Enterprise Management | 0 (0.0%) | 0 (0.0%) |
| Administrative & Support | 4 (50.0%) | 4 (50.0%) |
| Educational Services | 25 (26.0%) | 71 (74.0%) |
| Health Care & Social Assistance | 229 (62.9%) | 135 (37.1%) |
| Arts, Entertainment & Recreation | 12 (52.2%) | 11 (47.8%) |
| Accommodation & Food Services | 15 (100.0%) | 0 (0.0%) |
| Public Administration | 21 (60.0%) | 14 (40.0%) |
| Total | 1,145 (62.9%) | 674 (37.0%) |
Education in Mission Hills
School Enrollment in Mission Hills
The most common levels of schooling among the 847 students in Mission Hills are elementary school (294 | 34.7%), middle school (211 | 24.9%), and high school (112 | 13.2%).
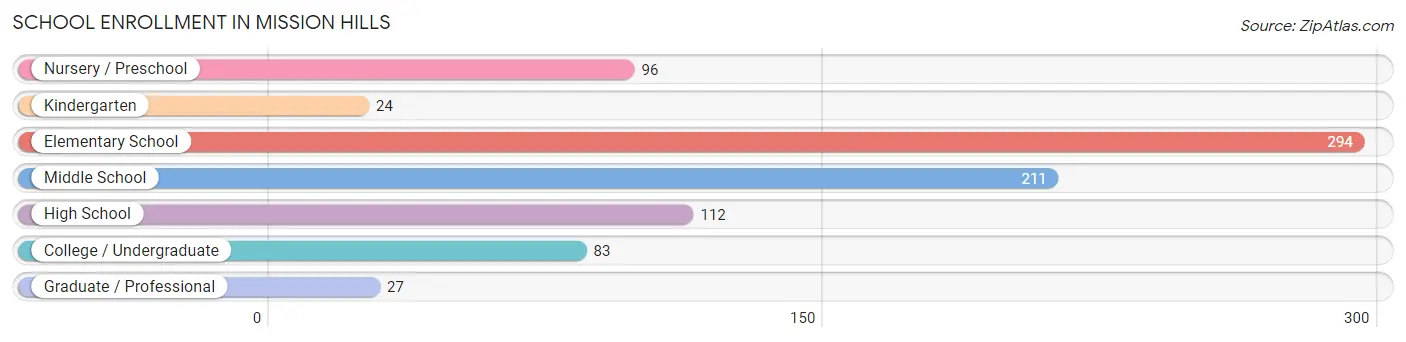
| School Level | # Students | % Students |
| Nursery / Preschool | 96 | 11.3% |
| Kindergarten | 24 | 2.8% |
| Elementary School | 294 | 34.7% |
| Middle School | 211 | 24.9% |
| High School | 112 | 13.2% |
| College / Undergraduate | 83 | 9.8% |
| Graduate / Professional | 27 | 3.2% |
| Total | 847 | 100.0% |
School Enrollment by Age by Funding Source in Mission Hills
Out of a total of 847 students who are enrolled in schools in Mission Hills, 275 (32.5%) attend a private institution, while the remaining 572 (67.5%) are enrolled in public schools. The age group of 3 to 4 year olds has the highest likelihood of being enrolled in private schools, with 31 (100.0% in the age bracket) enrolled. Conversely, the age group of 35 years and over has the lowest likelihood of being enrolled in a private school, with 64 (100.0% in the age bracket) attending a public institution.
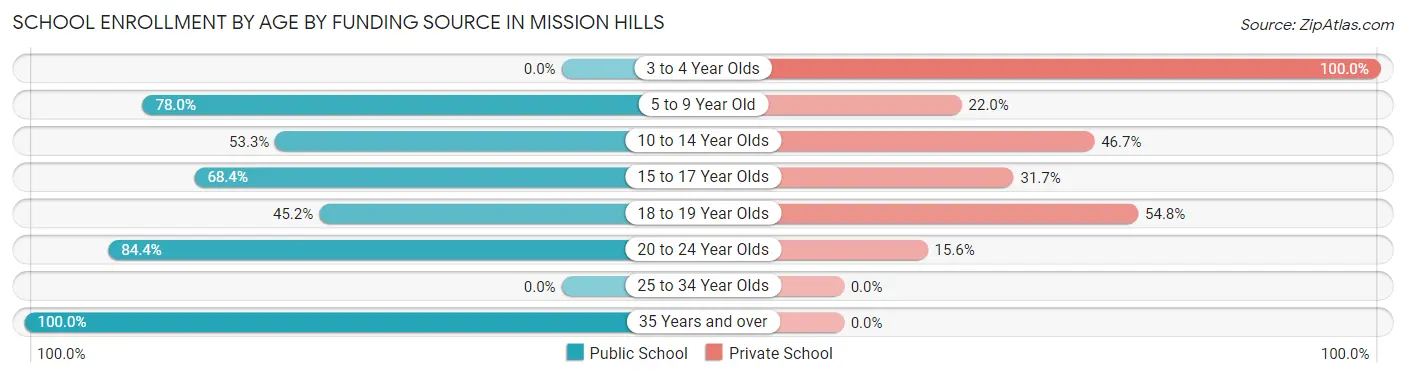
| Age Bracket | Public School | Private School |
| 3 to 4 Year Olds | 0 (0.0%) | 31 (100.0%) |
| 5 to 9 Year Old | 277 (78.0%) | 78 (22.0%) |
| 10 to 14 Year Olds | 136 (53.3%) | 119 (46.7%) |
| 15 to 17 Year Olds | 54 (68.3%) | 25 (31.7%) |
| 18 to 19 Year Olds | 14 (45.2%) | 17 (54.8%) |
| 20 to 24 Year Olds | 27 (84.4%) | 5 (15.6%) |
| 25 to 34 Year Olds | 0 (0.0%) | 0 (0.0%) |
| 35 Years and over | 64 (100.0%) | 0 (0.0%) |
| Total | 572 (67.5%) | 275 (32.5%) |
Educational Attainment by Field of Study in Mission Hills
Business (582 | 24.0%), bio, nature & agricultural (257 | 10.6%), social sciences (254 | 10.5%), computers & mathematics (196 | 8.1%), and education (191 | 7.9%) are the most common fields of study among 2,429 individuals in Mission Hills who have obtained a bachelor's degree or higher.
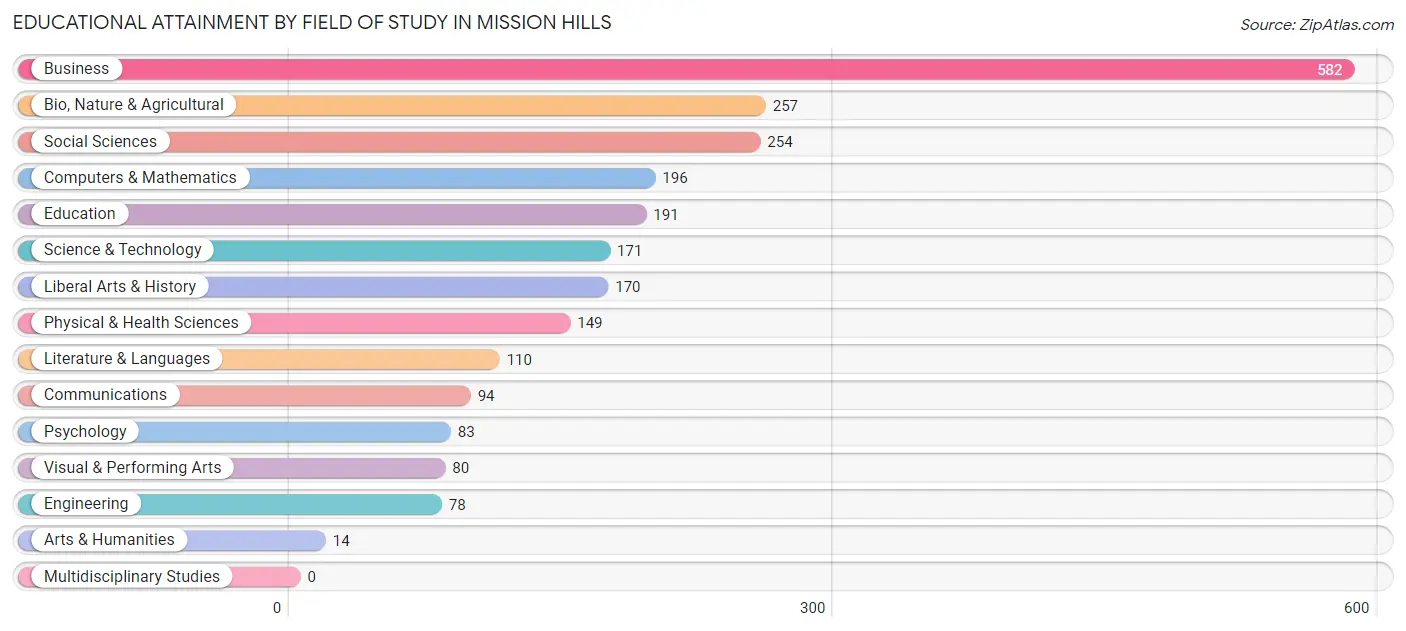
| Field of Study | # Graduates | % Graduates |
| Computers & Mathematics | 196 | 8.1% |
| Bio, Nature & Agricultural | 257 | 10.6% |
| Physical & Health Sciences | 149 | 6.1% |
| Psychology | 83 | 3.4% |
| Social Sciences | 254 | 10.5% |
| Engineering | 78 | 3.2% |
| Multidisciplinary Studies | 0 | 0.0% |
| Science & Technology | 171 | 7.0% |
| Business | 582 | 24.0% |
| Education | 191 | 7.9% |
| Literature & Languages | 110 | 4.5% |
| Liberal Arts & History | 170 | 7.0% |
| Visual & Performing Arts | 80 | 3.3% |
| Communications | 94 | 3.9% |
| Arts & Humanities | 14 | 0.6% |
| Total | 2,429 | 100.0% |
Transportation & Commute in Mission Hills
Vehicle Availability by Sex in Mission Hills
The most prevalent vehicle ownership categories in Mission Hills are males with 2 vehicles (606, accounting for 53.0%) and females with 2 vehicles (349, making up 95.1%).
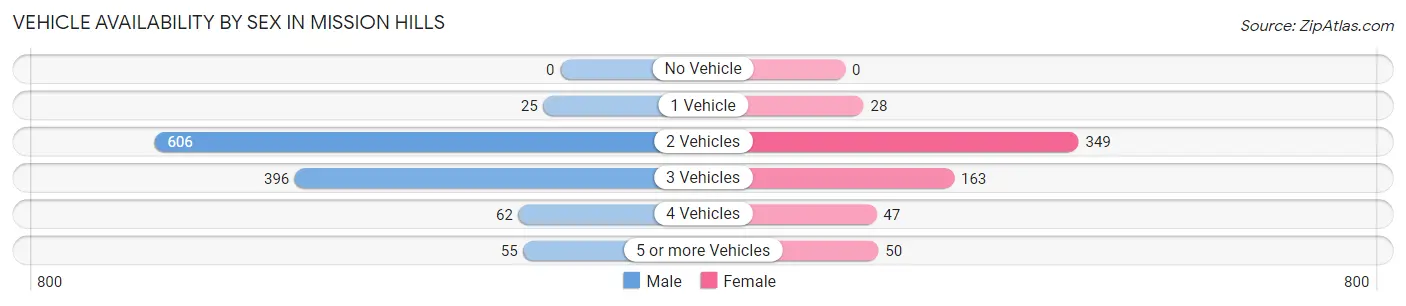
| Vehicles Available | Male | Female |
| No Vehicle | 0 (0.0%) | 0 (0.0%) |
| 1 Vehicle | 25 (2.2%) | 28 (4.4%) |
| 2 Vehicles | 606 (53.0%) | 349 (54.8%) |
| 3 Vehicles | 396 (34.6%) | 163 (25.6%) |
| 4 Vehicles | 62 (5.4%) | 47 (7.4%) |
| 5 or more Vehicles | 55 (4.8%) | 50 (7.9%) |
| Total | 1,144 (100.0%) | 637 (100.0%) |
Commute Time in Mission Hills
The most frequently occuring commute durations in Mission Hills are 10 to 14 minutes (343 commuters, 25.5%), 15 to 19 minutes (339 commuters, 25.2%), and 5 to 9 minutes (237 commuters, 17.6%).
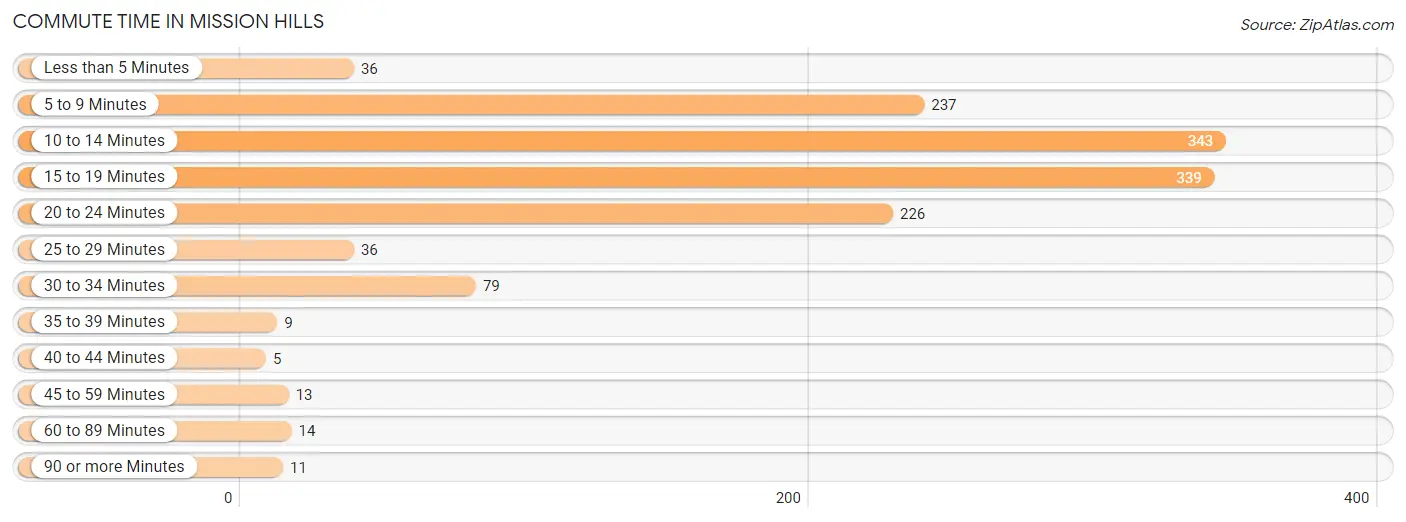
| Commute Time | # Commuters | % Commuters |
| Less than 5 Minutes | 36 | 2.7% |
| 5 to 9 Minutes | 237 | 17.6% |
| 10 to 14 Minutes | 343 | 25.5% |
| 15 to 19 Minutes | 339 | 25.2% |
| 20 to 24 Minutes | 226 | 16.8% |
| 25 to 29 Minutes | 36 | 2.7% |
| 30 to 34 Minutes | 79 | 5.9% |
| 35 to 39 Minutes | 9 | 0.7% |
| 40 to 44 Minutes | 5 | 0.4% |
| 45 to 59 Minutes | 13 | 1.0% |
| 60 to 89 Minutes | 14 | 1.0% |
| 90 or more Minutes | 11 | 0.8% |
Commute Time by Sex in Mission Hills
The most common commute times in Mission Hills are 10 to 14 minutes (202 commuters, 23.9%) for males and 10 to 14 minutes (141 commuters, 28.0%) for females.
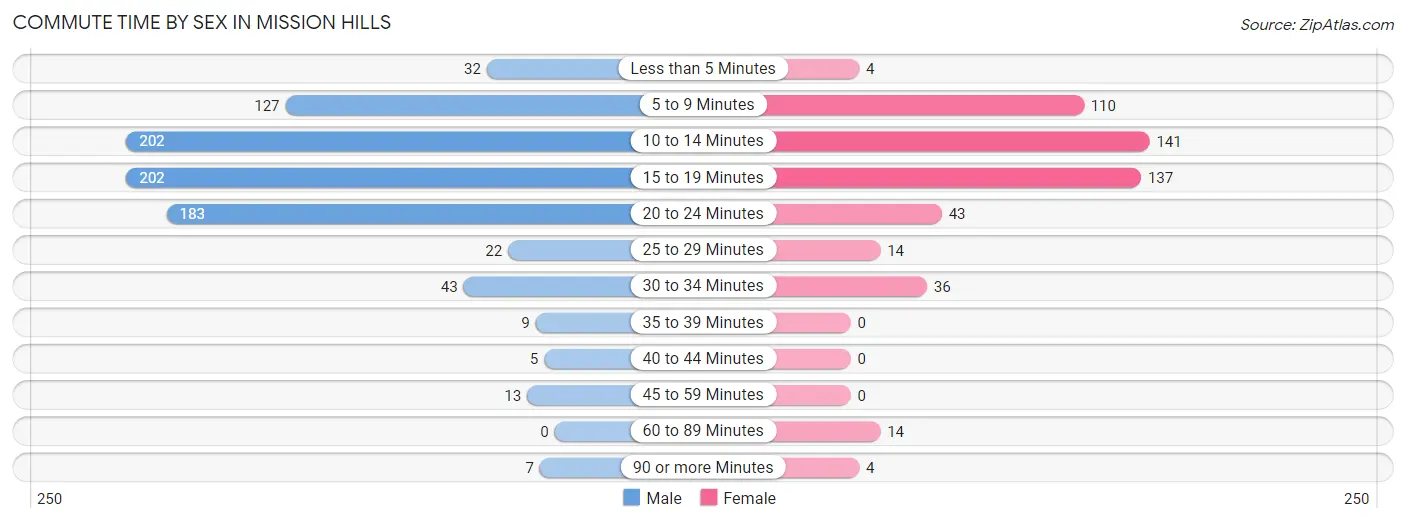
| Commute Time | Male | Female |
| Less than 5 Minutes | 32 (3.8%) | 4 (0.8%) |
| 5 to 9 Minutes | 127 (15.0%) | 110 (21.9%) |
| 10 to 14 Minutes | 202 (23.9%) | 141 (28.0%) |
| 15 to 19 Minutes | 202 (23.9%) | 137 (27.2%) |
| 20 to 24 Minutes | 183 (21.7%) | 43 (8.6%) |
| 25 to 29 Minutes | 22 (2.6%) | 14 (2.8%) |
| 30 to 34 Minutes | 43 (5.1%) | 36 (7.2%) |
| 35 to 39 Minutes | 9 (1.1%) | 0 (0.0%) |
| 40 to 44 Minutes | 5 (0.6%) | 0 (0.0%) |
| 45 to 59 Minutes | 13 (1.5%) | 0 (0.0%) |
| 60 to 89 Minutes | 0 (0.0%) | 14 (2.8%) |
| 90 or more Minutes | 7 (0.8%) | 4 (0.8%) |
Time of Departure to Work by Sex in Mission Hills
The most frequent times of departure to work in Mission Hills are 8:00 AM to 8:29 AM (226, 26.8%) for males and 8:00 AM to 8:29 AM (195, 38.8%) for females.
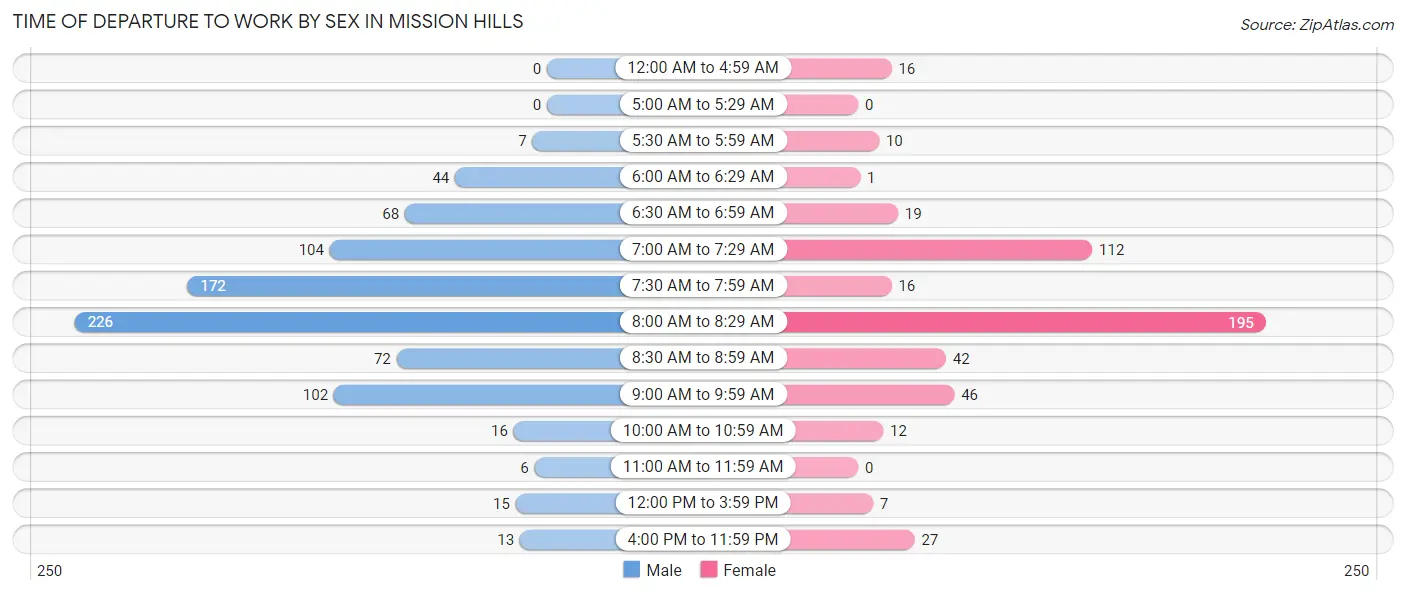
| Time of Departure | Male | Female |
| 12:00 AM to 4:59 AM | 0 (0.0%) | 16 (3.2%) |
| 5:00 AM to 5:29 AM | 0 (0.0%) | 0 (0.0%) |
| 5:30 AM to 5:59 AM | 7 (0.8%) | 10 (2.0%) |
| 6:00 AM to 6:29 AM | 44 (5.2%) | 1 (0.2%) |
| 6:30 AM to 6:59 AM | 68 (8.1%) | 19 (3.8%) |
| 7:00 AM to 7:29 AM | 104 (12.3%) | 112 (22.3%) |
| 7:30 AM to 7:59 AM | 172 (20.4%) | 16 (3.2%) |
| 8:00 AM to 8:29 AM | 226 (26.8%) | 195 (38.8%) |
| 8:30 AM to 8:59 AM | 72 (8.5%) | 42 (8.4%) |
| 9:00 AM to 9:59 AM | 102 (12.1%) | 46 (9.1%) |
| 10:00 AM to 10:59 AM | 16 (1.9%) | 12 (2.4%) |
| 11:00 AM to 11:59 AM | 6 (0.7%) | 0 (0.0%) |
| 12:00 PM to 3:59 PM | 15 (1.8%) | 7 (1.4%) |
| 4:00 PM to 11:59 PM | 13 (1.5%) | 27 (5.4%) |
| Total | 845 (100.0%) | 503 (100.0%) |
Housing Occupancy in Mission Hills
Occupancy by Ownership in Mission Hills
Of the total 1,254 dwellings in Mission Hills, owner-occupied units account for 1,254 (100.0%), while renter-occupied units make up 0 (0.0%).
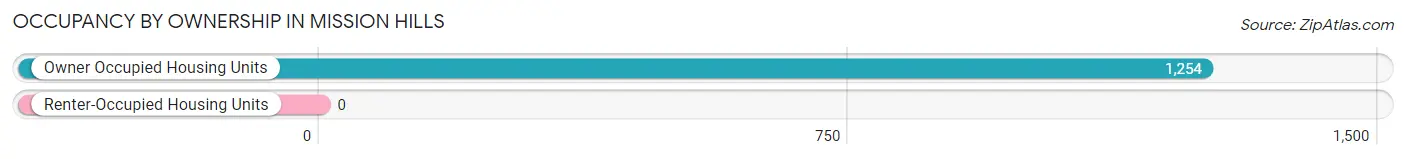
| Occupancy | # Housing Units | % Housing Units |
| Owner Occupied Housing Units | 1,254 | 100.0% |
| Renter-Occupied Housing Units | 0 | 0.0% |
| Total Occupied Housing Units | 1,254 | 100.0% |
Occupancy by Household Size in Mission Hills
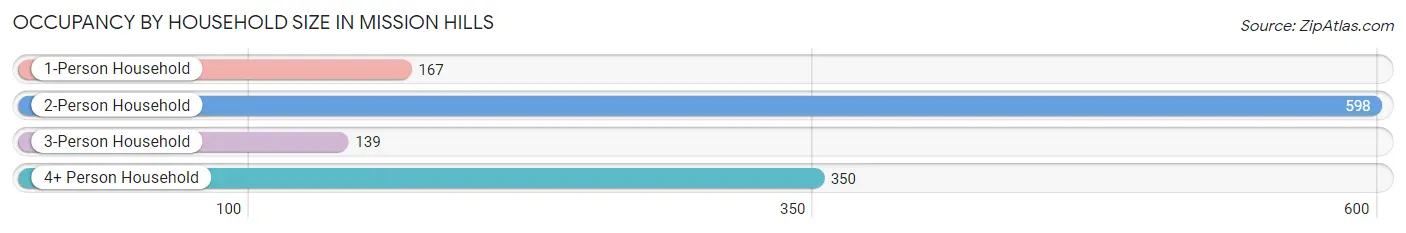
| Household Size | # Housing Units | % Housing Units |
| 1-Person Household | 167 | 13.3% |
| 2-Person Household | 598 | 47.7% |
| 3-Person Household | 139 | 11.1% |
| 4+ Person Household | 350 | 27.9% |
| Total Housing Units | 1,254 | 100.0% |
Occupancy by Ownership by Household Size in Mission Hills
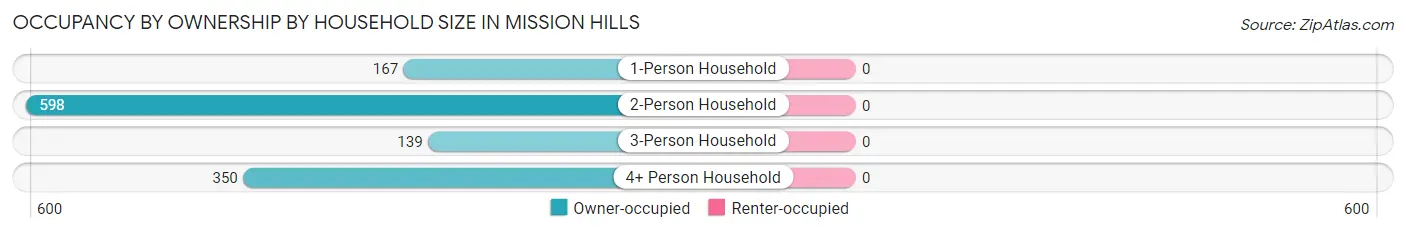
| Household Size | Owner-occupied | Renter-occupied |
| 1-Person Household | 167 (100.0%) | 0 (0.0%) |
| 2-Person Household | 598 (100.0%) | 0 (0.0%) |
| 3-Person Household | 139 (100.0%) | 0 (0.0%) |
| 4+ Person Household | 350 (100.0%) | 0 (0.0%) |
| Total Housing Units | 1,254 (100.0%) | 0 (0.0%) |
Occupancy by Educational Attainment in Mission Hills
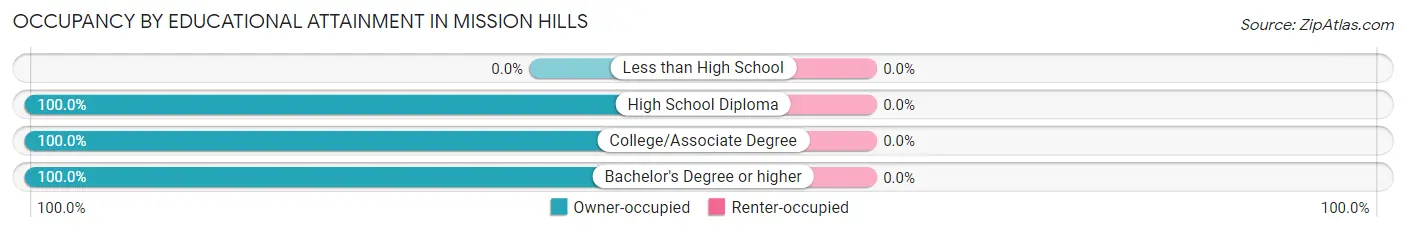
| Household Size | Owner-occupied | Renter-occupied |
| Less than High School | 0 (0.0%) | 0 (0.0%) |
| High School Diploma | 24 (100.0%) | 0 (0.0%) |
| College/Associate Degree | 98 (100.0%) | 0 (0.0%) |
| Bachelor's Degree or higher | 1,132 (100.0%) | 0 (0.0%) |
Occupancy by Age of Householder in Mission Hills
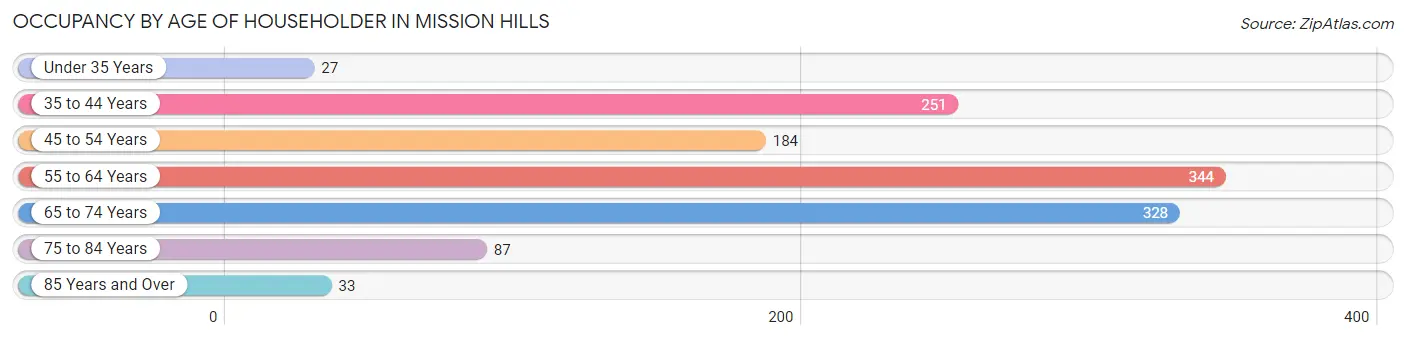
| Age Bracket | # Households | % Households |
| Under 35 Years | 27 | 2.1% |
| 35 to 44 Years | 251 | 20.0% |
| 45 to 54 Years | 184 | 14.7% |
| 55 to 64 Years | 344 | 27.4% |
| 65 to 74 Years | 328 | 26.2% |
| 75 to 84 Years | 87 | 6.9% |
| 85 Years and Over | 33 | 2.6% |
| Total | 1,254 | 100.0% |
Housing Finances in Mission Hills
Median Income by Occupancy in Mission Hills
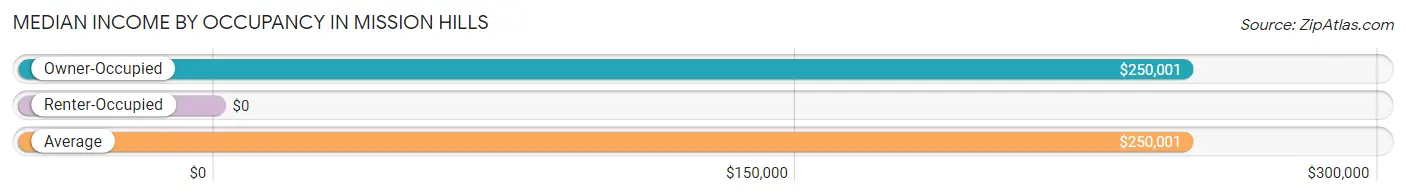
| Occupancy Type | # Households | Median Income |
| Owner-Occupied | 1,254 (100.0%) | $250,001 |
| Renter-Occupied | 0 (0.0%) | $0 |
| Average | 1,254 (100.0%) | $250,001 |
Occupancy by Householder Income Bracket in Mission Hills
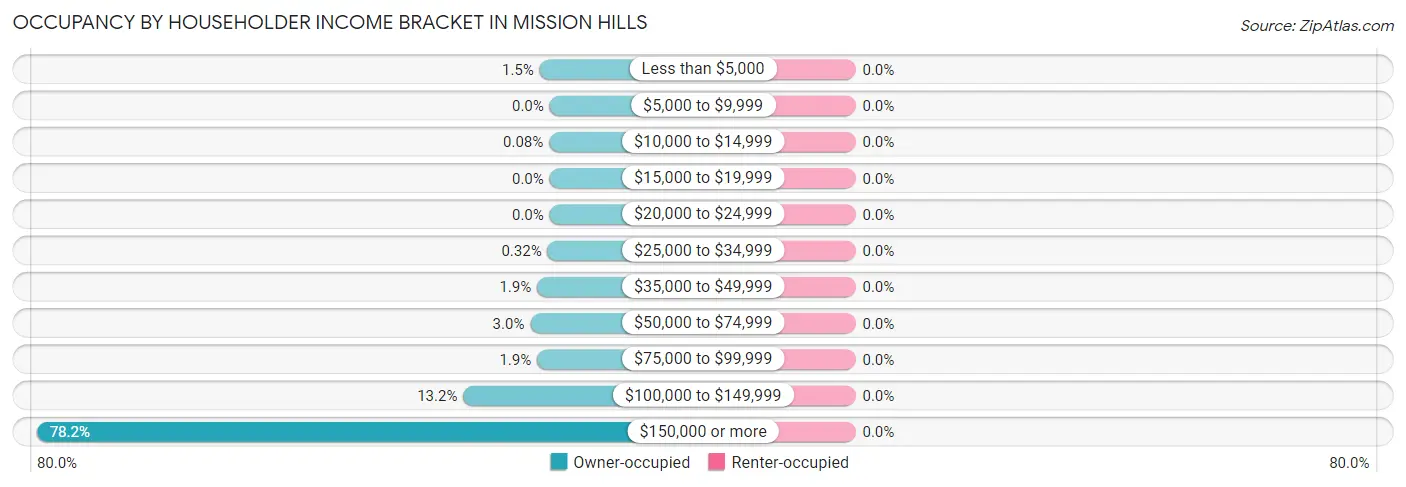
| Income Bracket | Owner-occupied | Renter-occupied |
| Less than $5,000 | 19 (1.5%) | 0 (0.0%) |
| $5,000 to $9,999 | 0 (0.0%) | 0 (0.0%) |
| $10,000 to $14,999 | 1 (0.1%) | 0 (0.0%) |
| $15,000 to $19,999 | 0 (0.0%) | 0 (0.0%) |
| $20,000 to $24,999 | 0 (0.0%) | 0 (0.0%) |
| $25,000 to $34,999 | 4 (0.3%) | 0 (0.0%) |
| $35,000 to $49,999 | 24 (1.9%) | 0 (0.0%) |
| $50,000 to $74,999 | 37 (2.9%) | 0 (0.0%) |
| $75,000 to $99,999 | 24 (1.9%) | 0 (0.0%) |
| $100,000 to $149,999 | 165 (13.2%) | 0 (0.0%) |
| $150,000 or more | 980 (78.1%) | 0 (0.0%) |
| Total | 1,254 (100.0%) | 0 (0.0%) |
Monthly Housing Cost Tiers in Mission Hills
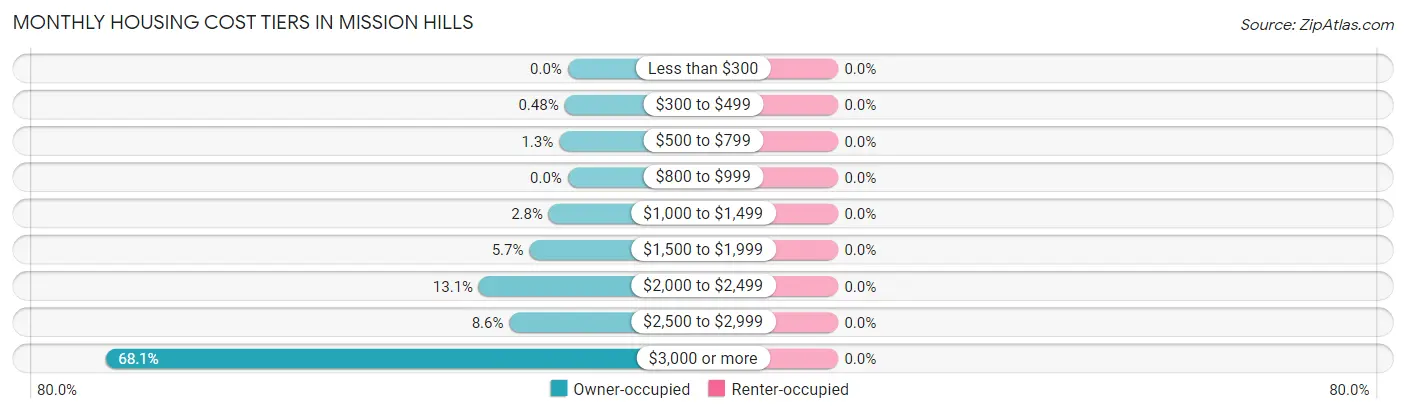
| Monthly Cost | Owner-occupied | Renter-occupied |
| Less than $300 | 0 (0.0%) | 0 (0.0%) |
| $300 to $499 | 6 (0.5%) | 0 (0.0%) |
| $500 to $799 | 16 (1.3%) | 0 (0.0%) |
| $800 to $999 | 0 (0.0%) | 0 (0.0%) |
| $1,000 to $1,499 | 35 (2.8%) | 0 (0.0%) |
| $1,500 to $1,999 | 71 (5.7%) | 0 (0.0%) |
| $2,000 to $2,499 | 164 (13.1%) | 0 (0.0%) |
| $2,500 to $2,999 | 108 (8.6%) | 0 (0.0%) |
| $3,000 or more | 854 (68.1%) | 0 (0.0%) |
| Total | 1,254 (100.0%) | 0 (0.0%) |
Physical Housing Characteristics in Mission Hills
Housing Structures in Mission Hills
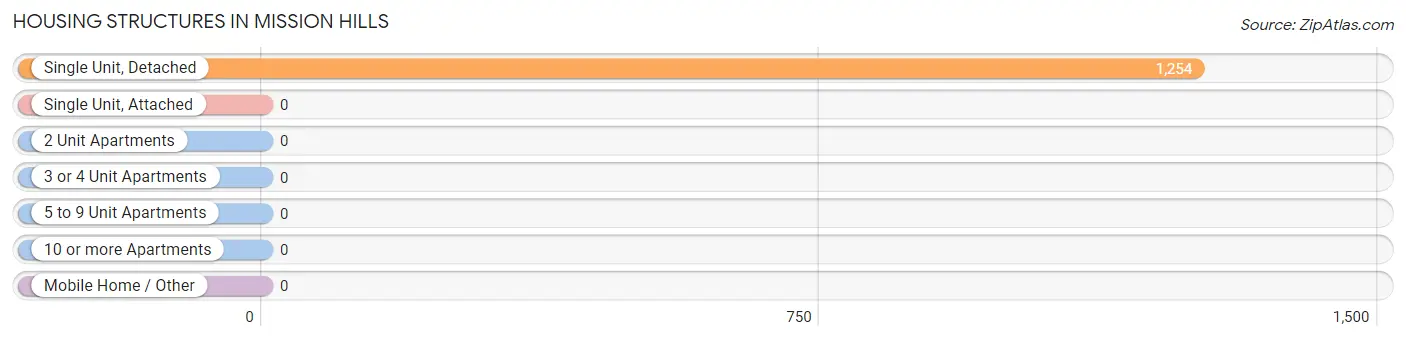
| Structure Type | # Housing Units | % Housing Units |
| Single Unit, Detached | 1,254 | 100.0% |
| Single Unit, Attached | 0 | 0.0% |
| 2 Unit Apartments | 0 | 0.0% |
| 3 or 4 Unit Apartments | 0 | 0.0% |
| 5 to 9 Unit Apartments | 0 | 0.0% |
| 10 or more Apartments | 0 | 0.0% |
| Mobile Home / Other | 0 | 0.0% |
| Total | 1,254 | 100.0% |
Housing Structures by Occupancy in Mission Hills
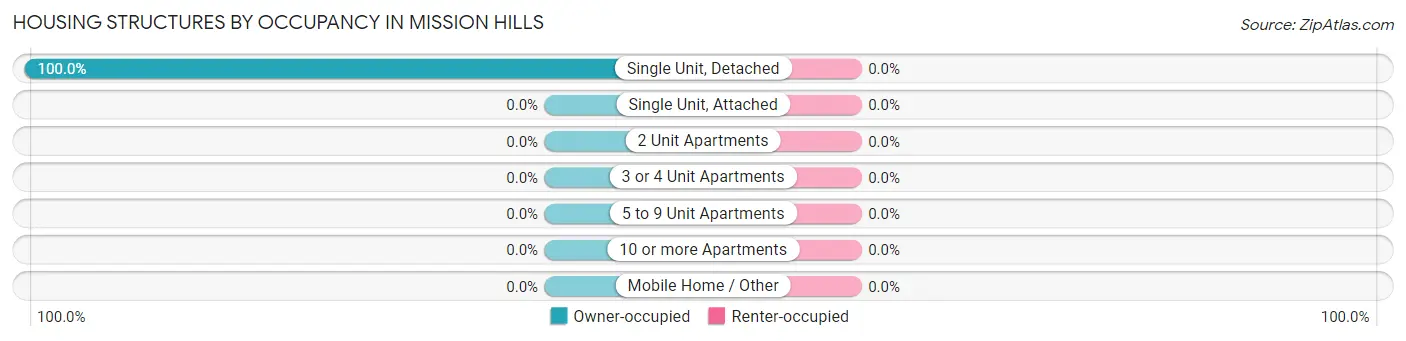
| Structure Type | Owner-occupied | Renter-occupied |
| Single Unit, Detached | 1,254 (100.0%) | 0 (0.0%) |
| Single Unit, Attached | 0 (0.0%) | 0 (0.0%) |
| 2 Unit Apartments | 0 (0.0%) | 0 (0.0%) |
| 3 or 4 Unit Apartments | 0 (0.0%) | 0 (0.0%) |
| 5 to 9 Unit Apartments | 0 (0.0%) | 0 (0.0%) |
| 10 or more Apartments | 0 (0.0%) | 0 (0.0%) |
| Mobile Home / Other | 0 (0.0%) | 0 (0.0%) |
| Total | 1,254 (100.0%) | 0 (0.0%) |
Housing Structures by Number of Rooms in Mission Hills
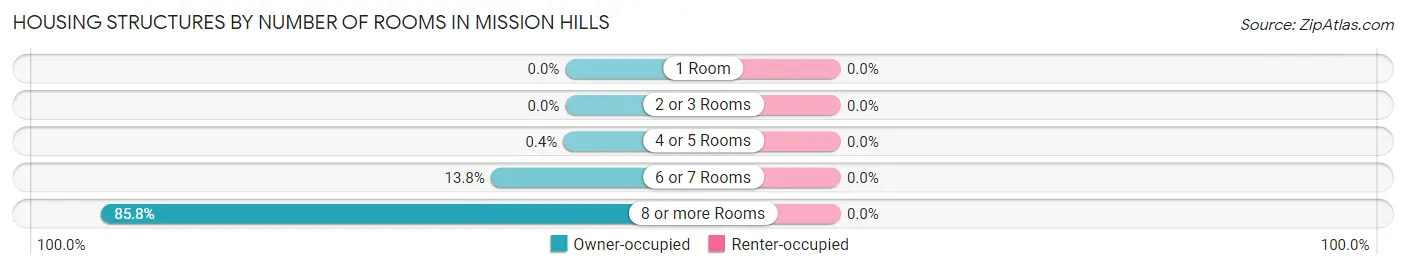
| Number of Rooms | Owner-occupied | Renter-occupied |
| 1 Room | 0 (0.0%) | 0 (0.0%) |
| 2 or 3 Rooms | 0 (0.0%) | 0 (0.0%) |
| 4 or 5 Rooms | 5 (0.4%) | 0 (0.0%) |
| 6 or 7 Rooms | 173 (13.8%) | 0 (0.0%) |
| 8 or more Rooms | 1,076 (85.8%) | 0 (0.0%) |
| Total | 1,254 (100.0%) | 0 (0.0%) |
Housing Structure by Heating Type in Mission Hills
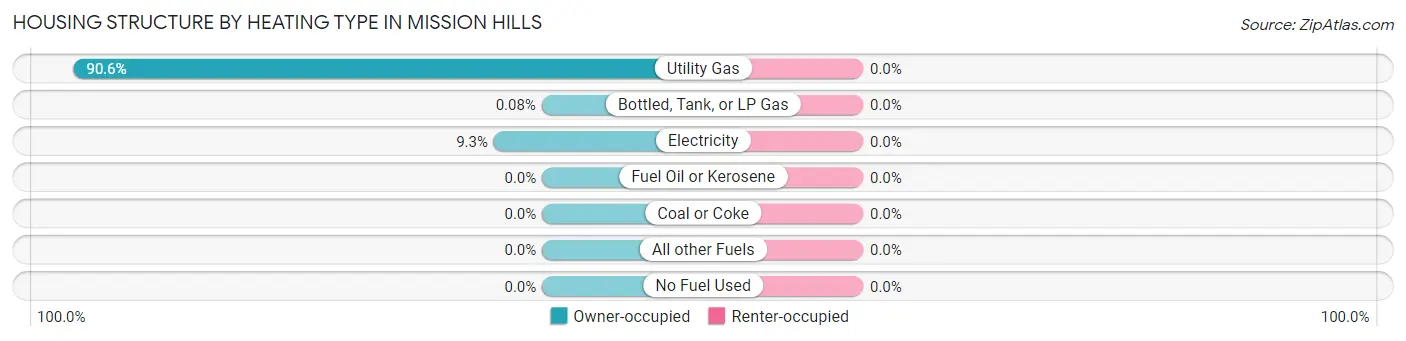
| Heating Type | Owner-occupied | Renter-occupied |
| Utility Gas | 1,136 (90.6%) | 0 (0.0%) |
| Bottled, Tank, or LP Gas | 1 (0.1%) | 0 (0.0%) |
| Electricity | 117 (9.3%) | 0 (0.0%) |
| Fuel Oil or Kerosene | 0 (0.0%) | 0 (0.0%) |
| Coal or Coke | 0 (0.0%) | 0 (0.0%) |
| All other Fuels | 0 (0.0%) | 0 (0.0%) |
| No Fuel Used | 0 (0.0%) | 0 (0.0%) |
| Total | 1,254 (100.0%) | 0 (0.0%) |
Household Vehicle Usage in Mission Hills
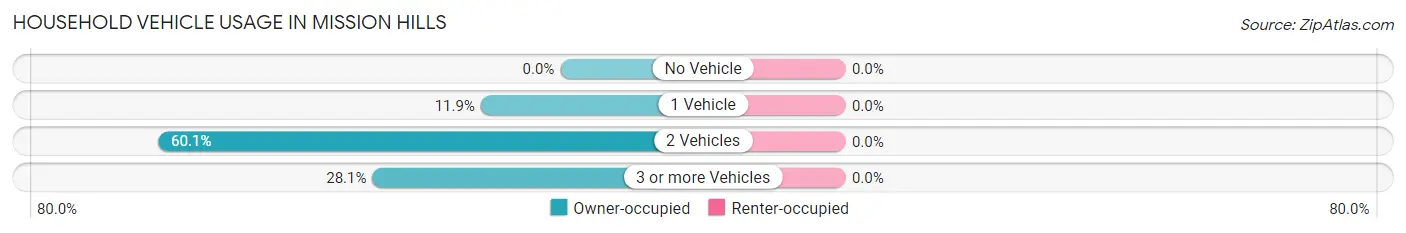
| Vehicles per Household | Owner-occupied | Renter-occupied |
| No Vehicle | 0 (0.0%) | 0 (0.0%) |
| 1 Vehicle | 149 (11.9%) | 0 (0.0%) |
| 2 Vehicles | 753 (60.1%) | 0 (0.0%) |
| 3 or more Vehicles | 352 (28.1%) | 0 (0.0%) |
| Total | 1,254 (100.0%) | 0 (0.0%) |
Real Estate & Mortgages in Mission Hills
Real Estate and Mortgage Overview in Mission Hills
| Characteristic | Without Mortgage | With Mortgage |
| Housing Units | 442 | 812 |
| Median Property Value | $1,388,200 | $1,087,000 |
| Median Household Income | $250,001 | $623 |
| Monthly Housing Costs | $1,501 | $703 |
| Real Estate Taxes | $10,001 | $5 |
Property Value by Mortgage Status in Mission Hills
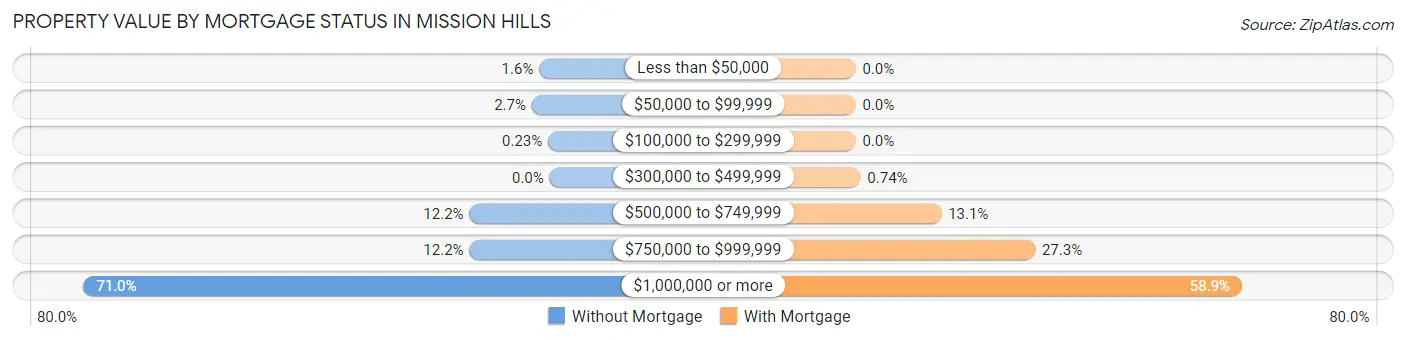
| Property Value | Without Mortgage | With Mortgage |
| Less than $50,000 | 7 (1.6%) | 0 (0.0%) |
| $50,000 to $99,999 | 12 (2.7%) | 0 (0.0%) |
| $100,000 to $299,999 | 1 (0.2%) | 0 (0.0%) |
| $300,000 to $499,999 | 0 (0.0%) | 6 (0.7%) |
| $500,000 to $749,999 | 54 (12.2%) | 106 (13.1%) |
| $750,000 to $999,999 | 54 (12.2%) | 222 (27.3%) |
| $1,000,000 or more | 314 (71.0%) | 478 (58.9%) |
| Total | 442 (100.0%) | 812 (100.0%) |
Household Income by Mortgage Status in Mission Hills
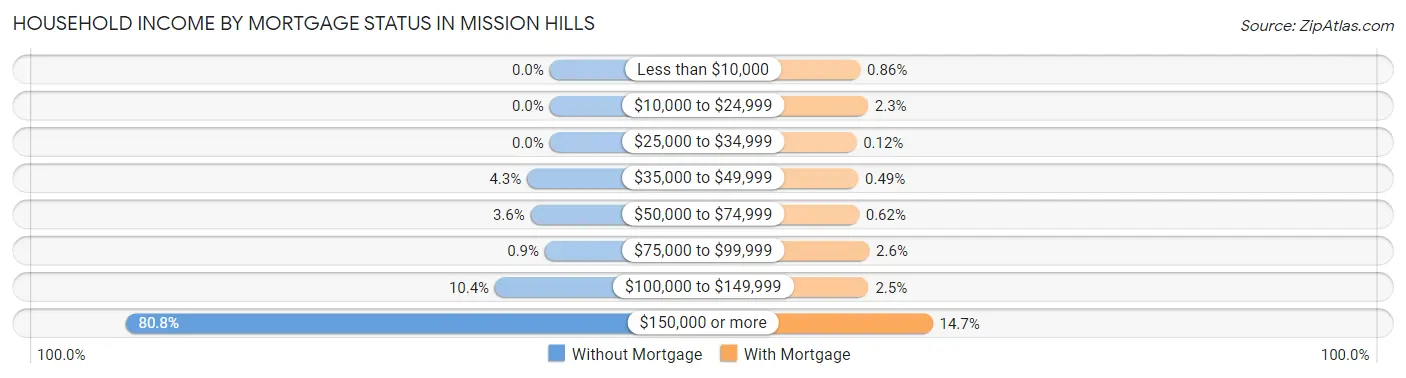
| Household Income | Without Mortgage | With Mortgage |
| Less than $10,000 | 0 (0.0%) | 7 (0.9%) |
| $10,000 to $24,999 | 0 (0.0%) | 19 (2.3%) |
| $25,000 to $34,999 | 0 (0.0%) | 1 (0.1%) |
| $35,000 to $49,999 | 19 (4.3%) | 4 (0.5%) |
| $50,000 to $74,999 | 16 (3.6%) | 5 (0.6%) |
| $75,000 to $99,999 | 4 (0.9%) | 21 (2.6%) |
| $100,000 to $149,999 | 46 (10.4%) | 20 (2.5%) |
| $150,000 or more | 357 (80.8%) | 119 (14.7%) |
| Total | 442 (100.0%) | 812 (100.0%) |
Property Value to Household Income Ratio in Mission Hills
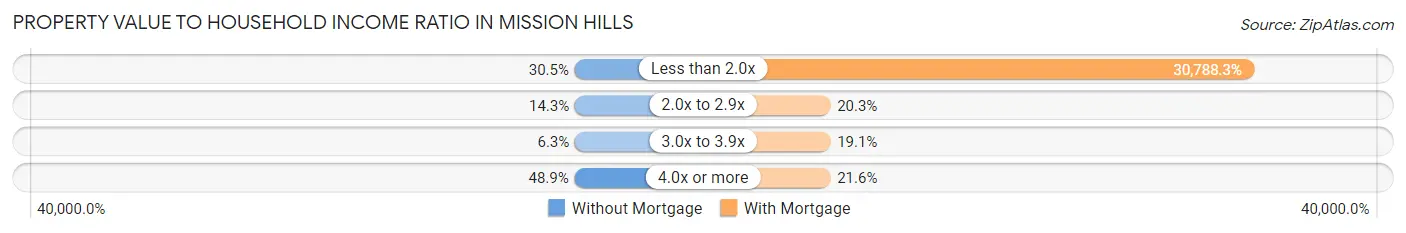
| Value-to-Income Ratio | Without Mortgage | With Mortgage |
| Less than 2.0x | 135 (30.5%) | 250,001 (30,788.3%) |
| 2.0x to 2.9x | 63 (14.2%) | 165 (20.3%) |
| 3.0x to 3.9x | 28 (6.3%) | 155 (19.1%) |
| 4.0x or more | 216 (48.9%) | 175 (21.5%) |
| Total | 442 (100.0%) | 812 (100.0%) |
Real Estate Taxes by Mortgage Status in Mission Hills
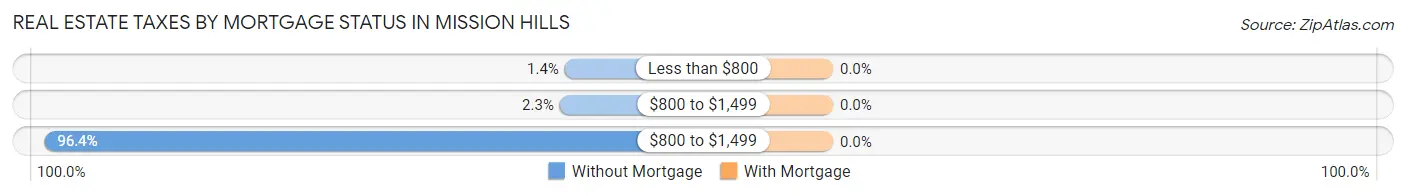
| Property Taxes | Without Mortgage | With Mortgage |
| Less than $800 | 6 (1.4%) | 0 (0.0%) |
| $800 to $1,499 | 10 (2.3%) | 0 (0.0%) |
| $800 to $1,499 | 426 (96.4%) | 0 (0.0%) |
| Total | 442 (100.0%) | 812 (100.0%) |
Health & Disability in Mission Hills
Health Insurance Coverage by Age in Mission Hills
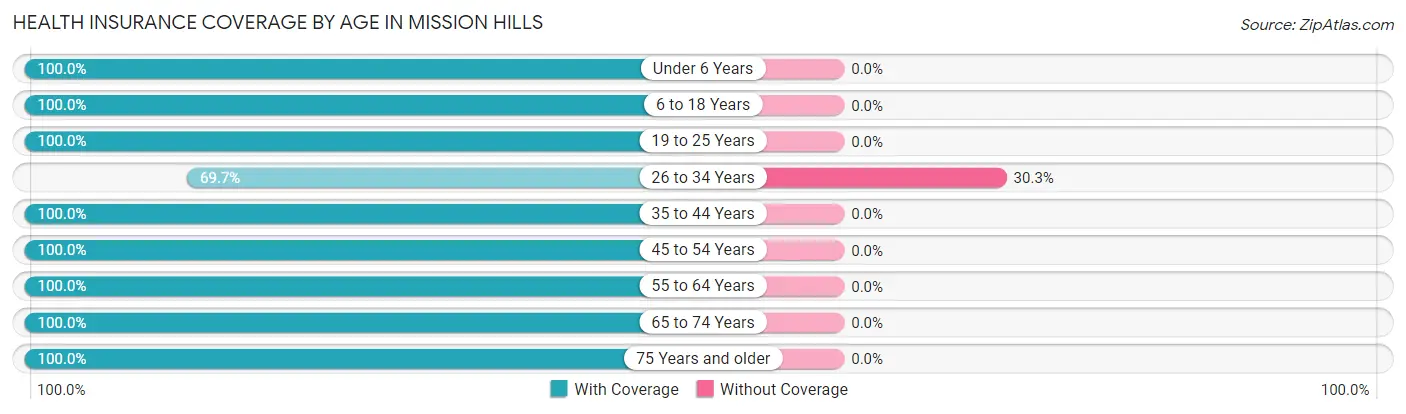
| Age Bracket | With Coverage | Without Coverage |
| Under 6 Years | 233 (100.0%) | 0 (0.0%) |
| 6 to 18 Years | 638 (100.0%) | 0 (0.0%) |
| 19 to 25 Years | 116 (100.0%) | 0 (0.0%) |
| 26 to 34 Years | 99 (69.7%) | 43 (30.3%) |
| 35 to 44 Years | 498 (100.0%) | 0 (0.0%) |
| 45 to 54 Years | 320 (100.0%) | 0 (0.0%) |
| 55 to 64 Years | 701 (100.0%) | 0 (0.0%) |
| 65 to 74 Years | 705 (100.0%) | 0 (0.0%) |
| 75 Years and older | 214 (100.0%) | 0 (0.0%) |
| Total | 3,524 (98.8%) | 43 (1.2%) |
Health Insurance Coverage by Citizenship Status in Mission Hills
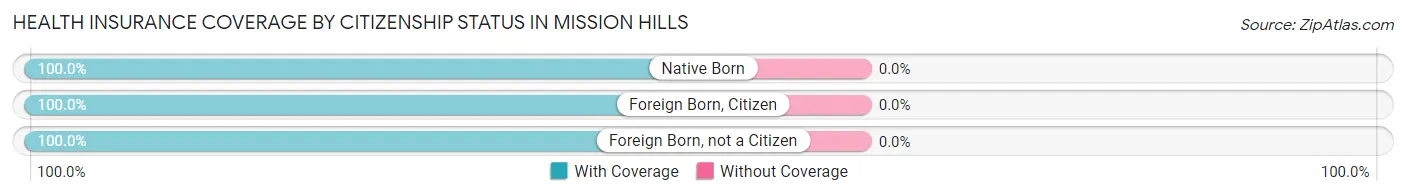
| Citizenship Status | With Coverage | Without Coverage |
| Native Born | 233 (100.0%) | 0 (0.0%) |
| Foreign Born, Citizen | 638 (100.0%) | 0 (0.0%) |
| Foreign Born, not a Citizen | 116 (100.0%) | 0 (0.0%) |
Health Insurance Coverage by Household Income in Mission Hills
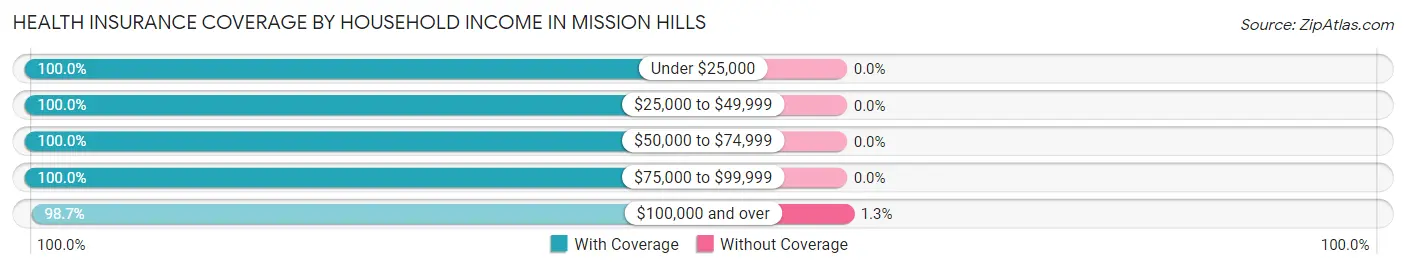
| Household Income | With Coverage | Without Coverage |
| Under $25,000 | 23 (100.0%) | 0 (0.0%) |
| $25,000 to $49,999 | 57 (100.0%) | 0 (0.0%) |
| $50,000 to $74,999 | 77 (100.0%) | 0 (0.0%) |
| $75,000 to $99,999 | 81 (100.0%) | 0 (0.0%) |
| $100,000 and over | 3,286 (98.7%) | 43 (1.3%) |
Public vs Private Health Insurance Coverage by Age in Mission Hills
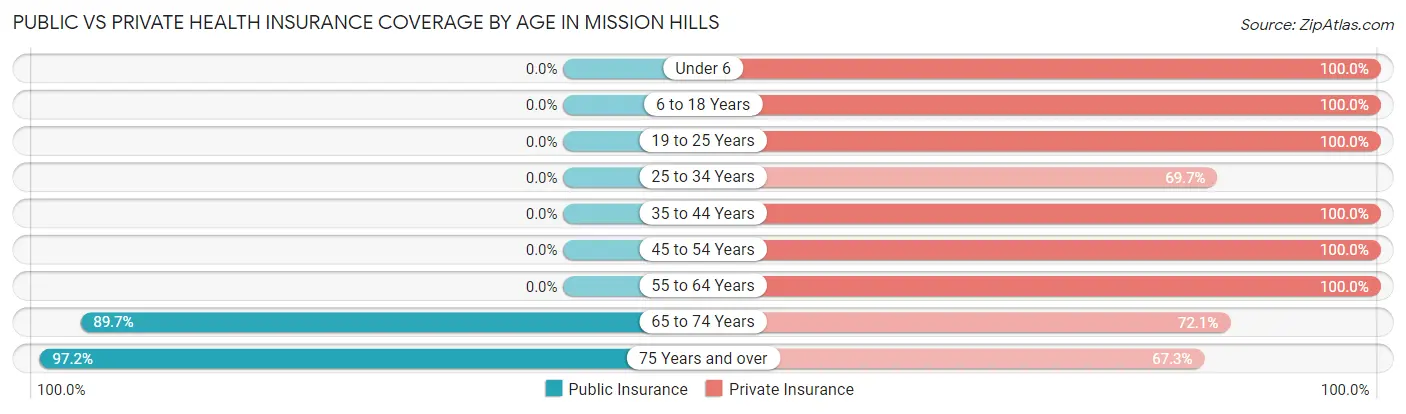
| Age Bracket | Public Insurance | Private Insurance |
| Under 6 | 0 (0.0%) | 233 (100.0%) |
| 6 to 18 Years | 0 (0.0%) | 638 (100.0%) |
| 19 to 25 Years | 0 (0.0%) | 116 (100.0%) |
| 25 to 34 Years | 0 (0.0%) | 99 (69.7%) |
| 35 to 44 Years | 0 (0.0%) | 498 (100.0%) |
| 45 to 54 Years | 0 (0.0%) | 320 (100.0%) |
| 55 to 64 Years | 0 (0.0%) | 701 (100.0%) |
| 65 to 74 Years | 632 (89.6%) | 508 (72.1%) |
| 75 Years and over | 208 (97.2%) | 144 (67.3%) |
| Total | 840 (23.5%) | 3,257 (91.3%) |
Disability Status by Sex by Age in Mission Hills
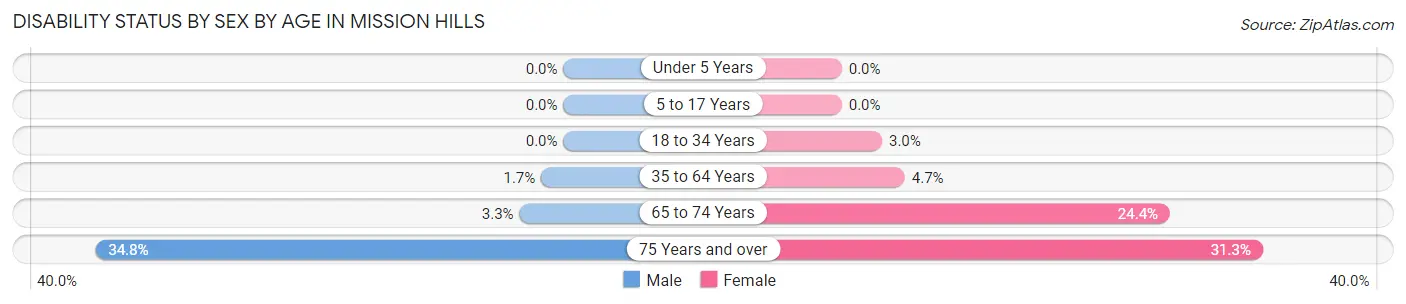
| Age Bracket | Male | Female |
| Under 5 Years | 0 (0.0%) | 0 (0.0%) |
| 5 to 17 Years | 0 (0.0%) | 0 (0.0%) |
| 18 to 34 Years | 0 (0.0%) | 6 (3.0%) |
| 35 to 64 Years | 12 (1.7%) | 37 (4.7%) |
| 65 to 74 Years | 14 (3.3%) | 67 (24.4%) |
| 75 Years and over | 41 (34.7%) | 30 (31.2%) |
Disability Class by Sex by Age in Mission Hills
Disability Class: Hearing Difficulty
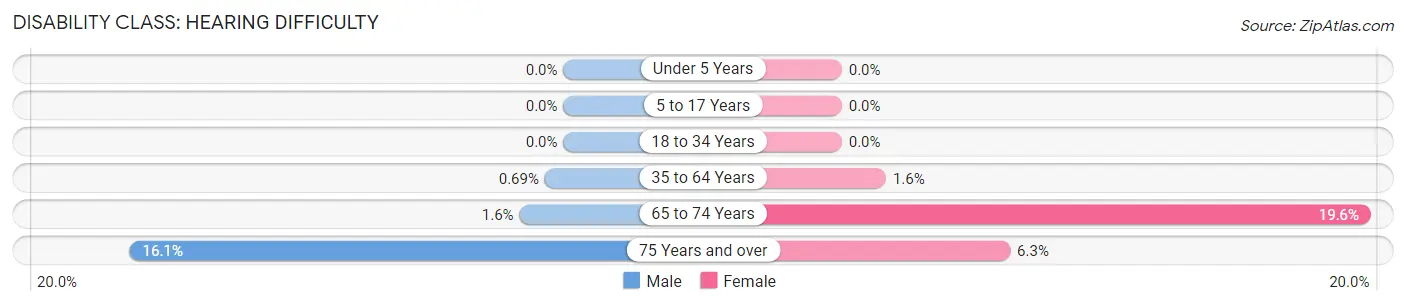
| Age Bracket | Male | Female |
| Under 5 Years | 0 (0.0%) | 0 (0.0%) |
| 5 to 17 Years | 0 (0.0%) | 0 (0.0%) |
| 18 to 34 Years | 0 (0.0%) | 0 (0.0%) |
| 35 to 64 Years | 5 (0.7%) | 13 (1.6%) |
| 65 to 74 Years | 7 (1.6%) | 54 (19.6%) |
| 75 Years and over | 19 (16.1%) | 6 (6.2%) |
Disability Class: Vision Difficulty
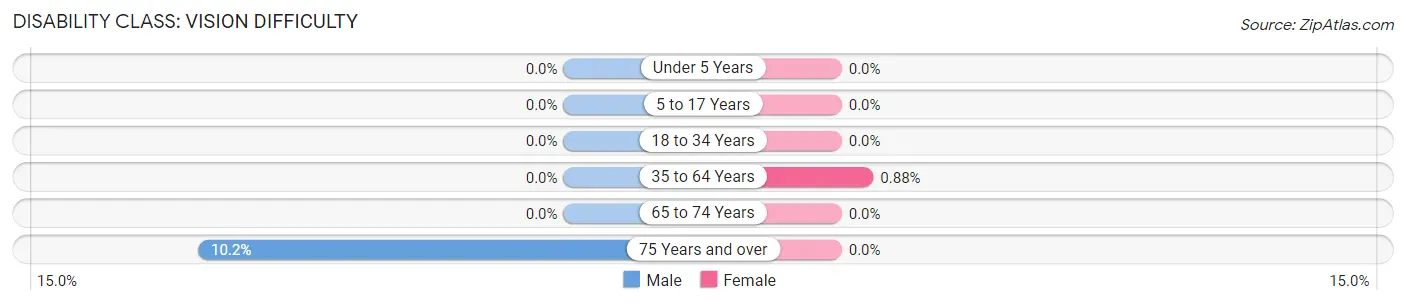
| Age Bracket | Male | Female |
| Under 5 Years | 0 (0.0%) | 0 (0.0%) |
| 5 to 17 Years | 0 (0.0%) | 0 (0.0%) |
| 18 to 34 Years | 0 (0.0%) | 0 (0.0%) |
| 35 to 64 Years | 0 (0.0%) | 7 (0.9%) |
| 65 to 74 Years | 0 (0.0%) | 0 (0.0%) |
| 75 Years and over | 12 (10.2%) | 0 (0.0%) |
Disability Class: Cognitive Difficulty
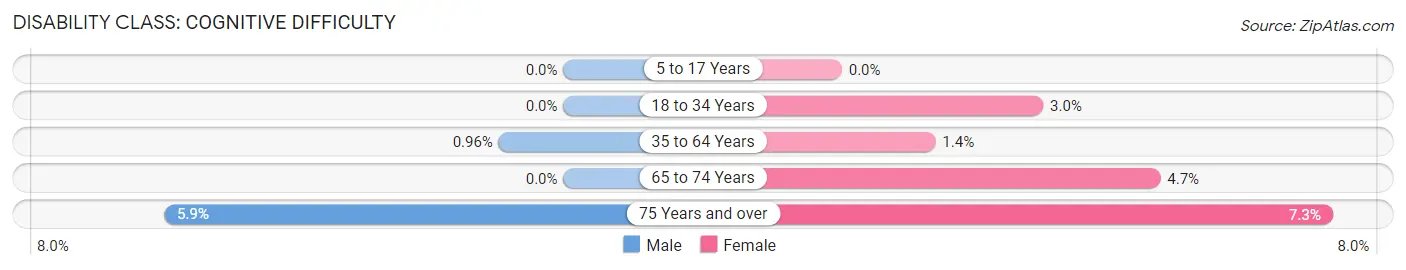
| Age Bracket | Male | Female |
| 5 to 17 Years | 0 (0.0%) | 0 (0.0%) |
| 18 to 34 Years | 0 (0.0%) | 6 (3.0%) |
| 35 to 64 Years | 7 (1.0%) | 11 (1.4%) |
| 65 to 74 Years | 0 (0.0%) | 13 (4.7%) |
| 75 Years and over | 7 (5.9%) | 7 (7.3%) |
Disability Class: Ambulatory Difficulty
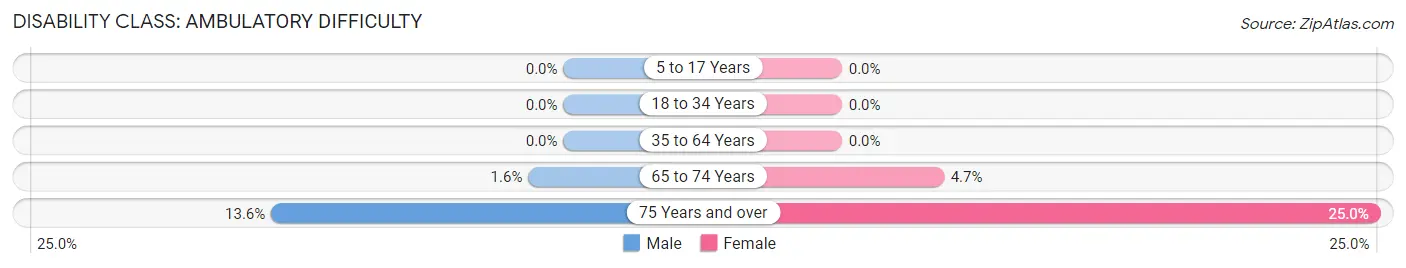
| Age Bracket | Male | Female |
| 5 to 17 Years | 0 (0.0%) | 0 (0.0%) |
| 18 to 34 Years | 0 (0.0%) | 0 (0.0%) |
| 35 to 64 Years | 0 (0.0%) | 0 (0.0%) |
| 65 to 74 Years | 7 (1.6%) | 13 (4.7%) |
| 75 Years and over | 16 (13.6%) | 24 (25.0%) |
Disability Class: Self-Care Difficulty
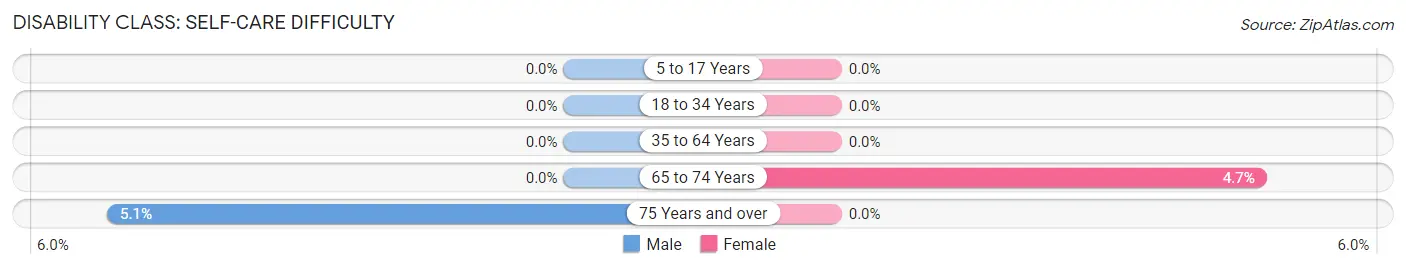
| Age Bracket | Male | Female |
| 5 to 17 Years | 0 (0.0%) | 0 (0.0%) |
| 18 to 34 Years | 0 (0.0%) | 0 (0.0%) |
| 35 to 64 Years | 0 (0.0%) | 0 (0.0%) |
| 65 to 74 Years | 0 (0.0%) | 13 (4.7%) |
| 75 Years and over | 6 (5.1%) | 0 (0.0%) |
Technology Access in Mission Hills
Computing Device Access in Mission Hills
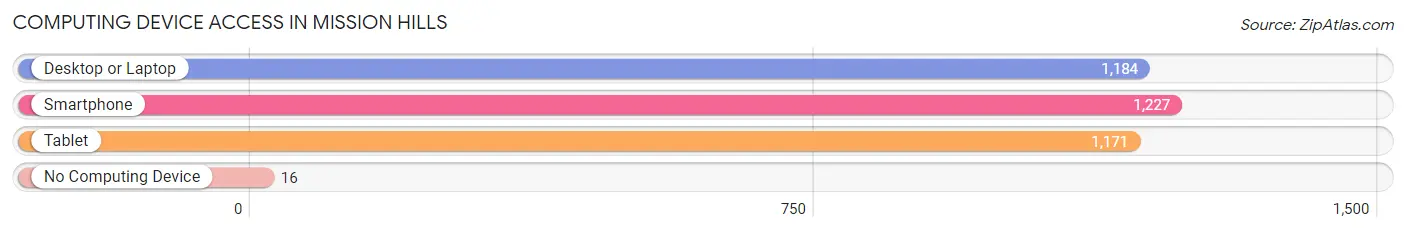
| Device Type | # Households | % Households |
| Desktop or Laptop | 1,184 | 94.4% |
| Smartphone | 1,227 | 97.9% |
| Tablet | 1,171 | 93.4% |
| No Computing Device | 16 | 1.3% |
| Total | 1,254 | 100.0% |
Internet Access in Mission Hills
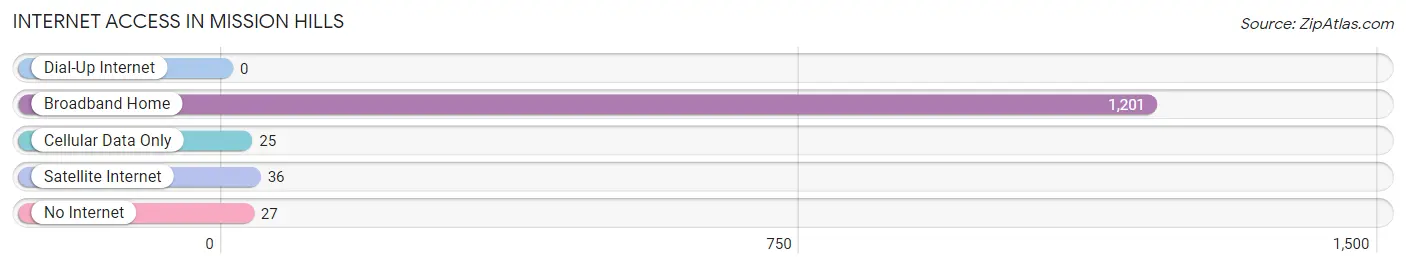
| Internet Type | # Households | % Households |
| Dial-Up Internet | 0 | 0.0% |
| Broadband Home | 1,201 | 95.8% |
| Cellular Data Only | 25 | 2.0% |
| Satellite Internet | 36 | 2.9% |
| No Internet | 27 | 2.1% |
| Total | 1,254 | 100.0% |
Mission Hills Summary
History
Mission Hills is a city located in Johnson County, Kansas, United States. It is a suburb of Kansas City, Missouri, and is part of the Kansas City metropolitan area. The city was incorporated in 1949 and has a population of 3,717 as of the 2010 census.
Mission Hills was originally part of the Shawnee Indian Reservation, which was established in 1825. The area was settled by European-American settlers in the late 19th century. The city was named after the Mission Hills Country Club, which was founded in 1921. The club was the first private golf club in the Kansas City area and was designed by renowned golf course architect A.W. Tillinghast.
The city was incorporated in 1949 and has since grown to become one of the most affluent suburbs of Kansas City. The city is home to many prominent residents, including former Kansas City Chiefs quarterback Len Dawson and former Kansas City Royals pitcher Bret Saberhagen.
Geography
Mission Hills is located at 39°02'45" North, 94°35'45" West (39.04583, -94.59583). It is situated in the rolling hills of northeastern Johnson County, Kansas, and is part of the Kansas City metropolitan area.
The city has a total area of 1.2 square miles, all of which is land. The city is bordered by Leawood to the north, Fairway to the east, and Westwood to the south.
Economy
Mission Hills is a wealthy suburb of Kansas City and is home to many affluent residents. The city has a strong economy, with a median household income of $150,000 and a median home value of $1.2 million.
The city is home to several large employers, including the Mission Hills Country Club, the Mission Hills Golf Course, and the Mission Hills Shopping Center. The city is also home to several small businesses, including restaurants, boutiques, and professional services.
Demographics
As of the 2010 census, there were 3,717 people, 1,541 households, and 1,093 families residing in the city. The population density was 3,072.2 people per square mile. The racial makeup of the city was 92.2% White, 2.2% African American, 0.2% Native American, 3.2% Asian, 0.1% Pacific Islander, 0.7% from other races, and 1.6% from two or more races. Hispanic or Latino of any race were 3.2% of the population.
There were 1,541 households, out of which 28.2% had children under the age of 18 living with them, 63.2% were married couples living together, 5.7% had a female householder with no husband present, and 29.2% were non-families. 24.3% of all households were made up of individuals, and 11.2% had someone living alone who was 65 years of age or older. The average household size was 2.41 and the average family size was 2.88.
In the city, the population was spread out, with 22.2% under the age of 18, 4.2% from 18 to 24, 22.2% from 25 to 44, 33.2% from 45 to 64, and 18.2% who were 65 years of age or older. The median age was 45 years. For every 100 females, there were 93.2 males. For every 100 females age 18 and over, there were 91.2 males.
The median income for a household in the city was $150,000, and the median income for a family was $175,000. Males had a median income of $100,000 versus $60,000 for females. The per capita income for the city was $90,000. About 2.2% of families and 3.2% of the population were below the poverty line, including 4.2% of those under age 18 and 1.2% of those age 65 or over.
Common Questions
What is Per Capita Income in Mission Hills?
Per Capita income in Mission Hills is $235,738.
What is the Median Family Income in Mission Hills?
Median Family Income in Mission Hills is $250,001.
What is the Median Household income in Mission Hills?
Median Household Income in Mission Hills is $250,001.
What is Income or Wage Gap in Mission Hills?
Income or Wage Gap in Mission Hills is 77.8%.
Women in Mission Hills earn 22.2 cents for every dollar earned by a man.
What is Inequality or Gini Index in Mission Hills?
Inequality or Gini Index in Mission Hills is 0.46.
What is the Total Population of Mission Hills?
Total Population of Mission Hills is 3,567.
What is the Total Male Population of Mission Hills?
Total Male Population of Mission Hills is 1,761.
What is the Total Female Population of Mission Hills?
Total Female Population of Mission Hills is 1,806.
What is the Ratio of Males per 100 Females in Mission Hills?
There are 97.51 Males per 100 Females in Mission Hills.
What is the Ratio of Females per 100 Males in Mission Hills?
There are 102.56 Females per 100 Males in Mission Hills.
What is the Median Population Age in Mission Hills?
Median Population Age in Mission Hills is 49.8 Years.
What is the Average Family Size in Mission Hills
Average Family Size in Mission Hills is 3.1 People.
What is the Average Household Size in Mission Hills
Average Household Size in Mission Hills is 2.8 People.
How Large is the Labor Force in Mission Hills?
There are 1,828 People in the Labor Forcein in Mission Hills.
What is the Percentage of People in the Labor Force in Mission Hills?
66.5% of People are in the Labor Force in Mission Hills.
What is the Unemployment Rate in Mission Hills?
Unemployment Rate in Mission Hills is 0.5%.