Asbury Lake, FL Map & Demographics
Asbury Lake Map
Asbury Lake Overview
$43,130
PER CAPITA INCOME
$114,221
AVG FAMILY INCOME
$102,454
AVG HOUSEHOLD INCOME
42.7%
WAGE / INCOME GAP [ % ]
57.3¢/ $1
WAGE / INCOME GAP [ $ ]
0.37
INEQUALITY / GINI INDEX
12,515
TOTAL POPULATION
6,472
MALE POPULATION
6,043
FEMALE POPULATION
107.10
MALES / 100 FEMALES
93.37
FEMALES / 100 MALES
38.6
MEDIAN AGE
3.1
AVG FAMILY SIZE
2.8
AVG HOUSEHOLD SIZE
6,359
LABOR FORCE [ PEOPLE ]
66.6%
PERCENT IN LABOR FORCE
1.3%
UNEMPLOYMENT RATE
Income in Asbury Lake
Income Overview in Asbury Lake
Per Capita Income in Asbury Lake is $43,130, while median incomes of families and households are $114,221 and $102,454 respectively.
| Characteristic | Number | Measure |
| Per Capita Income | 12,515 | $43,130 |
| Median Family Income | 3,494 | $114,221 |
| Mean Family Income | 3,494 | $133,518 |
| Median Household Income | 4,529 | $102,454 |
| Mean Household Income | 4,529 | $118,068 |
| Income Deficit | 3,494 | $0 |
| Wage / Income Gap (%) | 12,515 | 42.75% |
| Wage / Income Gap ($) | 12,515 | 57.25¢ per $1 |
| Gini / Inequality Index | 12,515 | 0.37 |
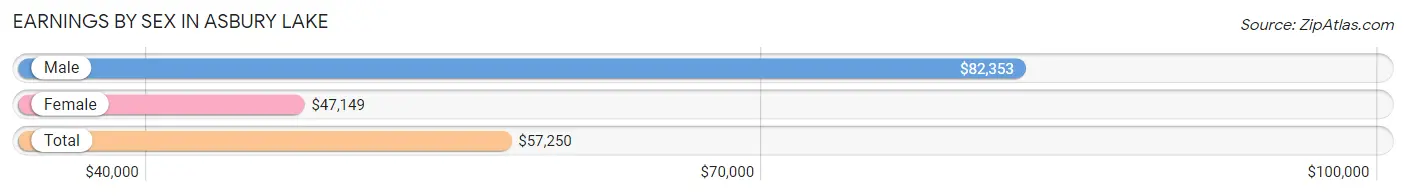
Earnings by Sex in Asbury Lake
Average Earnings in Asbury Lake are $57,250, $82,353 for men and $47,149 for women, a difference of 42.7%.
| Sex | Number | Average Earnings |
| Male | 3,138 (48.6%) | $82,353 |
| Female | 3,323 (51.4%) | $47,149 |
| Total | 6,461 (100.0%) | $57,250 |
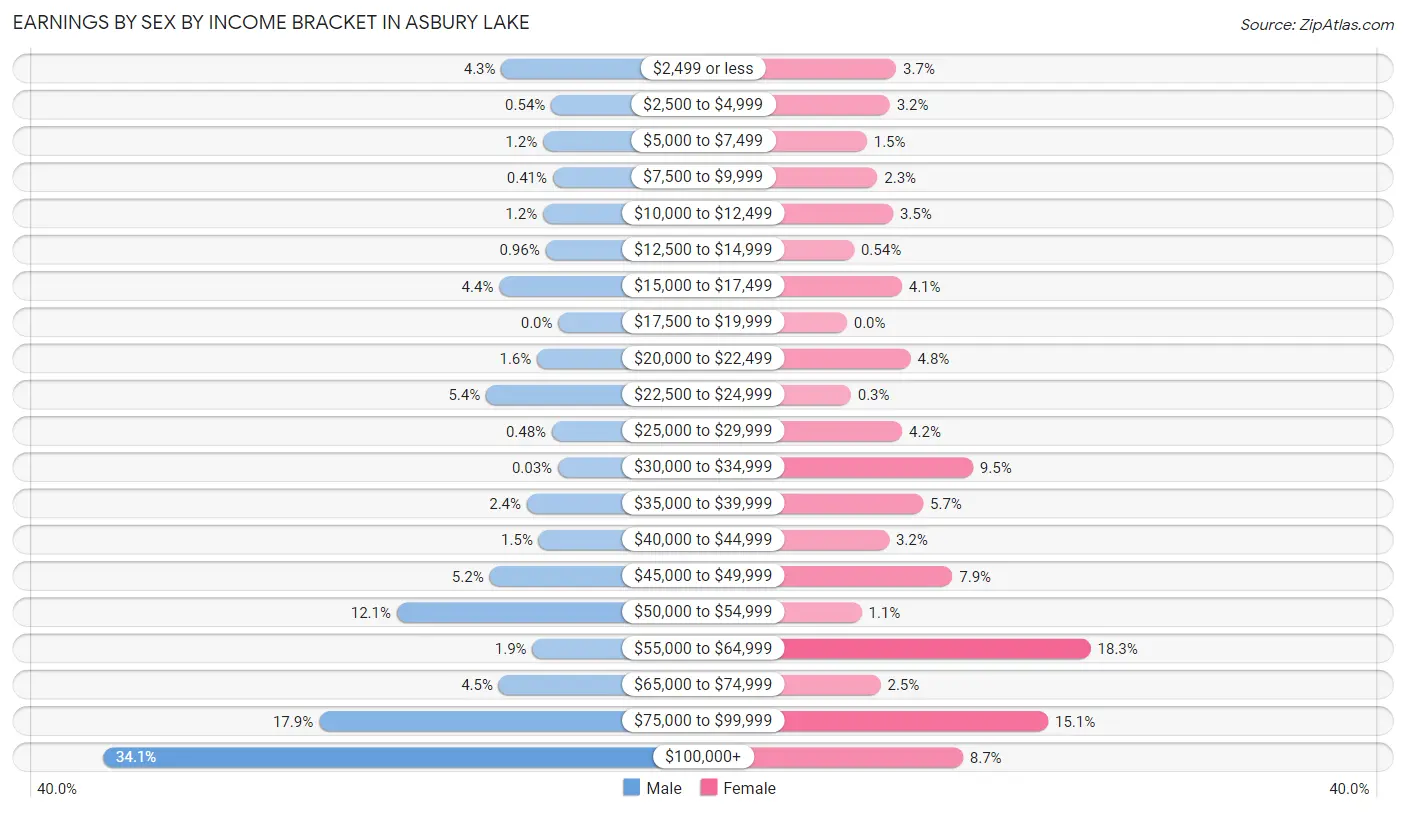
Earnings by Sex by Income Bracket in Asbury Lake
The most common earnings brackets in Asbury Lake are $100,000+ for men (1,071 | 34.1%) and $55,000 to $64,999 for women (607 | 18.3%).
| Income | Male | Female |
| $2,499 or less | 134 (4.3%) | 123 (3.7%) |
| $2,500 to $4,999 | 17 (0.5%) | 107 (3.2%) |
| $5,000 to $7,499 | 36 (1.1%) | 50 (1.5%) |
| $7,500 to $9,999 | 13 (0.4%) | 76 (2.3%) |
| $10,000 to $12,499 | 36 (1.1%) | 115 (3.5%) |
| $12,500 to $14,999 | 30 (1.0%) | 18 (0.5%) |
| $15,000 to $17,499 | 139 (4.4%) | 137 (4.1%) |
| $17,500 to $19,999 | 0 (0.0%) | 0 (0.0%) |
| $20,000 to $22,499 | 50 (1.6%) | 159 (4.8%) |
| $22,500 to $24,999 | 170 (5.4%) | 10 (0.3%) |
| $25,000 to $29,999 | 15 (0.5%) | 138 (4.2%) |
| $30,000 to $34,999 | 1 (0.0%) | 314 (9.5%) |
| $35,000 to $39,999 | 74 (2.4%) | 190 (5.7%) |
| $40,000 to $44,999 | 46 (1.5%) | 105 (3.2%) |
| $45,000 to $49,999 | 162 (5.2%) | 263 (7.9%) |
| $50,000 to $54,999 | 380 (12.1%) | 37 (1.1%) |
| $55,000 to $64,999 | 61 (1.9%) | 607 (18.3%) |
| $65,000 to $74,999 | 140 (4.5%) | 84 (2.5%) |
| $75,000 to $99,999 | 563 (17.9%) | 501 (15.1%) |
| $100,000+ | 1,071 (34.1%) | 289 (8.7%) |
| Total | 3,138 (100.0%) | 3,323 (100.0%) |
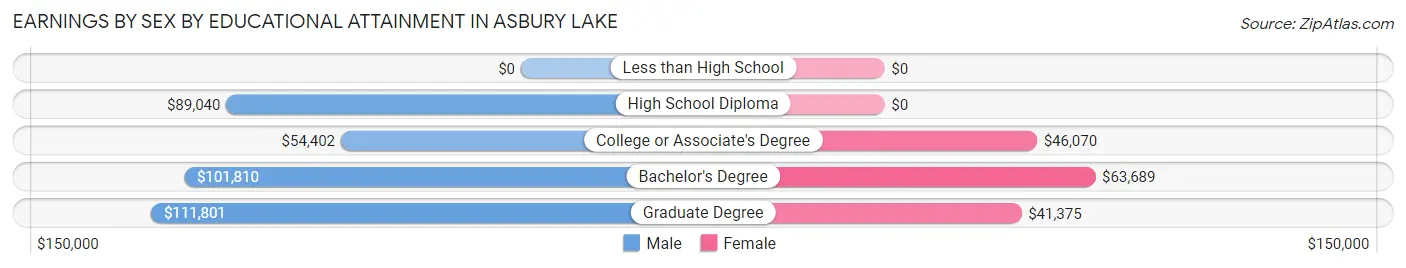
Earnings by Sex by Educational Attainment in Asbury Lake
Average earnings in Asbury Lake are $87,960 for men and $57,040 for women, a difference of 35.1%. Men with an educational attainment of graduate degree enjoy the highest average annual earnings of $111,801, while those with college or associate's degree education earn the least with $54,402. Women with an educational attainment of bachelor's degree earn the most with the average annual earnings of $63,689, while those with graduate degree education have the smallest earnings of $41,375.
| Educational Attainment | Male Income | Female Income |
| Less than High School | - | - |
| High School Diploma | $89,040 | $0 |
| College or Associate's Degree | $54,402 | $46,070 |
| Bachelor's Degree | $101,810 | $63,689 |
| Graduate Degree | $111,801 | $41,375 |
| Total | $87,960 | $57,040 |
Family Income in Asbury Lake
Family Income Brackets in Asbury Lake
According to the Asbury Lake family income data, there are 1,321 families falling into the $100,000 to $149,999 income range, which is the most common income bracket and makes up 37.8% of all families.
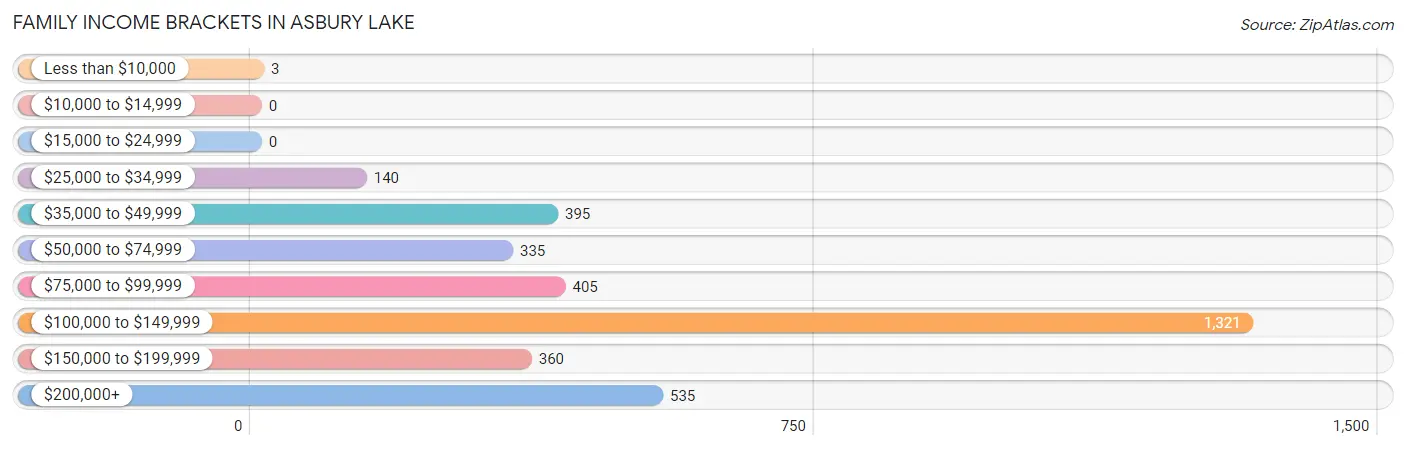
| Income Bracket | # Families | % Families |
| Less than $10,000 | 3 | 0.1% |
| $10,000 to $14,999 | 0 | 0.0% |
| $15,000 to $24,999 | 0 | 0.0% |
| $25,000 to $34,999 | 140 | 4.0% |
| $35,000 to $49,999 | 395 | 11.3% |
| $50,000 to $74,999 | 335 | 9.6% |
| $75,000 to $99,999 | 405 | 11.6% |
| $100,000 to $149,999 | 1,321 | 37.8% |
| $150,000 to $199,999 | 360 | 10.3% |
| $200,000+ | 535 | 15.3% |
Family Income by Famaliy Size in Asbury Lake
6-person families (57 | 1.6%) account for the highest median family income in Asbury Lake with $140,188 per family, while 3-person families (491 | 14.1%) have the highest median income of $41,594 per family member.
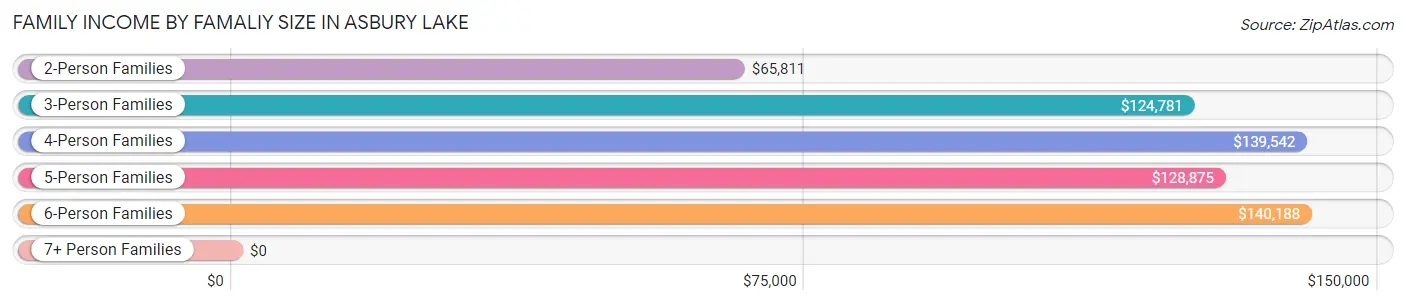
| Income Bracket | # Families | Median Income |
| 2-Person Families | 1,490 (42.6%) | $65,811 |
| 3-Person Families | 491 (14.1%) | $124,781 |
| 4-Person Families | 1,093 (31.3%) | $139,542 |
| 5-Person Families | 305 (8.7%) | $128,875 |
| 6-Person Families | 57 (1.6%) | $140,188 |
| 7+ Person Families | 58 (1.7%) | $0 |
| Total | 3,494 (100.0%) | $114,221 |
Family Income by Number of Earners in Asbury Lake
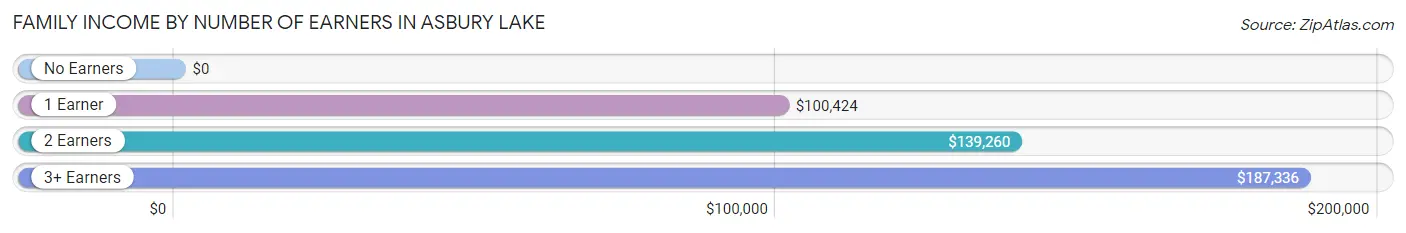
| Number of Earners | # Families | Median Income |
| No Earners | 582 (16.7%) | $0 |
| 1 Earner | 1,064 (30.4%) | $100,424 |
| 2 Earners | 1,399 (40.0%) | $139,260 |
| 3+ Earners | 449 (12.9%) | $187,336 |
| Total | 3,494 (100.0%) | $114,221 |
Household Income in Asbury Lake
Household Income Brackets in Asbury Lake
With 1,354 households falling in the category, the $100,000 to $149,999 income range is the most frequent in Asbury Lake, accounting for 29.9% of all households. In contrast, only 5 households (0.1%) fall into the $10,000 to $14,999 income bracket, making it the least populous group.
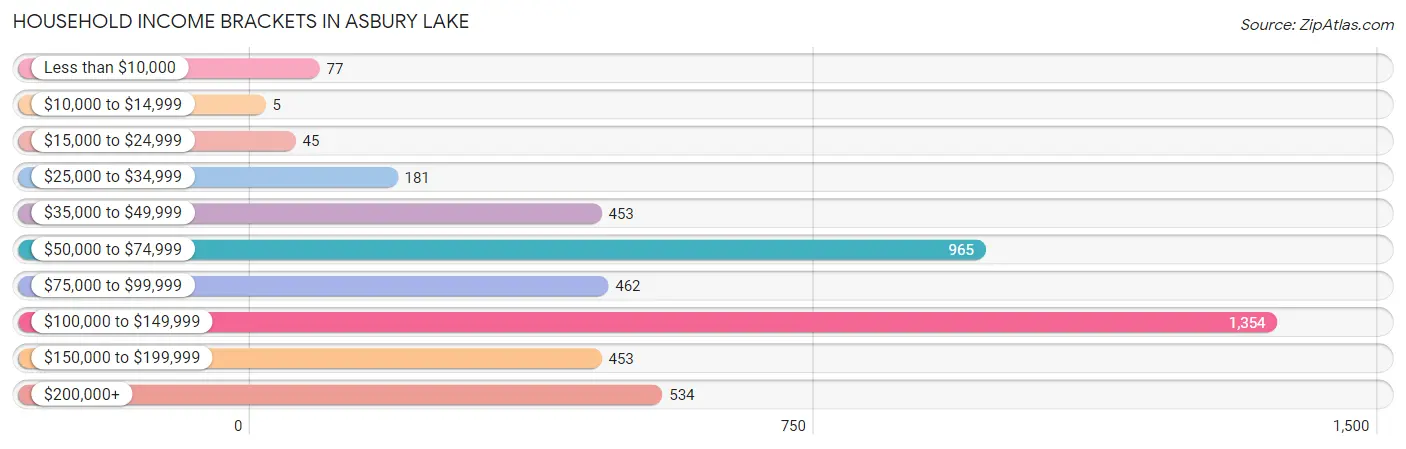
| Income Bracket | # Households | % Households |
| Less than $10,000 | 77 | 1.7% |
| $10,000 to $14,999 | 5 | 0.1% |
| $15,000 to $24,999 | 45 | 1.0% |
| $25,000 to $34,999 | 181 | 4.0% |
| $35,000 to $49,999 | 453 | 10.0% |
| $50,000 to $74,999 | 965 | 21.3% |
| $75,000 to $99,999 | 462 | 10.2% |
| $100,000 to $149,999 | 1,354 | 29.9% |
| $150,000 to $199,999 | 453 | 10.0% |
| $200,000+ | 534 | 11.8% |
Household Income by Householder Age in Asbury Lake
The median household income in Asbury Lake is $102,454, with the highest median household income of $137,651 found in the 25 to 44 years age bracket for the primary householder. A total of 1,371 households (30.3%) fall into this category. Meanwhile, the 15 to 24 years age bracket for the primary householder has the lowest median household income of $0, with 65 households (1.4%) in this group.
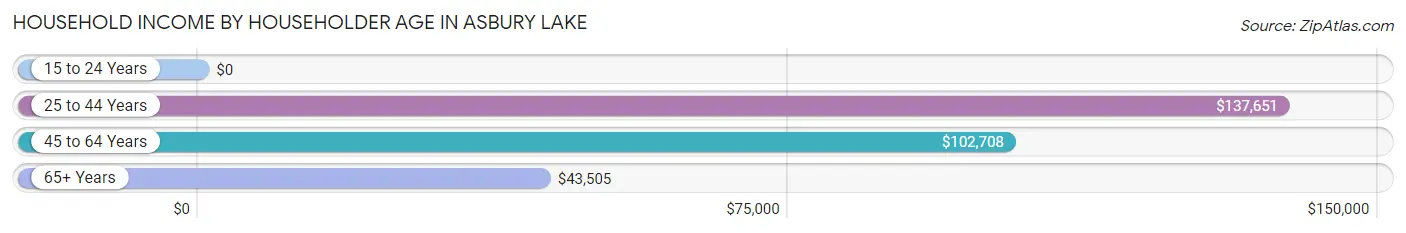
| Income Bracket | # Households | Median Income |
| 15 to 24 Years | 65 (1.4%) | $0 |
| 25 to 44 Years | 1,371 (30.3%) | $137,651 |
| 45 to 64 Years | 2,379 (52.5%) | $102,708 |
| 65+ Years | 714 (15.8%) | $43,505 |
| Total | 4,529 (100.0%) | $102,454 |
Poverty in Asbury Lake
Income Below Poverty by Sex and Age in Asbury Lake
With 1.4% poverty level for males and 4.2% for females among the residents of Asbury Lake, 15 year old males and 35 to 44 year old females are the most vulnerable to poverty, with 83 males (54.6%) and 102 females (10.9%) in their respective age groups living below the poverty level.
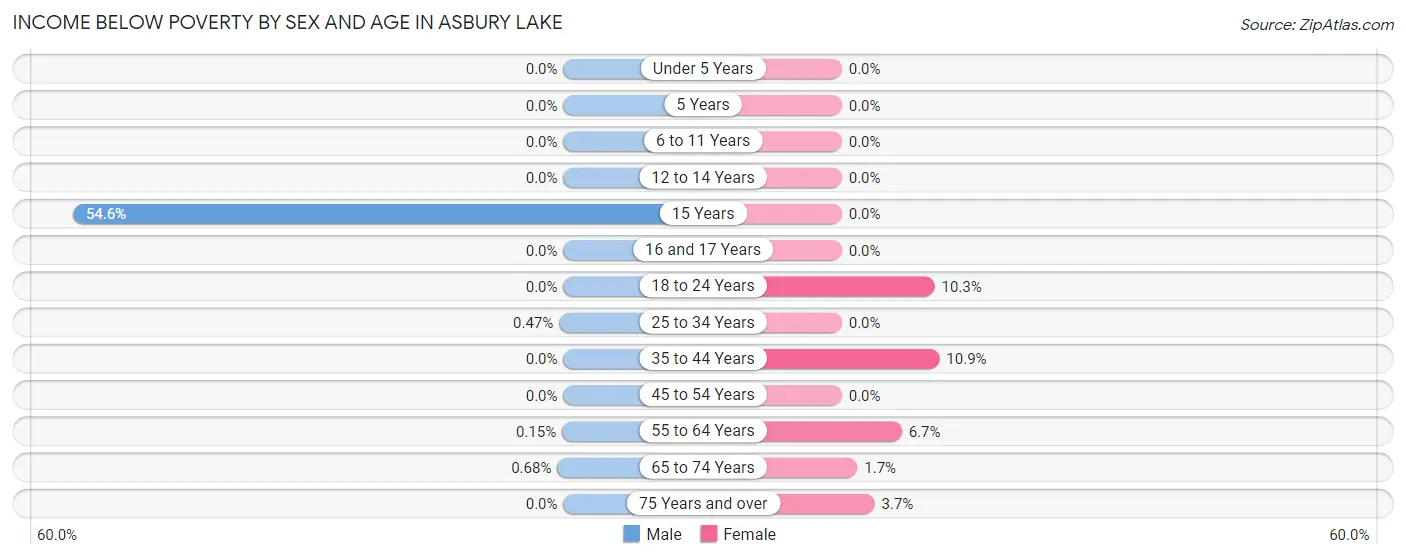
| Age Bracket | Male | Female |
| Under 5 Years | 0 (0.0%) | 0 (0.0%) |
| 5 Years | 0 (0.0%) | 0 (0.0%) |
| 6 to 11 Years | 0 (0.0%) | 0 (0.0%) |
| 12 to 14 Years | 0 (0.0%) | 0 (0.0%) |
| 15 Years | 83 (54.6%) | 0 (0.0%) |
| 16 and 17 Years | 0 (0.0%) | 0 (0.0%) |
| 18 to 24 Years | 0 (0.0%) | 65 (10.3%) |
| 25 to 34 Years | 2 (0.5%) | 0 (0.0%) |
| 35 to 44 Years | 0 (0.0%) | 102 (10.9%) |
| 45 to 54 Years | 0 (0.0%) | 0 (0.0%) |
| 55 to 64 Years | 1 (0.2%) | 66 (6.7%) |
| 65 to 74 Years | 4 (0.7%) | 9 (1.7%) |
| 75 Years and over | 0 (0.0%) | 7 (3.6%) |
| Total | 90 (1.4%) | 249 (4.2%) |
Income Above Poverty by Sex and Age in Asbury Lake
According to the poverty statistics in Asbury Lake, males aged under 5 years and females aged under 5 years are the age groups that are most secure financially, with 100.0% of males and 100.0% of females in these age groups living above the poverty line.
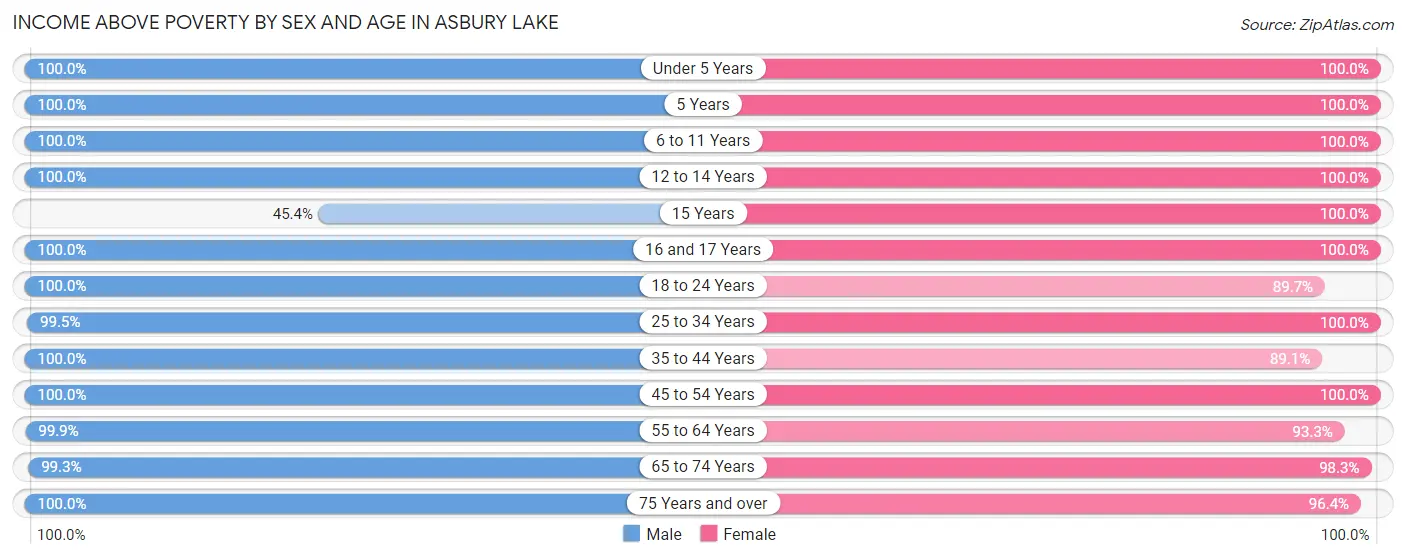
| Age Bracket | Male | Female |
| Under 5 Years | 666 (100.0%) | 165 (100.0%) |
| 5 Years | 220 (100.0%) | 21 (100.0%) |
| 6 to 11 Years | 506 (100.0%) | 548 (100.0%) |
| 12 to 14 Years | 364 (100.0%) | 216 (100.0%) |
| 15 Years | 69 (45.4%) | 40 (100.0%) |
| 16 and 17 Years | 224 (100.0%) | 135 (100.0%) |
| 18 to 24 Years | 493 (100.0%) | 564 (89.7%) |
| 25 to 34 Years | 420 (99.5%) | 417 (100.0%) |
| 35 to 44 Years | 1,214 (100.0%) | 836 (89.1%) |
| 45 to 54 Years | 857 (100.0%) | 1,164 (100.0%) |
| 55 to 64 Years | 657 (99.9%) | 924 (93.3%) |
| 65 to 74 Years | 582 (99.3%) | 510 (98.3%) |
| 75 Years and over | 110 (100.0%) | 185 (96.4%) |
| Total | 6,382 (98.6%) | 5,725 (95.8%) |
Income Below Poverty Among Married-Couple Families in Asbury Lake
The poverty statistics for married-couple families in Asbury Lake show that 0.1% or 4 of the total 3,073 families live below the poverty line. Families with no children have the highest poverty rate of 0.3%, comprising of 4 families. On the other hand, families with 1 or 2 children have the lowest poverty rate of 0.0%, which includes 0 families.
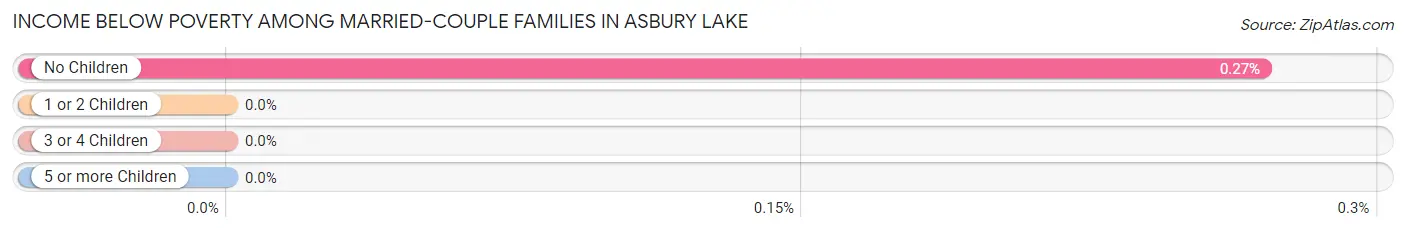
| Children | Above Poverty | Below Poverty |
| No Children | 1,473 (99.7%) | 4 (0.3%) |
| 1 or 2 Children | 1,310 (100.0%) | 0 (0.0%) |
| 3 or 4 Children | 228 (100.0%) | 0 (0.0%) |
| 5 or more Children | 58 (100.0%) | 0 (0.0%) |
| Total | 3,069 (99.9%) | 4 (0.1%) |
Income Below Poverty Among Single-Parent Households in Asbury Lake
| Children | Single Father | Single Mother |
| No Children | 0 (0.0%) | 0 (0.0%) |
| 1 or 2 Children | 0 (0.0%) | 0 (0.0%) |
| 3 or 4 Children | 0 (0.0%) | 0 (0.0%) |
| 5 or more Children | 0 (0.0%) | 0 (0.0%) |
| Total | 0 (0.0%) | 0 (0.0%) |
Income Below Poverty Among Married-Couple vs Single-Parent Households in Asbury Lake
| Children | Married-Couple Families | Single-Parent Households |
| No Children | 4 (0.3%) | 0 (0.0%) |
| 1 or 2 Children | 0 (0.0%) | 0 (0.0%) |
| 3 or 4 Children | 0 (0.0%) | 0 (0.0%) |
| 5 or more Children | 0 (0.0%) | 0 (0.0%) |
| Total | 4 (0.1%) | 0 (0.0%) |
Race in Asbury Lake
The most populous races in Asbury Lake are White / Caucasian (10,924 | 87.3%), Black / African American (696 | 5.6%), and Hispanic or Latino (591 | 4.7%).
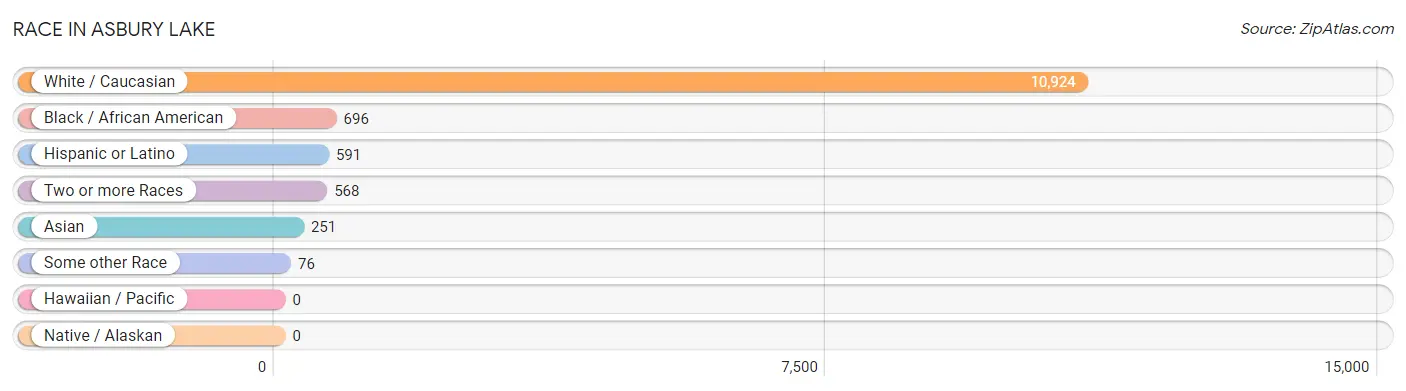
| Race | # Population | % Population |
| Asian | 251 | 2.0% |
| Black / African American | 696 | 5.6% |
| Hawaiian / Pacific | 0 | 0.0% |
| Hispanic or Latino | 591 | 4.7% |
| Native / Alaskan | 0 | 0.0% |
| White / Caucasian | 10,924 | 87.3% |
| Two or more Races | 568 | 4.5% |
| Some other Race | 76 | 0.6% |
| Total | 12,515 | 100.0% |
Ancestry in Asbury Lake
The most populous ancestries reported in Asbury Lake are English (2,449 | 19.6%), German (1,941 | 15.5%), Irish (1,516 | 12.1%), Scottish (727 | 5.8%), and Puerto Rican (463 | 3.7%), together accounting for 56.7% of all Asbury Lake residents.
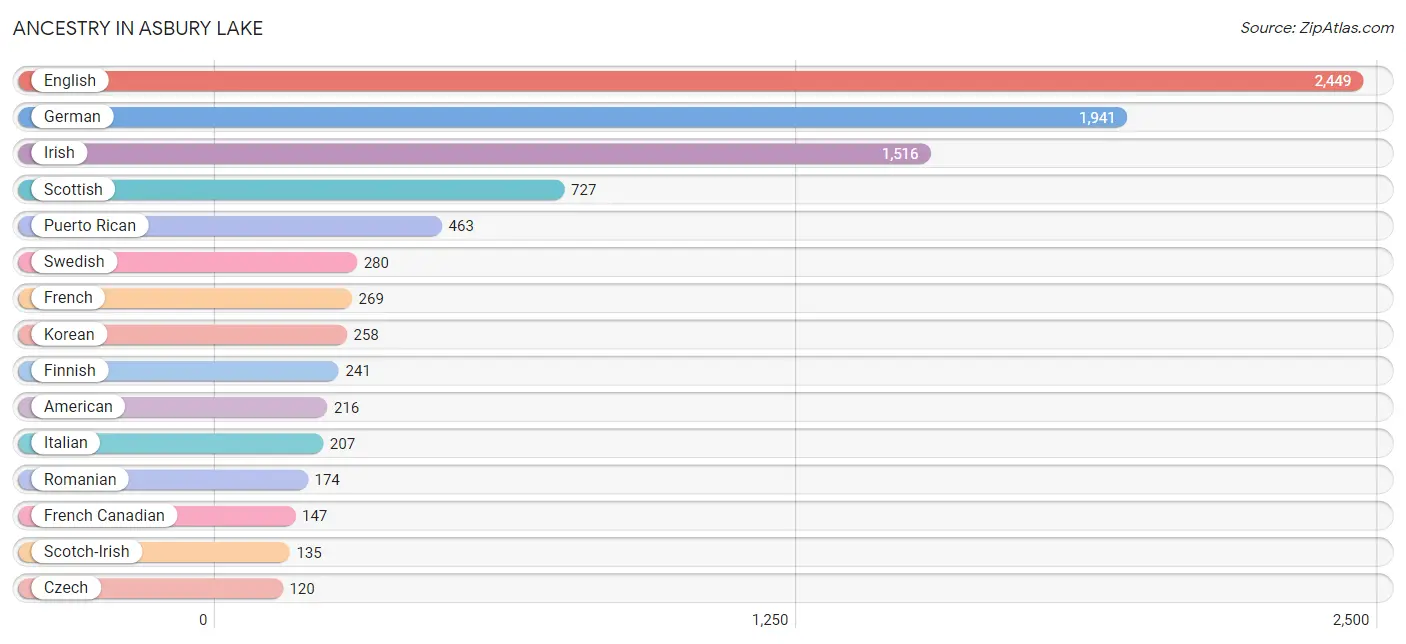
| Ancestry | # Population | % Population |
| American | 216 | 1.7% |
| Arab | 11 | 0.1% |
| Bhutanese | 64 | 0.5% |
| British | 70 | 0.6% |
| Central American | 60 | 0.5% |
| Croatian | 12 | 0.1% |
| Cuban | 14 | 0.1% |
| Czech | 120 | 1.0% |
| Danish | 17 | 0.1% |
| Dominican | 1 | 0.0% |
| Dutch | 69 | 0.5% |
| English | 2,449 | 19.6% |
| Estonian | 95 | 0.8% |
| European | 114 | 0.9% |
| Finnish | 241 | 1.9% |
| French | 269 | 2.1% |
| French Canadian | 147 | 1.2% |
| German | 1,941 | 15.5% |
| Haitian | 33 | 0.3% |
| Hungarian | 21 | 0.2% |
| Indian (Asian) | 26 | 0.2% |
| Irish | 1,516 | 12.1% |
| Italian | 207 | 1.7% |
| Korean | 258 | 2.1% |
| Lebanese | 11 | 0.1% |
| Mexican | 53 | 0.4% |
| Norwegian | 29 | 0.2% |
| Polish | 82 | 0.7% |
| Portuguese | 38 | 0.3% |
| Puerto Rican | 463 | 3.7% |
| Romanian | 174 | 1.4% |
| Salvadoran | 60 | 0.5% |
| Scotch-Irish | 135 | 1.1% |
| Scottish | 727 | 5.8% |
| Swedish | 280 | 2.2% |
| Welsh | 32 | 0.3% | View All 36 Rows |
Immigrants in Asbury Lake
The most numerous immigrant groups reported in Asbury Lake came from Asia (251 | 2.0%), Philippines (199 | 1.6%), South Eastern Asia (199 | 1.6%), Europe (122 | 1.0%), and Italy (69 | 0.5%), together accounting for 6.7% of all Asbury Lake residents.
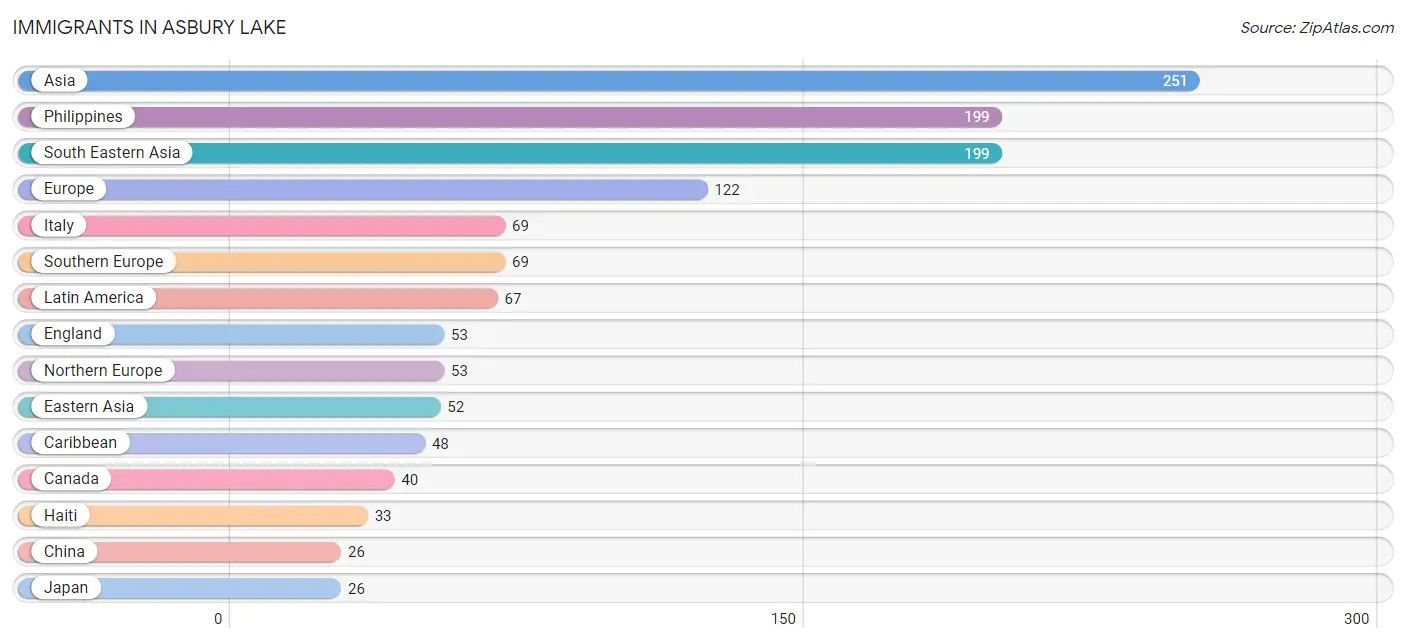
| Immigration Origin | # Population | % Population |
| Asia | 251 | 2.0% |
| Canada | 40 | 0.3% |
| Caribbean | 48 | 0.4% |
| Central America | 19 | 0.2% |
| China | 26 | 0.2% |
| Cuba | 14 | 0.1% |
| Dominican Republic | 1 | 0.0% |
| Eastern Asia | 52 | 0.4% |
| El Salvador | 18 | 0.1% |
| England | 53 | 0.4% |
| Europe | 122 | 1.0% |
| Haiti | 33 | 0.3% |
| Italy | 69 | 0.5% |
| Japan | 26 | 0.2% |
| Latin America | 67 | 0.5% |
| Mexico | 1 | 0.0% |
| Northern Europe | 53 | 0.4% |
| Philippines | 199 | 1.6% |
| South Eastern Asia | 199 | 1.6% |
| Southern Europe | 69 | 0.5% | View All 20 Rows |
Sex and Age in Asbury Lake
Sex and Age in Asbury Lake
The most populous age groups in Asbury Lake are 35 to 39 Years (786 | 12.1%) for men and 55 to 59 Years (692 | 11.5%) for women.
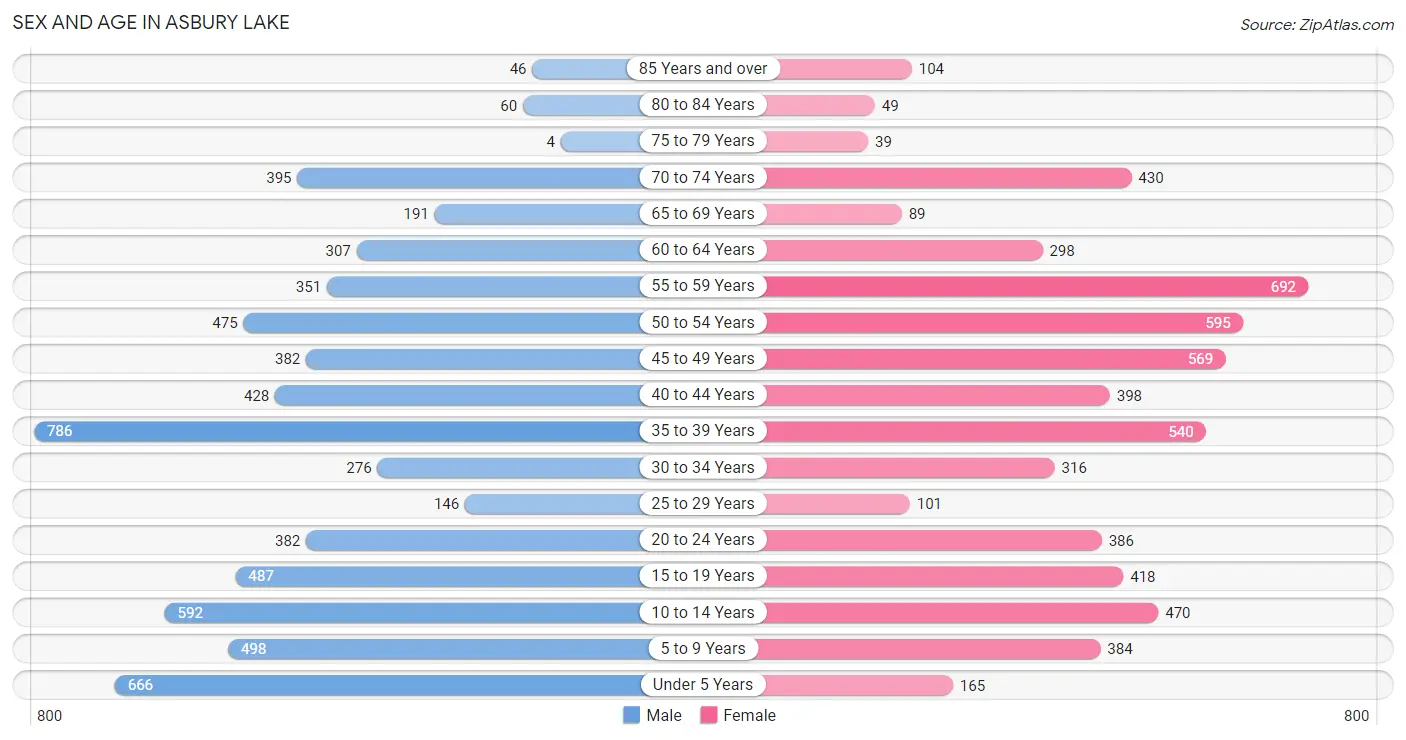
| Age Bracket | Male | Female |
| Under 5 Years | 666 (10.3%) | 165 (2.7%) |
| 5 to 9 Years | 498 (7.7%) | 384 (6.4%) |
| 10 to 14 Years | 592 (9.1%) | 470 (7.8%) |
| 15 to 19 Years | 487 (7.5%) | 418 (6.9%) |
| 20 to 24 Years | 382 (5.9%) | 386 (6.4%) |
| 25 to 29 Years | 146 (2.3%) | 101 (1.7%) |
| 30 to 34 Years | 276 (4.3%) | 316 (5.2%) |
| 35 to 39 Years | 786 (12.1%) | 540 (8.9%) |
| 40 to 44 Years | 428 (6.6%) | 398 (6.6%) |
| 45 to 49 Years | 382 (5.9%) | 569 (9.4%) |
| 50 to 54 Years | 475 (7.3%) | 595 (9.9%) |
| 55 to 59 Years | 351 (5.4%) | 692 (11.5%) |
| 60 to 64 Years | 307 (4.7%) | 298 (4.9%) |
| 65 to 69 Years | 191 (2.9%) | 89 (1.5%) |
| 70 to 74 Years | 395 (6.1%) | 430 (7.1%) |
| 75 to 79 Years | 4 (0.1%) | 39 (0.6%) |
| 80 to 84 Years | 60 (0.9%) | 49 (0.8%) |
| 85 Years and over | 46 (0.7%) | 104 (1.7%) |
| Total | 6,472 (100.0%) | 6,043 (100.0%) |
Families and Households in Asbury Lake
Median Family Size in Asbury Lake
The median family size in Asbury Lake is 3.14 persons per family, with married-couple families (3,073 | 87.9%) accounting for the largest median family size of 3.2 persons per family. On the other hand, single female/mother families (190 | 5.4%) represent the smallest median family size with 2.62 persons per family.
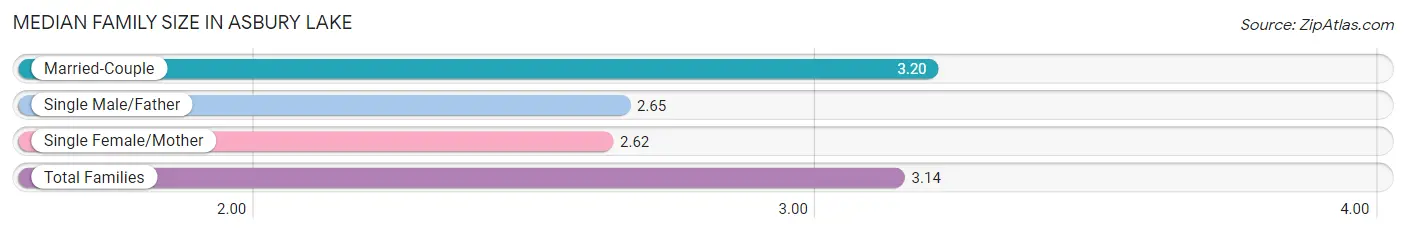
| Family Type | # Families | Family Size |
| Married-Couple | 3,073 (87.9%) | 3.20 |
| Single Male/Father | 231 (6.6%) | 2.65 |
| Single Female/Mother | 190 (5.4%) | 2.62 |
| Total Families | 3,494 (100.0%) | 3.14 |
Median Household Size in Asbury Lake
The median household size in Asbury Lake is 2.76 persons per household, with married-couple households (3,073 | 67.8%) accounting for the largest median household size of 3.2 persons per household. non-family households (1,035 | 22.9%) represent the smallest median household size with 1.36 persons per household.
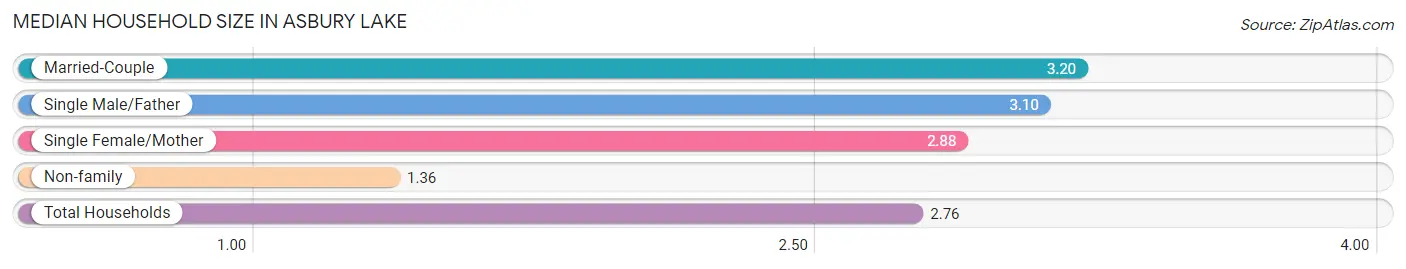
| Household Type | # Households | Household Size |
| Married-Couple | 3,073 (67.8%) | 3.20 |
| Single Male/Father | 231 (5.1%) | 3.10 |
| Single Female/Mother | 190 (4.2%) | 2.88 |
| Non-family | 1,035 (22.9%) | 1.36 |
| Total Households | 4,529 (100.0%) | 2.76 |
Household Size by Marriage Status in Asbury Lake
Out of a total of 4,529 households in Asbury Lake, 3,494 (77.1%) are family households, while 1,035 (22.9%) are nonfamily households. The most numerous type of family households are 2-person households, comprising 1,449, and the most common type of nonfamily households are 1-person households, comprising 894.
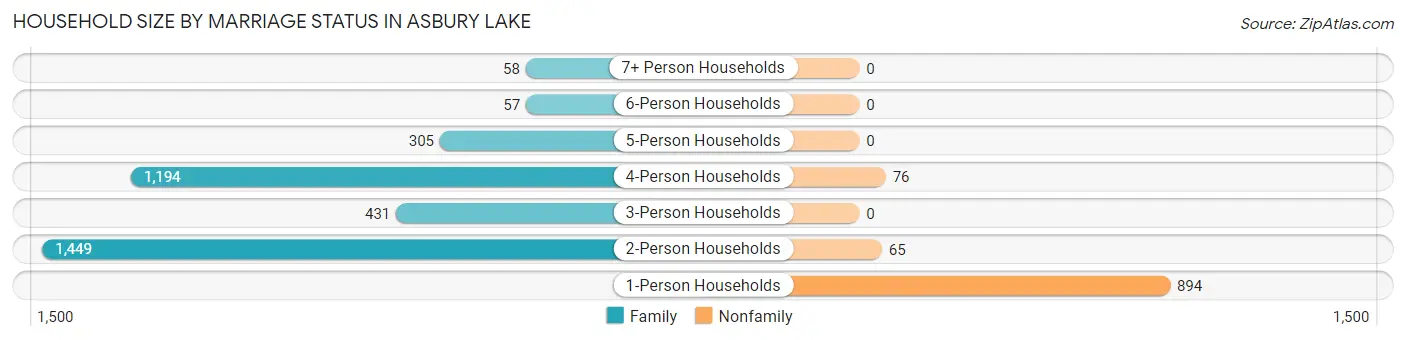
| Household Size | Family Households | Nonfamily Households |
| 1-Person Households | - | 894 (19.7%) |
| 2-Person Households | 1,449 (32.0%) | 65 (1.4%) |
| 3-Person Households | 431 (9.5%) | 0 (0.0%) |
| 4-Person Households | 1,194 (26.4%) | 76 (1.7%) |
| 5-Person Households | 305 (6.7%) | 0 (0.0%) |
| 6-Person Households | 57 (1.3%) | 0 (0.0%) |
| 7+ Person Households | 58 (1.3%) | 0 (0.0%) |
| Total | 3,494 (77.1%) | 1,035 (22.9%) |
Female Fertility in Asbury Lake
Fertility by Age in Asbury Lake
Average fertility rate in Asbury Lake is 43.0 births per 1,000 women. Women in the age bracket of 35 to 50 years have the highest fertility rate with 51.0 births per 1,000 women. Women in the age bracket of 35 to 50 years acount for 68.3% of all women with births.
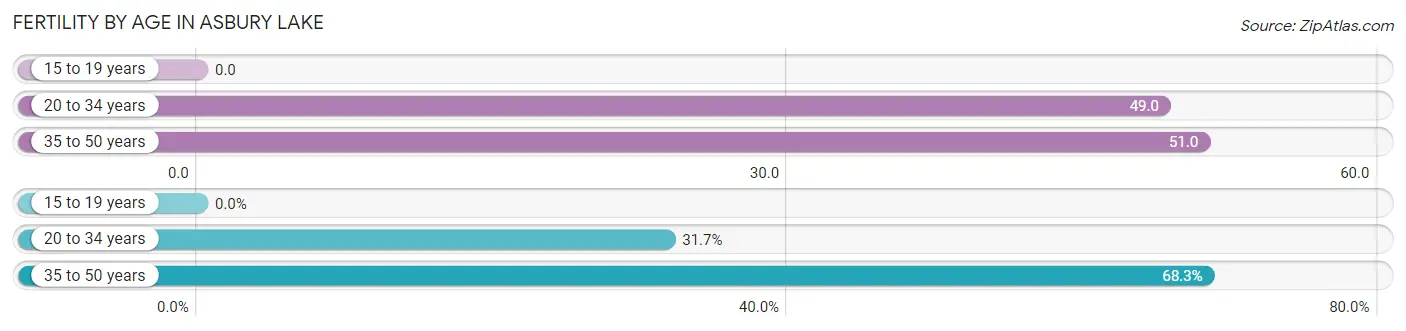
| Age Bracket | Women with Births | Births / 1,000 Women |
| 15 to 19 years | 0 (0.0%) | 0.0 |
| 20 to 34 years | 39 (31.7%) | 49.0 |
| 35 to 50 years | 84 (68.3%) | 51.0 |
| Total | 123 (100.0%) | 43.0 |
Fertility by Age by Marriage Status in Asbury Lake
81.3% of women with births (123) in Asbury Lake are married. The highest percentage of unmarried women with births falls into 35 to 50 years age bracket with 27.4% of them unmarried at the time of birth, while the lowest percentage of unmarried women with births belong to 20 to 34 years age bracket with 0.0% of them unmarried.
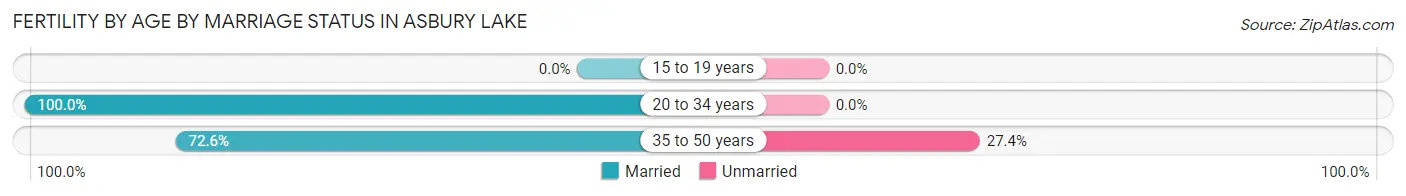
| Age Bracket | Married | Unmarried |
| 15 to 19 years | 0 (0.0%) | 0 (0.0%) |
| 20 to 34 years | 39 (100.0%) | 0 (0.0%) |
| 35 to 50 years | 61 (72.6%) | 23 (27.4%) |
| Total | 100 (81.3%) | 23 (18.7%) |
Fertility by Education in Asbury Lake
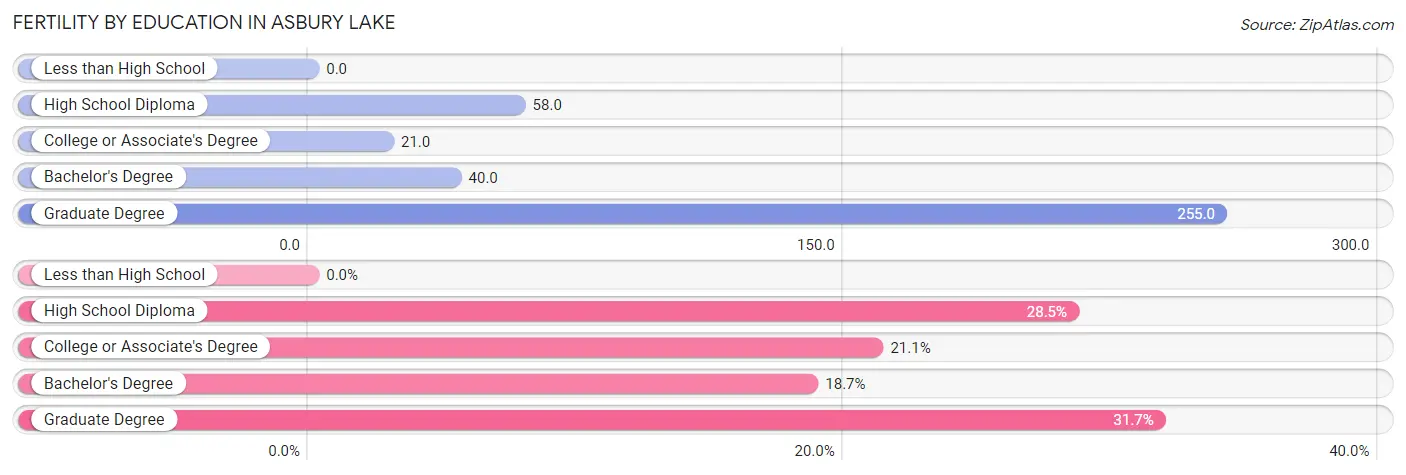
| Educational Attainment | Women with Births | Births / 1,000 Women |
| Less than High School | 0 (0.0%) | 0.0 |
| High School Diploma | 35 (28.5%) | 58.0 |
| College or Associate's Degree | 26 (21.1%) | 21.0 |
| Bachelor's Degree | 23 (18.7%) | 40.0 |
| Graduate Degree | 39 (31.7%) | 255.0 |
| Total | 123 (100.0%) | 43.0 |
Fertility by Education by Marriage Status in Asbury Lake
18.7% of women with births in Asbury Lake are unmarried. Women with the educational attainment of high school diploma are most likely to be married with 100.0% of them married at childbirth, while women with the educational attainment of bachelor's degree are least likely to be married with 100.0% of them unmarried at childbirth.
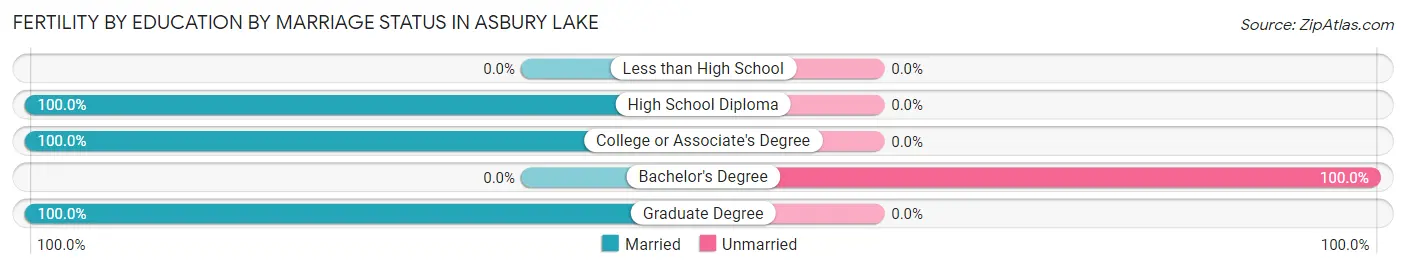
| Educational Attainment | Married | Unmarried |
| Less than High School | 0 (0.0%) | 0 (0.0%) |
| High School Diploma | 35 (100.0%) | 0 (0.0%) |
| College or Associate's Degree | 26 (100.0%) | 0 (0.0%) |
| Bachelor's Degree | 0 (0.0%) | 23 (100.0%) |
| Graduate Degree | 39 (100.0%) | 0 (0.0%) |
| Total | 100 (81.3%) | 23 (18.7%) |
Employment Characteristics in Asbury Lake
Employment by Class of Employer in Asbury Lake
Among the 6,101 employed individuals in Asbury Lake, private company employees (3,850 | 63.1%), not-for-profit organizations (1,288 | 21.1%), and local government employees (434 | 7.1%) make up the most common classes of employment.
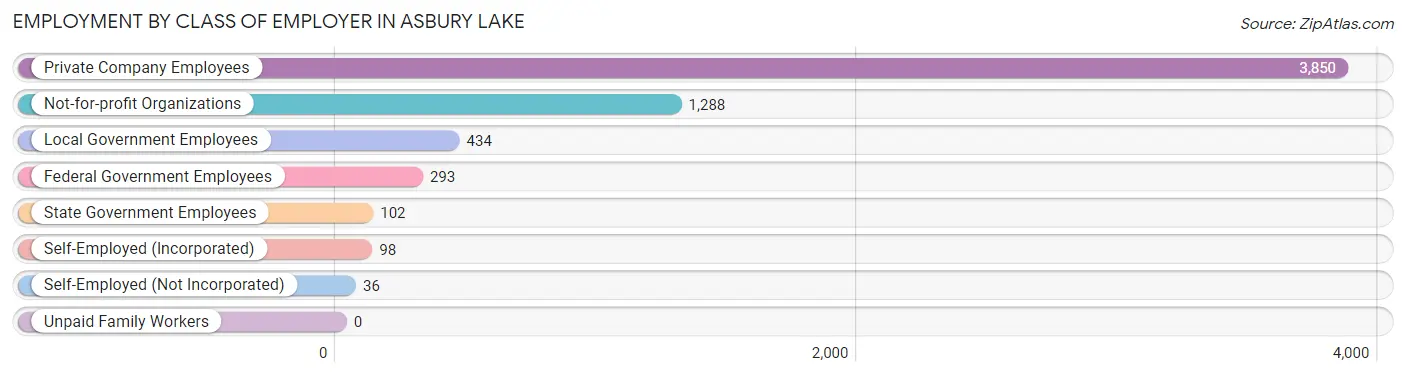
| Employer Class | # Employees | % Employees |
| Private Company Employees | 3,850 | 63.1% |
| Self-Employed (Incorporated) | 98 | 1.6% |
| Self-Employed (Not Incorporated) | 36 | 0.6% |
| Not-for-profit Organizations | 1,288 | 21.1% |
| Local Government Employees | 434 | 7.1% |
| State Government Employees | 102 | 1.7% |
| Federal Government Employees | 293 | 4.8% |
| Unpaid Family Workers | 0 | 0.0% |
| Total | 6,101 | 100.0% |
Employment Status by Age in Asbury Lake
According to the labor force statistics for Asbury Lake, out of the total population over 16 years of age (9,548), 66.6% or 6,359 individuals are in the labor force, with 1.3% or 83 of them unemployed. The age group with the highest labor force participation rate is 35 to 44 years, with 94.7% or 2,038 individuals in the labor force. Within the labor force, the 65 to 74 years age range has the highest percentage of unemployed individuals, with 17.4% or 33 of them being unemployed.
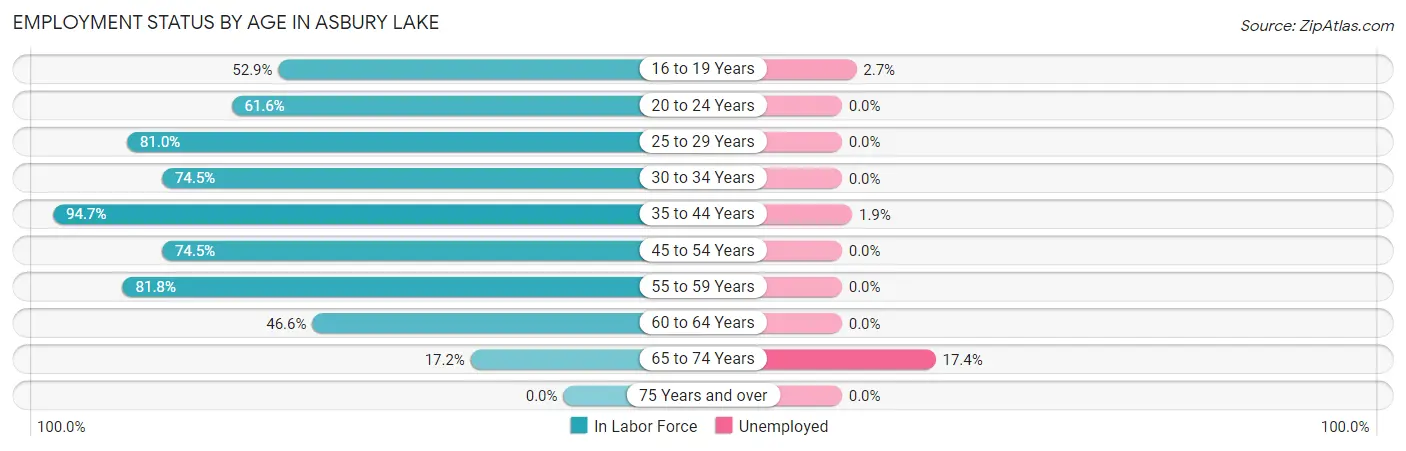
| Age Bracket | In Labor Force | Unemployed |
| 16 to 19 Years | 377 (52.9%) | 10 (2.7%) |
| 20 to 24 Years | 473 (61.6%) | 0 (0.0%) |
| 25 to 29 Years | 200 (81.0%) | 0 (0.0%) |
| 30 to 34 Years | 441 (74.5%) | 0 (0.0%) |
| 35 to 44 Years | 2,038 (94.7%) | 39 (1.9%) |
| 45 to 54 Years | 1,506 (74.5%) | 0 (0.0%) |
| 55 to 59 Years | 853 (81.8%) | 0 (0.0%) |
| 60 to 64 Years | 282 (46.6%) | 0 (0.0%) |
| 65 to 74 Years | 190 (17.2%) | 33 (17.4%) |
| 75 Years and over | 0 (0.0%) | 0 (0.0%) |
| Total | 6,359 (66.6%) | 83 (1.3%) |
Employment Status by Educational Attainment in Asbury Lake
According to labor force statistics for Asbury Lake, 79.9% of individuals (5,321) out of the total population between 25 and 64 years of age (6,660) are in the labor force, with 0.7% or 37 of them being unemployed. The group with the highest labor force participation rate are those with the educational attainment of bachelor's degree or higher, with 88.0% or 2,256 individuals in the labor force. Within the labor force, individuals with college / associate degree education have the highest percentage of unemployment, with 2.3% or 41 of them being unemployed.
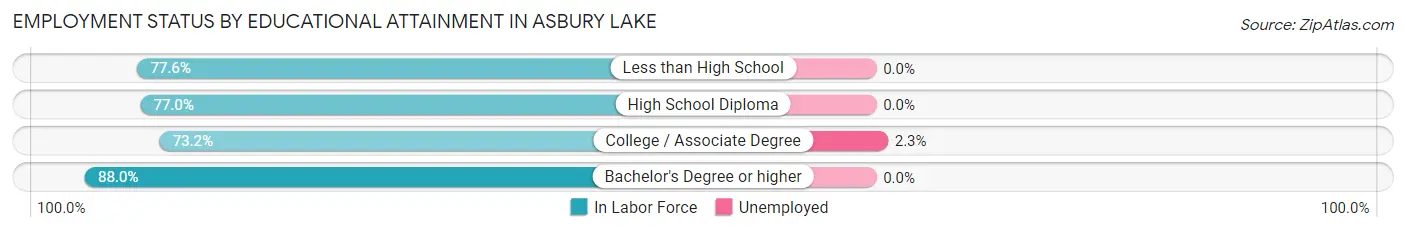
| Educational Attainment | In Labor Force | Unemployed |
| Less than High School | 173 (77.6%) | 0 (0.0%) |
| High School Diploma | 1,105 (77.0%) | 0 (0.0%) |
| College / Associate Degree | 1,785 (73.2%) | 56 (2.3%) |
| Bachelor's Degree or higher | 2,256 (88.0%) | 0 (0.0%) |
| Total | 5,321 (79.9%) | 47 (0.7%) |
Employment Occupations by Sex in Asbury Lake
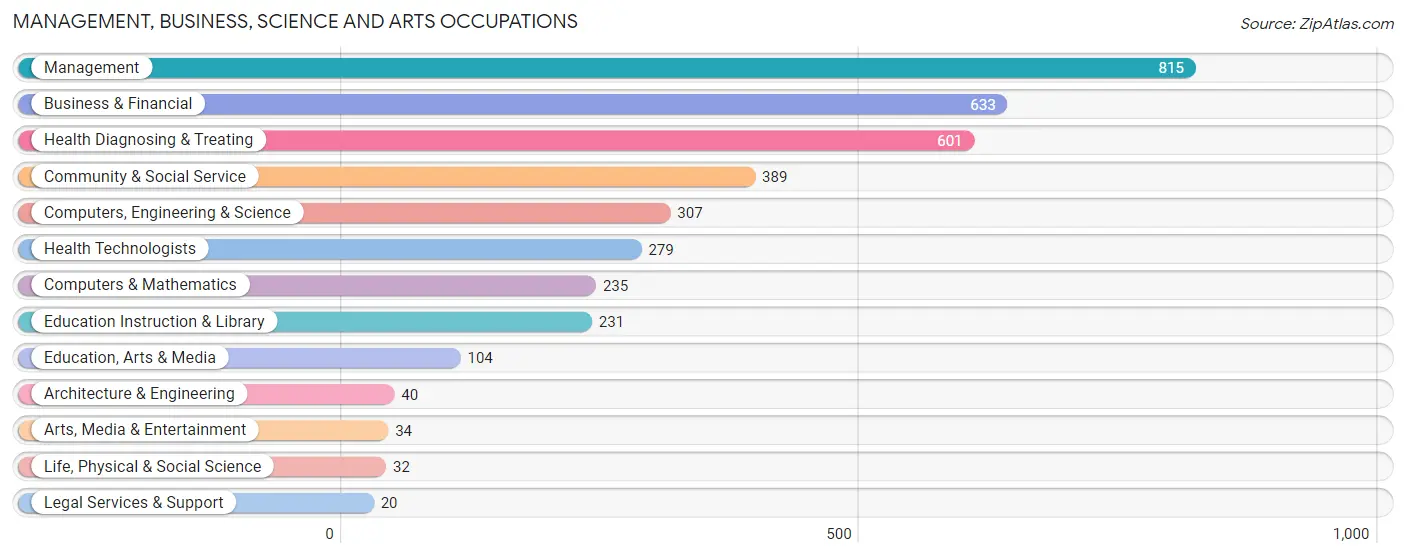
Management, Business, Science and Arts Occupations
The most common Management, Business, Science and Arts occupations in Asbury Lake are Management (815 | 13.2%), Business & Financial (633 | 10.3%), Health Diagnosing & Treating (601 | 9.8%), Community & Social Service (389 | 6.3%), and Computers, Engineering & Science (307 | 5.0%).
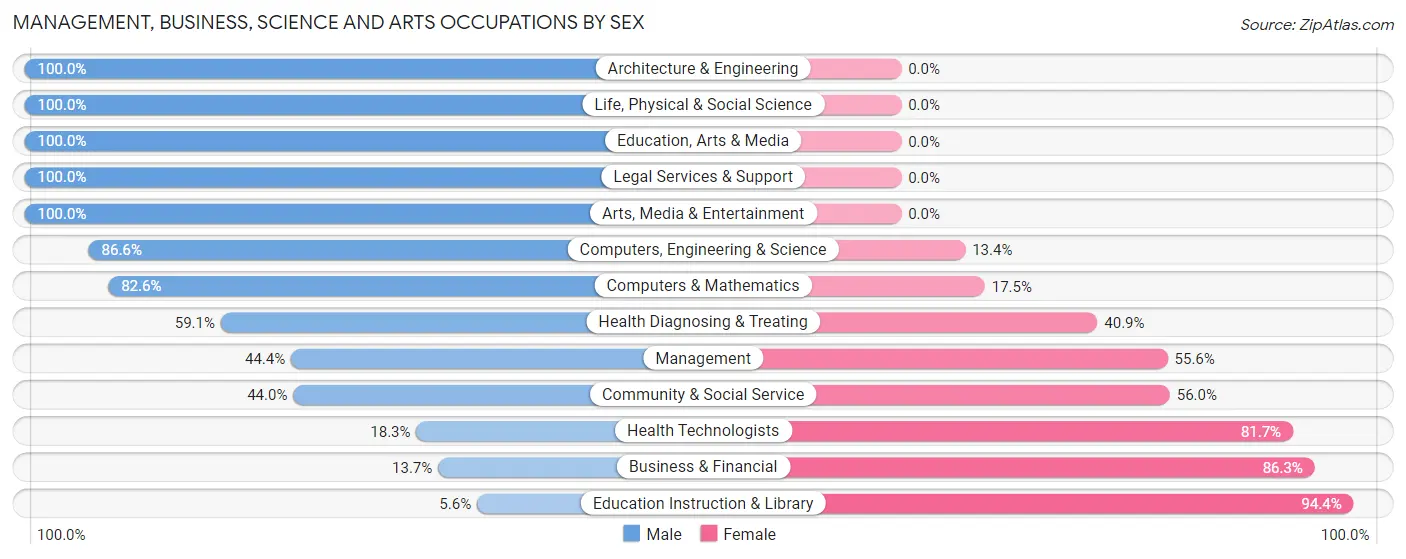
Management, Business, Science and Arts Occupations by Sex
Within the Management, Business, Science and Arts occupations in Asbury Lake, the most male-oriented occupations are Architecture & Engineering (100.0%), Life, Physical & Social Science (100.0%), and Education, Arts & Media (100.0%), while the most female-oriented occupations are Education Instruction & Library (94.4%), Business & Financial (86.3%), and Health Technologists (81.7%).
| Occupation | Male | Female |
| Management | 362 (44.4%) | 453 (55.6%) |
| Business & Financial | 87 (13.7%) | 546 (86.3%) |
| Computers, Engineering & Science | 266 (86.6%) | 41 (13.4%) |
| Computers & Mathematics | 194 (82.6%) | 41 (17.4%) |
| Architecture & Engineering | 40 (100.0%) | 0 (0.0%) |
| Life, Physical & Social Science | 32 (100.0%) | 0 (0.0%) |
| Community & Social Service | 171 (44.0%) | 218 (56.0%) |
| Education, Arts & Media | 104 (100.0%) | 0 (0.0%) |
| Legal Services & Support | 20 (100.0%) | 0 (0.0%) |
| Education Instruction & Library | 13 (5.6%) | 218 (94.4%) |
| Arts, Media & Entertainment | 34 (100.0%) | 0 (0.0%) |
| Health Diagnosing & Treating | 355 (59.1%) | 246 (40.9%) |
| Health Technologists | 51 (18.3%) | 228 (81.7%) |
| Total (Category) | 1,241 (45.2%) | 1,504 (54.8%) |
| Total (Overall) | 2,933 (47.6%) | 3,227 (52.4%) |
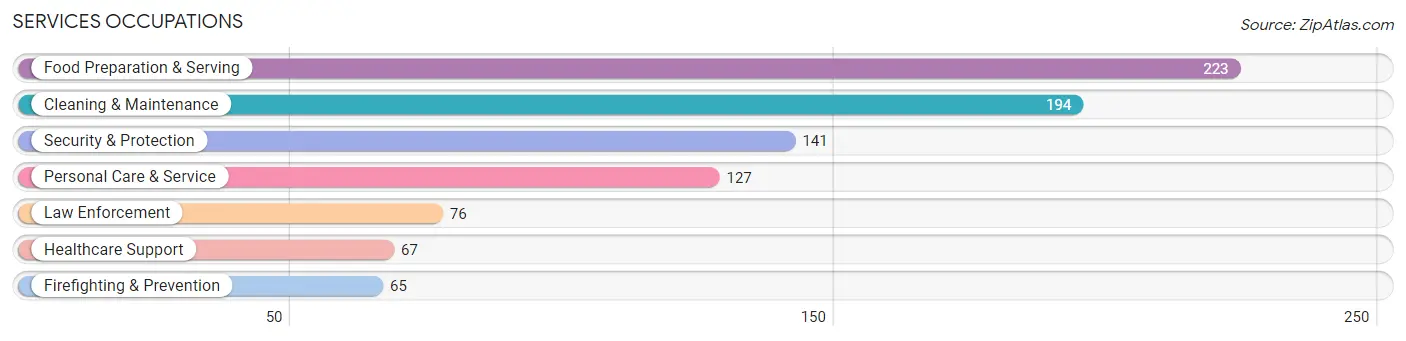
Services Occupations
The most common Services occupations in Asbury Lake are Food Preparation & Serving (223 | 3.6%), Cleaning & Maintenance (194 | 3.2%), Security & Protection (141 | 2.3%), Personal Care & Service (127 | 2.1%), and Law Enforcement (76 | 1.2%).
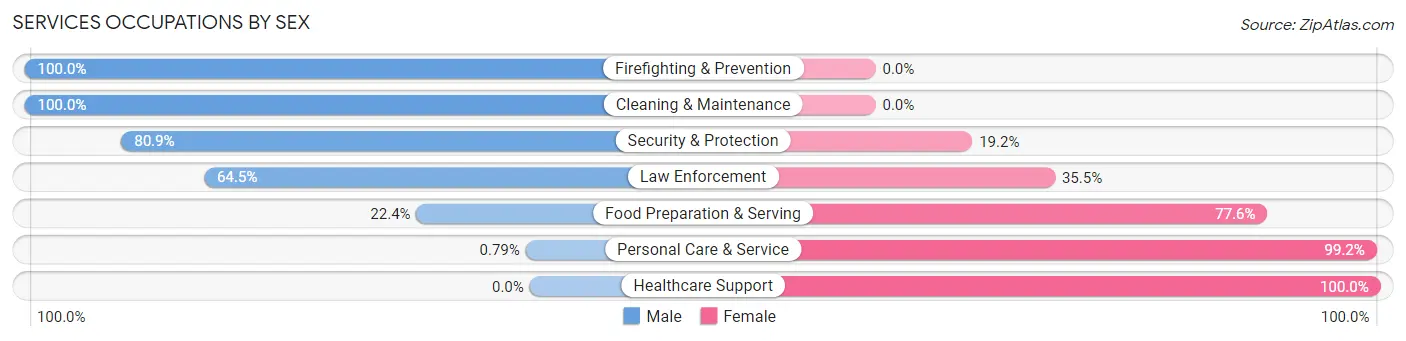
Services Occupations by Sex
Within the Services occupations in Asbury Lake, the most male-oriented occupations are Firefighting & Prevention (100.0%), Cleaning & Maintenance (100.0%), and Security & Protection (80.8%), while the most female-oriented occupations are Healthcare Support (100.0%), Personal Care & Service (99.2%), and Food Preparation & Serving (77.6%).
| Occupation | Male | Female |
| Healthcare Support | 0 (0.0%) | 67 (100.0%) |
| Security & Protection | 114 (80.8%) | 27 (19.2%) |
| Firefighting & Prevention | 65 (100.0%) | 0 (0.0%) |
| Law Enforcement | 49 (64.5%) | 27 (35.5%) |
| Food Preparation & Serving | 50 (22.4%) | 173 (77.6%) |
| Cleaning & Maintenance | 194 (100.0%) | 0 (0.0%) |
| Personal Care & Service | 1 (0.8%) | 126 (99.2%) |
| Total (Category) | 359 (47.7%) | 393 (52.3%) |
| Total (Overall) | 2,933 (47.6%) | 3,227 (52.4%) |
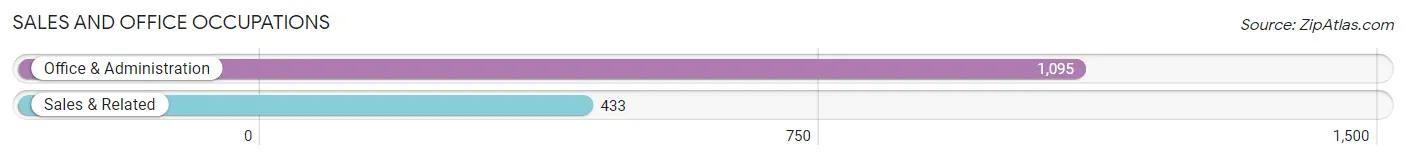
Sales and Office Occupations
The most common Sales and Office occupations in Asbury Lake are Office & Administration (1,095 | 17.8%), and Sales & Related (433 | 7.0%).
Sales and Office Occupations by Sex
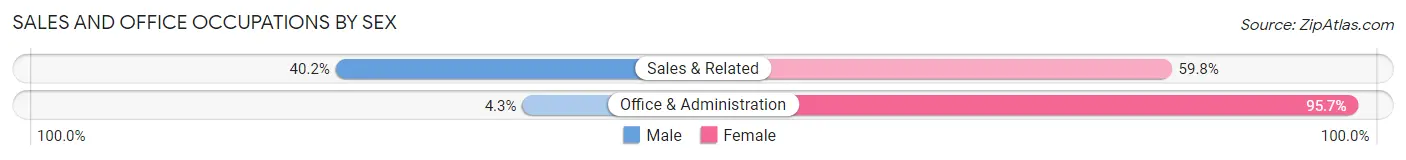
| Occupation | Male | Female |
| Sales & Related | 174 (40.2%) | 259 (59.8%) |
| Office & Administration | 47 (4.3%) | 1,048 (95.7%) |
| Total (Category) | 221 (14.5%) | 1,307 (85.5%) |
| Total (Overall) | 2,933 (47.6%) | 3,227 (52.4%) |
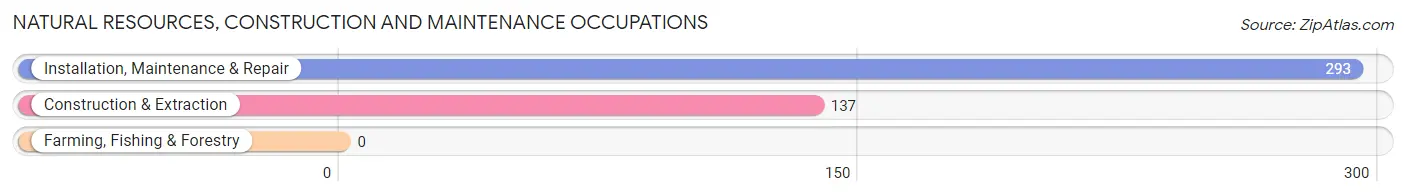
Natural Resources, Construction and Maintenance Occupations
The most common Natural Resources, Construction and Maintenance occupations in Asbury Lake are Installation, Maintenance & Repair (293 | 4.8%), and Construction & Extraction (137 | 2.2%).
Natural Resources, Construction and Maintenance Occupations by Sex
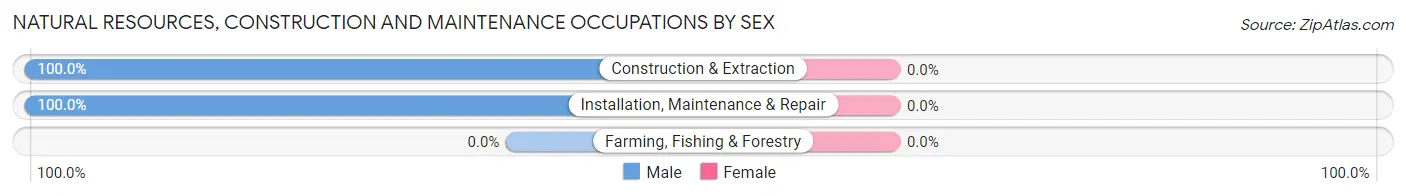
| Occupation | Male | Female |
| Farming, Fishing & Forestry | 0 (0.0%) | 0 (0.0%) |
| Construction & Extraction | 137 (100.0%) | 0 (0.0%) |
| Installation, Maintenance & Repair | 293 (100.0%) | 0 (0.0%) |
| Total (Category) | 430 (100.0%) | 0 (0.0%) |
| Total (Overall) | 2,933 (47.6%) | 3,227 (52.4%) |
Production, Transportation and Moving Occupations
The most common Production, Transportation and Moving occupations in Asbury Lake are Transportation (354 | 5.8%), Material Moving (187 | 3.0%), and Production (164 | 2.7%).
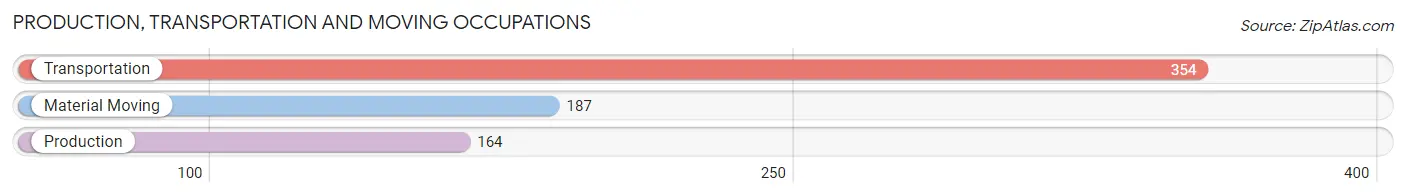
Production, Transportation and Moving Occupations by Sex
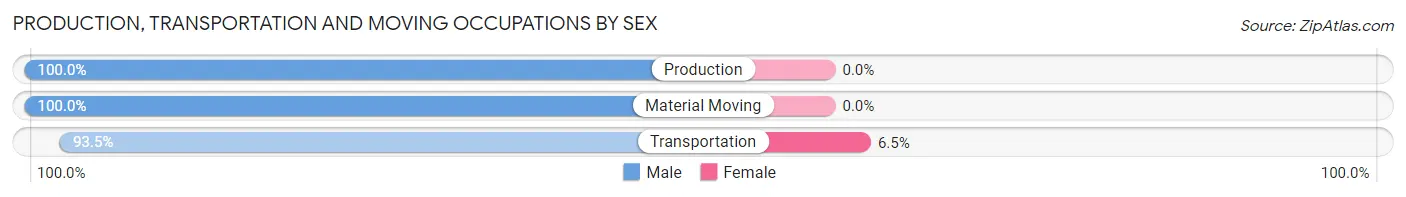
| Occupation | Male | Female |
| Production | 164 (100.0%) | 0 (0.0%) |
| Transportation | 331 (93.5%) | 23 (6.5%) |
| Material Moving | 187 (100.0%) | 0 (0.0%) |
| Total (Category) | 682 (96.7%) | 23 (3.3%) |
| Total (Overall) | 2,933 (47.6%) | 3,227 (52.4%) |
Employment Industries by Sex in Asbury Lake
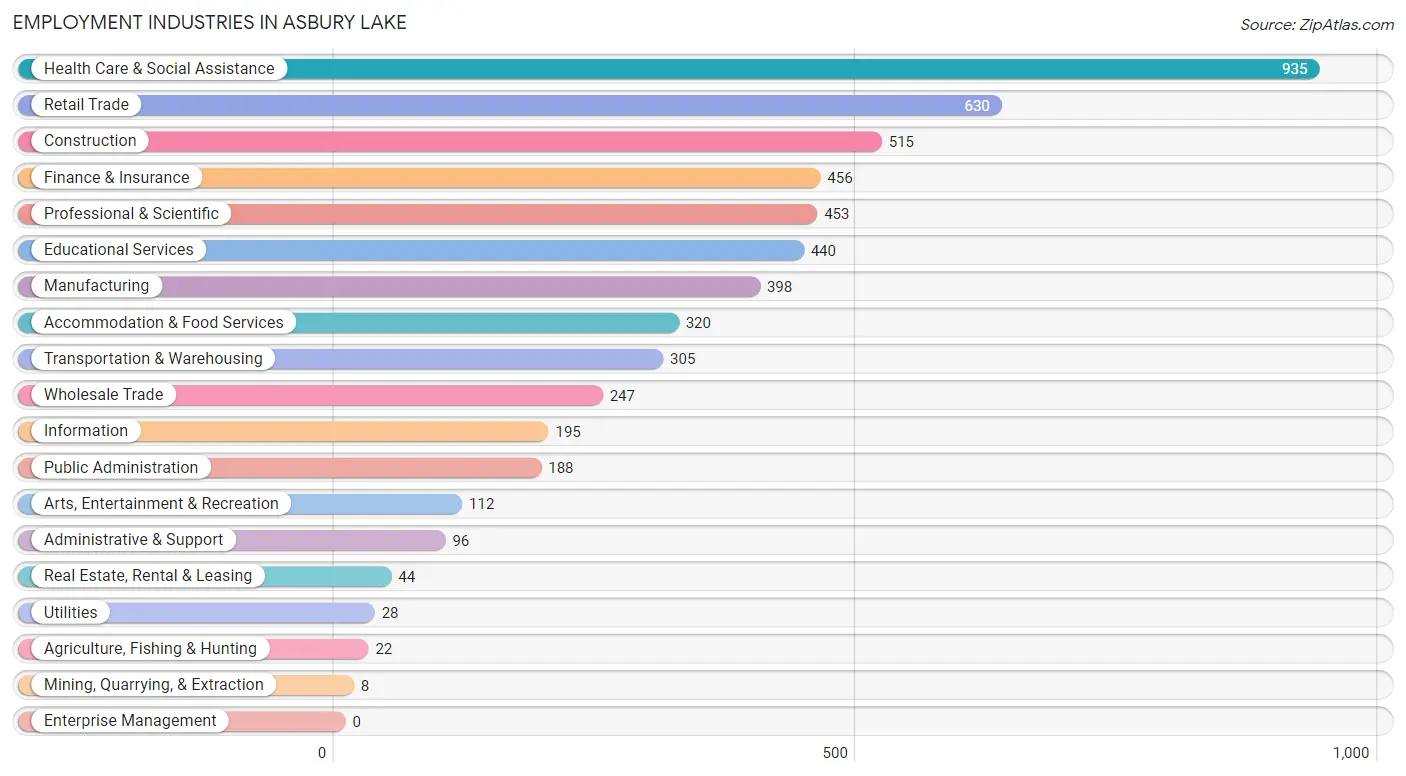
Employment Industries in Asbury Lake
The major employment industries in Asbury Lake include Health Care & Social Assistance (935 | 15.2%), Retail Trade (630 | 10.2%), Construction (515 | 8.4%), Finance & Insurance (456 | 7.4%), and Professional & Scientific (453 | 7.3%).
Employment Industries by Sex in Asbury Lake
The Asbury Lake industries that see more men than women are Agriculture, Fishing & Hunting (100.0%), Mining, Quarrying, & Extraction (100.0%), and Utilities (100.0%), whereas the industries that tend to have a higher number of women are Arts, Entertainment & Recreation (100.0%), Finance & Insurance (82.9%), and Educational Services (81.4%).
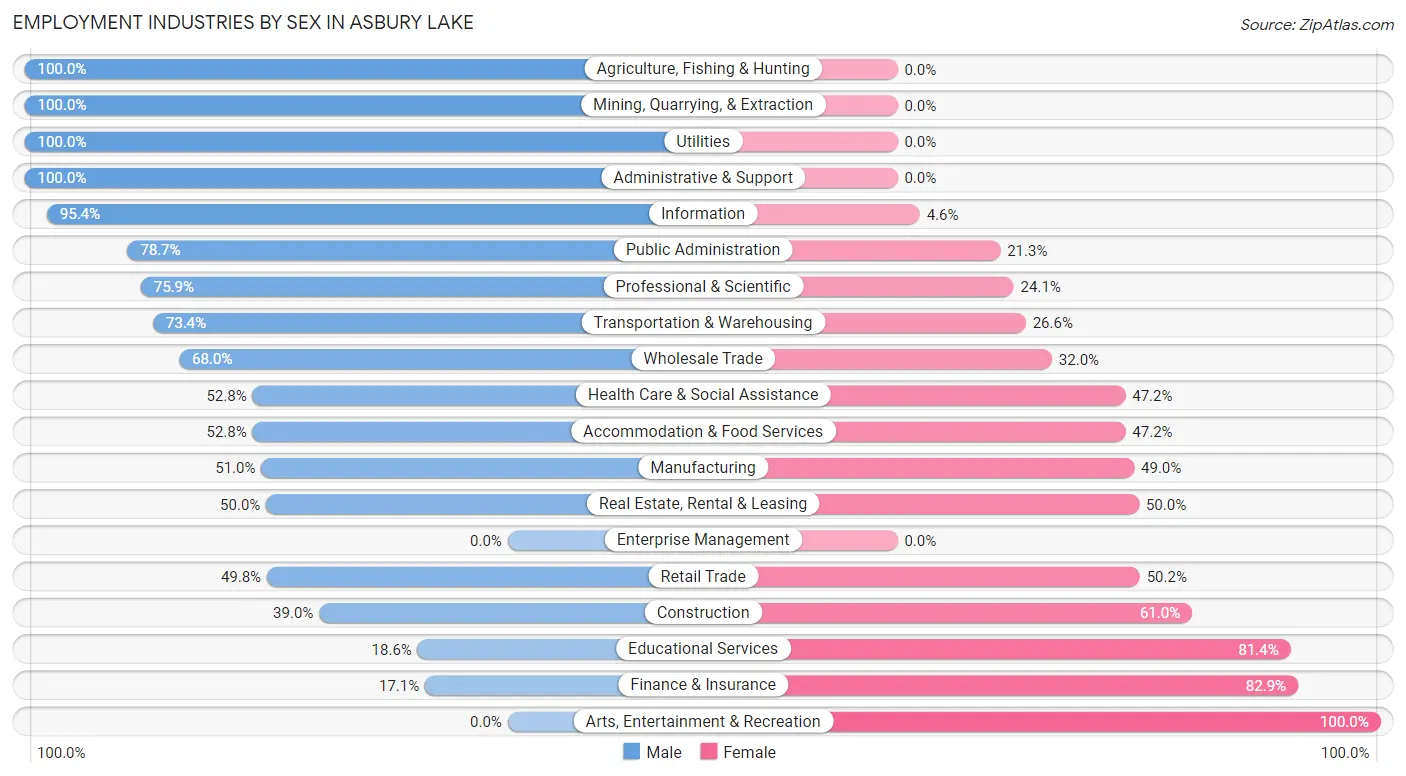
| Industry | Male | Female |
| Agriculture, Fishing & Hunting | 22 (100.0%) | 0 (0.0%) |
| Mining, Quarrying, & Extraction | 8 (100.0%) | 0 (0.0%) |
| Construction | 201 (39.0%) | 314 (61.0%) |
| Manufacturing | 203 (51.0%) | 195 (49.0%) |
| Wholesale Trade | 168 (68.0%) | 79 (32.0%) |
| Retail Trade | 314 (49.8%) | 316 (50.2%) |
| Transportation & Warehousing | 224 (73.4%) | 81 (26.6%) |
| Utilities | 28 (100.0%) | 0 (0.0%) |
| Information | 186 (95.4%) | 9 (4.6%) |
| Finance & Insurance | 78 (17.1%) | 378 (82.9%) |
| Real Estate, Rental & Leasing | 22 (50.0%) | 22 (50.0%) |
| Professional & Scientific | 344 (75.9%) | 109 (24.1%) |
| Enterprise Management | 0 (0.0%) | 0 (0.0%) |
| Administrative & Support | 96 (100.0%) | 0 (0.0%) |
| Educational Services | 82 (18.6%) | 358 (81.4%) |
| Health Care & Social Assistance | 494 (52.8%) | 441 (47.2%) |
| Arts, Entertainment & Recreation | 0 (0.0%) | 112 (100.0%) |
| Accommodation & Food Services | 169 (52.8%) | 151 (47.2%) |
| Public Administration | 148 (78.7%) | 40 (21.3%) |
| Total | 2,933 (47.6%) | 3,227 (52.4%) |
Education in Asbury Lake
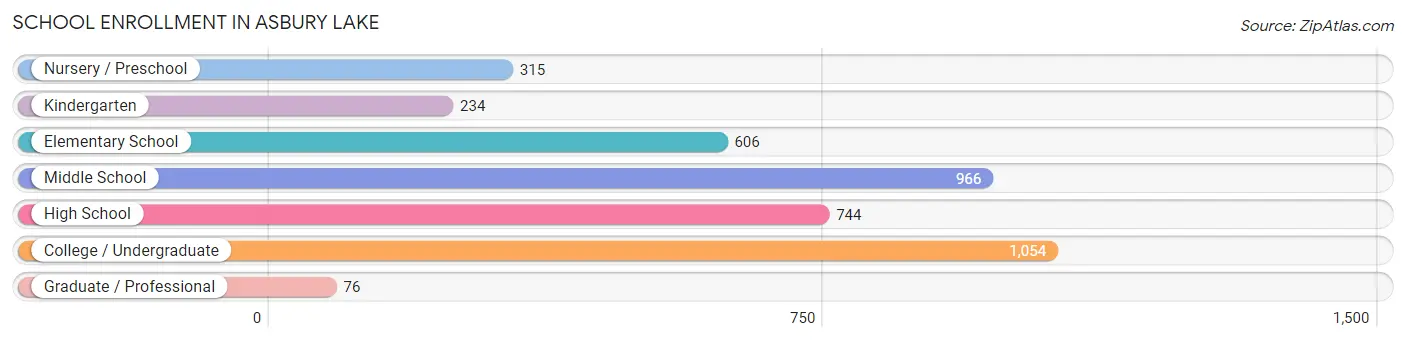
School Enrollment in Asbury Lake
The most common levels of schooling among the 3,995 students in Asbury Lake are college / undergraduate (1,054 | 26.4%), middle school (966 | 24.2%), and high school (744 | 18.6%).
| School Level | # Students | % Students |
| Nursery / Preschool | 315 | 7.9% |
| Kindergarten | 234 | 5.9% |
| Elementary School | 606 | 15.2% |
| Middle School | 966 | 24.2% |
| High School | 744 | 18.6% |
| College / Undergraduate | 1,054 | 26.4% |
| Graduate / Professional | 76 | 1.9% |
| Total | 3,995 | 100.0% |
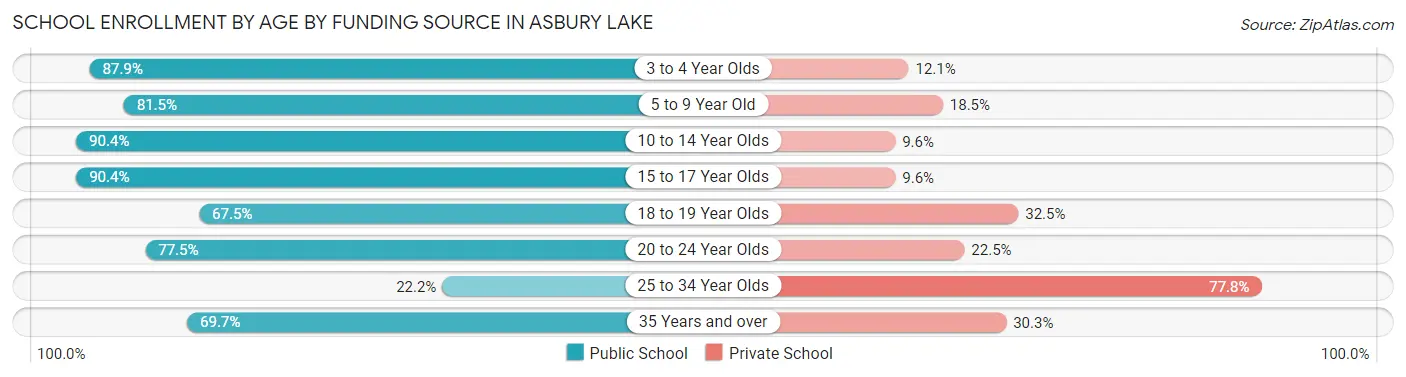
School Enrollment by Age by Funding Source in Asbury Lake
Out of a total of 3,995 students who are enrolled in schools in Asbury Lake, 763 (19.1%) attend a private institution, while the remaining 3,232 (80.9%) are enrolled in public schools. The age group of 25 to 34 year olds has the highest likelihood of being enrolled in private schools, with 91 (77.8% in the age bracket) enrolled. Conversely, the age group of 10 to 14 year olds has the lowest likelihood of being enrolled in a private school, with 960 (90.4% in the age bracket) attending a public institution.
| Age Bracket | Public School | Private School |
| 3 to 4 Year Olds | 240 (87.9%) | 33 (12.1%) |
| 5 to 9 Year Old | 719 (81.5%) | 163 (18.5%) |
| 10 to 14 Year Olds | 960 (90.4%) | 102 (9.6%) |
| 15 to 17 Year Olds | 498 (90.4%) | 53 (9.6%) |
| 18 to 19 Year Olds | 222 (67.5%) | 107 (32.5%) |
| 20 to 24 Year Olds | 224 (77.5%) | 65 (22.5%) |
| 25 to 34 Year Olds | 26 (22.2%) | 91 (77.8%) |
| 35 Years and over | 343 (69.7%) | 149 (30.3%) |
| Total | 3,232 (80.9%) | 763 (19.1%) |
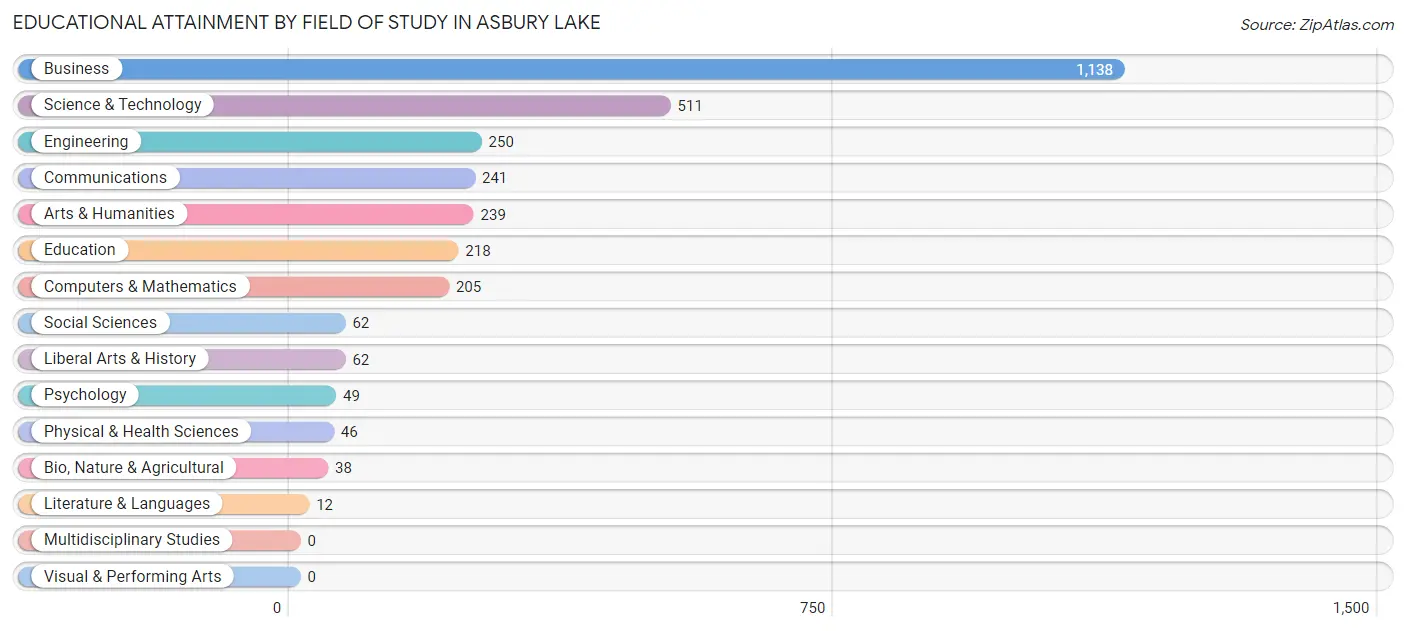
Educational Attainment by Field of Study in Asbury Lake
Business (1,138 | 37.1%), science & technology (511 | 16.6%), engineering (250 | 8.1%), communications (241 | 7.9%), and arts & humanities (239 | 7.8%) are the most common fields of study among 3,071 individuals in Asbury Lake who have obtained a bachelor's degree or higher.
| Field of Study | # Graduates | % Graduates |
| Computers & Mathematics | 205 | 6.7% |
| Bio, Nature & Agricultural | 38 | 1.2% |
| Physical & Health Sciences | 46 | 1.5% |
| Psychology | 49 | 1.6% |
| Social Sciences | 62 | 2.0% |
| Engineering | 250 | 8.1% |
| Multidisciplinary Studies | 0 | 0.0% |
| Science & Technology | 511 | 16.6% |
| Business | 1,138 | 37.1% |
| Education | 218 | 7.1% |
| Literature & Languages | 12 | 0.4% |
| Liberal Arts & History | 62 | 2.0% |
| Visual & Performing Arts | 0 | 0.0% |
| Communications | 241 | 7.9% |
| Arts & Humanities | 239 | 7.8% |
| Total | 3,071 | 100.0% |
Transportation & Commute in Asbury Lake
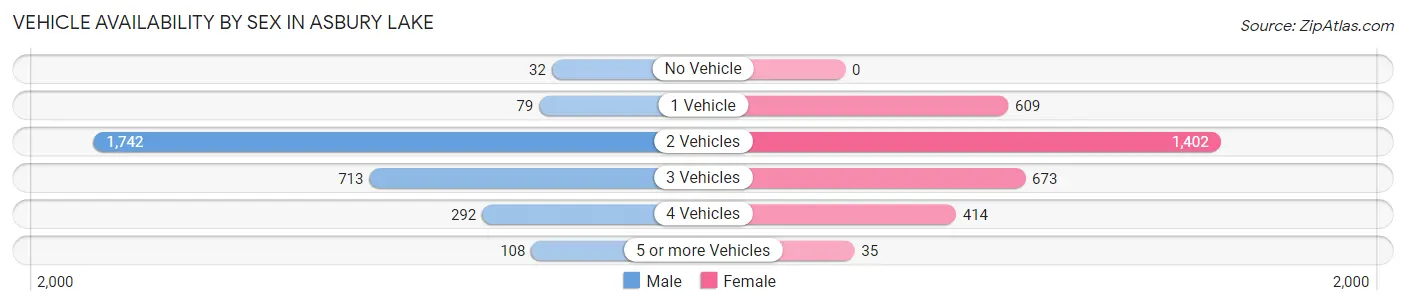
Vehicle Availability by Sex in Asbury Lake
The most prevalent vehicle ownership categories in Asbury Lake are males with 2 vehicles (1,742, accounting for 58.7%) and females with 2 vehicles (1,402, making up 55.6%).
| Vehicles Available | Male | Female |
| No Vehicle | 32 (1.1%) | 0 (0.0%) |
| 1 Vehicle | 79 (2.7%) | 609 (19.4%) |
| 2 Vehicles | 1,742 (58.7%) | 1,402 (44.8%) |
| 3 Vehicles | 713 (24.0%) | 673 (21.5%) |
| 4 Vehicles | 292 (9.8%) | 414 (13.2%) |
| 5 or more Vehicles | 108 (3.6%) | 35 (1.1%) |
| Total | 2,966 (100.0%) | 3,133 (100.0%) |
Commute Time in Asbury Lake
The most frequently occuring commute durations in Asbury Lake are 45 to 59 minutes (1,085 commuters, 22.0%), 60 to 89 minutes (708 commuters, 14.3%), and 30 to 34 minutes (668 commuters, 13.5%).
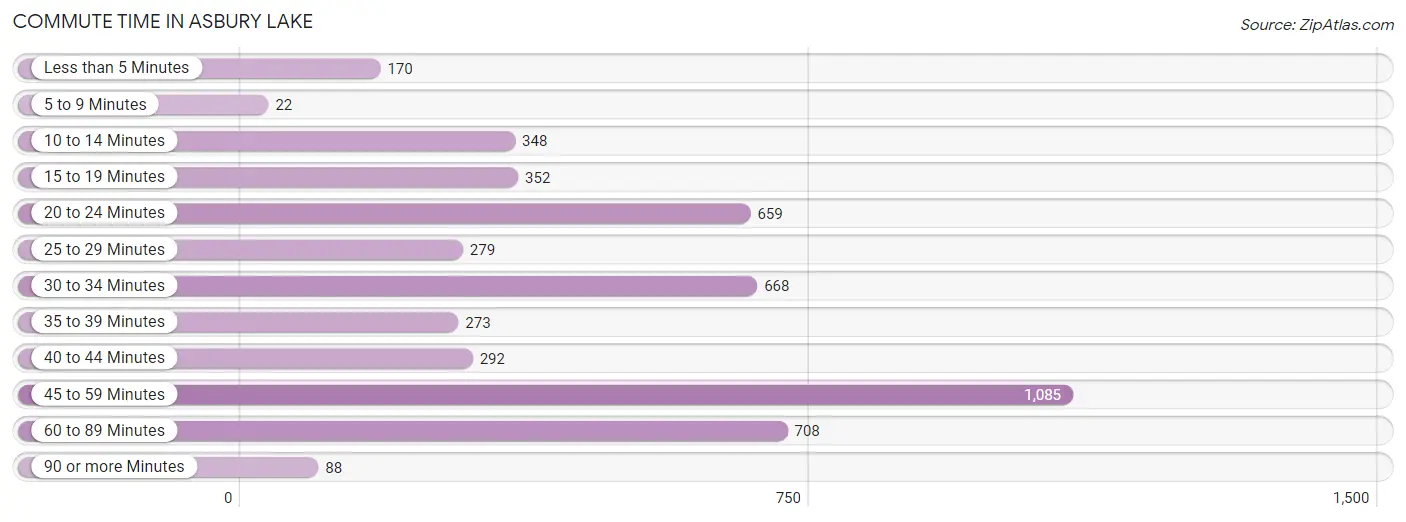
| Commute Time | # Commuters | % Commuters |
| Less than 5 Minutes | 170 | 3.4% |
| 5 to 9 Minutes | 22 | 0.4% |
| 10 to 14 Minutes | 348 | 7.0% |
| 15 to 19 Minutes | 352 | 7.1% |
| 20 to 24 Minutes | 659 | 13.3% |
| 25 to 29 Minutes | 279 | 5.6% |
| 30 to 34 Minutes | 668 | 13.5% |
| 35 to 39 Minutes | 273 | 5.5% |
| 40 to 44 Minutes | 292 | 5.9% |
| 45 to 59 Minutes | 1,085 | 22.0% |
| 60 to 89 Minutes | 708 | 14.3% |
| 90 or more Minutes | 88 | 1.8% |
Commute Time by Sex in Asbury Lake
The most common commute times in Asbury Lake are 45 to 59 minutes (805 commuters, 30.2%) for males and 60 to 89 minutes (441 commuters, 19.3%) for females.
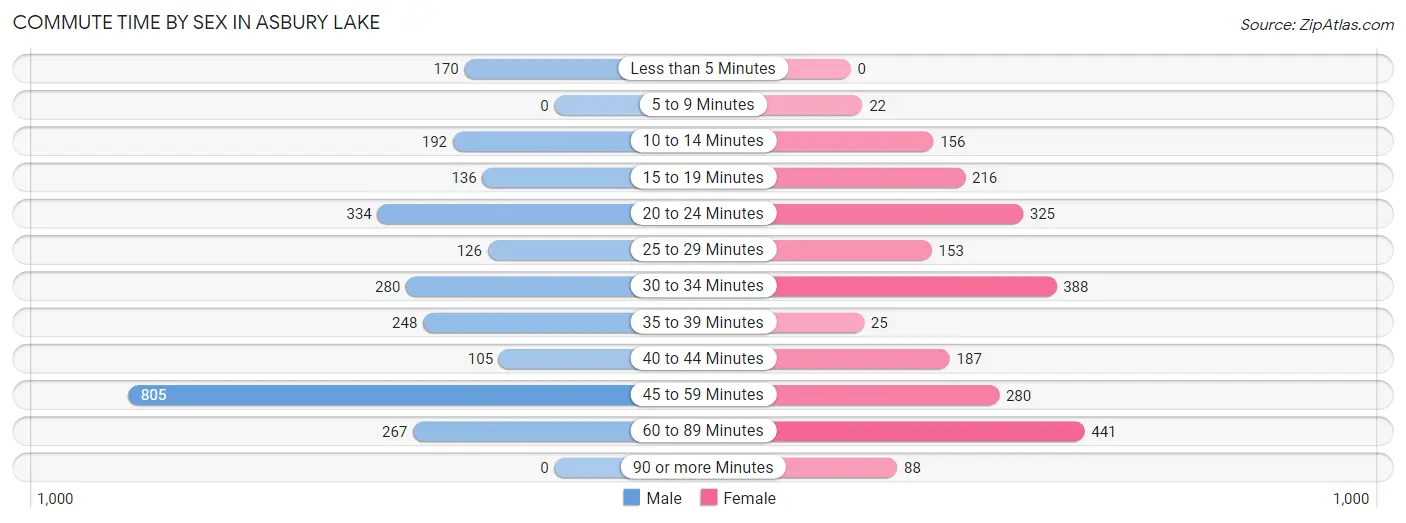
| Commute Time | Male | Female |
| Less than 5 Minutes | 170 (6.4%) | 0 (0.0%) |
| 5 to 9 Minutes | 0 (0.0%) | 22 (1.0%) |
| 10 to 14 Minutes | 192 (7.2%) | 156 (6.8%) |
| 15 to 19 Minutes | 136 (5.1%) | 216 (9.5%) |
| 20 to 24 Minutes | 334 (12.5%) | 325 (14.2%) |
| 25 to 29 Minutes | 126 (4.7%) | 153 (6.7%) |
| 30 to 34 Minutes | 280 (10.5%) | 388 (17.0%) |
| 35 to 39 Minutes | 248 (9.3%) | 25 (1.1%) |
| 40 to 44 Minutes | 105 (3.9%) | 187 (8.2%) |
| 45 to 59 Minutes | 805 (30.2%) | 280 (12.3%) |
| 60 to 89 Minutes | 267 (10.0%) | 441 (19.3%) |
| 90 or more Minutes | 0 (0.0%) | 88 (3.9%) |
Time of Departure to Work by Sex in Asbury Lake
The most frequent times of departure to work in Asbury Lake are 7:00 AM to 7:29 AM (715, 26.9%) for males and 7:00 AM to 7:29 AM (377, 16.5%) for females.
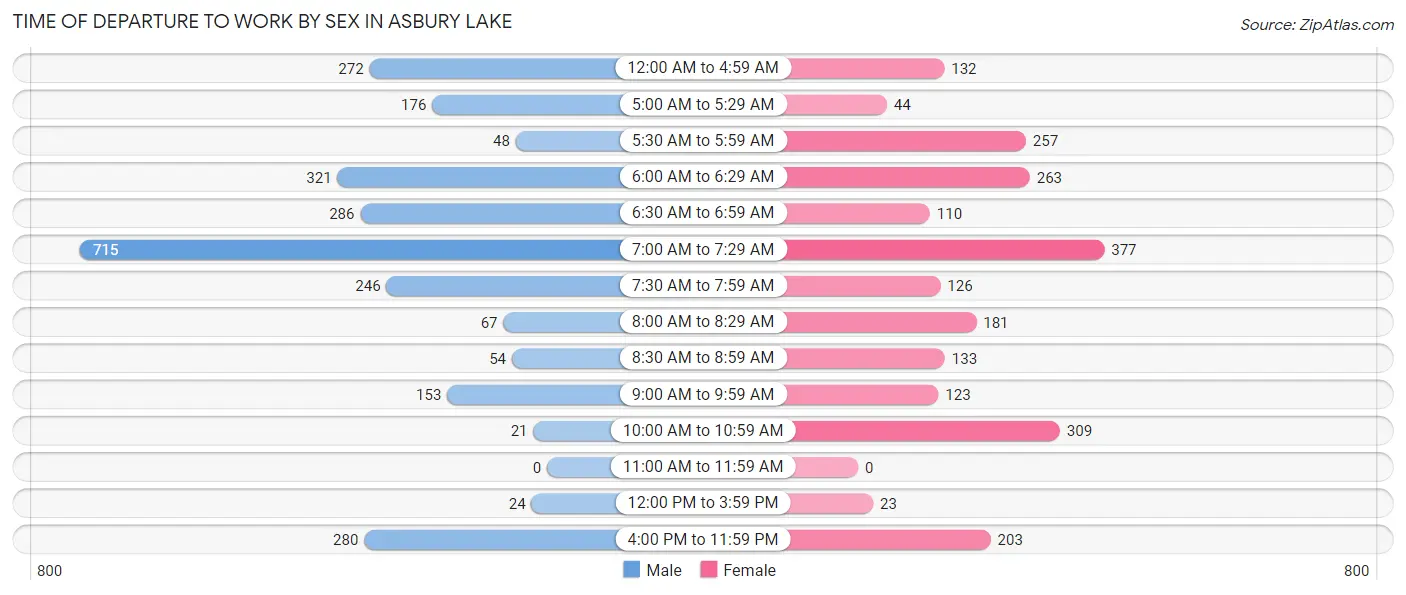
| Time of Departure | Male | Female |
| 12:00 AM to 4:59 AM | 272 (10.2%) | 132 (5.8%) |
| 5:00 AM to 5:29 AM | 176 (6.6%) | 44 (1.9%) |
| 5:30 AM to 5:59 AM | 48 (1.8%) | 257 (11.3%) |
| 6:00 AM to 6:29 AM | 321 (12.0%) | 263 (11.5%) |
| 6:30 AM to 6:59 AM | 286 (10.7%) | 110 (4.8%) |
| 7:00 AM to 7:29 AM | 715 (26.9%) | 377 (16.5%) |
| 7:30 AM to 7:59 AM | 246 (9.2%) | 126 (5.5%) |
| 8:00 AM to 8:29 AM | 67 (2.5%) | 181 (7.9%) |
| 8:30 AM to 8:59 AM | 54 (2.0%) | 133 (5.8%) |
| 9:00 AM to 9:59 AM | 153 (5.8%) | 123 (5.4%) |
| 10:00 AM to 10:59 AM | 21 (0.8%) | 309 (13.6%) |
| 11:00 AM to 11:59 AM | 0 (0.0%) | 0 (0.0%) |
| 12:00 PM to 3:59 PM | 24 (0.9%) | 23 (1.0%) |
| 4:00 PM to 11:59 PM | 280 (10.5%) | 203 (8.9%) |
| Total | 2,663 (100.0%) | 2,281 (100.0%) |
Housing Occupancy in Asbury Lake
Occupancy by Ownership in Asbury Lake
Of the total 4,529 dwellings in Asbury Lake, owner-occupied units account for 4,188 (92.5%), while renter-occupied units make up 341 (7.5%).
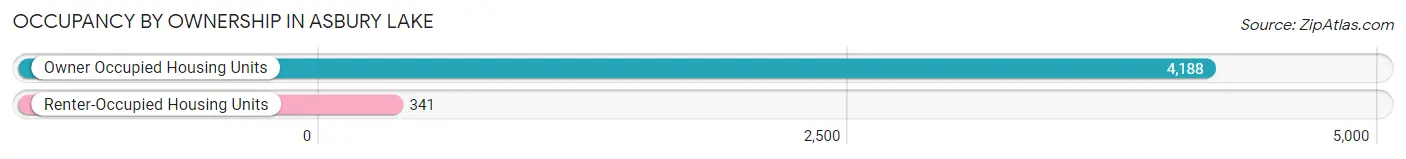
| Occupancy | # Housing Units | % Housing Units |
| Owner Occupied Housing Units | 4,188 | 92.5% |
| Renter-Occupied Housing Units | 341 | 7.5% |
| Total Occupied Housing Units | 4,529 | 100.0% |
Occupancy by Household Size in Asbury Lake
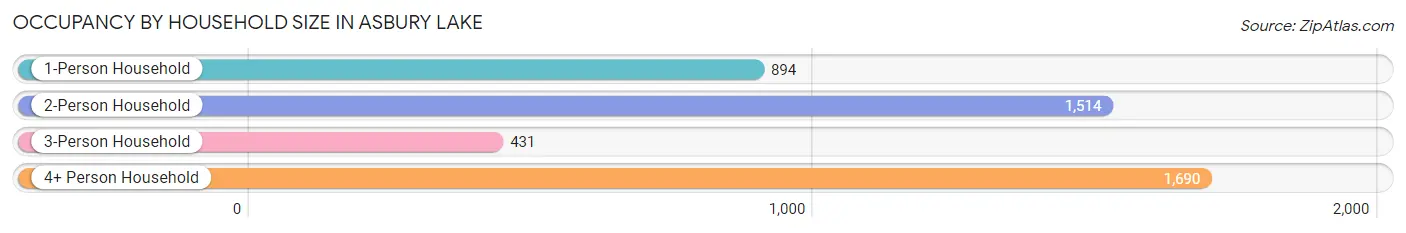
| Household Size | # Housing Units | % Housing Units |
| 1-Person Household | 894 | 19.7% |
| 2-Person Household | 1,514 | 33.4% |
| 3-Person Household | 431 | 9.5% |
| 4+ Person Household | 1,690 | 37.3% |
| Total Housing Units | 4,529 | 100.0% |
Occupancy by Ownership by Household Size in Asbury Lake
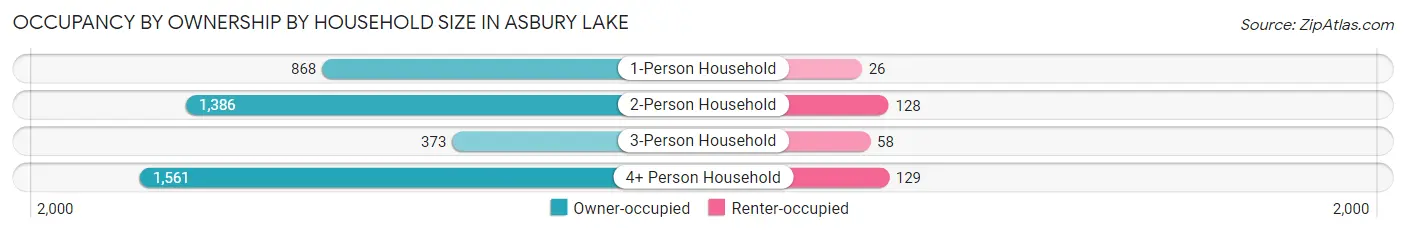
| Household Size | Owner-occupied | Renter-occupied |
| 1-Person Household | 868 (97.1%) | 26 (2.9%) |
| 2-Person Household | 1,386 (91.5%) | 128 (8.5%) |
| 3-Person Household | 373 (86.5%) | 58 (13.5%) |
| 4+ Person Household | 1,561 (92.4%) | 129 (7.6%) |
| Total Housing Units | 4,188 (92.5%) | 341 (7.5%) |
Occupancy by Educational Attainment in Asbury Lake
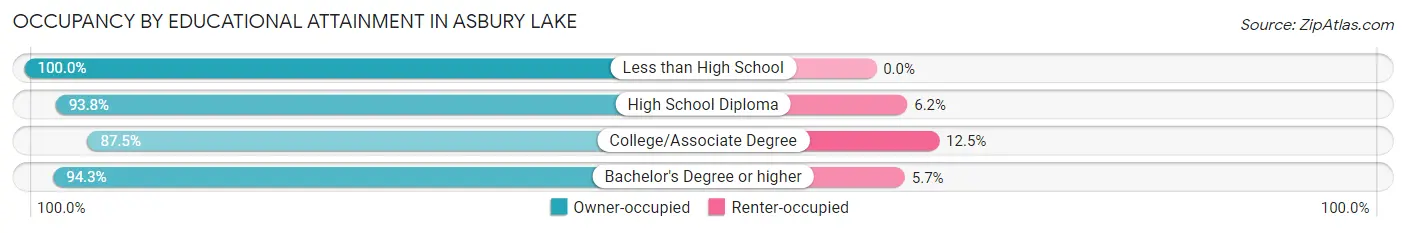
| Household Size | Owner-occupied | Renter-occupied |
| Less than High School | 141 (100.0%) | 0 (0.0%) |
| High School Diploma | 1,019 (93.8%) | 67 (6.2%) |
| College/Associate Degree | 1,107 (87.5%) | 158 (12.5%) |
| Bachelor's Degree or higher | 1,921 (94.3%) | 116 (5.7%) |
Occupancy by Age of Householder in Asbury Lake
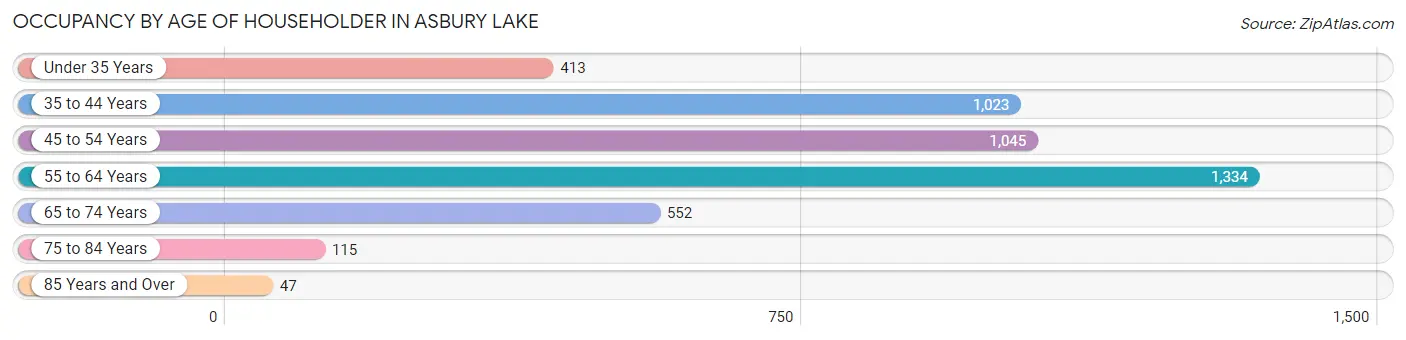
| Age Bracket | # Households | % Households |
| Under 35 Years | 413 | 9.1% |
| 35 to 44 Years | 1,023 | 22.6% |
| 45 to 54 Years | 1,045 | 23.1% |
| 55 to 64 Years | 1,334 | 29.4% |
| 65 to 74 Years | 552 | 12.2% |
| 75 to 84 Years | 115 | 2.5% |
| 85 Years and Over | 47 | 1.0% |
| Total | 4,529 | 100.0% |
Housing Finances in Asbury Lake
Median Income by Occupancy in Asbury Lake
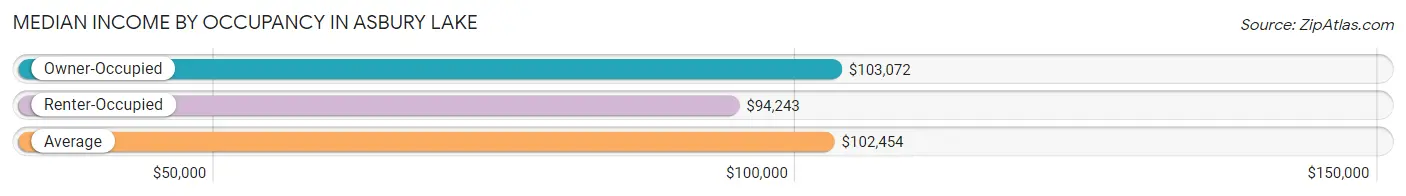
| Occupancy Type | # Households | Median Income |
| Owner-Occupied | 4,188 (92.5%) | $103,072 |
| Renter-Occupied | 341 (7.5%) | $94,243 |
| Average | 4,529 (100.0%) | $102,454 |
Occupancy by Householder Income Bracket in Asbury Lake
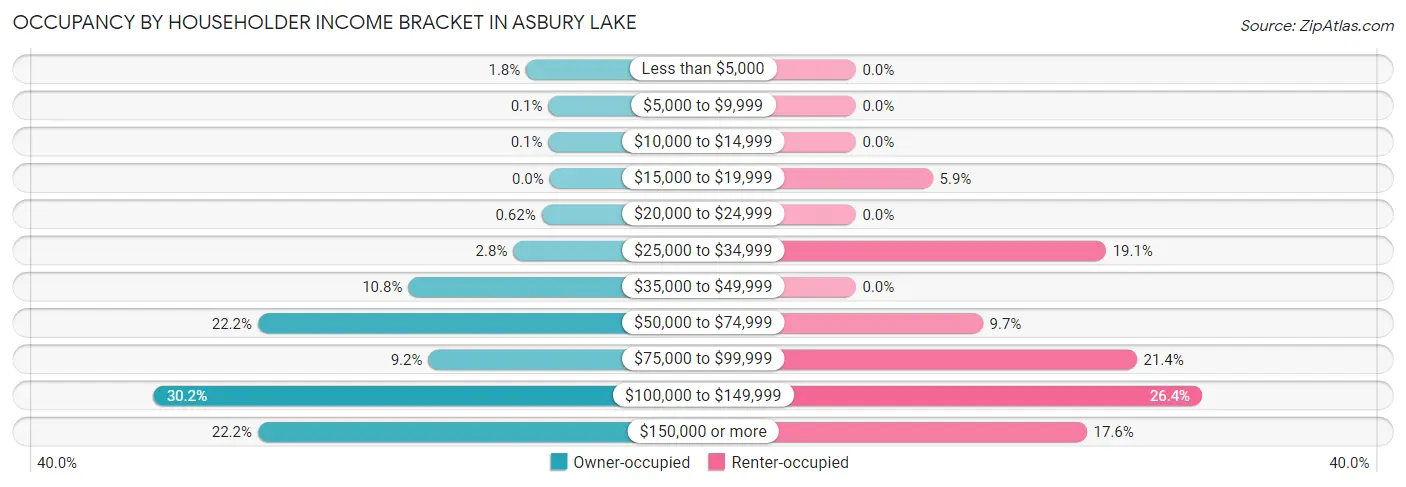
| Income Bracket | Owner-occupied | Renter-occupied |
| Less than $5,000 | 75 (1.8%) | 0 (0.0%) |
| $5,000 to $9,999 | 4 (0.1%) | 0 (0.0%) |
| $10,000 to $14,999 | 4 (0.1%) | 0 (0.0%) |
| $15,000 to $19,999 | 0 (0.0%) | 20 (5.9%) |
| $20,000 to $24,999 | 26 (0.6%) | 0 (0.0%) |
| $25,000 to $34,999 | 116 (2.8%) | 65 (19.1%) |
| $35,000 to $49,999 | 451 (10.8%) | 0 (0.0%) |
| $50,000 to $74,999 | 931 (22.2%) | 33 (9.7%) |
| $75,000 to $99,999 | 387 (9.2%) | 73 (21.4%) |
| $100,000 to $149,999 | 1,263 (30.2%) | 90 (26.4%) |
| $150,000 or more | 931 (22.2%) | 60 (17.6%) |
| Total | 4,188 (100.0%) | 341 (100.0%) |
Monthly Housing Cost Tiers in Asbury Lake
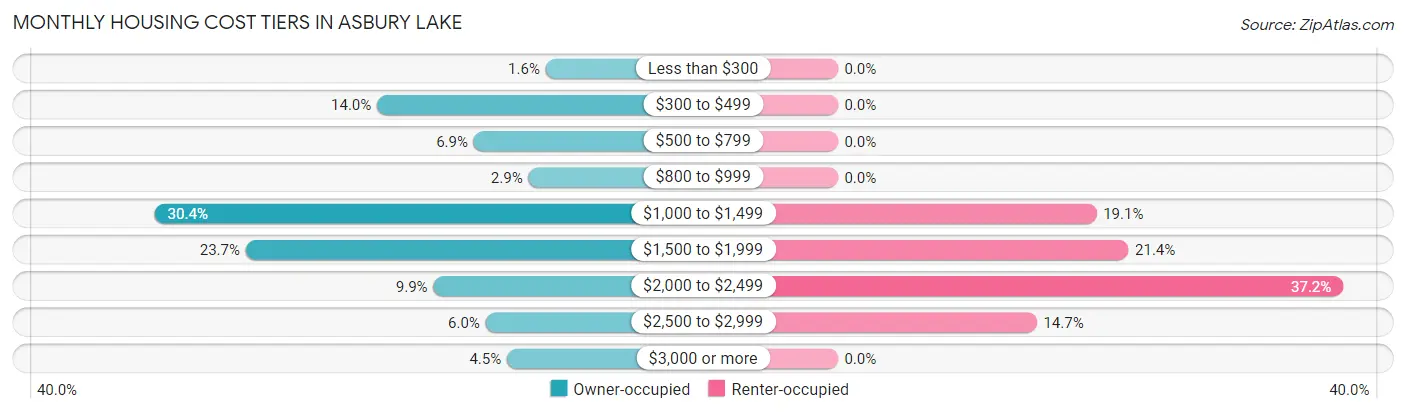
| Monthly Cost | Owner-occupied | Renter-occupied |
| Less than $300 | 68 (1.6%) | 0 (0.0%) |
| $300 to $499 | 588 (14.0%) | 0 (0.0%) |
| $500 to $799 | 290 (6.9%) | 0 (0.0%) |
| $800 to $999 | 121 (2.9%) | 0 (0.0%) |
| $1,000 to $1,499 | 1,274 (30.4%) | 65 (19.1%) |
| $1,500 to $1,999 | 993 (23.7%) | 73 (21.4%) |
| $2,000 to $2,499 | 414 (9.9%) | 127 (37.2%) |
| $2,500 to $2,999 | 253 (6.0%) | 50 (14.7%) |
| $3,000 or more | 187 (4.5%) | 0 (0.0%) |
| Total | 4,188 (100.0%) | 341 (100.0%) |
Physical Housing Characteristics in Asbury Lake
Housing Structures in Asbury Lake
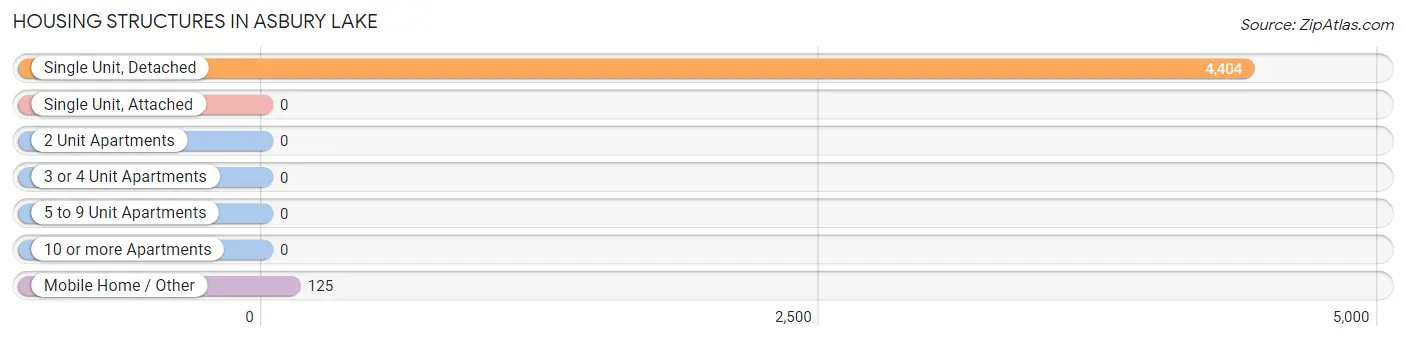
| Structure Type | # Housing Units | % Housing Units |
| Single Unit, Detached | 4,404 | 97.2% |
| Single Unit, Attached | 0 | 0.0% |
| 2 Unit Apartments | 0 | 0.0% |
| 3 or 4 Unit Apartments | 0 | 0.0% |
| 5 to 9 Unit Apartments | 0 | 0.0% |
| 10 or more Apartments | 0 | 0.0% |
| Mobile Home / Other | 125 | 2.8% |
| Total | 4,529 | 100.0% |
Housing Structures by Occupancy in Asbury Lake
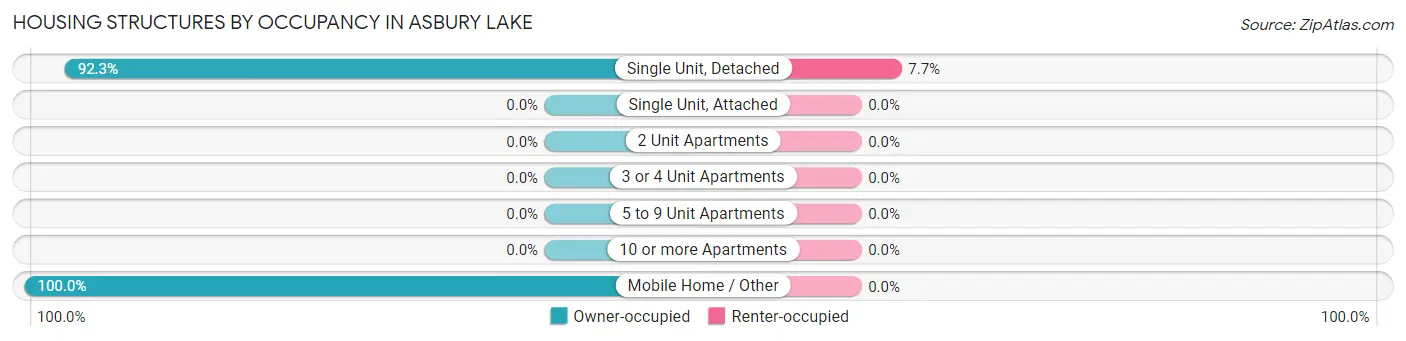
| Structure Type | Owner-occupied | Renter-occupied |
| Single Unit, Detached | 4,063 (92.3%) | 341 (7.7%) |
| Single Unit, Attached | 0 (0.0%) | 0 (0.0%) |
| 2 Unit Apartments | 0 (0.0%) | 0 (0.0%) |
| 3 or 4 Unit Apartments | 0 (0.0%) | 0 (0.0%) |
| 5 to 9 Unit Apartments | 0 (0.0%) | 0 (0.0%) |
| 10 or more Apartments | 0 (0.0%) | 0 (0.0%) |
| Mobile Home / Other | 125 (100.0%) | 0 (0.0%) |
| Total | 4,188 (92.5%) | 341 (7.5%) |
Housing Structures by Number of Rooms in Asbury Lake
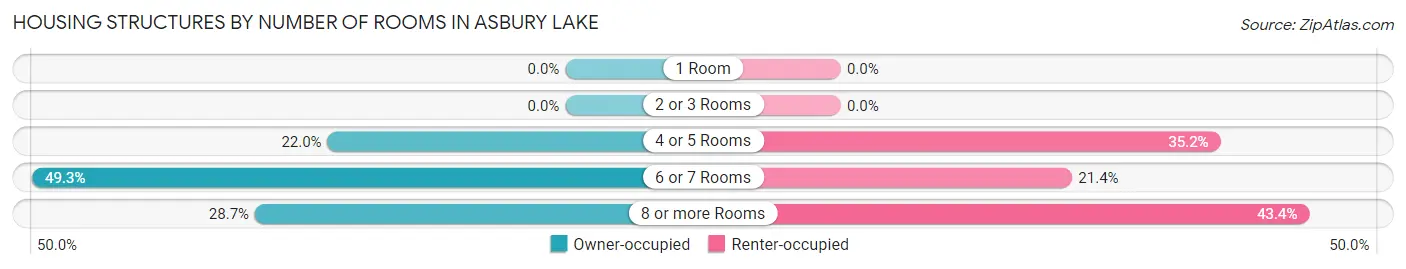
| Number of Rooms | Owner-occupied | Renter-occupied |
| 1 Room | 0 (0.0%) | 0 (0.0%) |
| 2 or 3 Rooms | 0 (0.0%) | 0 (0.0%) |
| 4 or 5 Rooms | 921 (22.0%) | 120 (35.2%) |
| 6 or 7 Rooms | 2,065 (49.3%) | 73 (21.4%) |
| 8 or more Rooms | 1,202 (28.7%) | 148 (43.4%) |
| Total | 4,188 (100.0%) | 341 (100.0%) |
Housing Structure by Heating Type in Asbury Lake
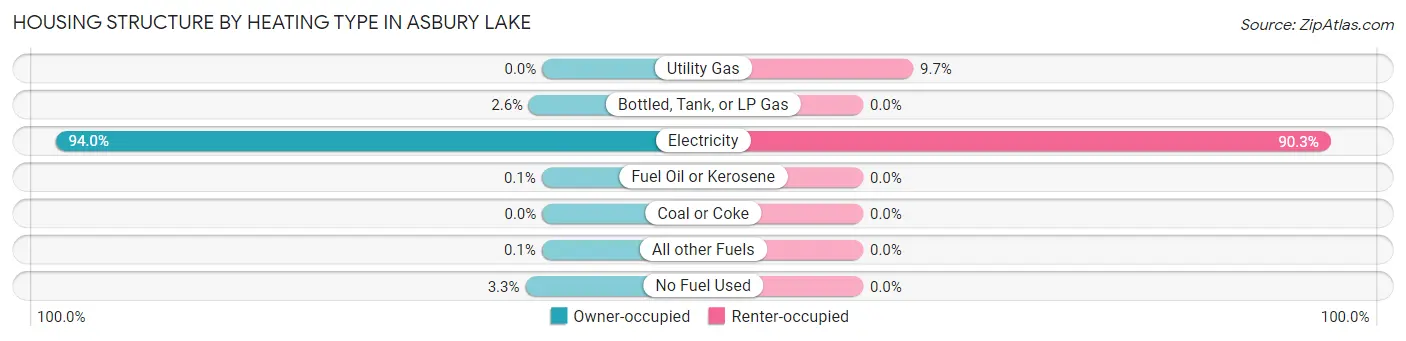
| Heating Type | Owner-occupied | Renter-occupied |
| Utility Gas | 0 (0.0%) | 33 (9.7%) |
| Bottled, Tank, or LP Gas | 107 (2.5%) | 0 (0.0%) |
| Electricity | 3,937 (94.0%) | 308 (90.3%) |
| Fuel Oil or Kerosene | 4 (0.1%) | 0 (0.0%) |
| Coal or Coke | 0 (0.0%) | 0 (0.0%) |
| All other Fuels | 4 (0.1%) | 0 (0.0%) |
| No Fuel Used | 136 (3.3%) | 0 (0.0%) |
| Total | 4,188 (100.0%) | 341 (100.0%) |
Household Vehicle Usage in Asbury Lake
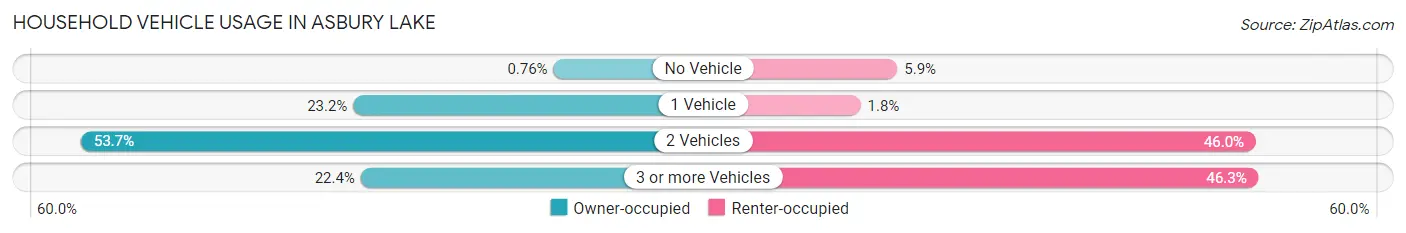
| Vehicles per Household | Owner-occupied | Renter-occupied |
| No Vehicle | 32 (0.8%) | 20 (5.9%) |
| 1 Vehicle | 971 (23.2%) | 6 (1.8%) |
| 2 Vehicles | 2,249 (53.7%) | 157 (46.0%) |
| 3 or more Vehicles | 936 (22.4%) | 158 (46.3%) |
| Total | 4,188 (100.0%) | 341 (100.0%) |
Real Estate & Mortgages in Asbury Lake
Real Estate and Mortgage Overview in Asbury Lake
| Characteristic | Without Mortgage | With Mortgage |
| Housing Units | 1,050 | 3,138 |
| Median Property Value | - | - |
| Median Household Income | $64,722 | $830 |
| Monthly Housing Costs | $396 | $187 |
| Real Estate Taxes | $1,847 | $192 |
Property Value by Mortgage Status in Asbury Lake
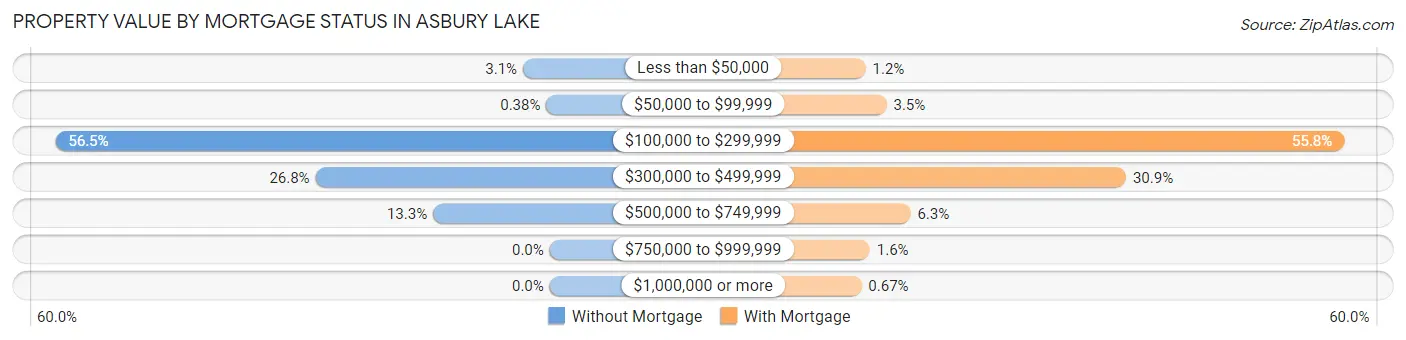
| Property Value | Without Mortgage | With Mortgage |
| Less than $50,000 | 32 (3.0%) | 36 (1.1%) |
| $50,000 to $99,999 | 4 (0.4%) | 111 (3.5%) |
| $100,000 to $299,999 | 593 (56.5%) | 1,752 (55.8%) |
| $300,000 to $499,999 | 281 (26.8%) | 970 (30.9%) |
| $500,000 to $749,999 | 140 (13.3%) | 197 (6.3%) |
| $750,000 to $999,999 | 0 (0.0%) | 51 (1.6%) |
| $1,000,000 or more | 0 (0.0%) | 21 (0.7%) |
| Total | 1,050 (100.0%) | 3,138 (100.0%) |
Household Income by Mortgage Status in Asbury Lake
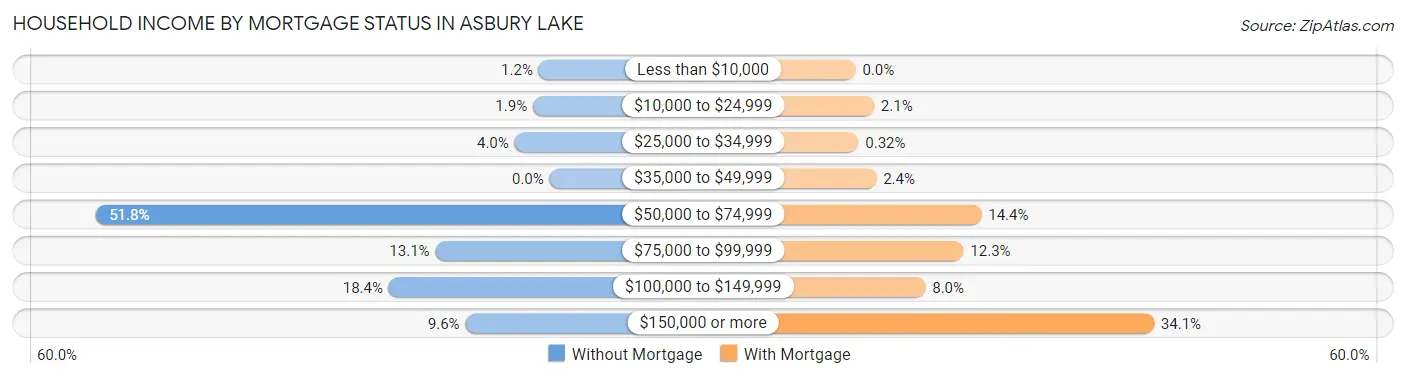
| Household Income | Without Mortgage | With Mortgage |
| Less than $10,000 | 13 (1.2%) | 0 (0.0%) |
| $10,000 to $24,999 | 20 (1.9%) | 66 (2.1%) |
| $25,000 to $34,999 | 42 (4.0%) | 10 (0.3%) |
| $35,000 to $49,999 | 0 (0.0%) | 74 (2.4%) |
| $50,000 to $74,999 | 544 (51.8%) | 451 (14.4%) |
| $75,000 to $99,999 | 137 (13.1%) | 387 (12.3%) |
| $100,000 to $149,999 | 193 (18.4%) | 250 (8.0%) |
| $150,000 or more | 101 (9.6%) | 1,070 (34.1%) |
| Total | 1,050 (100.0%) | 3,138 (100.0%) |
Property Value to Household Income Ratio in Asbury Lake
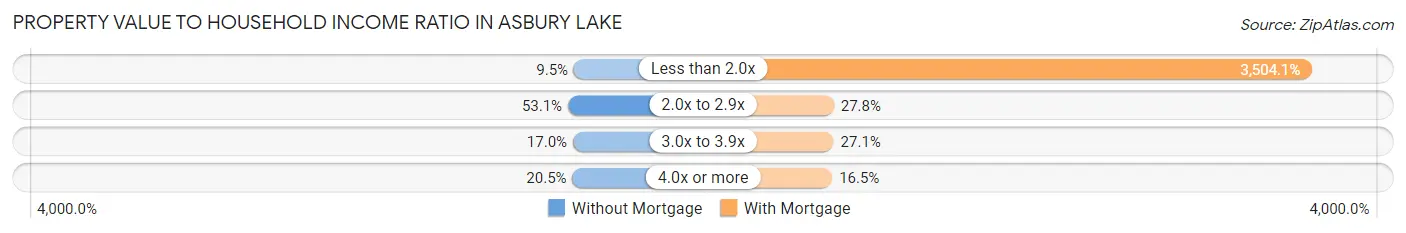
| Value-to-Income Ratio | Without Mortgage | With Mortgage |
| Less than 2.0x | 100 (9.5%) | 109,958 (3,504.1%) |
| 2.0x to 2.9x | 557 (53.0%) | 873 (27.8%) |
| 3.0x to 3.9x | 178 (17.0%) | 851 (27.1%) |
| 4.0x or more | 215 (20.5%) | 518 (16.5%) |
| Total | 1,050 (100.0%) | 3,138 (100.0%) |
Real Estate Taxes by Mortgage Status in Asbury Lake
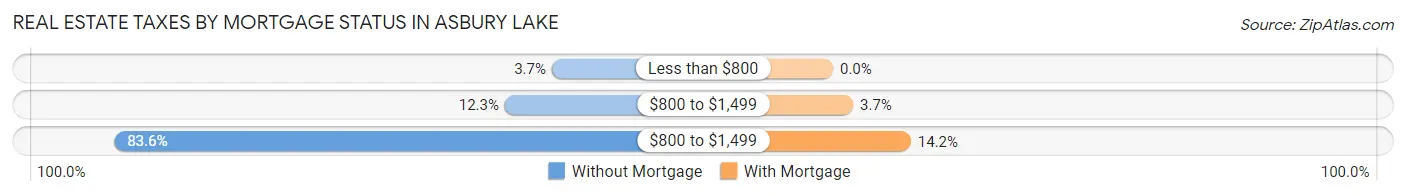
| Property Taxes | Without Mortgage | With Mortgage |
| Less than $800 | 39 (3.7%) | 0 (0.0%) |
| $800 to $1,499 | 129 (12.3%) | 115 (3.7%) |
| $800 to $1,499 | 878 (83.6%) | 446 (14.2%) |
| Total | 1,050 (100.0%) | 3,138 (100.0%) |
Health & Disability in Asbury Lake
Health Insurance Coverage by Age in Asbury Lake
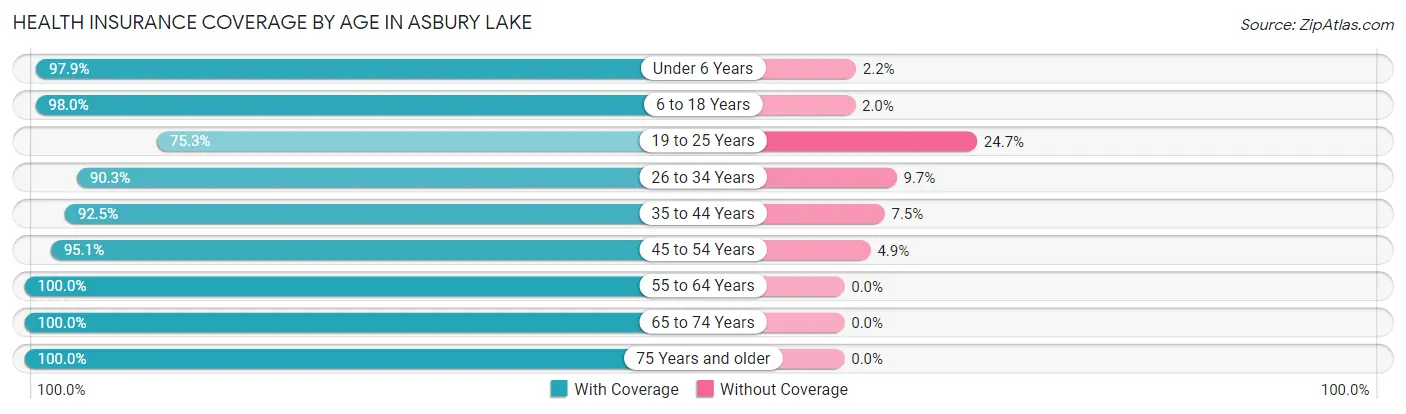
| Age Bracket | With Coverage | Without Coverage |
| Under 6 Years | 1,049 (97.9%) | 23 (2.1%) |
| 6 to 18 Years | 2,445 (98.0%) | 50 (2.0%) |
| 19 to 25 Years | 685 (75.3%) | 225 (24.7%) |
| 26 to 34 Years | 686 (90.3%) | 74 (9.7%) |
| 35 to 44 Years | 1,959 (92.5%) | 159 (7.5%) |
| 45 to 54 Years | 1,891 (95.1%) | 97 (4.9%) |
| 55 to 64 Years | 1,648 (100.0%) | 0 (0.0%) |
| 65 to 74 Years | 1,105 (100.0%) | 0 (0.0%) |
| 75 Years and older | 302 (100.0%) | 0 (0.0%) |
| Total | 11,770 (94.9%) | 628 (5.1%) |
Health Insurance Coverage by Citizenship Status in Asbury Lake
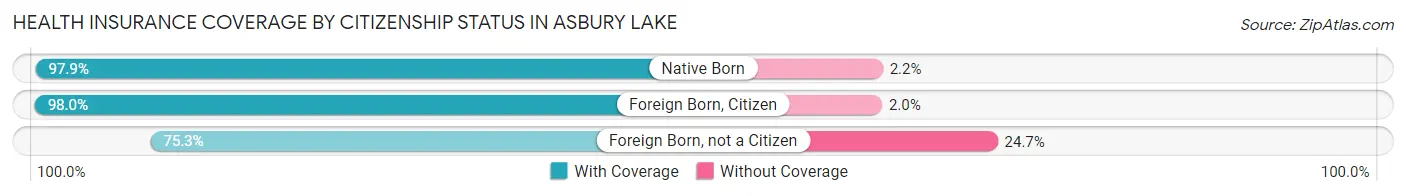
| Citizenship Status | With Coverage | Without Coverage |
| Native Born | 1,049 (97.9%) | 23 (2.1%) |
| Foreign Born, Citizen | 2,445 (98.0%) | 50 (2.0%) |
| Foreign Born, not a Citizen | 685 (75.3%) | 225 (24.7%) |
Health Insurance Coverage by Household Income in Asbury Lake
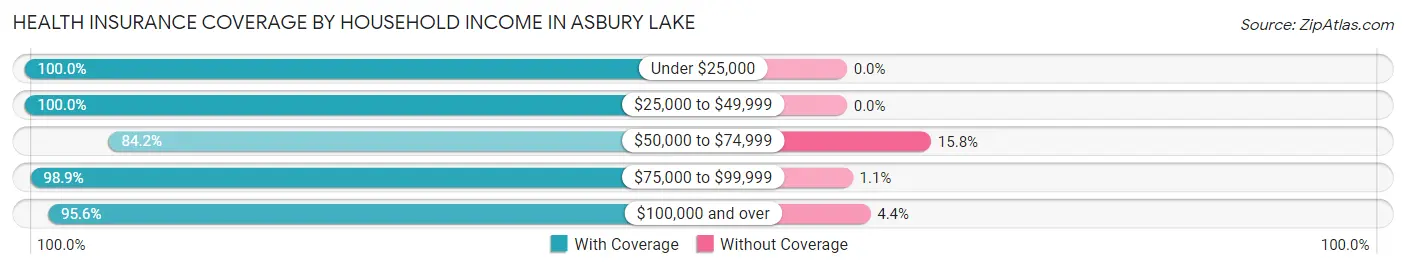
| Household Income | With Coverage | Without Coverage |
| Under $25,000 | 132 (100.0%) | 0 (0.0%) |
| $25,000 to $49,999 | 1,309 (100.0%) | 0 (0.0%) |
| $50,000 to $74,999 | 1,417 (84.2%) | 265 (15.8%) |
| $75,000 to $99,999 | 1,366 (98.9%) | 15 (1.1%) |
| $100,000 and over | 7,542 (95.6%) | 347 (4.4%) |
Public vs Private Health Insurance Coverage by Age in Asbury Lake
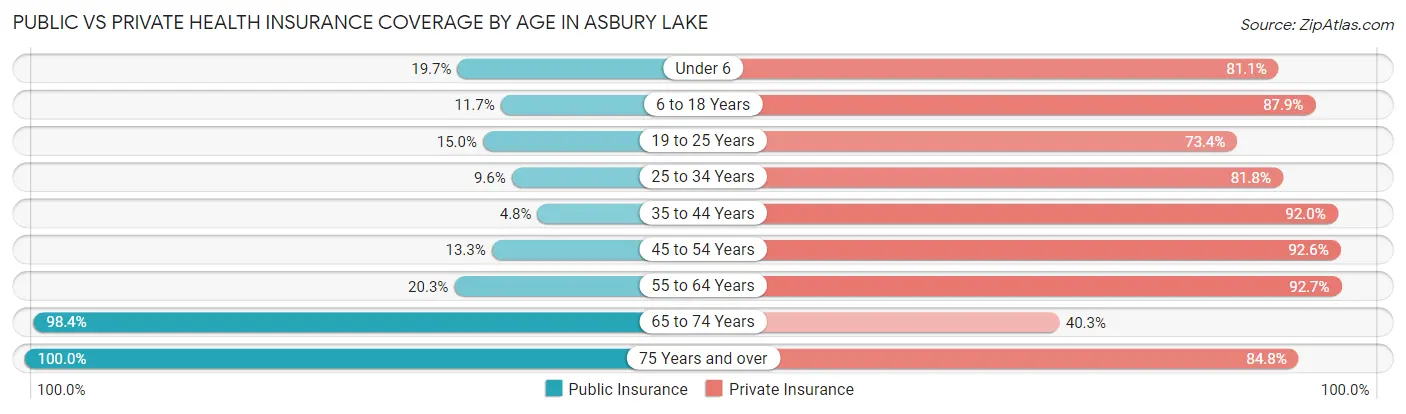
| Age Bracket | Public Insurance | Private Insurance |
| Under 6 | 211 (19.7%) | 869 (81.1%) |
| 6 to 18 Years | 291 (11.7%) | 2,192 (87.9%) |
| 19 to 25 Years | 136 (14.9%) | 668 (73.4%) |
| 25 to 34 Years | 73 (9.6%) | 622 (81.8%) |
| 35 to 44 Years | 102 (4.8%) | 1,949 (92.0%) |
| 45 to 54 Years | 265 (13.3%) | 1,840 (92.6%) |
| 55 to 64 Years | 334 (20.3%) | 1,528 (92.7%) |
| 65 to 74 Years | 1,087 (98.4%) | 445 (40.3%) |
| 75 Years and over | 302 (100.0%) | 256 (84.8%) |
| Total | 2,801 (22.6%) | 10,369 (83.6%) |
Disability Status by Sex by Age in Asbury Lake
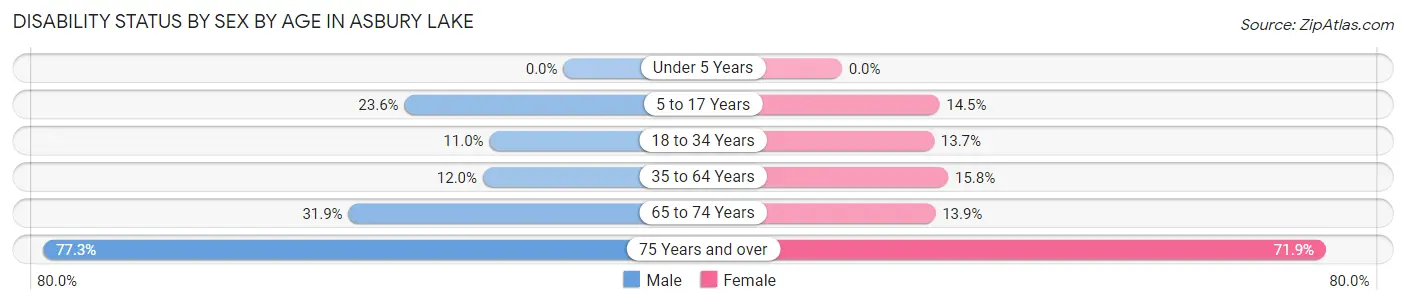
| Age Bracket | Male | Female |
| Under 5 Years | 0 (0.0%) | 0 (0.0%) |
| 5 to 17 Years | 346 (23.6%) | 149 (14.5%) |
| 18 to 34 Years | 95 (11.0%) | 143 (13.7%) |
| 35 to 64 Years | 318 (11.9%) | 488 (15.8%) |
| 65 to 74 Years | 187 (31.9%) | 72 (13.9%) |
| 75 Years and over | 85 (77.3%) | 138 (71.9%) |
Disability Class by Sex by Age in Asbury Lake
Disability Class: Hearing Difficulty
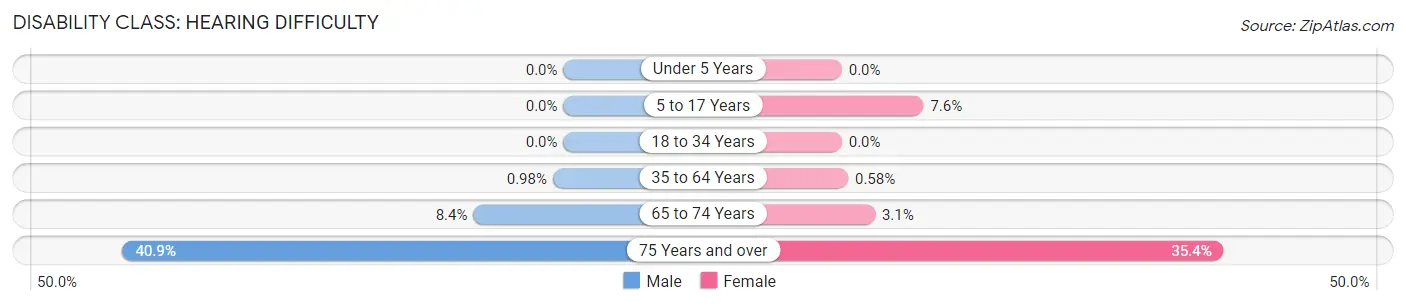
| Age Bracket | Male | Female |
| Under 5 Years | 0 (0.0%) | 0 (0.0%) |
| 5 to 17 Years | 0 (0.0%) | 78 (7.6%) |
| 18 to 34 Years | 0 (0.0%) | 0 (0.0%) |
| 35 to 64 Years | 26 (1.0%) | 18 (0.6%) |
| 65 to 74 Years | 49 (8.4%) | 16 (3.1%) |
| 75 Years and over | 45 (40.9%) | 68 (35.4%) |
Disability Class: Vision Difficulty
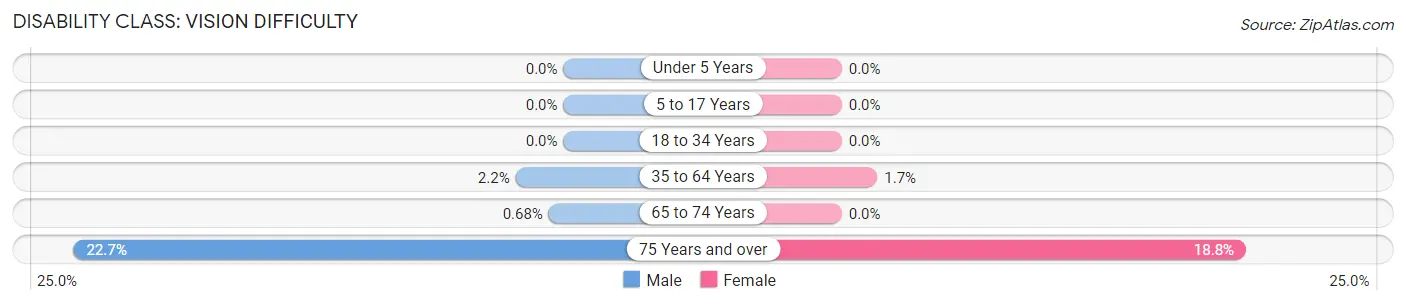
| Age Bracket | Male | Female |
| Under 5 Years | 0 (0.0%) | 0 (0.0%) |
| 5 to 17 Years | 0 (0.0%) | 0 (0.0%) |
| 18 to 34 Years | 0 (0.0%) | 0 (0.0%) |
| 35 to 64 Years | 59 (2.2%) | 51 (1.7%) |
| 65 to 74 Years | 4 (0.7%) | 0 (0.0%) |
| 75 Years and over | 25 (22.7%) | 36 (18.8%) |
Disability Class: Cognitive Difficulty
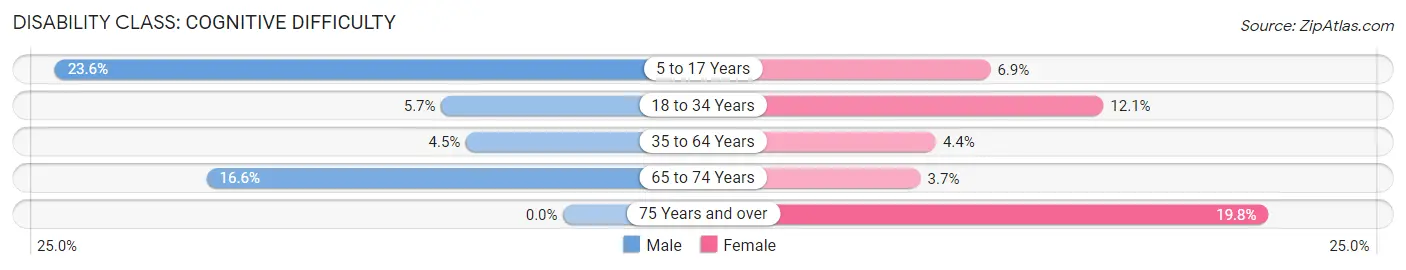
| Age Bracket | Male | Female |
| 5 to 17 Years | 346 (23.6%) | 71 (6.9%) |
| 18 to 34 Years | 49 (5.7%) | 127 (12.1%) |
| 35 to 64 Years | 120 (4.5%) | 135 (4.4%) |
| 65 to 74 Years | 97 (16.6%) | 19 (3.7%) |
| 75 Years and over | 0 (0.0%) | 38 (19.8%) |
Disability Class: Ambulatory Difficulty
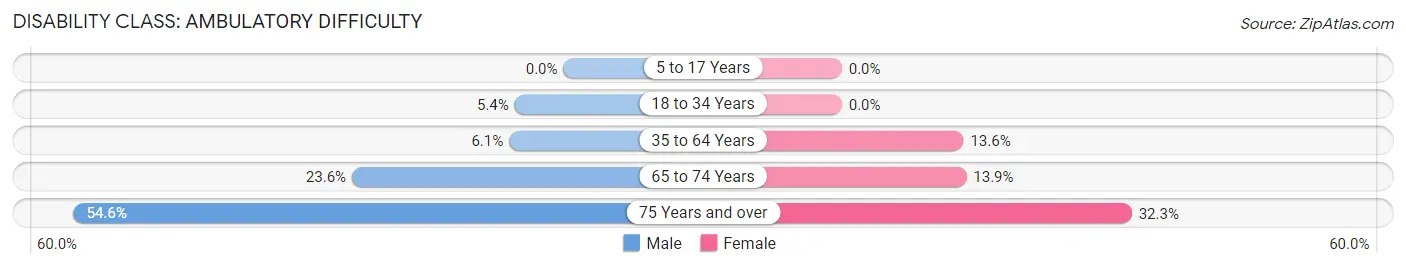
| Age Bracket | Male | Female |
| 5 to 17 Years | 0 (0.0%) | 0 (0.0%) |
| 18 to 34 Years | 47 (5.4%) | 0 (0.0%) |
| 35 to 64 Years | 161 (6.0%) | 419 (13.6%) |
| 65 to 74 Years | 138 (23.5%) | 72 (13.9%) |
| 75 Years and over | 60 (54.5%) | 62 (32.3%) |
Disability Class: Self-Care Difficulty

| Age Bracket | Male | Female |
| 5 to 17 Years | 21 (1.4%) | 0 (0.0%) |
| 18 to 34 Years | 47 (5.4%) | 0 (0.0%) |
| 35 to 64 Years | 0 (0.0%) | 79 (2.5%) |
| 65 to 74 Years | 37 (6.3%) | 19 (3.7%) |
| 75 Years and over | 40 (36.4%) | 38 (19.8%) |
Technology Access in Asbury Lake
Computing Device Access in Asbury Lake
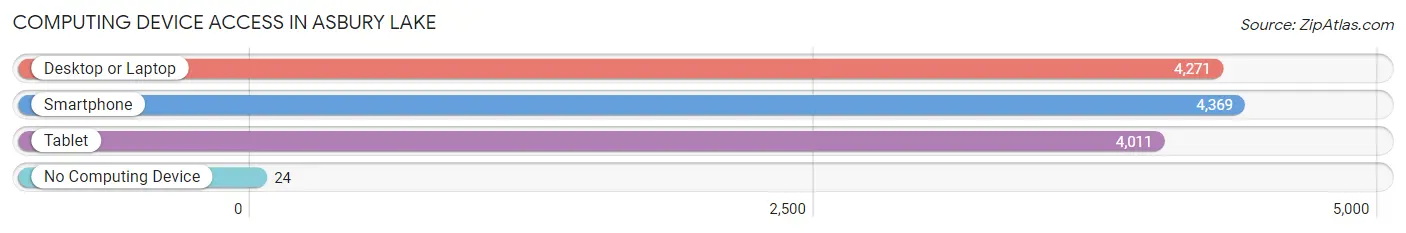
| Device Type | # Households | % Households |
| Desktop or Laptop | 4,271 | 94.3% |
| Smartphone | 4,369 | 96.5% |
| Tablet | 4,011 | 88.6% |
| No Computing Device | 24 | 0.5% |
| Total | 4,529 | 100.0% |
Internet Access in Asbury Lake
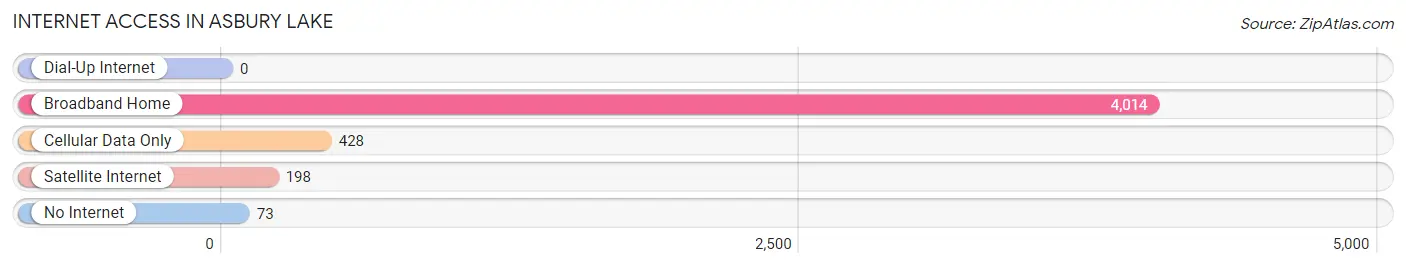
| Internet Type | # Households | % Households |
| Dial-Up Internet | 0 | 0.0% |
| Broadband Home | 4,014 | 88.6% |
| Cellular Data Only | 428 | 9.5% |
| Satellite Internet | 198 | 4.4% |
| No Internet | 73 | 1.6% |
| Total | 4,529 | 100.0% |
Asbury Lake Summary
Asbury Lake is a small town located in Clay County, Florida. It is situated on the banks of the St. Johns River, just south of Jacksonville. The town has a population of approximately 1,000 people and is part of the Jacksonville metropolitan area.
History
Asbury Lake was first settled in the late 1800s by a group of settlers from Georgia. The town was named after the Reverend Asbury, a Methodist minister who had preached in the area. The town was incorporated in 1887 and was originally known as Asbury Park. The town was renamed Asbury Lake in 1895.
The town was a popular destination for tourists in the early 1900s. It was known for its beautiful scenery and its many fishing spots. The town also had a number of resorts and hotels, which attracted visitors from all over the country.
In the 1950s, the town began to decline as the popularity of the area decreased. The town was eventually annexed by the city of Jacksonville in 1967.
Geography
Asbury Lake is located in Clay County, Florida. It is situated on the banks of the St. Johns River, just south of Jacksonville. The town is located in a rural area and is surrounded by forests and wetlands. The town is located at an elevation of about 20 feet above sea level.
The climate in Asbury Lake is humid subtropical, with hot, humid summers and mild winters. The average temperature in the summer is around 90 degrees Fahrenheit, while the average temperature in the winter is around 60 degrees Fahrenheit.
Economy
The economy of Asbury Lake is largely based on tourism and agriculture. The town is home to several resorts and hotels, which attract visitors from all over the country. The town also has a number of farms, which produce a variety of crops, including corn, soybeans, and cotton.
The town also has a number of small businesses, including restaurants, shops, and other services. The town is also home to a number of manufacturing companies, which produce a variety of products, including furniture, clothing, and electronics.
Demographics
As of the 2010 census, the population of Asbury Lake was 1,000 people. The racial makeup of the town was 94.2% White, 2.2% African American, 0.2% Native American, 0.8% Asian, 0.2% from other races, and 2.4% from two or more races. Hispanic or Latino of any race were 1.2% of the population.
The median income for a household in Asbury Lake was $37,500, and the median income for a family was $45,000. The per capita income for the town was $19,000. About 11.2% of families and 14.2% of the population were below the poverty line, including 18.2% of those under age 18 and 8.2% of those age 65 or over.
Conclusion
Asbury Lake is a small town located in Clay County, Florida. It is situated on the banks of the St. Johns River, just south of Jacksonville. The town has a population of approximately 1,000 people and is part of the Jacksonville metropolitan area. The economy of Asbury Lake is largely based on tourism and agriculture, and the town is home to several resorts and hotels, as well as a number of small businesses. The racial makeup of the town is predominantly White, with a small percentage of African American, Native American, Asian, and other races. The median income for a household in Asbury Lake is $37,500, and the per capita income for the town is $19,000.
Common Questions
What is Per Capita Income in Asbury Lake?
Per Capita income in Asbury Lake is $43,130.
What is the Median Family Income in Asbury Lake?
Median Family Income in Asbury Lake is $114,221.
What is the Median Household income in Asbury Lake?
Median Household Income in Asbury Lake is $102,454.
What is Income or Wage Gap in Asbury Lake?
Income or Wage Gap in Asbury Lake is 42.7%.
Women in Asbury Lake earn 57.3 cents for every dollar earned by a man.
What is Inequality or Gini Index in Asbury Lake?
Inequality or Gini Index in Asbury Lake is 0.37.
What is the Total Population of Asbury Lake?
Total Population of Asbury Lake is 12,515.
What is the Total Male Population of Asbury Lake?
Total Male Population of Asbury Lake is 6,472.
What is the Total Female Population of Asbury Lake?
Total Female Population of Asbury Lake is 6,043.
What is the Ratio of Males per 100 Females in Asbury Lake?
There are 107.10 Males per 100 Females in Asbury Lake.
What is the Ratio of Females per 100 Males in Asbury Lake?
There are 93.37 Females per 100 Males in Asbury Lake.
What is the Median Population Age in Asbury Lake?
Median Population Age in Asbury Lake is 38.6 Years.
What is the Average Family Size in Asbury Lake
Average Family Size in Asbury Lake is 3.1 People.
What is the Average Household Size in Asbury Lake
Average Household Size in Asbury Lake is 2.8 People.
How Large is the Labor Force in Asbury Lake?
There are 6,359 People in the Labor Forcein in Asbury Lake.
What is the Percentage of People in the Labor Force in Asbury Lake?
66.6% of People are in the Labor Force in Asbury Lake.
What is the Unemployment Rate in Asbury Lake?
Unemployment Rate in Asbury Lake is 1.3%.