Prairieville, LA Map & Demographics
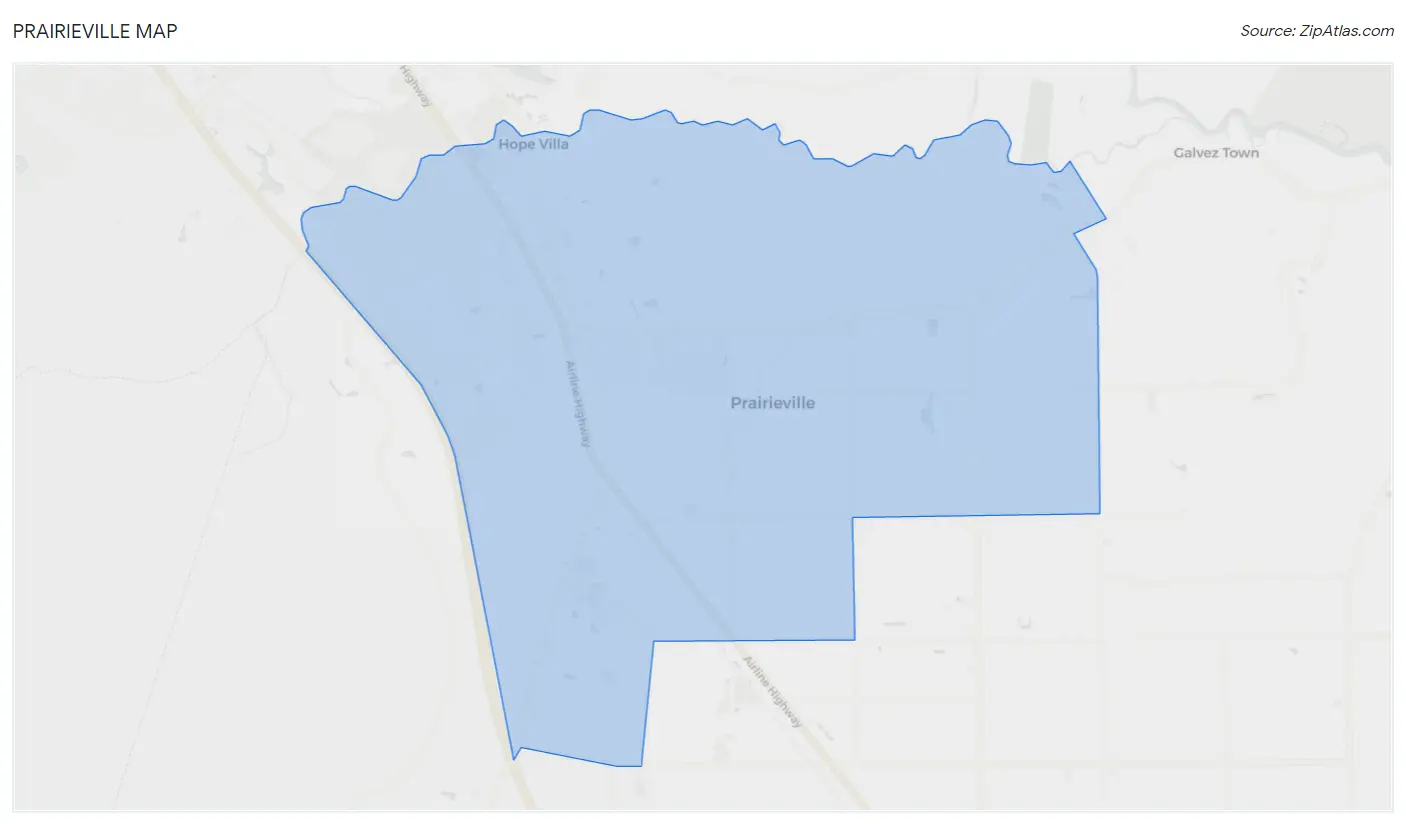
Prairieville Map
Prairieville Overview
$46,811
PER CAPITA INCOME
$124,654
AVG FAMILY INCOME
$111,927
AVG HOUSEHOLD INCOME
41.9%
WAGE / INCOME GAP [ % ]
58.1¢/ $1
WAGE / INCOME GAP [ $ ]
0.37
INEQUALITY / GINI INDEX
34,215
TOTAL POPULATION
16,373
MALE POPULATION
17,842
FEMALE POPULATION
91.77
MALES / 100 FEMALES
108.97
FEMALES / 100 MALES
36.6
MEDIAN AGE
3.2
AVG FAMILY SIZE
2.8
AVG HOUSEHOLD SIZE
18,588
LABOR FORCE [ PEOPLE ]
71.1%
PERCENT IN LABOR FORCE
2.9%
UNEMPLOYMENT RATE
Prairieville Zip Codes
Prairieville Area Codes
Income in Prairieville
Income Overview in Prairieville
Per Capita Income in Prairieville is $46,811, while median incomes of families and households are $124,654 and $111,927 respectively.
| Characteristic | Number | Measure |
| Per Capita Income | 34,215 | $46,811 |
| Median Family Income | 9,658 | $124,654 |
| Mean Family Income | 9,658 | $139,673 |
| Median Household Income | 12,238 | $111,927 |
| Mean Household Income | 12,238 | $130,946 |
| Income Deficit | 9,658 | $0 |
| Wage / Income Gap (%) | 34,215 | 41.93% |
| Wage / Income Gap ($) | 34,215 | 58.07¢ per $1 |
| Gini / Inequality Index | 34,215 | 0.37 |
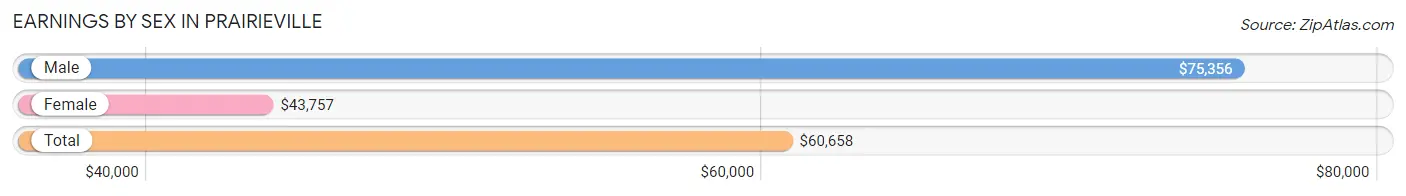
Earnings by Sex in Prairieville
Average Earnings in Prairieville are $60,658, $75,356 for men and $43,757 for women, a difference of 41.9%.
| Sex | Number | Average Earnings |
| Male | 9,761 (52.2%) | $75,356 |
| Female | 8,945 (47.8%) | $43,757 |
| Total | 18,706 (100.0%) | $60,658 |
Earnings by Sex by Income Bracket in Prairieville
The most common earnings brackets in Prairieville are $100,000+ for men (3,546 | 36.3%) and $55,000 to $64,999 for women (1,233 | 13.8%).
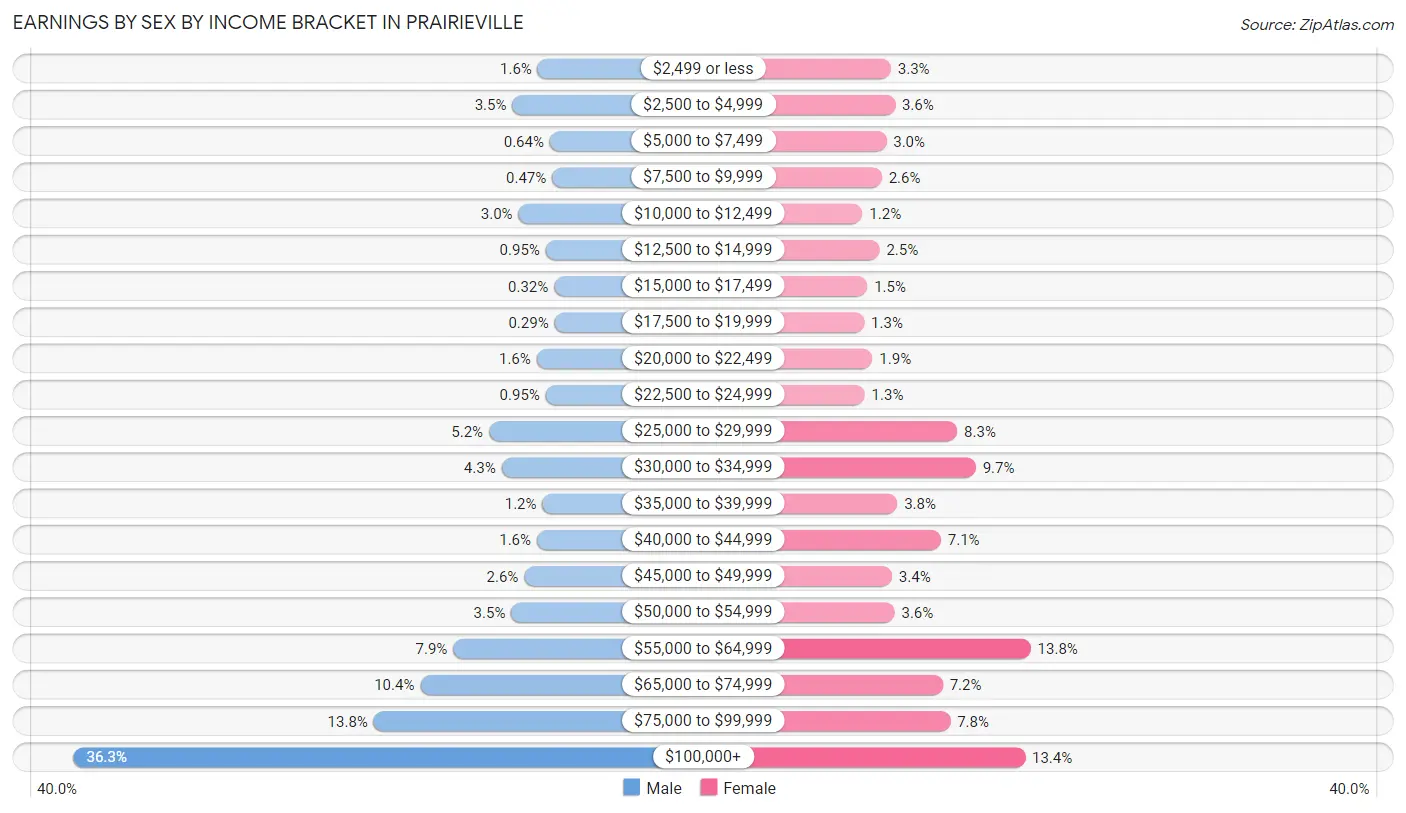
| Income | Male | Female |
| $2,499 or less | 151 (1.5%) | 295 (3.3%) |
| $2,500 to $4,999 | 337 (3.5%) | 323 (3.6%) |
| $5,000 to $7,499 | 62 (0.6%) | 265 (3.0%) |
| $7,500 to $9,999 | 46 (0.5%) | 234 (2.6%) |
| $10,000 to $12,499 | 292 (3.0%) | 105 (1.2%) |
| $12,500 to $14,999 | 93 (0.9%) | 219 (2.5%) |
| $15,000 to $17,499 | 31 (0.3%) | 137 (1.5%) |
| $17,500 to $19,999 | 28 (0.3%) | 116 (1.3%) |
| $20,000 to $22,499 | 159 (1.6%) | 172 (1.9%) |
| $22,500 to $24,999 | 93 (0.9%) | 120 (1.3%) |
| $25,000 to $29,999 | 508 (5.2%) | 740 (8.3%) |
| $30,000 to $34,999 | 416 (4.3%) | 864 (9.7%) |
| $35,000 to $39,999 | 117 (1.2%) | 338 (3.8%) |
| $40,000 to $44,999 | 157 (1.6%) | 631 (7.0%) |
| $45,000 to $49,999 | 250 (2.6%) | 302 (3.4%) |
| $50,000 to $54,999 | 345 (3.5%) | 320 (3.6%) |
| $55,000 to $64,999 | 769 (7.9%) | 1,233 (13.8%) |
| $65,000 to $74,999 | 1,010 (10.3%) | 643 (7.2%) |
| $75,000 to $99,999 | 1,351 (13.8%) | 693 (7.7%) |
| $100,000+ | 3,546 (36.3%) | 1,195 (13.4%) |
| Total | 9,761 (100.0%) | 8,945 (100.0%) |
Earnings by Sex by Educational Attainment in Prairieville
Average earnings in Prairieville are $82,524 for men and $53,867 for women, a difference of 34.7%. Men with an educational attainment of graduate degree enjoy the highest average annual earnings of $113,466, while those with less than high school education earn the least with $29,121. Women with an educational attainment of bachelor's degree earn the most with the average annual earnings of $82,071, while those with high school diploma education have the smallest earnings of $37,721.
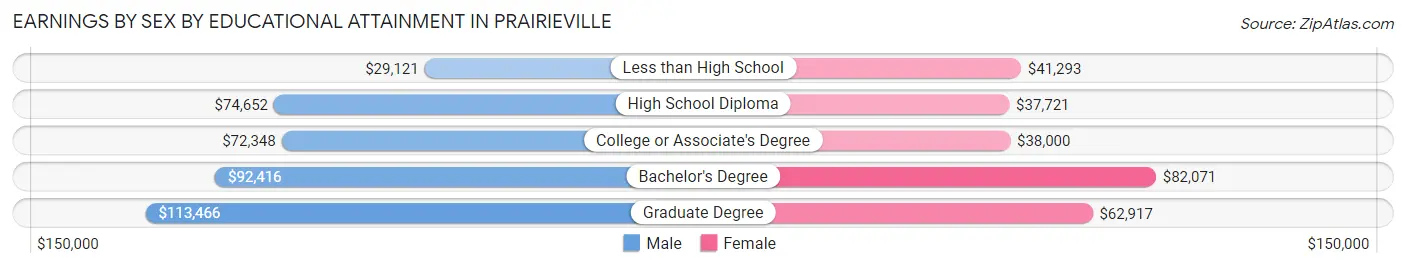
| Educational Attainment | Male Income | Female Income |
| Less than High School | $29,121 | $41,293 |
| High School Diploma | $74,652 | $37,721 |
| College or Associate's Degree | $72,348 | $38,000 |
| Bachelor's Degree | $92,416 | $82,071 |
| Graduate Degree | $113,466 | $62,917 |
| Total | $82,524 | $53,867 |
Family Income in Prairieville
Family Income Brackets in Prairieville
According to the Prairieville family income data, there are 2,511 families falling into the $100,000 to $149,999 income range, which is the most common income bracket and makes up 26.0% of all families.
| Income Bracket | # Families | % Families |
| Less than $10,000 | 68 | 0.7% |
| $10,000 to $14,999 | 0 | 0.0% |
| $15,000 to $24,999 | 212 | 2.2% |
| $25,000 to $34,999 | 270 | 2.8% |
| $35,000 to $49,999 | 444 | 4.6% |
| $50,000 to $74,999 | 1,169 | 12.1% |
| $75,000 to $99,999 | 1,198 | 12.4% |
| $100,000 to $149,999 | 2,511 | 26.0% |
| $150,000 to $199,999 | 1,632 | 16.9% |
| $200,000+ | 2,154 | 22.3% |
Family Income by Famaliy Size in Prairieville
6-person families (99 | 1.0%) account for the highest median family income in Prairieville with $232,287 per family, while 2-person families (3,472 | 35.9%) have the highest median income of $55,586 per family member.
| Income Bracket | # Families | Median Income |
| 2-Person Families | 3,472 (35.9%) | $111,173 |
| 3-Person Families | 3,139 (32.5%) | $107,474 |
| 4-Person Families | 1,821 (18.9%) | $150,568 |
| 5-Person Families | 994 (10.3%) | $168,929 |
| 6-Person Families | 99 (1.0%) | $232,287 |
| 7+ Person Families | 133 (1.4%) | $186,086 |
| Total | 9,658 (100.0%) | $124,654 |
Family Income by Number of Earners in Prairieville
The median family income in Prairieville is $124,654, with families comprising 3+ earners (959) having the highest median family income of $163,587, while families with no earners (1,156) have the lowest median family income of $56,725, accounting for 9.9% and 12.0% of families, respectively.
| Number of Earners | # Families | Median Income |
| No Earners | 1,156 (12.0%) | $56,725 |
| 1 Earner | 2,558 (26.5%) | $94,628 |
| 2 Earners | 4,985 (51.6%) | $153,637 |
| 3+ Earners | 959 (9.9%) | $163,587 |
| Total | 9,658 (100.0%) | $124,654 |
Household Income in Prairieville
Household Income Brackets in Prairieville
With 2,876 households falling in the category, the $100,000 to $149,999 income range is the most frequent in Prairieville, accounting for 23.5% of all households. In contrast, only 49 households (0.4%) fall into the $10,000 to $14,999 income bracket, making it the least populous group.
| Income Bracket | # Households | % Households |
| Less than $10,000 | 159 | 1.3% |
| $10,000 to $14,999 | 49 | 0.4% |
| $15,000 to $24,999 | 318 | 2.6% |
| $25,000 to $34,999 | 893 | 7.3% |
| $35,000 to $49,999 | 771 | 6.3% |
| $50,000 to $74,999 | 1,481 | 12.1% |
| $75,000 to $99,999 | 1,603 | 13.1% |
| $100,000 to $149,999 | 2,876 | 23.5% |
| $150,000 to $199,999 | 1,738 | 14.2% |
| $200,000+ | 2,350 | 19.2% |
Household Income by Householder Age in Prairieville
The median household income in Prairieville is $111,927, with the highest median household income of $134,444 found in the 45 to 64 years age bracket for the primary householder. A total of 4,230 households (34.6%) fall into this category. Meanwhile, the 15 to 24 years age bracket for the primary householder has the lowest median household income of $0, with 169 households (1.4%) in this group.
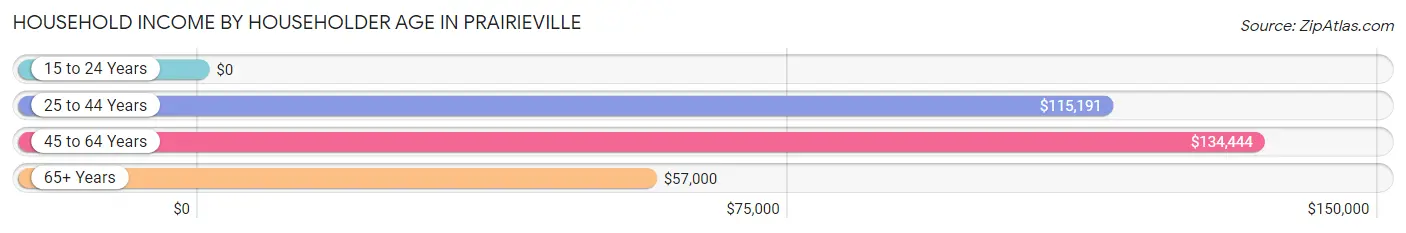
| Income Bracket | # Households | Median Income |
| 15 to 24 Years | 169 (1.4%) | $0 |
| 25 to 44 Years | 5,365 (43.8%) | $115,191 |
| 45 to 64 Years | 4,230 (34.6%) | $134,444 |
| 65+ Years | 2,474 (20.2%) | $57,000 |
| Total | 12,238 (100.0%) | $111,927 |
Poverty in Prairieville
Income Below Poverty by Sex and Age in Prairieville
With 0.7% poverty level for males and 4.0% for females among the residents of Prairieville, 16 and 17 year old males and 5 year old females are the most vulnerable to poverty, with 19 males (3.6%) and 64 females (33.9%) in their respective age groups living below the poverty level.
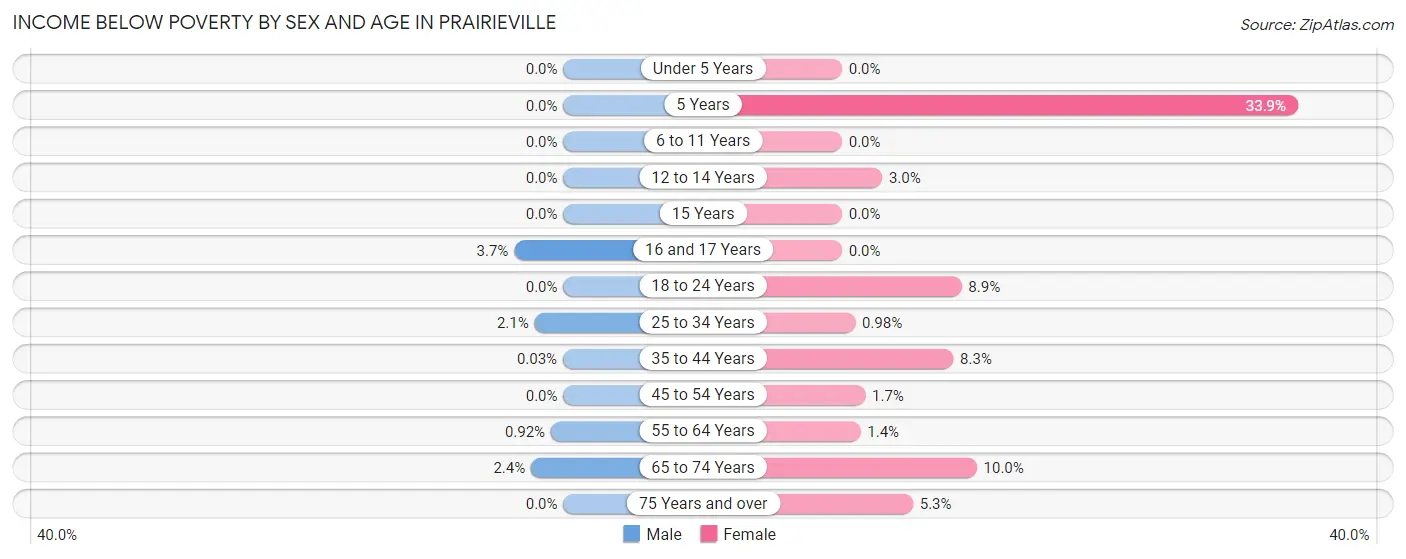
| Age Bracket | Male | Female |
| Under 5 Years | 0 (0.0%) | 0 (0.0%) |
| 5 Years | 0 (0.0%) | 64 (33.9%) |
| 6 to 11 Years | 0 (0.0%) | 0 (0.0%) |
| 12 to 14 Years | 0 (0.0%) | 21 (3.0%) |
| 15 Years | 0 (0.0%) | 0 (0.0%) |
| 16 and 17 Years | 19 (3.6%) | 0 (0.0%) |
| 18 to 24 Years | 0 (0.0%) | 128 (8.9%) |
| 25 to 34 Years | 52 (2.1%) | 23 (1.0%) |
| 35 to 44 Years | 1 (0.0%) | 232 (8.3%) |
| 45 to 54 Years | 0 (0.0%) | 38 (1.7%) |
| 55 to 64 Years | 18 (0.9%) | 29 (1.4%) |
| 65 to 74 Years | 33 (2.4%) | 152 (10.0%) |
| 75 Years and over | 0 (0.0%) | 29 (5.3%) |
| Total | 123 (0.7%) | 716 (4.0%) |
Income Above Poverty by Sex and Age in Prairieville
According to the poverty statistics in Prairieville, males aged under 5 years and females aged under 5 years are the age groups that are most secure financially, with 100.0% of males and 100.0% of females in these age groups living above the poverty line.
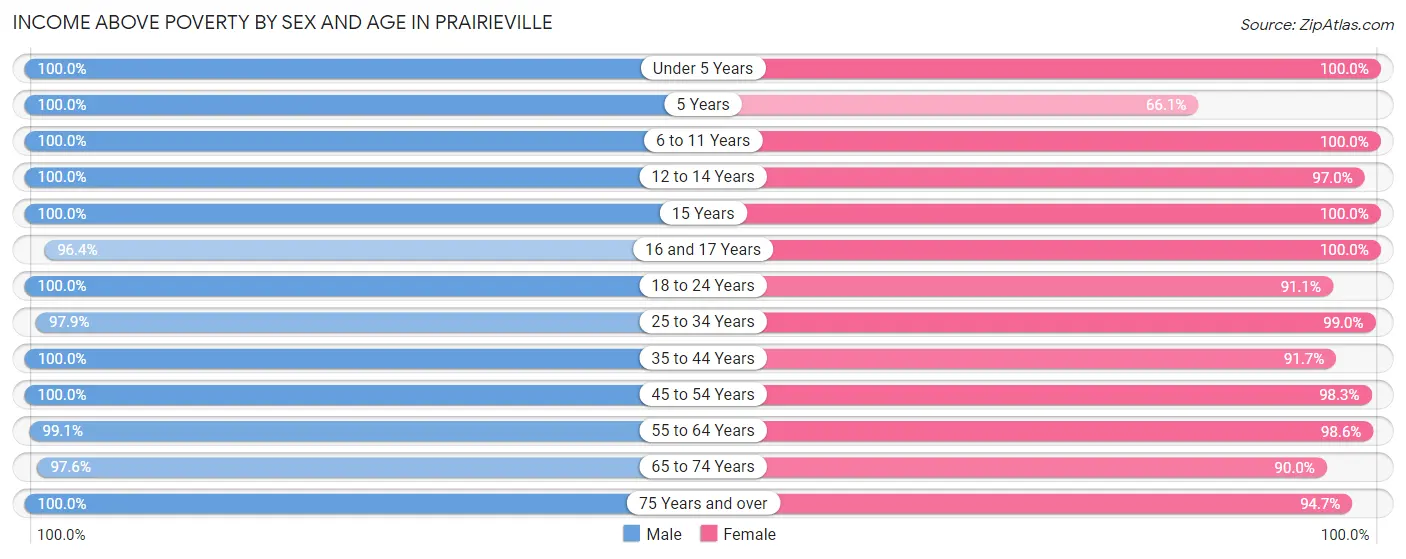
| Age Bracket | Male | Female |
| Under 5 Years | 1,173 (100.0%) | 1,242 (100.0%) |
| 5 Years | 404 (100.0%) | 125 (66.1%) |
| 6 to 11 Years | 1,305 (100.0%) | 1,735 (100.0%) |
| 12 to 14 Years | 814 (100.0%) | 684 (97.0%) |
| 15 Years | 203 (100.0%) | 218 (100.0%) |
| 16 and 17 Years | 501 (96.4%) | 705 (100.0%) |
| 18 to 24 Years | 1,038 (100.0%) | 1,314 (91.1%) |
| 25 to 34 Years | 2,374 (97.9%) | 2,329 (99.0%) |
| 35 to 44 Years | 2,946 (100.0%) | 2,572 (91.7%) |
| 45 to 54 Years | 1,656 (100.0%) | 2,161 (98.3%) |
| 55 to 64 Years | 1,932 (99.1%) | 2,075 (98.6%) |
| 65 to 74 Years | 1,340 (97.6%) | 1,367 (90.0%) |
| 75 Years and over | 559 (100.0%) | 521 (94.7%) |
| Total | 16,245 (99.3%) | 17,048 (96.0%) |
Income Below Poverty Among Married-Couple Families in Prairieville
The poverty statistics for married-couple families in Prairieville show that 0.3% or 24 of the total 7,844 families live below the poverty line. Families with no children have the highest poverty rate of 0.7%, comprising of 24 families. On the other hand, families with 1 or 2 children have the lowest poverty rate of 0.0%, which includes 0 families.
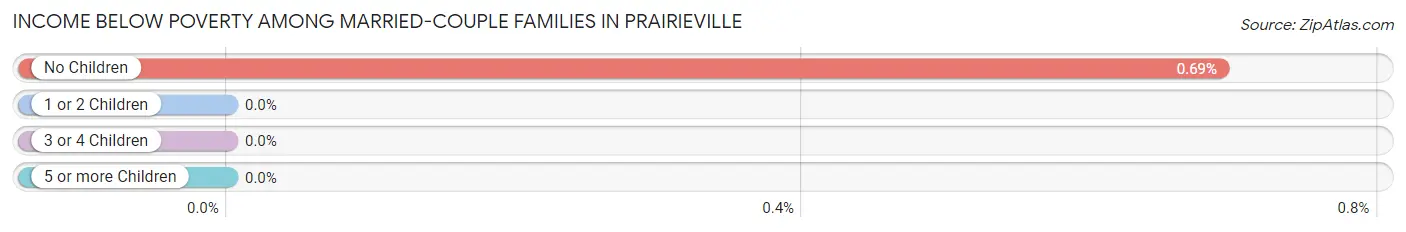
| Children | Above Poverty | Below Poverty |
| No Children | 3,452 (99.3%) | 24 (0.7%) |
| 1 or 2 Children | 3,857 (100.0%) | 0 (0.0%) |
| 3 or 4 Children | 385 (100.0%) | 0 (0.0%) |
| 5 or more Children | 126 (100.0%) | 0 (0.0%) |
| Total | 7,820 (99.7%) | 24 (0.3%) |
Income Below Poverty Among Single-Parent Households in Prairieville
| Children | Single Father | Single Mother |
| No Children | 0 (0.0%) | 29 (8.3%) |
| 1 or 2 Children | 0 (0.0%) | 89 (8.8%) |
| 3 or 4 Children | 0 (0.0%) | 0 (0.0%) |
| 5 or more Children | 0 (0.0%) | 0 (0.0%) |
| Total | 0 (0.0%) | 118 (8.6%) |
Income Below Poverty Among Married-Couple vs Single-Parent Households in Prairieville
The poverty data for Prairieville shows that 24 of the married-couple family households (0.3%) and 118 of the single-parent households (6.5%) are living below the poverty level. Within the married-couple family households, those with no children have the highest poverty rate, with 24 households (0.7%) falling below the poverty line. Among the single-parent households, those with 1 or 2 children have the highest poverty rate, with 89 household (7.4%) living below poverty.
| Children | Married-Couple Families | Single-Parent Households |
| No Children | 24 (0.7%) | 29 (5.1%) |
| 1 or 2 Children | 0 (0.0%) | 89 (7.4%) |
| 3 or 4 Children | 0 (0.0%) | 0 (0.0%) |
| 5 or more Children | 0 (0.0%) | 0 (0.0%) |
| Total | 24 (0.3%) | 118 (6.5%) |
Race in Prairieville
The most populous races in Prairieville are White / Caucasian (26,624 | 77.8%), Black / African American (4,474 | 13.1%), and Two or more Races (1,741 | 5.1%).
| Race | # Population | % Population |
| Asian | 684 | 2.0% |
| Black / African American | 4,474 | 13.1% |
| Hawaiian / Pacific | 0 | 0.0% |
| Hispanic or Latino | 839 | 2.5% |
| Native / Alaskan | 13 | 0.0% |
| White / Caucasian | 26,624 | 77.8% |
| Two or more Races | 1,741 | 5.1% |
| Some other Race | 679 | 2.0% |
| Total | 34,215 | 100.0% |
Ancestry in Prairieville
The most populous ancestries reported in Prairieville are French (5,136 | 15.0%), English (4,079 | 11.9%), German (3,765 | 11.0%), American (3,156 | 9.2%), and Italian (3,077 | 9.0%), together accounting for 56.1% of all Prairieville residents.
| Ancestry | # Population | % Population |
| African | 306 | 0.9% |
| American | 3,156 | 9.2% |
| Arab | 86 | 0.3% |
| Bhutanese | 100 | 0.3% |
| Brazilian | 2 | 0.0% |
| British | 89 | 0.3% |
| Burmese | 63 | 0.2% |
| Cajun | 342 | 1.0% |
| Canadian | 31 | 0.1% |
| Central American | 267 | 0.8% |
| Cherokee | 25 | 0.1% |
| Chickasaw | 72 | 0.2% |
| Colombian | 33 | 0.1% |
| Croatian | 43 | 0.1% |
| Cuban | 67 | 0.2% |
| Dutch | 88 | 0.3% |
| English | 4,079 | 11.9% |
| Ethiopian | 17 | 0.1% |
| European | 378 | 1.1% |
| Filipino | 57 | 0.2% |
| Finnish | 10 | 0.0% |
| French | 5,136 | 15.0% |
| French Canadian | 515 | 1.5% |
| German | 3,765 | 11.0% |
| Honduran | 144 | 0.4% |
| Houma | 9 | 0.0% |
| Hungarian | 503 | 1.5% |
| Indian (Asian) | 203 | 0.6% |
| Iranian | 213 | 0.6% |
| Irish | 2,821 | 8.2% |
| Italian | 3,077 | 9.0% |
| Korean | 159 | 0.5% |
| Lebanese | 33 | 0.1% |
| Malaysian | 19 | 0.1% |
| Mexican | 177 | 0.5% |
| Mexican American Indian | 13 | 0.0% |
| Moroccan | 53 | 0.2% |
| Northern European | 201 | 0.6% |
| Norwegian | 21 | 0.1% |
| Pakistani | 50 | 0.2% |
| Polish | 261 | 0.8% |
| Puerto Rican | 39 | 0.1% |
| Romanian | 20 | 0.1% |
| Russian | 27 | 0.1% |
| Salvadoran | 123 | 0.4% |
| Scandinavian | 11 | 0.0% |
| Scotch-Irish | 238 | 0.7% |
| Scottish | 118 | 0.3% |
| Sioux | 169 | 0.5% |
| Slavic | 23 | 0.1% |
| South American | 33 | 0.1% |
| Spanish | 254 | 0.7% |
| Sri Lankan | 410 | 1.2% |
| Subsaharan African | 323 | 0.9% |
| Swedish | 188 | 0.5% |
| Thai | 4 | 0.0% |
| Turkish | 58 | 0.2% |
| Welsh | 81 | 0.2% | View All 58 Rows |
Immigrants in Prairieville
The most numerous immigrant groups reported in Prairieville came from Asia (712 | 2.1%), South Eastern Asia (323 | 0.9%), Latin America (315 | 0.9%), Central America (282 | 0.8%), and South Central Asia (279 | 0.8%), together accounting for 5.6% of all Prairieville residents.
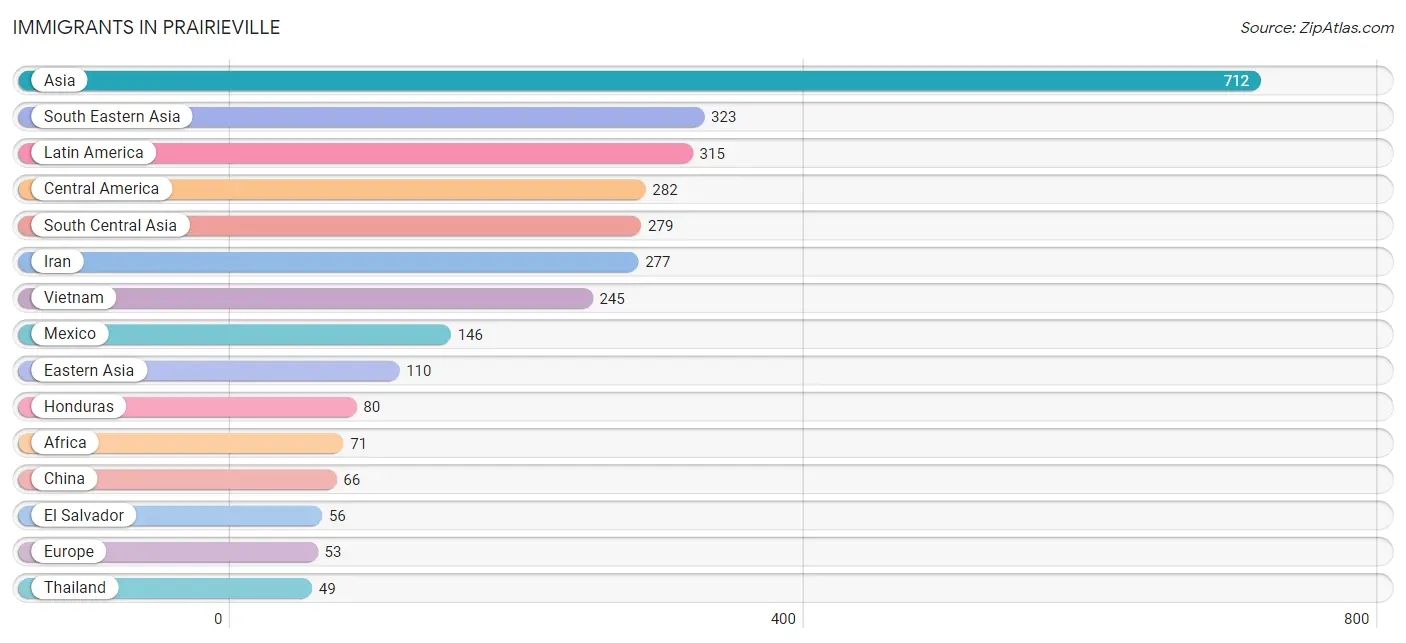
| Immigration Origin | # Population | % Population |
| Africa | 71 | 0.2% |
| Asia | 712 | 2.1% |
| Canada | 36 | 0.1% |
| Central America | 282 | 0.8% |
| China | 66 | 0.2% |
| Colombia | 33 | 0.1% |
| Eastern Africa | 17 | 0.1% |
| Eastern Asia | 110 | 0.3% |
| Eastern Europe | 27 | 0.1% |
| El Salvador | 56 | 0.2% |
| Ethiopia | 17 | 0.1% |
| Europe | 53 | 0.2% |
| Ghana | 32 | 0.1% |
| Honduras | 80 | 0.2% |
| India | 2 | 0.0% |
| Iran | 277 | 0.8% |
| Japan | 44 | 0.1% |
| Latin America | 315 | 0.9% |
| Mexico | 146 | 0.4% |
| Morocco | 22 | 0.1% |
| Northern Africa | 22 | 0.1% |
| Northern Europe | 26 | 0.1% |
| Philippines | 29 | 0.1% |
| Russia | 27 | 0.1% |
| South America | 33 | 0.1% |
| South Central Asia | 279 | 0.8% |
| South Eastern Asia | 323 | 0.9% |
| Taiwan | 23 | 0.1% |
| Thailand | 49 | 0.1% |
| Vietnam | 245 | 0.7% |
| Western Africa | 32 | 0.1% | View All 31 Rows |
Sex and Age in Prairieville
Sex and Age in Prairieville
The most populous age groups in Prairieville are 40 to 44 Years (1,576 | 9.6%) for men and 35 to 39 Years (1,584 | 8.9%) for women.
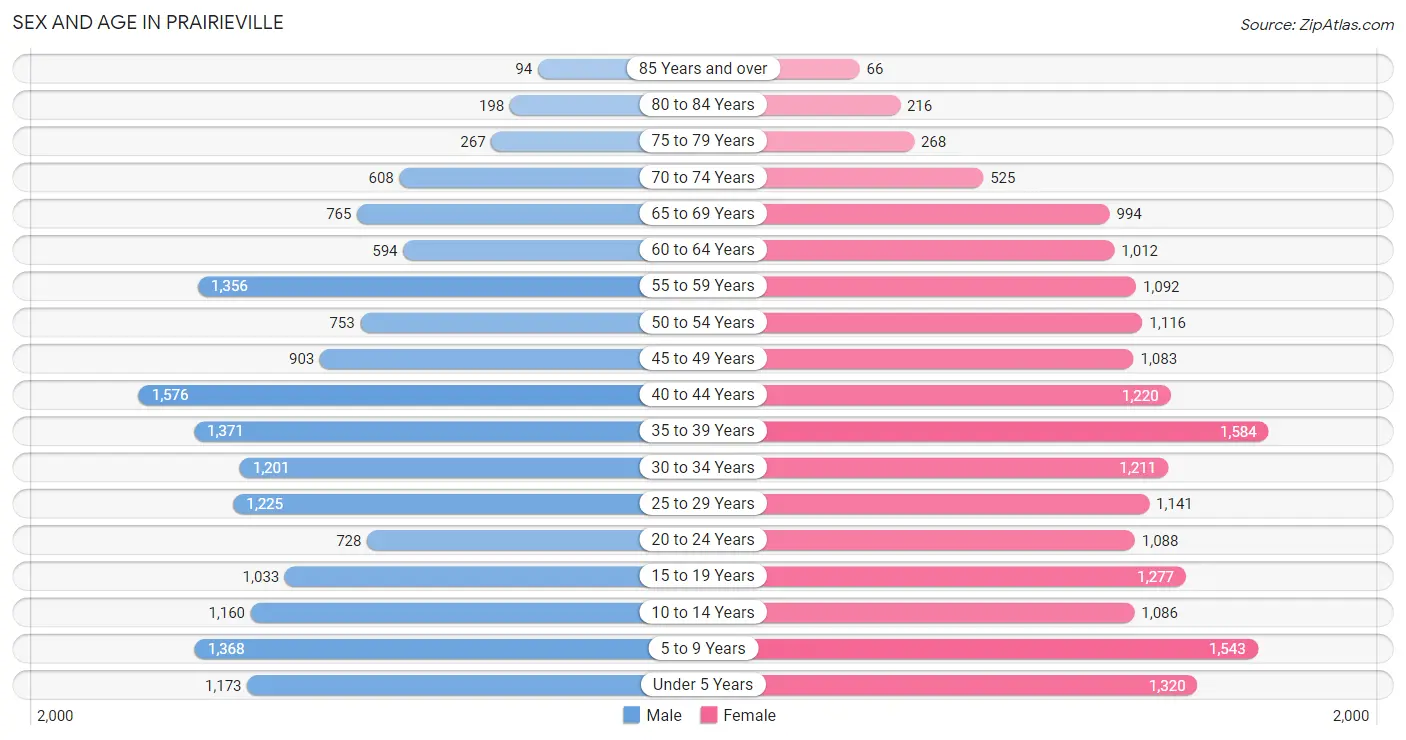
| Age Bracket | Male | Female |
| Under 5 Years | 1,173 (7.2%) | 1,320 (7.4%) |
| 5 to 9 Years | 1,368 (8.4%) | 1,543 (8.6%) |
| 10 to 14 Years | 1,160 (7.1%) | 1,086 (6.1%) |
| 15 to 19 Years | 1,033 (6.3%) | 1,277 (7.2%) |
| 20 to 24 Years | 728 (4.4%) | 1,088 (6.1%) |
| 25 to 29 Years | 1,225 (7.5%) | 1,141 (6.4%) |
| 30 to 34 Years | 1,201 (7.3%) | 1,211 (6.8%) |
| 35 to 39 Years | 1,371 (8.4%) | 1,584 (8.9%) |
| 40 to 44 Years | 1,576 (9.6%) | 1,220 (6.8%) |
| 45 to 49 Years | 903 (5.5%) | 1,083 (6.1%) |
| 50 to 54 Years | 753 (4.6%) | 1,116 (6.2%) |
| 55 to 59 Years | 1,356 (8.3%) | 1,092 (6.1%) |
| 60 to 64 Years | 594 (3.6%) | 1,012 (5.7%) |
| 65 to 69 Years | 765 (4.7%) | 994 (5.6%) |
| 70 to 74 Years | 608 (3.7%) | 525 (2.9%) |
| 75 to 79 Years | 267 (1.6%) | 268 (1.5%) |
| 80 to 84 Years | 198 (1.2%) | 216 (1.2%) |
| 85 Years and over | 94 (0.6%) | 66 (0.4%) |
| Total | 16,373 (100.0%) | 17,842 (100.0%) |
Families and Households in Prairieville
Median Family Size in Prairieville
The median family size in Prairieville is 3.17 persons per family, with single male/father families (450 | 4.7%) accounting for the largest median family size of 3.38 persons per family. On the other hand, married-couple families (7,844 | 81.2%) represent the smallest median family size with 3.16 persons per family.
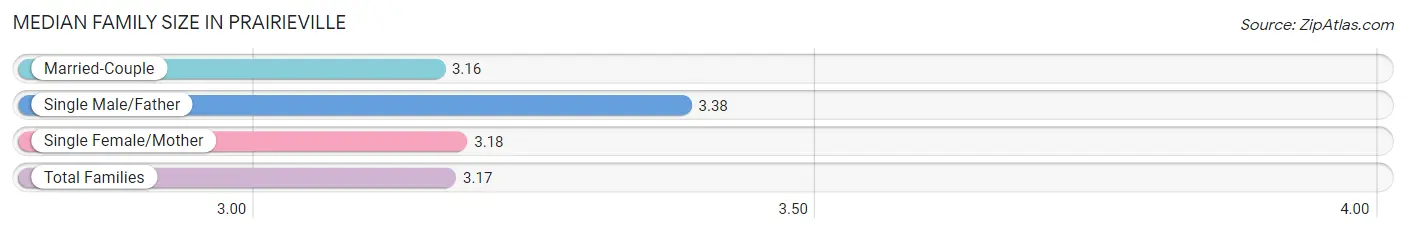
| Family Type | # Families | Family Size |
| Married-Couple | 7,844 (81.2%) | 3.16 |
| Single Male/Father | 450 (4.7%) | 3.38 |
| Single Female/Mother | 1,364 (14.1%) | 3.18 |
| Total Families | 9,658 (100.0%) | 3.17 |
Median Household Size in Prairieville
The median household size in Prairieville is 2.80 persons per household, with single male/father households (450 | 3.7%) accounting for the largest median household size of 3.61 persons per household. non-family households (2,580 | 21.1%) represent the smallest median household size with 1.25 persons per household.
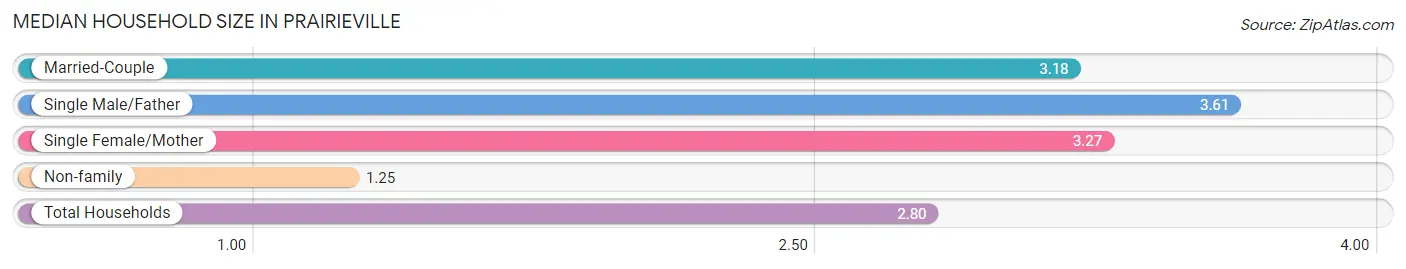
| Household Type | # Households | Household Size |
| Married-Couple | 7,844 (64.1%) | 3.18 |
| Single Male/Father | 450 (3.7%) | 3.61 |
| Single Female/Mother | 1,364 (11.2%) | 3.27 |
| Non-family | 2,580 (21.1%) | 1.25 |
| Total Households | 12,238 (100.0%) | 2.80 |
Household Size by Marriage Status in Prairieville
Out of a total of 12,238 households in Prairieville, 9,658 (78.9%) are family households, while 2,580 (21.1%) are nonfamily households. The most numerous type of family households are 2-person households, comprising 3,388, and the most common type of nonfamily households are 1-person households, comprising 2,088.
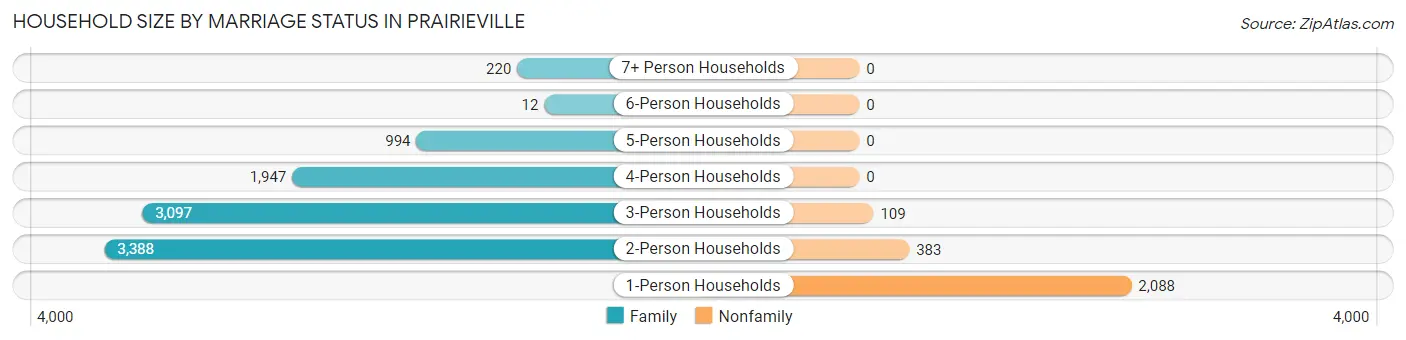
| Household Size | Family Households | Nonfamily Households |
| 1-Person Households | - | 2,088 (17.1%) |
| 2-Person Households | 3,388 (27.7%) | 383 (3.1%) |
| 3-Person Households | 3,097 (25.3%) | 109 (0.9%) |
| 4-Person Households | 1,947 (15.9%) | 0 (0.0%) |
| 5-Person Households | 994 (8.1%) | 0 (0.0%) |
| 6-Person Households | 12 (0.1%) | 0 (0.0%) |
| 7+ Person Households | 220 (1.8%) | 0 (0.0%) |
| Total | 9,658 (78.9%) | 2,580 (21.1%) |
Female Fertility in Prairieville
Fertility by Age in Prairieville
Average fertility rate in Prairieville is 67.0 births per 1,000 women. Women in the age bracket of 20 to 34 years have the highest fertility rate with 118.0 births per 1,000 women. Women in the age bracket of 20 to 34 years acount for 66.7% of all women with births.
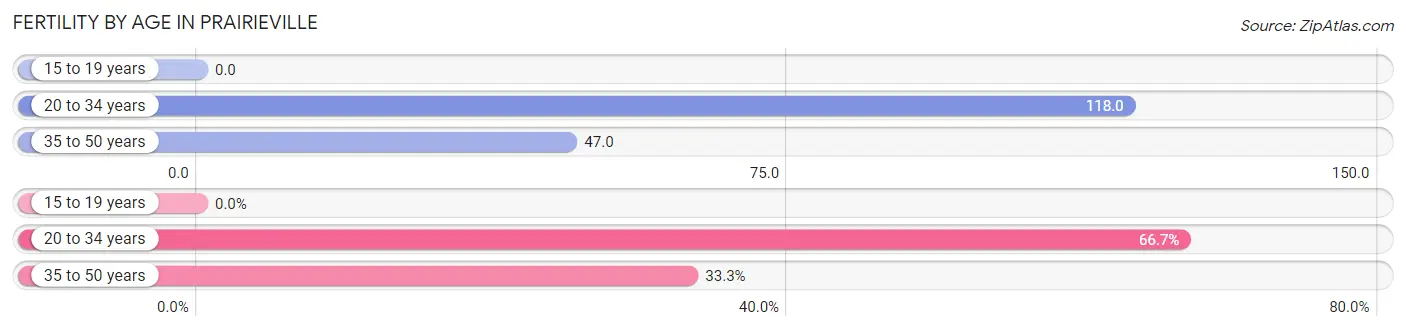
| Age Bracket | Women with Births | Births / 1,000 Women |
| 15 to 19 years | 0 (0.0%) | 0.0 |
| 20 to 34 years | 405 (66.7%) | 118.0 |
| 35 to 50 years | 202 (33.3%) | 47.0 |
| Total | 607 (100.0%) | 67.0 |
Fertility by Age by Marriage Status in Prairieville
91.1% of women with births (607) in Prairieville are married. The highest percentage of unmarried women with births falls into 35 to 50 years age bracket with 26.7% of them unmarried at the time of birth, while the lowest percentage of unmarried women with births belong to 20 to 34 years age bracket with 0.0% of them unmarried.
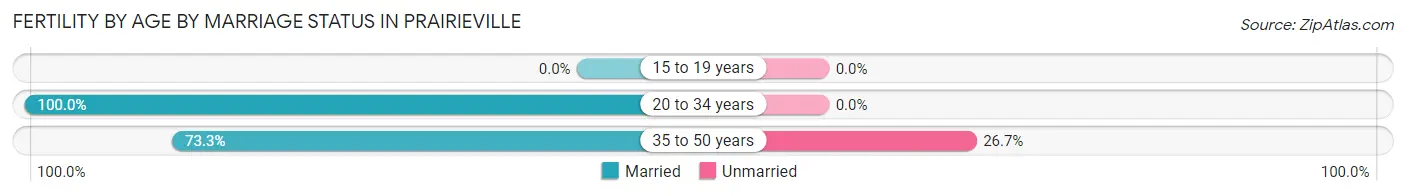
| Age Bracket | Married | Unmarried |
| 15 to 19 years | 0 (0.0%) | 0 (0.0%) |
| 20 to 34 years | 405 (100.0%) | 0 (0.0%) |
| 35 to 50 years | 148 (73.3%) | 54 (26.7%) |
| Total | 553 (91.1%) | 54 (8.9%) |
Fertility by Education in Prairieville
Average fertility rate in Prairieville is 67.0 births per 1,000 women. Women with the education attainment of bachelor's degree have the highest fertility rate of 88.0 births per 1,000 women, while women with the education attainment of graduate degree have the lowest fertility at 34.0 births per 1,000 women. Women with the education attainment of college or associate's degree represent 31.6% of all women with births.
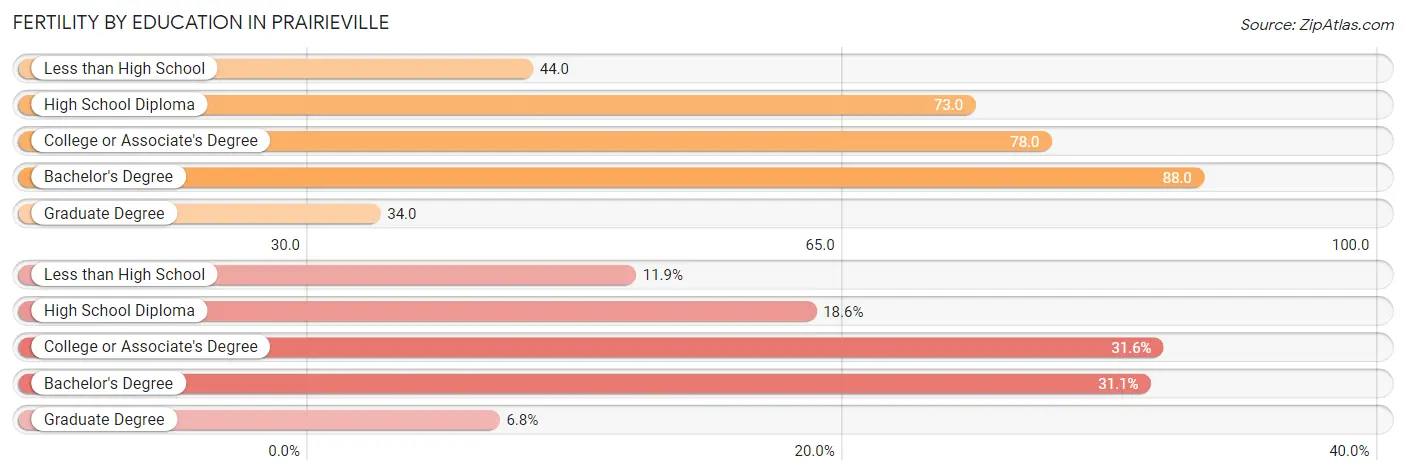
| Educational Attainment | Women with Births | Births / 1,000 Women |
| Less than High School | 72 (11.9%) | 44.0 |
| High School Diploma | 113 (18.6%) | 73.0 |
| College or Associate's Degree | 192 (31.6%) | 78.0 |
| Bachelor's Degree | 189 (31.1%) | 88.0 |
| Graduate Degree | 41 (6.8%) | 34.0 |
| Total | 607 (100.0%) | 67.0 |
Fertility by Education by Marriage Status in Prairieville
8.9% of women with births in Prairieville are unmarried. Women with the educational attainment of less than high school are most likely to be married with 100.0% of them married at childbirth, while women with the educational attainment of high school diploma are least likely to be married with 33.6% of them unmarried at childbirth.
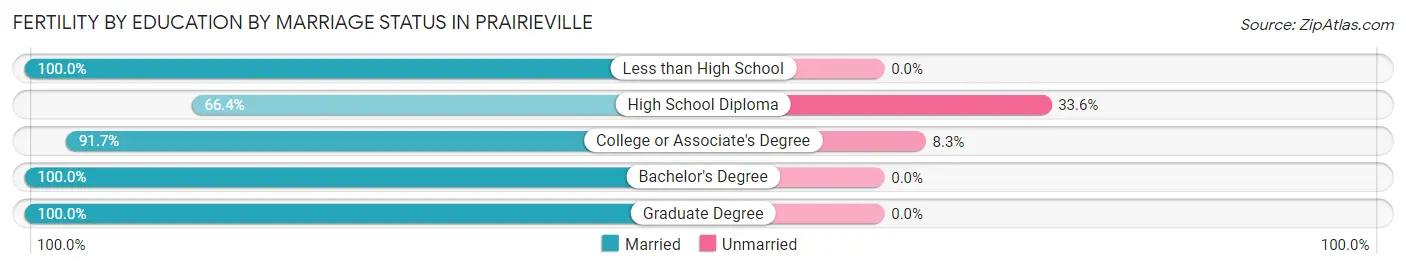
| Educational Attainment | Married | Unmarried |
| Less than High School | 72 (100.0%) | 0 (0.0%) |
| High School Diploma | 75 (66.4%) | 38 (33.6%) |
| College or Associate's Degree | 176 (91.7%) | 16 (8.3%) |
| Bachelor's Degree | 189 (100.0%) | 0 (0.0%) |
| Graduate Degree | 41 (100.0%) | 0 (0.0%) |
| Total | 553 (91.1%) | 54 (8.9%) |
Employment Characteristics in Prairieville
Employment by Class of Employer in Prairieville
Among the 17,735 employed individuals in Prairieville, private company employees (12,398 | 69.9%), state government employees (1,339 | 7.5%), and local government employees (1,136 | 6.4%) make up the most common classes of employment.
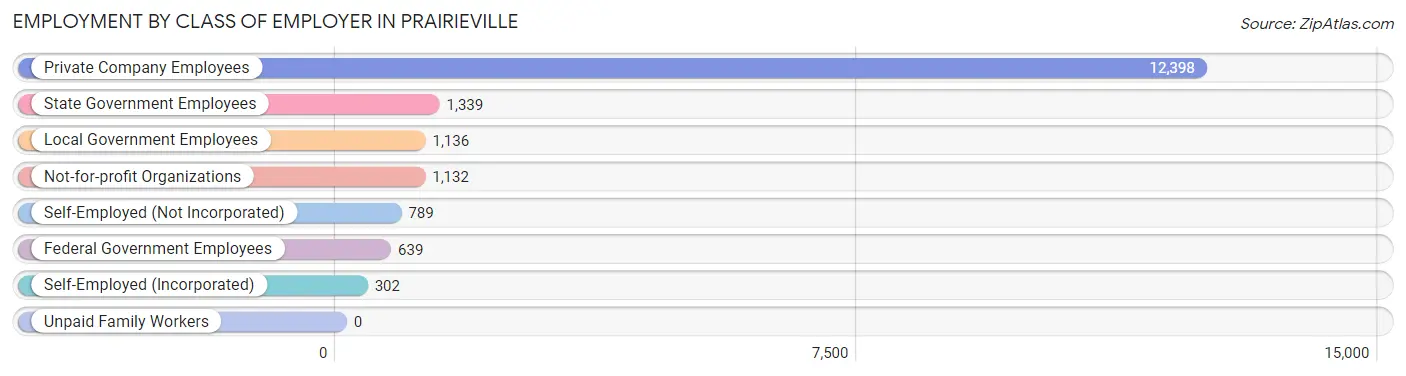
| Employer Class | # Employees | % Employees |
| Private Company Employees | 12,398 | 69.9% |
| Self-Employed (Incorporated) | 302 | 1.7% |
| Self-Employed (Not Incorporated) | 789 | 4.4% |
| Not-for-profit Organizations | 1,132 | 6.4% |
| Local Government Employees | 1,136 | 6.4% |
| State Government Employees | 1,339 | 7.5% |
| Federal Government Employees | 639 | 3.6% |
| Unpaid Family Workers | 0 | 0.0% |
| Total | 17,735 | 100.0% |
Employment Status by Age in Prairieville
According to the labor force statistics for Prairieville, out of the total population over 16 years of age (26,144), 71.1% or 18,588 individuals are in the labor force, with 2.9% or 539 of them unemployed. The age group with the highest labor force participation rate is 25 to 29 years, with 92.9% or 2,198 individuals in the labor force. Within the labor force, the 55 to 59 years age range has the highest percentage of unemployed individuals, with 8.6% or 155 of them being unemployed.
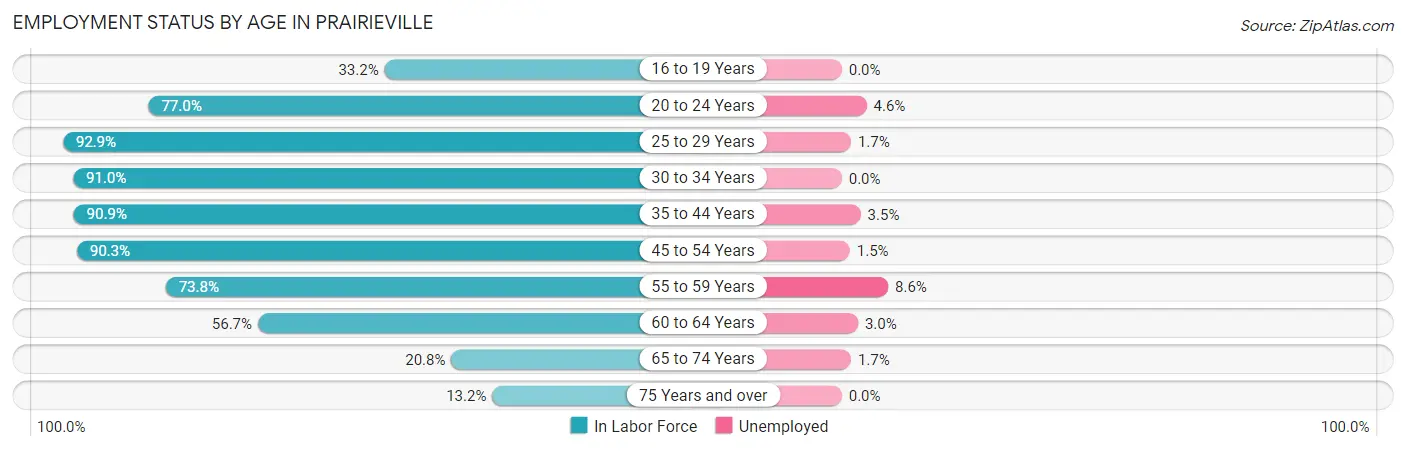
| Age Bracket | In Labor Force | Unemployed |
| 16 to 19 Years | 627 (33.2%) | 0 (0.0%) |
| 20 to 24 Years | 1,398 (77.0%) | 64 (4.6%) |
| 25 to 29 Years | 2,198 (92.9%) | 37 (1.7%) |
| 30 to 34 Years | 2,195 (91.0%) | 0 (0.0%) |
| 35 to 44 Years | 5,228 (90.9%) | 183 (3.5%) |
| 45 to 54 Years | 3,481 (90.3%) | 52 (1.5%) |
| 55 to 59 Years | 1,807 (73.8%) | 155 (8.6%) |
| 60 to 64 Years | 911 (56.7%) | 27 (3.0%) |
| 65 to 74 Years | 602 (20.8%) | 10 (1.7%) |
| 75 Years and over | 146 (13.2%) | 0 (0.0%) |
| Total | 18,588 (71.1%) | 539 (2.9%) |
Employment Status by Educational Attainment in Prairieville
According to labor force statistics for Prairieville, 85.8% of individuals (15,820) out of the total population between 25 and 64 years of age (18,438) are in the labor force, with 2.9% or 459 of them being unemployed. The group with the highest labor force participation rate are those with the educational attainment of bachelor's degree or higher, with 90.5% or 6,827 individuals in the labor force. Within the labor force, individuals with less than high school education have the highest percentage of unemployment, with 17.6% or 163 of them being unemployed.
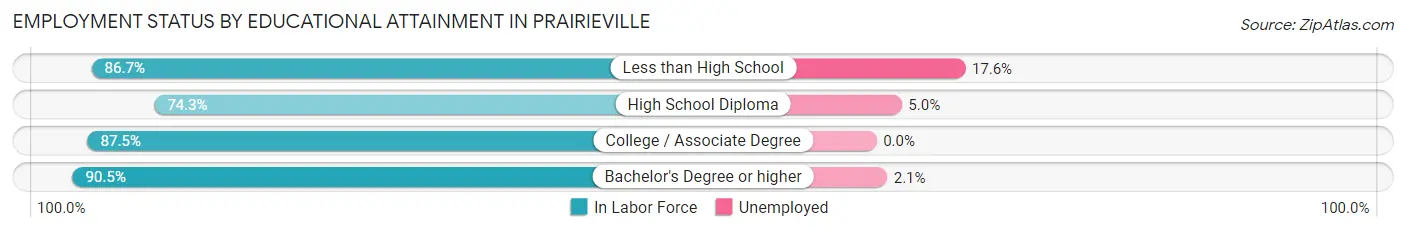
| Educational Attainment | In Labor Force | Unemployed |
| Less than High School | 925 (86.7%) | 188 (17.6%) |
| High School Diploma | 3,002 (74.3%) | 202 (5.0%) |
| College / Associate Degree | 5,064 (87.5%) | 0 (0.0%) |
| Bachelor's Degree or higher | 6,827 (90.5%) | 158 (2.1%) |
| Total | 15,820 (85.8%) | 535 (2.9%) |
Employment Occupations by Sex in Prairieville
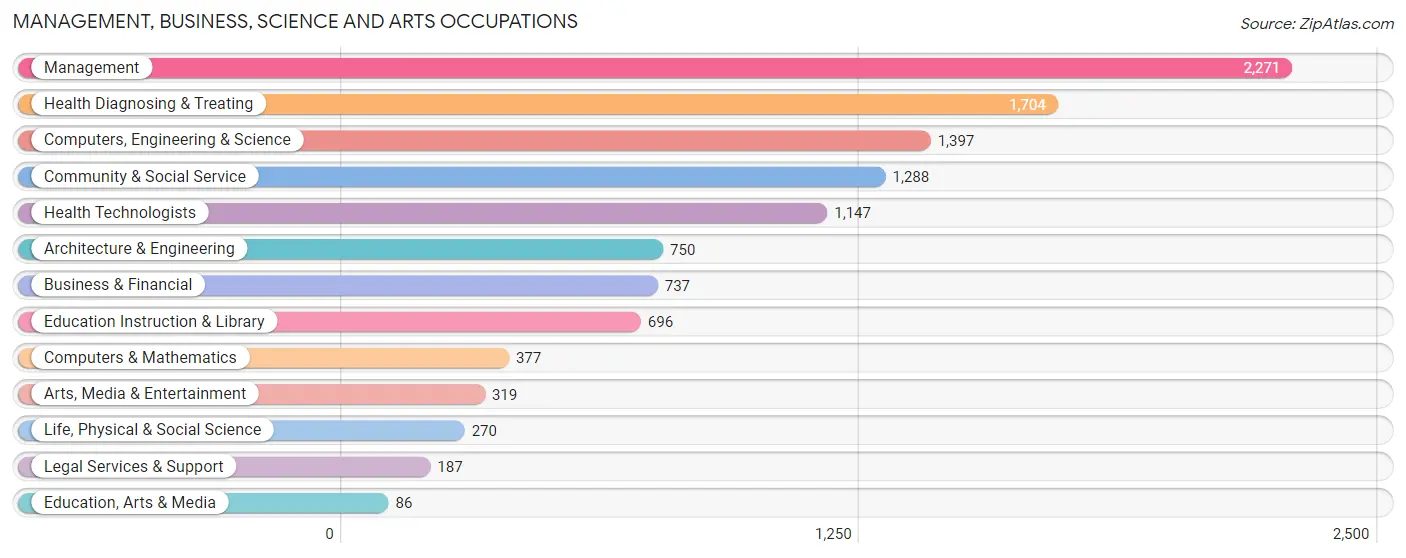
Management, Business, Science and Arts Occupations
The most common Management, Business, Science and Arts occupations in Prairieville are Management (2,271 | 12.6%), Health Diagnosing & Treating (1,704 | 9.5%), Computers, Engineering & Science (1,397 | 7.8%), Community & Social Service (1,288 | 7.1%), and Health Technologists (1,147 | 6.4%).
Management, Business, Science and Arts Occupations by Sex
Within the Management, Business, Science and Arts occupations in Prairieville, the most male-oriented occupations are Architecture & Engineering (91.7%), Arts, Media & Entertainment (77.7%), and Computers, Engineering & Science (77.3%), while the most female-oriented occupations are Education, Arts & Media (100.0%), Health Technologists (90.3%), and Health Diagnosing & Treating (85.5%).
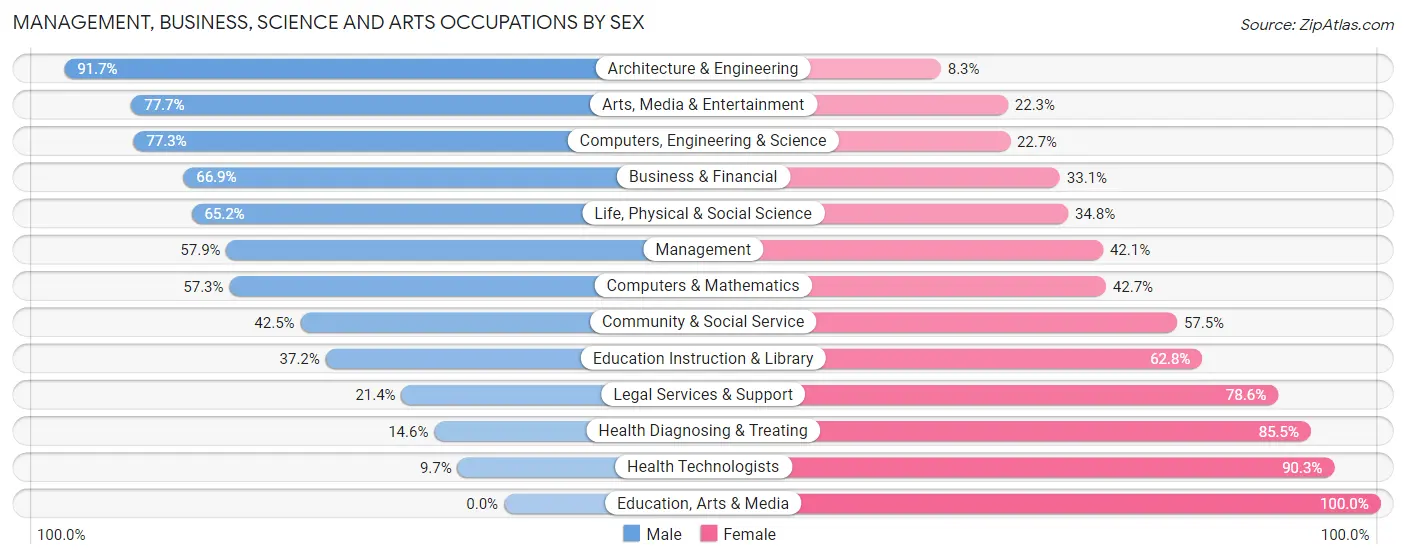
| Occupation | Male | Female |
| Management | 1,315 (57.9%) | 956 (42.1%) |
| Business & Financial | 493 (66.9%) | 244 (33.1%) |
| Computers, Engineering & Science | 1,080 (77.3%) | 317 (22.7%) |
| Computers & Mathematics | 216 (57.3%) | 161 (42.7%) |
| Architecture & Engineering | 688 (91.7%) | 62 (8.3%) |
| Life, Physical & Social Science | 176 (65.2%) | 94 (34.8%) |
| Community & Social Service | 547 (42.5%) | 741 (57.5%) |
| Education, Arts & Media | 0 (0.0%) | 86 (100.0%) |
| Legal Services & Support | 40 (21.4%) | 147 (78.6%) |
| Education Instruction & Library | 259 (37.2%) | 437 (62.8%) |
| Arts, Media & Entertainment | 248 (77.7%) | 71 (22.3%) |
| Health Diagnosing & Treating | 248 (14.5%) | 1,456 (85.5%) |
| Health Technologists | 111 (9.7%) | 1,036 (90.3%) |
| Total (Category) | 3,683 (49.8%) | 3,714 (50.2%) |
| Total (Overall) | 9,336 (51.9%) | 8,666 (48.1%) |
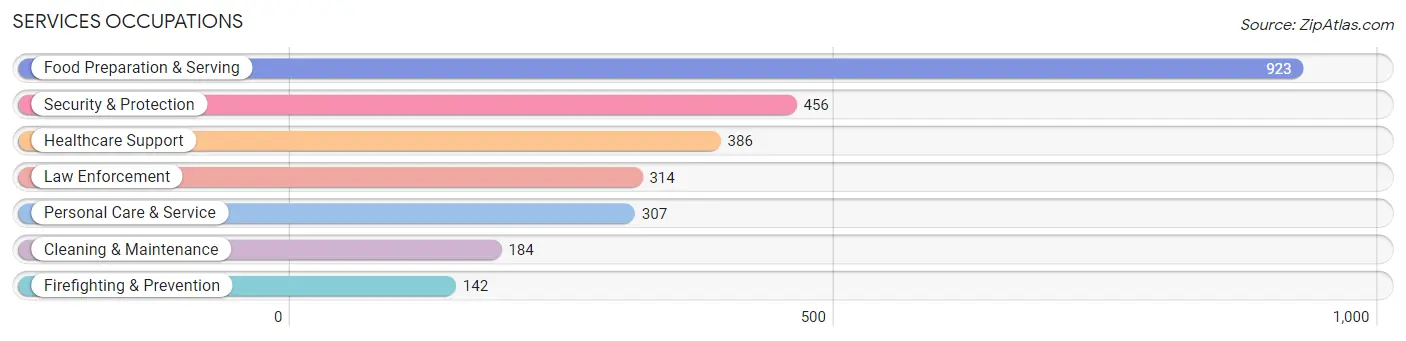
Services Occupations
The most common Services occupations in Prairieville are Food Preparation & Serving (923 | 5.1%), Security & Protection (456 | 2.5%), Healthcare Support (386 | 2.1%), Law Enforcement (314 | 1.7%), and Personal Care & Service (307 | 1.7%).
Services Occupations by Sex
Within the Services occupations in Prairieville, the most male-oriented occupations are Cleaning & Maintenance (76.6%), Law Enforcement (60.8%), and Security & Protection (57.2%), while the most female-oriented occupations are Healthcare Support (89.4%), Personal Care & Service (87.0%), and Food Preparation & Serving (75.8%).
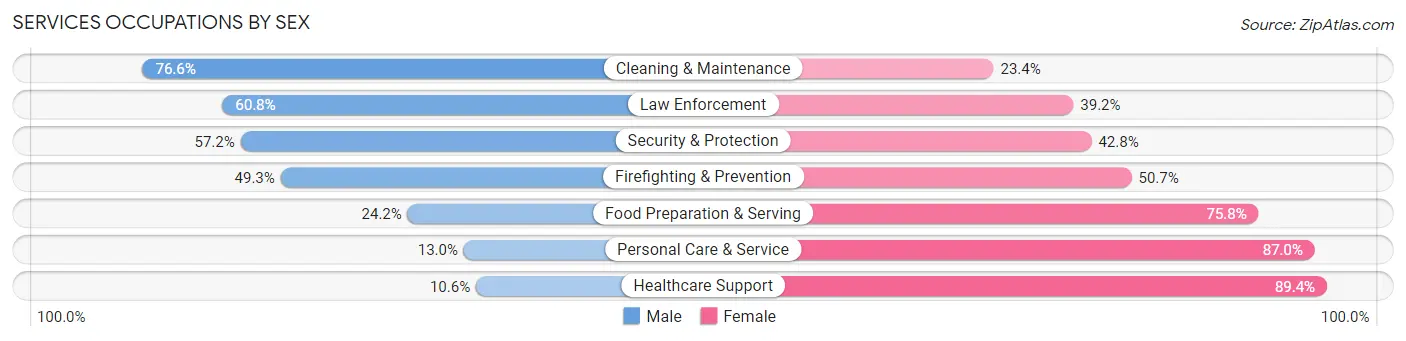
| Occupation | Male | Female |
| Healthcare Support | 41 (10.6%) | 345 (89.4%) |
| Security & Protection | 261 (57.2%) | 195 (42.8%) |
| Firefighting & Prevention | 70 (49.3%) | 72 (50.7%) |
| Law Enforcement | 191 (60.8%) | 123 (39.2%) |
| Food Preparation & Serving | 223 (24.2%) | 700 (75.8%) |
| Cleaning & Maintenance | 141 (76.6%) | 43 (23.4%) |
| Personal Care & Service | 40 (13.0%) | 267 (87.0%) |
| Total (Category) | 706 (31.3%) | 1,550 (68.7%) |
| Total (Overall) | 9,336 (51.9%) | 8,666 (48.1%) |
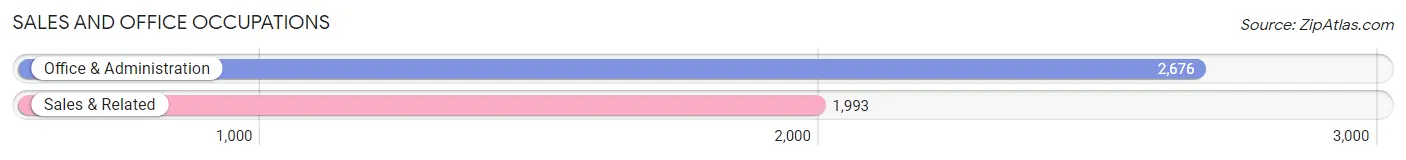
Sales and Office Occupations
The most common Sales and Office occupations in Prairieville are Office & Administration (2,676 | 14.9%), and Sales & Related (1,993 | 11.1%).
Sales and Office Occupations by Sex
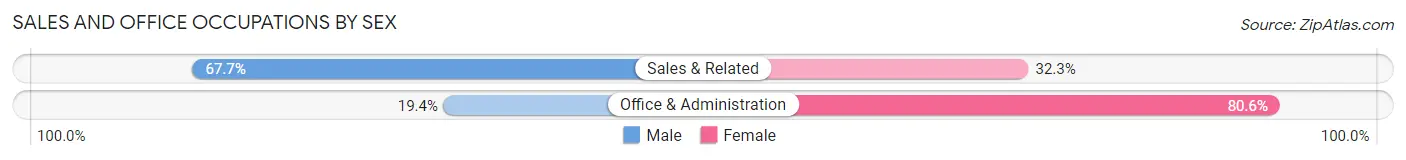
| Occupation | Male | Female |
| Sales & Related | 1,349 (67.7%) | 644 (32.3%) |
| Office & Administration | 519 (19.4%) | 2,157 (80.6%) |
| Total (Category) | 1,868 (40.0%) | 2,801 (60.0%) |
| Total (Overall) | 9,336 (51.9%) | 8,666 (48.1%) |
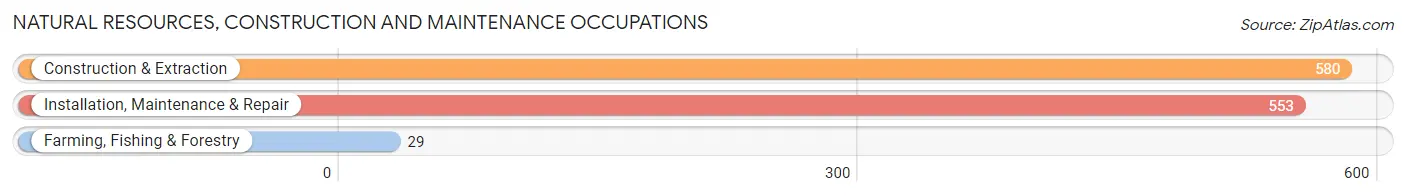
Natural Resources, Construction and Maintenance Occupations
The most common Natural Resources, Construction and Maintenance occupations in Prairieville are Construction & Extraction (580 | 3.2%), Installation, Maintenance & Repair (553 | 3.1%), and Farming, Fishing & Forestry (29 | 0.2%).
Natural Resources, Construction and Maintenance Occupations by Sex
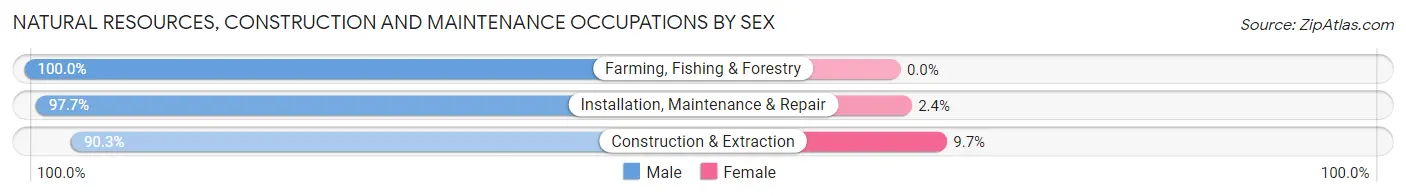
| Occupation | Male | Female |
| Farming, Fishing & Forestry | 29 (100.0%) | 0 (0.0%) |
| Construction & Extraction | 524 (90.3%) | 56 (9.7%) |
| Installation, Maintenance & Repair | 540 (97.7%) | 13 (2.4%) |
| Total (Category) | 1,093 (94.1%) | 69 (5.9%) |
| Total (Overall) | 9,336 (51.9%) | 8,666 (48.1%) |
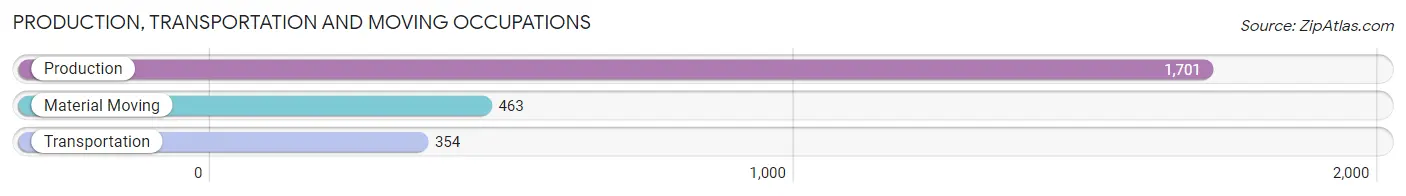
Production, Transportation and Moving Occupations
The most common Production, Transportation and Moving occupations in Prairieville are Production (1,701 | 9.5%), Material Moving (463 | 2.6%), and Transportation (354 | 2.0%).
Production, Transportation and Moving Occupations by Sex
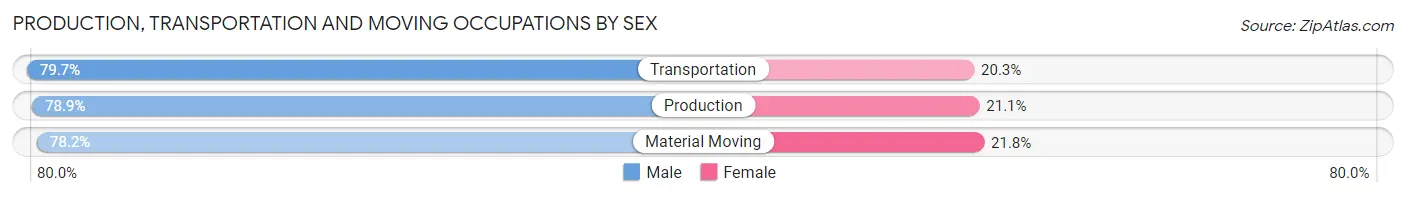
| Occupation | Male | Female |
| Production | 1,342 (78.9%) | 359 (21.1%) |
| Transportation | 282 (79.7%) | 72 (20.3%) |
| Material Moving | 362 (78.2%) | 101 (21.8%) |
| Total (Category) | 1,986 (78.9%) | 532 (21.1%) |
| Total (Overall) | 9,336 (51.9%) | 8,666 (48.1%) |
Employment Industries by Sex in Prairieville
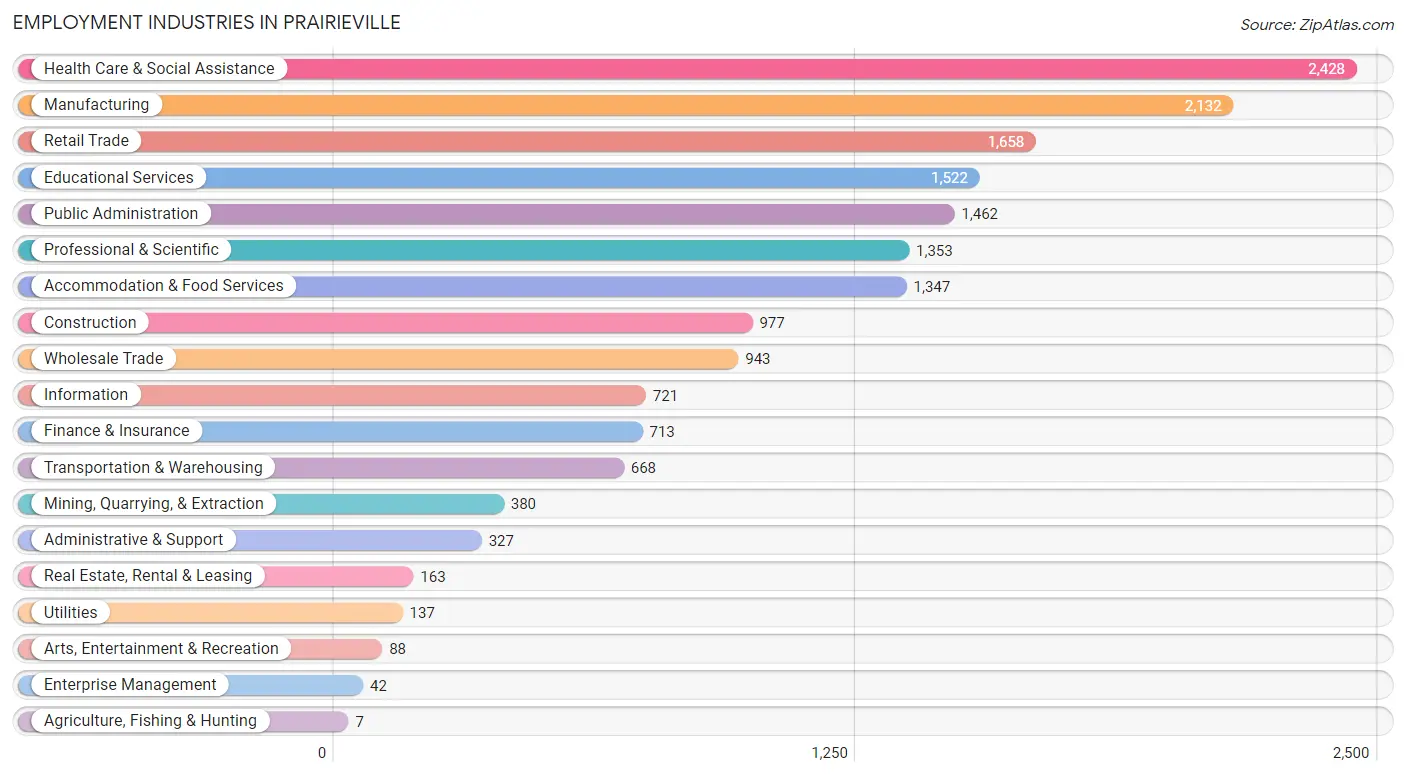
Employment Industries in Prairieville
The major employment industries in Prairieville include Health Care & Social Assistance (2,428 | 13.5%), Manufacturing (2,132 | 11.8%), Retail Trade (1,658 | 9.2%), Educational Services (1,522 | 8.5%), and Public Administration (1,462 | 8.1%).
Employment Industries by Sex in Prairieville
The Prairieville industries that see more men than women are Agriculture, Fishing & Hunting (100.0%), Utilities (100.0%), and Enterprise Management (100.0%), whereas the industries that tend to have a higher number of women are Health Care & Social Assistance (84.6%), Accommodation & Food Services (75.1%), and Educational Services (70.8%).
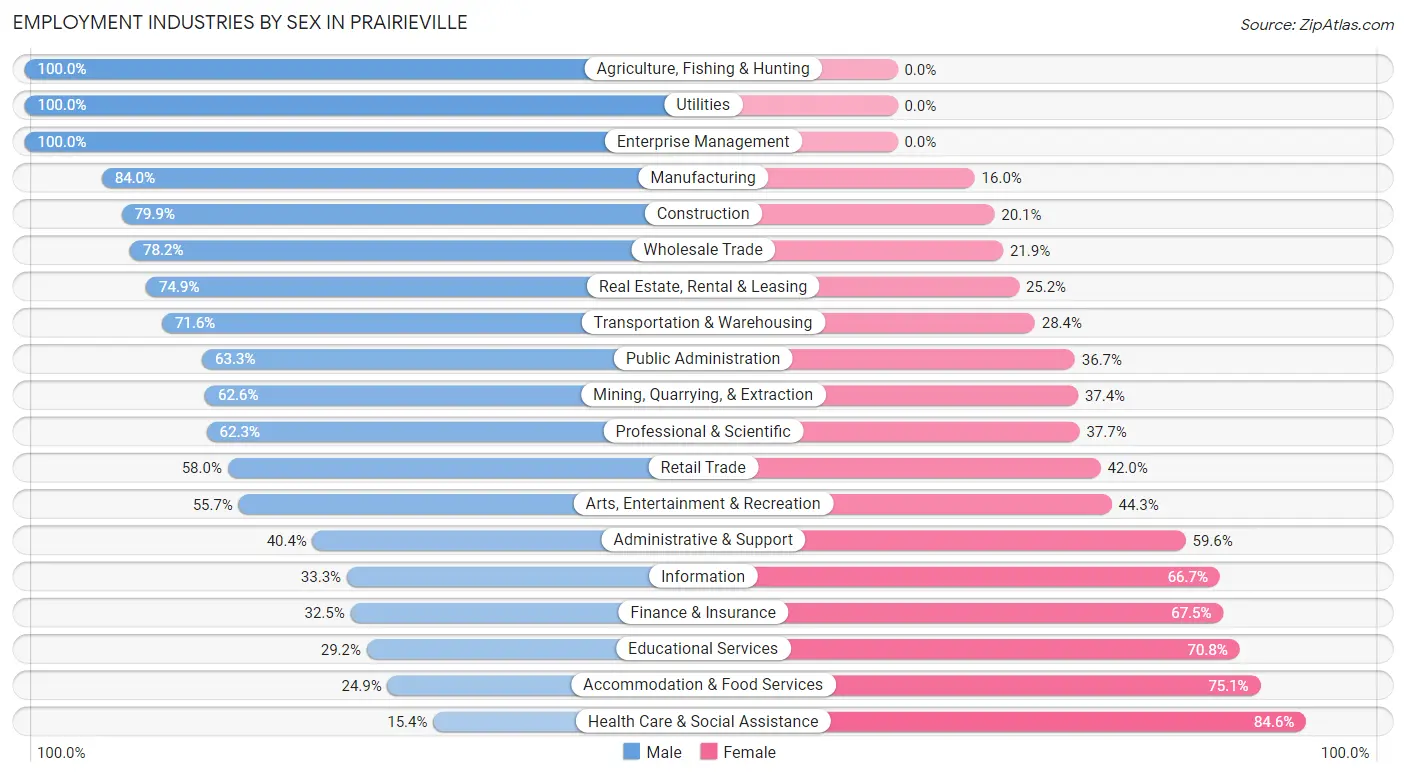
| Industry | Male | Female |
| Agriculture, Fishing & Hunting | 7 (100.0%) | 0 (0.0%) |
| Mining, Quarrying, & Extraction | 238 (62.6%) | 142 (37.4%) |
| Construction | 781 (79.9%) | 196 (20.1%) |
| Manufacturing | 1,791 (84.0%) | 341 (16.0%) |
| Wholesale Trade | 737 (78.1%) | 206 (21.8%) |
| Retail Trade | 961 (58.0%) | 697 (42.0%) |
| Transportation & Warehousing | 478 (71.6%) | 190 (28.4%) |
| Utilities | 137 (100.0%) | 0 (0.0%) |
| Information | 240 (33.3%) | 481 (66.7%) |
| Finance & Insurance | 232 (32.5%) | 481 (67.5%) |
| Real Estate, Rental & Leasing | 122 (74.9%) | 41 (25.2%) |
| Professional & Scientific | 843 (62.3%) | 510 (37.7%) |
| Enterprise Management | 42 (100.0%) | 0 (0.0%) |
| Administrative & Support | 132 (40.4%) | 195 (59.6%) |
| Educational Services | 444 (29.2%) | 1,078 (70.8%) |
| Health Care & Social Assistance | 374 (15.4%) | 2,054 (84.6%) |
| Arts, Entertainment & Recreation | 49 (55.7%) | 39 (44.3%) |
| Accommodation & Food Services | 335 (24.9%) | 1,012 (75.1%) |
| Public Administration | 925 (63.3%) | 537 (36.7%) |
| Total | 9,336 (51.9%) | 8,666 (48.1%) |
Education in Prairieville
School Enrollment in Prairieville
The most common levels of schooling among the 9,362 students in Prairieville are high school (2,363 | 25.2%), elementary school (2,162 | 23.1%), and middle school (1,674 | 17.9%).
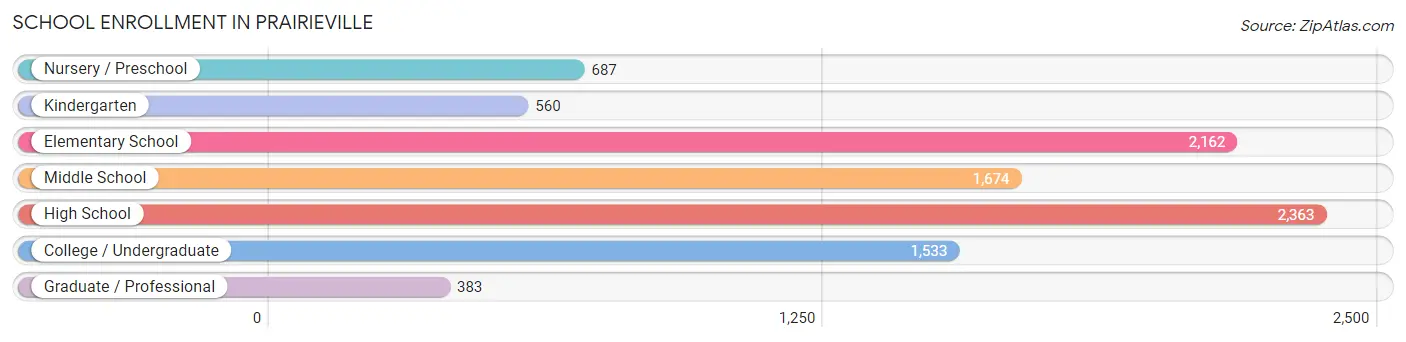
| School Level | # Students | % Students |
| Nursery / Preschool | 687 | 7.3% |
| Kindergarten | 560 | 6.0% |
| Elementary School | 2,162 | 23.1% |
| Middle School | 1,674 | 17.9% |
| High School | 2,363 | 25.2% |
| College / Undergraduate | 1,533 | 16.4% |
| Graduate / Professional | 383 | 4.1% |
| Total | 9,362 | 100.0% |
School Enrollment by Age by Funding Source in Prairieville
Out of a total of 9,362 students who are enrolled in schools in Prairieville, 1,582 (16.9%) attend a private institution, while the remaining 7,780 (83.1%) are enrolled in public schools. The age group of 3 to 4 year olds has the highest likelihood of being enrolled in private schools, with 413 (76.6% in the age bracket) enrolled. Conversely, the age group of 20 to 24 year olds has the lowest likelihood of being enrolled in a private school, with 638 (95.7% in the age bracket) attending a public institution.
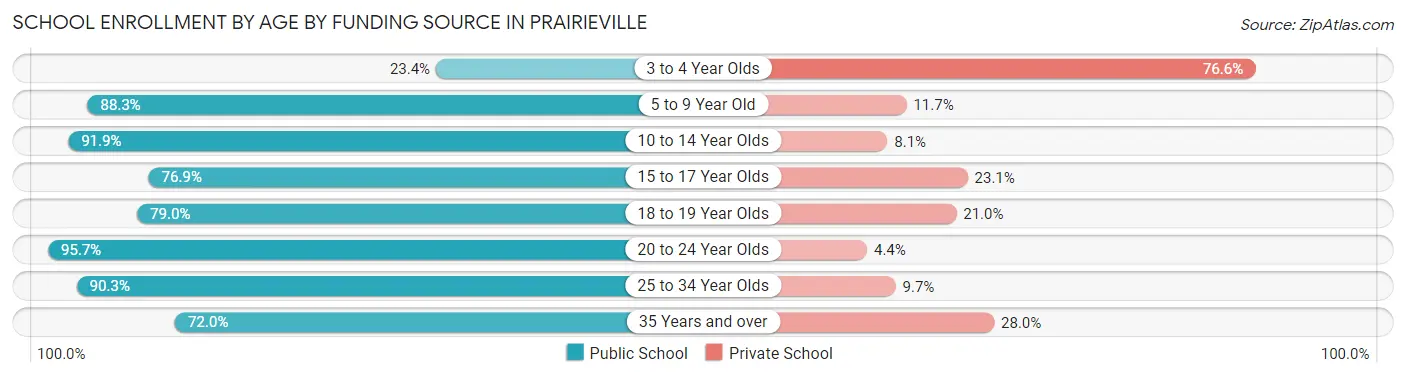
| Age Bracket | Public School | Private School |
| 3 to 4 Year Olds | 126 (23.4%) | 413 (76.6%) |
| 5 to 9 Year Old | 2,476 (88.3%) | 328 (11.7%) |
| 10 to 14 Year Olds | 2,001 (91.9%) | 177 (8.1%) |
| 15 to 17 Year Olds | 1,266 (76.9%) | 380 (23.1%) |
| 18 to 19 Year Olds | 392 (79.0%) | 104 (21.0%) |
| 20 to 24 Year Olds | 638 (95.7%) | 29 (4.3%) |
| 25 to 34 Year Olds | 700 (90.3%) | 75 (9.7%) |
| 35 Years and over | 185 (72.0%) | 72 (28.0%) |
| Total | 7,780 (83.1%) | 1,582 (16.9%) |
Educational Attainment by Field of Study in Prairieville
Business (1,948 | 21.9%), science & technology (1,289 | 14.5%), education (1,079 | 12.1%), engineering (792 | 8.9%), and liberal arts & history (750 | 8.4%) are the most common fields of study among 8,888 individuals in Prairieville who have obtained a bachelor's degree or higher.
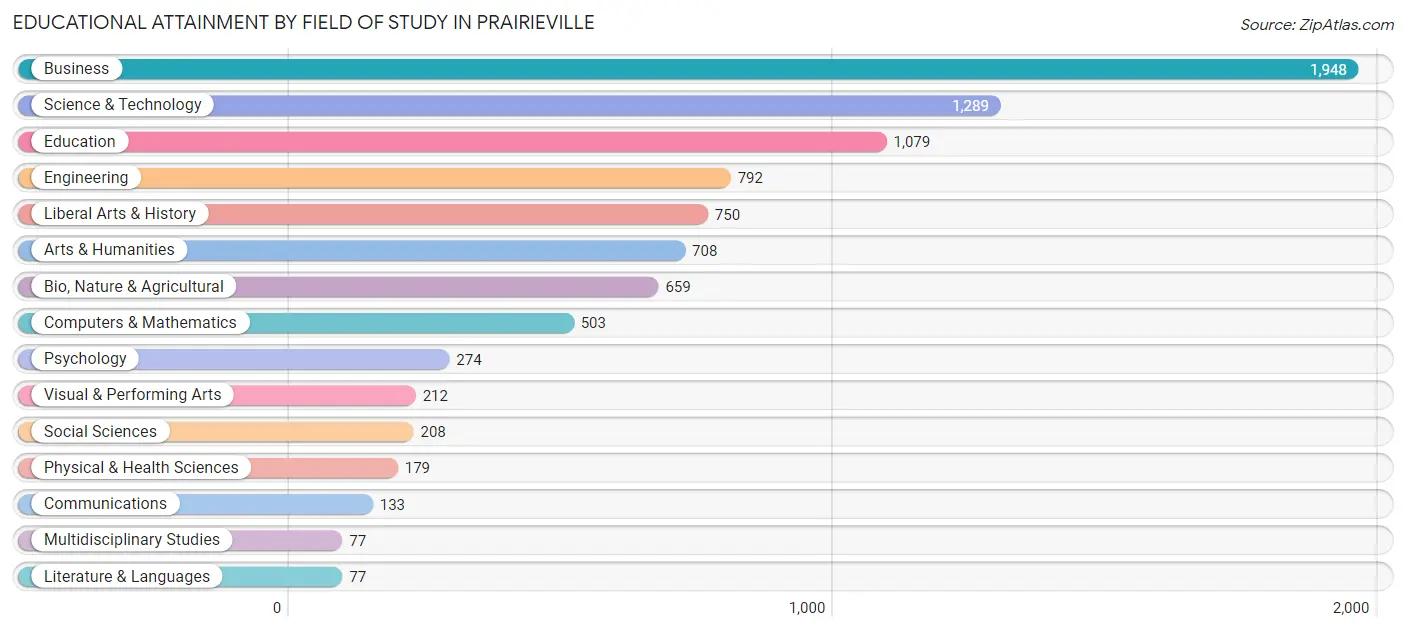
| Field of Study | # Graduates | % Graduates |
| Computers & Mathematics | 503 | 5.7% |
| Bio, Nature & Agricultural | 659 | 7.4% |
| Physical & Health Sciences | 179 | 2.0% |
| Psychology | 274 | 3.1% |
| Social Sciences | 208 | 2.3% |
| Engineering | 792 | 8.9% |
| Multidisciplinary Studies | 77 | 0.9% |
| Science & Technology | 1,289 | 14.5% |
| Business | 1,948 | 21.9% |
| Education | 1,079 | 12.1% |
| Literature & Languages | 77 | 0.9% |
| Liberal Arts & History | 750 | 8.4% |
| Visual & Performing Arts | 212 | 2.4% |
| Communications | 133 | 1.5% |
| Arts & Humanities | 708 | 8.0% |
| Total | 8,888 | 100.0% |
Transportation & Commute in Prairieville
Vehicle Availability by Sex in Prairieville
The most prevalent vehicle ownership categories in Prairieville are males with 2 vehicles (5,232, accounting for 55.7%) and females with 2 vehicles (4,287, making up 62.6%).
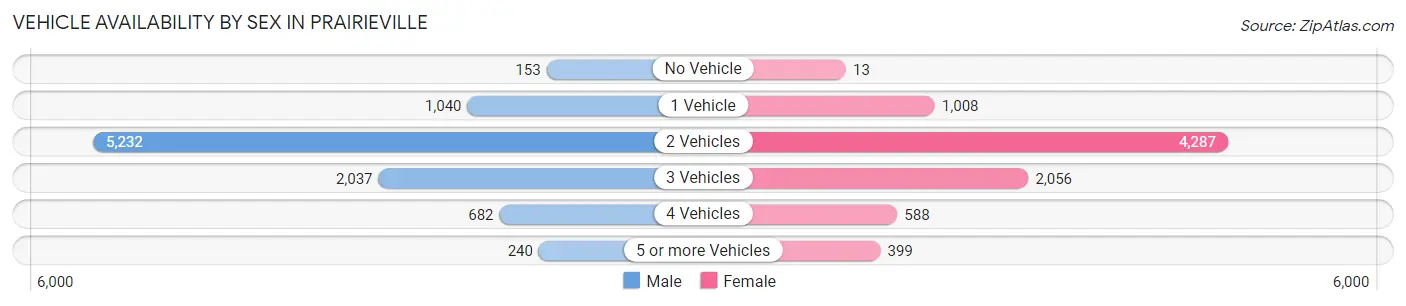
| Vehicles Available | Male | Female |
| No Vehicle | 153 (1.6%) | 13 (0.2%) |
| 1 Vehicle | 1,040 (11.1%) | 1,008 (12.1%) |
| 2 Vehicles | 5,232 (55.7%) | 4,287 (51.3%) |
| 3 Vehicles | 2,037 (21.7%) | 2,056 (24.6%) |
| 4 Vehicles | 682 (7.3%) | 588 (7.0%) |
| 5 or more Vehicles | 240 (2.6%) | 399 (4.8%) |
| Total | 9,384 (100.0%) | 8,351 (100.0%) |
Commute Time in Prairieville
The most frequently occuring commute durations in Prairieville are 30 to 34 minutes (3,693 commuters, 22.7%), 45 to 59 minutes (1,960 commuters, 12.0%), and 60 to 89 minutes (1,874 commuters, 11.5%).
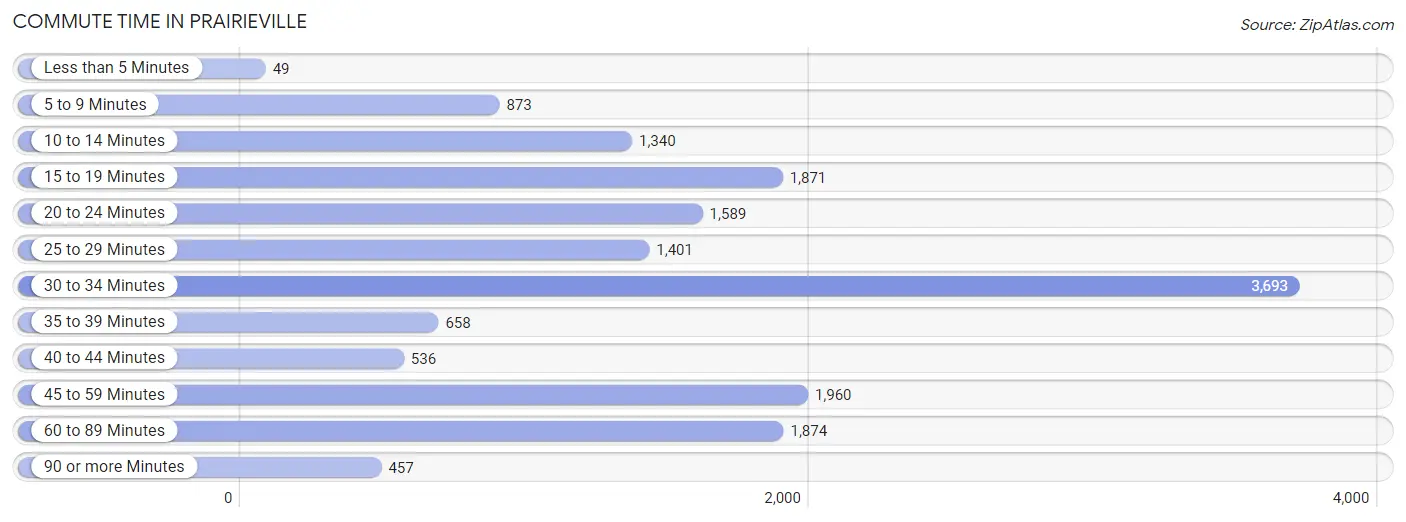
| Commute Time | # Commuters | % Commuters |
| Less than 5 Minutes | 49 | 0.3% |
| 5 to 9 Minutes | 873 | 5.4% |
| 10 to 14 Minutes | 1,340 | 8.2% |
| 15 to 19 Minutes | 1,871 | 11.5% |
| 20 to 24 Minutes | 1,589 | 9.8% |
| 25 to 29 Minutes | 1,401 | 8.6% |
| 30 to 34 Minutes | 3,693 | 22.7% |
| 35 to 39 Minutes | 658 | 4.0% |
| 40 to 44 Minutes | 536 | 3.3% |
| 45 to 59 Minutes | 1,960 | 12.0% |
| 60 to 89 Minutes | 1,874 | 11.5% |
| 90 or more Minutes | 457 | 2.8% |
Commute Time by Sex in Prairieville
The most common commute times in Prairieville are 30 to 34 minutes (2,201 commuters, 25.4%) for males and 30 to 34 minutes (1,492 commuters, 19.6%) for females.
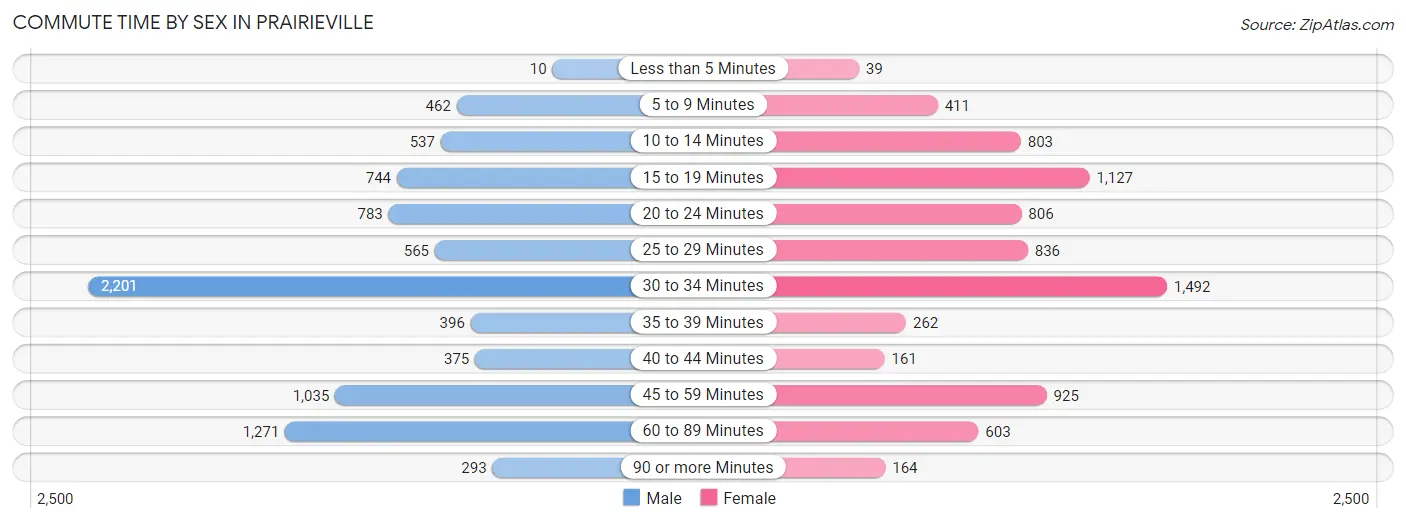
| Commute Time | Male | Female |
| Less than 5 Minutes | 10 (0.1%) | 39 (0.5%) |
| 5 to 9 Minutes | 462 (5.3%) | 411 (5.4%) |
| 10 to 14 Minutes | 537 (6.2%) | 803 (10.5%) |
| 15 to 19 Minutes | 744 (8.6%) | 1,127 (14.8%) |
| 20 to 24 Minutes | 783 (9.0%) | 806 (10.6%) |
| 25 to 29 Minutes | 565 (6.5%) | 836 (11.0%) |
| 30 to 34 Minutes | 2,201 (25.4%) | 1,492 (19.6%) |
| 35 to 39 Minutes | 396 (4.6%) | 262 (3.4%) |
| 40 to 44 Minutes | 375 (4.3%) | 161 (2.1%) |
| 45 to 59 Minutes | 1,035 (11.9%) | 925 (12.1%) |
| 60 to 89 Minutes | 1,271 (14.7%) | 603 (7.9%) |
| 90 or more Minutes | 293 (3.4%) | 164 (2.1%) |
Time of Departure to Work by Sex in Prairieville
The most frequent times of departure to work in Prairieville are 6:00 AM to 6:29 AM (1,255, 14.5%) for males and 6:30 AM to 6:59 AM (1,131, 14.8%) for females.
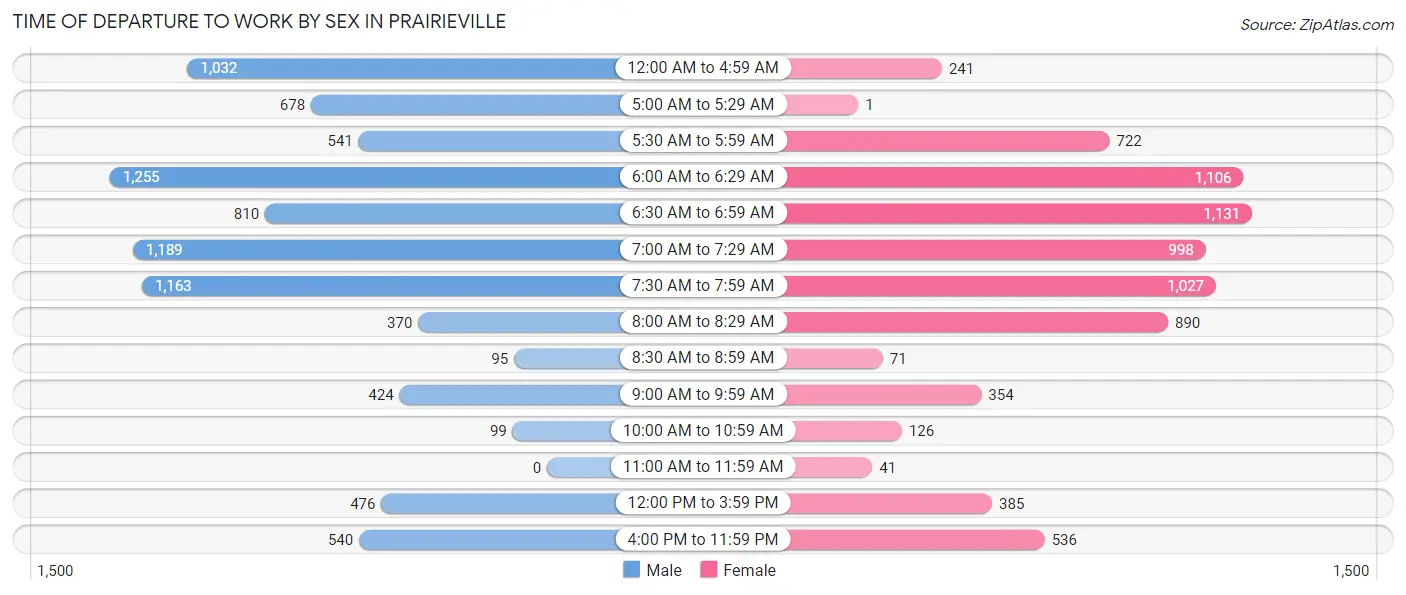
| Time of Departure | Male | Female |
| 12:00 AM to 4:59 AM | 1,032 (11.9%) | 241 (3.2%) |
| 5:00 AM to 5:29 AM | 678 (7.8%) | 1 (0.0%) |
| 5:30 AM to 5:59 AM | 541 (6.2%) | 722 (9.5%) |
| 6:00 AM to 6:29 AM | 1,255 (14.5%) | 1,106 (14.5%) |
| 6:30 AM to 6:59 AM | 810 (9.3%) | 1,131 (14.8%) |
| 7:00 AM to 7:29 AM | 1,189 (13.7%) | 998 (13.1%) |
| 7:30 AM to 7:59 AM | 1,163 (13.4%) | 1,027 (13.5%) |
| 8:00 AM to 8:29 AM | 370 (4.3%) | 890 (11.7%) |
| 8:30 AM to 8:59 AM | 95 (1.1%) | 71 (0.9%) |
| 9:00 AM to 9:59 AM | 424 (4.9%) | 354 (4.6%) |
| 10:00 AM to 10:59 AM | 99 (1.1%) | 126 (1.7%) |
| 11:00 AM to 11:59 AM | 0 (0.0%) | 41 (0.5%) |
| 12:00 PM to 3:59 PM | 476 (5.5%) | 385 (5.1%) |
| 4:00 PM to 11:59 PM | 540 (6.2%) | 536 (7.0%) |
| Total | 8,672 (100.0%) | 7,629 (100.0%) |
Housing Occupancy in Prairieville
Occupancy by Ownership in Prairieville
Of the total 12,238 dwellings in Prairieville, owner-occupied units account for 10,810 (88.3%), while renter-occupied units make up 1,428 (11.7%).
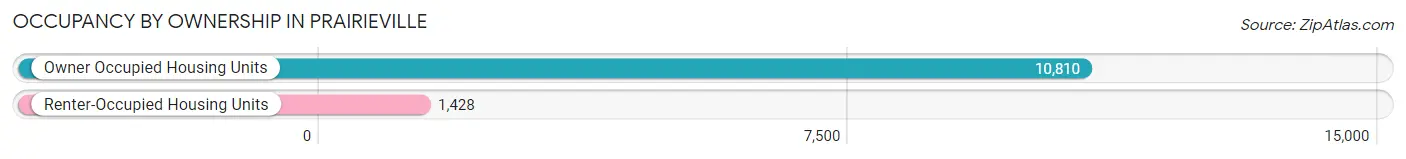
| Occupancy | # Housing Units | % Housing Units |
| Owner Occupied Housing Units | 10,810 | 88.3% |
| Renter-Occupied Housing Units | 1,428 | 11.7% |
| Total Occupied Housing Units | 12,238 | 100.0% |
Occupancy by Household Size in Prairieville
| Household Size | # Housing Units | % Housing Units |
| 1-Person Household | 2,088 | 17.1% |
| 2-Person Household | 3,771 | 30.8% |
| 3-Person Household | 3,206 | 26.2% |
| 4+ Person Household | 3,173 | 25.9% |
| Total Housing Units | 12,238 | 100.0% |
Occupancy by Ownership by Household Size in Prairieville
| Household Size | Owner-occupied | Renter-occupied |
| 1-Person Household | 1,247 (59.7%) | 841 (40.3%) |
| 2-Person Household | 3,551 (94.2%) | 220 (5.8%) |
| 3-Person Household | 2,969 (92.6%) | 237 (7.4%) |
| 4+ Person Household | 3,043 (95.9%) | 130 (4.1%) |
| Total Housing Units | 10,810 (88.3%) | 1,428 (11.7%) |
Occupancy by Educational Attainment in Prairieville
| Household Size | Owner-occupied | Renter-occupied |
| Less than High School | 299 (54.7%) | 248 (45.3%) |
| High School Diploma | 2,241 (80.0%) | 559 (20.0%) |
| College/Associate Degree | 3,151 (88.0%) | 429 (12.0%) |
| Bachelor's Degree or higher | 5,119 (96.4%) | 192 (3.6%) |
Occupancy by Age of Householder in Prairieville
| Age Bracket | # Households | % Households |
| Under 35 Years | 2,371 | 19.4% |
| 35 to 44 Years | 3,163 | 25.9% |
| 45 to 54 Years | 2,049 | 16.7% |
| 55 to 64 Years | 2,181 | 17.8% |
| 65 to 74 Years | 1,690 | 13.8% |
| 75 to 84 Years | 709 | 5.8% |
| 85 Years and Over | 75 | 0.6% |
| Total | 12,238 | 100.0% |
Housing Finances in Prairieville
Median Income by Occupancy in Prairieville
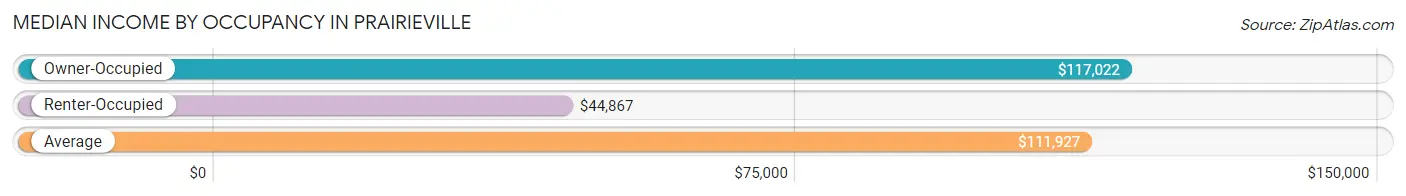
| Occupancy Type | # Households | Median Income |
| Owner-Occupied | 10,810 (88.3%) | $117,022 |
| Renter-Occupied | 1,428 (11.7%) | $44,867 |
| Average | 12,238 (100.0%) | $111,927 |
Occupancy by Householder Income Bracket in Prairieville
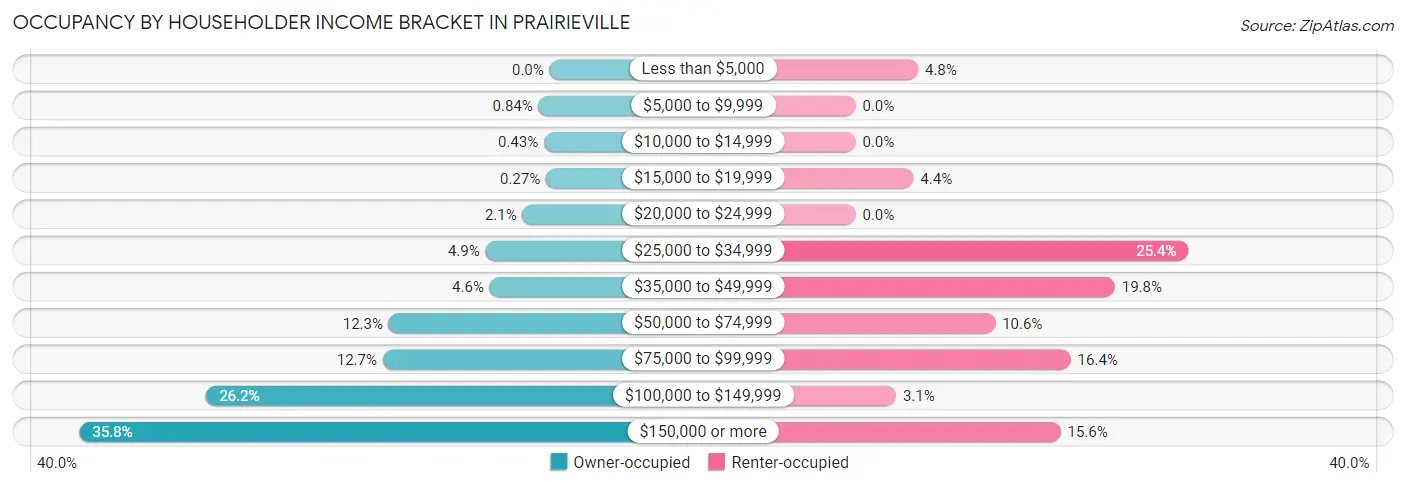
| Income Bracket | Owner-occupied | Renter-occupied |
| Less than $5,000 | 0 (0.0%) | 68 (4.8%) |
| $5,000 to $9,999 | 91 (0.8%) | 0 (0.0%) |
| $10,000 to $14,999 | 47 (0.4%) | 0 (0.0%) |
| $15,000 to $19,999 | 29 (0.3%) | 63 (4.4%) |
| $20,000 to $24,999 | 223 (2.1%) | 0 (0.0%) |
| $25,000 to $34,999 | 528 (4.9%) | 362 (25.4%) |
| $35,000 to $49,999 | 493 (4.6%) | 282 (19.8%) |
| $50,000 to $74,999 | 1,324 (12.2%) | 152 (10.6%) |
| $75,000 to $99,999 | 1,374 (12.7%) | 234 (16.4%) |
| $100,000 to $149,999 | 2,828 (26.2%) | 44 (3.1%) |
| $150,000 or more | 3,873 (35.8%) | 223 (15.6%) |
| Total | 10,810 (100.0%) | 1,428 (100.0%) |
Monthly Housing Cost Tiers in Prairieville
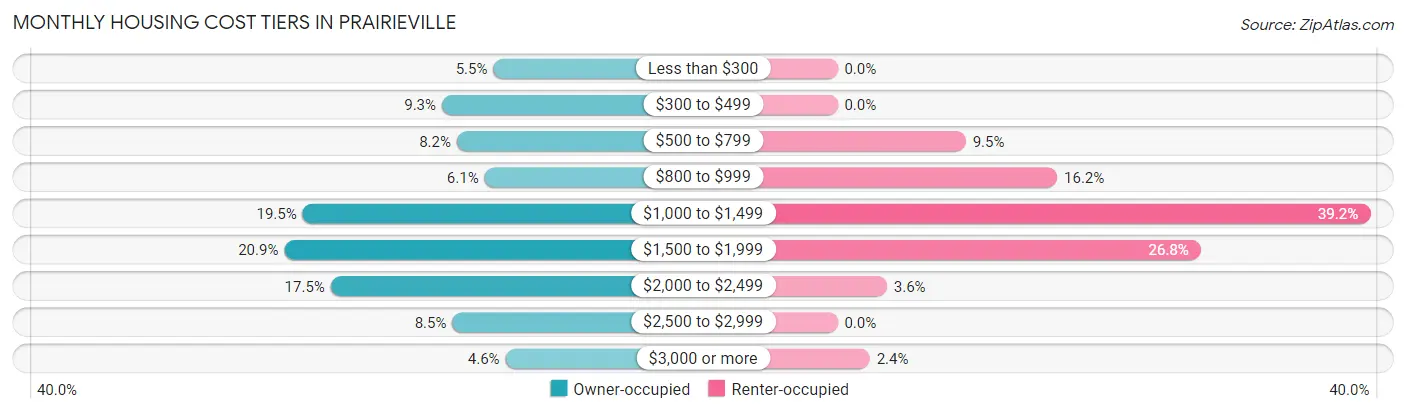
| Monthly Cost | Owner-occupied | Renter-occupied |
| Less than $300 | 592 (5.5%) | 0 (0.0%) |
| $300 to $499 | 1,002 (9.3%) | 0 (0.0%) |
| $500 to $799 | 883 (8.2%) | 135 (9.5%) |
| $800 to $999 | 663 (6.1%) | 231 (16.2%) |
| $1,000 to $1,499 | 2,111 (19.5%) | 560 (39.2%) |
| $1,500 to $1,999 | 2,257 (20.9%) | 382 (26.8%) |
| $2,000 to $2,499 | 1,887 (17.5%) | 52 (3.6%) |
| $2,500 to $2,999 | 919 (8.5%) | 0 (0.0%) |
| $3,000 or more | 496 (4.6%) | 34 (2.4%) |
| Total | 10,810 (100.0%) | 1,428 (100.0%) |
Physical Housing Characteristics in Prairieville
Housing Structures in Prairieville
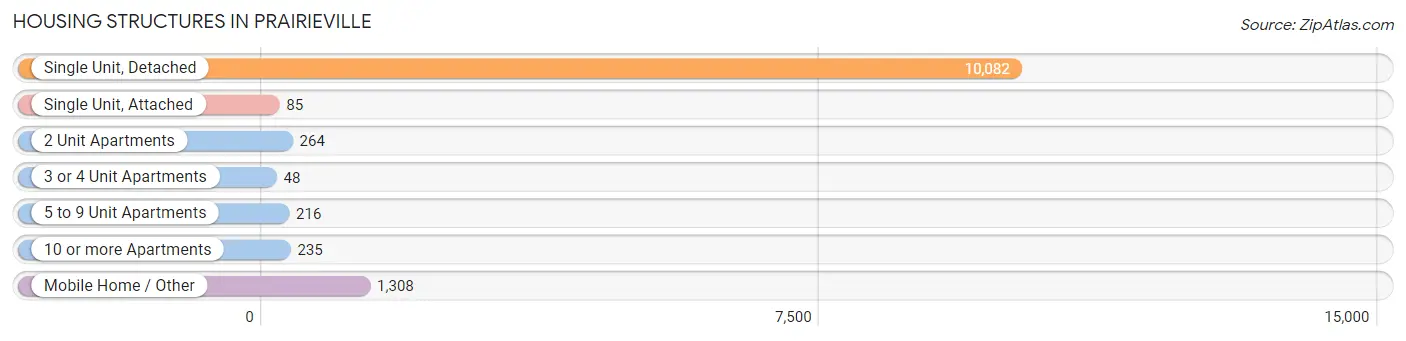
| Structure Type | # Housing Units | % Housing Units |
| Single Unit, Detached | 10,082 | 82.4% |
| Single Unit, Attached | 85 | 0.7% |
| 2 Unit Apartments | 264 | 2.2% |
| 3 or 4 Unit Apartments | 48 | 0.4% |
| 5 to 9 Unit Apartments | 216 | 1.8% |
| 10 or more Apartments | 235 | 1.9% |
| Mobile Home / Other | 1,308 | 10.7% |
| Total | 12,238 | 100.0% |
Housing Structures by Occupancy in Prairieville
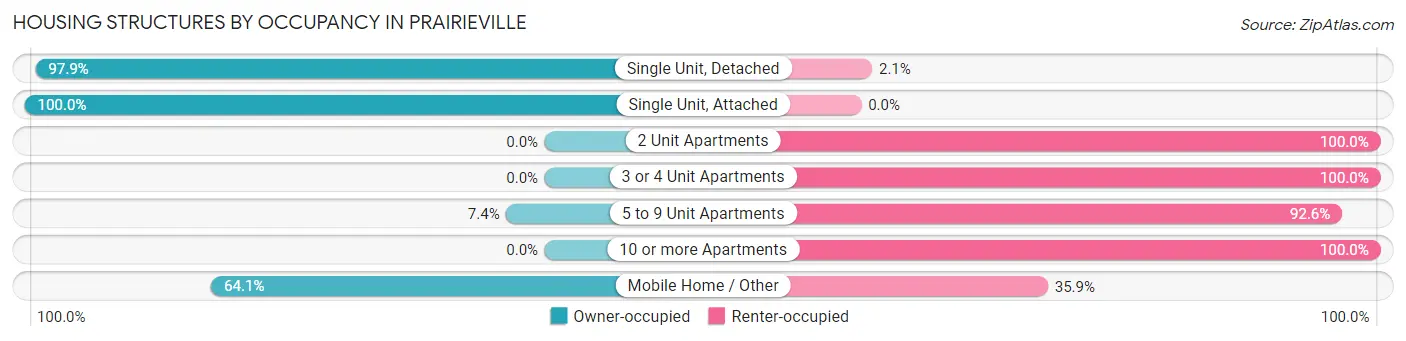
| Structure Type | Owner-occupied | Renter-occupied |
| Single Unit, Detached | 9,871 (97.9%) | 211 (2.1%) |
| Single Unit, Attached | 85 (100.0%) | 0 (0.0%) |
| 2 Unit Apartments | 0 (0.0%) | 264 (100.0%) |
| 3 or 4 Unit Apartments | 0 (0.0%) | 48 (100.0%) |
| 5 to 9 Unit Apartments | 16 (7.4%) | 200 (92.6%) |
| 10 or more Apartments | 0 (0.0%) | 235 (100.0%) |
| Mobile Home / Other | 838 (64.1%) | 470 (35.9%) |
| Total | 10,810 (88.3%) | 1,428 (11.7%) |
Housing Structures by Number of Rooms in Prairieville
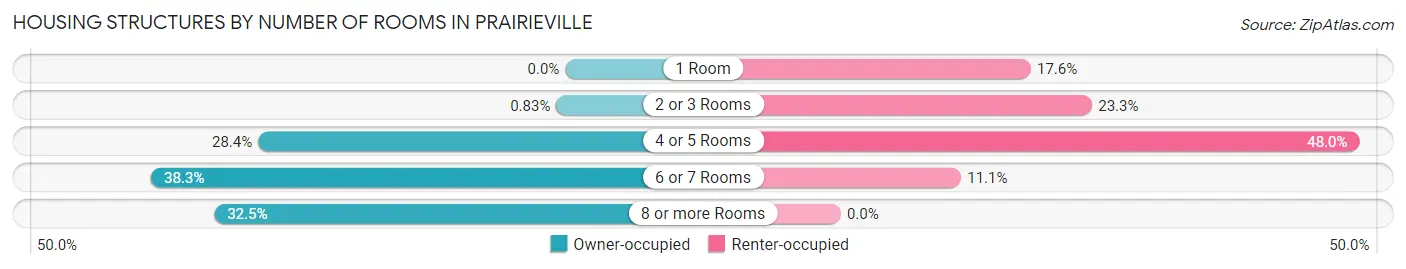
| Number of Rooms | Owner-occupied | Renter-occupied |
| 1 Room | 0 (0.0%) | 251 (17.6%) |
| 2 or 3 Rooms | 90 (0.8%) | 332 (23.3%) |
| 4 or 5 Rooms | 3,071 (28.4%) | 686 (48.0%) |
| 6 or 7 Rooms | 4,140 (38.3%) | 159 (11.1%) |
| 8 or more Rooms | 3,509 (32.5%) | 0 (0.0%) |
| Total | 10,810 (100.0%) | 1,428 (100.0%) |
Housing Structure by Heating Type in Prairieville
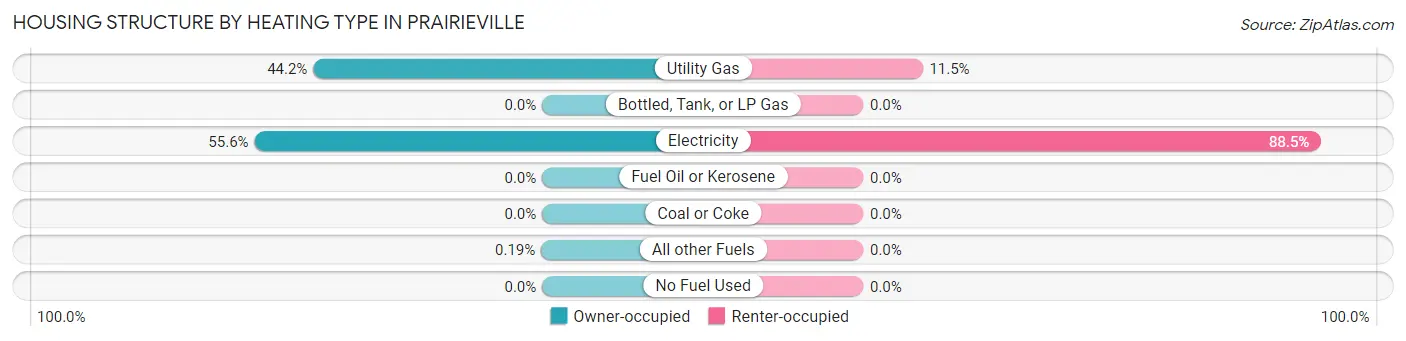
| Heating Type | Owner-occupied | Renter-occupied |
| Utility Gas | 4,781 (44.2%) | 164 (11.5%) |
| Bottled, Tank, or LP Gas | 0 (0.0%) | 0 (0.0%) |
| Electricity | 6,009 (55.6%) | 1,264 (88.5%) |
| Fuel Oil or Kerosene | 0 (0.0%) | 0 (0.0%) |
| Coal or Coke | 0 (0.0%) | 0 (0.0%) |
| All other Fuels | 20 (0.2%) | 0 (0.0%) |
| No Fuel Used | 0 (0.0%) | 0 (0.0%) |
| Total | 10,810 (100.0%) | 1,428 (100.0%) |
Household Vehicle Usage in Prairieville
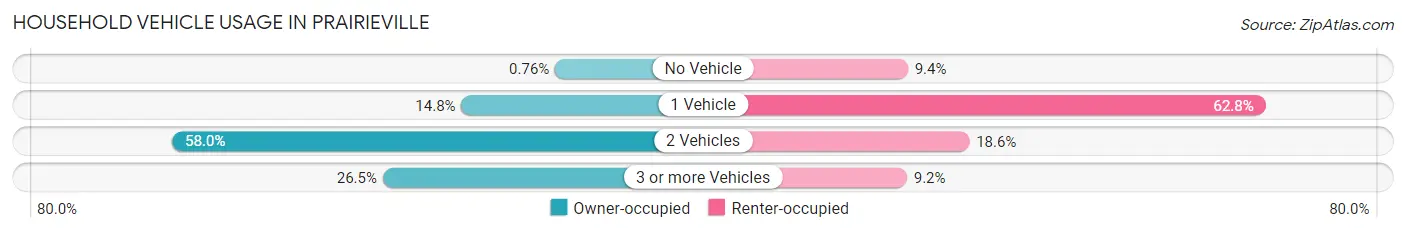
| Vehicles per Household | Owner-occupied | Renter-occupied |
| No Vehicle | 82 (0.8%) | 134 (9.4%) |
| 1 Vehicle | 1,596 (14.8%) | 897 (62.8%) |
| 2 Vehicles | 6,267 (58.0%) | 265 (18.6%) |
| 3 or more Vehicles | 2,865 (26.5%) | 132 (9.2%) |
| Total | 10,810 (100.0%) | 1,428 (100.0%) |
Real Estate & Mortgages in Prairieville
Real Estate and Mortgage Overview in Prairieville
| Characteristic | Without Mortgage | With Mortgage |
| Housing Units | 2,556 | 8,254 |
| Median Property Value | $271,600 | $296,800 |
| Median Household Income | $73,526 | $3,437 |
| Monthly Housing Costs | $471 | $496 |
| Real Estate Taxes | $1,729 | $545 |
Property Value by Mortgage Status in Prairieville
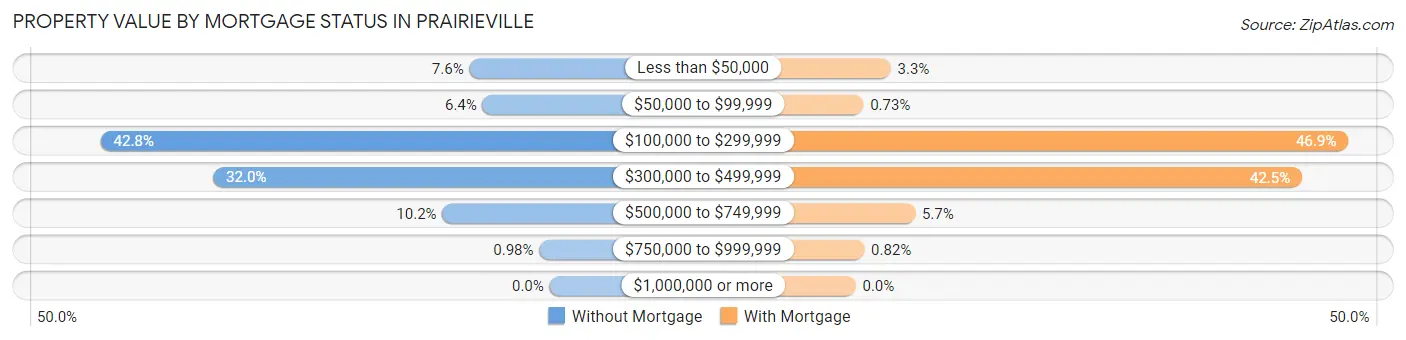
| Property Value | Without Mortgage | With Mortgage |
| Less than $50,000 | 195 (7.6%) | 276 (3.3%) |
| $50,000 to $99,999 | 163 (6.4%) | 60 (0.7%) |
| $100,000 to $299,999 | 1,093 (42.8%) | 3,873 (46.9%) |
| $300,000 to $499,999 | 819 (32.0%) | 3,510 (42.5%) |
| $500,000 to $749,999 | 261 (10.2%) | 467 (5.7%) |
| $750,000 to $999,999 | 25 (1.0%) | 68 (0.8%) |
| $1,000,000 or more | 0 (0.0%) | 0 (0.0%) |
| Total | 2,556 (100.0%) | 8,254 (100.0%) |
Household Income by Mortgage Status in Prairieville
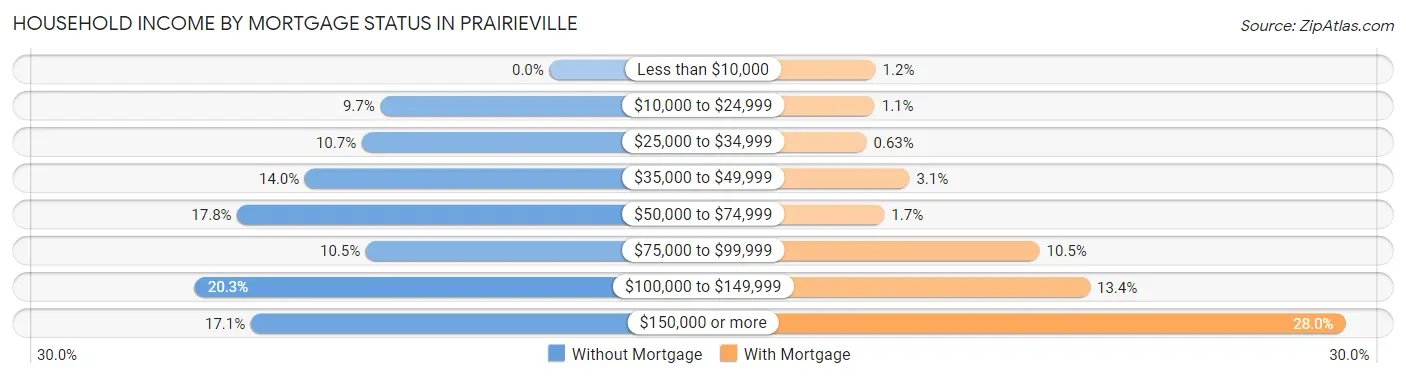
| Household Income | Without Mortgage | With Mortgage |
| Less than $10,000 | 0 (0.0%) | 95 (1.1%) |
| $10,000 to $24,999 | 247 (9.7%) | 91 (1.1%) |
| $25,000 to $34,999 | 274 (10.7%) | 52 (0.6%) |
| $35,000 to $49,999 | 357 (14.0%) | 254 (3.1%) |
| $50,000 to $74,999 | 456 (17.8%) | 136 (1.7%) |
| $75,000 to $99,999 | 268 (10.5%) | 868 (10.5%) |
| $100,000 to $149,999 | 518 (20.3%) | 1,106 (13.4%) |
| $150,000 or more | 436 (17.1%) | 2,310 (28.0%) |
| Total | 2,556 (100.0%) | 8,254 (100.0%) |
Property Value to Household Income Ratio in Prairieville
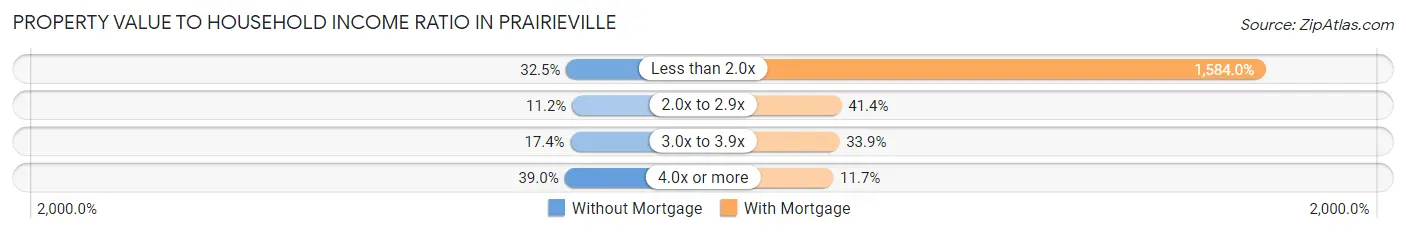
| Value-to-Income Ratio | Without Mortgage | With Mortgage |
| Less than 2.0x | 830 (32.5%) | 130,741 (1,584.0%) |
| 2.0x to 2.9x | 285 (11.2%) | 3,418 (41.4%) |
| 3.0x to 3.9x | 444 (17.4%) | 2,795 (33.9%) |
| 4.0x or more | 997 (39.0%) | 968 (11.7%) |
| Total | 2,556 (100.0%) | 8,254 (100.0%) |
Real Estate Taxes by Mortgage Status in Prairieville
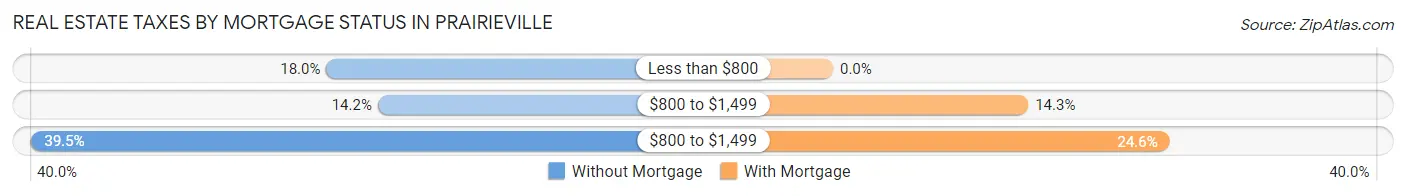
| Property Taxes | Without Mortgage | With Mortgage |
| Less than $800 | 459 (18.0%) | 0 (0.0%) |
| $800 to $1,499 | 363 (14.2%) | 1,177 (14.3%) |
| $800 to $1,499 | 1,010 (39.5%) | 2,029 (24.6%) |
| Total | 2,556 (100.0%) | 8,254 (100.0%) |
Health & Disability in Prairieville
Health Insurance Coverage by Age in Prairieville
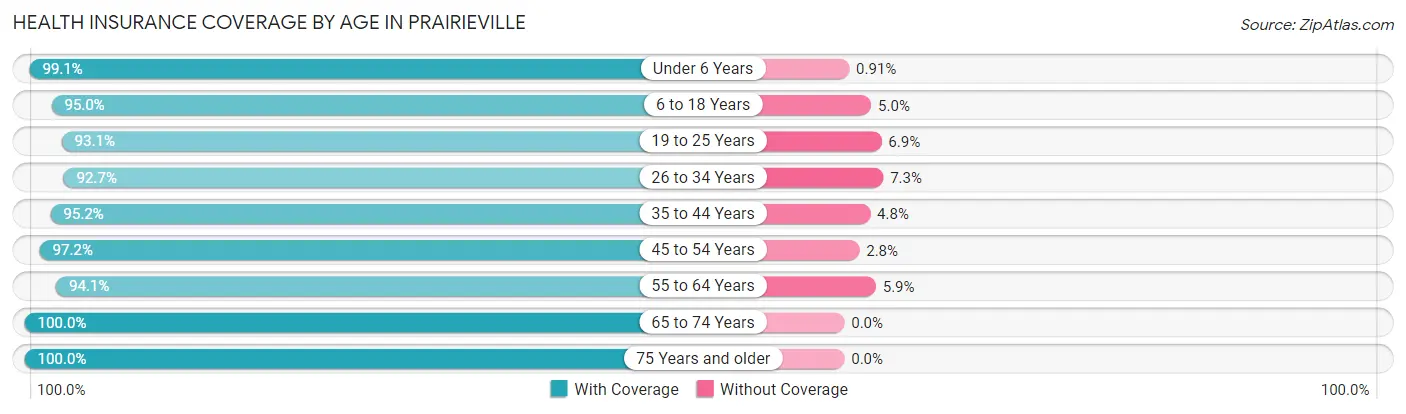
| Age Bracket | With Coverage | Without Coverage |
| Under 6 Years | 3,058 (99.1%) | 28 (0.9%) |
| 6 to 18 Years | 6,291 (95.0%) | 332 (5.0%) |
| 19 to 25 Years | 2,258 (93.1%) | 168 (6.9%) |
| 26 to 34 Years | 4,073 (92.7%) | 319 (7.3%) |
| 35 to 44 Years | 5,446 (95.2%) | 276 (4.8%) |
| 45 to 54 Years | 3,747 (97.2%) | 108 (2.8%) |
| 55 to 64 Years | 3,816 (94.1%) | 238 (5.9%) |
| 65 to 74 Years | 2,892 (100.0%) | 0 (0.0%) |
| 75 Years and older | 1,109 (100.0%) | 0 (0.0%) |
| Total | 32,690 (95.7%) | 1,469 (4.3%) |
Health Insurance Coverage by Citizenship Status in Prairieville
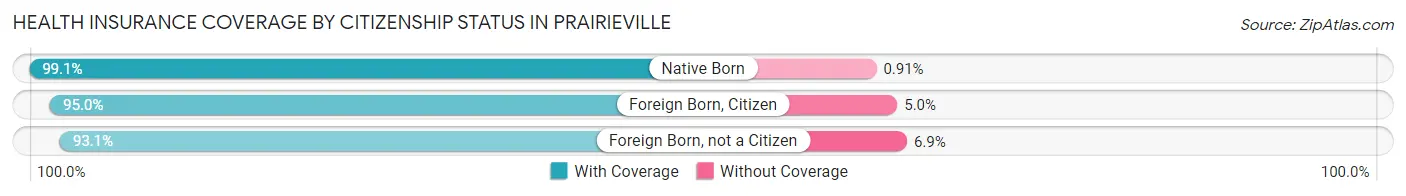
| Citizenship Status | With Coverage | Without Coverage |
| Native Born | 3,058 (99.1%) | 28 (0.9%) |
| Foreign Born, Citizen | 6,291 (95.0%) | 332 (5.0%) |
| Foreign Born, not a Citizen | 2,258 (93.1%) | 168 (6.9%) |
Health Insurance Coverage by Household Income in Prairieville
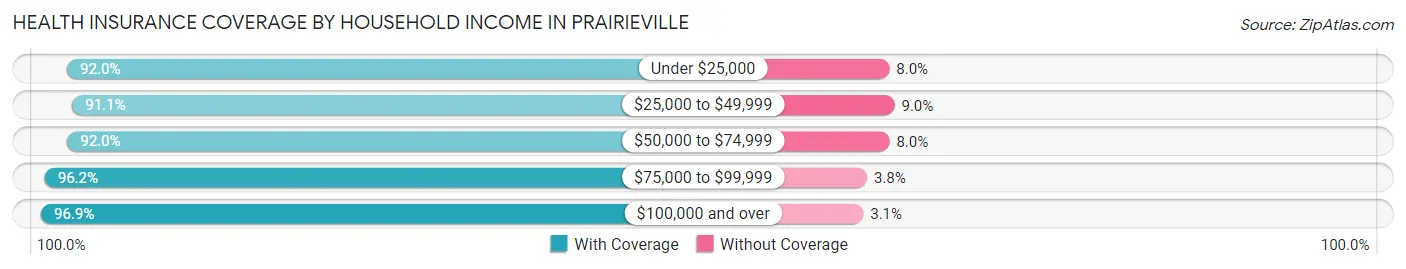
| Household Income | With Coverage | Without Coverage |
| Under $25,000 | 784 (92.0%) | 68 (8.0%) |
| $25,000 to $49,999 | 2,563 (91.0%) | 252 (8.9%) |
| $50,000 to $74,999 | 3,253 (92.0%) | 283 (8.0%) |
| $75,000 to $99,999 | 4,542 (96.2%) | 179 (3.8%) |
| $100,000 and over | 21,548 (96.9%) | 687 (3.1%) |
Public vs Private Health Insurance Coverage by Age in Prairieville
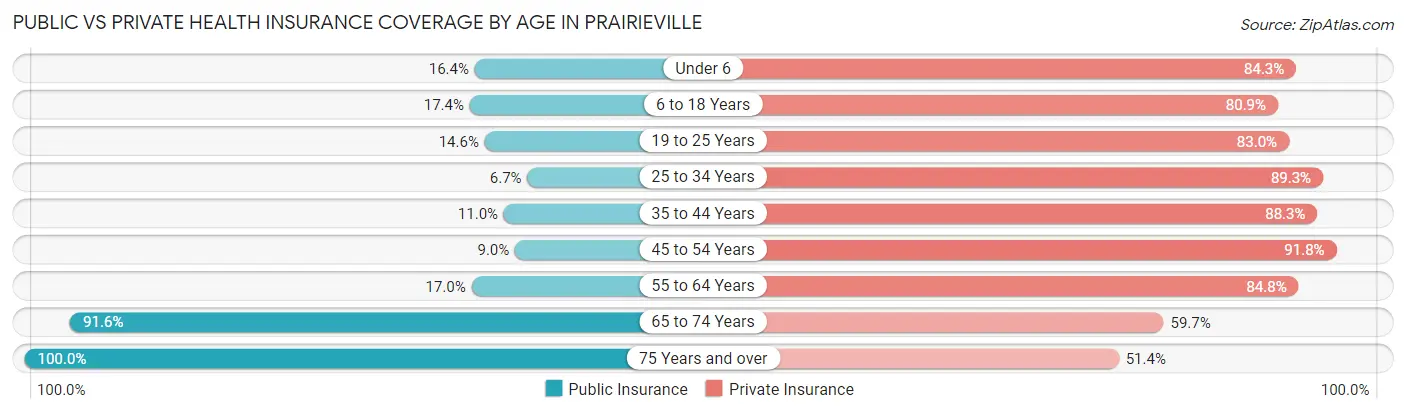
| Age Bracket | Public Insurance | Private Insurance |
| Under 6 | 507 (16.4%) | 2,602 (84.3%) |
| 6 to 18 Years | 1,150 (17.4%) | 5,360 (80.9%) |
| 19 to 25 Years | 354 (14.6%) | 2,013 (83.0%) |
| 25 to 34 Years | 293 (6.7%) | 3,922 (89.3%) |
| 35 to 44 Years | 631 (11.0%) | 5,050 (88.3%) |
| 45 to 54 Years | 345 (8.9%) | 3,539 (91.8%) |
| 55 to 64 Years | 691 (17.0%) | 3,436 (84.8%) |
| 65 to 74 Years | 2,648 (91.6%) | 1,727 (59.7%) |
| 75 Years and over | 1,109 (100.0%) | 570 (51.4%) |
| Total | 7,728 (22.6%) | 28,219 (82.6%) |
Disability Status by Sex by Age in Prairieville
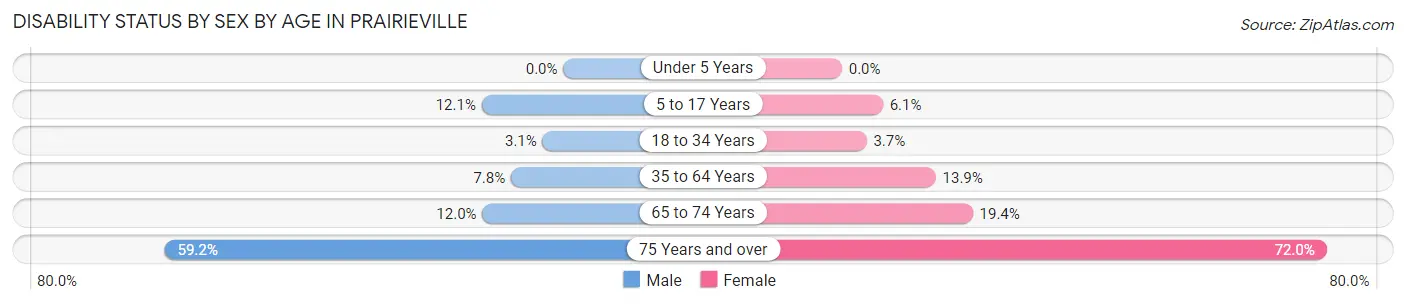
| Age Bracket | Male | Female |
| Under 5 Years | 0 (0.0%) | 0 (0.0%) |
| 5 to 17 Years | 394 (12.1%) | 216 (6.1%) |
| 18 to 34 Years | 106 (3.1%) | 139 (3.7%) |
| 35 to 64 Years | 507 (7.8%) | 990 (13.9%) |
| 65 to 74 Years | 165 (12.0%) | 295 (19.4%) |
| 75 Years and over | 331 (59.2%) | 396 (72.0%) |
Disability Class by Sex by Age in Prairieville
Disability Class: Hearing Difficulty
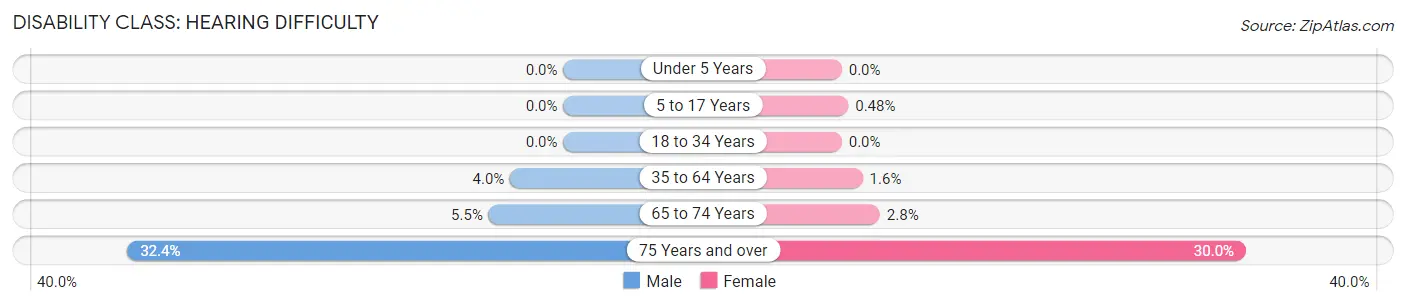
| Age Bracket | Male | Female |
| Under 5 Years | 0 (0.0%) | 0 (0.0%) |
| 5 to 17 Years | 0 (0.0%) | 17 (0.5%) |
| 18 to 34 Years | 0 (0.0%) | 0 (0.0%) |
| 35 to 64 Years | 258 (4.0%) | 110 (1.5%) |
| 65 to 74 Years | 76 (5.5%) | 43 (2.8%) |
| 75 Years and over | 181 (32.4%) | 165 (30.0%) |
Disability Class: Vision Difficulty
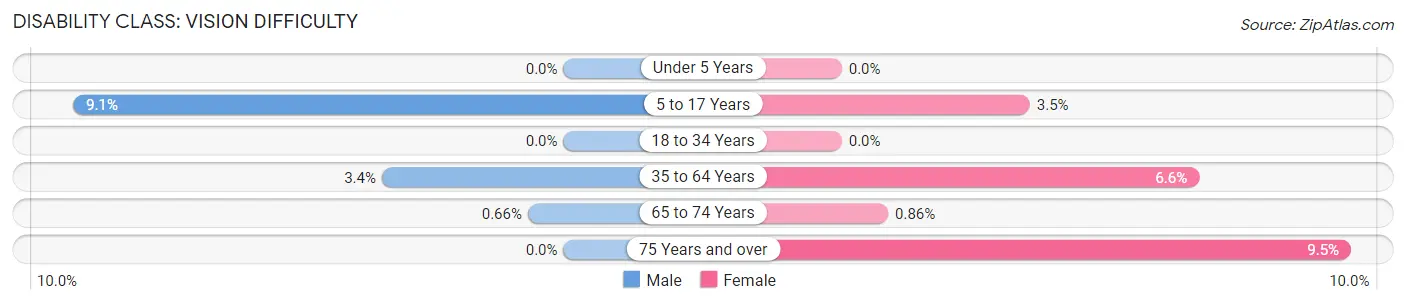
| Age Bracket | Male | Female |
| Under 5 Years | 0 (0.0%) | 0 (0.0%) |
| 5 to 17 Years | 296 (9.1%) | 124 (3.5%) |
| 18 to 34 Years | 0 (0.0%) | 0 (0.0%) |
| 35 to 64 Years | 220 (3.4%) | 471 (6.6%) |
| 65 to 74 Years | 9 (0.7%) | 13 (0.9%) |
| 75 Years and over | 0 (0.0%) | 52 (9.5%) |
Disability Class: Cognitive Difficulty
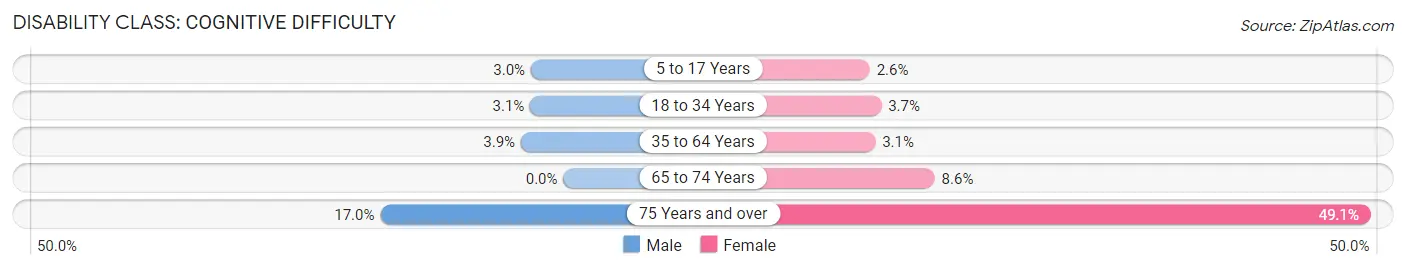
| Age Bracket | Male | Female |
| 5 to 17 Years | 98 (3.0%) | 92 (2.6%) |
| 18 to 34 Years | 106 (3.1%) | 139 (3.7%) |
| 35 to 64 Years | 257 (3.9%) | 220 (3.1%) |
| 65 to 74 Years | 0 (0.0%) | 131 (8.6%) |
| 75 Years and over | 95 (17.0%) | 270 (49.1%) |
Disability Class: Ambulatory Difficulty
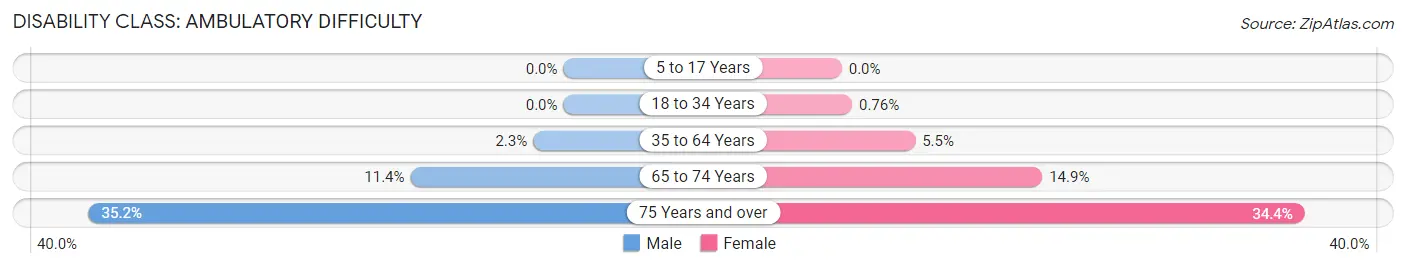
| Age Bracket | Male | Female |
| 5 to 17 Years | 0 (0.0%) | 0 (0.0%) |
| 18 to 34 Years | 0 (0.0%) | 29 (0.8%) |
| 35 to 64 Years | 147 (2.2%) | 387 (5.4%) |
| 65 to 74 Years | 156 (11.4%) | 226 (14.9%) |
| 75 Years and over | 197 (35.2%) | 189 (34.4%) |
Disability Class: Self-Care Difficulty
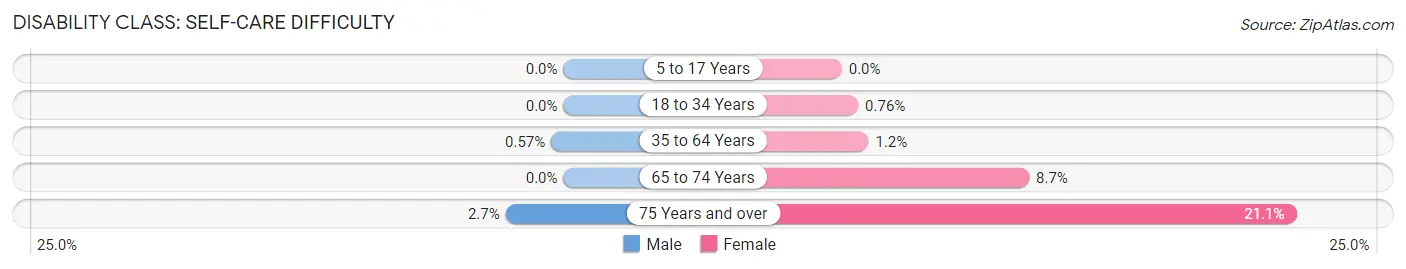
| Age Bracket | Male | Female |
| 5 to 17 Years | 0 (0.0%) | 0 (0.0%) |
| 18 to 34 Years | 0 (0.0%) | 29 (0.8%) |
| 35 to 64 Years | 37 (0.6%) | 88 (1.2%) |
| 65 to 74 Years | 0 (0.0%) | 132 (8.7%) |
| 75 Years and over | 15 (2.7%) | 116 (21.1%) |
Technology Access in Prairieville
Computing Device Access in Prairieville
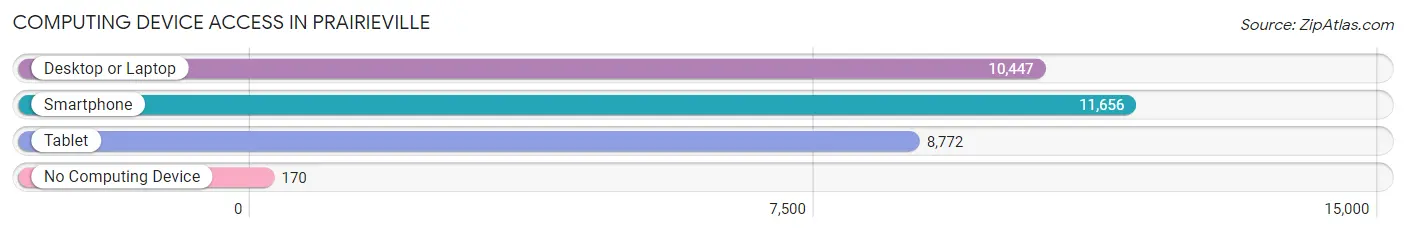
| Device Type | # Households | % Households |
| Desktop or Laptop | 10,447 | 85.4% |
| Smartphone | 11,656 | 95.2% |
| Tablet | 8,772 | 71.7% |
| No Computing Device | 170 | 1.4% |
| Total | 12,238 | 100.0% |
Internet Access in Prairieville
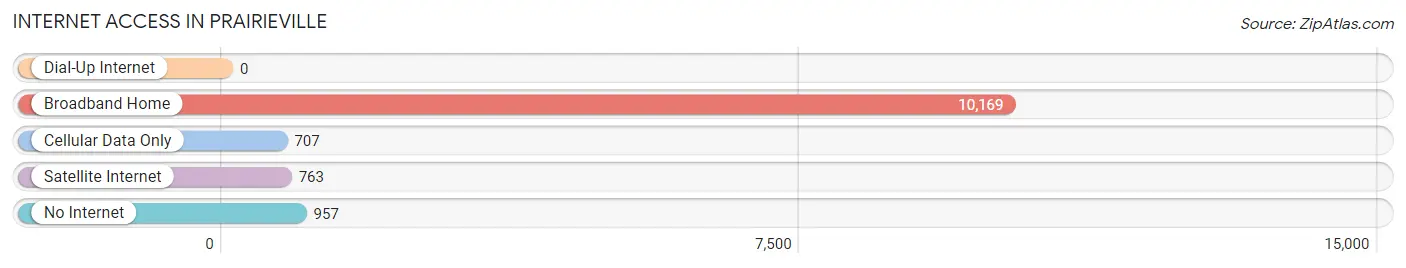
| Internet Type | # Households | % Households |
| Dial-Up Internet | 0 | 0.0% |
| Broadband Home | 10,169 | 83.1% |
| Cellular Data Only | 707 | 5.8% |
| Satellite Internet | 763 | 6.2% |
| No Internet | 957 | 7.8% |
| Total | 12,238 | 100.0% |
Prairieville Summary
Prairieville is a census-designated place (CDP) located in Ascension Parish, Louisiana, United States. The population was 8,814 at the 2010 census. It is part of the Baton Rouge Metropolitan Statistical Area.
History
Prairieville was founded in 1809 by French settlers who named it after the prairie-like landscape of the area. The area was originally part of the Spanish West Florida province, and was later annexed by the United States in 1810. The area was then part of the Louisiana Territory until it became part of the state of Louisiana in 1812.
In the early 19th century, the area was home to a large number of cotton plantations, and the town was a major center for the cotton trade. The town was also home to a number of churches, including the First Baptist Church of Prairieville, which was founded in 1820.
In the late 19th century, the town began to grow as a result of the railroad, which connected it to Baton Rouge and New Orleans. The town was incorporated in 1894, and the first mayor was elected in 1895.
Geography
Prairieville is located at 30°20'25" North, 90°59'45" West (30.340278, -90.995833). According to the United States Census Bureau, the CDP has a total area of 8.3 square miles (21.5 km2), of which 8.2 square miles (21.3 km2) is land and 0.1 square mile (0.2 km2) (1.17%) is water.
Economy
Prairieville is home to a number of businesses, including a number of retail stores, restaurants, and other services. The town is also home to a number of industrial and manufacturing businesses, including a number of oil and gas companies.
Demographics
As of the census of 2000, there were 8,814 people, 3,093 households, and 2,521 families residing in the CDP. The population density was 1,072.2 people per square mile (414.3/km2). There were 3,309 housing units at an average density of 403.2 per square mile (155.6/km2). The racial makeup of the CDP was 87.45% White, 10.45% African American, 0.25% Native American, 0.45% Asian, 0.02% Pacific Islander, 0.45% from other races, and 0.93% from two or more races. Hispanic or Latino of any race were 1.45% of the population.
There were 3,093 households, out of which 44.2% had children under the age of 18 living with them, 63.2% were married couples living together, 11.2% had a female householder with no husband present, and 21.3% were non-families. 17.2% of all households were made up of individuals, and 5.2% had someone living alone who was 65 years of age or older. The average household size was 2.86 and the average family size was 3.23.
In the CDP, the population was spread out, with 30.2% under the age of 18, 8.2% from 18 to 24, 33.2% from 25 to 44, 20.7% from 45 to 64, and 7.7% who were 65 years of age or older. The median age was 33 years. For every 100 females, there were 97.2 males. For every 100 females age 18 and over, there were 94.2 males.
The median income for a household in the CDP was $50,945, and the median income for a family was $55,917. Males had a median income of $41,919 versus $27,917 for females. The per capita income for the CDP was $20,945. About 4.2% of families and 5.3% of the population were below the poverty line, including 6.2% of those under age 18 and 6.2% of those age 65 or over.
Common Questions
What is Per Capita Income in Prairieville?
Per Capita income in Prairieville is $46,811.
What is the Median Family Income in Prairieville?
Median Family Income in Prairieville is $124,654.
What is the Median Household income in Prairieville?
Median Household Income in Prairieville is $111,927.
What is Income or Wage Gap in Prairieville?
Income or Wage Gap in Prairieville is 41.9%.
Women in Prairieville earn 58.1 cents for every dollar earned by a man.
What is Inequality or Gini Index in Prairieville?
Inequality or Gini Index in Prairieville is 0.37.
What is the Total Population of Prairieville?
Total Population of Prairieville is 34,215.
What is the Total Male Population of Prairieville?
Total Male Population of Prairieville is 16,373.
What is the Total Female Population of Prairieville?
Total Female Population of Prairieville is 17,842.
What is the Ratio of Males per 100 Females in Prairieville?
There are 91.77 Males per 100 Females in Prairieville.
What is the Ratio of Females per 100 Males in Prairieville?
There are 108.97 Females per 100 Males in Prairieville.
What is the Median Population Age in Prairieville?
Median Population Age in Prairieville is 36.6 Years.
What is the Average Family Size in Prairieville
Average Family Size in Prairieville is 3.2 People.
What is the Average Household Size in Prairieville
Average Household Size in Prairieville is 2.8 People.
How Large is the Labor Force in Prairieville?
There are 18,588 People in the Labor Forcein in Prairieville.
What is the Percentage of People in the Labor Force in Prairieville?
71.1% of People are in the Labor Force in Prairieville.
What is the Unemployment Rate in Prairieville?
Unemployment Rate in Prairieville is 2.9%.