North Salt Lake, UT Map & Demographics
North Salt Lake Map
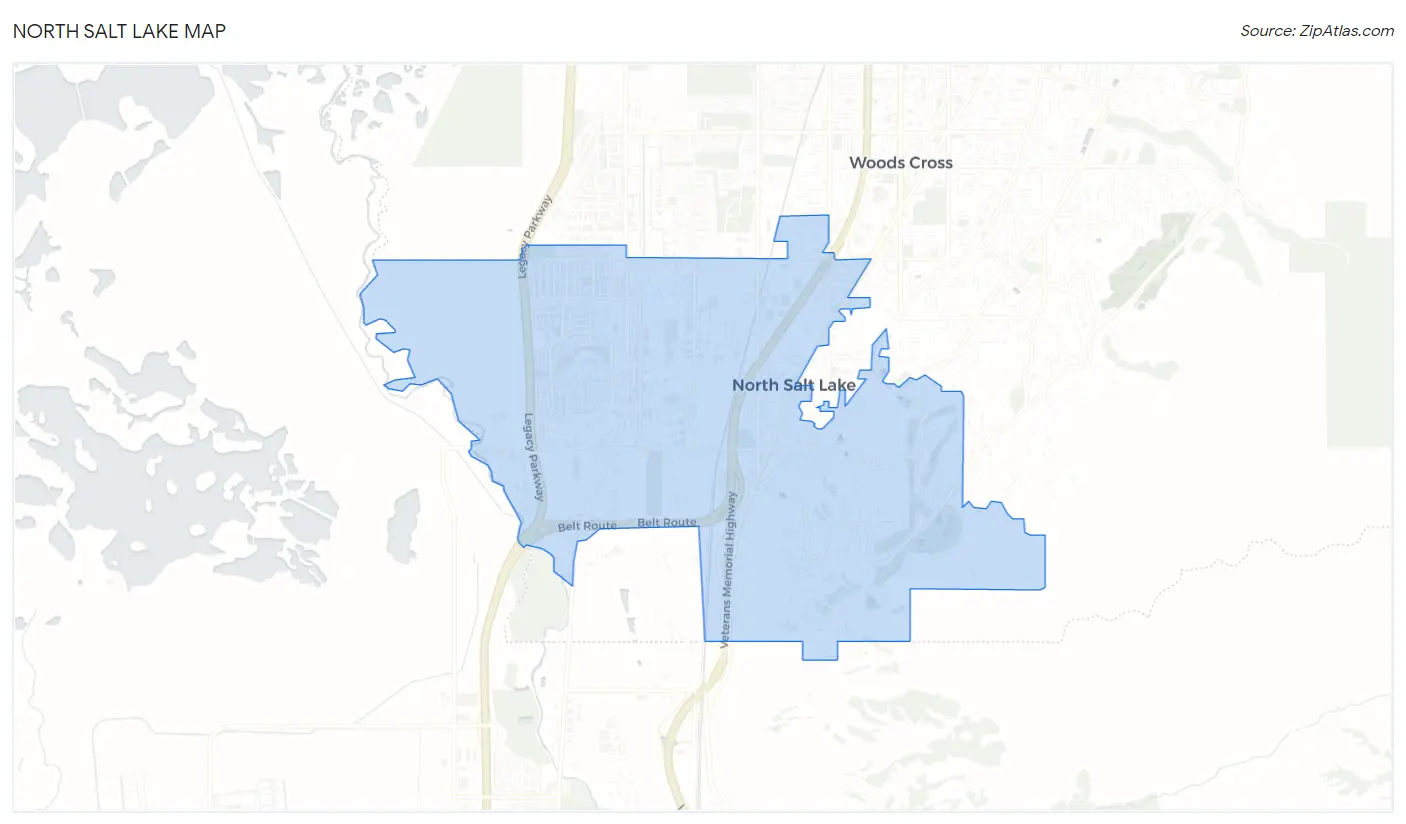
North Salt Lake Overview
$42,165
PER CAPITA INCOME
$108,137
AVG FAMILY INCOME
$94,365
AVG HOUSEHOLD INCOME
37.7%
WAGE / INCOME GAP [ % ]
62.3¢/ $1
WAGE / INCOME GAP [ $ ]
0.41
INEQUALITY / GINI INDEX
21,875
TOTAL POPULATION
10,893
MALE POPULATION
10,982
FEMALE POPULATION
99.19
MALES / 100 FEMALES
100.82
FEMALES / 100 MALES
33.6
MEDIAN AGE
3.3
AVG FAMILY SIZE
2.9
AVG HOUSEHOLD SIZE
12,203
LABOR FORCE [ PEOPLE ]
73.9%
PERCENT IN LABOR FORCE
3.1%
UNEMPLOYMENT RATE
North Salt Lake Zip Codes
North Salt Lake Area Codes
Income in North Salt Lake
Income Overview in North Salt Lake
Per Capita Income in North Salt Lake is $42,165, while median incomes of families and households are $108,137 and $94,365 respectively.
| Characteristic | Number | Measure |
| Per Capita Income | 21,875 | $42,165 |
| Median Family Income | 5,884 | $108,137 |
| Mean Family Income | 5,884 | $125,968 |
| Median Household Income | 7,515 | $94,365 |
| Mean Household Income | 7,515 | $118,925 |
| Income Deficit | 5,884 | $0 |
| Wage / Income Gap (%) | 21,875 | 37.69% |
| Wage / Income Gap ($) | 21,875 | 62.31¢ per $1 |
| Gini / Inequality Index | 21,875 | 0.41 |
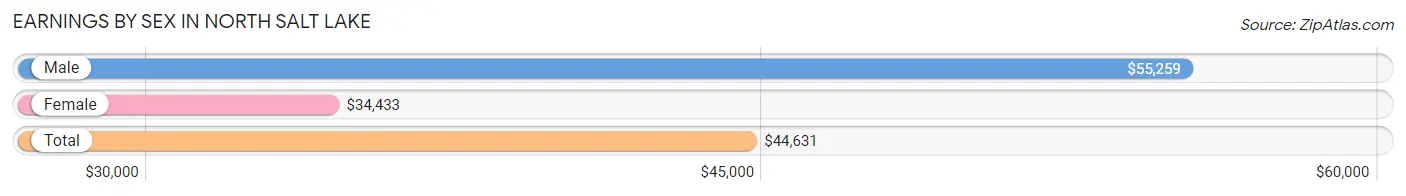
Earnings by Sex in North Salt Lake
Average Earnings in North Salt Lake are $44,631, $55,259 for men and $34,433 for women, a difference of 37.7%.
| Sex | Number | Average Earnings |
| Male | 6,913 (54.6%) | $55,259 |
| Female | 5,748 (45.4%) | $34,433 |
| Total | 12,661 (100.0%) | $44,631 |
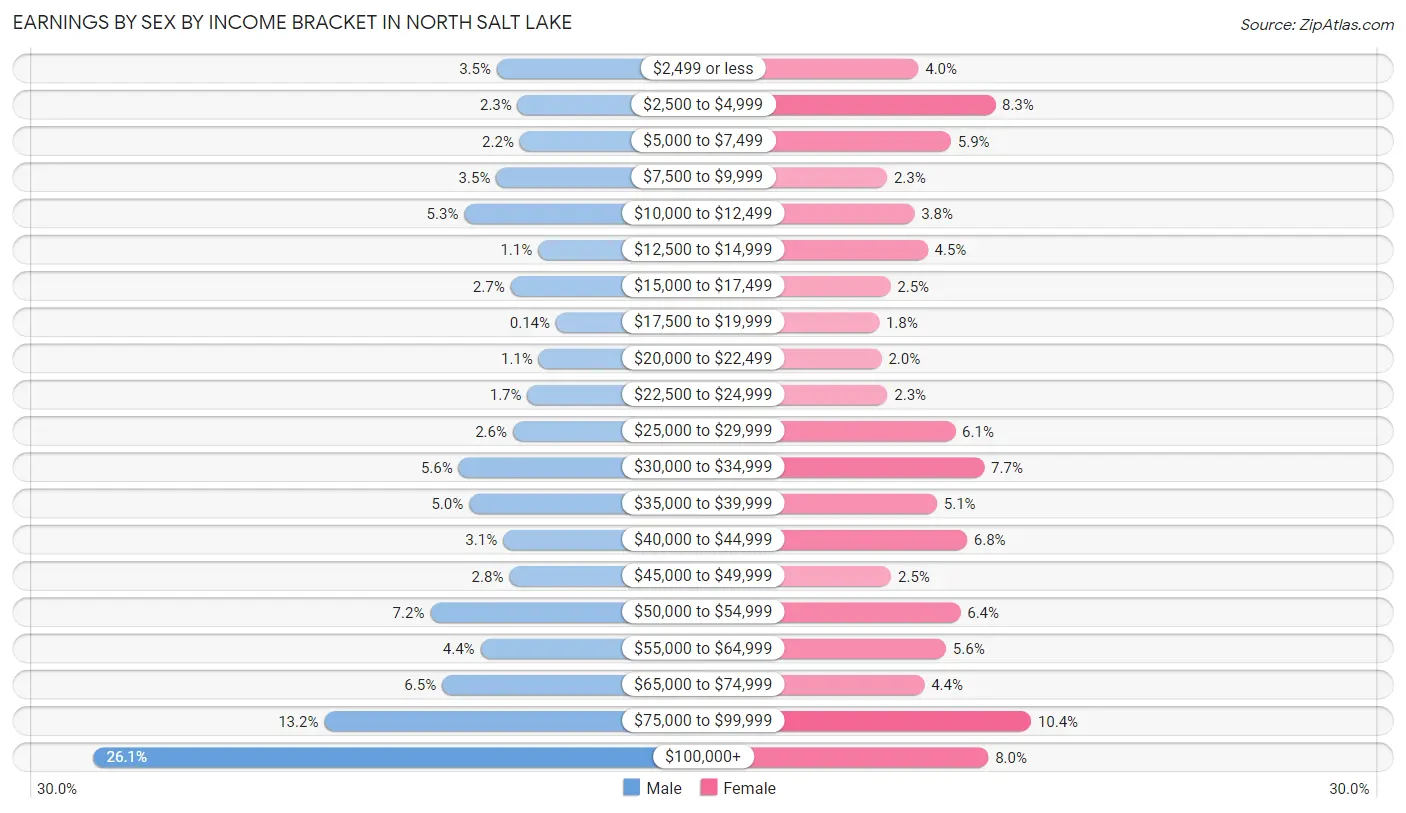
Earnings by Sex by Income Bracket in North Salt Lake
The most common earnings brackets in North Salt Lake are $100,000+ for men (1,806 | 26.1%) and $75,000 to $99,999 for women (595 | 10.3%).
| Income | Male | Female |
| $2,499 or less | 239 (3.5%) | 231 (4.0%) |
| $2,500 to $4,999 | 158 (2.3%) | 479 (8.3%) |
| $5,000 to $7,499 | 150 (2.2%) | 336 (5.9%) |
| $7,500 to $9,999 | 241 (3.5%) | 130 (2.3%) |
| $10,000 to $12,499 | 366 (5.3%) | 218 (3.8%) |
| $12,500 to $14,999 | 79 (1.1%) | 261 (4.5%) |
| $15,000 to $17,499 | 186 (2.7%) | 141 (2.5%) |
| $17,500 to $19,999 | 10 (0.1%) | 104 (1.8%) |
| $20,000 to $22,499 | 77 (1.1%) | 112 (1.9%) |
| $22,500 to $24,999 | 120 (1.7%) | 131 (2.3%) |
| $25,000 to $29,999 | 177 (2.6%) | 350 (6.1%) |
| $30,000 to $34,999 | 388 (5.6%) | 444 (7.7%) |
| $35,000 to $39,999 | 347 (5.0%) | 291 (5.1%) |
| $40,000 to $44,999 | 215 (3.1%) | 388 (6.8%) |
| $45,000 to $49,999 | 191 (2.8%) | 143 (2.5%) |
| $50,000 to $54,999 | 498 (7.2%) | 367 (6.4%) |
| $55,000 to $64,999 | 303 (4.4%) | 320 (5.6%) |
| $65,000 to $74,999 | 452 (6.5%) | 250 (4.3%) |
| $75,000 to $99,999 | 910 (13.2%) | 595 (10.3%) |
| $100,000+ | 1,806 (26.1%) | 457 (8.0%) |
| Total | 6,913 (100.0%) | 5,748 (100.0%) |
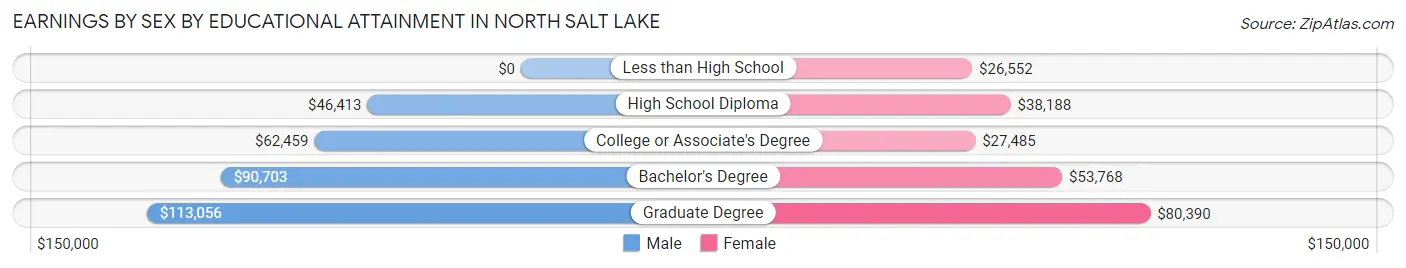
Earnings by Sex by Educational Attainment in North Salt Lake
Average earnings in North Salt Lake are $74,717 for men and $41,244 for women, a difference of 44.8%. Men with an educational attainment of graduate degree enjoy the highest average annual earnings of $113,056, while those with high school diploma education earn the least with $46,413. Women with an educational attainment of graduate degree earn the most with the average annual earnings of $80,390, while those with less than high school education have the smallest earnings of $26,552.
| Educational Attainment | Male Income | Female Income |
| Less than High School | - | - |
| High School Diploma | $46,413 | $38,188 |
| College or Associate's Degree | $62,459 | $27,485 |
| Bachelor's Degree | $90,703 | $53,768 |
| Graduate Degree | $113,056 | $80,390 |
| Total | $74,717 | $41,244 |
Family Income in North Salt Lake
Family Income Brackets in North Salt Lake
According to the North Salt Lake family income data, there are 1,453 families falling into the $100,000 to $149,999 income range, which is the most common income bracket and makes up 24.7% of all families. Conversely, the $10,000 to $14,999 income bracket is the least frequent group with only 41 families (0.7%) belonging to this category.
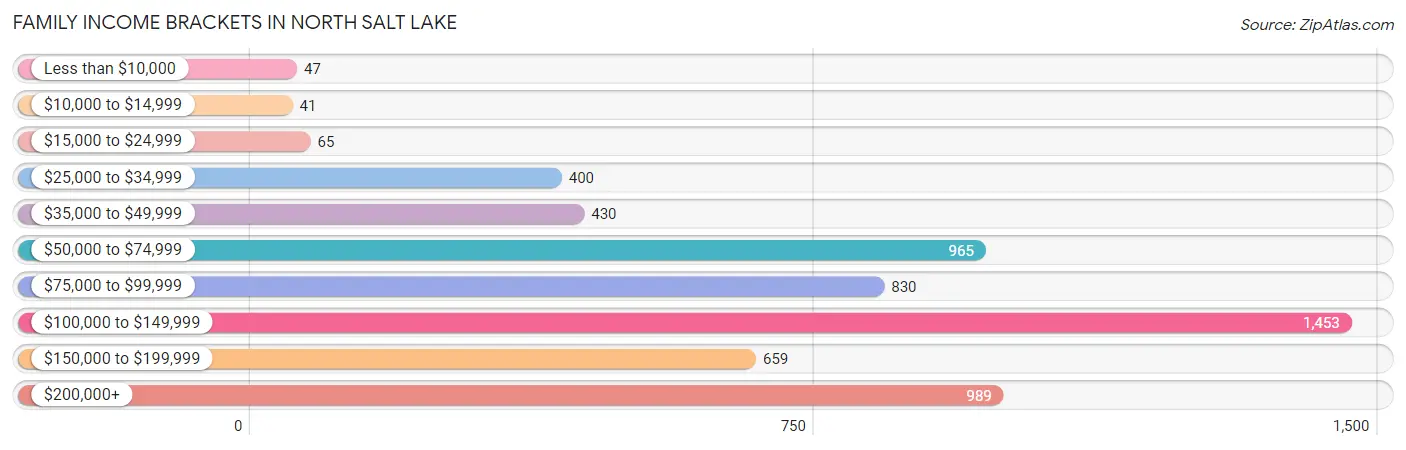
| Income Bracket | # Families | % Families |
| Less than $10,000 | 47 | 0.8% |
| $10,000 to $14,999 | 41 | 0.7% |
| $15,000 to $24,999 | 65 | 1.1% |
| $25,000 to $34,999 | 400 | 6.8% |
| $35,000 to $49,999 | 430 | 7.3% |
| $50,000 to $74,999 | 965 | 16.4% |
| $75,000 to $99,999 | 830 | 14.1% |
| $100,000 to $149,999 | 1,453 | 24.7% |
| $150,000 to $199,999 | 659 | 11.2% |
| $200,000+ | 989 | 16.8% |
Family Income by Famaliy Size in North Salt Lake
5-person families (605 | 10.3%) account for the highest median family income in North Salt Lake with $136,191 per family, while 2-person families (2,540 | 43.2%) have the highest median income of $45,102 per family member.
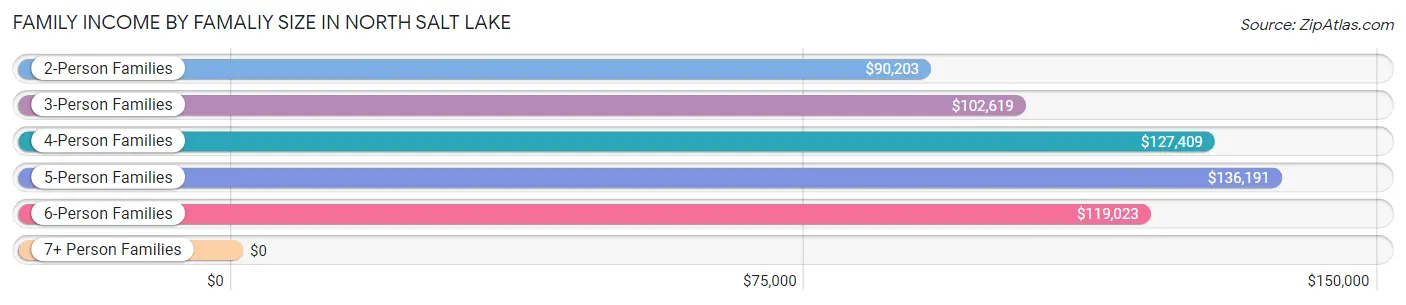
| Income Bracket | # Families | Median Income |
| 2-Person Families | 2,540 (43.2%) | $90,203 |
| 3-Person Families | 1,202 (20.4%) | $102,619 |
| 4-Person Families | 955 (16.2%) | $127,409 |
| 5-Person Families | 605 (10.3%) | $136,191 |
| 6-Person Families | 453 (7.7%) | $119,023 |
| 7+ Person Families | 129 (2.2%) | $0 |
| Total | 5,884 (100.0%) | $108,137 |
Family Income by Number of Earners in North Salt Lake
The median family income in North Salt Lake is $108,137, with families comprising 3+ earners (848) having the highest median family income of $137,370, while families with no earners (512) have the lowest median family income of $64,435, accounting for 14.4% and 8.7% of families, respectively.
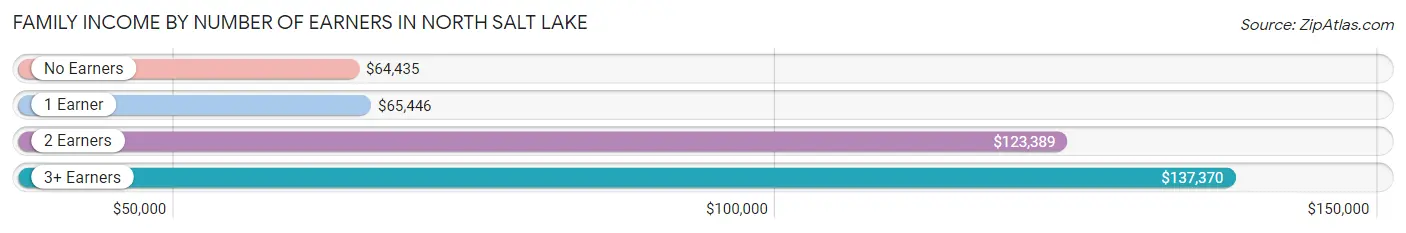
| Number of Earners | # Families | Median Income |
| No Earners | 512 (8.7%) | $64,435 |
| 1 Earner | 1,917 (32.6%) | $65,446 |
| 2 Earners | 2,607 (44.3%) | $123,389 |
| 3+ Earners | 848 (14.4%) | $137,370 |
| Total | 5,884 (100.0%) | $108,137 |
Household Income in North Salt Lake
Household Income Brackets in North Salt Lake
With 1,661 households falling in the category, the $100,000 to $149,999 income range is the most frequent in North Salt Lake, accounting for 22.1% of all households. In contrast, only 53 households (0.7%) fall into the $10,000 to $14,999 income bracket, making it the least populous group.
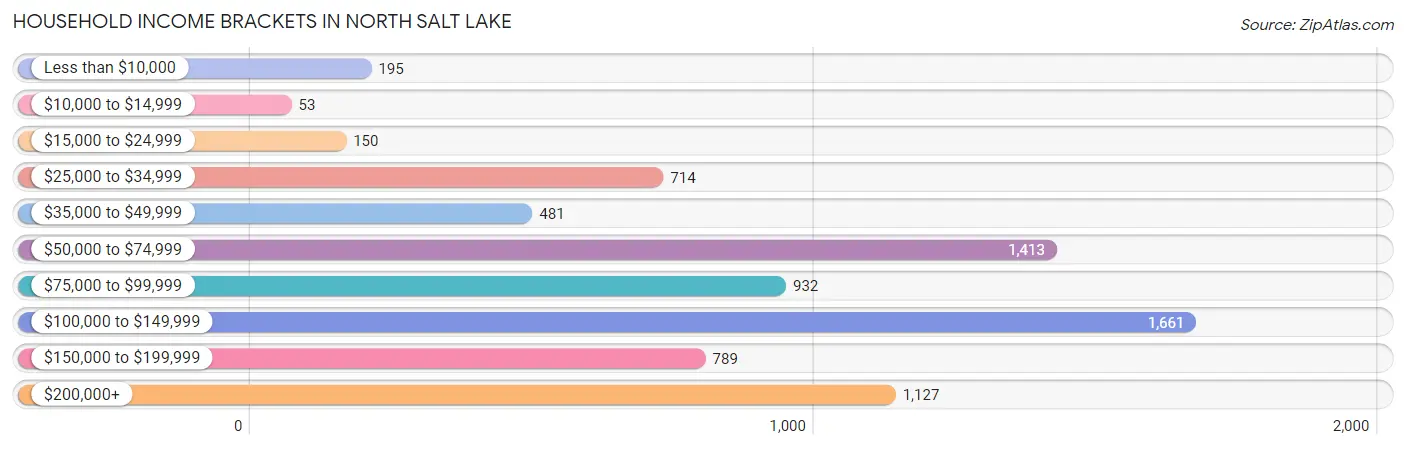
| Income Bracket | # Households | % Households |
| Less than $10,000 | 195 | 2.6% |
| $10,000 to $14,999 | 53 | 0.7% |
| $15,000 to $24,999 | 150 | 2.0% |
| $25,000 to $34,999 | 714 | 9.5% |
| $35,000 to $49,999 | 481 | 6.4% |
| $50,000 to $74,999 | 1,413 | 18.8% |
| $75,000 to $99,999 | 932 | 12.4% |
| $100,000 to $149,999 | 1,661 | 22.1% |
| $150,000 to $199,999 | 789 | 10.5% |
| $200,000+ | 1,127 | 15.0% |
Household Income by Householder Age in North Salt Lake
The median household income in North Salt Lake is $94,365, with the highest median household income of $145,484 found in the 45 to 64 years age bracket for the primary householder. A total of 1,980 households (26.4%) fall into this category. Meanwhile, the 15 to 24 years age bracket for the primary householder has the lowest median household income of $43,558, with 671 households (8.9%) in this group.
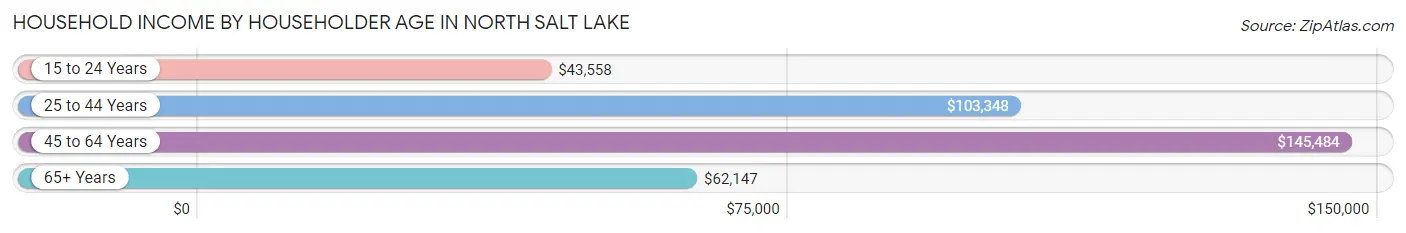
| Income Bracket | # Households | Median Income |
| 15 to 24 Years | 671 (8.9%) | $43,558 |
| 25 to 44 Years | 3,481 (46.3%) | $103,348 |
| 45 to 64 Years | 1,980 (26.4%) | $145,484 |
| 65+ Years | 1,383 (18.4%) | $62,147 |
| Total | 7,515 (100.0%) | $94,365 |
Poverty in North Salt Lake
Income Below Poverty by Sex and Age in North Salt Lake
With 3.5% poverty level for males and 3.6% for females among the residents of North Salt Lake, 18 to 24 year old males and 18 to 24 year old females are the most vulnerable to poverty, with 195 males (15.4%) and 207 females (17.5%) in their respective age groups living below the poverty level.
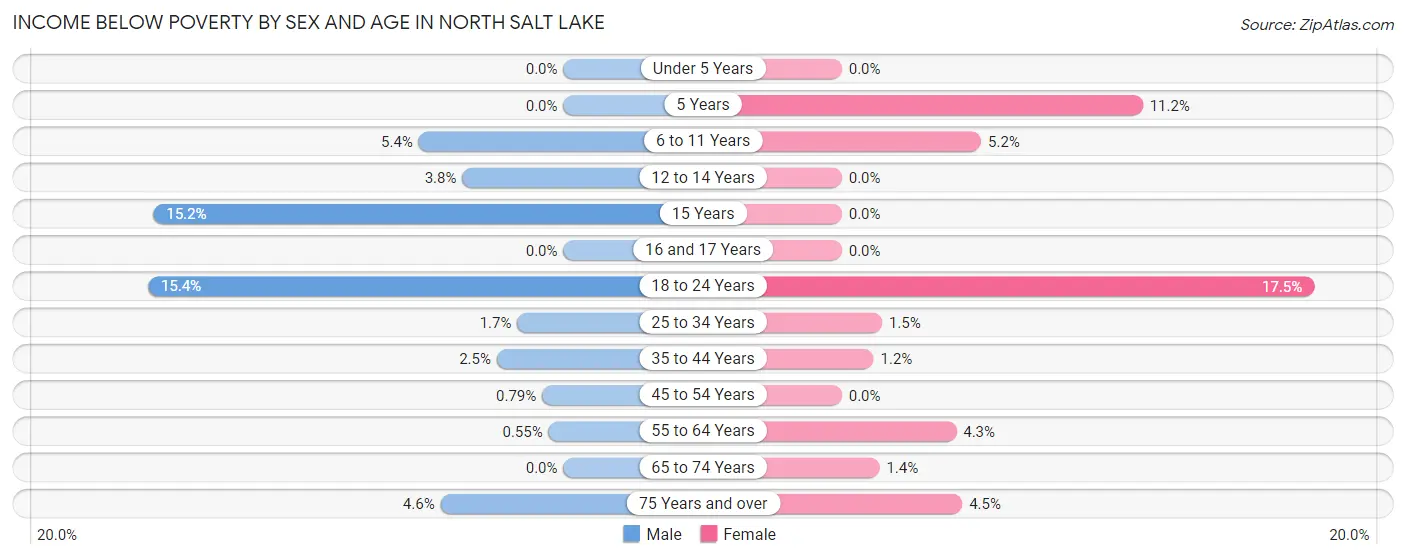
| Age Bracket | Male | Female |
| Under 5 Years | 0 (0.0%) | 0 (0.0%) |
| 5 Years | 0 (0.0%) | 20 (11.2%) |
| 6 to 11 Years | 46 (5.4%) | 46 (5.2%) |
| 12 to 14 Years | 21 (3.7%) | 0 (0.0%) |
| 15 Years | 21 (15.2%) | 0 (0.0%) |
| 16 and 17 Years | 0 (0.0%) | 0 (0.0%) |
| 18 to 24 Years | 195 (15.4%) | 207 (17.5%) |
| 25 to 34 Years | 24 (1.7%) | 20 (1.5%) |
| 35 to 44 Years | 49 (2.5%) | 24 (1.2%) |
| 45 to 54 Years | 8 (0.8%) | 0 (0.0%) |
| 55 to 64 Years | 6 (0.5%) | 38 (4.3%) |
| 65 to 74 Years | 0 (0.0%) | 9 (1.4%) |
| 75 Years and over | 15 (4.6%) | 28 (4.5%) |
| Total | 385 (3.5%) | 392 (3.6%) |
Income Above Poverty by Sex and Age in North Salt Lake
According to the poverty statistics in North Salt Lake, males aged under 5 years and females aged under 5 years are the age groups that are most secure financially, with 100.0% of males and 100.0% of females in these age groups living above the poverty line.
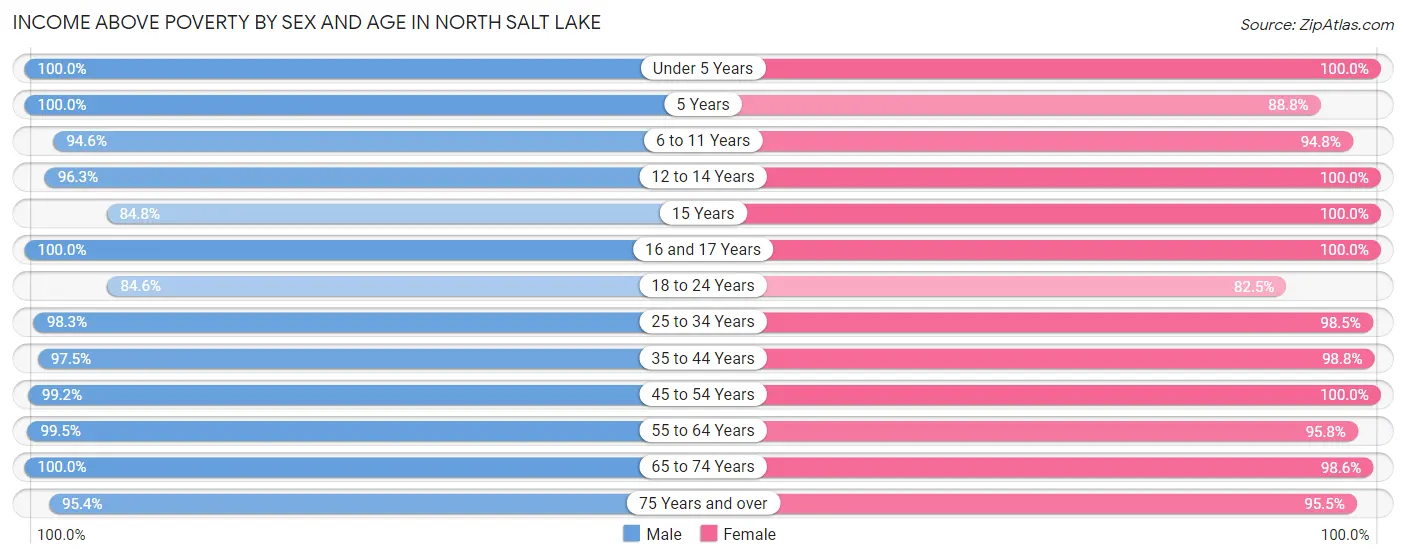
| Age Bracket | Male | Female |
| Under 5 Years | 734 (100.0%) | 817 (100.0%) |
| 5 Years | 402 (100.0%) | 159 (88.8%) |
| 6 to 11 Years | 811 (94.6%) | 844 (94.8%) |
| 12 to 14 Years | 539 (96.3%) | 577 (100.0%) |
| 15 Years | 117 (84.8%) | 208 (100.0%) |
| 16 and 17 Years | 490 (100.0%) | 423 (100.0%) |
| 18 to 24 Years | 1,070 (84.6%) | 974 (82.5%) |
| 25 to 34 Years | 1,382 (98.3%) | 1,325 (98.5%) |
| 35 to 44 Years | 1,936 (97.5%) | 2,016 (98.8%) |
| 45 to 54 Years | 1,000 (99.2%) | 1,160 (100.0%) |
| 55 to 64 Years | 1,090 (99.5%) | 856 (95.8%) |
| 65 to 74 Years | 623 (100.0%) | 633 (98.6%) |
| 75 Years and over | 314 (95.4%) | 598 (95.5%) |
| Total | 10,508 (96.5%) | 10,590 (96.4%) |
Income Below Poverty Among Married-Couple Families in North Salt Lake
The poverty statistics for married-couple families in North Salt Lake show that 0.3% or 15 of the total 4,604 families live below the poverty line. Families with no children have the highest poverty rate of 0.7%, comprising of 15 families. On the other hand, families with 1 or 2 children have the lowest poverty rate of 0.0%, which includes 0 families.
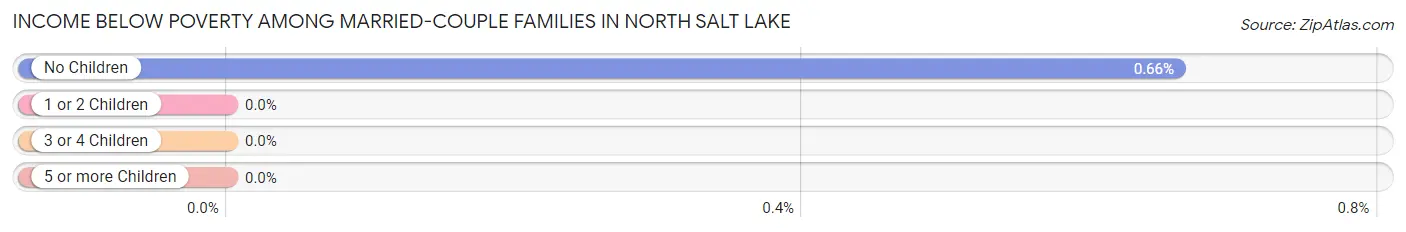
| Children | Above Poverty | Below Poverty |
| No Children | 2,271 (99.3%) | 15 (0.7%) |
| 1 or 2 Children | 1,527 (100.0%) | 0 (0.0%) |
| 3 or 4 Children | 737 (100.0%) | 0 (0.0%) |
| 5 or more Children | 54 (100.0%) | 0 (0.0%) |
| Total | 4,589 (99.7%) | 15 (0.3%) |
Income Below Poverty Among Single-Parent Households in North Salt Lake
According to the poverty data in North Salt Lake, 21.2% or 49 single-father households and 7.5% or 79 single-mother households are living below the poverty line. Among single-father households, those with 1 or 2 children have the highest poverty rate, with 49 households (32.0%) experiencing poverty. Likewise, among single-mother households, those with 3 or 4 children have the highest poverty rate, with 20 households (25.3%) falling below the poverty line.
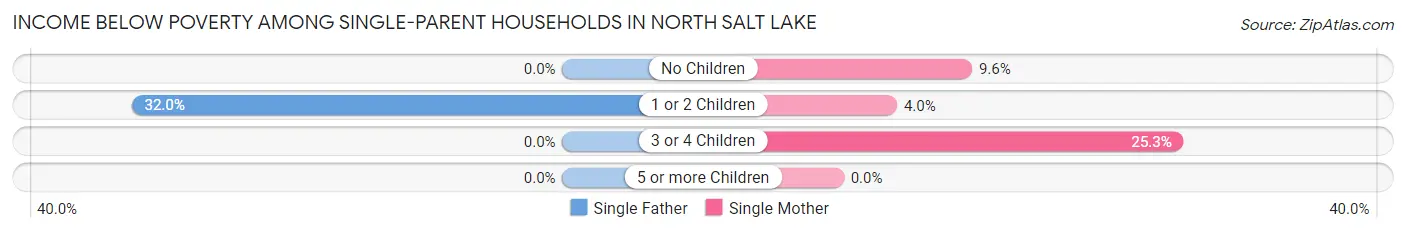
| Children | Single Father | Single Mother |
| No Children | 0 (0.0%) | 35 (9.6%) |
| 1 or 2 Children | 49 (32.0%) | 24 (4.0%) |
| 3 or 4 Children | 0 (0.0%) | 20 (25.3%) |
| 5 or more Children | 0 (0.0%) | 0 (0.0%) |
| Total | 49 (21.2%) | 79 (7.5%) |
Income Below Poverty Among Married-Couple vs Single-Parent Households in North Salt Lake
The poverty data for North Salt Lake shows that 15 of the married-couple family households (0.3%) and 128 of the single-parent households (10.0%) are living below the poverty level. Within the married-couple family households, those with no children have the highest poverty rate, with 15 households (0.7%) falling below the poverty line. Among the single-parent households, those with 3 or 4 children have the highest poverty rate, with 20 household (14.2%) living below poverty.
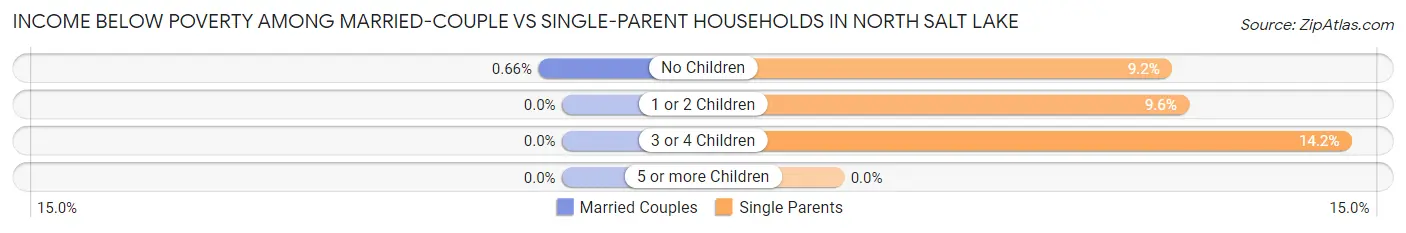
| Children | Married-Couple Families | Single-Parent Households |
| No Children | 15 (0.7%) | 35 (9.2%) |
| 1 or 2 Children | 0 (0.0%) | 73 (9.6%) |
| 3 or 4 Children | 0 (0.0%) | 20 (14.2%) |
| 5 or more Children | 0 (0.0%) | 0 (0.0%) |
| Total | 15 (0.3%) | 128 (10.0%) |
Race in North Salt Lake
The most populous races in North Salt Lake are White / Caucasian (18,036 | 82.5%), Hispanic or Latino (3,280 | 15.0%), and Two or more Races (2,113 | 9.7%).
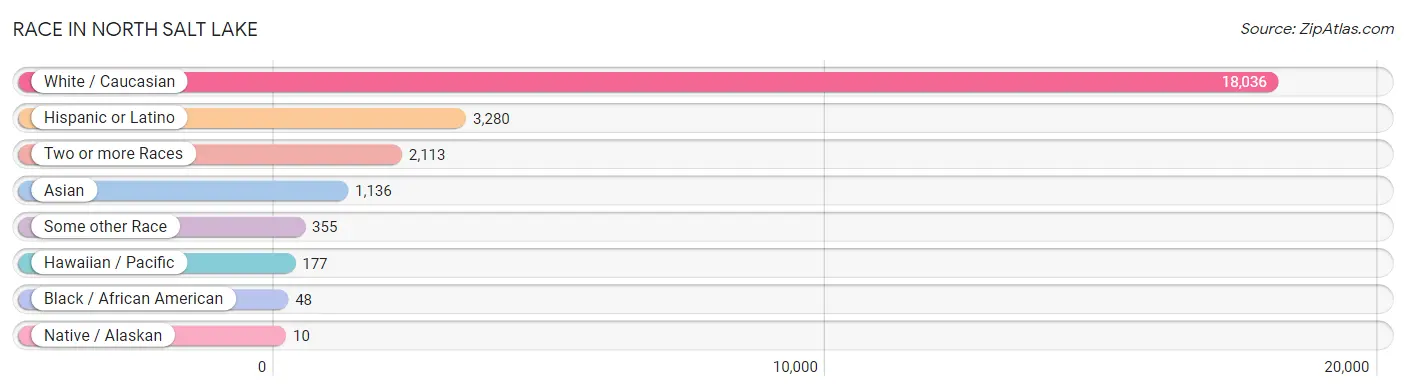
| Race | # Population | % Population |
| Asian | 1,136 | 5.2% |
| Black / African American | 48 | 0.2% |
| Hawaiian / Pacific | 177 | 0.8% |
| Hispanic or Latino | 3,280 | 15.0% |
| Native / Alaskan | 10 | 0.1% |
| White / Caucasian | 18,036 | 82.5% |
| Two or more Races | 2,113 | 9.7% |
| Some other Race | 355 | 1.6% |
| Total | 21,875 | 100.0% |
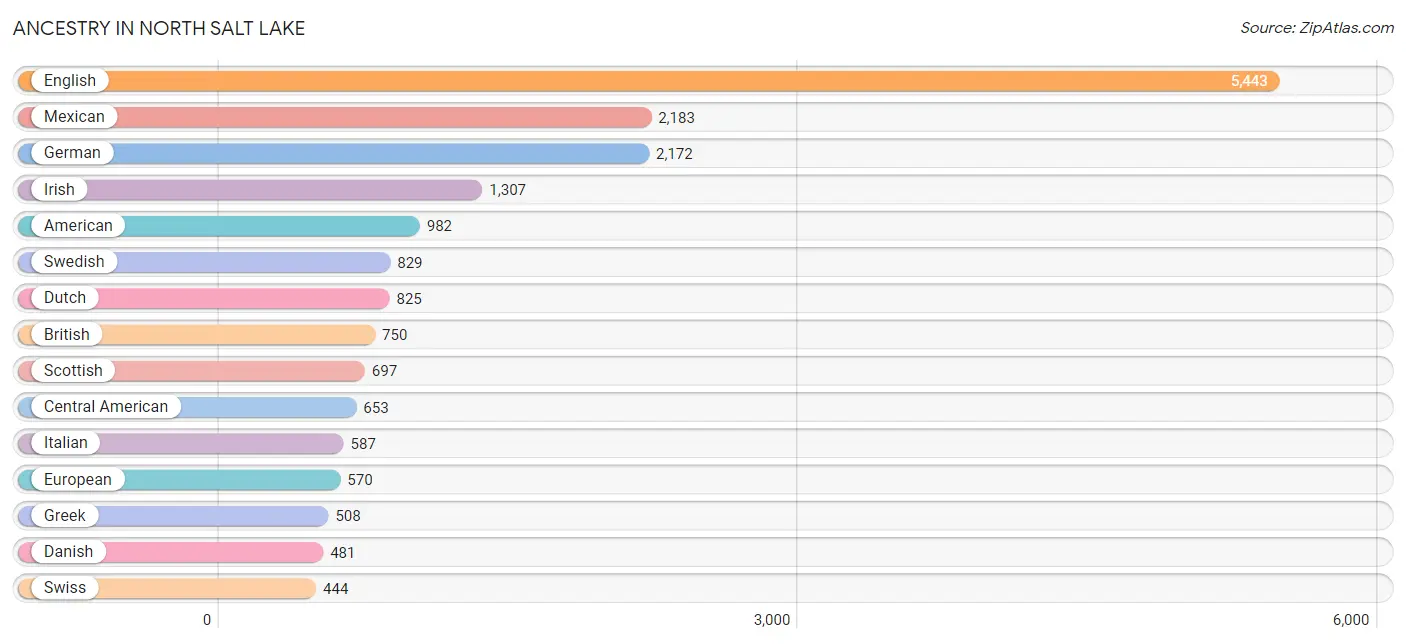
Ancestry in North Salt Lake
The most populous ancestries reported in North Salt Lake are English (5,443 | 24.9%), Mexican (2,183 | 10.0%), German (2,172 | 9.9%), Irish (1,307 | 6.0%), and American (982 | 4.5%), together accounting for 55.3% of all North Salt Lake residents.
| Ancestry | # Population | % Population |
| American | 982 | 4.5% |
| Apache | 10 | 0.1% |
| Arab | 75 | 0.3% |
| Armenian | 55 | 0.3% |
| Austrian | 48 | 0.2% |
| Bhutanese | 249 | 1.1% |
| Bolivian | 15 | 0.1% |
| Brazilian | 149 | 0.7% |
| British | 750 | 3.4% |
| Burmese | 248 | 1.1% |
| Canadian | 78 | 0.4% |
| Central American | 653 | 3.0% |
| Cherokee | 67 | 0.3% |
| Chilean | 13 | 0.1% |
| Colombian | 57 | 0.3% |
| Cuban | 72 | 0.3% |
| Czechoslovakian | 7 | 0.0% |
| Danish | 481 | 2.2% |
| Dutch | 825 | 3.8% |
| Eastern European | 48 | 0.2% |
| Ecuadorian | 150 | 0.7% |
| English | 5,443 | 24.9% |
| European | 570 | 2.6% |
| Fijian | 59 | 0.3% |
| Finnish | 35 | 0.2% |
| French | 256 | 1.2% |
| French Canadian | 40 | 0.2% |
| German | 2,172 | 9.9% |
| Ghanaian | 85 | 0.4% |
| Greek | 508 | 2.3% |
| Guatemalan | 166 | 0.8% |
| Hungarian | 4 | 0.0% |
| Icelander | 6 | 0.0% |
| Indian (Asian) | 53 | 0.2% |
| Iranian | 17 | 0.1% |
| Irish | 1,307 | 6.0% |
| Italian | 587 | 2.7% |
| Korean | 130 | 0.6% |
| Lebanese | 75 | 0.3% |
| Lithuanian | 63 | 0.3% |
| Malaysian | 52 | 0.2% |
| Mexican | 2,183 | 10.0% |
| Navajo | 5 | 0.0% |
| Nicaraguan | 54 | 0.3% |
| Northern European | 32 | 0.2% |
| Norwegian | 424 | 1.9% |
| Pakistani | 22 | 0.1% |
| Peruvian | 88 | 0.4% |
| Polish | 105 | 0.5% |
| Portuguese | 47 | 0.2% |
| Puerto Rican | 31 | 0.1% |
| Russian | 29 | 0.1% |
| Salvadoran | 433 | 2.0% |
| Samoan | 45 | 0.2% |
| Scandinavian | 280 | 1.3% |
| Scotch-Irish | 86 | 0.4% |
| Scottish | 697 | 3.2% |
| Sioux | 5 | 0.0% |
| South American | 330 | 1.5% |
| Spanish | 11 | 0.1% |
| Subsaharan African | 85 | 0.4% |
| Swedish | 829 | 3.8% |
| Swiss | 444 | 2.0% |
| Thai | 131 | 0.6% |
| Tongan | 54 | 0.3% |
| Ukrainian | 28 | 0.1% |
| Uruguayan | 7 | 0.0% |
| Welsh | 256 | 1.2% | View All 68 Rows |
Immigrants in North Salt Lake
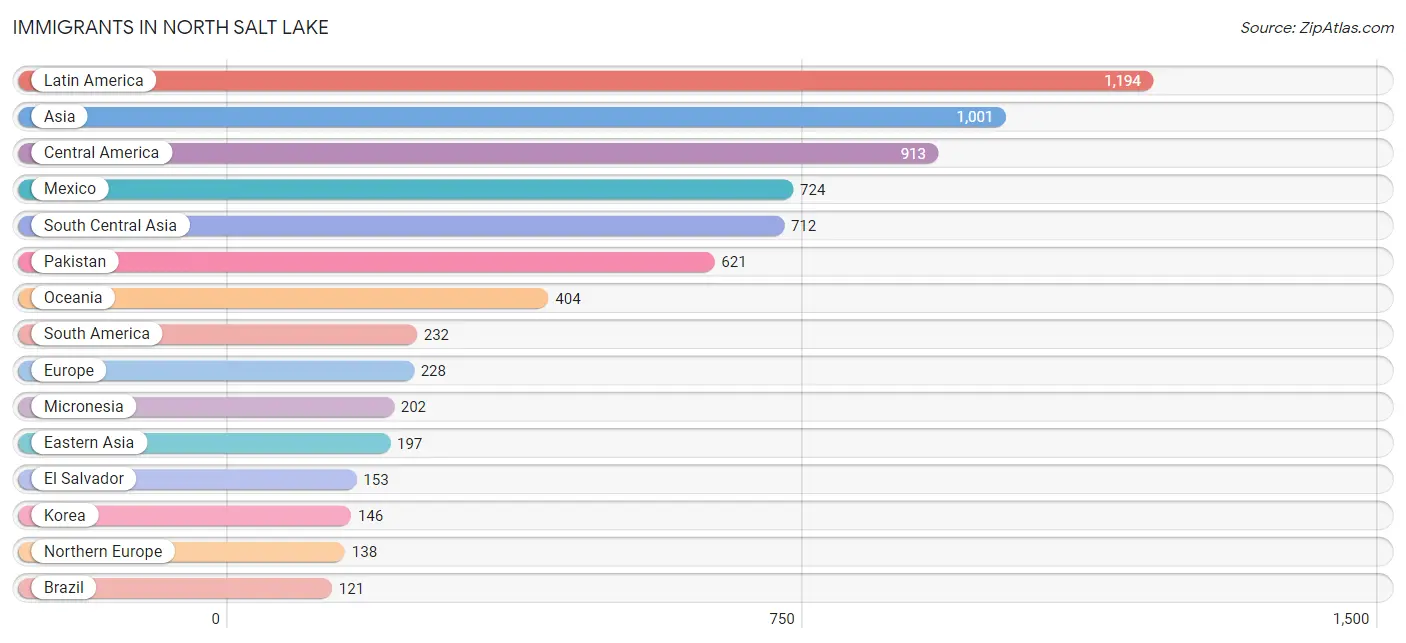
The most numerous immigrant groups reported in North Salt Lake came from Latin America (1,194 | 5.5%), Asia (1,001 | 4.6%), Central America (913 | 4.2%), Mexico (724 | 3.3%), and South Central Asia (712 | 3.3%), together accounting for 20.8% of all North Salt Lake residents.
| Immigration Origin | # Population | % Population |
| Asia | 1,001 | 4.6% |
| Bolivia | 28 | 0.1% |
| Brazil | 121 | 0.5% |
| Canada | 97 | 0.4% |
| Caribbean | 49 | 0.2% |
| Central America | 913 | 4.2% |
| China | 20 | 0.1% |
| Cuba | 49 | 0.2% |
| Eastern Asia | 197 | 0.9% |
| Ecuador | 35 | 0.2% |
| El Salvador | 153 | 0.7% |
| England | 6 | 0.0% |
| Europe | 228 | 1.0% |
| France | 24 | 0.1% |
| Germany | 6 | 0.0% |
| Guatemala | 19 | 0.1% |
| India | 91 | 0.4% |
| Japan | 31 | 0.1% |
| Korea | 146 | 0.7% |
| Latin America | 1,194 | 5.5% |
| Lebanon | 62 | 0.3% |
| Mexico | 724 | 3.3% |
| Micronesia | 202 | 0.9% |
| Netherlands | 47 | 0.2% |
| Nicaragua | 17 | 0.1% |
| Northern Europe | 138 | 0.6% |
| Oceania | 404 | 1.8% |
| Pakistan | 621 | 2.8% |
| Peru | 41 | 0.2% |
| South America | 232 | 1.1% |
| South Central Asia | 712 | 3.3% |
| South Eastern Asia | 30 | 0.1% |
| Switzerland | 13 | 0.1% |
| Thailand | 7 | 0.0% |
| Uruguay | 7 | 0.0% |
| Vietnam | 23 | 0.1% |
| Western Asia | 62 | 0.3% |
| Western Europe | 90 | 0.4% | View All 38 Rows |
Sex and Age in North Salt Lake
Sex and Age in North Salt Lake
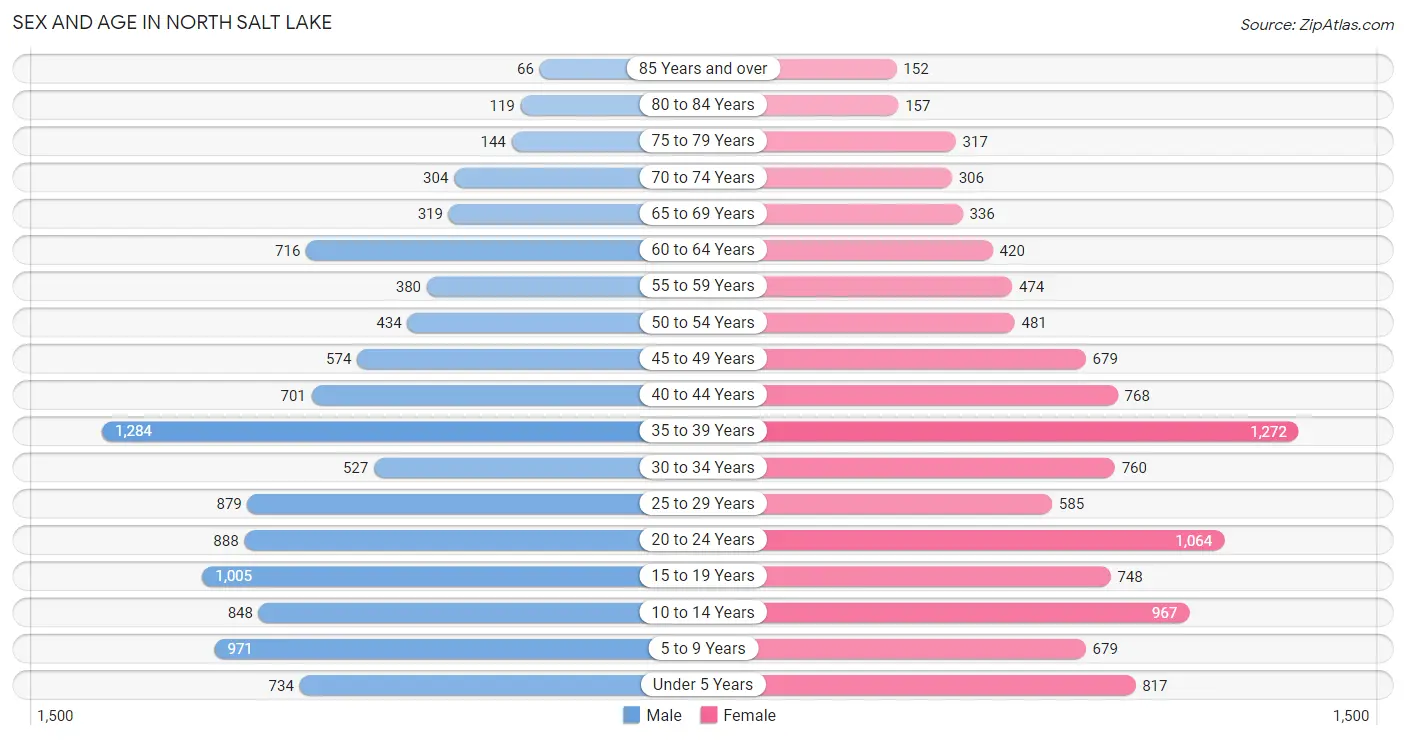
The most populous age groups in North Salt Lake are 35 to 39 Years (1,284 | 11.8%) for men and 35 to 39 Years (1,272 | 11.6%) for women.
| Age Bracket | Male | Female |
| Under 5 Years | 734 (6.7%) | 817 (7.4%) |
| 5 to 9 Years | 971 (8.9%) | 679 (6.2%) |
| 10 to 14 Years | 848 (7.8%) | 967 (8.8%) |
| 15 to 19 Years | 1,005 (9.2%) | 748 (6.8%) |
| 20 to 24 Years | 888 (8.2%) | 1,064 (9.7%) |
| 25 to 29 Years | 879 (8.1%) | 585 (5.3%) |
| 30 to 34 Years | 527 (4.8%) | 760 (6.9%) |
| 35 to 39 Years | 1,284 (11.8%) | 1,272 (11.6%) |
| 40 to 44 Years | 701 (6.4%) | 768 (7.0%) |
| 45 to 49 Years | 574 (5.3%) | 679 (6.2%) |
| 50 to 54 Years | 434 (4.0%) | 481 (4.4%) |
| 55 to 59 Years | 380 (3.5%) | 474 (4.3%) |
| 60 to 64 Years | 716 (6.6%) | 420 (3.8%) |
| 65 to 69 Years | 319 (2.9%) | 336 (3.1%) |
| 70 to 74 Years | 304 (2.8%) | 306 (2.8%) |
| 75 to 79 Years | 144 (1.3%) | 317 (2.9%) |
| 80 to 84 Years | 119 (1.1%) | 157 (1.4%) |
| 85 Years and over | 66 (0.6%) | 152 (1.4%) |
| Total | 10,893 (100.0%) | 10,982 (100.0%) |
Families and Households in North Salt Lake
Median Family Size in North Salt Lake
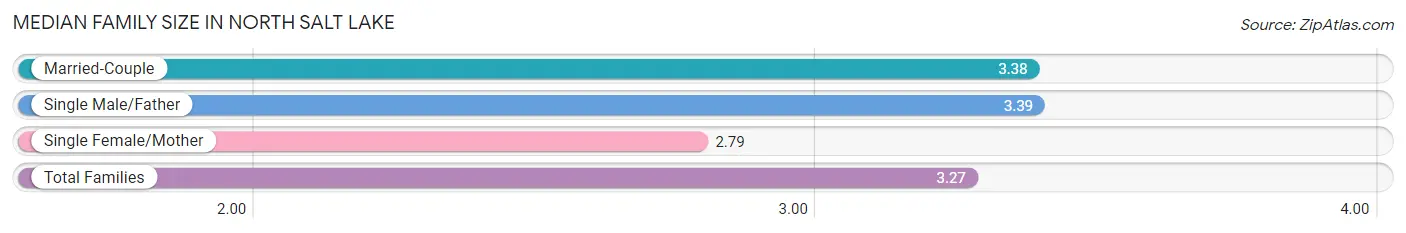
The median family size in North Salt Lake is 3.27 persons per family, with single male/father families (231 | 3.9%) accounting for the largest median family size of 3.39 persons per family. On the other hand, single female/mother families (1,049 | 17.8%) represent the smallest median family size with 2.79 persons per family.
| Family Type | # Families | Family Size |
| Married-Couple | 4,604 (78.2%) | 3.38 |
| Single Male/Father | 231 (3.9%) | 3.39 |
| Single Female/Mother | 1,049 (17.8%) | 2.79 |
| Total Families | 5,884 (100.0%) | 3.27 |
Median Household Size in North Salt Lake
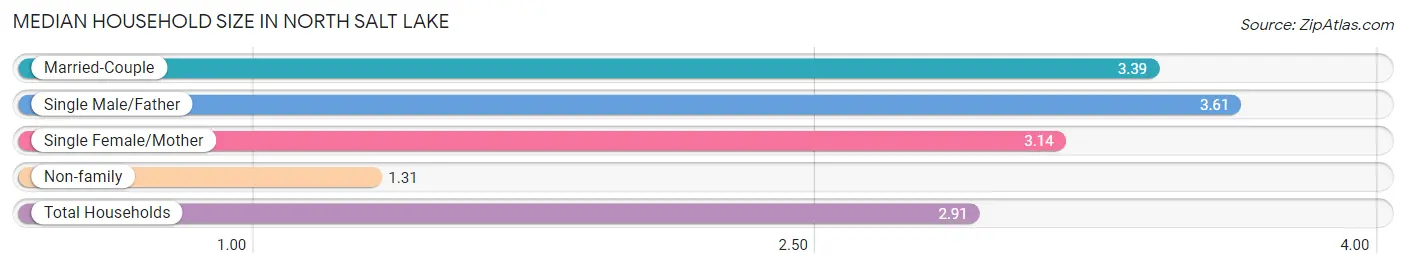
The median household size in North Salt Lake is 2.91 persons per household, with single male/father households (231 | 3.1%) accounting for the largest median household size of 3.61 persons per household. non-family households (1,631 | 21.7%) represent the smallest median household size with 1.31 persons per household.
| Household Type | # Households | Household Size |
| Married-Couple | 4,604 (61.3%) | 3.39 |
| Single Male/Father | 231 (3.1%) | 3.61 |
| Single Female/Mother | 1,049 (14.0%) | 3.14 |
| Non-family | 1,631 (21.7%) | 1.31 |
| Total Households | 7,515 (100.0%) | 2.91 |
Household Size by Marriage Status in North Salt Lake
Out of a total of 7,515 households in North Salt Lake, 5,884 (78.3%) are family households, while 1,631 (21.7%) are nonfamily households. The most numerous type of family households are 2-person households, comprising 2,274, and the most common type of nonfamily households are 1-person households, comprising 1,237.
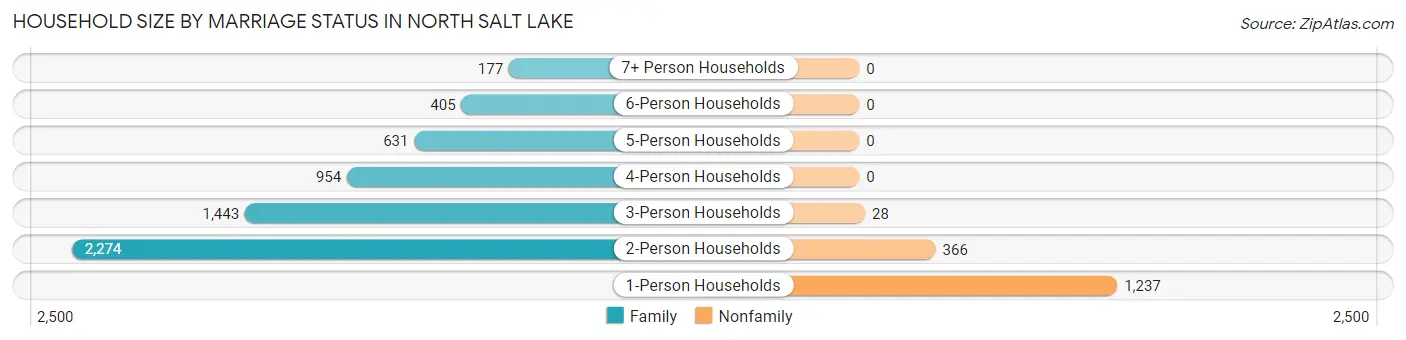
| Household Size | Family Households | Nonfamily Households |
| 1-Person Households | - | 1,237 (16.5%) |
| 2-Person Households | 2,274 (30.3%) | 366 (4.9%) |
| 3-Person Households | 1,443 (19.2%) | 28 (0.4%) |
| 4-Person Households | 954 (12.7%) | 0 (0.0%) |
| 5-Person Households | 631 (8.4%) | 0 (0.0%) |
| 6-Person Households | 405 (5.4%) | 0 (0.0%) |
| 7+ Person Households | 177 (2.4%) | 0 (0.0%) |
| Total | 5,884 (78.3%) | 1,631 (21.7%) |
Female Fertility in North Salt Lake
Fertility by Age in North Salt Lake
Average fertility rate in North Salt Lake is 69.0 births per 1,000 women. Women in the age bracket of 20 to 34 years have the highest fertility rate with 153.0 births per 1,000 women. Women in the age bracket of 20 to 34 years acount for 89.3% of all women with births.
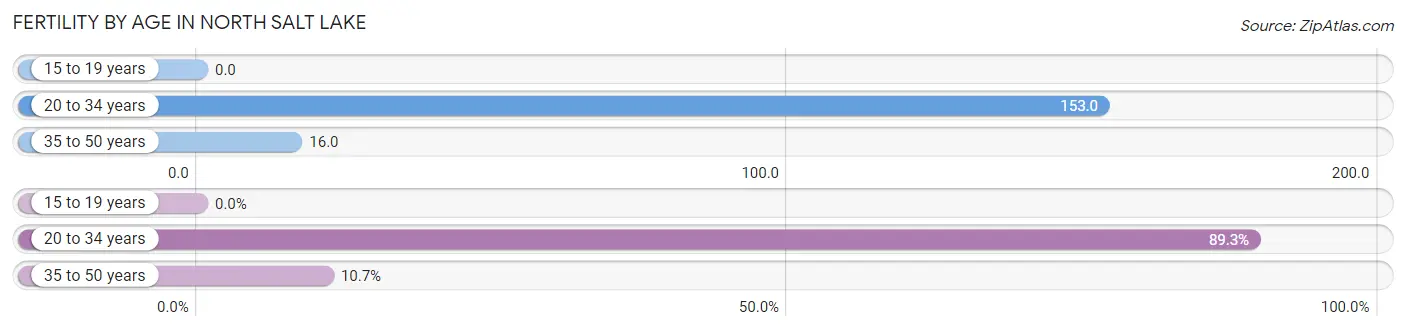
| Age Bracket | Women with Births | Births / 1,000 Women |
| 15 to 19 years | 0 (0.0%) | 0.0 |
| 20 to 34 years | 368 (89.3%) | 153.0 |
| 35 to 50 years | 44 (10.7%) | 16.0 |
| Total | 412 (100.0%) | 69.0 |
Fertility by Age by Marriage Status in North Salt Lake
80.3% of women with births (412) in North Salt Lake are married. The highest percentage of unmarried women with births falls into 20 to 34 years age bracket with 22.0% of them unmarried at the time of birth, while the lowest percentage of unmarried women with births belong to 35 to 50 years age bracket with 0.0% of them unmarried.
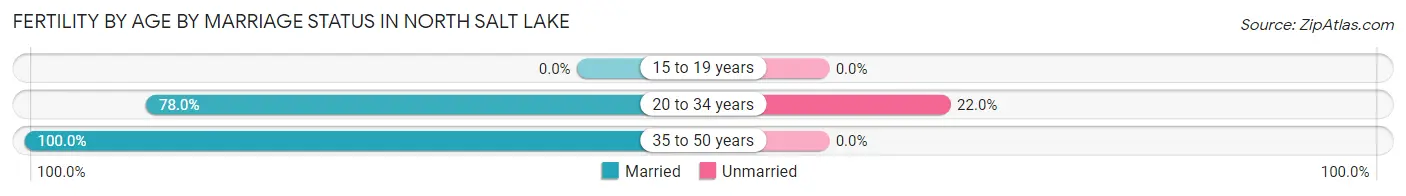
| Age Bracket | Married | Unmarried |
| 15 to 19 years | 0 (0.0%) | 0 (0.0%) |
| 20 to 34 years | 287 (78.0%) | 81 (22.0%) |
| 35 to 50 years | 44 (100.0%) | 0 (0.0%) |
| Total | 331 (80.3%) | 81 (19.7%) |
Fertility by Education in North Salt Lake
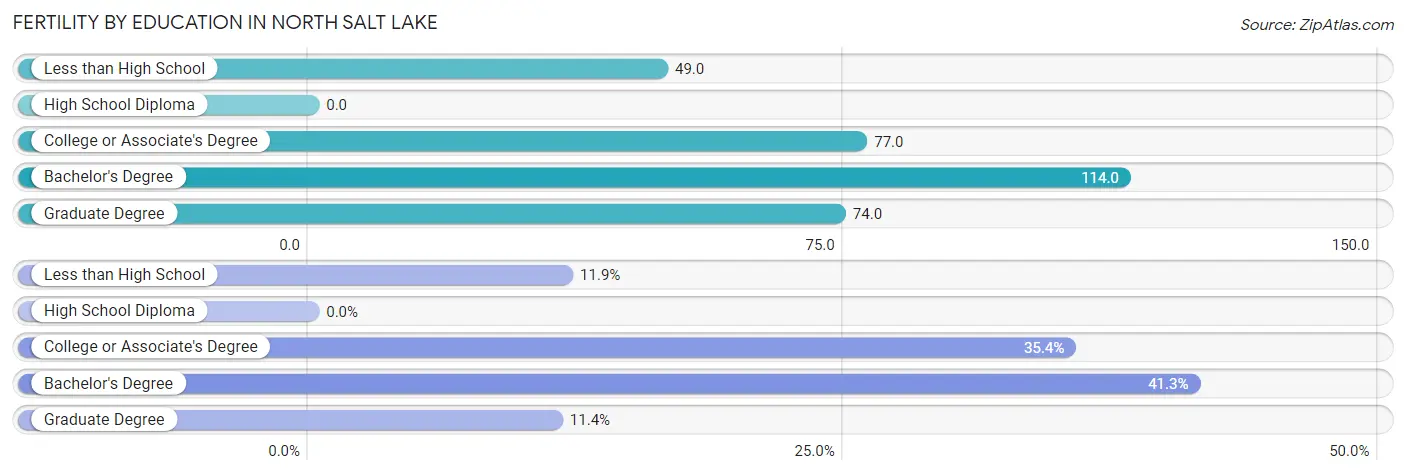
| Educational Attainment | Women with Births | Births / 1,000 Women |
| Less than High School | 49 (11.9%) | 49.0 |
| High School Diploma | 0 (0.0%) | 0.0 |
| College or Associate's Degree | 146 (35.4%) | 77.0 |
| Bachelor's Degree | 170 (41.3%) | 114.0 |
| Graduate Degree | 47 (11.4%) | 74.0 |
| Total | 412 (100.0%) | 69.0 |
Fertility by Education by Marriage Status in North Salt Lake
19.7% of women with births in North Salt Lake are unmarried. Women with the educational attainment of college or associate's degree are most likely to be married with 100.0% of them married at childbirth, while women with the educational attainment of less than high school are least likely to be married with 100.0% of them unmarried at childbirth.
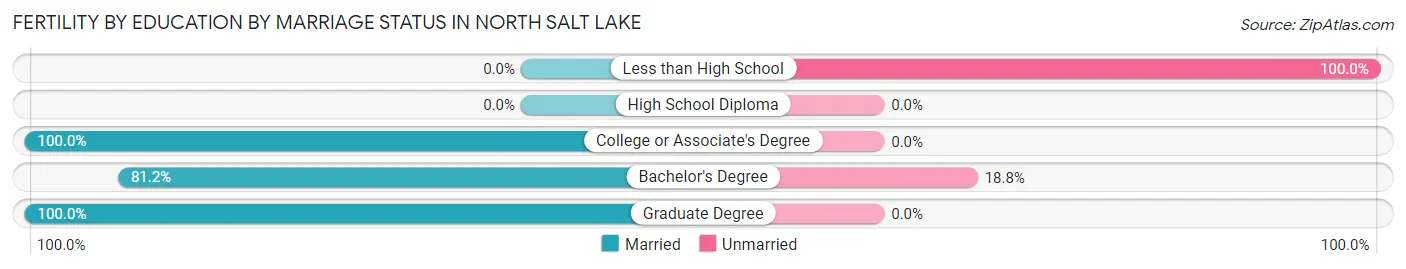
| Educational Attainment | Married | Unmarried |
| Less than High School | 0 (0.0%) | 49 (100.0%) |
| High School Diploma | 0 (0.0%) | 0 (0.0%) |
| College or Associate's Degree | 146 (100.0%) | 0 (0.0%) |
| Bachelor's Degree | 138 (81.2%) | 32 (18.8%) |
| Graduate Degree | 47 (100.0%) | 0 (0.0%) |
| Total | 331 (80.3%) | 81 (19.7%) |
Employment Characteristics in North Salt Lake
Employment by Class of Employer in North Salt Lake
Among the 11,616 employed individuals in North Salt Lake, private company employees (8,441 | 72.7%), state government employees (1,055 | 9.1%), and not-for-profit organizations (777 | 6.7%) make up the most common classes of employment.
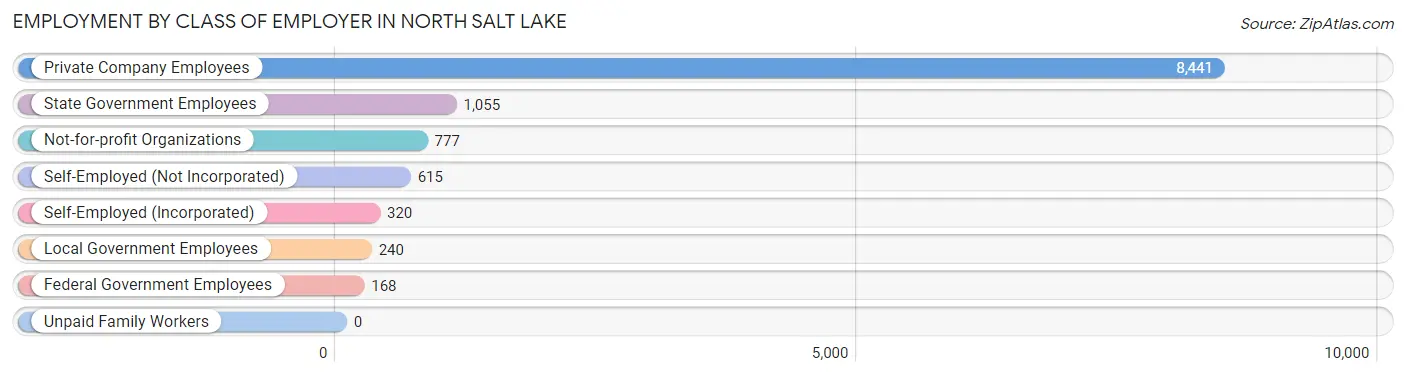
| Employer Class | # Employees | % Employees |
| Private Company Employees | 8,441 | 72.7% |
| Self-Employed (Incorporated) | 320 | 2.8% |
| Self-Employed (Not Incorporated) | 615 | 5.3% |
| Not-for-profit Organizations | 777 | 6.7% |
| Local Government Employees | 240 | 2.1% |
| State Government Employees | 1,055 | 9.1% |
| Federal Government Employees | 168 | 1.5% |
| Unpaid Family Workers | 0 | 0.0% |
| Total | 11,616 | 100.0% |
Employment Status by Age in North Salt Lake
According to the labor force statistics for North Salt Lake, out of the total population over 16 years of age (16,513), 73.9% or 12,203 individuals are in the labor force, with 3.1% or 378 of them unemployed. The age group with the highest labor force participation rate is 25 to 29 years, with 91.1% or 1,334 individuals in the labor force. Within the labor force, the 75 years and over age range has the highest percentage of unemployed individuals, with 38.3% or 36 of them being unemployed.
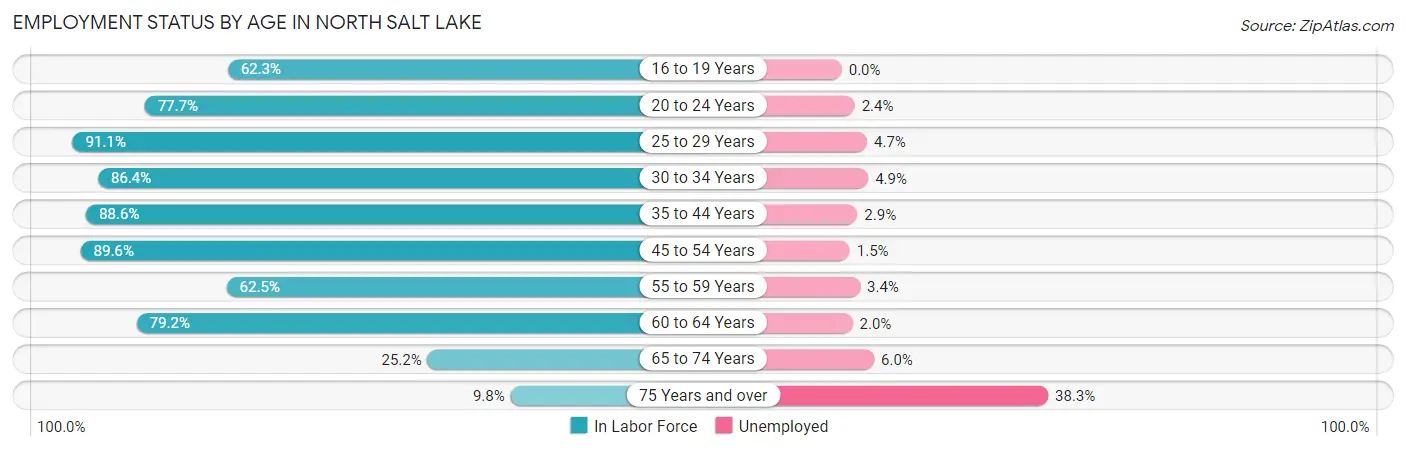
| Age Bracket | In Labor Force | Unemployed |
| 16 to 19 Years | 877 (62.3%) | 0 (0.0%) |
| 20 to 24 Years | 1,517 (77.7%) | 36 (2.4%) |
| 25 to 29 Years | 1,334 (91.1%) | 63 (4.7%) |
| 30 to 34 Years | 1,112 (86.4%) | 54 (4.9%) |
| 35 to 44 Years | 3,566 (88.6%) | 103 (2.9%) |
| 45 to 54 Years | 1,943 (89.6%) | 29 (1.5%) |
| 55 to 59 Years | 534 (62.5%) | 18 (3.4%) |
| 60 to 64 Years | 900 (79.2%) | 18 (2.0%) |
| 65 to 74 Years | 319 (25.2%) | 19 (6.0%) |
| 75 Years and over | 94 (9.8%) | 36 (38.3%) |
| Total | 12,203 (73.9%) | 378 (3.1%) |
Employment Status by Educational Attainment in North Salt Lake
According to labor force statistics for North Salt Lake, 85.9% of individuals (9,392) out of the total population between 25 and 64 years of age (10,934) are in the labor force, with 3.1% or 291 of them being unemployed. The group with the highest labor force participation rate are those with the educational attainment of high school diploma, with 95.3% or 2,086 individuals in the labor force. Within the labor force, individuals with college / associate degree education have the highest percentage of unemployment, with 6.0% or 177 of them being unemployed.
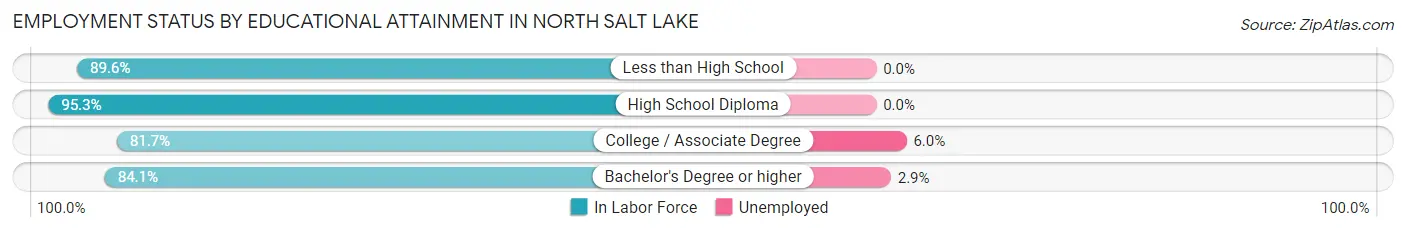
| Educational Attainment | In Labor Force | Unemployed |
| Less than High School | 509 (89.6%) | 0 (0.0%) |
| High School Diploma | 2,086 (95.3%) | 0 (0.0%) |
| College / Associate Degree | 2,956 (81.7%) | 217 (6.0%) |
| Bachelor's Degree or higher | 3,834 (84.1%) | 132 (2.9%) |
| Total | 9,392 (85.9%) | 339 (3.1%) |
Employment Occupations by Sex in North Salt Lake
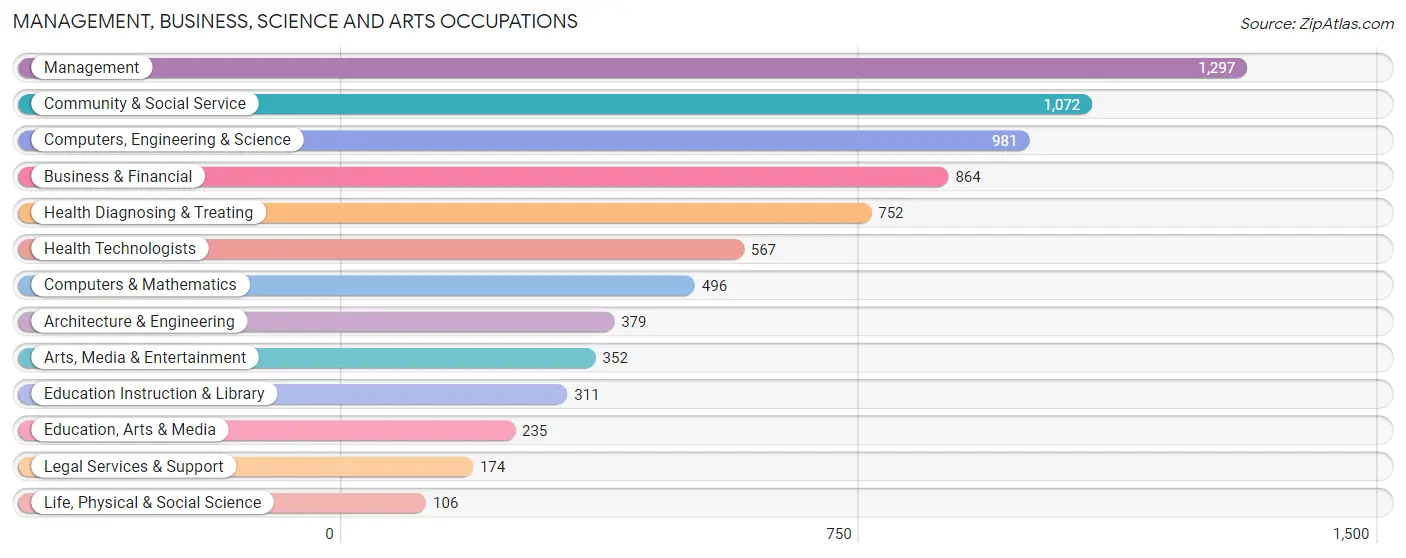
Management, Business, Science and Arts Occupations
The most common Management, Business, Science and Arts occupations in North Salt Lake are Management (1,297 | 11.0%), Community & Social Service (1,072 | 9.1%), Computers, Engineering & Science (981 | 8.3%), Business & Financial (864 | 7.3%), and Health Diagnosing & Treating (752 | 6.4%).
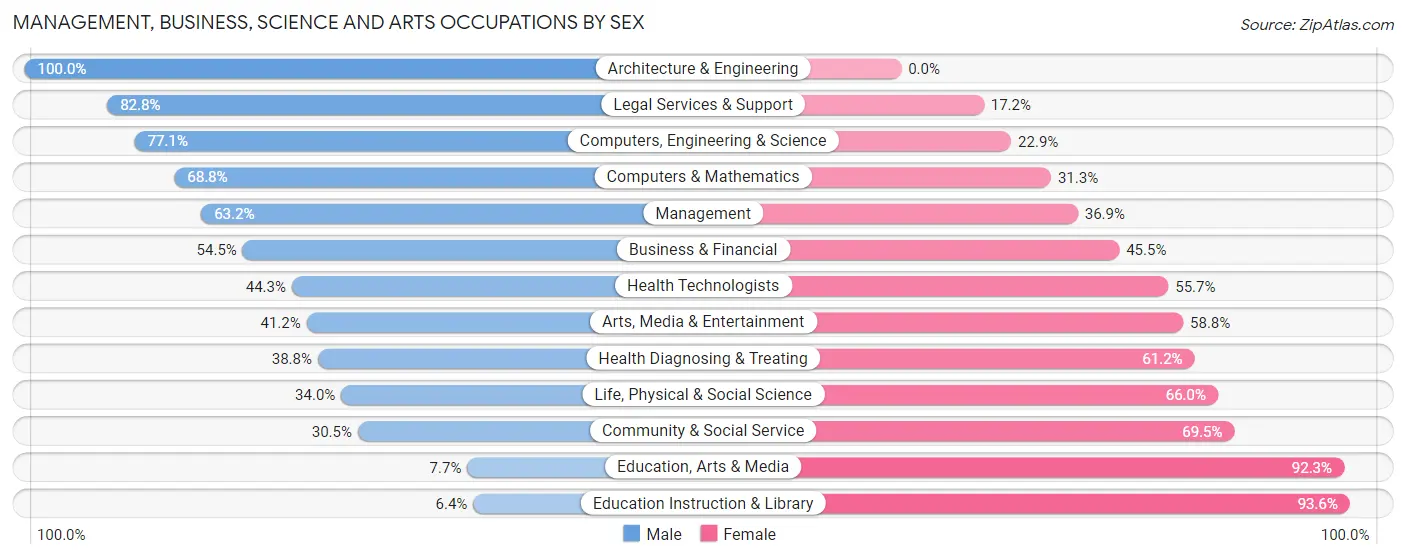
Management, Business, Science and Arts Occupations by Sex
Within the Management, Business, Science and Arts occupations in North Salt Lake, the most male-oriented occupations are Architecture & Engineering (100.0%), Legal Services & Support (82.8%), and Computers, Engineering & Science (77.1%), while the most female-oriented occupations are Education Instruction & Library (93.6%), Education, Arts & Media (92.3%), and Community & Social Service (69.5%).
| Occupation | Male | Female |
| Management | 819 (63.1%) | 478 (36.8%) |
| Business & Financial | 471 (54.5%) | 393 (45.5%) |
| Computers, Engineering & Science | 756 (77.1%) | 225 (22.9%) |
| Computers & Mathematics | 341 (68.8%) | 155 (31.2%) |
| Architecture & Engineering | 379 (100.0%) | 0 (0.0%) |
| Life, Physical & Social Science | 36 (34.0%) | 70 (66.0%) |
| Community & Social Service | 327 (30.5%) | 745 (69.5%) |
| Education, Arts & Media | 18 (7.7%) | 217 (92.3%) |
| Legal Services & Support | 144 (82.8%) | 30 (17.2%) |
| Education Instruction & Library | 20 (6.4%) | 291 (93.6%) |
| Arts, Media & Entertainment | 145 (41.2%) | 207 (58.8%) |
| Health Diagnosing & Treating | 292 (38.8%) | 460 (61.2%) |
| Health Technologists | 251 (44.3%) | 316 (55.7%) |
| Total (Category) | 2,665 (53.7%) | 2,301 (46.3%) |
| Total (Overall) | 6,614 (56.1%) | 5,172 (43.9%) |
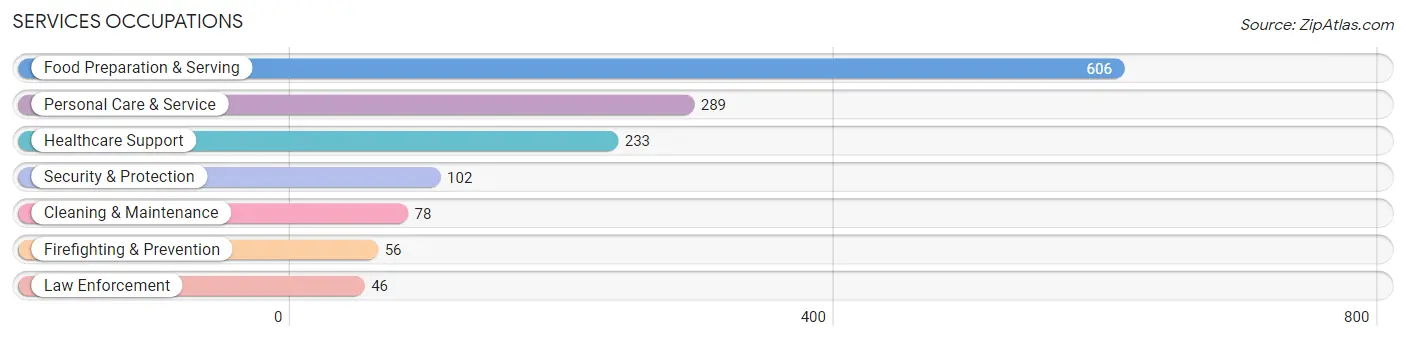
Services Occupations
The most common Services occupations in North Salt Lake are Food Preparation & Serving (606 | 5.1%), Personal Care & Service (289 | 2.5%), Healthcare Support (233 | 2.0%), Security & Protection (102 | 0.9%), and Cleaning & Maintenance (78 | 0.7%).
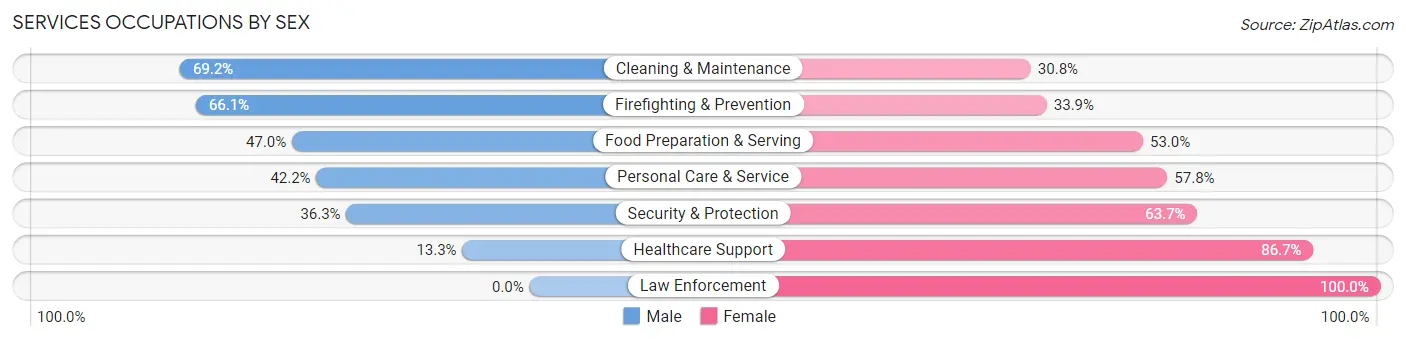
Services Occupations by Sex
Within the Services occupations in North Salt Lake, the most male-oriented occupations are Cleaning & Maintenance (69.2%), Firefighting & Prevention (66.1%), and Food Preparation & Serving (47.0%), while the most female-oriented occupations are Law Enforcement (100.0%), Healthcare Support (86.7%), and Security & Protection (63.7%).
| Occupation | Male | Female |
| Healthcare Support | 31 (13.3%) | 202 (86.7%) |
| Security & Protection | 37 (36.3%) | 65 (63.7%) |
| Firefighting & Prevention | 37 (66.1%) | 19 (33.9%) |
| Law Enforcement | 0 (0.0%) | 46 (100.0%) |
| Food Preparation & Serving | 285 (47.0%) | 321 (53.0%) |
| Cleaning & Maintenance | 54 (69.2%) | 24 (30.8%) |
| Personal Care & Service | 122 (42.2%) | 167 (57.8%) |
| Total (Category) | 529 (40.4%) | 779 (59.6%) |
| Total (Overall) | 6,614 (56.1%) | 5,172 (43.9%) |
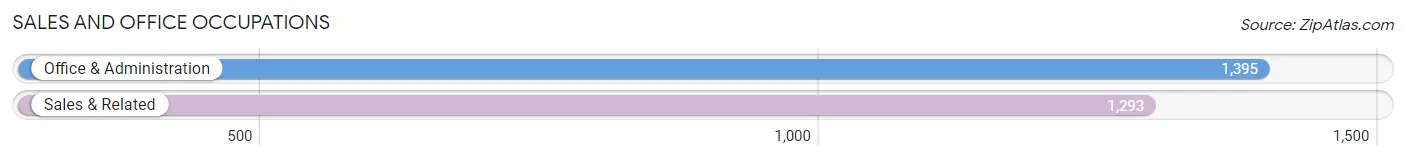
Sales and Office Occupations
The most common Sales and Office occupations in North Salt Lake are Office & Administration (1,395 | 11.8%), and Sales & Related (1,293 | 11.0%).
Sales and Office Occupations by Sex
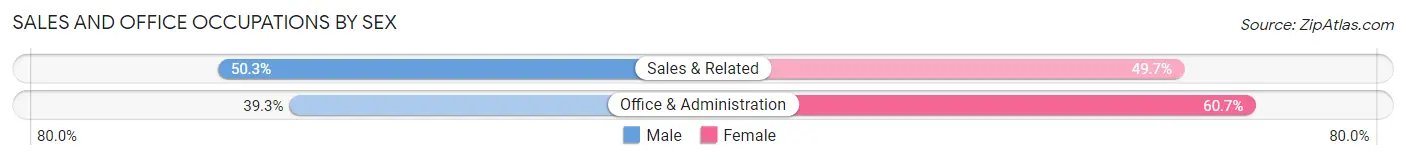
| Occupation | Male | Female |
| Sales & Related | 650 (50.3%) | 643 (49.7%) |
| Office & Administration | 548 (39.3%) | 847 (60.7%) |
| Total (Category) | 1,198 (44.6%) | 1,490 (55.4%) |
| Total (Overall) | 6,614 (56.1%) | 5,172 (43.9%) |
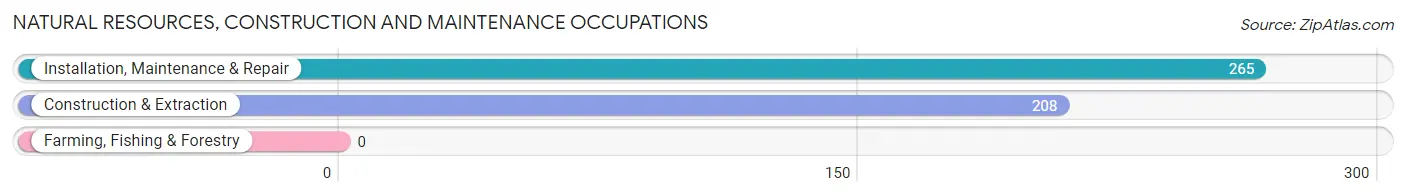
Natural Resources, Construction and Maintenance Occupations
The most common Natural Resources, Construction and Maintenance occupations in North Salt Lake are Installation, Maintenance & Repair (265 | 2.2%), and Construction & Extraction (208 | 1.8%).
Natural Resources, Construction and Maintenance Occupations by Sex
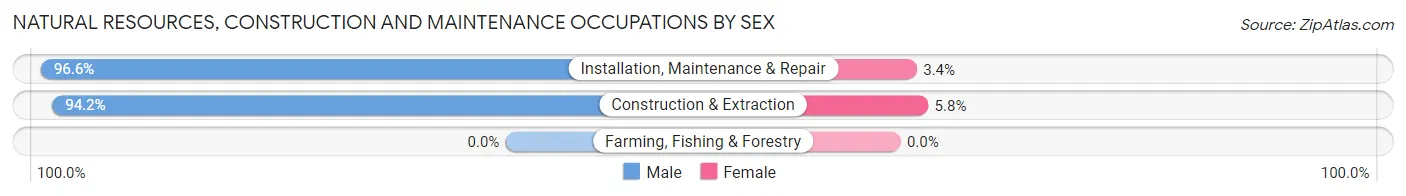
| Occupation | Male | Female |
| Farming, Fishing & Forestry | 0 (0.0%) | 0 (0.0%) |
| Construction & Extraction | 196 (94.2%) | 12 (5.8%) |
| Installation, Maintenance & Repair | 256 (96.6%) | 9 (3.4%) |
| Total (Category) | 452 (95.6%) | 21 (4.4%) |
| Total (Overall) | 6,614 (56.1%) | 5,172 (43.9%) |
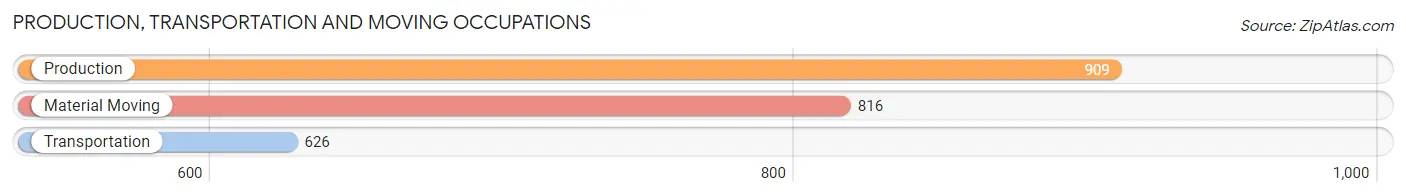
Production, Transportation and Moving Occupations
The most common Production, Transportation and Moving occupations in North Salt Lake are Production (909 | 7.7%), Material Moving (816 | 6.9%), and Transportation (626 | 5.3%).
Production, Transportation and Moving Occupations by Sex
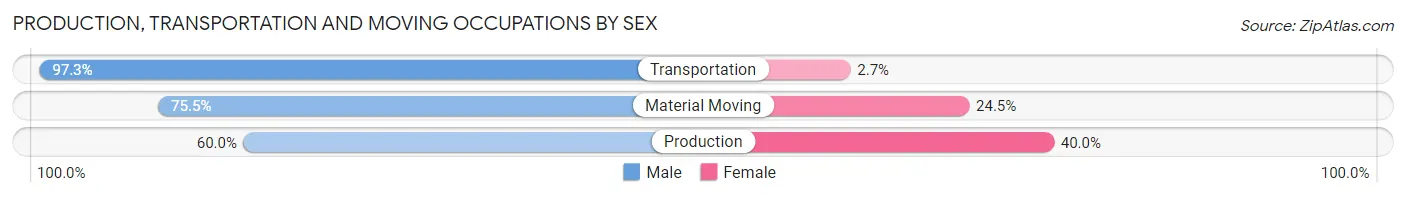
| Occupation | Male | Female |
| Production | 545 (60.0%) | 364 (40.0%) |
| Transportation | 609 (97.3%) | 17 (2.7%) |
| Material Moving | 616 (75.5%) | 200 (24.5%) |
| Total (Category) | 1,770 (75.3%) | 581 (24.7%) |
| Total (Overall) | 6,614 (56.1%) | 5,172 (43.9%) |
Employment Industries by Sex in North Salt Lake
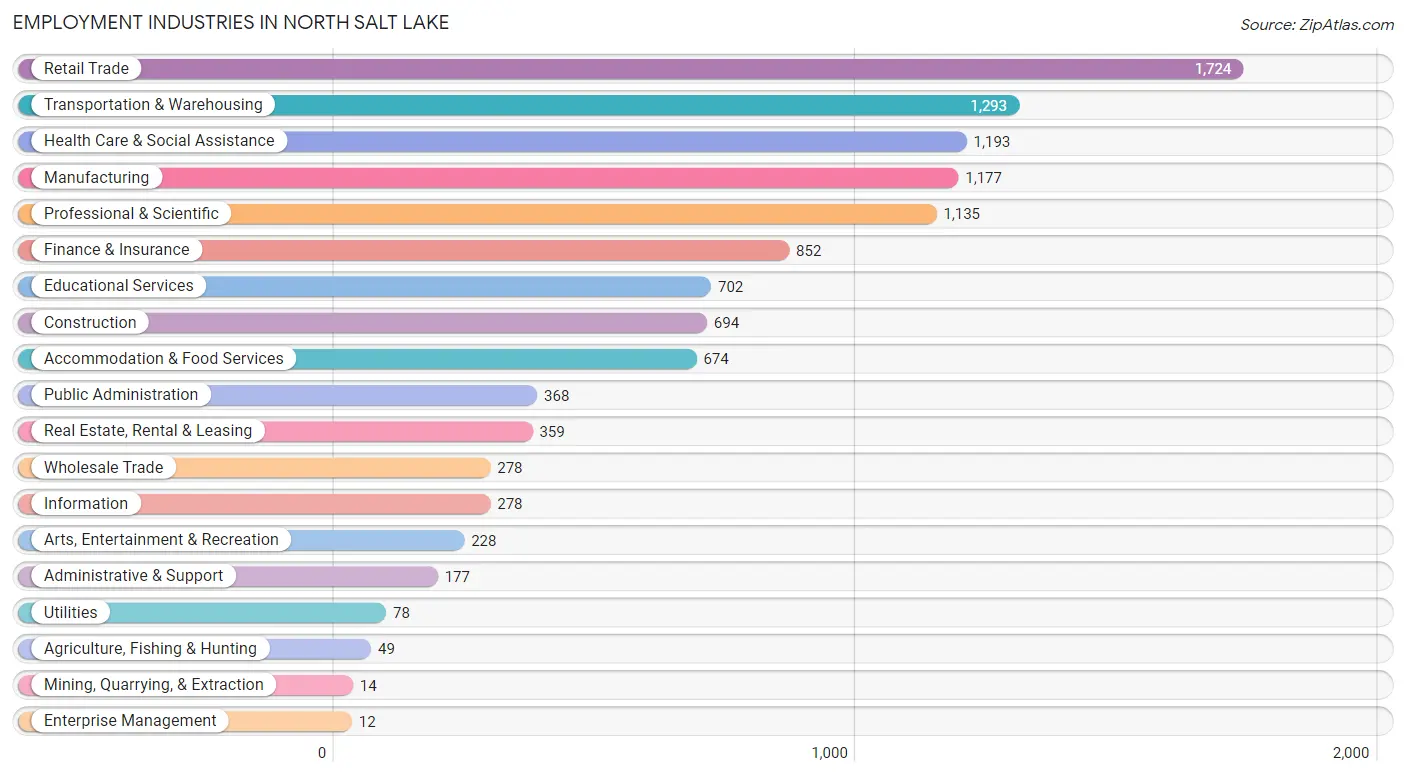
Employment Industries in North Salt Lake
The major employment industries in North Salt Lake include Retail Trade (1,724 | 14.6%), Transportation & Warehousing (1,293 | 11.0%), Health Care & Social Assistance (1,193 | 10.1%), Manufacturing (1,177 | 10.0%), and Professional & Scientific (1,135 | 9.6%).
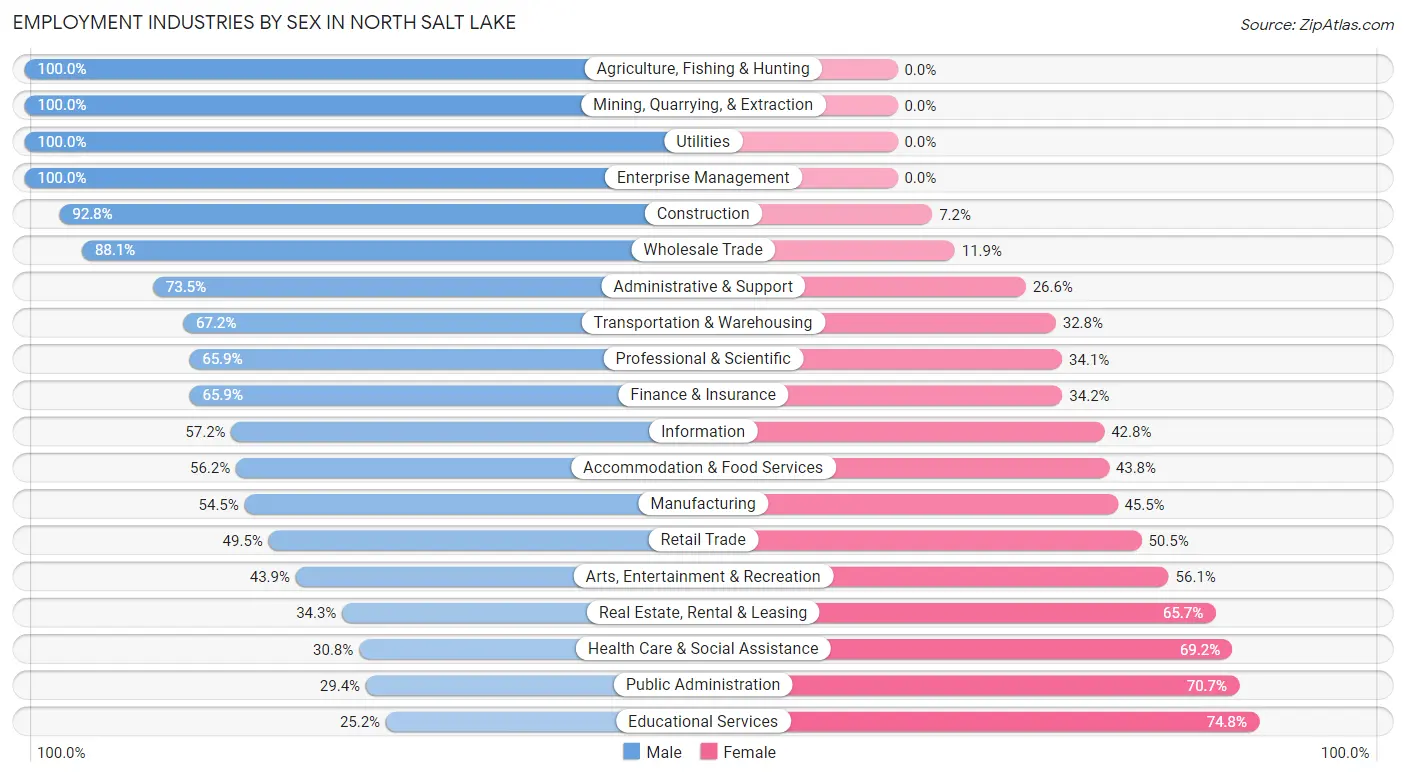
Employment Industries by Sex in North Salt Lake
The North Salt Lake industries that see more men than women are Agriculture, Fishing & Hunting (100.0%), Mining, Quarrying, & Extraction (100.0%), and Utilities (100.0%), whereas the industries that tend to have a higher number of women are Educational Services (74.8%), Public Administration (70.7%), and Health Care & Social Assistance (69.2%).
| Industry | Male | Female |
| Agriculture, Fishing & Hunting | 49 (100.0%) | 0 (0.0%) |
| Mining, Quarrying, & Extraction | 14 (100.0%) | 0 (0.0%) |
| Construction | 644 (92.8%) | 50 (7.2%) |
| Manufacturing | 641 (54.5%) | 536 (45.5%) |
| Wholesale Trade | 245 (88.1%) | 33 (11.9%) |
| Retail Trade | 853 (49.5%) | 871 (50.5%) |
| Transportation & Warehousing | 869 (67.2%) | 424 (32.8%) |
| Utilities | 78 (100.0%) | 0 (0.0%) |
| Information | 159 (57.2%) | 119 (42.8%) |
| Finance & Insurance | 561 (65.8%) | 291 (34.2%) |
| Real Estate, Rental & Leasing | 123 (34.3%) | 236 (65.7%) |
| Professional & Scientific | 748 (65.9%) | 387 (34.1%) |
| Enterprise Management | 12 (100.0%) | 0 (0.0%) |
| Administrative & Support | 130 (73.5%) | 47 (26.6%) |
| Educational Services | 177 (25.2%) | 525 (74.8%) |
| Health Care & Social Assistance | 367 (30.8%) | 826 (69.2%) |
| Arts, Entertainment & Recreation | 100 (43.9%) | 128 (56.1%) |
| Accommodation & Food Services | 379 (56.2%) | 295 (43.8%) |
| Public Administration | 108 (29.3%) | 260 (70.7%) |
| Total | 6,614 (56.1%) | 5,172 (43.9%) |
Education in North Salt Lake
School Enrollment in North Salt Lake
The most common levels of schooling among the 6,227 students in North Salt Lake are college / undergraduate (1,410 | 22.6%), middle school (1,395 | 22.4%), and high school (1,365 | 21.9%).
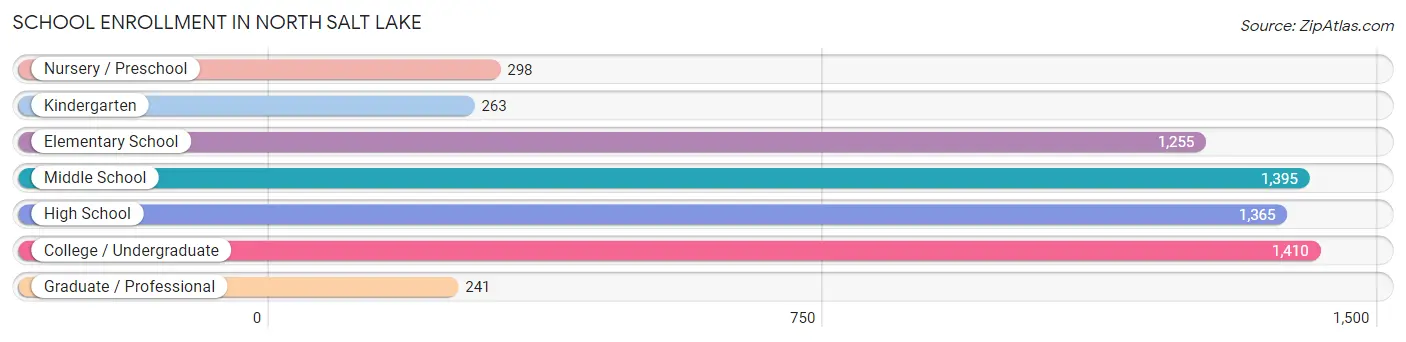
| School Level | # Students | % Students |
| Nursery / Preschool | 298 | 4.8% |
| Kindergarten | 263 | 4.2% |
| Elementary School | 1,255 | 20.2% |
| Middle School | 1,395 | 22.4% |
| High School | 1,365 | 21.9% |
| College / Undergraduate | 1,410 | 22.6% |
| Graduate / Professional | 241 | 3.9% |
| Total | 6,227 | 100.0% |
School Enrollment by Age by Funding Source in North Salt Lake
Out of a total of 6,227 students who are enrolled in schools in North Salt Lake, 747 (12.0%) attend a private institution, while the remaining 5,480 (88.0%) are enrolled in public schools. The age group of 3 to 4 year olds has the highest likelihood of being enrolled in private schools, with 144 (57.1% in the age bracket) enrolled. Conversely, the age group of 18 to 19 year olds has the lowest likelihood of being enrolled in a private school, with 299 (100.0% in the age bracket) attending a public institution.
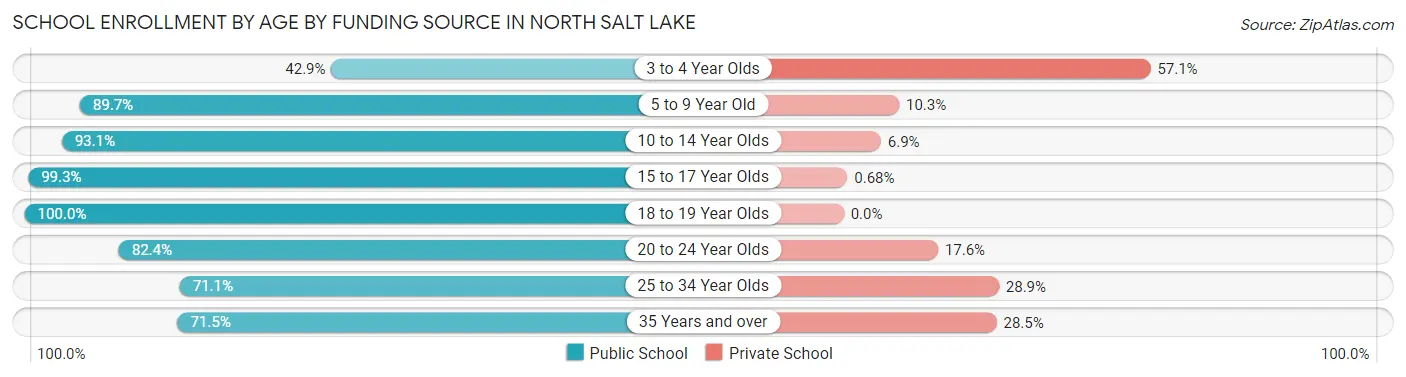
| Age Bracket | Public School | Private School |
| 3 to 4 Year Olds | 108 (42.9%) | 144 (57.1%) |
| 5 to 9 Year Old | 1,192 (89.7%) | 137 (10.3%) |
| 10 to 14 Year Olds | 1,628 (93.1%) | 121 (6.9%) |
| 15 to 17 Year Olds | 1,173 (99.3%) | 8 (0.7%) |
| 18 to 19 Year Olds | 299 (100.0%) | 0 (0.0%) |
| 20 to 24 Year Olds | 521 (82.4%) | 111 (17.6%) |
| 25 to 34 Year Olds | 241 (71.1%) | 98 (28.9%) |
| 35 Years and over | 319 (71.5%) | 127 (28.5%) |
| Total | 5,480 (88.0%) | 747 (12.0%) |
Educational Attainment by Field of Study in North Salt Lake
Business (1,186 | 21.1%), science & technology (729 | 13.0%), education (573 | 10.2%), arts & humanities (523 | 9.3%), and social sciences (384 | 6.9%) are the most common fields of study among 5,609 individuals in North Salt Lake who have obtained a bachelor's degree or higher.
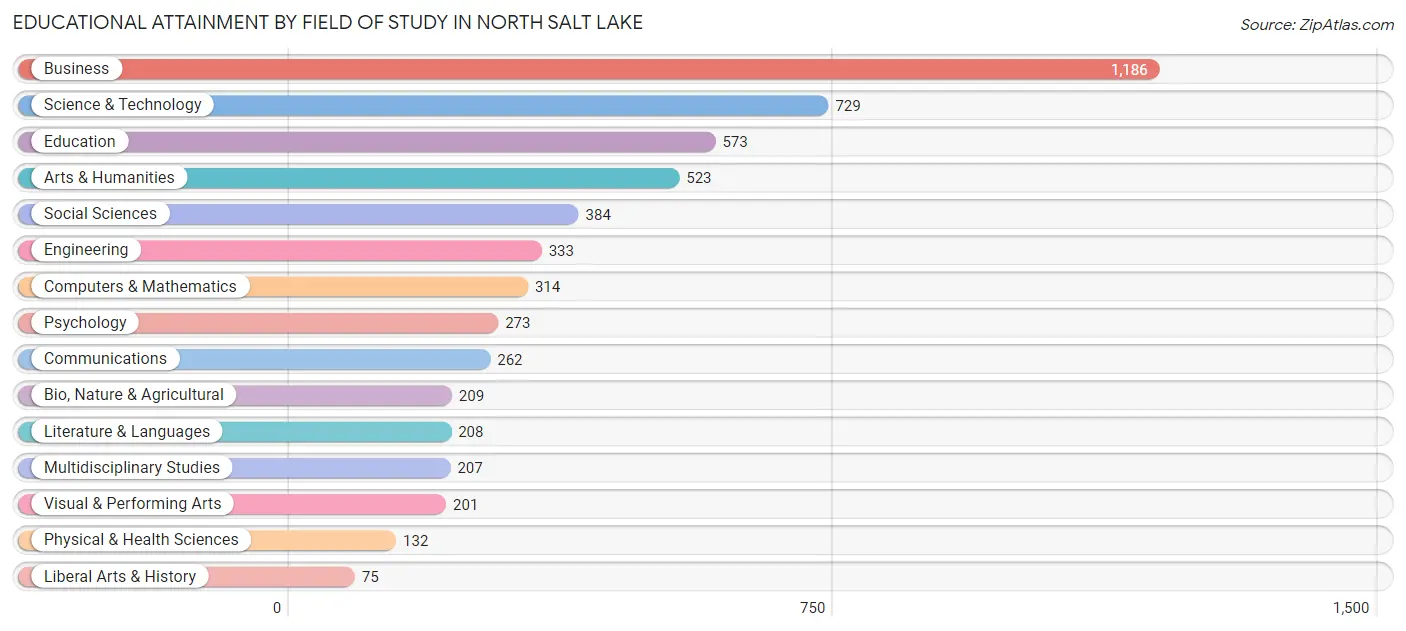
| Field of Study | # Graduates | % Graduates |
| Computers & Mathematics | 314 | 5.6% |
| Bio, Nature & Agricultural | 209 | 3.7% |
| Physical & Health Sciences | 132 | 2.4% |
| Psychology | 273 | 4.9% |
| Social Sciences | 384 | 6.9% |
| Engineering | 333 | 5.9% |
| Multidisciplinary Studies | 207 | 3.7% |
| Science & Technology | 729 | 13.0% |
| Business | 1,186 | 21.1% |
| Education | 573 | 10.2% |
| Literature & Languages | 208 | 3.7% |
| Liberal Arts & History | 75 | 1.3% |
| Visual & Performing Arts | 201 | 3.6% |
| Communications | 262 | 4.7% |
| Arts & Humanities | 523 | 9.3% |
| Total | 5,609 | 100.0% |
Transportation & Commute in North Salt Lake
Vehicle Availability by Sex in North Salt Lake
The most prevalent vehicle ownership categories in North Salt Lake are males with 2 vehicles (3,232, accounting for 49.8%) and females with 2 vehicles (2,220, making up 63.0%).

| Vehicles Available | Male | Female |
| No Vehicle | 30 (0.5%) | 8 (0.2%) |
| 1 Vehicle | 935 (14.4%) | 1,096 (21.4%) |
| 2 Vehicles | 3,232 (49.8%) | 2,220 (43.3%) |
| 3 Vehicles | 1,511 (23.3%) | 1,283 (25.0%) |
| 4 Vehicles | 562 (8.7%) | 359 (7.0%) |
| 5 or more Vehicles | 219 (3.4%) | 161 (3.1%) |
| Total | 6,489 (100.0%) | 5,127 (100.0%) |
Commute Time in North Salt Lake
The most frequently occuring commute durations in North Salt Lake are 20 to 24 minutes (2,132 commuters, 22.1%), 15 to 19 minutes (1,951 commuters, 20.2%), and 25 to 29 minutes (1,327 commuters, 13.8%).
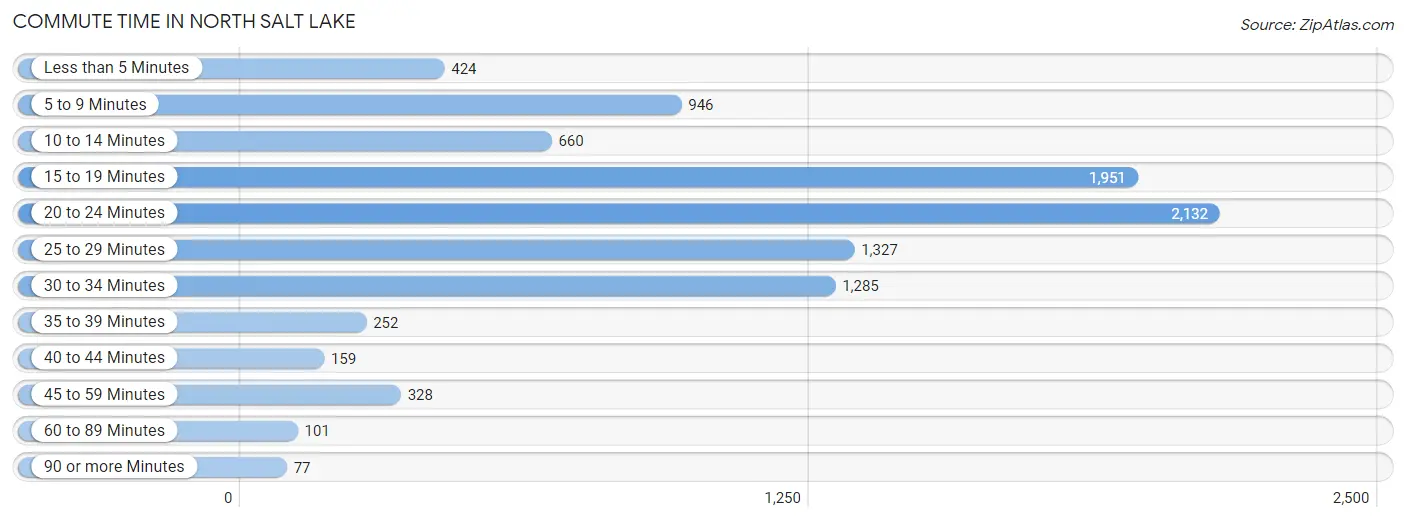
| Commute Time | # Commuters | % Commuters |
| Less than 5 Minutes | 424 | 4.4% |
| 5 to 9 Minutes | 946 | 9.8% |
| 10 to 14 Minutes | 660 | 6.9% |
| 15 to 19 Minutes | 1,951 | 20.2% |
| 20 to 24 Minutes | 2,132 | 22.1% |
| 25 to 29 Minutes | 1,327 | 13.8% |
| 30 to 34 Minutes | 1,285 | 13.3% |
| 35 to 39 Minutes | 252 | 2.6% |
| 40 to 44 Minutes | 159 | 1.7% |
| 45 to 59 Minutes | 328 | 3.4% |
| 60 to 89 Minutes | 101 | 1.1% |
| 90 or more Minutes | 77 | 0.8% |
Commute Time by Sex in North Salt Lake
The most common commute times in North Salt Lake are 20 to 24 minutes (1,214 commuters, 21.8%) for males and 15 to 19 minutes (951 commuters, 23.4%) for females.
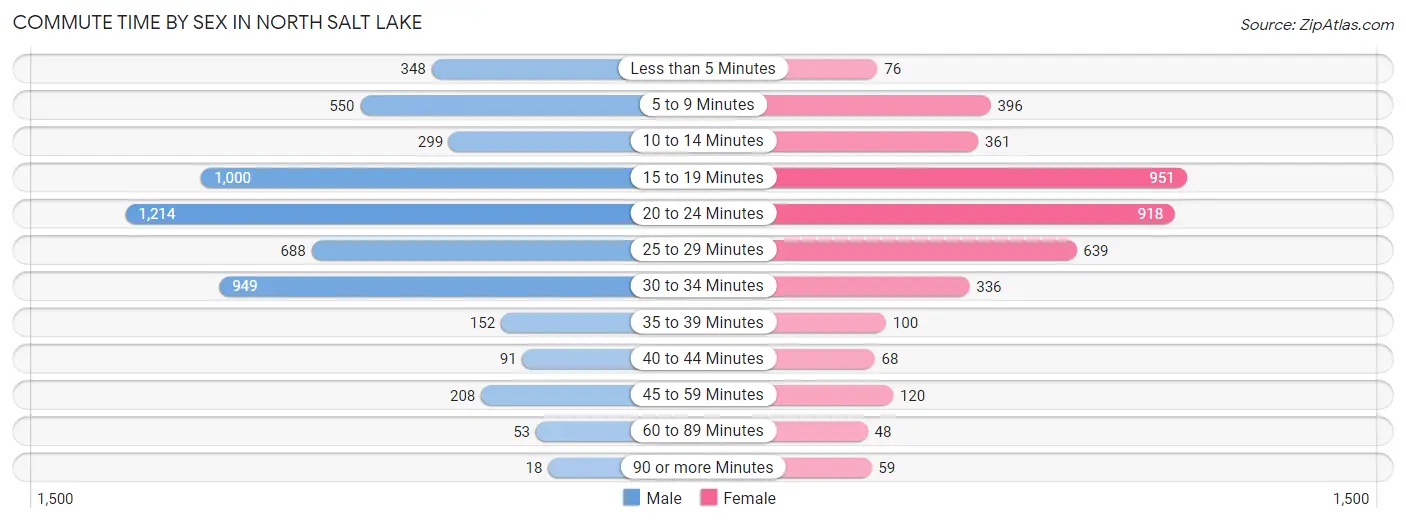
| Commute Time | Male | Female |
| Less than 5 Minutes | 348 (6.2%) | 76 (1.9%) |
| 5 to 9 Minutes | 550 (9.9%) | 396 (9.7%) |
| 10 to 14 Minutes | 299 (5.4%) | 361 (8.9%) |
| 15 to 19 Minutes | 1,000 (17.9%) | 951 (23.4%) |
| 20 to 24 Minutes | 1,214 (21.8%) | 918 (22.5%) |
| 25 to 29 Minutes | 688 (12.3%) | 639 (15.7%) |
| 30 to 34 Minutes | 949 (17.0%) | 336 (8.3%) |
| 35 to 39 Minutes | 152 (2.7%) | 100 (2.5%) |
| 40 to 44 Minutes | 91 (1.6%) | 68 (1.7%) |
| 45 to 59 Minutes | 208 (3.7%) | 120 (2.9%) |
| 60 to 89 Minutes | 53 (0.9%) | 48 (1.2%) |
| 90 or more Minutes | 18 (0.3%) | 59 (1.5%) |
Time of Departure to Work by Sex in North Salt Lake
The most frequent times of departure to work in North Salt Lake are 8:00 AM to 8:29 AM (1,048, 18.8%) for males and 7:00 AM to 7:29 AM (649, 15.9%) for females.
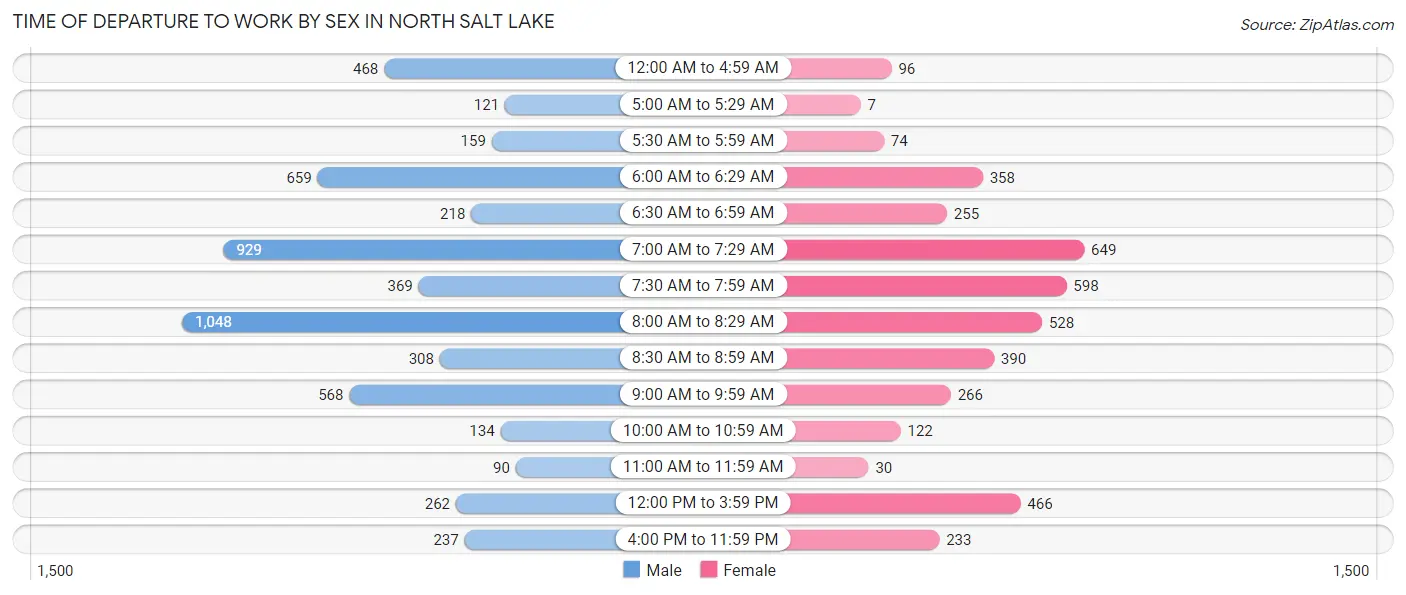
| Time of Departure | Male | Female |
| 12:00 AM to 4:59 AM | 468 (8.4%) | 96 (2.4%) |
| 5:00 AM to 5:29 AM | 121 (2.2%) | 7 (0.2%) |
| 5:30 AM to 5:59 AM | 159 (2.9%) | 74 (1.8%) |
| 6:00 AM to 6:29 AM | 659 (11.8%) | 358 (8.8%) |
| 6:30 AM to 6:59 AM | 218 (3.9%) | 255 (6.3%) |
| 7:00 AM to 7:29 AM | 929 (16.7%) | 649 (15.9%) |
| 7:30 AM to 7:59 AM | 369 (6.6%) | 598 (14.7%) |
| 8:00 AM to 8:29 AM | 1,048 (18.8%) | 528 (13.0%) |
| 8:30 AM to 8:59 AM | 308 (5.5%) | 390 (9.6%) |
| 9:00 AM to 9:59 AM | 568 (10.2%) | 266 (6.5%) |
| 10:00 AM to 10:59 AM | 134 (2.4%) | 122 (3.0%) |
| 11:00 AM to 11:59 AM | 90 (1.6%) | 30 (0.7%) |
| 12:00 PM to 3:59 PM | 262 (4.7%) | 466 (11.4%) |
| 4:00 PM to 11:59 PM | 237 (4.3%) | 233 (5.7%) |
| Total | 5,570 (100.0%) | 4,072 (100.0%) |
Housing Occupancy in North Salt Lake
Occupancy by Ownership in North Salt Lake
Of the total 7,515 dwellings in North Salt Lake, owner-occupied units account for 5,284 (70.3%), while renter-occupied units make up 2,231 (29.7%).
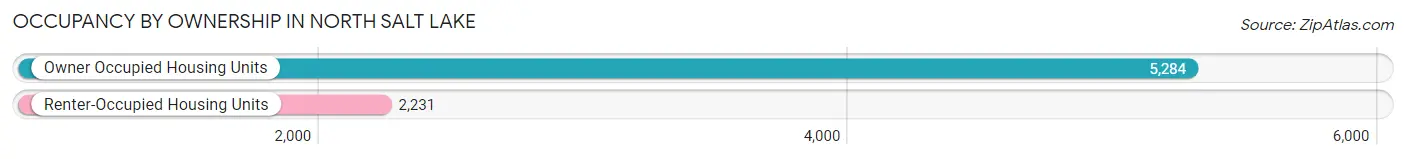
| Occupancy | # Housing Units | % Housing Units |
| Owner Occupied Housing Units | 5,284 | 70.3% |
| Renter-Occupied Housing Units | 2,231 | 29.7% |
| Total Occupied Housing Units | 7,515 | 100.0% |
Occupancy by Household Size in North Salt Lake
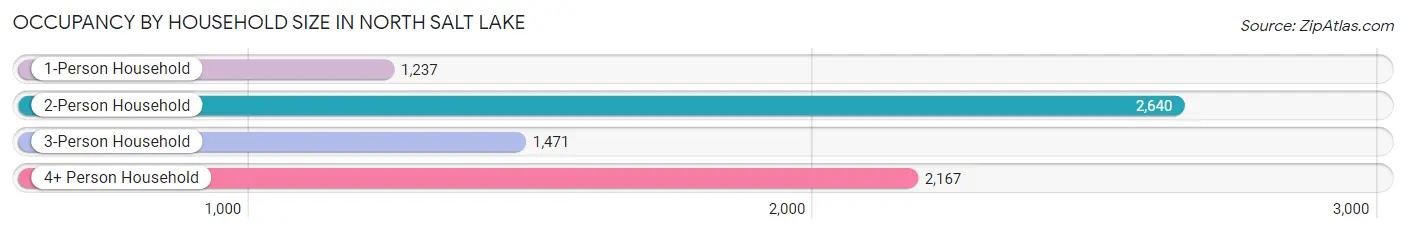
| Household Size | # Housing Units | % Housing Units |
| 1-Person Household | 1,237 | 16.5% |
| 2-Person Household | 2,640 | 35.1% |
| 3-Person Household | 1,471 | 19.6% |
| 4+ Person Household | 2,167 | 28.8% |
| Total Housing Units | 7,515 | 100.0% |
Occupancy by Ownership by Household Size in North Salt Lake
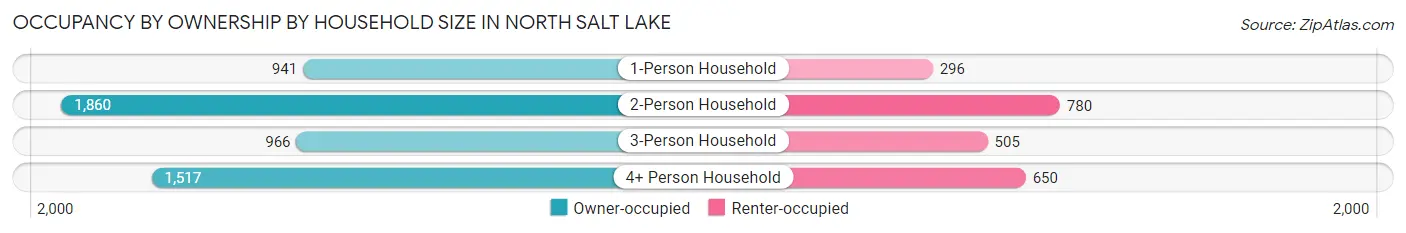
| Household Size | Owner-occupied | Renter-occupied |
| 1-Person Household | 941 (76.1%) | 296 (23.9%) |
| 2-Person Household | 1,860 (70.5%) | 780 (29.5%) |
| 3-Person Household | 966 (65.7%) | 505 (34.3%) |
| 4+ Person Household | 1,517 (70.0%) | 650 (30.0%) |
| Total Housing Units | 5,284 (70.3%) | 2,231 (29.7%) |
Occupancy by Educational Attainment in North Salt Lake
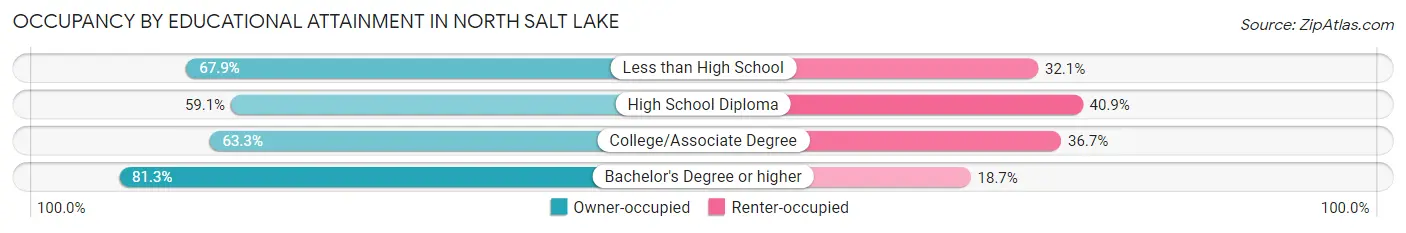
| Household Size | Owner-occupied | Renter-occupied |
| Less than High School | 381 (67.9%) | 180 (32.1%) |
| High School Diploma | 777 (59.1%) | 538 (40.9%) |
| College/Associate Degree | 1,614 (63.3%) | 934 (36.7%) |
| Bachelor's Degree or higher | 2,512 (81.3%) | 579 (18.7%) |
Occupancy by Age of Householder in North Salt Lake
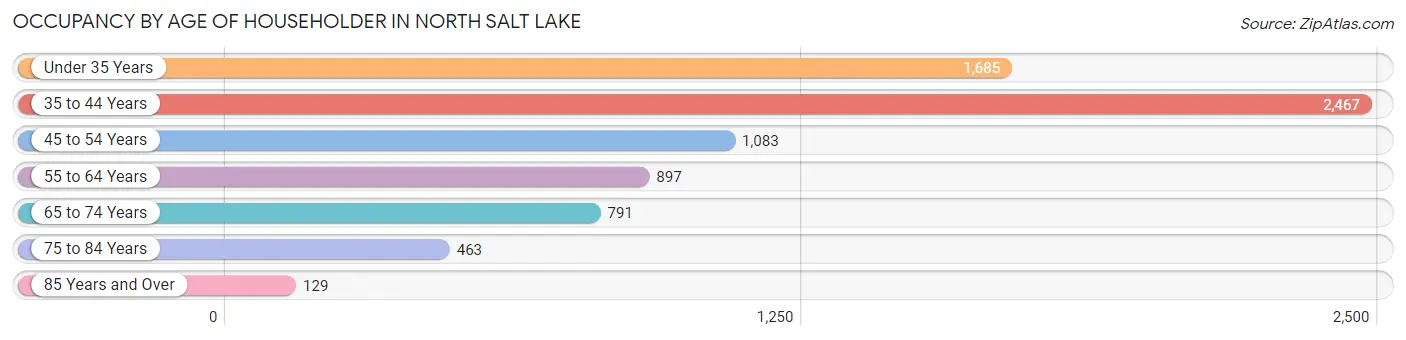
| Age Bracket | # Households | % Households |
| Under 35 Years | 1,685 | 22.4% |
| 35 to 44 Years | 2,467 | 32.8% |
| 45 to 54 Years | 1,083 | 14.4% |
| 55 to 64 Years | 897 | 11.9% |
| 65 to 74 Years | 791 | 10.5% |
| 75 to 84 Years | 463 | 6.2% |
| 85 Years and Over | 129 | 1.7% |
| Total | 7,515 | 100.0% |
Housing Finances in North Salt Lake
Median Income by Occupancy in North Salt Lake
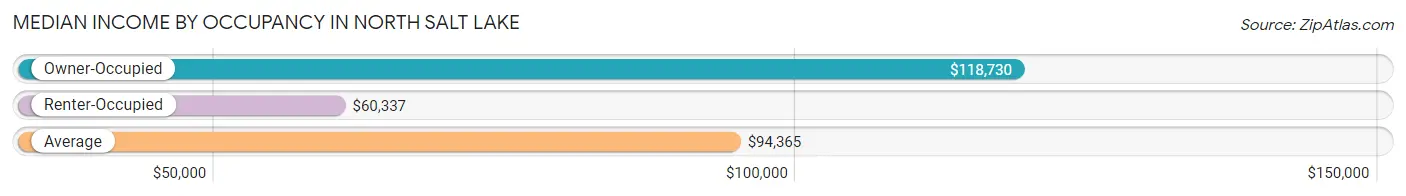
| Occupancy Type | # Households | Median Income |
| Owner-Occupied | 5,284 (70.3%) | $118,730 |
| Renter-Occupied | 2,231 (29.7%) | $60,337 |
| Average | 7,515 (100.0%) | $94,365 |
Occupancy by Householder Income Bracket in North Salt Lake
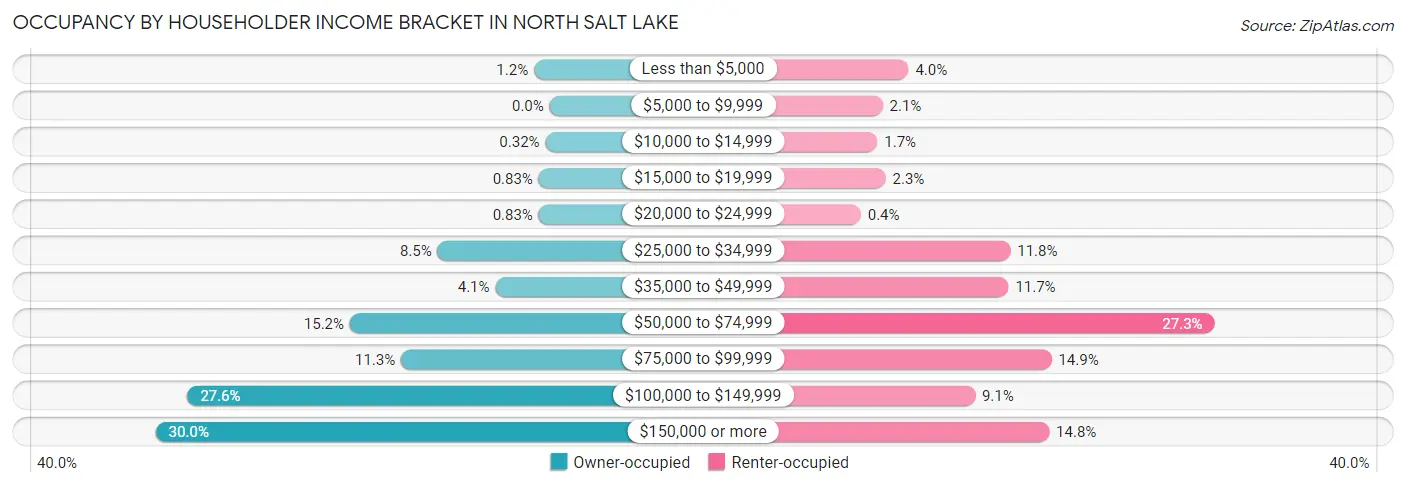
| Income Bracket | Owner-occupied | Renter-occupied |
| Less than $5,000 | 63 (1.2%) | 90 (4.0%) |
| $5,000 to $9,999 | 0 (0.0%) | 46 (2.1%) |
| $10,000 to $14,999 | 17 (0.3%) | 37 (1.7%) |
| $15,000 to $19,999 | 44 (0.8%) | 51 (2.3%) |
| $20,000 to $24,999 | 44 (0.8%) | 9 (0.4%) |
| $25,000 to $34,999 | 451 (8.5%) | 263 (11.8%) |
| $35,000 to $49,999 | 218 (4.1%) | 260 (11.7%) |
| $50,000 to $74,999 | 804 (15.2%) | 610 (27.3%) |
| $75,000 to $99,999 | 598 (11.3%) | 333 (14.9%) |
| $100,000 to $149,999 | 1,459 (27.6%) | 203 (9.1%) |
| $150,000 or more | 1,586 (30.0%) | 329 (14.7%) |
| Total | 5,284 (100.0%) | 2,231 (100.0%) |
Monthly Housing Cost Tiers in North Salt Lake
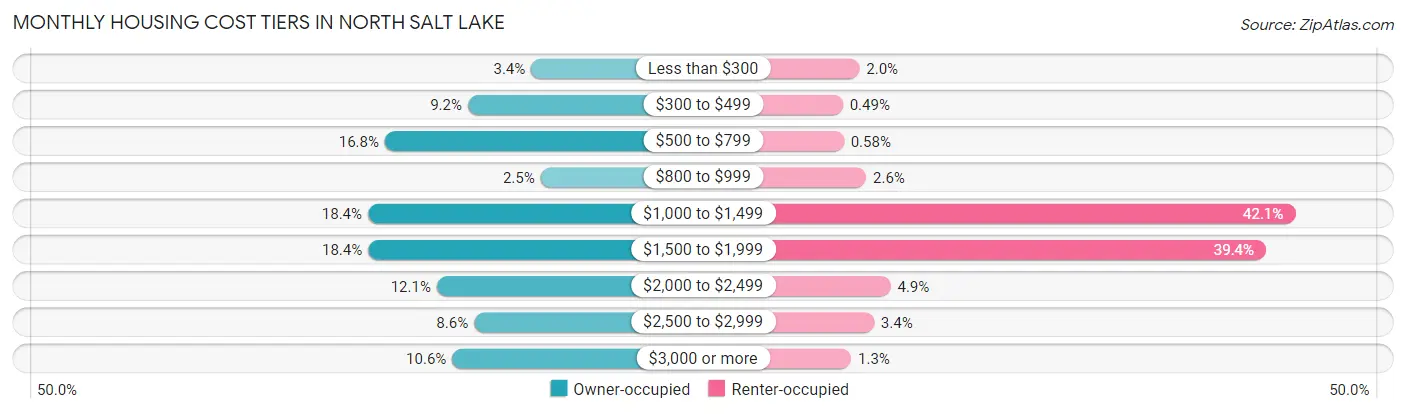
| Monthly Cost | Owner-occupied | Renter-occupied |
| Less than $300 | 178 (3.4%) | 45 (2.0%) |
| $300 to $499 | 486 (9.2%) | 11 (0.5%) |
| $500 to $799 | 890 (16.8%) | 13 (0.6%) |
| $800 to $999 | 132 (2.5%) | 59 (2.6%) |
| $1,000 to $1,499 | 972 (18.4%) | 940 (42.1%) |
| $1,500 to $1,999 | 971 (18.4%) | 880 (39.4%) |
| $2,000 to $2,499 | 637 (12.1%) | 109 (4.9%) |
| $2,500 to $2,999 | 456 (8.6%) | 75 (3.4%) |
| $3,000 or more | 562 (10.6%) | 28 (1.3%) |
| Total | 5,284 (100.0%) | 2,231 (100.0%) |
Physical Housing Characteristics in North Salt Lake
Housing Structures in North Salt Lake
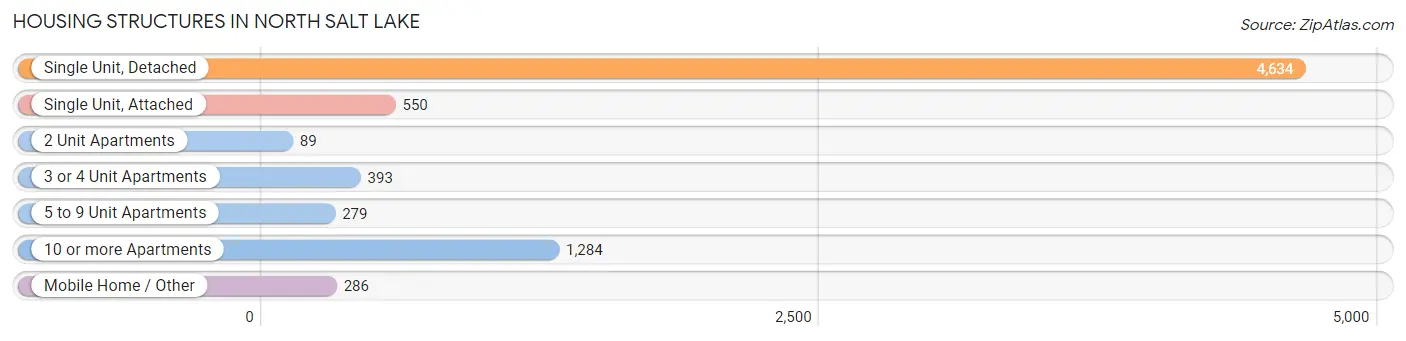
| Structure Type | # Housing Units | % Housing Units |
| Single Unit, Detached | 4,634 | 61.7% |
| Single Unit, Attached | 550 | 7.3% |
| 2 Unit Apartments | 89 | 1.2% |
| 3 or 4 Unit Apartments | 393 | 5.2% |
| 5 to 9 Unit Apartments | 279 | 3.7% |
| 10 or more Apartments | 1,284 | 17.1% |
| Mobile Home / Other | 286 | 3.8% |
| Total | 7,515 | 100.0% |
Housing Structures by Occupancy in North Salt Lake
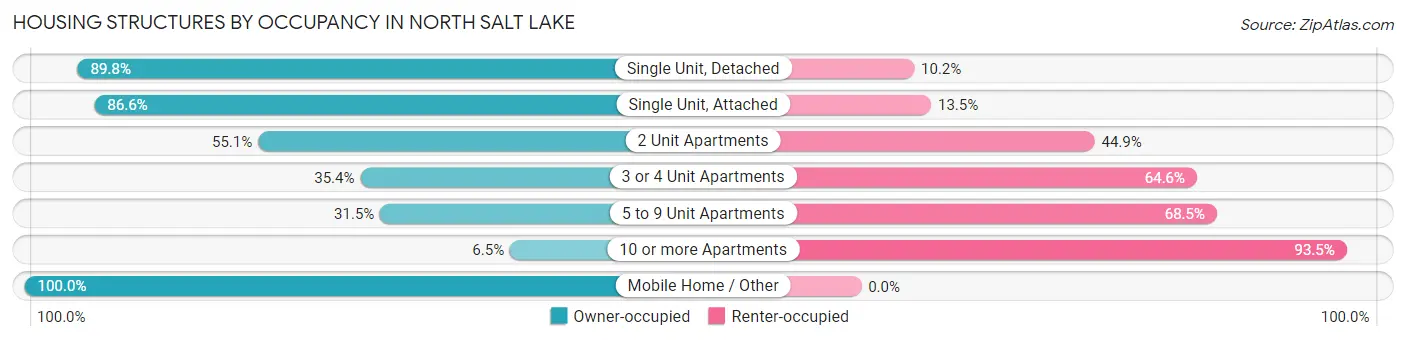
| Structure Type | Owner-occupied | Renter-occupied |
| Single Unit, Detached | 4,162 (89.8%) | 472 (10.2%) |
| Single Unit, Attached | 476 (86.6%) | 74 (13.5%) |
| 2 Unit Apartments | 49 (55.1%) | 40 (44.9%) |
| 3 or 4 Unit Apartments | 139 (35.4%) | 254 (64.6%) |
| 5 to 9 Unit Apartments | 88 (31.5%) | 191 (68.5%) |
| 10 or more Apartments | 84 (6.5%) | 1,200 (93.5%) |
| Mobile Home / Other | 286 (100.0%) | 0 (0.0%) |
| Total | 5,284 (70.3%) | 2,231 (29.7%) |
Housing Structures by Number of Rooms in North Salt Lake
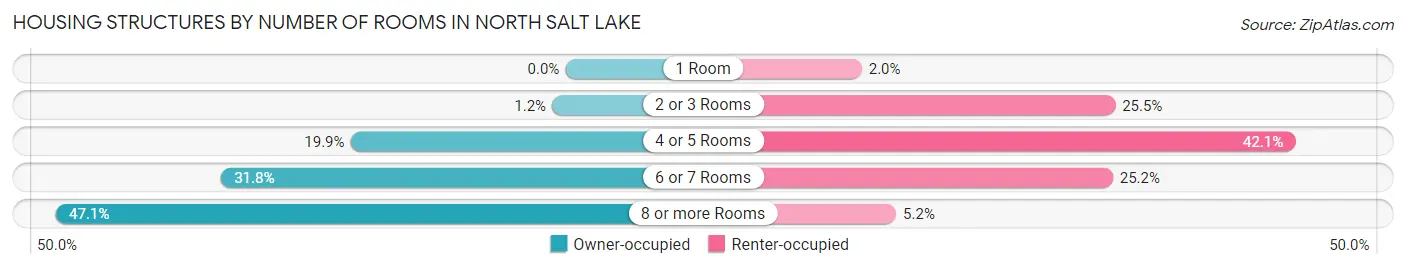
| Number of Rooms | Owner-occupied | Renter-occupied |
| 1 Room | 0 (0.0%) | 45 (2.0%) |
| 2 or 3 Rooms | 65 (1.2%) | 568 (25.5%) |
| 4 or 5 Rooms | 1,050 (19.9%) | 939 (42.1%) |
| 6 or 7 Rooms | 1,681 (31.8%) | 563 (25.2%) |
| 8 or more Rooms | 2,488 (47.1%) | 116 (5.2%) |
| Total | 5,284 (100.0%) | 2,231 (100.0%) |
Housing Structure by Heating Type in North Salt Lake
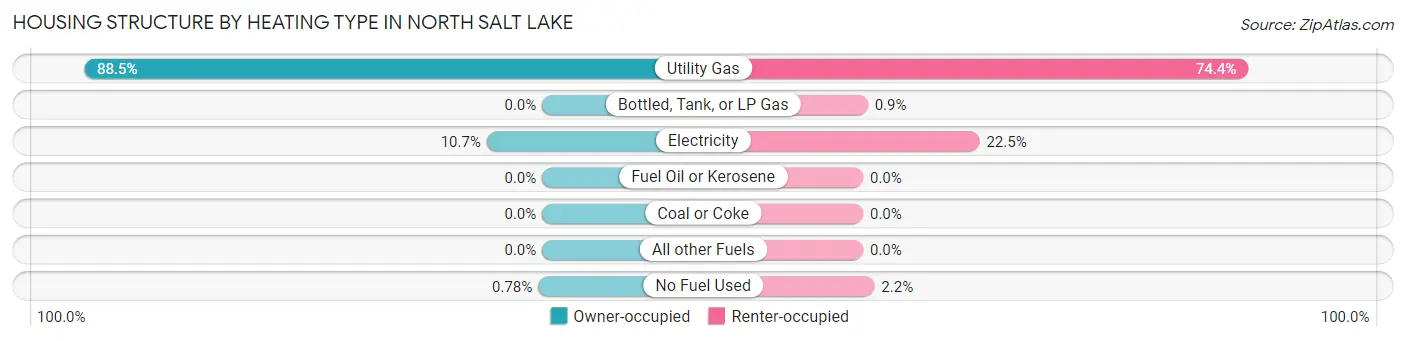
| Heating Type | Owner-occupied | Renter-occupied |
| Utility Gas | 4,677 (88.5%) | 1,660 (74.4%) |
| Bottled, Tank, or LP Gas | 0 (0.0%) | 20 (0.9%) |
| Electricity | 566 (10.7%) | 502 (22.5%) |
| Fuel Oil or Kerosene | 0 (0.0%) | 0 (0.0%) |
| Coal or Coke | 0 (0.0%) | 0 (0.0%) |
| All other Fuels | 0 (0.0%) | 0 (0.0%) |
| No Fuel Used | 41 (0.8%) | 49 (2.2%) |
| Total | 5,284 (100.0%) | 2,231 (100.0%) |
Household Vehicle Usage in North Salt Lake
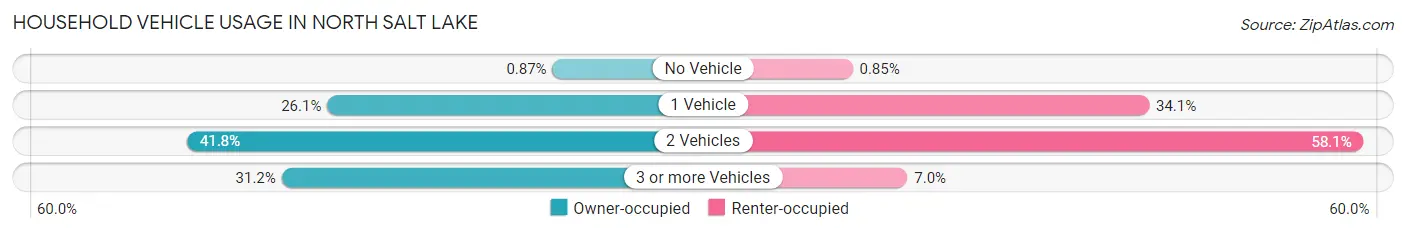
| Vehicles per Household | Owner-occupied | Renter-occupied |
| No Vehicle | 46 (0.9%) | 19 (0.9%) |
| 1 Vehicle | 1,379 (26.1%) | 760 (34.1%) |
| 2 Vehicles | 2,210 (41.8%) | 1,296 (58.1%) |
| 3 or more Vehicles | 1,649 (31.2%) | 156 (7.0%) |
| Total | 5,284 (100.0%) | 2,231 (100.0%) |
Real Estate & Mortgages in North Salt Lake
Real Estate and Mortgage Overview in North Salt Lake
| Characteristic | Without Mortgage | With Mortgage |
| Housing Units | 1,746 | 3,538 |
| Median Property Value | $421,400 | $431,100 |
| Median Household Income | $70,000 | $1,069 |
| Monthly Housing Costs | $559 | $562 |
| Real Estate Taxes | $2,451 | $0 |
Property Value by Mortgage Status in North Salt Lake
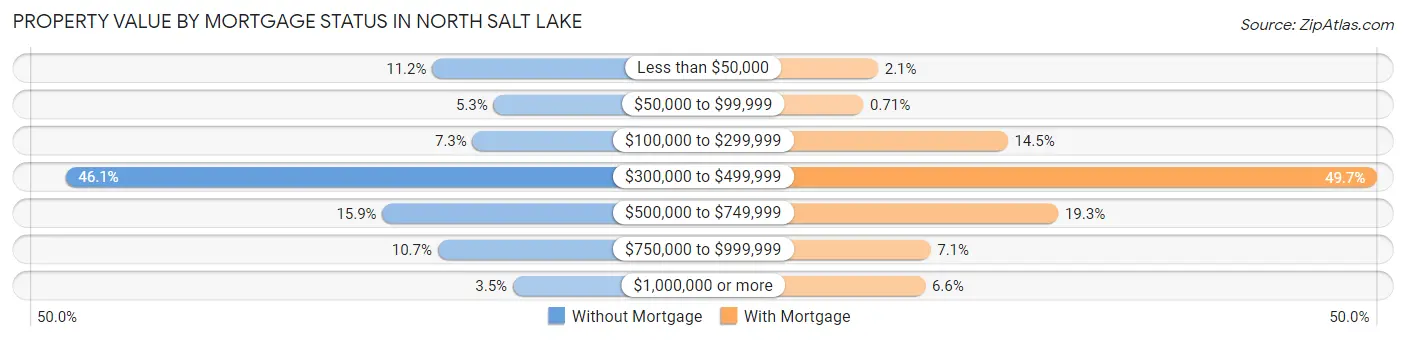
| Property Value | Without Mortgage | With Mortgage |
| Less than $50,000 | 195 (11.2%) | 75 (2.1%) |
| $50,000 to $99,999 | 93 (5.3%) | 25 (0.7%) |
| $100,000 to $299,999 | 128 (7.3%) | 512 (14.5%) |
| $300,000 to $499,999 | 805 (46.1%) | 1,758 (49.7%) |
| $500,000 to $749,999 | 278 (15.9%) | 682 (19.3%) |
| $750,000 to $999,999 | 186 (10.6%) | 252 (7.1%) |
| $1,000,000 or more | 61 (3.5%) | 234 (6.6%) |
| Total | 1,746 (100.0%) | 3,538 (100.0%) |
Household Income by Mortgage Status in North Salt Lake
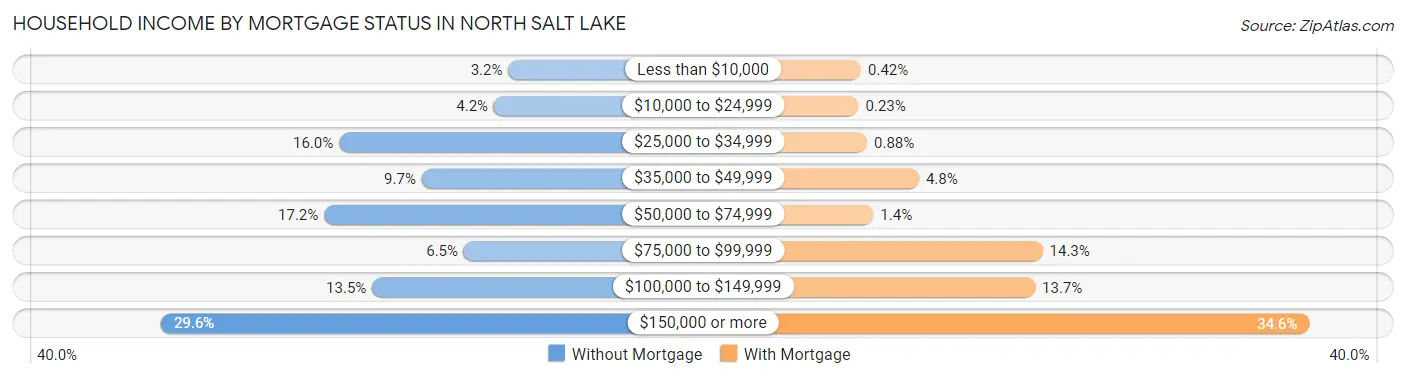
| Household Income | Without Mortgage | With Mortgage |
| Less than $10,000 | 55 (3.2%) | 15 (0.4%) |
| $10,000 to $24,999 | 74 (4.2%) | 8 (0.2%) |
| $25,000 to $34,999 | 280 (16.0%) | 31 (0.9%) |
| $35,000 to $49,999 | 170 (9.7%) | 171 (4.8%) |
| $50,000 to $74,999 | 300 (17.2%) | 48 (1.4%) |
| $75,000 to $99,999 | 114 (6.5%) | 504 (14.2%) |
| $100,000 to $149,999 | 236 (13.5%) | 484 (13.7%) |
| $150,000 or more | 517 (29.6%) | 1,223 (34.6%) |
| Total | 1,746 (100.0%) | 3,538 (100.0%) |
Property Value to Household Income Ratio in North Salt Lake
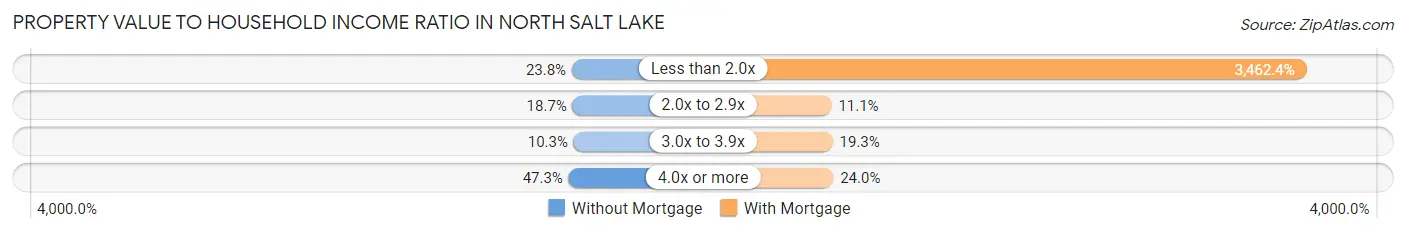
| Value-to-Income Ratio | Without Mortgage | With Mortgage |
| Less than 2.0x | 415 (23.8%) | 122,500 (3,462.4%) |
| 2.0x to 2.9x | 327 (18.7%) | 393 (11.1%) |
| 3.0x to 3.9x | 179 (10.2%) | 683 (19.3%) |
| 4.0x or more | 825 (47.2%) | 850 (24.0%) |
| Total | 1,746 (100.0%) | 3,538 (100.0%) |
Real Estate Taxes by Mortgage Status in North Salt Lake
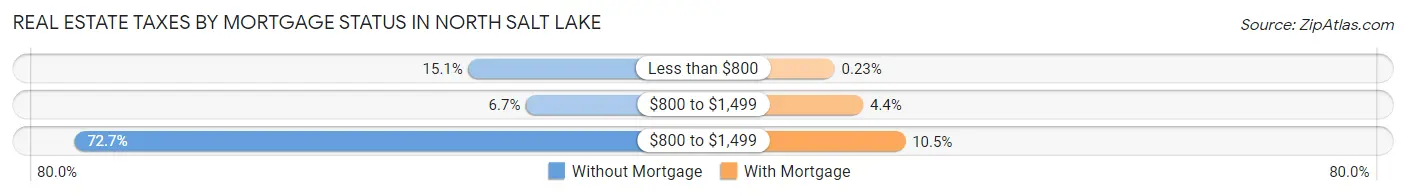
| Property Taxes | Without Mortgage | With Mortgage |
| Less than $800 | 264 (15.1%) | 8 (0.2%) |
| $800 to $1,499 | 117 (6.7%) | 155 (4.4%) |
| $800 to $1,499 | 1,270 (72.7%) | 373 (10.5%) |
| Total | 1,746 (100.0%) | 3,538 (100.0%) |
Health & Disability in North Salt Lake
Health Insurance Coverage by Age in North Salt Lake
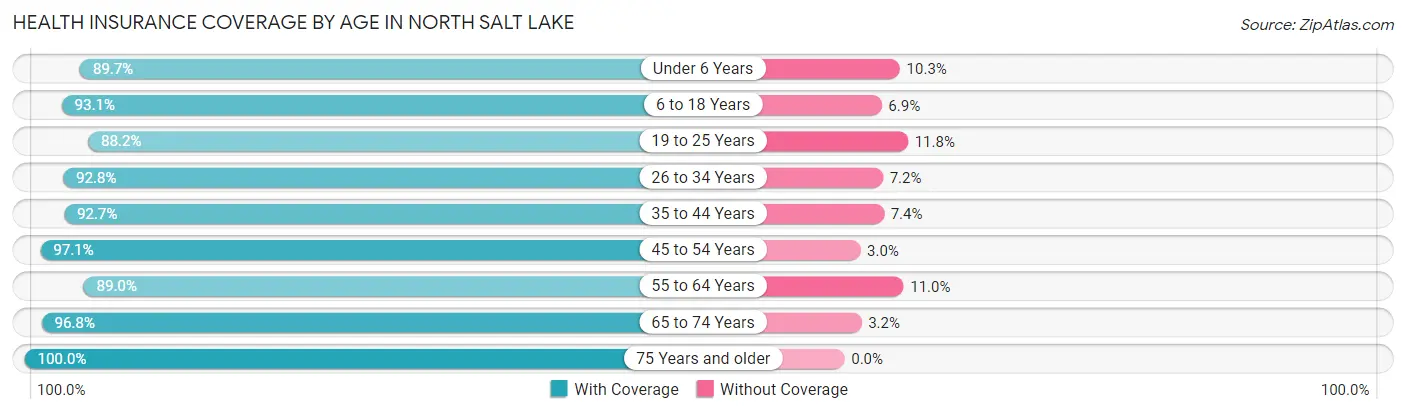
| Age Bracket | With Coverage | Without Coverage |
| Under 6 Years | 1,912 (89.7%) | 220 (10.3%) |
| 6 to 18 Years | 4,024 (93.1%) | 299 (6.9%) |
| 19 to 25 Years | 2,317 (88.2%) | 311 (11.8%) |
| 26 to 34 Years | 2,201 (92.8%) | 170 (7.2%) |
| 35 to 44 Years | 3,717 (92.6%) | 295 (7.3%) |
| 45 to 54 Years | 2,104 (97.1%) | 64 (2.9%) |
| 55 to 64 Years | 1,771 (89.0%) | 219 (11.0%) |
| 65 to 74 Years | 1,225 (96.8%) | 40 (3.2%) |
| 75 Years and older | 955 (100.0%) | 0 (0.0%) |
| Total | 20,226 (92.6%) | 1,618 (7.4%) |
Health Insurance Coverage by Citizenship Status in North Salt Lake
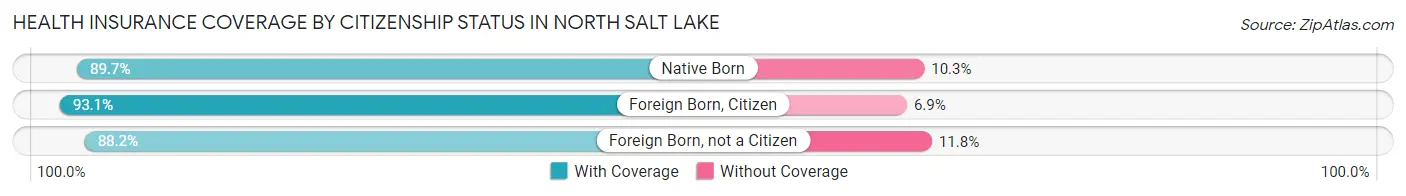
| Citizenship Status | With Coverage | Without Coverage |
| Native Born | 1,912 (89.7%) | 220 (10.3%) |
| Foreign Born, Citizen | 4,024 (93.1%) | 299 (6.9%) |
| Foreign Born, not a Citizen | 2,317 (88.2%) | 311 (11.8%) |
Health Insurance Coverage by Household Income in North Salt Lake
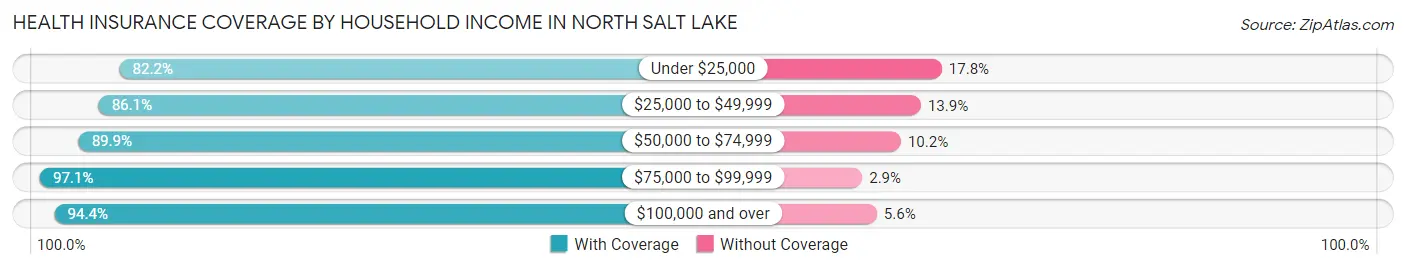
| Household Income | With Coverage | Without Coverage |
| Under $25,000 | 521 (82.2%) | 113 (17.8%) |
| $25,000 to $49,999 | 2,186 (86.1%) | 353 (13.9%) |
| $50,000 to $74,999 | 3,390 (89.8%) | 383 (10.2%) |
| $75,000 to $99,999 | 2,508 (97.1%) | 75 (2.9%) |
| $100,000 and over | 11,621 (94.4%) | 694 (5.6%) |
Public vs Private Health Insurance Coverage by Age in North Salt Lake
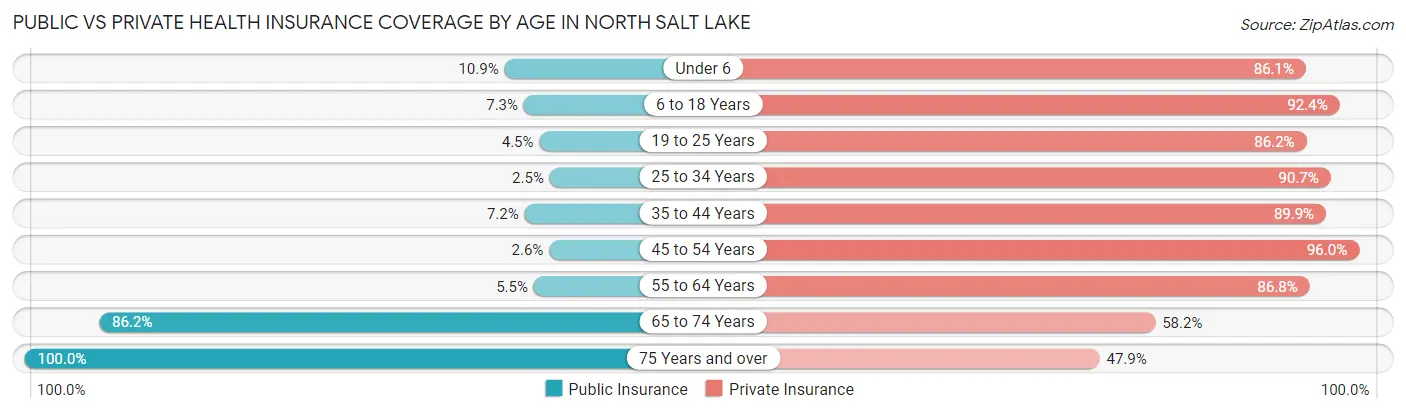
| Age Bracket | Public Insurance | Private Insurance |
| Under 6 | 233 (10.9%) | 1,836 (86.1%) |
| 6 to 18 Years | 317 (7.3%) | 3,993 (92.4%) |
| 19 to 25 Years | 117 (4.4%) | 2,266 (86.2%) |
| 25 to 34 Years | 60 (2.5%) | 2,151 (90.7%) |
| 35 to 44 Years | 289 (7.2%) | 3,605 (89.9%) |
| 45 to 54 Years | 57 (2.6%) | 2,081 (96.0%) |
| 55 to 64 Years | 109 (5.5%) | 1,728 (86.8%) |
| 65 to 74 Years | 1,090 (86.2%) | 736 (58.2%) |
| 75 Years and over | 955 (100.0%) | 457 (47.8%) |
| Total | 3,227 (14.8%) | 18,853 (86.3%) |
Disability Status by Sex by Age in North Salt Lake
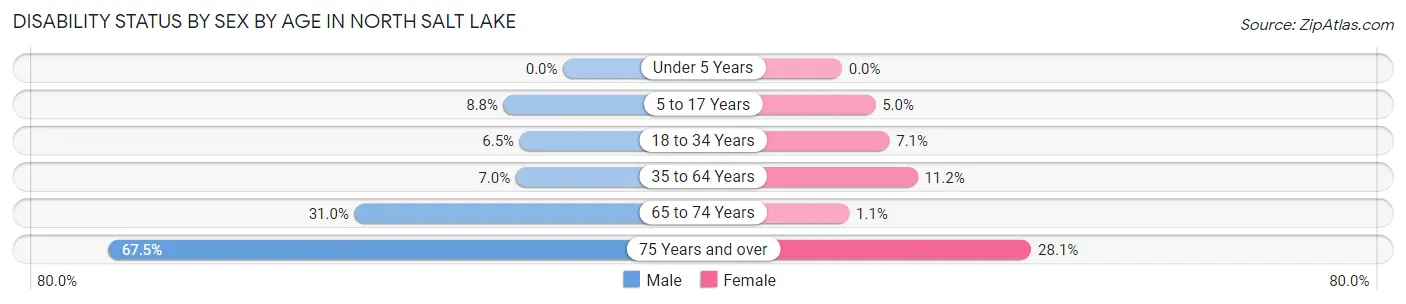
| Age Bracket | Male | Female |
| Under 5 Years | 0 (0.0%) | 0 (0.0%) |
| 5 to 17 Years | 216 (8.8%) | 113 (5.0%) |
| 18 to 34 Years | 171 (6.5%) | 178 (7.0%) |
| 35 to 64 Years | 286 (7.0%) | 460 (11.2%) |
| 65 to 74 Years | 193 (31.0%) | 7 (1.1%) |
| 75 Years and over | 222 (67.5%) | 176 (28.1%) |
Disability Class by Sex by Age in North Salt Lake
Disability Class: Hearing Difficulty
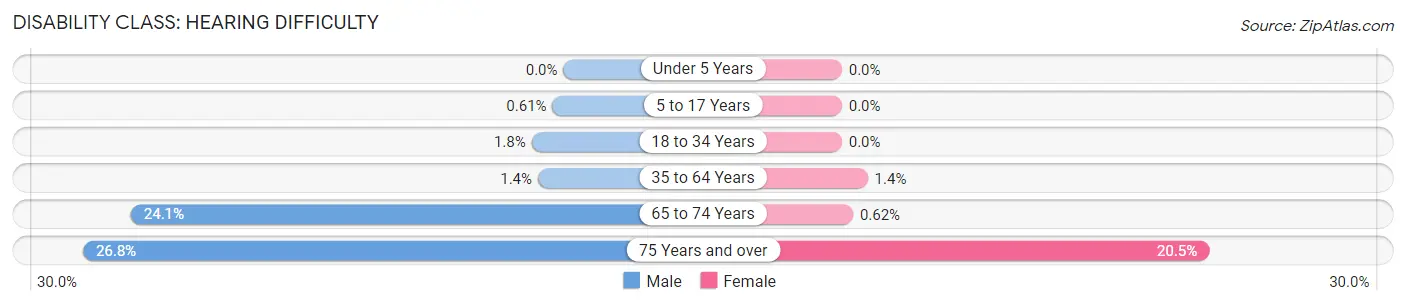
| Age Bracket | Male | Female |
| Under 5 Years | 0 (0.0%) | 0 (0.0%) |
| 5 to 17 Years | 15 (0.6%) | 0 (0.0%) |
| 18 to 34 Years | 47 (1.8%) | 0 (0.0%) |
| 35 to 64 Years | 58 (1.4%) | 59 (1.4%) |
| 65 to 74 Years | 150 (24.1%) | 4 (0.6%) |
| 75 Years and over | 88 (26.8%) | 128 (20.4%) |
Disability Class: Vision Difficulty
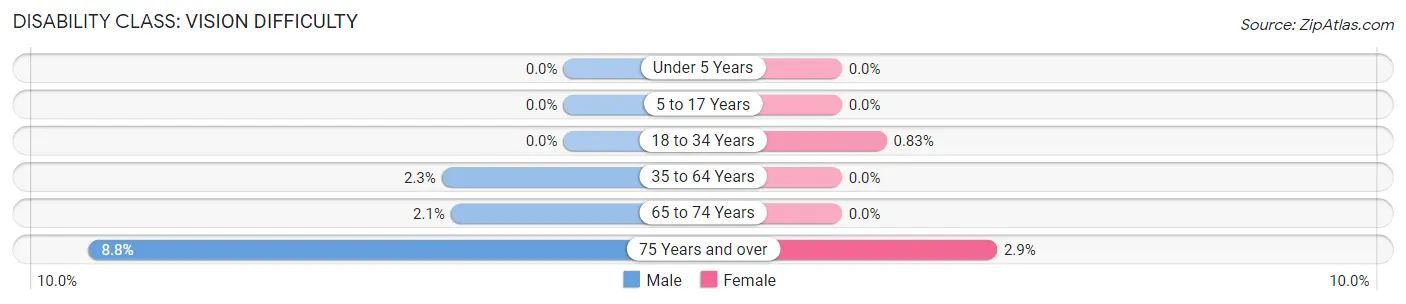
| Age Bracket | Male | Female |
| Under 5 Years | 0 (0.0%) | 0 (0.0%) |
| 5 to 17 Years | 0 (0.0%) | 0 (0.0%) |
| 18 to 34 Years | 0 (0.0%) | 21 (0.8%) |
| 35 to 64 Years | 92 (2.3%) | 0 (0.0%) |
| 65 to 74 Years | 13 (2.1%) | 0 (0.0%) |
| 75 Years and over | 29 (8.8%) | 18 (2.9%) |
Disability Class: Cognitive Difficulty
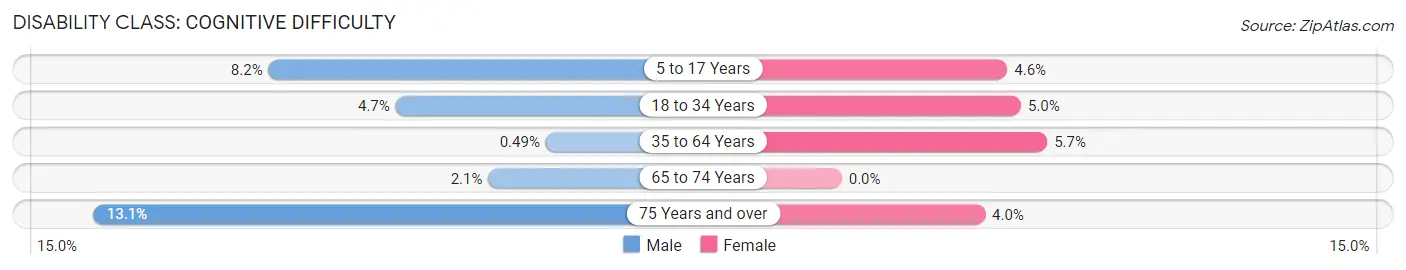
| Age Bracket | Male | Female |
| 5 to 17 Years | 201 (8.2%) | 105 (4.6%) |
| 18 to 34 Years | 124 (4.7%) | 126 (5.0%) |
| 35 to 64 Years | 20 (0.5%) | 234 (5.7%) |
| 65 to 74 Years | 13 (2.1%) | 0 (0.0%) |
| 75 Years and over | 43 (13.1%) | 25 (4.0%) |
Disability Class: Ambulatory Difficulty
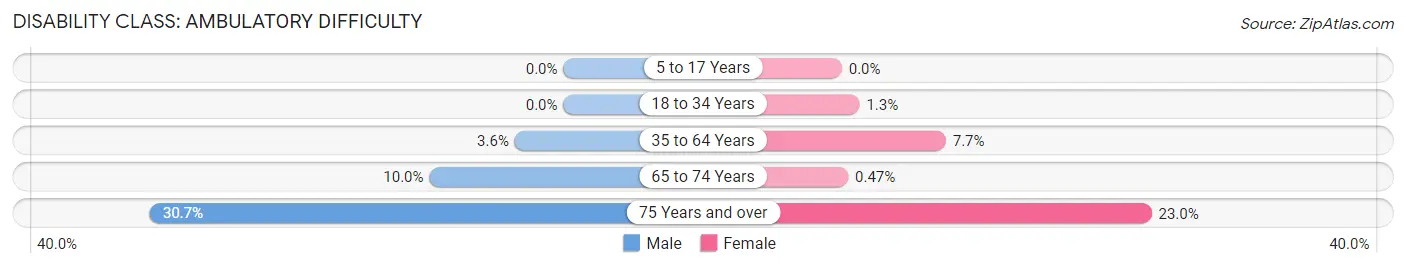
| Age Bracket | Male | Female |
| 5 to 17 Years | 0 (0.0%) | 0 (0.0%) |
| 18 to 34 Years | 0 (0.0%) | 33 (1.3%) |
| 35 to 64 Years | 147 (3.6%) | 316 (7.7%) |
| 65 to 74 Years | 62 (10.0%) | 3 (0.5%) |
| 75 Years and over | 101 (30.7%) | 144 (23.0%) |
Disability Class: Self-Care Difficulty
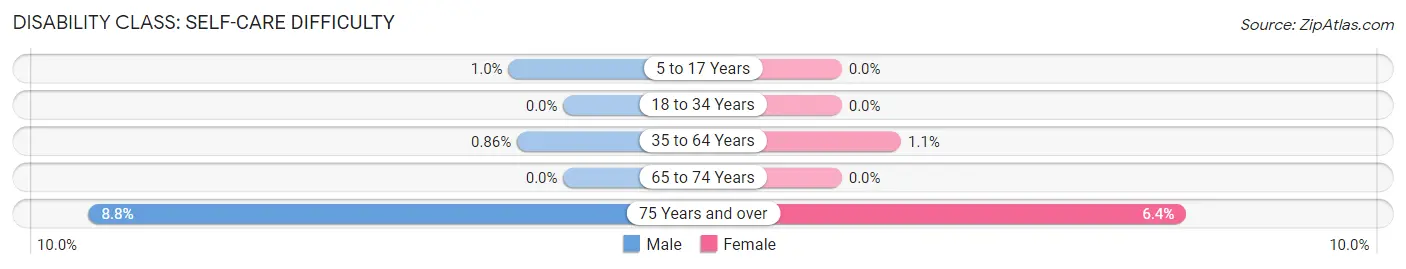
| Age Bracket | Male | Female |
| 5 to 17 Years | 25 (1.0%) | 0 (0.0%) |
| 18 to 34 Years | 0 (0.0%) | 0 (0.0%) |
| 35 to 64 Years | 35 (0.9%) | 45 (1.1%) |
| 65 to 74 Years | 0 (0.0%) | 0 (0.0%) |
| 75 Years and over | 29 (8.8%) | 40 (6.4%) |
Technology Access in North Salt Lake
Computing Device Access in North Salt Lake
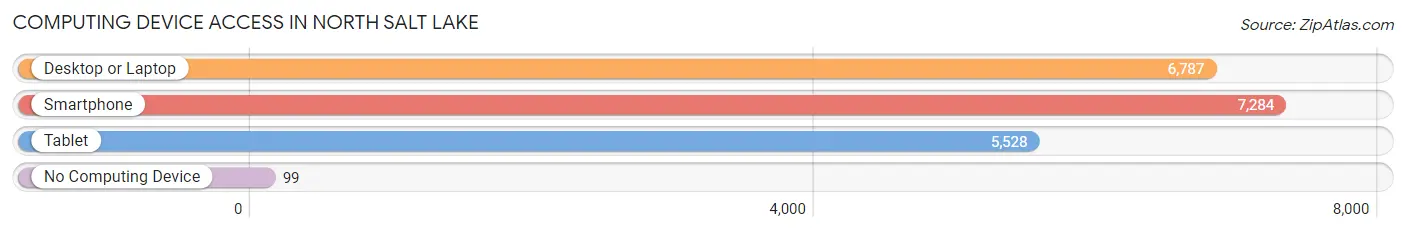
| Device Type | # Households | % Households |
| Desktop or Laptop | 6,787 | 90.3% |
| Smartphone | 7,284 | 96.9% |
| Tablet | 5,528 | 73.6% |
| No Computing Device | 99 | 1.3% |
| Total | 7,515 | 100.0% |
Internet Access in North Salt Lake
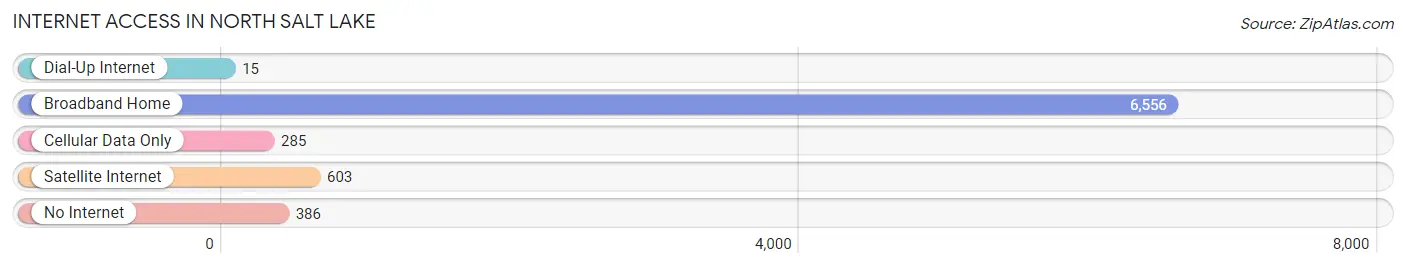
| Internet Type | # Households | % Households |
| Dial-Up Internet | 15 | 0.2% |
| Broadband Home | 6,556 | 87.2% |
| Cellular Data Only | 285 | 3.8% |
| Satellite Internet | 603 | 8.0% |
| No Internet | 386 | 5.1% |
| Total | 7,515 | 100.0% |
North Salt Lake Summary
Salt Lake City, Utah is the capital and most populous city in the state of Utah. It is located in the northern part of the state, along the Wasatch Front, and is the core of the Salt Lake City metropolitan area, which has a population of 1.2 million people. The city is known for its strong Mormon heritage, as well as its outdoor recreation opportunities.
History
Salt Lake City was founded in 1847 by Brigham Young and a group of Mormon pioneers. The city was established as a refuge from religious persecution and as a place for the Mormon faith to flourish. The city was named after the Great Salt Lake, which was located nearby.
The city grew rapidly in the late 19th century, becoming a major transportation hub and a center of industry. The city was also the site of the 2002 Winter Olympics.
Geography
Salt Lake City is located in the northern part of Utah, along the Wasatch Front. The city is situated in a valley between the Wasatch and Oquirrh Mountains. The city is bordered by the Great Salt Lake to the northwest and the Jordan River to the east.
The city has a total area of 110.4 square miles, of which 109.1 square miles is land and 1.3 square miles is water. The city has a semi-arid climate, with hot summers and cold winters.
Economy
Salt Lake City is the economic hub of Utah, and is home to a variety of industries. The city is a major transportation hub, with the Salt Lake City International Airport, the Union Pacific Railroad, and several major highways. The city is also a major center for finance, technology, and manufacturing.
The city is home to several major companies, including the Church of Jesus Christ of Latter-day Saints, Goldman Sachs, and eBay. The city is also home to several universities, including the University of Utah, Westminster College, and Salt Lake Community College.
Demographics
As of the 2010 census, Salt Lake City had a population of 186,440 people. The city has a population density of 1,711 people per square mile. The racial makeup of the city was 73.2% White, 2.3% African American, 1.2% Native American, 2.3% Asian, 0.2% Pacific Islander, and 18.9% from other races.
The median household income in the city was $50,936, and the median family income was $60,817. The per capita income in the city was $25,845. The city has a poverty rate of 14.3%.
Salt Lake City is a major center of the Mormon faith, with over 60% of the population identifying as members of the Church of Jesus Christ of Latter-day Saints. The city is also home to a variety of other religious faiths, including Catholicism, Judaism, and Islam.
Common Questions
What is Per Capita Income in North Salt Lake?
Per Capita income in North Salt Lake is $42,165.
What is the Median Family Income in North Salt Lake?
Median Family Income in North Salt Lake is $108,137.
What is the Median Household income in North Salt Lake?
Median Household Income in North Salt Lake is $94,365.
What is Income or Wage Gap in North Salt Lake?
Income or Wage Gap in North Salt Lake is 37.7%.
Women in North Salt Lake earn 62.3 cents for every dollar earned by a man.
What is Inequality or Gini Index in North Salt Lake?
Inequality or Gini Index in North Salt Lake is 0.41.
What is the Total Population of North Salt Lake?
Total Population of North Salt Lake is 21,875.
What is the Total Male Population of North Salt Lake?
Total Male Population of North Salt Lake is 10,893.
What is the Total Female Population of North Salt Lake?
Total Female Population of North Salt Lake is 10,982.
What is the Ratio of Males per 100 Females in North Salt Lake?
There are 99.19 Males per 100 Females in North Salt Lake.
What is the Ratio of Females per 100 Males in North Salt Lake?
There are 100.82 Females per 100 Males in North Salt Lake.
What is the Median Population Age in North Salt Lake?
Median Population Age in North Salt Lake is 33.6 Years.
What is the Average Family Size in North Salt Lake
Average Family Size in North Salt Lake is 3.3 People.
What is the Average Household Size in North Salt Lake
Average Household Size in North Salt Lake is 2.9 People.
How Large is the Labor Force in North Salt Lake?
There are 12,203 People in the Labor Forcein in North Salt Lake.
What is the Percentage of People in the Labor Force in North Salt Lake?
73.9% of People are in the Labor Force in North Salt Lake.
What is the Unemployment Rate in North Salt Lake?
Unemployment Rate in North Salt Lake is 3.1%.