Lutherville, MD Map & Demographics
Lutherville Map
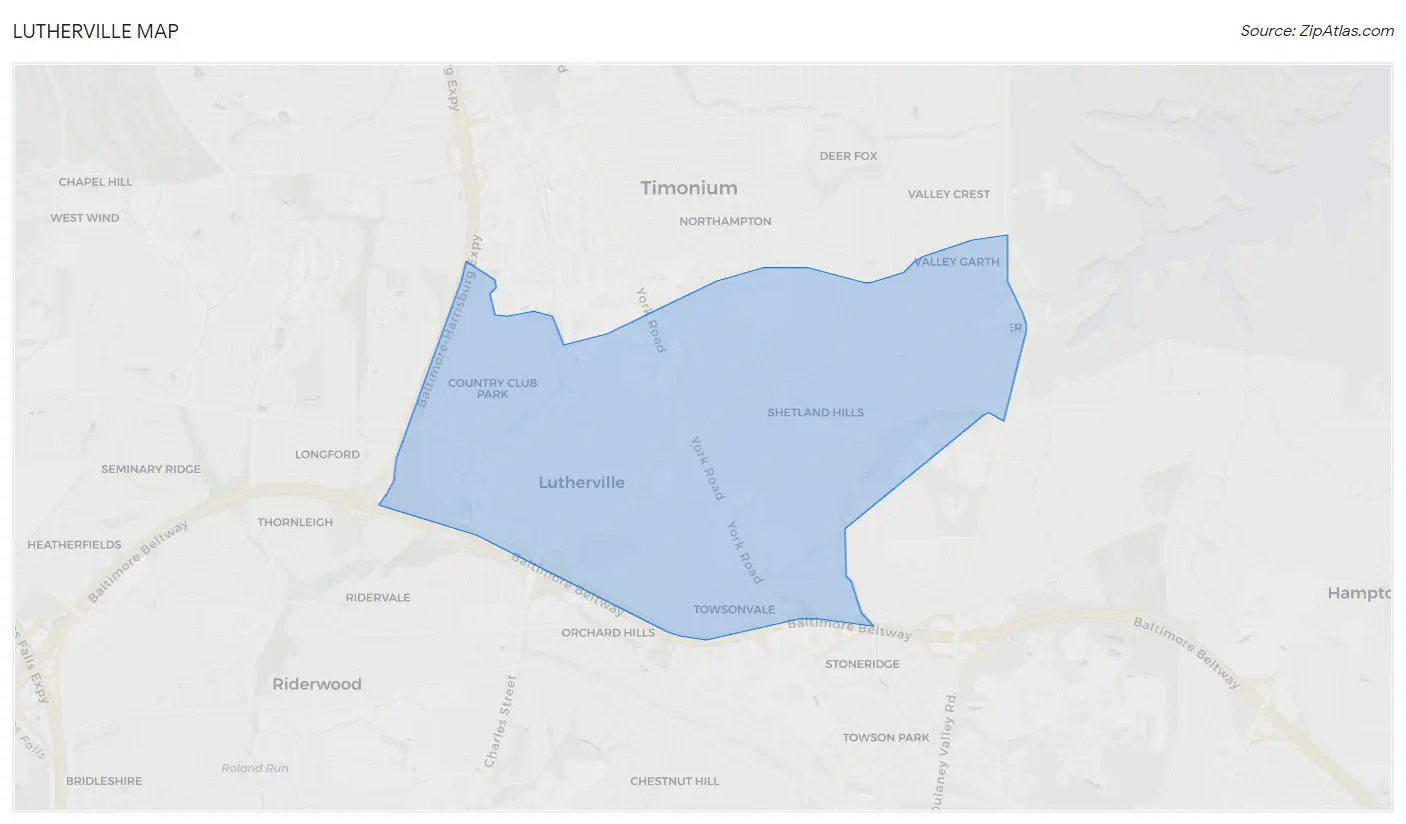
Lutherville Overview
$57,463
PER CAPITA INCOME
$145,609
AVG FAMILY INCOME
$133,865
AVG HOUSEHOLD INCOME
17.1%
WAGE / INCOME GAP [ % ]
82.9¢/ $1
WAGE / INCOME GAP [ $ ]
0.39
INEQUALITY / GINI INDEX
6,595
TOTAL POPULATION
3,329
MALE POPULATION
3,266
FEMALE POPULATION
101.93
MALES / 100 FEMALES
98.11
FEMALES / 100 MALES
45.6
MEDIAN AGE
3.0
AVG FAMILY SIZE
2.7
AVG HOUSEHOLD SIZE
3,733
LABOR FORCE [ PEOPLE ]
69.0%
PERCENT IN LABOR FORCE
5.5%
UNEMPLOYMENT RATE
Lutherville Area Codes
Income in Lutherville
Income Overview in Lutherville
Per Capita Income in Lutherville is $57,463, while median incomes of families and households are $145,609 and $133,865 respectively.
| Characteristic | Number | Measure |
| Per Capita Income | 6,595 | $57,463 |
| Median Family Income | 1,823 | $145,609 |
| Mean Family Income | 1,823 | $170,716 |
| Median Household Income | 2,473 | $133,865 |
| Mean Household Income | 2,473 | $150,556 |
| Income Deficit | 1,823 | $0 |
| Wage / Income Gap (%) | 6,595 | 17.15% |
| Wage / Income Gap ($) | 6,595 | 82.85¢ per $1 |
| Gini / Inequality Index | 6,595 | 0.39 |
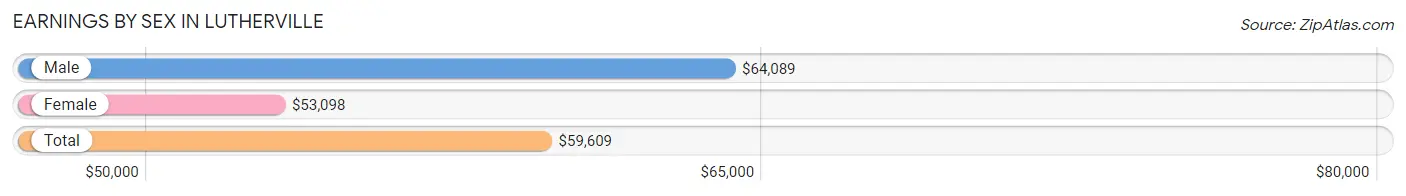
Earnings by Sex in Lutherville
Average Earnings in Lutherville are $59,609, $64,089 for men and $53,098 for women, a difference of 17.2%.
| Sex | Number | Average Earnings |
| Male | 1,998 (52.1%) | $64,089 |
| Female | 1,840 (47.9%) | $53,098 |
| Total | 3,838 (100.0%) | $59,609 |
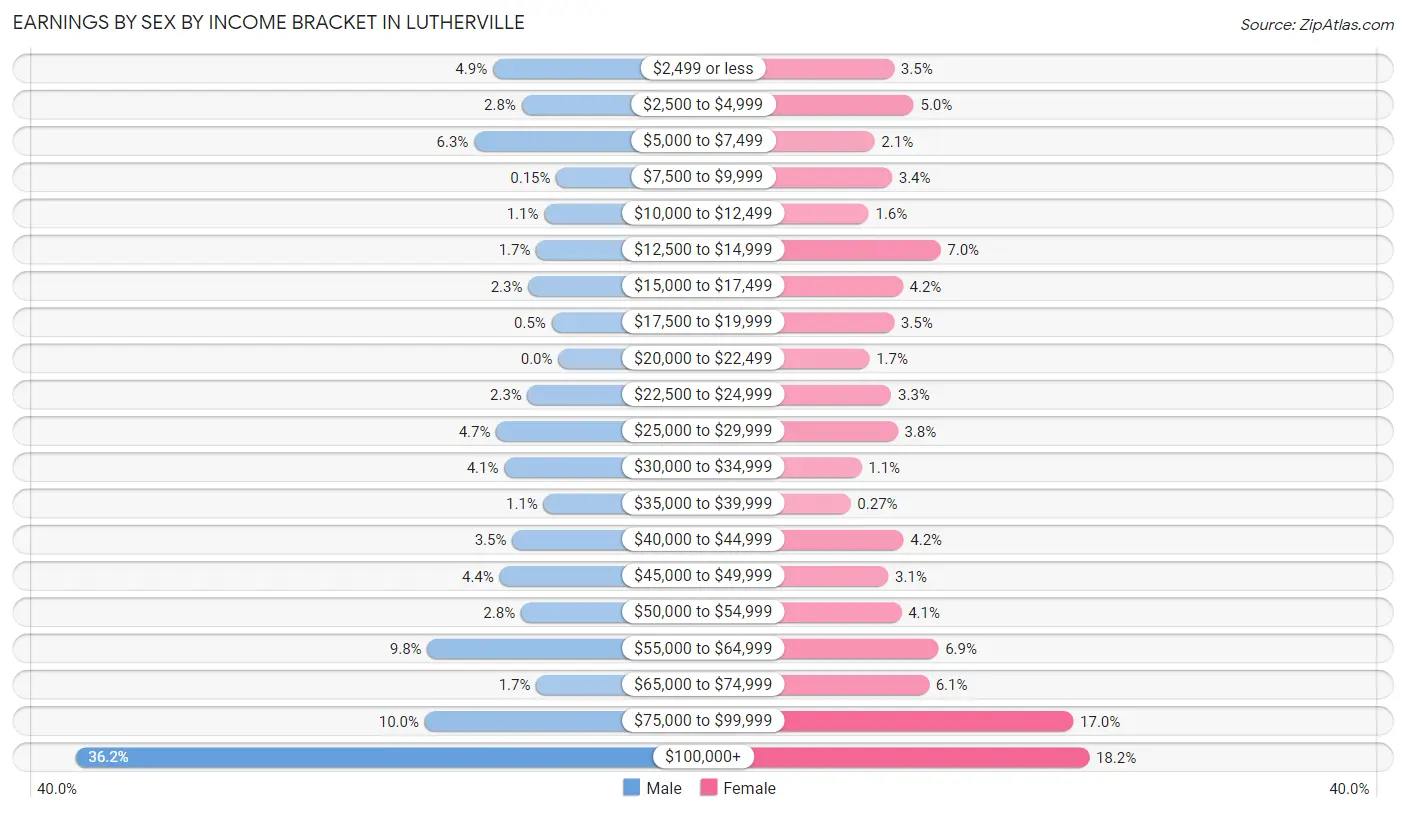
Earnings by Sex by Income Bracket in Lutherville
The most common earnings brackets in Lutherville are $100,000+ for men (723 | 36.2%) and $100,000+ for women (334 | 18.1%).
| Income | Male | Female |
| $2,499 or less | 98 (4.9%) | 65 (3.5%) |
| $2,500 to $4,999 | 55 (2.8%) | 92 (5.0%) |
| $5,000 to $7,499 | 126 (6.3%) | 38 (2.1%) |
| $7,500 to $9,999 | 3 (0.2%) | 62 (3.4%) |
| $10,000 to $12,499 | 21 (1.1%) | 30 (1.6%) |
| $12,500 to $14,999 | 33 (1.7%) | 129 (7.0%) |
| $15,000 to $17,499 | 45 (2.2%) | 77 (4.2%) |
| $17,500 to $19,999 | 10 (0.5%) | 65 (3.5%) |
| $20,000 to $22,499 | 0 (0.0%) | 31 (1.7%) |
| $22,500 to $24,999 | 46 (2.3%) | 61 (3.3%) |
| $25,000 to $29,999 | 93 (4.6%) | 70 (3.8%) |
| $30,000 to $34,999 | 81 (4.1%) | 20 (1.1%) |
| $35,000 to $39,999 | 22 (1.1%) | 5 (0.3%) |
| $40,000 to $44,999 | 69 (3.5%) | 78 (4.2%) |
| $45,000 to $49,999 | 88 (4.4%) | 57 (3.1%) |
| $50,000 to $54,999 | 56 (2.8%) | 75 (4.1%) |
| $55,000 to $64,999 | 196 (9.8%) | 126 (6.9%) |
| $65,000 to $74,999 | 33 (1.7%) | 113 (6.1%) |
| $75,000 to $99,999 | 200 (10.0%) | 312 (17.0%) |
| $100,000+ | 723 (36.2%) | 334 (18.1%) |
| Total | 1,998 (100.0%) | 1,840 (100.0%) |
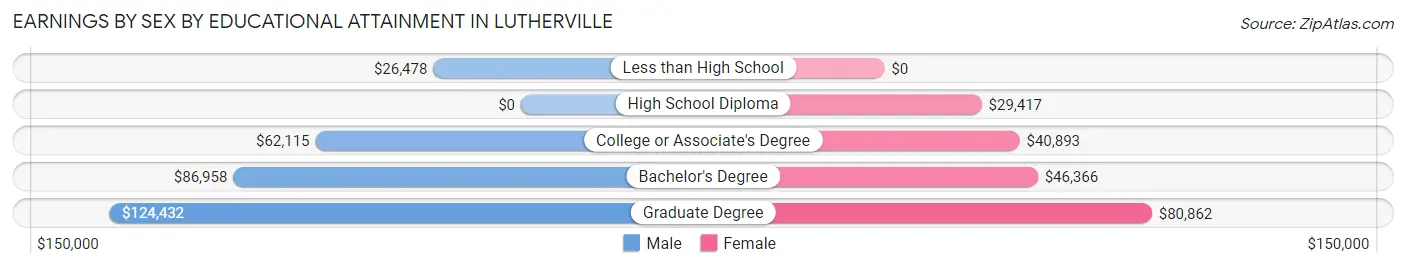
Earnings by Sex by Educational Attainment in Lutherville
Average earnings in Lutherville are $85,313 for men and $56,354 for women, a difference of 33.9%. Men with an educational attainment of graduate degree enjoy the highest average annual earnings of $124,432, while those with less than high school education earn the least with $26,478. Women with an educational attainment of graduate degree earn the most with the average annual earnings of $80,862, while those with high school diploma education have the smallest earnings of $29,417.
| Educational Attainment | Male Income | Female Income |
| Less than High School | $26,478 | $0 |
| High School Diploma | - | - |
| College or Associate's Degree | $62,115 | $40,893 |
| Bachelor's Degree | $86,958 | $46,366 |
| Graduate Degree | $124,432 | $80,862 |
| Total | $85,313 | $56,354 |
Family Income in Lutherville
Family Income Brackets in Lutherville
According to the Lutherville family income data, there are 605 families falling into the $200,000+ income range, which is the most common income bracket and makes up 33.2% of all families.
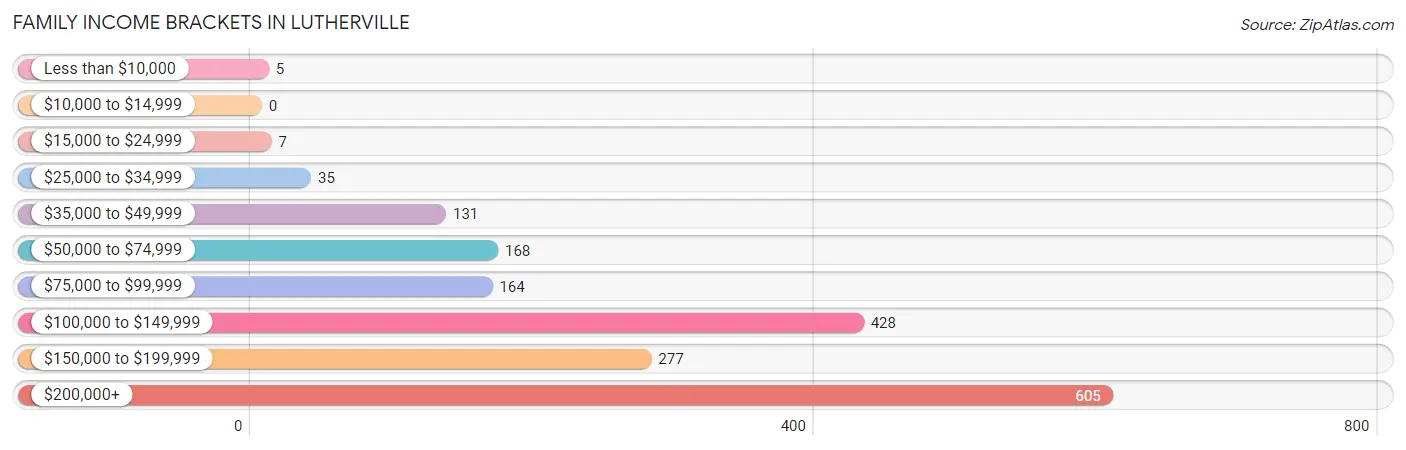
| Income Bracket | # Families | % Families |
| Less than $10,000 | 5 | 0.3% |
| $10,000 to $14,999 | 0 | 0.0% |
| $15,000 to $24,999 | 7 | 0.4% |
| $25,000 to $34,999 | 35 | 1.9% |
| $35,000 to $49,999 | 131 | 7.2% |
| $50,000 to $74,999 | 168 | 9.2% |
| $75,000 to $99,999 | 164 | 9.0% |
| $100,000 to $149,999 | 428 | 23.5% |
| $150,000 to $199,999 | 277 | 15.2% |
| $200,000+ | 605 | 33.2% |
Family Income by Famaliy Size in Lutherville
5-person families (78 | 4.3%) account for the highest median family income in Lutherville with $208,750 per family, while 2-person families (805 | 44.2%) have the highest median income of $70,625 per family member.
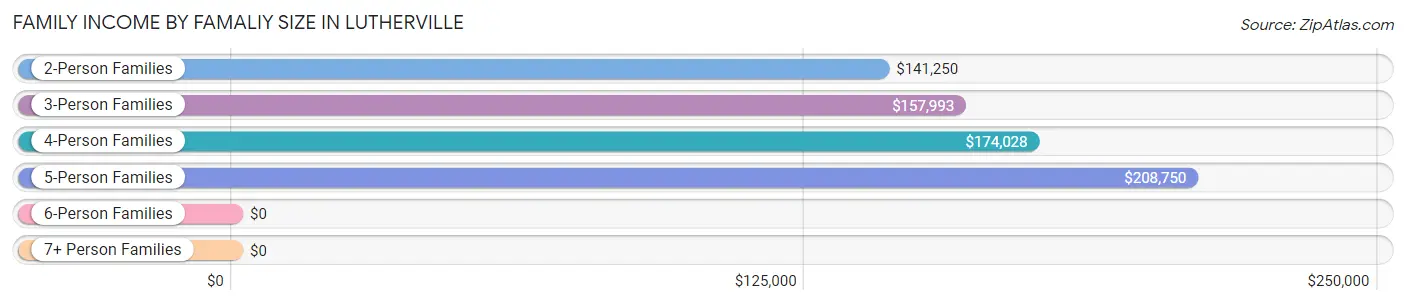
| Income Bracket | # Families | Median Income |
| 2-Person Families | 805 (44.2%) | $141,250 |
| 3-Person Families | 581 (31.9%) | $157,993 |
| 4-Person Families | 291 (16.0%) | $174,028 |
| 5-Person Families | 78 (4.3%) | $208,750 |
| 6-Person Families | 32 (1.8%) | $0 |
| 7+ Person Families | 36 (2.0%) | $0 |
| Total | 1,823 (100.0%) | $145,609 |
Family Income by Number of Earners in Lutherville
The median family income in Lutherville is $145,609, with families comprising 3+ earners (215) having the highest median family income of $206,719, while families with no earners (179) have the lowest median family income of $92,917, accounting for 11.8% and 9.8% of families, respectively.
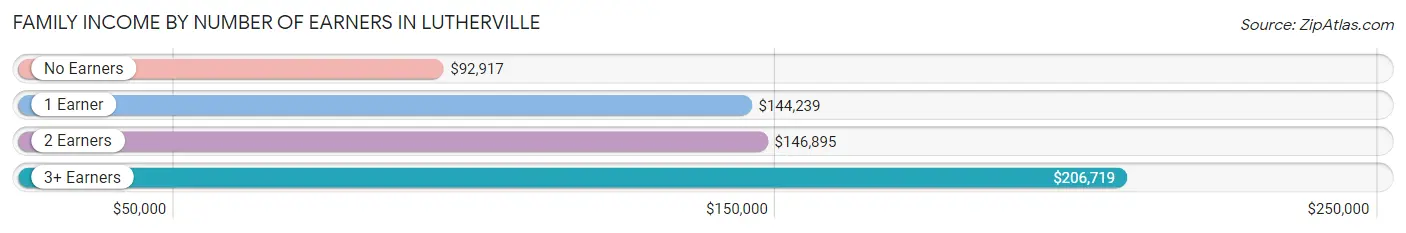
| Number of Earners | # Families | Median Income |
| No Earners | 179 (9.8%) | $92,917 |
| 1 Earner | 468 (25.7%) | $144,239 |
| 2 Earners | 961 (52.7%) | $146,895 |
| 3+ Earners | 215 (11.8%) | $206,719 |
| Total | 1,823 (100.0%) | $145,609 |
Household Income in Lutherville
Household Income Brackets in Lutherville
With 717 households falling in the category, the $200,000+ income range is the most frequent in Lutherville, accounting for 29.0% of all households. In contrast, only 35 households (1.4%) fall into the $10,000 to $14,999 income bracket, making it the least populous group.
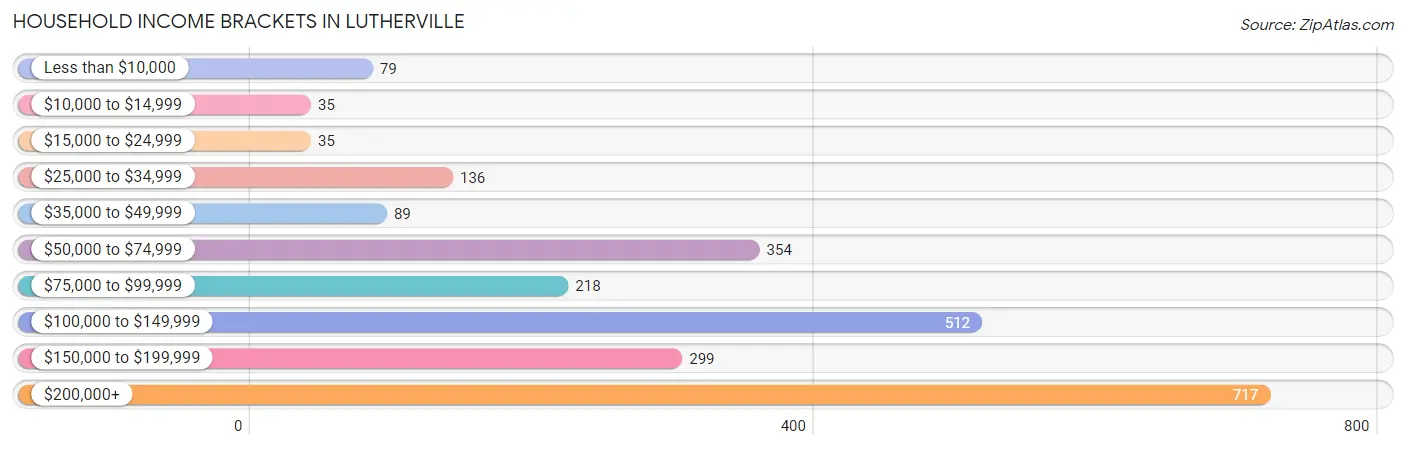
| Income Bracket | # Households | % Households |
| Less than $10,000 | 79 | 3.2% |
| $10,000 to $14,999 | 35 | 1.4% |
| $15,000 to $24,999 | 35 | 1.4% |
| $25,000 to $34,999 | 136 | 5.5% |
| $35,000 to $49,999 | 89 | 3.6% |
| $50,000 to $74,999 | 354 | 14.3% |
| $75,000 to $99,999 | 218 | 8.8% |
| $100,000 to $149,999 | 512 | 20.7% |
| $150,000 to $199,999 | 299 | 12.1% |
| $200,000+ | 717 | 29.0% |
Household Income by Householder Age in Lutherville
The median household income in Lutherville is $133,865, with the highest median household income of $145,671 found in the 45 to 64 years age bracket for the primary householder. A total of 988 households (40.0%) fall into this category. Meanwhile, the 15 to 24 years age bracket for the primary householder has the lowest median household income of $0, with 13 households (0.5%) in this group.
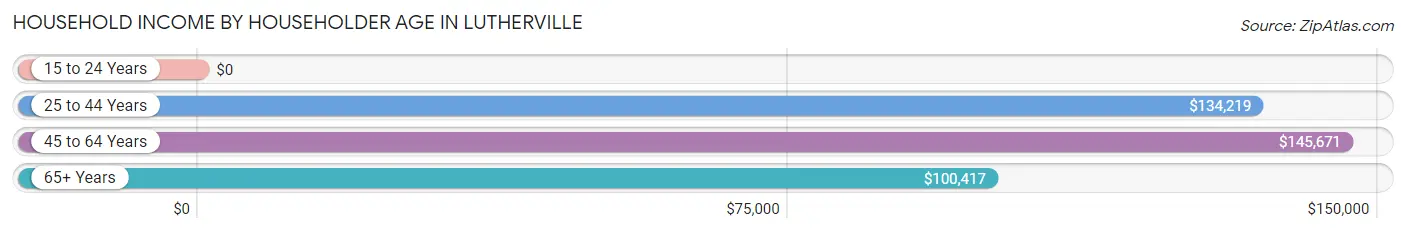
| Income Bracket | # Households | Median Income |
| 15 to 24 Years | 13 (0.5%) | $0 |
| 25 to 44 Years | 560 (22.6%) | $134,219 |
| 45 to 64 Years | 988 (40.0%) | $145,671 |
| 65+ Years | 912 (36.9%) | $100,417 |
| Total | 2,473 (100.0%) | $133,865 |
Poverty in Lutherville
Income Below Poverty by Sex and Age in Lutherville
With 3.4% poverty level for males and 4.8% for females among the residents of Lutherville, 18 to 24 year old males and 75 year old and over females are the most vulnerable to poverty, with 28 males (12.7%) and 48 females (18.2%) in their respective age groups living below the poverty level.
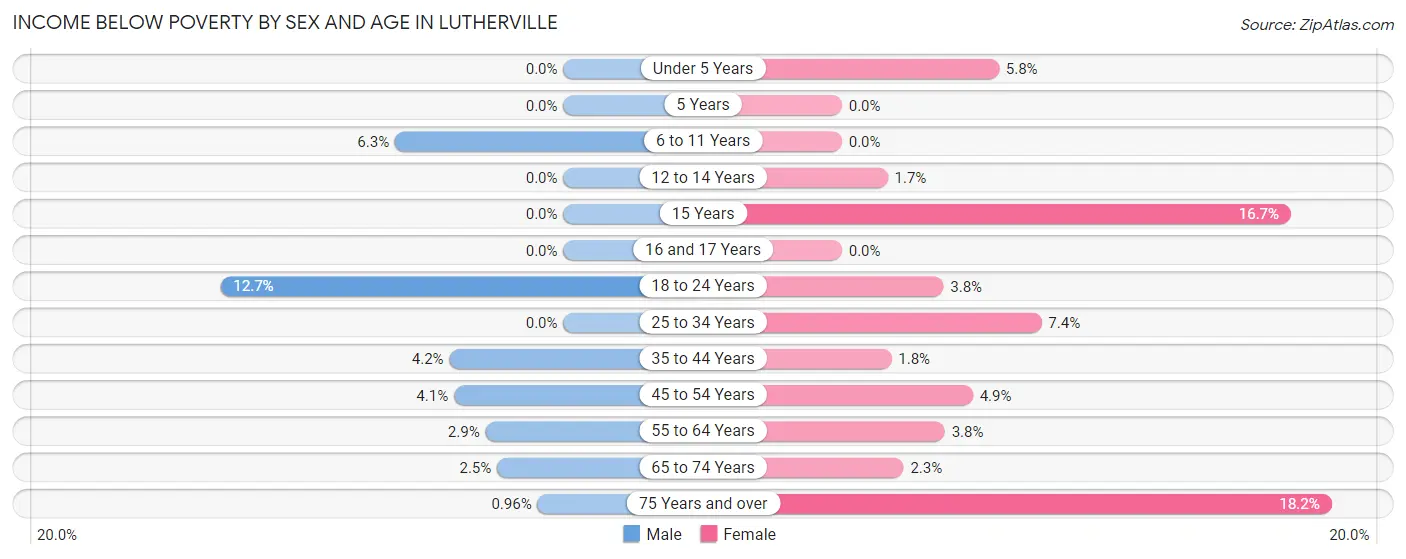
| Age Bracket | Male | Female |
| Under 5 Years | 0 (0.0%) | 6 (5.8%) |
| 5 Years | 0 (0.0%) | 0 (0.0%) |
| 6 to 11 Years | 18 (6.2%) | 0 (0.0%) |
| 12 to 14 Years | 0 (0.0%) | 3 (1.7%) |
| 15 Years | 0 (0.0%) | 5 (16.7%) |
| 16 and 17 Years | 0 (0.0%) | 0 (0.0%) |
| 18 to 24 Years | 28 (12.7%) | 6 (3.8%) |
| 25 to 34 Years | 0 (0.0%) | 28 (7.4%) |
| 35 to 44 Years | 18 (4.2%) | 8 (1.8%) |
| 45 to 54 Years | 23 (4.1%) | 21 (4.9%) |
| 55 to 64 Years | 14 (2.9%) | 18 (3.8%) |
| 65 to 74 Years | 9 (2.5%) | 12 (2.3%) |
| 75 Years and over | 3 (1.0%) | 48 (18.2%) |
| Total | 113 (3.4%) | 155 (4.8%) |
Income Above Poverty by Sex and Age in Lutherville
According to the poverty statistics in Lutherville, males aged under 5 years and females aged 5 years are the age groups that are most secure financially, with 100.0% of males and 100.0% of females in these age groups living above the poverty line.
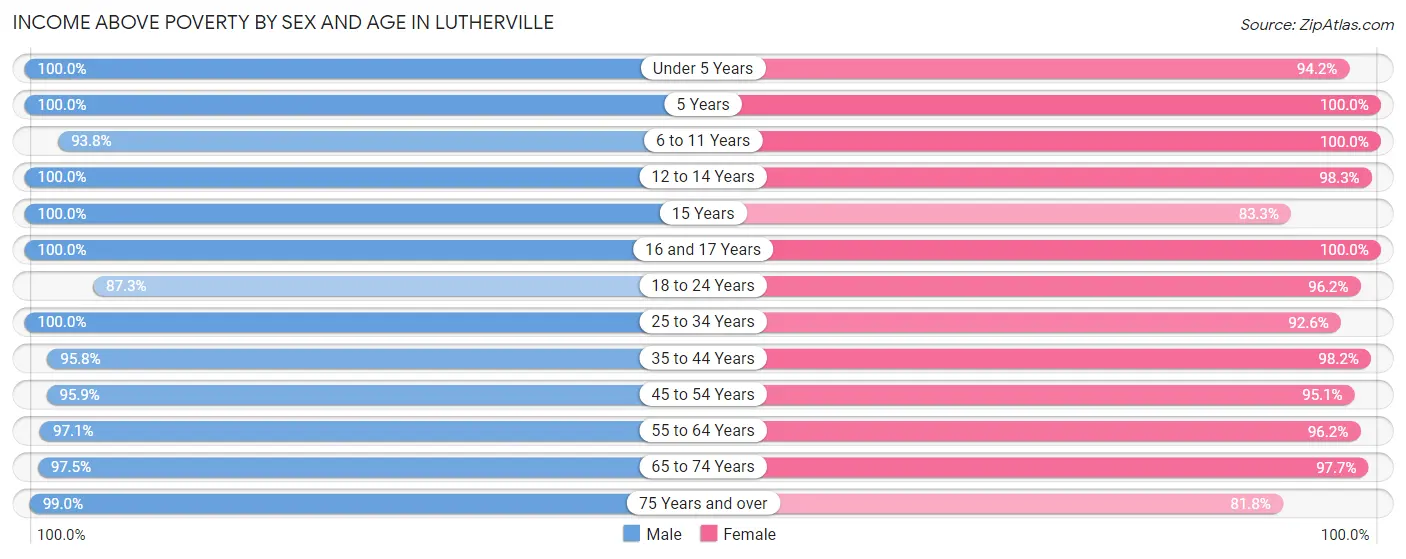
| Age Bracket | Male | Female |
| Under 5 Years | 115 (100.0%) | 97 (94.2%) |
| 5 Years | 5 (100.0%) | 24 (100.0%) |
| 6 to 11 Years | 270 (93.8%) | 246 (100.0%) |
| 12 to 14 Years | 176 (100.0%) | 173 (98.3%) |
| 15 Years | 22 (100.0%) | 25 (83.3%) |
| 16 and 17 Years | 67 (100.0%) | 25 (100.0%) |
| 18 to 24 Years | 192 (87.3%) | 153 (96.2%) |
| 25 to 34 Years | 281 (100.0%) | 350 (92.6%) |
| 35 to 44 Years | 408 (95.8%) | 426 (98.2%) |
| 45 to 54 Years | 544 (95.9%) | 411 (95.1%) |
| 55 to 64 Years | 470 (97.1%) | 453 (96.2%) |
| 65 to 74 Years | 357 (97.5%) | 512 (97.7%) |
| 75 Years and over | 309 (99.0%) | 216 (81.8%) |
| Total | 3,216 (96.6%) | 3,111 (95.3%) |
Income Below Poverty Among Married-Couple Families in Lutherville
The poverty statistics for married-couple families in Lutherville show that 0.1% or 2 of the total 1,536 families live below the poverty line. Families with 1 or 2 children have the highest poverty rate of 0.4%, comprising of 2 families. On the other hand, families with no children have the lowest poverty rate of 0.0%, which includes 0 families.
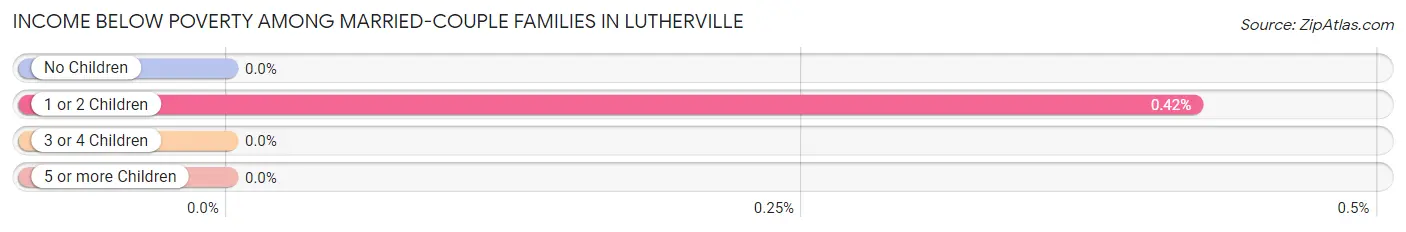
| Children | Above Poverty | Below Poverty |
| No Children | 938 (100.0%) | 0 (0.0%) |
| 1 or 2 Children | 473 (99.6%) | 2 (0.4%) |
| 3 or 4 Children | 123 (100.0%) | 0 (0.0%) |
| 5 or more Children | 0 (0.0%) | 0 (0.0%) |
| Total | 1,534 (99.9%) | 2 (0.1%) |
Income Below Poverty Among Single-Parent Households in Lutherville
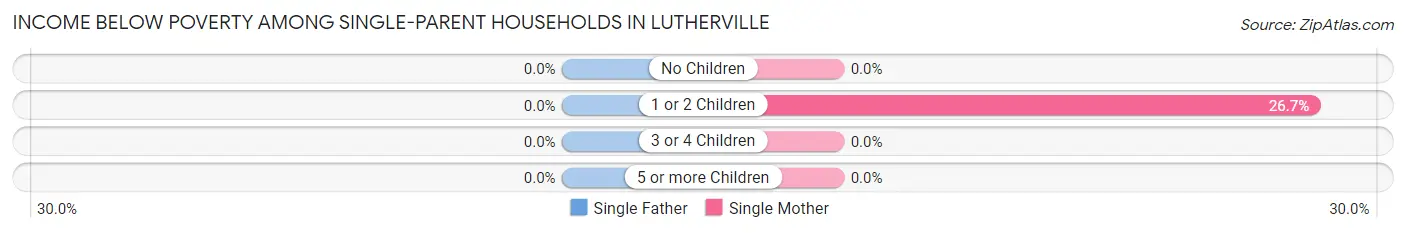
| Children | Single Father | Single Mother |
| No Children | 0 (0.0%) | 0 (0.0%) |
| 1 or 2 Children | 0 (0.0%) | 12 (26.7%) |
| 3 or 4 Children | 0 (0.0%) | 0 (0.0%) |
| 5 or more Children | 0 (0.0%) | 0 (0.0%) |
| Total | 0 (0.0%) | 12 (8.4%) |
Income Below Poverty Among Married-Couple vs Single-Parent Households in Lutherville
The poverty data for Lutherville shows that 2 of the married-couple family households (0.1%) and 12 of the single-parent households (4.2%) are living below the poverty level. Within the married-couple family households, those with 1 or 2 children have the highest poverty rate, with 2 households (0.4%) falling below the poverty line. Among the single-parent households, those with 1 or 2 children have the highest poverty rate, with 12 household (7.9%) living below poverty.
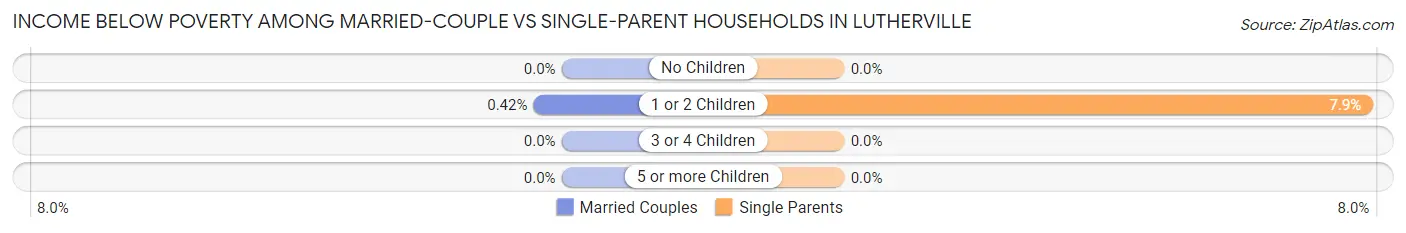
| Children | Married-Couple Families | Single-Parent Households |
| No Children | 0 (0.0%) | 0 (0.0%) |
| 1 or 2 Children | 2 (0.4%) | 12 (7.9%) |
| 3 or 4 Children | 0 (0.0%) | 0 (0.0%) |
| 5 or more Children | 0 (0.0%) | 0 (0.0%) |
| Total | 2 (0.1%) | 12 (4.2%) |
Race in Lutherville
The most populous races in Lutherville are White / Caucasian (5,090 | 77.2%), Asian (933 | 14.1%), and Two or more Races (446 | 6.8%).
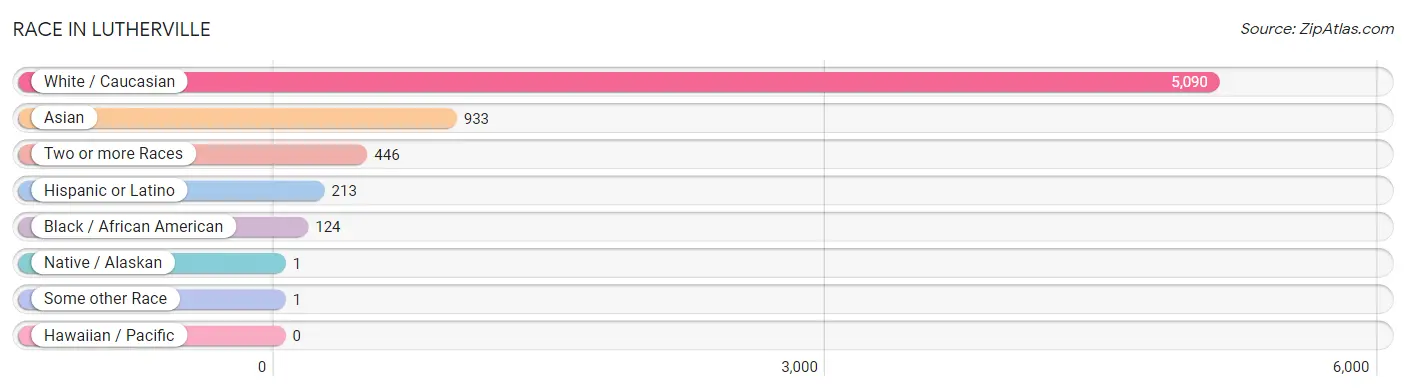
| Race | # Population | % Population |
| Asian | 933 | 14.1% |
| Black / African American | 124 | 1.9% |
| Hawaiian / Pacific | 0 | 0.0% |
| Hispanic or Latino | 213 | 3.2% |
| Native / Alaskan | 1 | 0.0% |
| White / Caucasian | 5,090 | 77.2% |
| Two or more Races | 446 | 6.8% |
| Some other Race | 1 | 0.0% |
| Total | 6,595 | 100.0% |
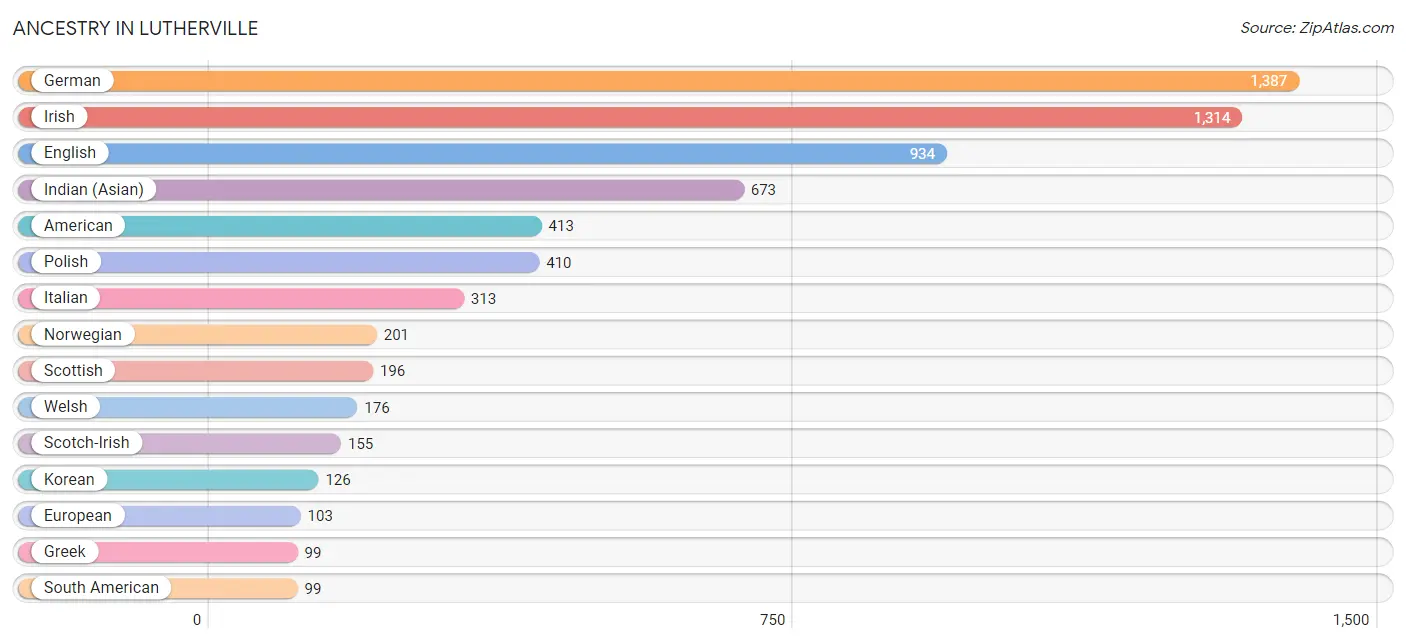
Ancestry in Lutherville
The most populous ancestries reported in Lutherville are German (1,387 | 21.0%), Irish (1,314 | 19.9%), English (934 | 14.2%), Indian (Asian) (673 | 10.2%), and American (413 | 6.3%), together accounting for 71.6% of all Lutherville residents.
| Ancestry | # Population | % Population |
| Afghan | 7 | 0.1% |
| African | 27 | 0.4% |
| American | 413 | 6.3% |
| Arab | 44 | 0.7% |
| Australian | 8 | 0.1% |
| Austrian | 33 | 0.5% |
| Bhutanese | 78 | 1.2% |
| Bolivian | 9 | 0.1% |
| British | 38 | 0.6% |
| Burmese | 55 | 0.8% |
| Celtic | 5 | 0.1% |
| Central American | 4 | 0.1% |
| Central American Indian | 19 | 0.3% |
| Chippewa | 1 | 0.0% |
| Colombian | 15 | 0.2% |
| Costa Rican | 4 | 0.1% |
| Croatian | 9 | 0.1% |
| Czech | 31 | 0.5% |
| Czechoslovakian | 32 | 0.5% |
| Danish | 7 | 0.1% |
| Dominican | 21 | 0.3% |
| Dutch | 80 | 1.2% |
| Eastern European | 54 | 0.8% |
| Ecuadorian | 1 | 0.0% |
| Egyptian | 44 | 0.7% |
| English | 934 | 14.2% |
| European | 103 | 1.6% |
| Filipino | 12 | 0.2% |
| Finnish | 20 | 0.3% |
| French | 55 | 0.8% |
| French Canadian | 24 | 0.4% |
| German | 1,387 | 21.0% |
| Greek | 99 | 1.5% |
| Hopi | 2 | 0.0% |
| Hungarian | 42 | 0.6% |
| Icelander | 4 | 0.1% |
| Indian (Asian) | 673 | 10.2% |
| Irish | 1,314 | 19.9% |
| Iroquois | 12 | 0.2% |
| Israeli | 3 | 0.1% |
| Italian | 313 | 4.8% |
| Kenyan | 20 | 0.3% |
| Korean | 126 | 1.9% |
| Latvian | 39 | 0.6% |
| Mexican | 11 | 0.2% |
| Mexican American Indian | 1 | 0.0% |
| Mongolian | 3 | 0.1% |
| Nigerian | 4 | 0.1% |
| Northern European | 20 | 0.3% |
| Norwegian | 201 | 3.0% |
| Pakistani | 16 | 0.2% |
| Paraguayan | 74 | 1.1% |
| Pennsylvania German | 18 | 0.3% |
| Polish | 410 | 6.2% |
| Portuguese | 7 | 0.1% |
| Puerto Rican | 19 | 0.3% |
| Russian | 75 | 1.1% |
| Scandinavian | 32 | 0.5% |
| Scotch-Irish | 155 | 2.4% |
| Scottish | 196 | 3.0% |
| Slovak | 24 | 0.4% |
| South American | 99 | 1.5% |
| South American Indian | 9 | 0.1% |
| Spaniard | 29 | 0.4% |
| Subsaharan African | 51 | 0.8% |
| Swedish | 50 | 0.8% |
| Swiss | 16 | 0.2% |
| Thai | 84 | 1.3% |
| Turkish | 16 | 0.2% |
| Ukrainian | 22 | 0.3% |
| Welsh | 176 | 2.7% |
| West Indian | 58 | 0.9% | View All 72 Rows |
Immigrants in Lutherville
The most numerous immigrant groups reported in Lutherville came from Asia (579 | 8.8%), Eastern Asia (374 | 5.7%), China (320 | 4.9%), Europe (137 | 2.1%), and South Eastern Asia (117 | 1.8%), together accounting for 23.1% of all Lutherville residents.
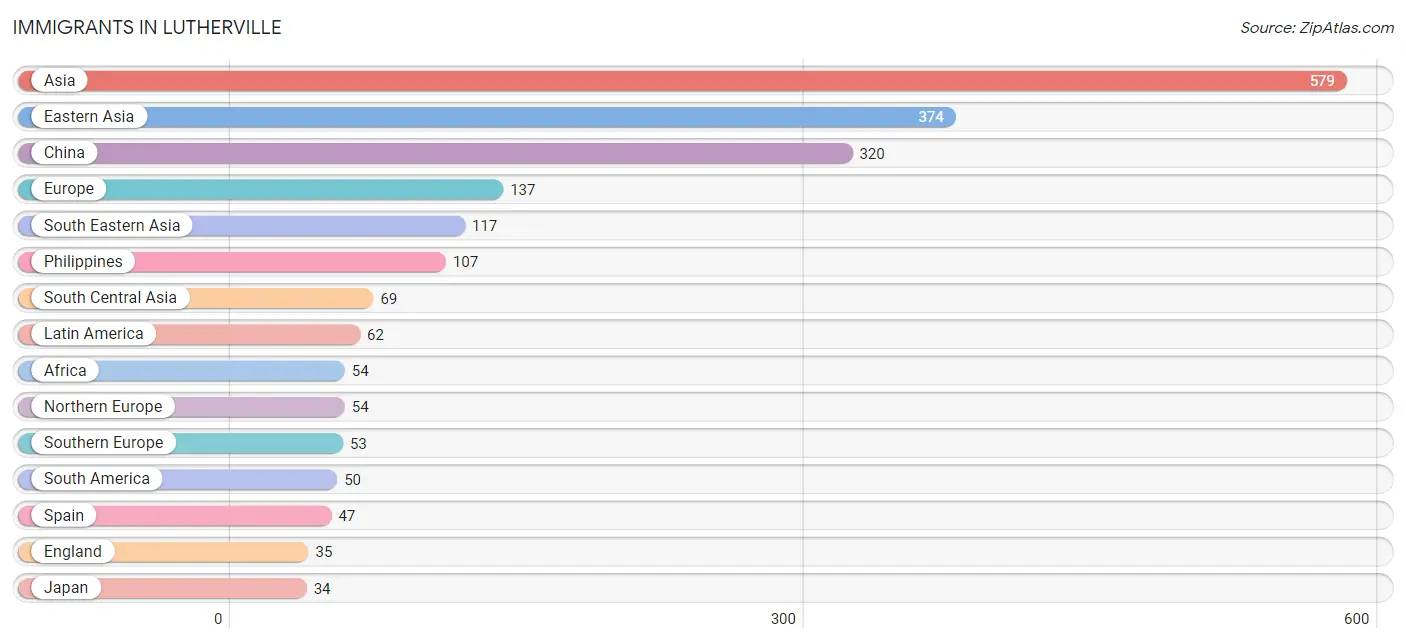
| Immigration Origin | # Population | % Population |
| Afghanistan | 14 | 0.2% |
| Africa | 54 | 0.8% |
| Asia | 579 | 8.8% |
| Australia | 5 | 0.1% |
| Austria | 21 | 0.3% |
| Bolivia | 14 | 0.2% |
| Brazil | 26 | 0.4% |
| Canada | 3 | 0.1% |
| Caribbean | 12 | 0.2% |
| China | 320 | 4.9% |
| Colombia | 9 | 0.1% |
| Dominican Republic | 8 | 0.1% |
| Eastern Africa | 11 | 0.2% |
| Eastern Asia | 374 | 5.7% |
| Eastern Europe | 3 | 0.1% |
| Ecuador | 1 | 0.0% |
| Egypt | 29 | 0.4% |
| England | 35 | 0.5% |
| Europe | 137 | 2.1% |
| Germany | 6 | 0.1% |
| Ghana | 14 | 0.2% |
| Greece | 6 | 0.1% |
| India | 26 | 0.4% |
| Israel | 3 | 0.1% |
| Japan | 34 | 0.5% |
| Kenya | 11 | 0.2% |
| Korea | 20 | 0.3% |
| Latin America | 62 | 0.9% |
| Malaysia | 10 | 0.2% |
| Nepal | 24 | 0.4% |
| Northern Africa | 29 | 0.4% |
| Northern Europe | 54 | 0.8% |
| Oceania | 5 | 0.1% |
| Pakistan | 5 | 0.1% |
| Philippines | 107 | 1.6% |
| South America | 50 | 0.8% |
| South Central Asia | 69 | 1.1% |
| South Eastern Asia | 117 | 1.8% |
| Southern Europe | 53 | 0.8% |
| Spain | 47 | 0.7% |
| Taiwan | 6 | 0.1% |
| Trinidad and Tobago | 4 | 0.1% |
| Turkey | 16 | 0.2% |
| Ukraine | 3 | 0.1% |
| Western Africa | 14 | 0.2% |
| Western Asia | 19 | 0.3% |
| Western Europe | 27 | 0.4% | View All 47 Rows |
Sex and Age in Lutherville
Sex and Age in Lutherville
The most populous age groups in Lutherville are 45 to 49 Years (373 | 11.2%) for men and 10 to 14 Years (297 | 9.1%) for women.
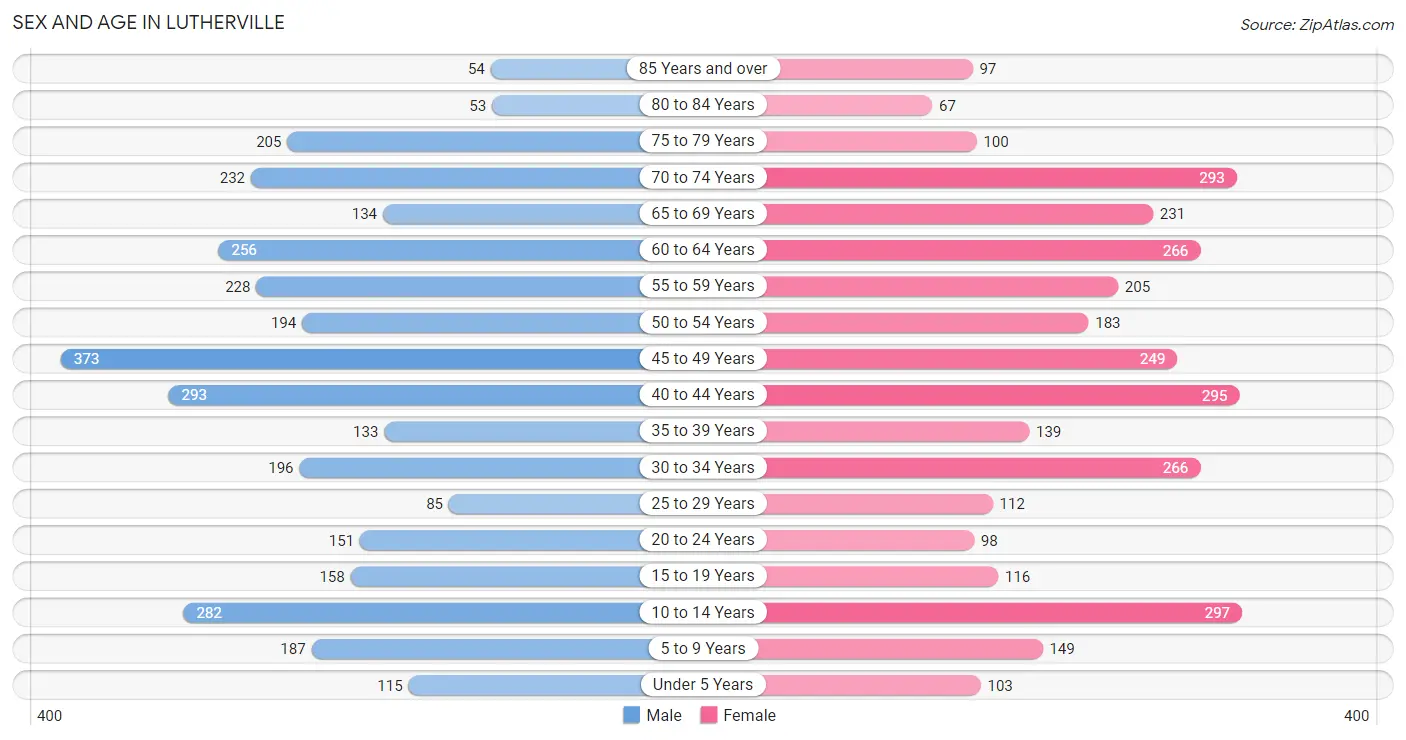
| Age Bracket | Male | Female |
| Under 5 Years | 115 (3.5%) | 103 (3.2%) |
| 5 to 9 Years | 187 (5.6%) | 149 (4.6%) |
| 10 to 14 Years | 282 (8.5%) | 297 (9.1%) |
| 15 to 19 Years | 158 (4.8%) | 116 (3.5%) |
| 20 to 24 Years | 151 (4.5%) | 98 (3.0%) |
| 25 to 29 Years | 85 (2.5%) | 112 (3.4%) |
| 30 to 34 Years | 196 (5.9%) | 266 (8.1%) |
| 35 to 39 Years | 133 (4.0%) | 139 (4.3%) |
| 40 to 44 Years | 293 (8.8%) | 295 (9.0%) |
| 45 to 49 Years | 373 (11.2%) | 249 (7.6%) |
| 50 to 54 Years | 194 (5.8%) | 183 (5.6%) |
| 55 to 59 Years | 228 (6.9%) | 205 (6.3%) |
| 60 to 64 Years | 256 (7.7%) | 266 (8.1%) |
| 65 to 69 Years | 134 (4.0%) | 231 (7.1%) |
| 70 to 74 Years | 232 (7.0%) | 293 (9.0%) |
| 75 to 79 Years | 205 (6.2%) | 100 (3.1%) |
| 80 to 84 Years | 53 (1.6%) | 67 (2.1%) |
| 85 Years and over | 54 (1.6%) | 97 (3.0%) |
| Total | 3,329 (100.0%) | 3,266 (100.0%) |
Families and Households in Lutherville
Median Family Size in Lutherville
The median family size in Lutherville is 3.05 persons per family, with married-couple families (1,536 | 84.3%) accounting for the largest median family size of 3.13 persons per family. On the other hand, single female/mother families (143 | 7.8%) represent the smallest median family size with 2.53 persons per family.
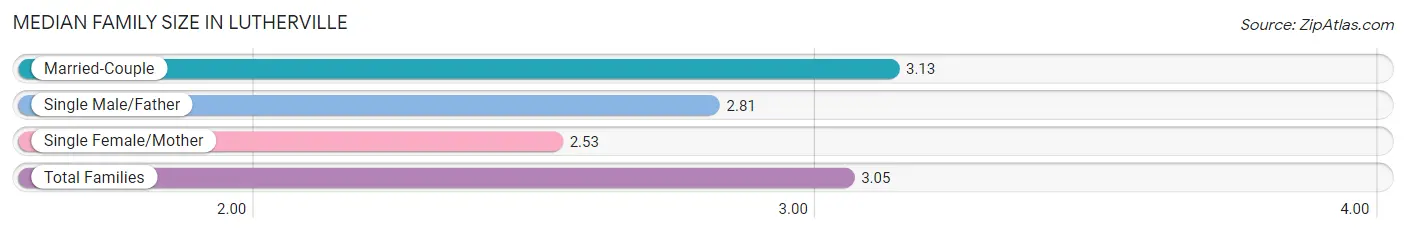
| Family Type | # Families | Family Size |
| Married-Couple | 1,536 (84.3%) | 3.13 |
| Single Male/Father | 144 (7.9%) | 2.81 |
| Single Female/Mother | 143 (7.8%) | 2.53 |
| Total Families | 1,823 (100.0%) | 3.05 |
Median Household Size in Lutherville
The median household size in Lutherville is 2.66 persons per household, with married-couple households (1,536 | 62.1%) accounting for the largest median household size of 3.26 persons per household. non-family households (650 | 26.3%) represent the smallest median household size with 1.14 persons per household.
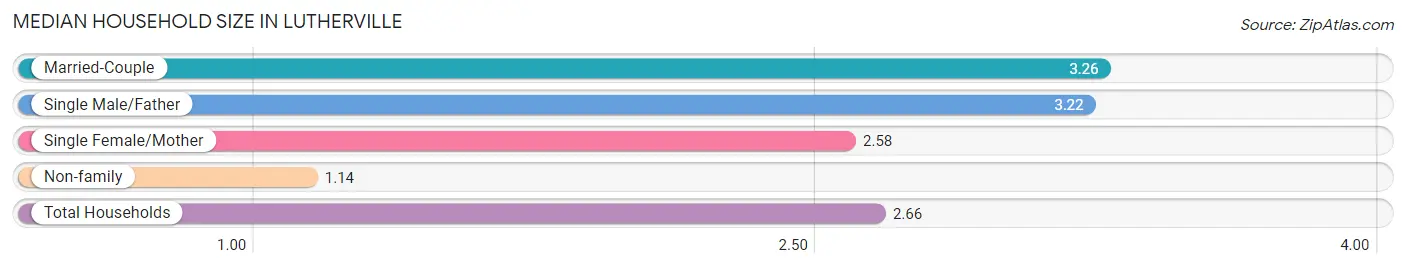
| Household Type | # Households | Household Size |
| Married-Couple | 1,536 (62.1%) | 3.26 |
| Single Male/Father | 144 (5.8%) | 3.22 |
| Single Female/Mother | 143 (5.8%) | 2.58 |
| Non-family | 650 (26.3%) | 1.14 |
| Total Households | 2,473 (100.0%) | 2.66 |
Household Size by Marriage Status in Lutherville
Out of a total of 2,473 households in Lutherville, 1,823 (73.7%) are family households, while 650 (26.3%) are nonfamily households. The most numerous type of family households are 2-person households, comprising 786, and the most common type of nonfamily households are 1-person households, comprising 564.
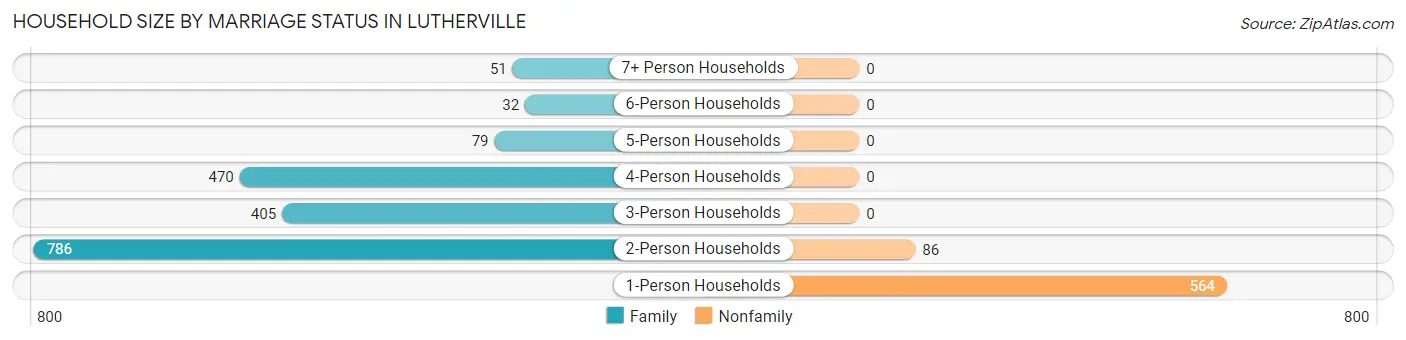
| Household Size | Family Households | Nonfamily Households |
| 1-Person Households | - | 564 (22.8%) |
| 2-Person Households | 786 (31.8%) | 86 (3.5%) |
| 3-Person Households | 405 (16.4%) | 0 (0.0%) |
| 4-Person Households | 470 (19.0%) | 0 (0.0%) |
| 5-Person Households | 79 (3.2%) | 0 (0.0%) |
| 6-Person Households | 32 (1.3%) | 0 (0.0%) |
| 7+ Person Households | 51 (2.1%) | 0 (0.0%) |
| Total | 1,823 (73.7%) | 650 (26.3%) |
Female Fertility in Lutherville
Fertility by Age in Lutherville
Average fertility rate in Lutherville is 58.0 births per 1,000 women. Women in the age bracket of 35 to 50 years have the highest fertility rate with 65.0 births per 1,000 women. Women in the age bracket of 35 to 50 years acount for 61.3% of all women with births.
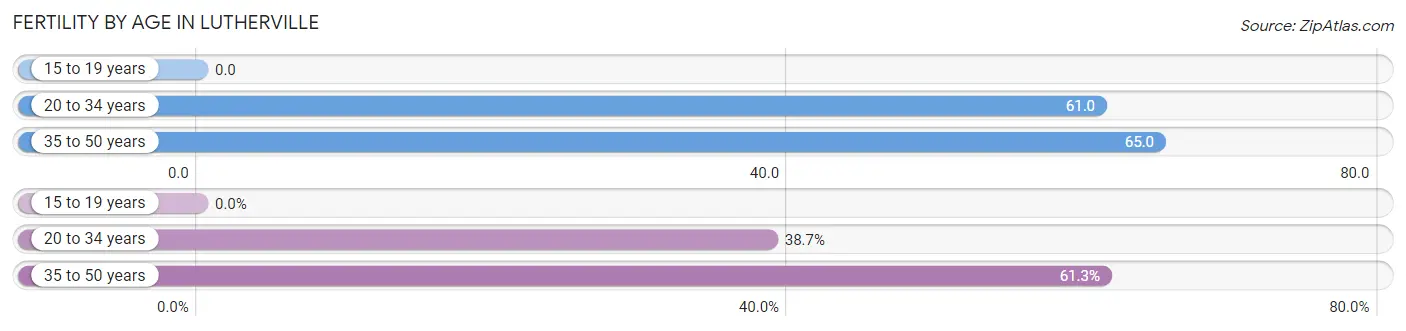
| Age Bracket | Women with Births | Births / 1,000 Women |
| 15 to 19 years | 0 (0.0%) | 0.0 |
| 20 to 34 years | 29 (38.7%) | 61.0 |
| 35 to 50 years | 46 (61.3%) | 65.0 |
| Total | 75 (100.0%) | 58.0 |
Fertility by Age by Marriage Status in Lutherville
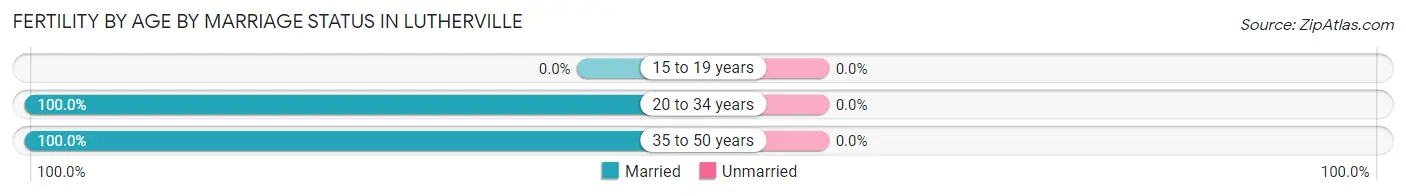
| Age Bracket | Married | Unmarried |
| 15 to 19 years | 0 (0.0%) | 0 (0.0%) |
| 20 to 34 years | 29 (100.0%) | 0 (0.0%) |
| 35 to 50 years | 46 (100.0%) | 0 (0.0%) |
| Total | 75 (100.0%) | 0 (0.0%) |
Fertility by Education in Lutherville
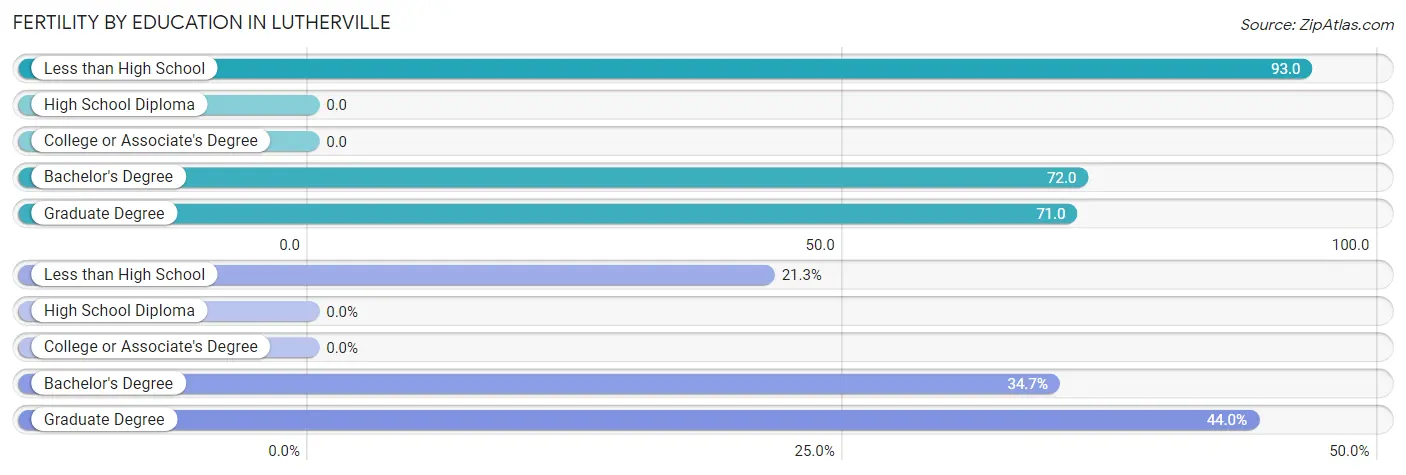
| Educational Attainment | Women with Births | Births / 1,000 Women |
| Less than High School | 16 (21.3%) | 93.0 |
| High School Diploma | 0 (0.0%) | 0.0 |
| College or Associate's Degree | 0 (0.0%) | 0.0 |
| Bachelor's Degree | 26 (34.7%) | 72.0 |
| Graduate Degree | 33 (44.0%) | 71.0 |
| Total | 75 (100.0%) | 58.0 |
Fertility by Education by Marriage Status in Lutherville
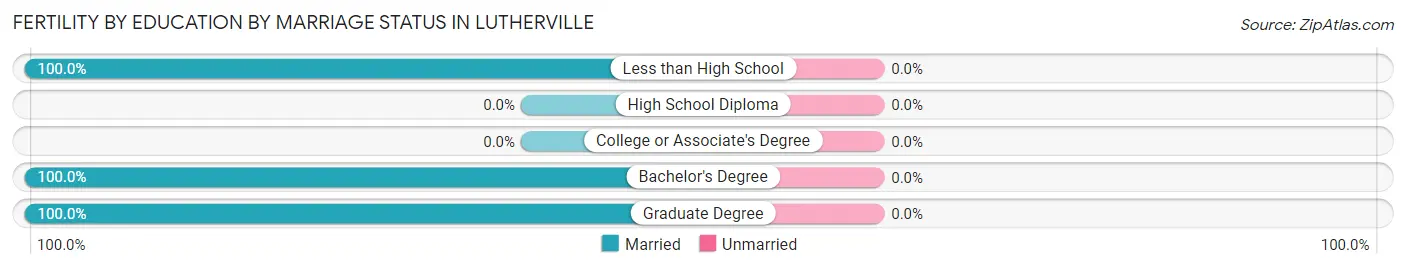
| Educational Attainment | Married | Unmarried |
| Less than High School | 16 (100.0%) | 0 (0.0%) |
| High School Diploma | 0 (0.0%) | 0 (0.0%) |
| College or Associate's Degree | 0 (0.0%) | 0 (0.0%) |
| Bachelor's Degree | 26 (100.0%) | 0 (0.0%) |
| Graduate Degree | 33 (100.0%) | 0 (0.0%) |
| Total | 75 (100.0%) | 0 (0.0%) |
Employment Characteristics in Lutherville
Employment by Class of Employer in Lutherville
Among the 3,484 employed individuals in Lutherville, private company employees (2,066 | 59.3%), not-for-profit organizations (383 | 11.0%), and local government employees (310 | 8.9%) make up the most common classes of employment.
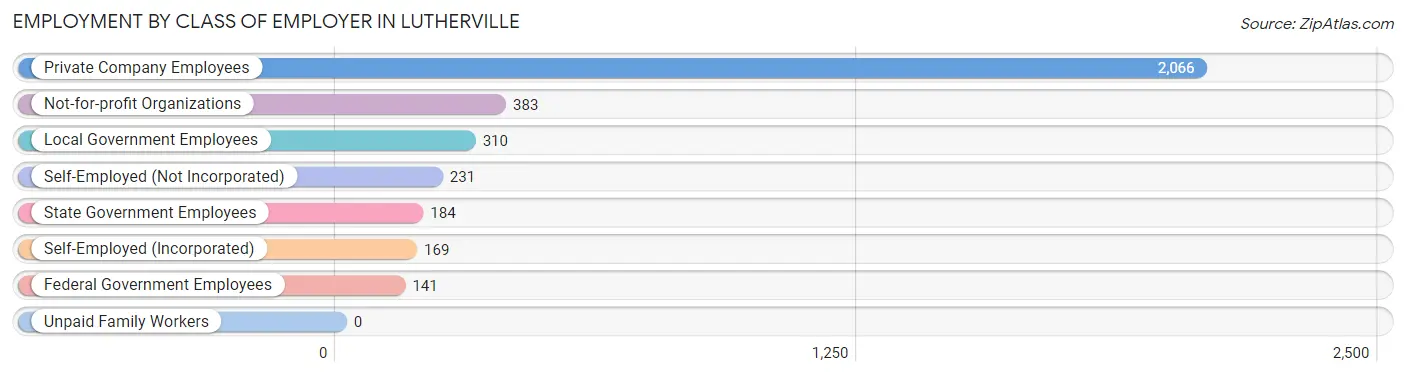
| Employer Class | # Employees | % Employees |
| Private Company Employees | 2,066 | 59.3% |
| Self-Employed (Incorporated) | 169 | 4.9% |
| Self-Employed (Not Incorporated) | 231 | 6.6% |
| Not-for-profit Organizations | 383 | 11.0% |
| Local Government Employees | 310 | 8.9% |
| State Government Employees | 184 | 5.3% |
| Federal Government Employees | 141 | 4.1% |
| Unpaid Family Workers | 0 | 0.0% |
| Total | 3,484 | 100.0% |
Employment Status by Age in Lutherville
According to the labor force statistics for Lutherville, out of the total population over 16 years of age (5,410), 69.0% or 3,733 individuals are in the labor force, with 5.5% or 205 of them unemployed. The age group with the highest labor force participation rate is 20 to 24 years, with 93.6% or 233 individuals in the labor force. Within the labor force, the 16 to 19 years age range has the highest percentage of unemployed individuals, with 46.4% or 58 of them being unemployed.
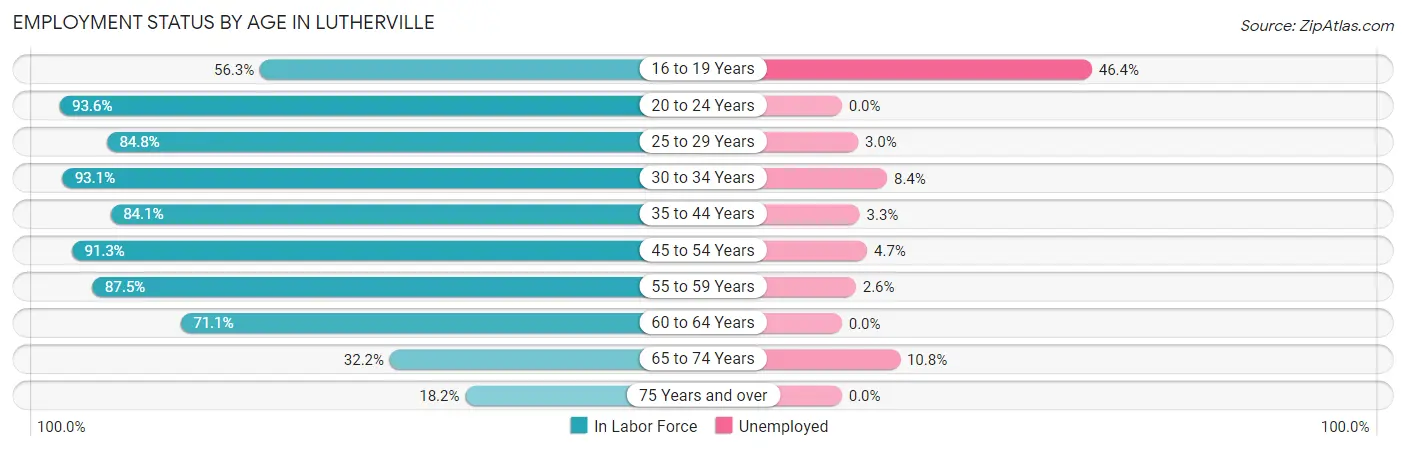
| Age Bracket | In Labor Force | Unemployed |
| 16 to 19 Years | 125 (56.3%) | 58 (46.4%) |
| 20 to 24 Years | 233 (93.6%) | 0 (0.0%) |
| 25 to 29 Years | 167 (84.8%) | 5 (3.0%) |
| 30 to 34 Years | 430 (93.1%) | 36 (8.4%) |
| 35 to 44 Years | 723 (84.1%) | 24 (3.3%) |
| 45 to 54 Years | 912 (91.3%) | 43 (4.7%) |
| 55 to 59 Years | 379 (87.5%) | 10 (2.6%) |
| 60 to 64 Years | 371 (71.1%) | 0 (0.0%) |
| 65 to 74 Years | 287 (32.2%) | 31 (10.8%) |
| 75 Years and over | 105 (18.2%) | 0 (0.0%) |
| Total | 3,733 (69.0%) | 205 (5.5%) |
Employment Status by Educational Attainment in Lutherville
According to labor force statistics for Lutherville, 85.9% of individuals (2,983) out of the total population between 25 and 64 years of age (3,473) are in the labor force, with 4.0% or 119 of them being unemployed. The group with the highest labor force participation rate are those with the educational attainment of high school diploma, with 91.2% or 218 individuals in the labor force. Within the labor force, individuals with college / associate degree education have the highest percentage of unemployment, with 9.8% or 53 of them being unemployed.
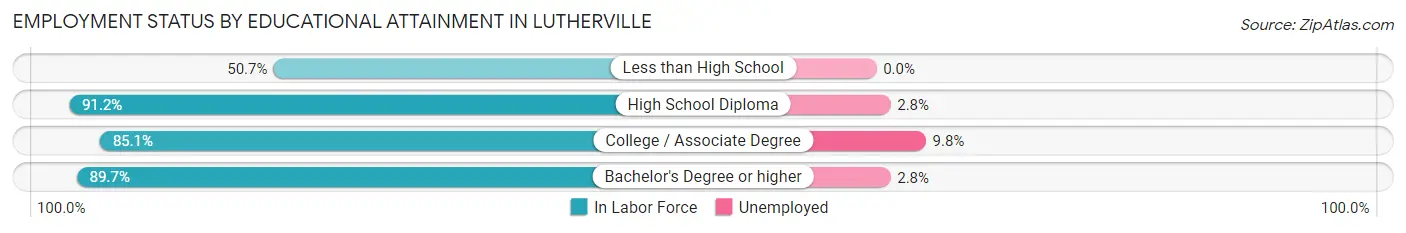
| Educational Attainment | In Labor Force | Unemployed |
| Less than High School | 139 (50.7%) | 0 (0.0%) |
| High School Diploma | 218 (91.2%) | 7 (2.8%) |
| College / Associate Degree | 542 (85.1%) | 62 (9.8%) |
| Bachelor's Degree or higher | 2,084 (89.7%) | 65 (2.8%) |
| Total | 2,983 (85.9%) | 139 (4.0%) |
Employment Occupations by Sex in Lutherville
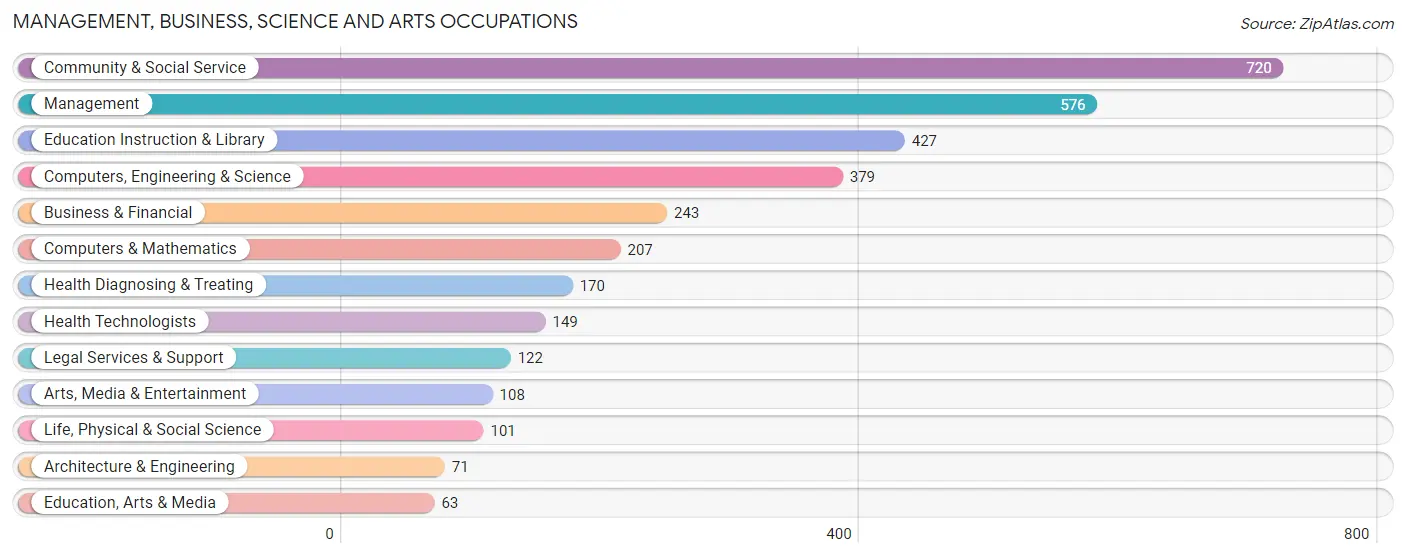
Management, Business, Science and Arts Occupations
The most common Management, Business, Science and Arts occupations in Lutherville are Community & Social Service (720 | 20.4%), Management (576 | 16.4%), Education Instruction & Library (427 | 12.1%), Computers, Engineering & Science (379 | 10.7%), and Business & Financial (243 | 6.9%).
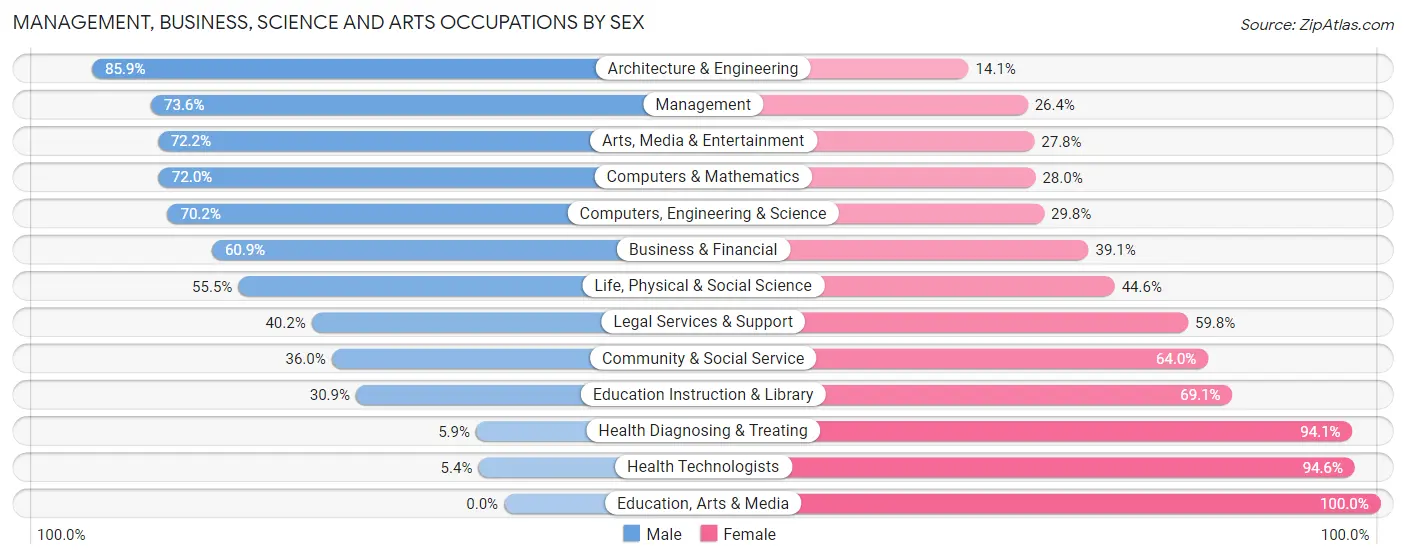
Management, Business, Science and Arts Occupations by Sex
Within the Management, Business, Science and Arts occupations in Lutherville, the most male-oriented occupations are Architecture & Engineering (85.9%), Management (73.6%), and Arts, Media & Entertainment (72.2%), while the most female-oriented occupations are Education, Arts & Media (100.0%), Health Technologists (94.6%), and Health Diagnosing & Treating (94.1%).
| Occupation | Male | Female |
| Management | 424 (73.6%) | 152 (26.4%) |
| Business & Financial | 148 (60.9%) | 95 (39.1%) |
| Computers, Engineering & Science | 266 (70.2%) | 113 (29.8%) |
| Computers & Mathematics | 149 (72.0%) | 58 (28.0%) |
| Architecture & Engineering | 61 (85.9%) | 10 (14.1%) |
| Life, Physical & Social Science | 56 (55.4%) | 45 (44.6%) |
| Community & Social Service | 259 (36.0%) | 461 (64.0%) |
| Education, Arts & Media | 0 (0.0%) | 63 (100.0%) |
| Legal Services & Support | 49 (40.2%) | 73 (59.8%) |
| Education Instruction & Library | 132 (30.9%) | 295 (69.1%) |
| Arts, Media & Entertainment | 78 (72.2%) | 30 (27.8%) |
| Health Diagnosing & Treating | 10 (5.9%) | 160 (94.1%) |
| Health Technologists | 8 (5.4%) | 141 (94.6%) |
| Total (Category) | 1,107 (53.0%) | 981 (47.0%) |
| Total (Overall) | 1,850 (52.5%) | 1,674 (47.5%) |
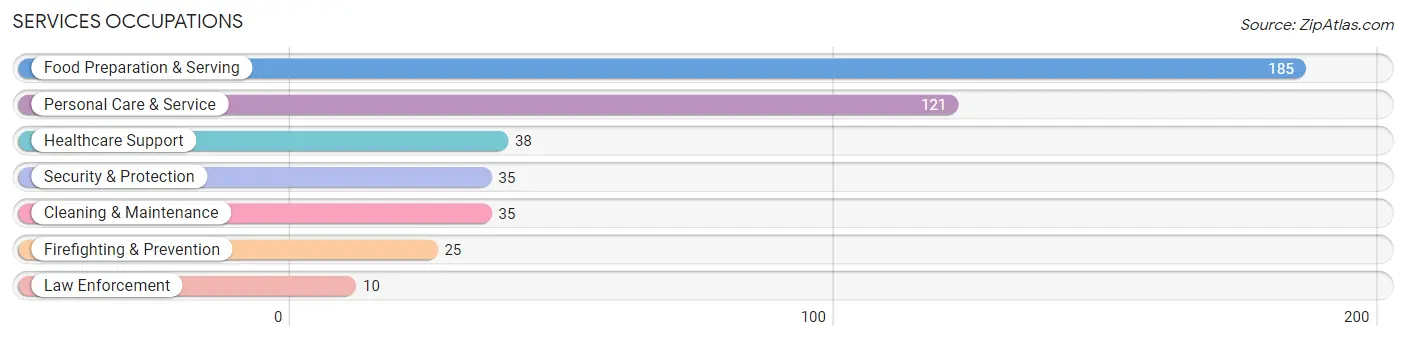
Services Occupations
The most common Services occupations in Lutherville are Food Preparation & Serving (185 | 5.2%), Personal Care & Service (121 | 3.4%), Healthcare Support (38 | 1.1%), Security & Protection (35 | 1.0%), and Cleaning & Maintenance (35 | 1.0%).
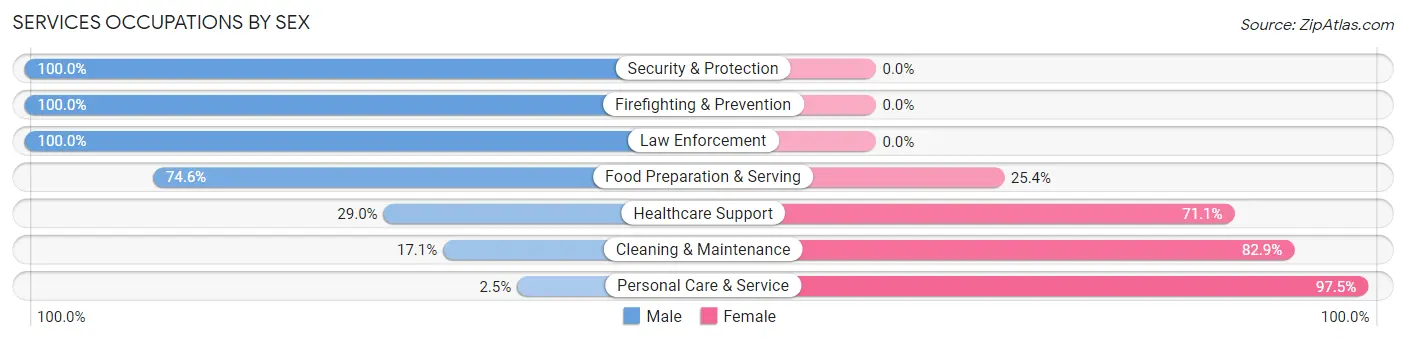
Services Occupations by Sex
Within the Services occupations in Lutherville, the most male-oriented occupations are Security & Protection (100.0%), Firefighting & Prevention (100.0%), and Law Enforcement (100.0%), while the most female-oriented occupations are Personal Care & Service (97.5%), Cleaning & Maintenance (82.9%), and Healthcare Support (71.1%).
| Occupation | Male | Female |
| Healthcare Support | 11 (28.9%) | 27 (71.1%) |
| Security & Protection | 35 (100.0%) | 0 (0.0%) |
| Firefighting & Prevention | 25 (100.0%) | 0 (0.0%) |
| Law Enforcement | 10 (100.0%) | 0 (0.0%) |
| Food Preparation & Serving | 138 (74.6%) | 47 (25.4%) |
| Cleaning & Maintenance | 6 (17.1%) | 29 (82.9%) |
| Personal Care & Service | 3 (2.5%) | 118 (97.5%) |
| Total (Category) | 193 (46.6%) | 221 (53.4%) |
| Total (Overall) | 1,850 (52.5%) | 1,674 (47.5%) |
Sales and Office Occupations
The most common Sales and Office occupations in Lutherville are Sales & Related (408 | 11.6%), and Office & Administration (258 | 7.3%).

Sales and Office Occupations by Sex

| Occupation | Male | Female |
| Sales & Related | 287 (70.3%) | 121 (29.7%) |
| Office & Administration | 51 (19.8%) | 207 (80.2%) |
| Total (Category) | 338 (50.7%) | 328 (49.2%) |
| Total (Overall) | 1,850 (52.5%) | 1,674 (47.5%) |
Natural Resources, Construction and Maintenance Occupations
The most common Natural Resources, Construction and Maintenance occupations in Lutherville are Construction & Extraction (69 | 2.0%), and Installation, Maintenance & Repair (66 | 1.9%).

Natural Resources, Construction and Maintenance Occupations by Sex

| Occupation | Male | Female |
| Farming, Fishing & Forestry | 0 (0.0%) | 0 (0.0%) |
| Construction & Extraction | 69 (100.0%) | 0 (0.0%) |
| Installation, Maintenance & Repair | 60 (90.9%) | 6 (9.1%) |
| Total (Category) | 129 (95.6%) | 6 (4.4%) |
| Total (Overall) | 1,850 (52.5%) | 1,674 (47.5%) |
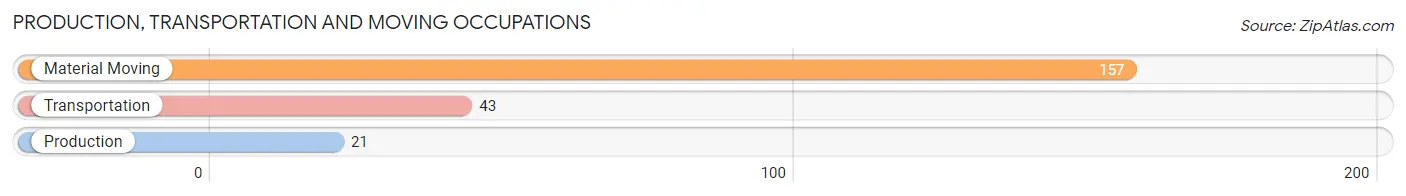
Production, Transportation and Moving Occupations
The most common Production, Transportation and Moving occupations in Lutherville are Material Moving (157 | 4.5%), Transportation (43 | 1.2%), and Production (21 | 0.6%).
Production, Transportation and Moving Occupations by Sex

| Occupation | Male | Female |
| Production | 21 (100.0%) | 0 (0.0%) |
| Transportation | 22 (51.2%) | 21 (48.8%) |
| Material Moving | 40 (25.5%) | 117 (74.5%) |
| Total (Category) | 83 (37.6%) | 138 (62.4%) |
| Total (Overall) | 1,850 (52.5%) | 1,674 (47.5%) |
Employment Industries by Sex in Lutherville
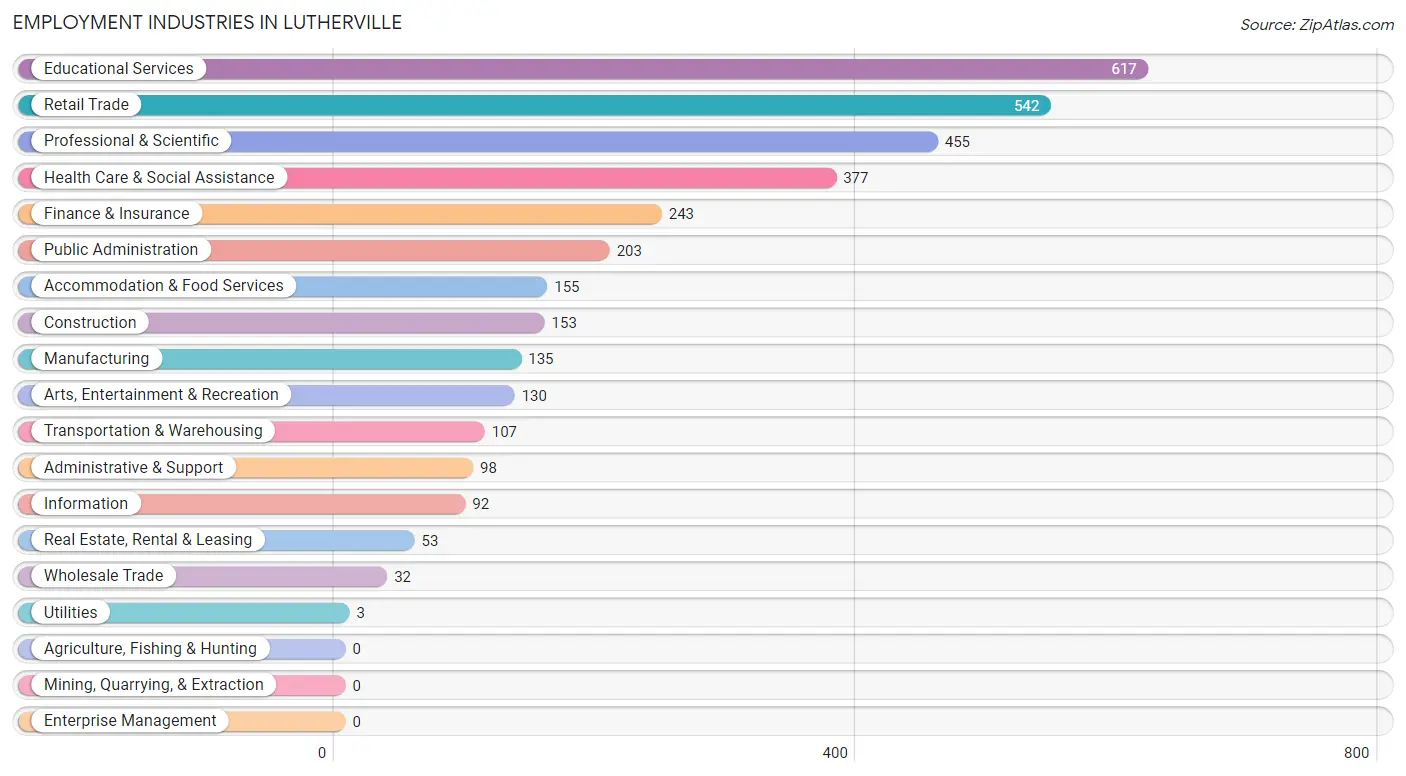
Employment Industries in Lutherville
The major employment industries in Lutherville include Educational Services (617 | 17.5%), Retail Trade (542 | 15.4%), Professional & Scientific (455 | 12.9%), Health Care & Social Assistance (377 | 10.7%), and Finance & Insurance (243 | 6.9%).
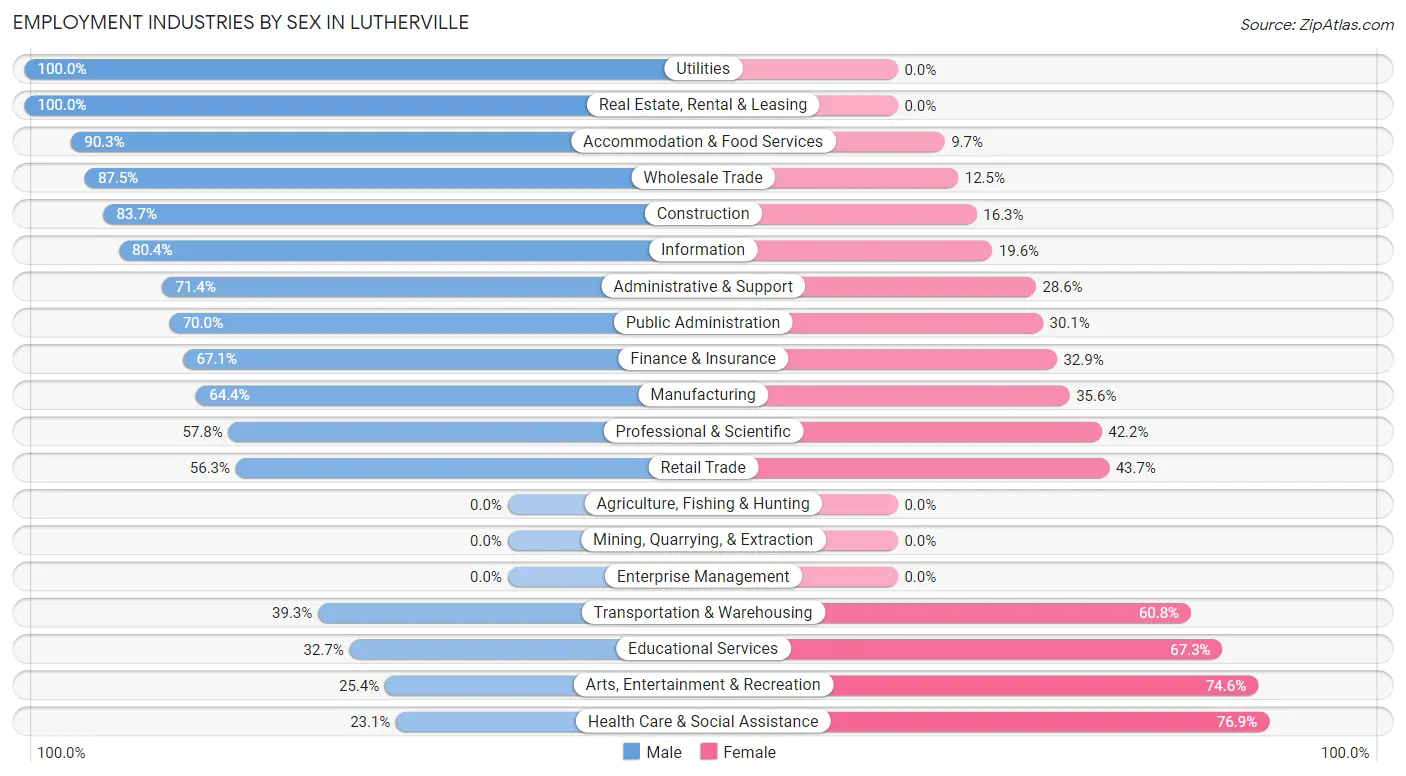
Employment Industries by Sex in Lutherville
The Lutherville industries that see more men than women are Utilities (100.0%), Real Estate, Rental & Leasing (100.0%), and Accommodation & Food Services (90.3%), whereas the industries that tend to have a higher number of women are Health Care & Social Assistance (76.9%), Arts, Entertainment & Recreation (74.6%), and Educational Services (67.3%).
| Industry | Male | Female |
| Agriculture, Fishing & Hunting | 0 (0.0%) | 0 (0.0%) |
| Mining, Quarrying, & Extraction | 0 (0.0%) | 0 (0.0%) |
| Construction | 128 (83.7%) | 25 (16.3%) |
| Manufacturing | 87 (64.4%) | 48 (35.6%) |
| Wholesale Trade | 28 (87.5%) | 4 (12.5%) |
| Retail Trade | 305 (56.3%) | 237 (43.7%) |
| Transportation & Warehousing | 42 (39.3%) | 65 (60.8%) |
| Utilities | 3 (100.0%) | 0 (0.0%) |
| Information | 74 (80.4%) | 18 (19.6%) |
| Finance & Insurance | 163 (67.1%) | 80 (32.9%) |
| Real Estate, Rental & Leasing | 53 (100.0%) | 0 (0.0%) |
| Professional & Scientific | 263 (57.8%) | 192 (42.2%) |
| Enterprise Management | 0 (0.0%) | 0 (0.0%) |
| Administrative & Support | 70 (71.4%) | 28 (28.6%) |
| Educational Services | 202 (32.7%) | 415 (67.3%) |
| Health Care & Social Assistance | 87 (23.1%) | 290 (76.9%) |
| Arts, Entertainment & Recreation | 33 (25.4%) | 97 (74.6%) |
| Accommodation & Food Services | 140 (90.3%) | 15 (9.7%) |
| Public Administration | 142 (70.0%) | 61 (30.0%) |
| Total | 1,850 (52.5%) | 1,674 (47.5%) |
Education in Lutherville
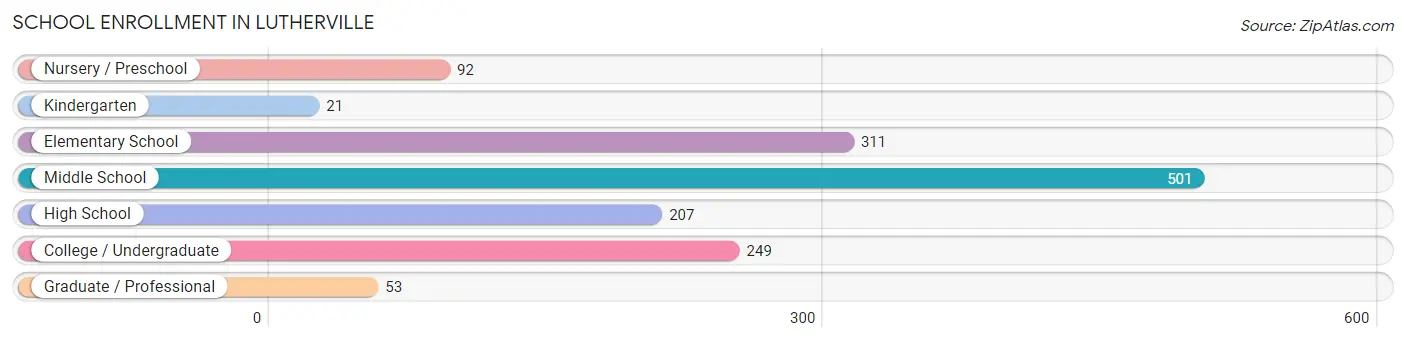
School Enrollment in Lutherville
The most common levels of schooling among the 1,434 students in Lutherville are middle school (501 | 34.9%), elementary school (311 | 21.7%), and college / undergraduate (249 | 17.4%).
| School Level | # Students | % Students |
| Nursery / Preschool | 92 | 6.4% |
| Kindergarten | 21 | 1.5% |
| Elementary School | 311 | 21.7% |
| Middle School | 501 | 34.9% |
| High School | 207 | 14.4% |
| College / Undergraduate | 249 | 17.4% |
| Graduate / Professional | 53 | 3.7% |
| Total | 1,434 | 100.0% |
School Enrollment by Age by Funding Source in Lutherville
Out of a total of 1,434 students who are enrolled in schools in Lutherville, 295 (20.6%) attend a private institution, while the remaining 1,139 (79.4%) are enrolled in public schools. The age group of 3 to 4 year olds has the highest likelihood of being enrolled in private schools, with 72 (93.5% in the age bracket) enrolled. Conversely, the age group of 25 to 34 year olds has the lowest likelihood of being enrolled in a private school, with 49 (96.1% in the age bracket) attending a public institution.
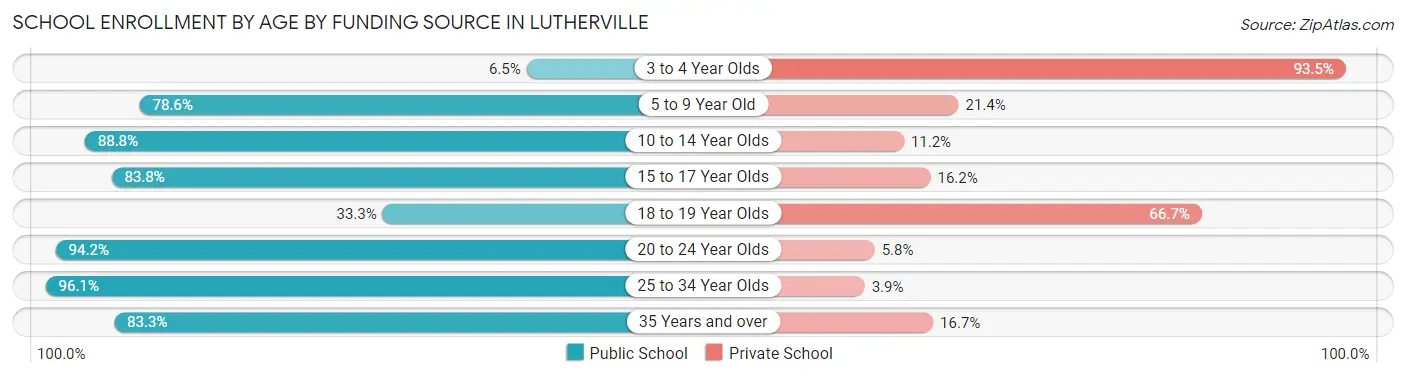
| Age Bracket | Public School | Private School |
| 3 to 4 Year Olds | 5 (6.5%) | 72 (93.5%) |
| 5 to 9 Year Old | 246 (78.6%) | 67 (21.4%) |
| 10 to 14 Year Olds | 514 (88.8%) | 65 (11.2%) |
| 15 to 17 Year Olds | 114 (83.8%) | 22 (16.2%) |
| 18 to 19 Year Olds | 27 (33.3%) | 54 (66.7%) |
| 20 to 24 Year Olds | 163 (94.2%) | 10 (5.8%) |
| 25 to 34 Year Olds | 49 (96.1%) | 2 (3.9%) |
| 35 Years and over | 20 (83.3%) | 4 (16.7%) |
| Total | 1,139 (79.4%) | 295 (20.6%) |
Educational Attainment by Field of Study in Lutherville
Business (519 | 15.2%), education (391 | 11.4%), visual & performing arts (322 | 9.4%), social sciences (313 | 9.1%), and liberal arts & history (293 | 8.6%) are the most common fields of study among 3,420 individuals in Lutherville who have obtained a bachelor's degree or higher.
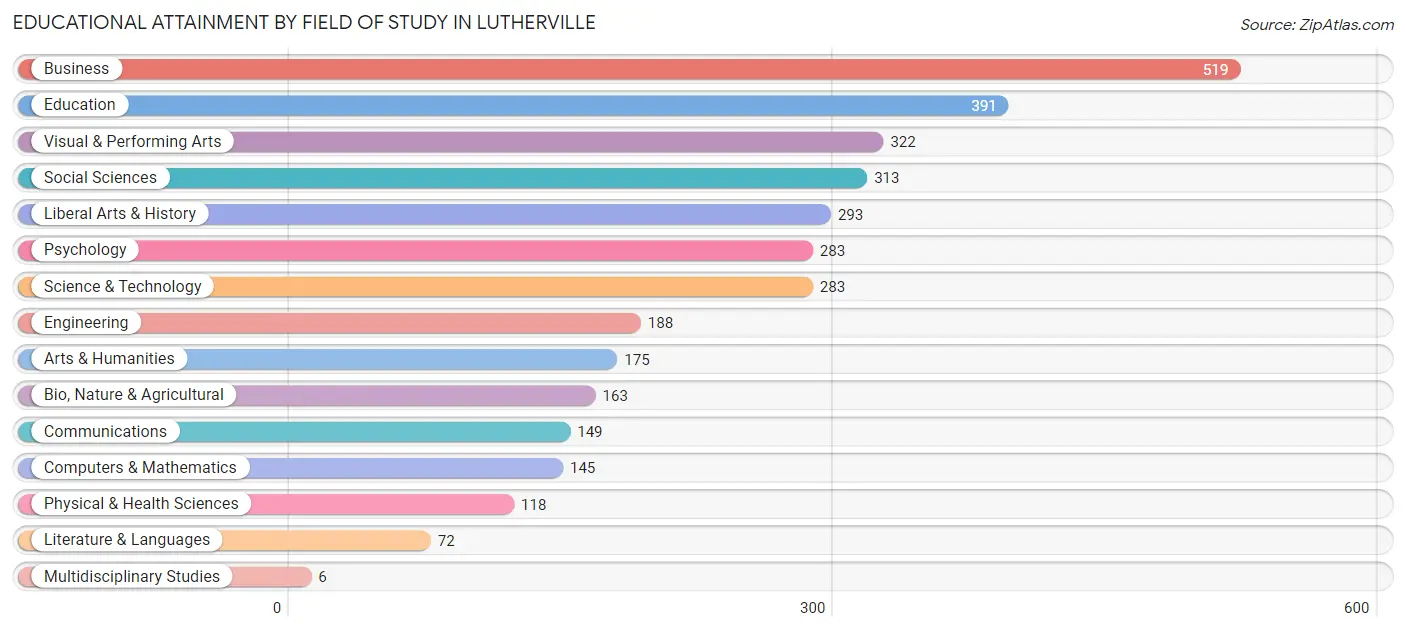
| Field of Study | # Graduates | % Graduates |
| Computers & Mathematics | 145 | 4.2% |
| Bio, Nature & Agricultural | 163 | 4.8% |
| Physical & Health Sciences | 118 | 3.5% |
| Psychology | 283 | 8.3% |
| Social Sciences | 313 | 9.1% |
| Engineering | 188 | 5.5% |
| Multidisciplinary Studies | 6 | 0.2% |
| Science & Technology | 283 | 8.3% |
| Business | 519 | 15.2% |
| Education | 391 | 11.4% |
| Literature & Languages | 72 | 2.1% |
| Liberal Arts & History | 293 | 8.6% |
| Visual & Performing Arts | 322 | 9.4% |
| Communications | 149 | 4.4% |
| Arts & Humanities | 175 | 5.1% |
| Total | 3,420 | 100.0% |
Transportation & Commute in Lutherville
Vehicle Availability by Sex in Lutherville
The most prevalent vehicle ownership categories in Lutherville are males with 2 vehicles (906, accounting for 49.3%) and females with 2 vehicles (705, making up 55.1%).
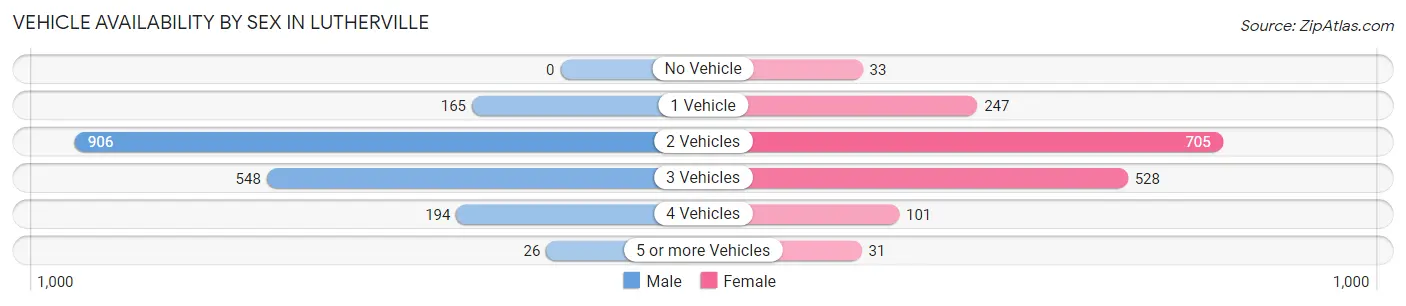
| Vehicles Available | Male | Female |
| No Vehicle | 0 (0.0%) | 33 (2.0%) |
| 1 Vehicle | 165 (9.0%) | 247 (15.0%) |
| 2 Vehicles | 906 (49.3%) | 705 (42.9%) |
| 3 Vehicles | 548 (29.8%) | 528 (32.1%) |
| 4 Vehicles | 194 (10.5%) | 101 (6.1%) |
| 5 or more Vehicles | 26 (1.4%) | 31 (1.9%) |
| Total | 1,839 (100.0%) | 1,645 (100.0%) |
Commute Time in Lutherville
The most frequently occuring commute durations in Lutherville are 15 to 19 minutes (647 commuters, 22.5%), 10 to 14 minutes (450 commuters, 15.7%), and 30 to 34 minutes (336 commuters, 11.7%).
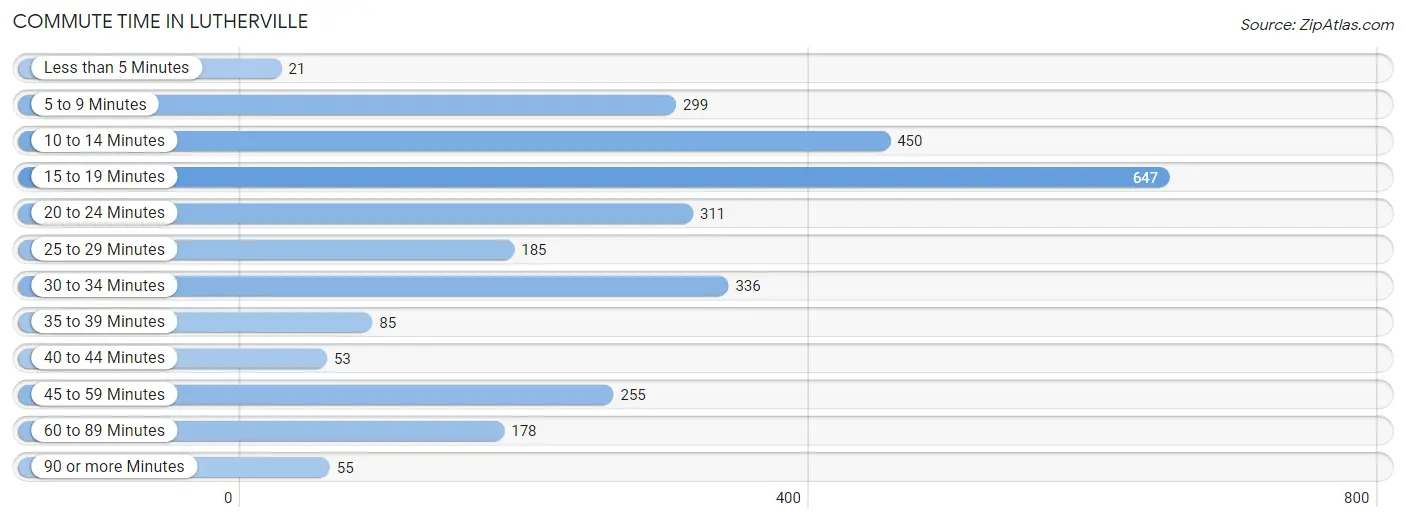
| Commute Time | # Commuters | % Commuters |
| Less than 5 Minutes | 21 | 0.7% |
| 5 to 9 Minutes | 299 | 10.4% |
| 10 to 14 Minutes | 450 | 15.7% |
| 15 to 19 Minutes | 647 | 22.5% |
| 20 to 24 Minutes | 311 | 10.8% |
| 25 to 29 Minutes | 185 | 6.4% |
| 30 to 34 Minutes | 336 | 11.7% |
| 35 to 39 Minutes | 85 | 3.0% |
| 40 to 44 Minutes | 53 | 1.8% |
| 45 to 59 Minutes | 255 | 8.9% |
| 60 to 89 Minutes | 178 | 6.2% |
| 90 or more Minutes | 55 | 1.9% |
Commute Time by Sex in Lutherville
The most common commute times in Lutherville are 15 to 19 minutes (312 commuters, 20.5%) for males and 15 to 19 minutes (335 commuters, 24.8%) for females.
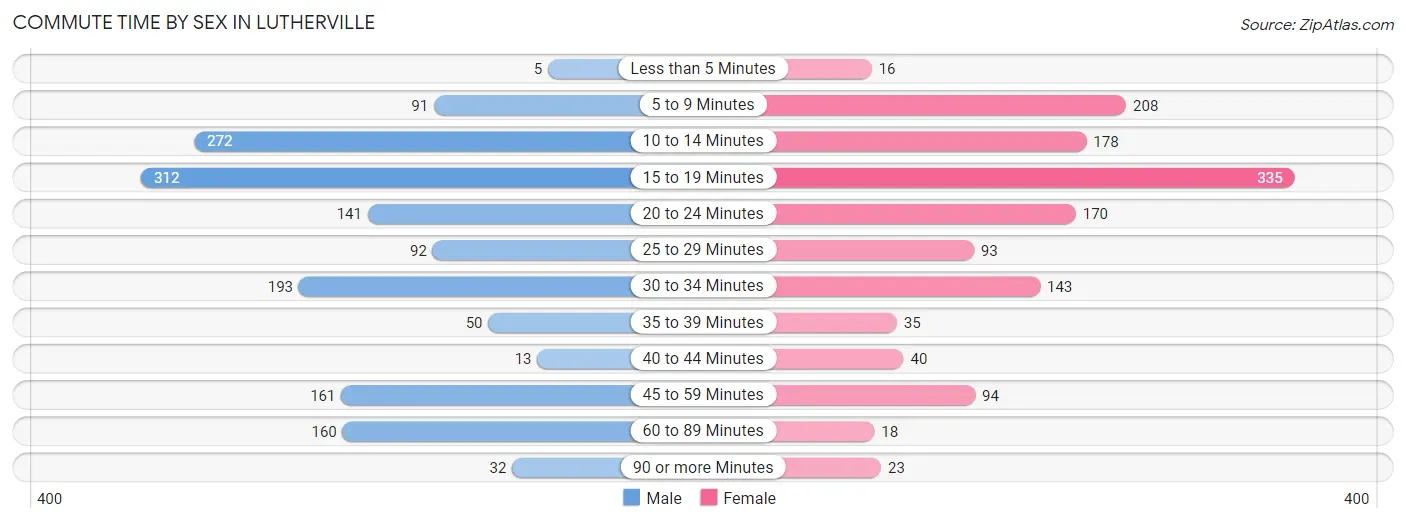
| Commute Time | Male | Female |
| Less than 5 Minutes | 5 (0.3%) | 16 (1.2%) |
| 5 to 9 Minutes | 91 (6.0%) | 208 (15.4%) |
| 10 to 14 Minutes | 272 (17.9%) | 178 (13.2%) |
| 15 to 19 Minutes | 312 (20.5%) | 335 (24.8%) |
| 20 to 24 Minutes | 141 (9.3%) | 170 (12.6%) |
| 25 to 29 Minutes | 92 (6.0%) | 93 (6.9%) |
| 30 to 34 Minutes | 193 (12.7%) | 143 (10.6%) |
| 35 to 39 Minutes | 50 (3.3%) | 35 (2.6%) |
| 40 to 44 Minutes | 13 (0.9%) | 40 (3.0%) |
| 45 to 59 Minutes | 161 (10.6%) | 94 (7.0%) |
| 60 to 89 Minutes | 160 (10.5%) | 18 (1.3%) |
| 90 or more Minutes | 32 (2.1%) | 23 (1.7%) |
Time of Departure to Work by Sex in Lutherville
The most frequent times of departure to work in Lutherville are 8:00 AM to 8:29 AM (277, 18.2%) for males and 8:00 AM to 8:29 AM (295, 21.8%) for females.
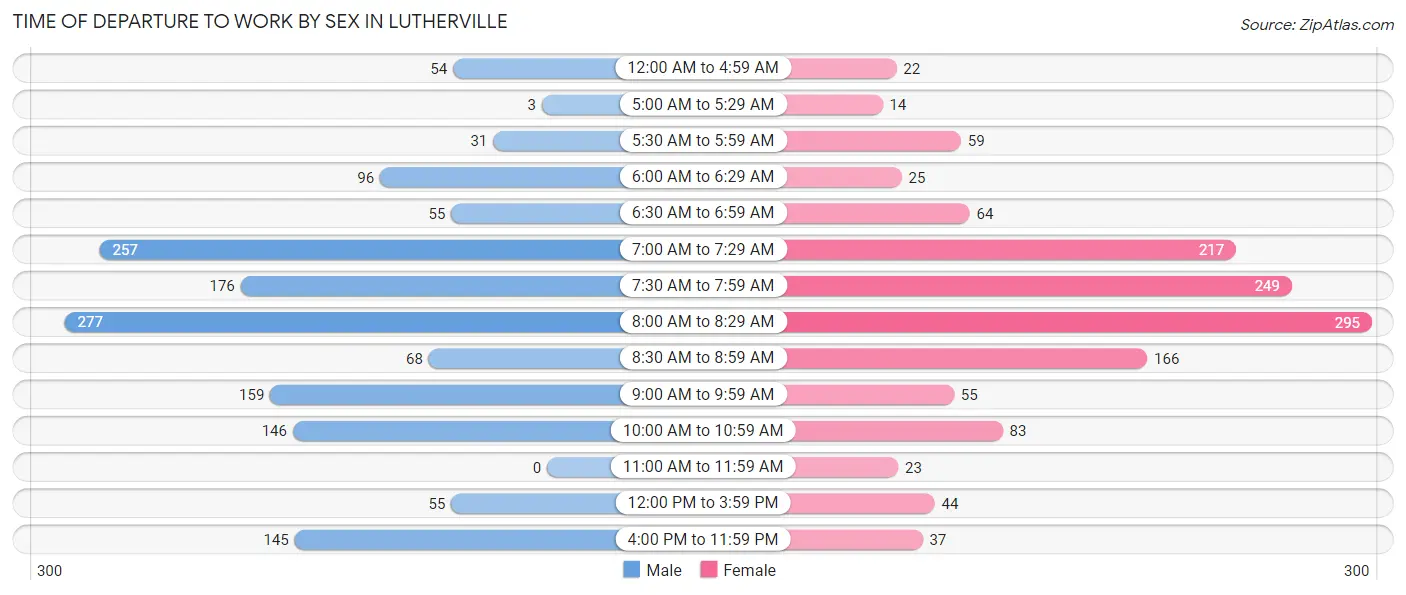
| Time of Departure | Male | Female |
| 12:00 AM to 4:59 AM | 54 (3.5%) | 22 (1.6%) |
| 5:00 AM to 5:29 AM | 3 (0.2%) | 14 (1.0%) |
| 5:30 AM to 5:59 AM | 31 (2.0%) | 59 (4.4%) |
| 6:00 AM to 6:29 AM | 96 (6.3%) | 25 (1.8%) |
| 6:30 AM to 6:59 AM | 55 (3.6%) | 64 (4.7%) |
| 7:00 AM to 7:29 AM | 257 (16.9%) | 217 (16.0%) |
| 7:30 AM to 7:59 AM | 176 (11.6%) | 249 (18.4%) |
| 8:00 AM to 8:29 AM | 277 (18.2%) | 295 (21.8%) |
| 8:30 AM to 8:59 AM | 68 (4.5%) | 166 (12.3%) |
| 9:00 AM to 9:59 AM | 159 (10.4%) | 55 (4.1%) |
| 10:00 AM to 10:59 AM | 146 (9.6%) | 83 (6.1%) |
| 11:00 AM to 11:59 AM | 0 (0.0%) | 23 (1.7%) |
| 12:00 PM to 3:59 PM | 55 (3.6%) | 44 (3.3%) |
| 4:00 PM to 11:59 PM | 145 (9.5%) | 37 (2.7%) |
| Total | 1,522 (100.0%) | 1,353 (100.0%) |
Housing Occupancy in Lutherville
Occupancy by Ownership in Lutherville
Of the total 2,473 dwellings in Lutherville, owner-occupied units account for 2,093 (84.6%), while renter-occupied units make up 380 (15.4%).
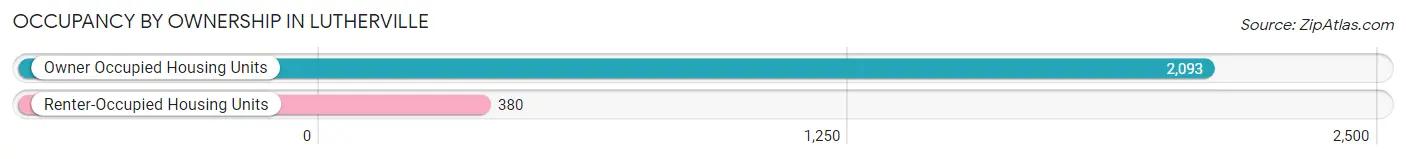
| Occupancy | # Housing Units | % Housing Units |
| Owner Occupied Housing Units | 2,093 | 84.6% |
| Renter-Occupied Housing Units | 380 | 15.4% |
| Total Occupied Housing Units | 2,473 | 100.0% |
Occupancy by Household Size in Lutherville
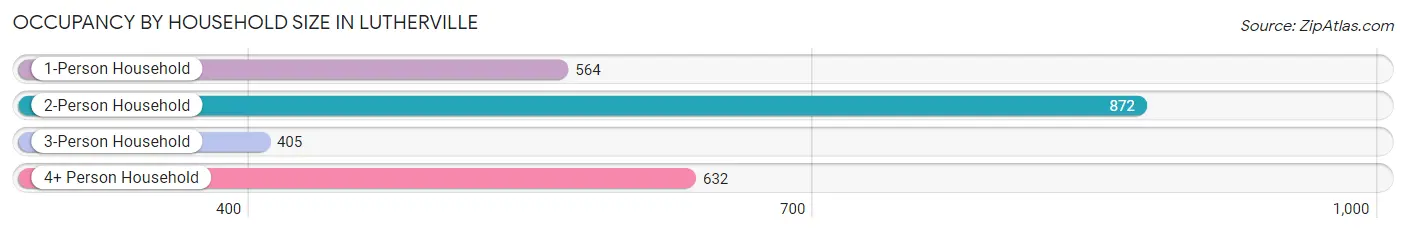
| Household Size | # Housing Units | % Housing Units |
| 1-Person Household | 564 | 22.8% |
| 2-Person Household | 872 | 35.3% |
| 3-Person Household | 405 | 16.4% |
| 4+ Person Household | 632 | 25.6% |
| Total Housing Units | 2,473 | 100.0% |
Occupancy by Ownership by Household Size in Lutherville
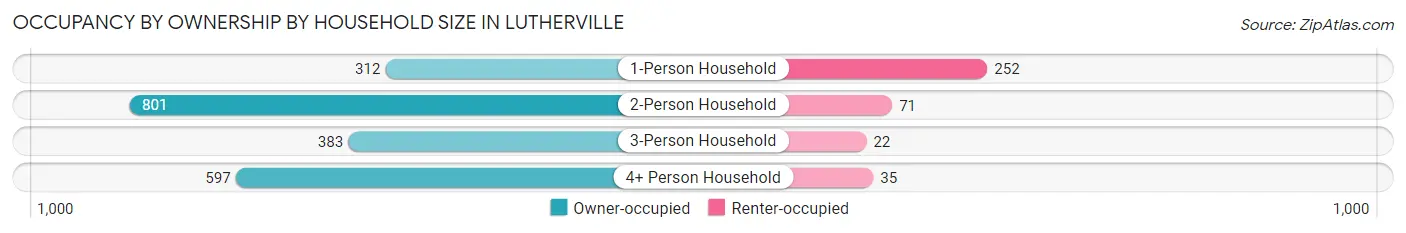
| Household Size | Owner-occupied | Renter-occupied |
| 1-Person Household | 312 (55.3%) | 252 (44.7%) |
| 2-Person Household | 801 (91.9%) | 71 (8.1%) |
| 3-Person Household | 383 (94.6%) | 22 (5.4%) |
| 4+ Person Household | 597 (94.5%) | 35 (5.5%) |
| Total Housing Units | 2,093 (84.6%) | 380 (15.4%) |
Occupancy by Educational Attainment in Lutherville
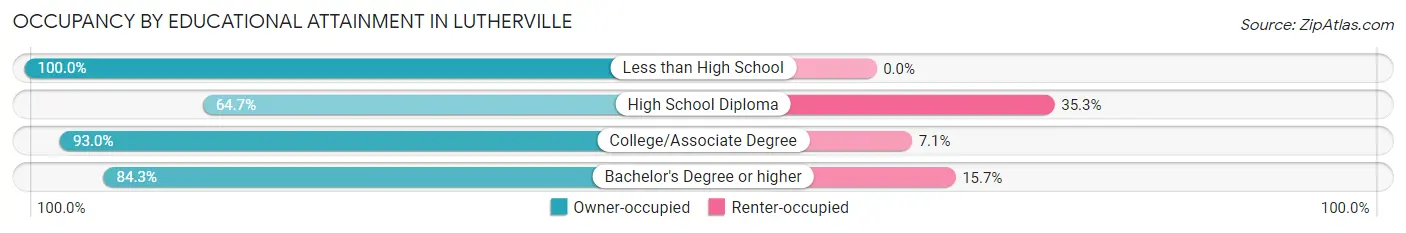
| Household Size | Owner-occupied | Renter-occupied |
| Less than High School | 143 (100.0%) | 0 (0.0%) |
| High School Diploma | 174 (64.7%) | 95 (35.3%) |
| College/Associate Degree | 409 (92.9%) | 31 (7.0%) |
| Bachelor's Degree or higher | 1,367 (84.3%) | 254 (15.7%) |
Occupancy by Age of Householder in Lutherville
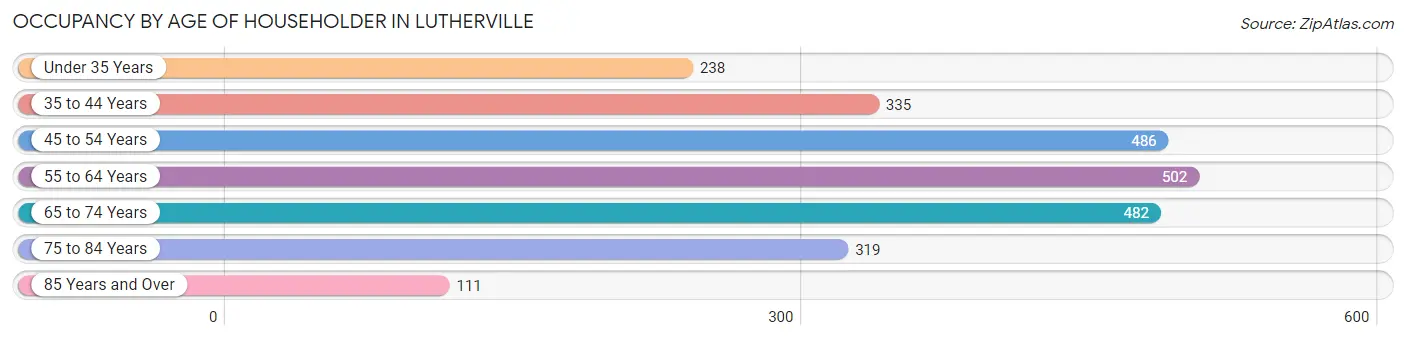
| Age Bracket | # Households | % Households |
| Under 35 Years | 238 | 9.6% |
| 35 to 44 Years | 335 | 13.6% |
| 45 to 54 Years | 486 | 19.7% |
| 55 to 64 Years | 502 | 20.3% |
| 65 to 74 Years | 482 | 19.5% |
| 75 to 84 Years | 319 | 12.9% |
| 85 Years and Over | 111 | 4.5% |
| Total | 2,473 | 100.0% |
Housing Finances in Lutherville
Median Income by Occupancy in Lutherville
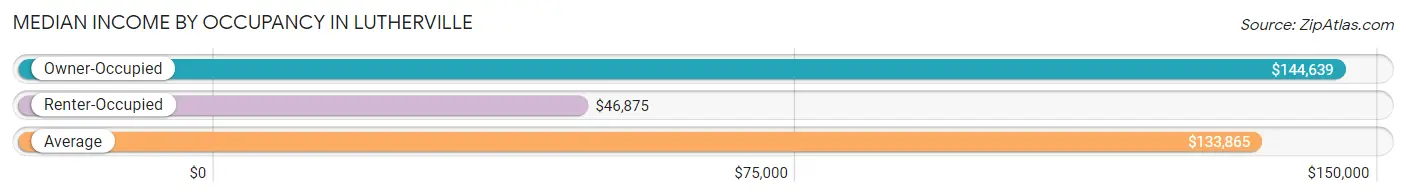
| Occupancy Type | # Households | Median Income |
| Owner-Occupied | 2,093 (84.6%) | $144,639 |
| Renter-Occupied | 380 (15.4%) | $46,875 |
| Average | 2,473 (100.0%) | $133,865 |
Occupancy by Householder Income Bracket in Lutherville
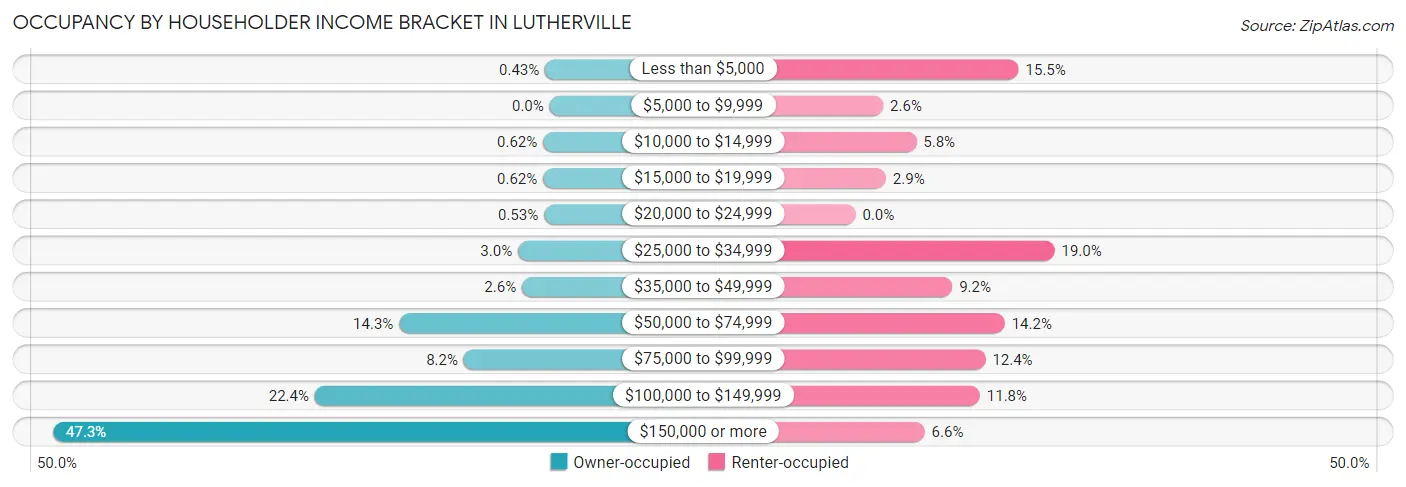
| Income Bracket | Owner-occupied | Renter-occupied |
| Less than $5,000 | 9 (0.4%) | 59 (15.5%) |
| $5,000 to $9,999 | 0 (0.0%) | 10 (2.6%) |
| $10,000 to $14,999 | 13 (0.6%) | 22 (5.8%) |
| $15,000 to $19,999 | 13 (0.6%) | 11 (2.9%) |
| $20,000 to $24,999 | 11 (0.5%) | 0 (0.0%) |
| $25,000 to $34,999 | 63 (3.0%) | 72 (19.0%) |
| $35,000 to $49,999 | 55 (2.6%) | 35 (9.2%) |
| $50,000 to $74,999 | 300 (14.3%) | 54 (14.2%) |
| $75,000 to $99,999 | 171 (8.2%) | 47 (12.4%) |
| $100,000 to $149,999 | 468 (22.4%) | 45 (11.8%) |
| $150,000 or more | 990 (47.3%) | 25 (6.6%) |
| Total | 2,093 (100.0%) | 380 (100.0%) |
Monthly Housing Cost Tiers in Lutherville
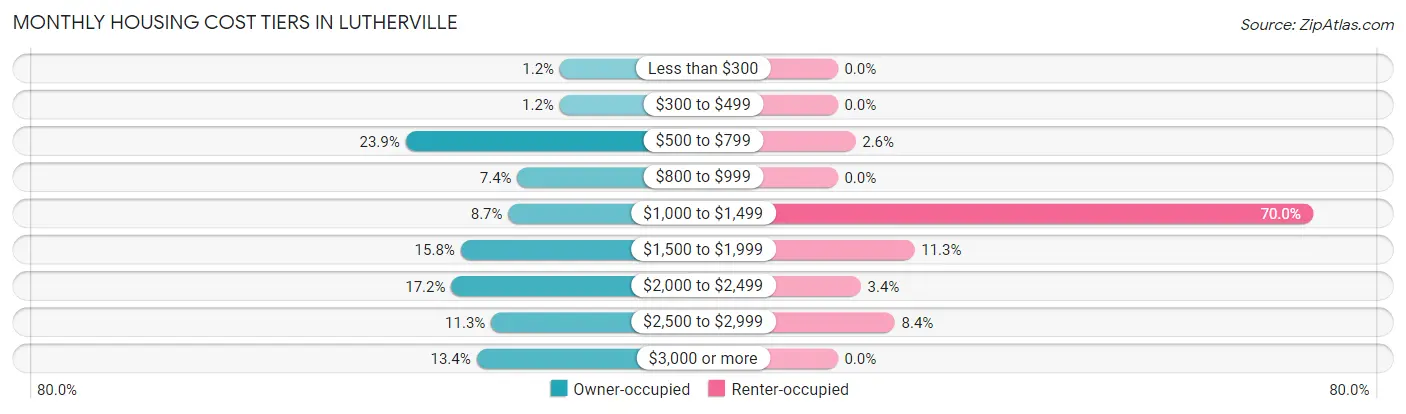
| Monthly Cost | Owner-occupied | Renter-occupied |
| Less than $300 | 24 (1.1%) | 0 (0.0%) |
| $300 to $499 | 25 (1.2%) | 0 (0.0%) |
| $500 to $799 | 500 (23.9%) | 10 (2.6%) |
| $800 to $999 | 155 (7.4%) | 0 (0.0%) |
| $1,000 to $1,499 | 183 (8.7%) | 266 (70.0%) |
| $1,500 to $1,999 | 330 (15.8%) | 43 (11.3%) |
| $2,000 to $2,499 | 359 (17.2%) | 13 (3.4%) |
| $2,500 to $2,999 | 236 (11.3%) | 32 (8.4%) |
| $3,000 or more | 281 (13.4%) | 0 (0.0%) |
| Total | 2,093 (100.0%) | 380 (100.0%) |
Physical Housing Characteristics in Lutherville
Housing Structures in Lutherville
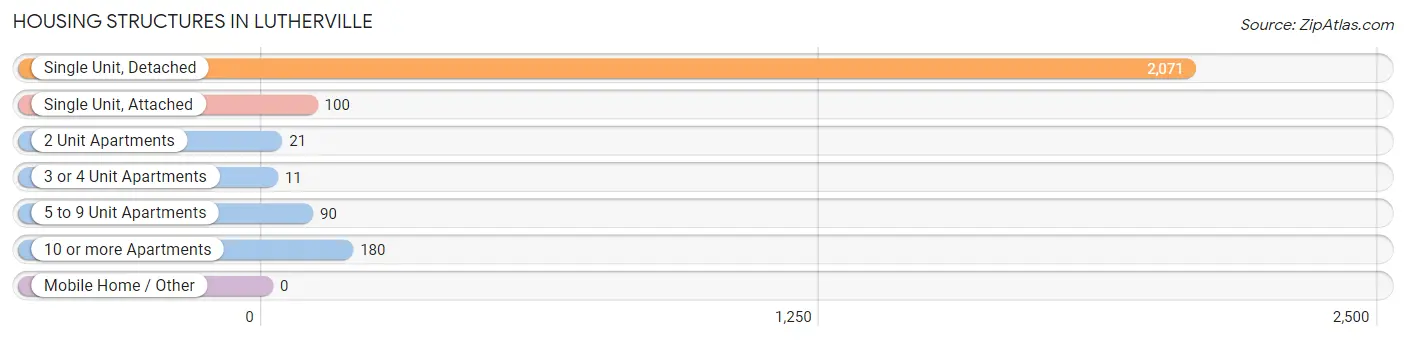
| Structure Type | # Housing Units | % Housing Units |
| Single Unit, Detached | 2,071 | 83.7% |
| Single Unit, Attached | 100 | 4.0% |
| 2 Unit Apartments | 21 | 0.9% |
| 3 or 4 Unit Apartments | 11 | 0.4% |
| 5 to 9 Unit Apartments | 90 | 3.6% |
| 10 or more Apartments | 180 | 7.3% |
| Mobile Home / Other | 0 | 0.0% |
| Total | 2,473 | 100.0% |
Housing Structures by Occupancy in Lutherville
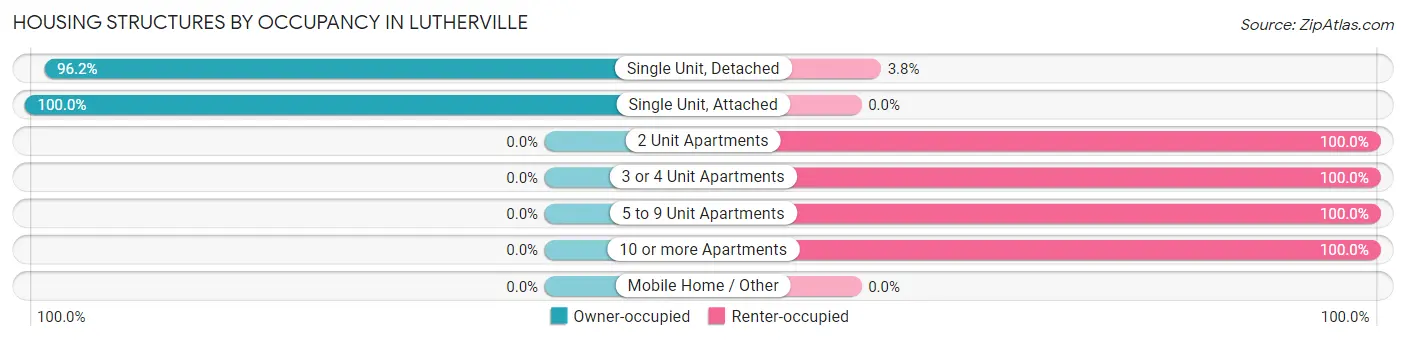
| Structure Type | Owner-occupied | Renter-occupied |
| Single Unit, Detached | 1,993 (96.2%) | 78 (3.8%) |
| Single Unit, Attached | 100 (100.0%) | 0 (0.0%) |
| 2 Unit Apartments | 0 (0.0%) | 21 (100.0%) |
| 3 or 4 Unit Apartments | 0 (0.0%) | 11 (100.0%) |
| 5 to 9 Unit Apartments | 0 (0.0%) | 90 (100.0%) |
| 10 or more Apartments | 0 (0.0%) | 180 (100.0%) |
| Mobile Home / Other | 0 (0.0%) | 0 (0.0%) |
| Total | 2,093 (84.6%) | 380 (15.4%) |
Housing Structures by Number of Rooms in Lutherville
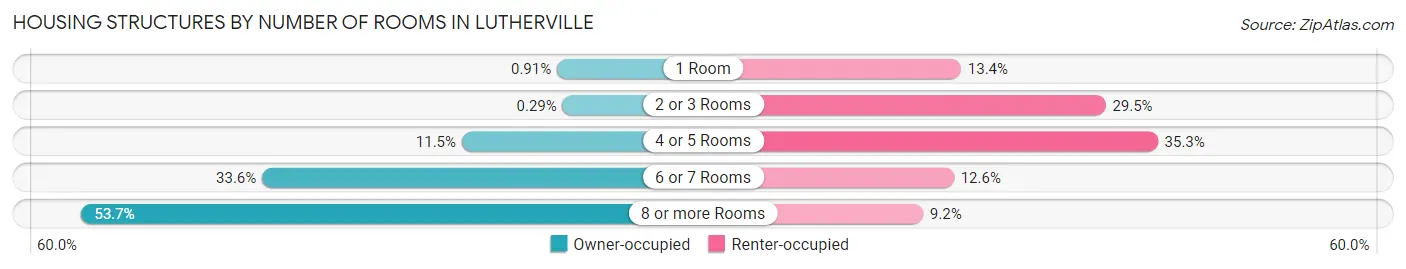
| Number of Rooms | Owner-occupied | Renter-occupied |
| 1 Room | 19 (0.9%) | 51 (13.4%) |
| 2 or 3 Rooms | 6 (0.3%) | 112 (29.5%) |
| 4 or 5 Rooms | 240 (11.5%) | 134 (35.3%) |
| 6 or 7 Rooms | 704 (33.6%) | 48 (12.6%) |
| 8 or more Rooms | 1,124 (53.7%) | 35 (9.2%) |
| Total | 2,093 (100.0%) | 380 (100.0%) |
Housing Structure by Heating Type in Lutherville
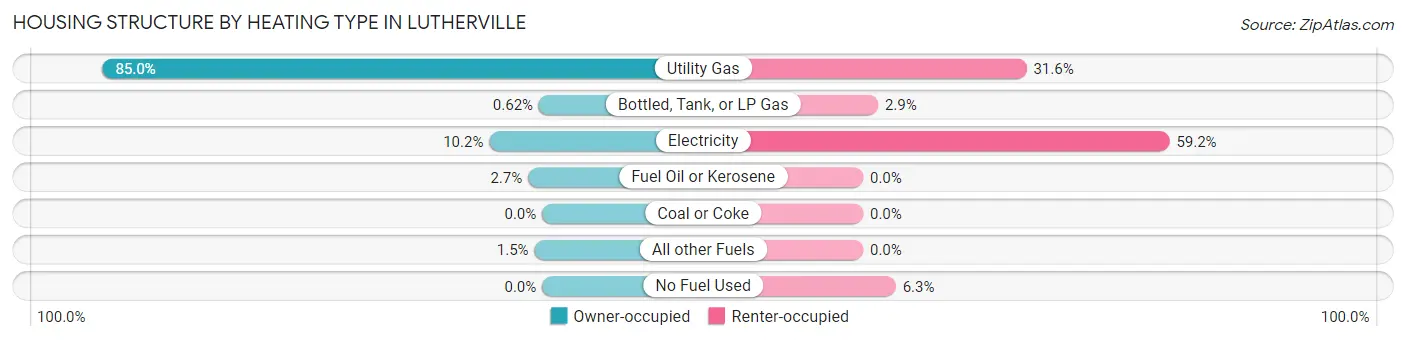
| Heating Type | Owner-occupied | Renter-occupied |
| Utility Gas | 1,778 (85.0%) | 120 (31.6%) |
| Bottled, Tank, or LP Gas | 13 (0.6%) | 11 (2.9%) |
| Electricity | 214 (10.2%) | 225 (59.2%) |
| Fuel Oil or Kerosene | 57 (2.7%) | 0 (0.0%) |
| Coal or Coke | 0 (0.0%) | 0 (0.0%) |
| All other Fuels | 31 (1.5%) | 0 (0.0%) |
| No Fuel Used | 0 (0.0%) | 24 (6.3%) |
| Total | 2,093 (100.0%) | 380 (100.0%) |
Household Vehicle Usage in Lutherville
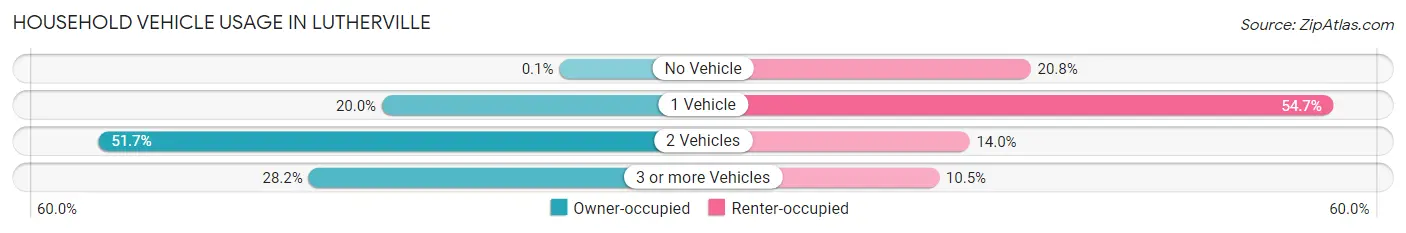
| Vehicles per Household | Owner-occupied | Renter-occupied |
| No Vehicle | 2 (0.1%) | 79 (20.8%) |
| 1 Vehicle | 418 (20.0%) | 208 (54.7%) |
| 2 Vehicles | 1,083 (51.7%) | 53 (14.0%) |
| 3 or more Vehicles | 590 (28.2%) | 40 (10.5%) |
| Total | 2,093 (100.0%) | 380 (100.0%) |
Real Estate & Mortgages in Lutherville
Real Estate and Mortgage Overview in Lutherville
| Characteristic | Without Mortgage | With Mortgage |
| Housing Units | 788 | 1,305 |
| Median Property Value | $382,400 | $418,800 |
| Median Household Income | $115,875 | $713 |
| Monthly Housing Costs | $723 | $281 |
| Real Estate Taxes | $4,354 | $19 |
Property Value by Mortgage Status in Lutherville
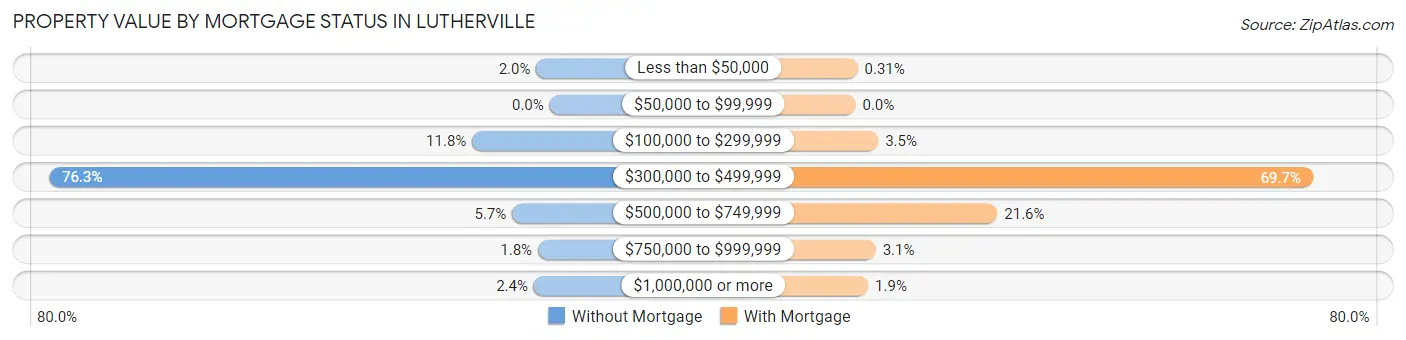
| Property Value | Without Mortgage | With Mortgage |
| Less than $50,000 | 16 (2.0%) | 4 (0.3%) |
| $50,000 to $99,999 | 0 (0.0%) | 0 (0.0%) |
| $100,000 to $299,999 | 93 (11.8%) | 45 (3.5%) |
| $300,000 to $499,999 | 601 (76.3%) | 909 (69.7%) |
| $500,000 to $749,999 | 45 (5.7%) | 282 (21.6%) |
| $750,000 to $999,999 | 14 (1.8%) | 40 (3.1%) |
| $1,000,000 or more | 19 (2.4%) | 25 (1.9%) |
| Total | 788 (100.0%) | 1,305 (100.0%) |
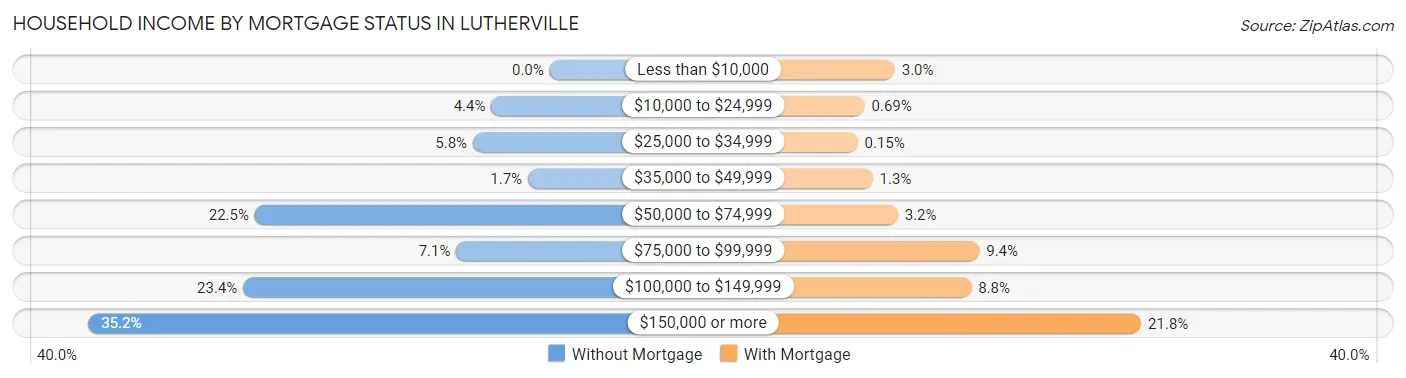
Household Income by Mortgage Status in Lutherville
| Household Income | Without Mortgage | With Mortgage |
| Less than $10,000 | 0 (0.0%) | 39 (3.0%) |
| $10,000 to $24,999 | 35 (4.4%) | 9 (0.7%) |
| $25,000 to $34,999 | 46 (5.8%) | 2 (0.2%) |
| $35,000 to $49,999 | 13 (1.7%) | 17 (1.3%) |
| $50,000 to $74,999 | 177 (22.5%) | 42 (3.2%) |
| $75,000 to $99,999 | 56 (7.1%) | 123 (9.4%) |
| $100,000 to $149,999 | 184 (23.4%) | 115 (8.8%) |
| $150,000 or more | 277 (35.1%) | 284 (21.8%) |
| Total | 788 (100.0%) | 1,305 (100.0%) |
Property Value to Household Income Ratio in Lutherville
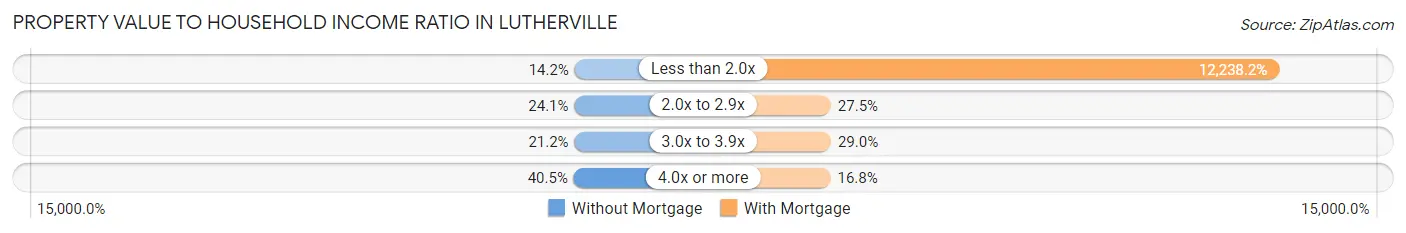
| Value-to-Income Ratio | Without Mortgage | With Mortgage |
| Less than 2.0x | 112 (14.2%) | 159,708 (12,238.2%) |
| 2.0x to 2.9x | 190 (24.1%) | 359 (27.5%) |
| 3.0x to 3.9x | 167 (21.2%) | 378 (29.0%) |
| 4.0x or more | 319 (40.5%) | 219 (16.8%) |
| Total | 788 (100.0%) | 1,305 (100.0%) |
Real Estate Taxes by Mortgage Status in Lutherville
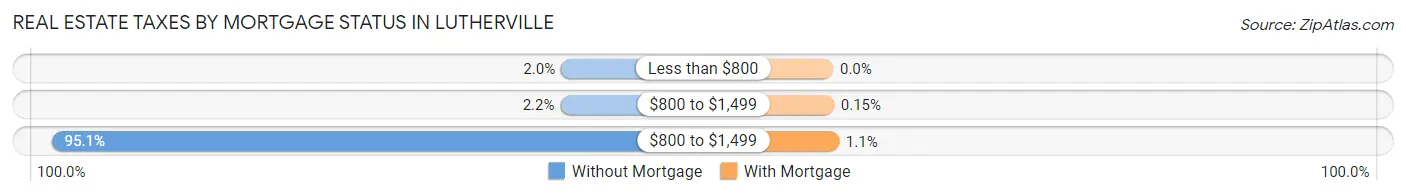
| Property Taxes | Without Mortgage | With Mortgage |
| Less than $800 | 16 (2.0%) | 0 (0.0%) |
| $800 to $1,499 | 17 (2.2%) | 2 (0.2%) |
| $800 to $1,499 | 749 (95.1%) | 14 (1.1%) |
| Total | 788 (100.0%) | 1,305 (100.0%) |
Health & Disability in Lutherville
Health Insurance Coverage by Age in Lutherville
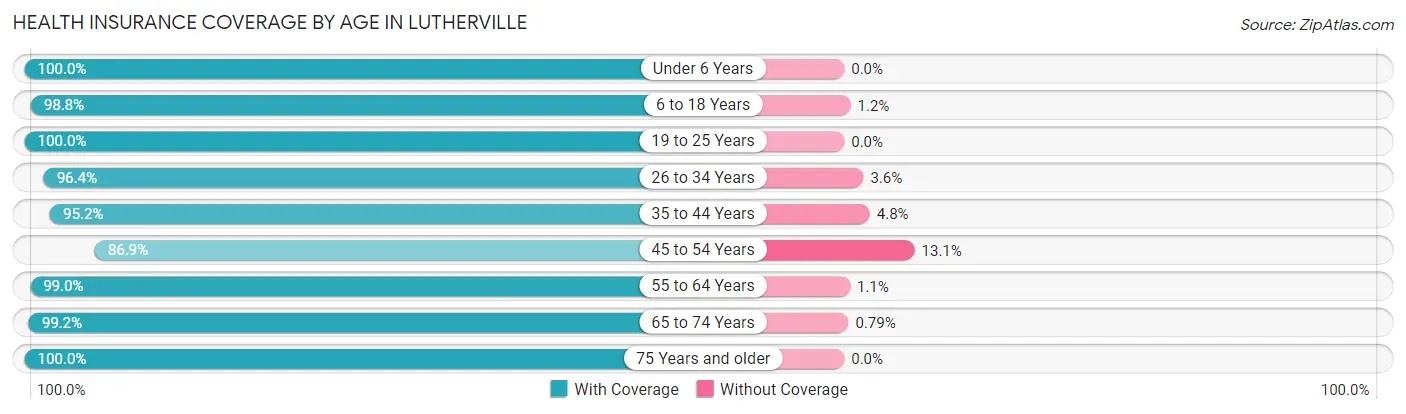
| Age Bracket | With Coverage | Without Coverage |
| Under 6 Years | 247 (100.0%) | 0 (0.0%) |
| 6 to 18 Years | 1,093 (98.8%) | 13 (1.2%) |
| 19 to 25 Years | 347 (100.0%) | 0 (0.0%) |
| 26 to 34 Years | 593 (96.4%) | 22 (3.6%) |
| 35 to 44 Years | 818 (95.2%) | 41 (4.8%) |
| 45 to 54 Years | 868 (86.9%) | 131 (13.1%) |
| 55 to 64 Years | 945 (99.0%) | 10 (1.1%) |
| 65 to 74 Years | 883 (99.2%) | 7 (0.8%) |
| 75 Years and older | 576 (100.0%) | 0 (0.0%) |
| Total | 6,370 (96.6%) | 224 (3.4%) |
Health Insurance Coverage by Citizenship Status in Lutherville

| Citizenship Status | With Coverage | Without Coverage |
| Native Born | 247 (100.0%) | 0 (0.0%) |
| Foreign Born, Citizen | 1,093 (98.8%) | 13 (1.2%) |
| Foreign Born, not a Citizen | 347 (100.0%) | 0 (0.0%) |
Health Insurance Coverage by Household Income in Lutherville
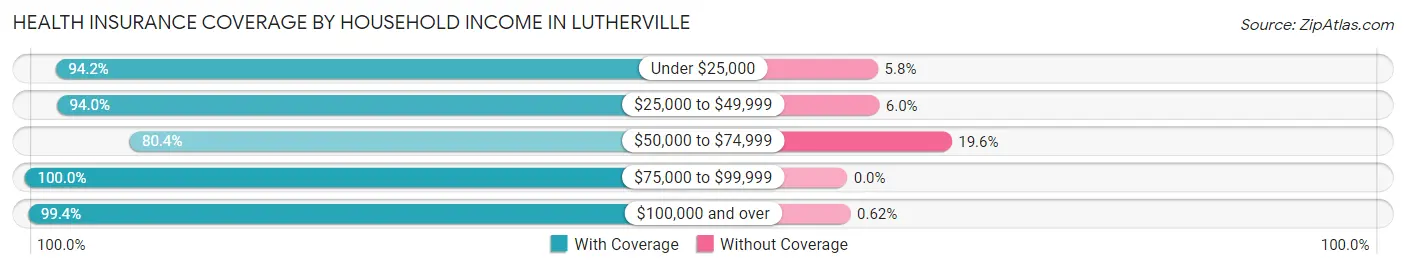
| Household Income | With Coverage | Without Coverage |
| Under $25,000 | 163 (94.2%) | 10 (5.8%) |
| $25,000 to $49,999 | 344 (94.0%) | 22 (6.0%) |
| $50,000 to $74,999 | 670 (80.4%) | 163 (19.6%) |
| $75,000 to $99,999 | 532 (100.0%) | 0 (0.0%) |
| $100,000 and over | 4,643 (99.4%) | 29 (0.6%) |
Public vs Private Health Insurance Coverage by Age in Lutherville
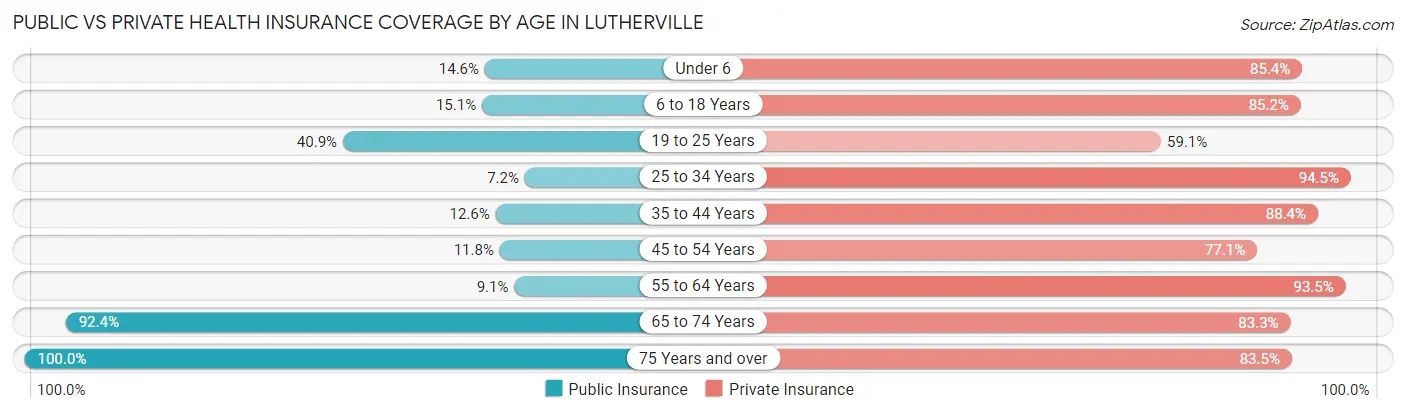
| Age Bracket | Public Insurance | Private Insurance |
| Under 6 | 36 (14.6%) | 211 (85.4%) |
| 6 to 18 Years | 167 (15.1%) | 942 (85.2%) |
| 19 to 25 Years | 142 (40.9%) | 205 (59.1%) |
| 25 to 34 Years | 44 (7.1%) | 581 (94.5%) |
| 35 to 44 Years | 108 (12.6%) | 759 (88.4%) |
| 45 to 54 Years | 118 (11.8%) | 770 (77.1%) |
| 55 to 64 Years | 87 (9.1%) | 893 (93.5%) |
| 65 to 74 Years | 822 (92.4%) | 741 (83.3%) |
| 75 Years and over | 576 (100.0%) | 481 (83.5%) |
| Total | 2,100 (31.9%) | 5,583 (84.7%) |
Disability Status by Sex by Age in Lutherville
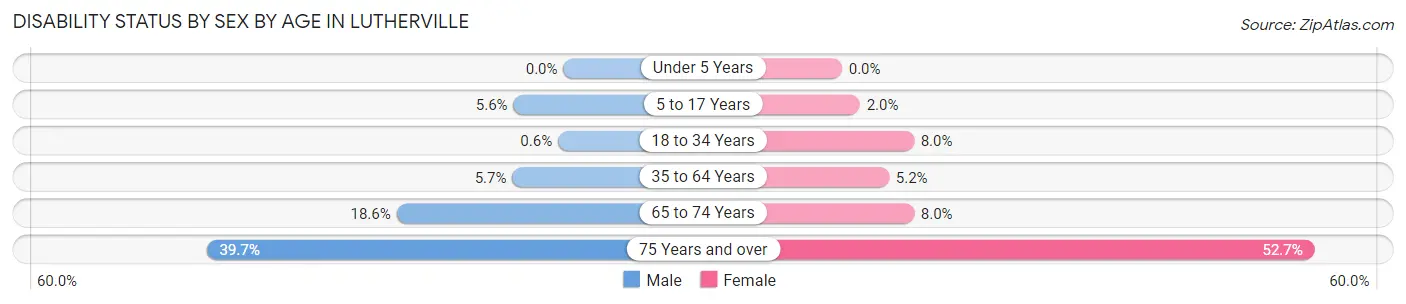
| Age Bracket | Male | Female |
| Under 5 Years | 0 (0.0%) | 0 (0.0%) |
| 5 to 17 Years | 31 (5.6%) | 10 (2.0%) |
| 18 to 34 Years | 3 (0.6%) | 43 (8.0%) |
| 35 to 64 Years | 84 (5.7%) | 70 (5.2%) |
| 65 to 74 Years | 68 (18.6%) | 42 (8.0%) |
| 75 Years and over | 124 (39.7%) | 139 (52.6%) |
Disability Class by Sex by Age in Lutherville
Disability Class: Hearing Difficulty

| Age Bracket | Male | Female |
| Under 5 Years | 0 (0.0%) | 0 (0.0%) |
| 5 to 17 Years | 0 (0.0%) | 0 (0.0%) |
| 18 to 34 Years | 0 (0.0%) | 0 (0.0%) |
| 35 to 64 Years | 17 (1.1%) | 19 (1.4%) |
| 65 to 74 Years | 35 (9.6%) | 11 (2.1%) |
| 75 Years and over | 92 (29.5%) | 62 (23.5%) |
Disability Class: Vision Difficulty
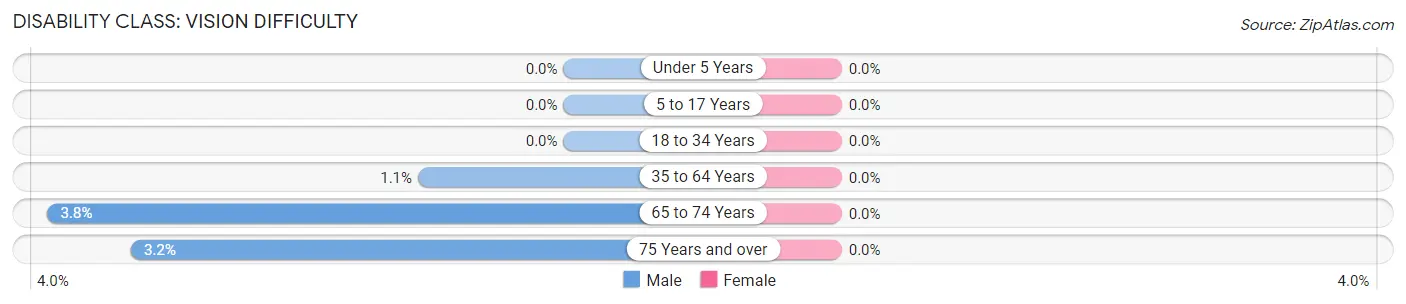
| Age Bracket | Male | Female |
| Under 5 Years | 0 (0.0%) | 0 (0.0%) |
| 5 to 17 Years | 0 (0.0%) | 0 (0.0%) |
| 18 to 34 Years | 0 (0.0%) | 0 (0.0%) |
| 35 to 64 Years | 16 (1.1%) | 0 (0.0%) |
| 65 to 74 Years | 14 (3.8%) | 0 (0.0%) |
| 75 Years and over | 10 (3.2%) | 0 (0.0%) |
Disability Class: Cognitive Difficulty
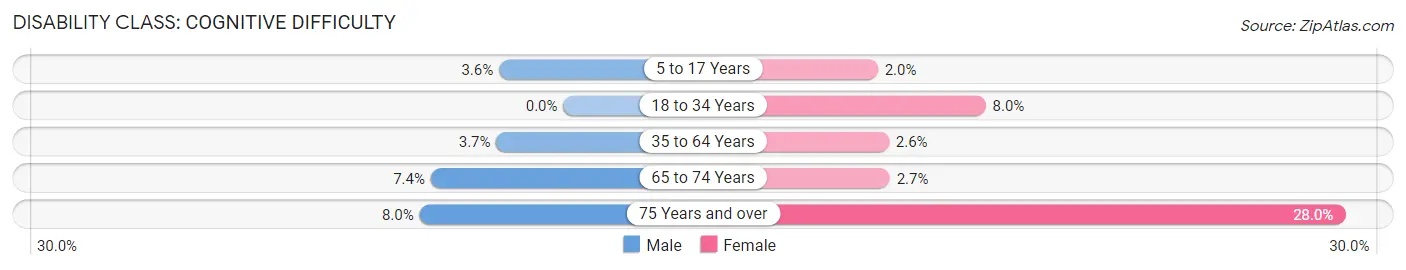
| Age Bracket | Male | Female |
| 5 to 17 Years | 20 (3.6%) | 10 (2.0%) |
| 18 to 34 Years | 0 (0.0%) | 43 (8.0%) |
| 35 to 64 Years | 55 (3.7%) | 35 (2.6%) |
| 65 to 74 Years | 27 (7.4%) | 14 (2.7%) |
| 75 Years and over | 25 (8.0%) | 74 (28.0%) |
Disability Class: Ambulatory Difficulty
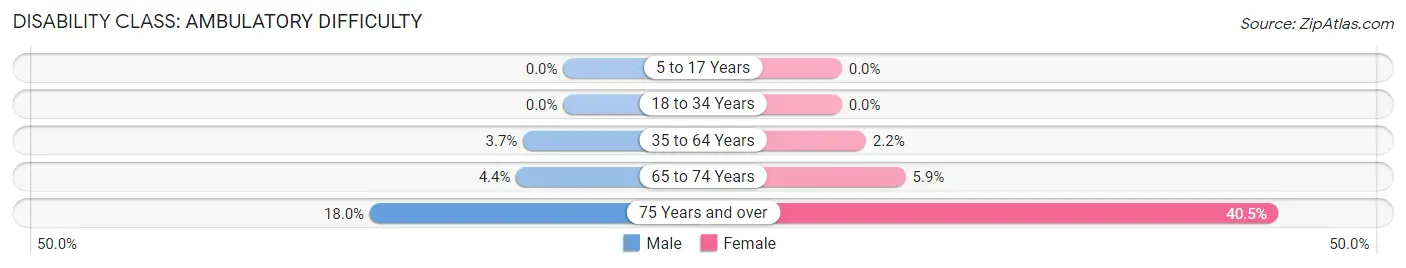
| Age Bracket | Male | Female |
| 5 to 17 Years | 0 (0.0%) | 0 (0.0%) |
| 18 to 34 Years | 0 (0.0%) | 0 (0.0%) |
| 35 to 64 Years | 55 (3.7%) | 30 (2.2%) |
| 65 to 74 Years | 16 (4.4%) | 31 (5.9%) |
| 75 Years and over | 56 (17.9%) | 107 (40.5%) |
Disability Class: Self-Care Difficulty
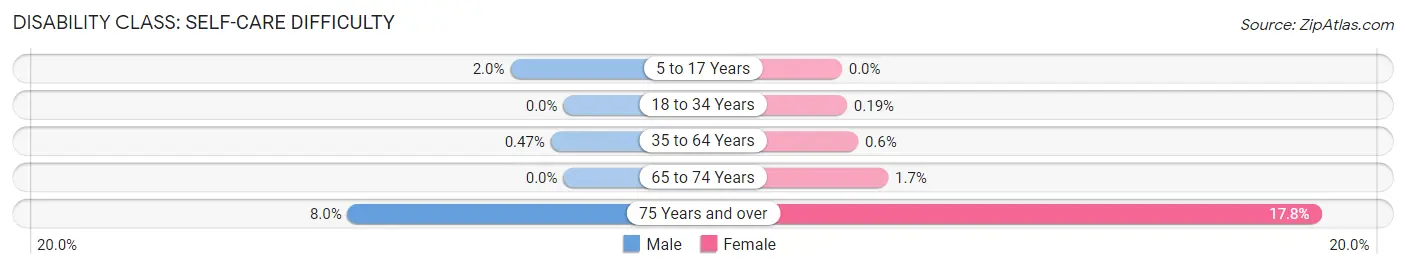
| Age Bracket | Male | Female |
| 5 to 17 Years | 11 (2.0%) | 0 (0.0%) |
| 18 to 34 Years | 0 (0.0%) | 1 (0.2%) |
| 35 to 64 Years | 7 (0.5%) | 8 (0.6%) |
| 65 to 74 Years | 0 (0.0%) | 9 (1.7%) |
| 75 Years and over | 25 (8.0%) | 47 (17.8%) |
Technology Access in Lutherville
Computing Device Access in Lutherville
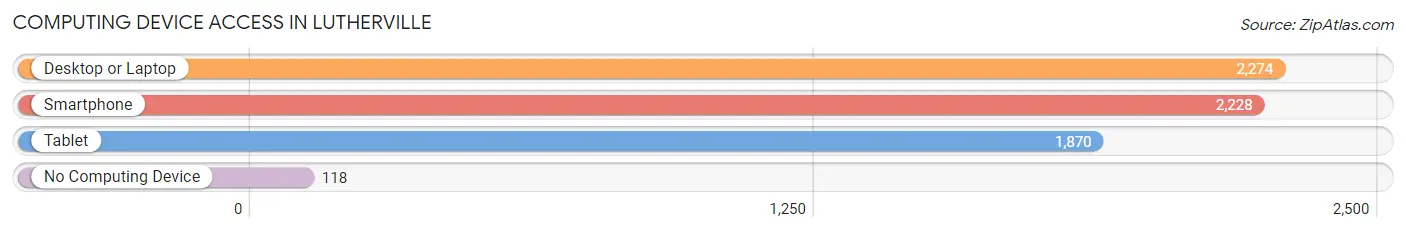
| Device Type | # Households | % Households |
| Desktop or Laptop | 2,274 | 91.9% |
| Smartphone | 2,228 | 90.1% |
| Tablet | 1,870 | 75.6% |
| No Computing Device | 118 | 4.8% |
| Total | 2,473 | 100.0% |
Internet Access in Lutherville
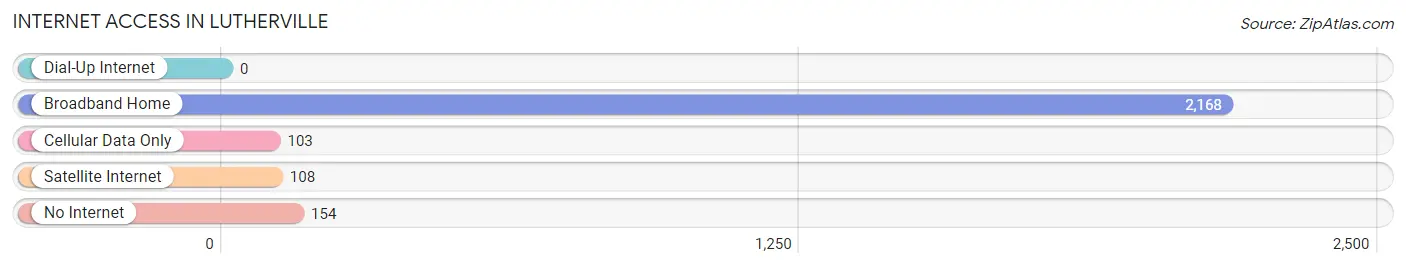
| Internet Type | # Households | % Households |
| Dial-Up Internet | 0 | 0.0% |
| Broadband Home | 2,168 | 87.7% |
| Cellular Data Only | 103 | 4.2% |
| Satellite Internet | 108 | 4.4% |
| No Internet | 154 | 6.2% |
| Total | 2,473 | 100.0% |
Lutherville Summary
Lutherville, Maryland is a small, unincorporated community located in Baltimore County, Maryland. It is situated just north of the city of Baltimore and is part of the Baltimore metropolitan area. The population of Lutherville was 6,919 at the 2010 census.
History
Lutherville was founded in 1852 by two German immigrants, John and Henry Luther. The brothers purchased a large tract of land and began to develop the area. They named the area after themselves and began to build homes and businesses. The area quickly grew and by the late 19th century, Lutherville had become a popular summer resort for wealthy Baltimoreans.
In the early 20th century, Lutherville began to experience a period of growth and development. The area was annexed by Baltimore County in 1918 and the Lutherville Volunteer Fire Department was established in 1921. The area continued to grow and by the 1950s, Lutherville had become a popular residential area for middle-class families.
Geography
Lutherville is located in northern Baltimore County, Maryland. It is situated just north of the city of Baltimore and is part of the Baltimore metropolitan area. The area is bordered by the communities of Timonium to the north, Towson to the east, and Cockeysville to the west. The area is located in the Piedmont region of Maryland and is characterized by rolling hills and valleys.
Economy
Lutherville is primarily a residential community, but it does have a few businesses. The area is home to a number of small retail stores, restaurants, and professional services. The area is also home to a number of corporate offices, including those of the Johns Hopkins University Applied Physics Laboratory and the Social Security Administration.
Demographics
As of the 2010 census, the population of Lutherville was 6,919. The racial makeup of the area was 87.3% White, 8.2% African American, 0.7% Asian, 0.3% Native American, and 3.5% from other races. The median household income was $90,945 and the median family income was $103,945. The per capita income was $41,945.
Conclusion
Lutherville, Maryland is a small, unincorporated community located in Baltimore County, Maryland. It is situated just north of the city of Baltimore and is part of the Baltimore metropolitan area. The area was founded in 1852 by two German immigrants and has since grown to become a popular residential area for middle-class families. The area is primarily residential, but does have a few businesses. The population of Lutherville was 6,919 at the 2010 census and the median household income was $90,945.
Common Questions
What is Per Capita Income in Lutherville?
Per Capita income in Lutherville is $57,463.
What is the Median Family Income in Lutherville?
Median Family Income in Lutherville is $145,609.
What is the Median Household income in Lutherville?
Median Household Income in Lutherville is $133,865.
What is Income or Wage Gap in Lutherville?
Income or Wage Gap in Lutherville is 17.1%.
Women in Lutherville earn 82.9 cents for every dollar earned by a man.
What is Inequality or Gini Index in Lutherville?
Inequality or Gini Index in Lutherville is 0.39.
What is the Total Population of Lutherville?
Total Population of Lutherville is 6,595.
What is the Total Male Population of Lutherville?
Total Male Population of Lutherville is 3,329.
What is the Total Female Population of Lutherville?
Total Female Population of Lutherville is 3,266.
What is the Ratio of Males per 100 Females in Lutherville?
There are 101.93 Males per 100 Females in Lutherville.
What is the Ratio of Females per 100 Males in Lutherville?
There are 98.11 Females per 100 Males in Lutherville.
What is the Median Population Age in Lutherville?
Median Population Age in Lutherville is 45.6 Years.
What is the Average Family Size in Lutherville
Average Family Size in Lutherville is 3.0 People.
What is the Average Household Size in Lutherville
Average Household Size in Lutherville is 2.7 People.
How Large is the Labor Force in Lutherville?
There are 3,733 People in the Labor Forcein in Lutherville.
What is the Percentage of People in the Labor Force in Lutherville?
69.0% of People are in the Labor Force in Lutherville.
What is the Unemployment Rate in Lutherville?
Unemployment Rate in Lutherville is 5.5%.