Roxborough Park, CO Map & Demographics
Roxborough Park Map
Roxborough Park Overview
$65,325
PER CAPITA INCOME
$152,241
AVG FAMILY INCOME
$150,086
AVG HOUSEHOLD INCOME
36.6%
WAGE / INCOME GAP [ % ]
63.4¢/ $1
WAGE / INCOME GAP [ $ ]
0.35
INEQUALITY / GINI INDEX
9,057
TOTAL POPULATION
4,653
MALE POPULATION
4,404
FEMALE POPULATION
105.65
MALES / 100 FEMALES
94.65
FEMALES / 100 MALES
40.5
MEDIAN AGE
2.9
AVG FAMILY SIZE
2.8
AVG HOUSEHOLD SIZE
4,771
LABOR FORCE [ PEOPLE ]
65.9%
PERCENT IN LABOR FORCE
1.1%
UNEMPLOYMENT RATE
Income in Roxborough Park
Income Overview in Roxborough Park
Per Capita Income in Roxborough Park is $65,325, while median incomes of families and households are $152,241 and $150,086 respectively.
| Characteristic | Number | Measure |
| Per Capita Income | 9,057 | $65,325 |
| Median Family Income | 2,766 | $152,241 |
| Mean Family Income | 2,766 | $187,074 |
| Median Household Income | 3,248 | $150,086 |
| Mean Household Income | 3,248 | $179,657 |
| Income Deficit | 2,766 | $0 |
| Wage / Income Gap (%) | 9,057 | 36.59% |
| Wage / Income Gap ($) | 9,057 | 63.41¢ per $1 |
| Gini / Inequality Index | 9,057 | 0.35 |
Earnings by Sex in Roxborough Park
Average Earnings in Roxborough Park are $68,762, $87,475 for men and $55,466 for women, a difference of 36.6%.
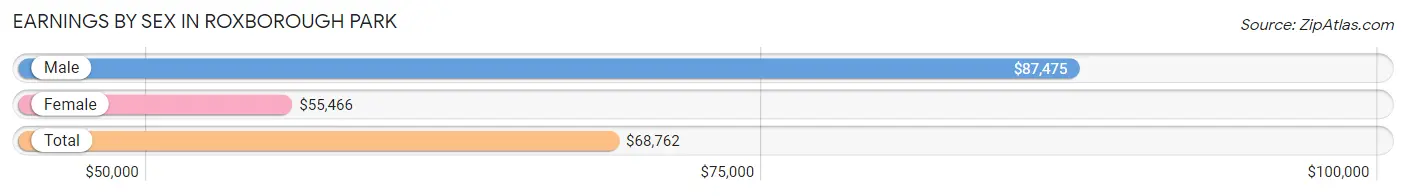
| Sex | Number | Average Earnings |
| Male | 2,697 (53.1%) | $87,475 |
| Female | 2,378 (46.9%) | $55,466 |
| Total | 5,075 (100.0%) | $68,762 |
Earnings by Sex by Income Bracket in Roxborough Park
The most common earnings brackets in Roxborough Park are $100,000+ for men (1,208 | 44.8%) and $100,000+ for women (477 | 20.1%).
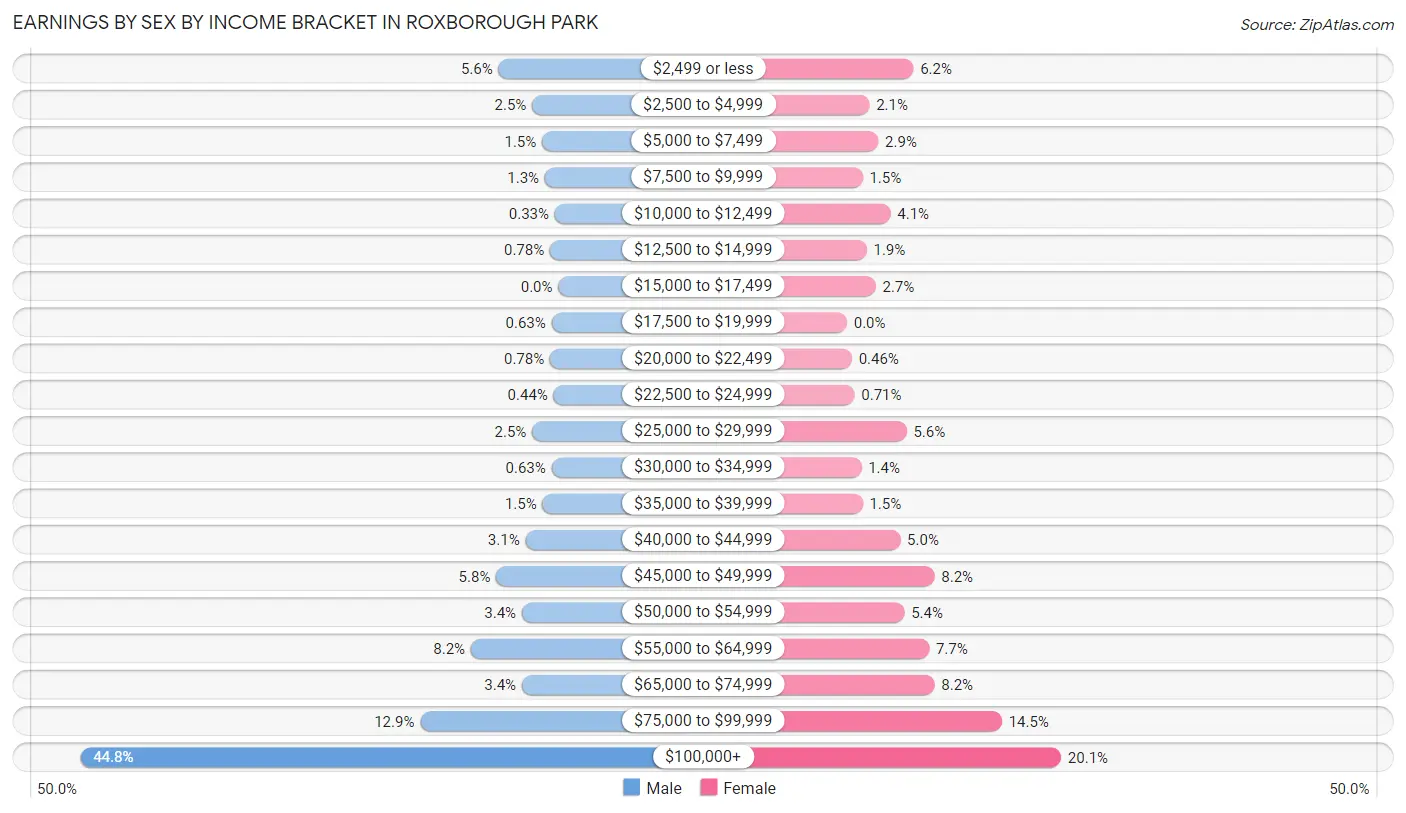
| Income | Male | Female |
| $2,499 or less | 151 (5.6%) | 148 (6.2%) |
| $2,500 to $4,999 | 66 (2.5%) | 50 (2.1%) |
| $5,000 to $7,499 | 41 (1.5%) | 70 (2.9%) |
| $7,500 to $9,999 | 34 (1.3%) | 35 (1.5%) |
| $10,000 to $12,499 | 9 (0.3%) | 97 (4.1%) |
| $12,500 to $14,999 | 21 (0.8%) | 44 (1.8%) |
| $15,000 to $17,499 | 0 (0.0%) | 64 (2.7%) |
| $17,500 to $19,999 | 17 (0.6%) | 0 (0.0%) |
| $20,000 to $22,499 | 21 (0.8%) | 11 (0.5%) |
| $22,500 to $24,999 | 12 (0.4%) | 17 (0.7%) |
| $25,000 to $29,999 | 66 (2.5%) | 133 (5.6%) |
| $30,000 to $34,999 | 17 (0.6%) | 32 (1.3%) |
| $35,000 to $39,999 | 40 (1.5%) | 35 (1.5%) |
| $40,000 to $44,999 | 83 (3.1%) | 119 (5.0%) |
| $45,000 to $49,999 | 157 (5.8%) | 195 (8.2%) |
| $50,000 to $54,999 | 92 (3.4%) | 128 (5.4%) |
| $55,000 to $64,999 | 221 (8.2%) | 183 (7.7%) |
| $65,000 to $74,999 | 92 (3.4%) | 195 (8.2%) |
| $75,000 to $99,999 | 349 (12.9%) | 345 (14.5%) |
| $100,000+ | 1,208 (44.8%) | 477 (20.1%) |
| Total | 2,697 (100.0%) | 2,378 (100.0%) |
Earnings by Sex by Educational Attainment in Roxborough Park
Average earnings in Roxborough Park are $97,849 for men and $59,967 for women, a difference of 38.7%. Men with an educational attainment of graduate degree enjoy the highest average annual earnings of $141,597, while those with high school diploma education earn the least with $51,250. Women with an educational attainment of graduate degree earn the most with the average annual earnings of $79,784, while those with high school diploma education have the smallest earnings of $43,846.
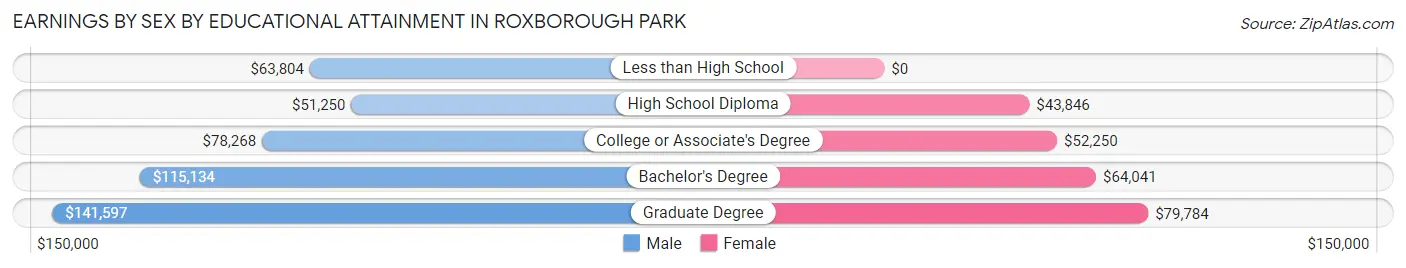
| Educational Attainment | Male Income | Female Income |
| Less than High School | $63,804 | $0 |
| High School Diploma | $51,250 | $43,846 |
| College or Associate's Degree | $78,268 | $52,250 |
| Bachelor's Degree | $115,134 | $64,041 |
| Graduate Degree | $141,597 | $79,784 |
| Total | $97,849 | $59,967 |
Family Income in Roxborough Park
Family Income Brackets in Roxborough Park
According to the Roxborough Park family income data, there are 880 families falling into the $100,000 to $149,999 income range, which is the most common income bracket and makes up 31.8% of all families.
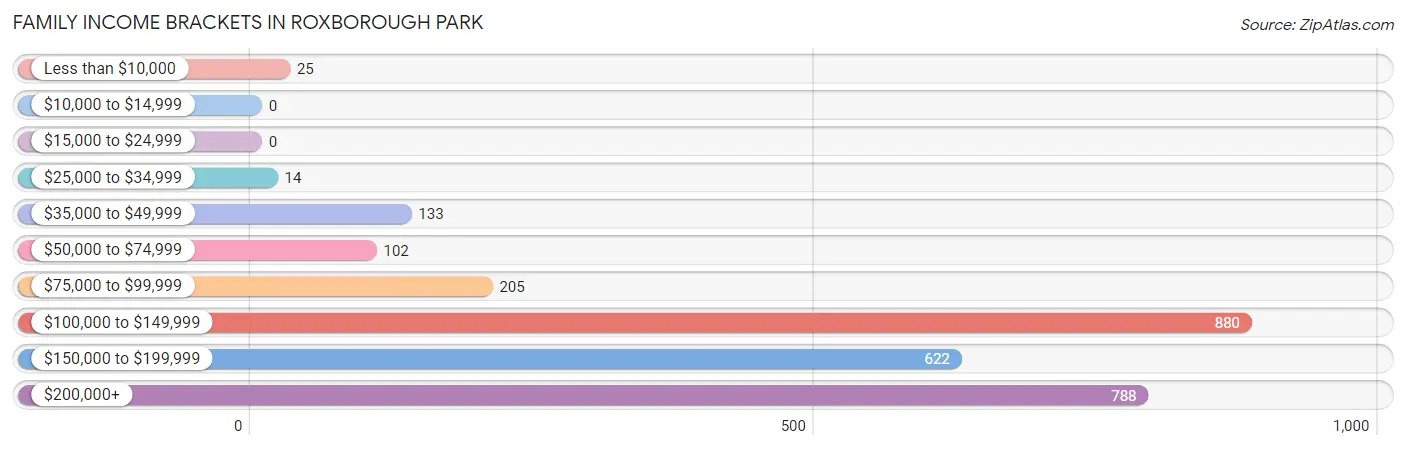
| Income Bracket | # Families | % Families |
| Less than $10,000 | 25 | 0.9% |
| $10,000 to $14,999 | 0 | 0.0% |
| $15,000 to $24,999 | 0 | 0.0% |
| $25,000 to $34,999 | 14 | 0.5% |
| $35,000 to $49,999 | 133 | 4.8% |
| $50,000 to $74,999 | 102 | 3.7% |
| $75,000 to $99,999 | 205 | 7.4% |
| $100,000 to $149,999 | 880 | 31.8% |
| $150,000 to $199,999 | 622 | 22.5% |
| $200,000+ | 788 | 28.5% |
Family Income by Famaliy Size in Roxborough Park
4-person families (457 | 16.5%) account for the highest median family income in Roxborough Park with $163,542 per family, while 2-person families (1,421 | 51.4%) have the highest median income of $81,320 per family member.
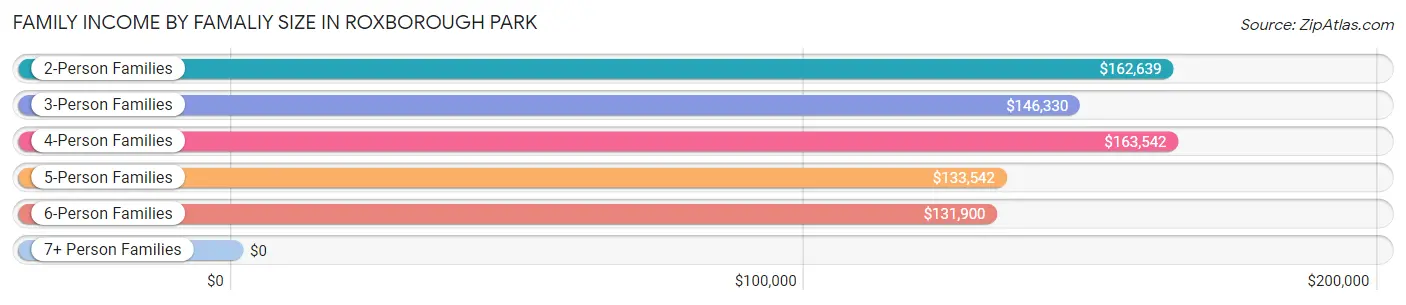
| Income Bracket | # Families | Median Income |
| 2-Person Families | 1,421 (51.4%) | $162,639 |
| 3-Person Families | 586 (21.2%) | $146,330 |
| 4-Person Families | 457 (16.5%) | $163,542 |
| 5-Person Families | 216 (7.8%) | $133,542 |
| 6-Person Families | 86 (3.1%) | $131,900 |
| 7+ Person Families | 0 (0.0%) | $0 |
| Total | 2,766 (100.0%) | $152,241 |
Family Income by Number of Earners in Roxborough Park
The median family income in Roxborough Park is $152,241, with families comprising 3+ earners (189) having the highest median family income of $228,938, while families with no earners (371) have the lowest median family income of $110,046, accounting for 6.8% and 13.4% of families, respectively.
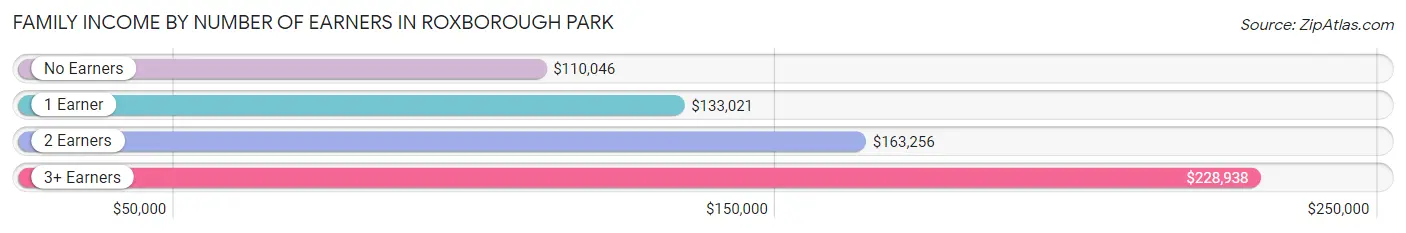
| Number of Earners | # Families | Median Income |
| No Earners | 371 (13.4%) | $110,046 |
| 1 Earner | 633 (22.9%) | $133,021 |
| 2 Earners | 1,573 (56.9%) | $163,256 |
| 3+ Earners | 189 (6.8%) | $228,938 |
| Total | 2,766 (100.0%) | $152,241 |
Household Income in Roxborough Park
Household Income Brackets in Roxborough Park
With 874 households falling in the category, the $100,000 to $149,999 income range is the most frequent in Roxborough Park, accounting for 26.9% of all households.
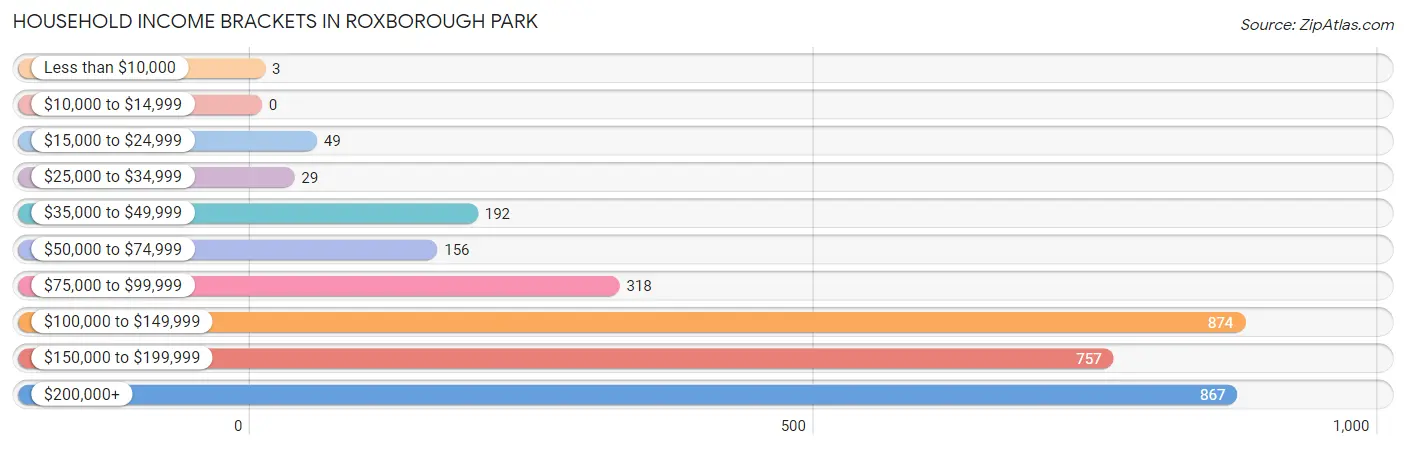
| Income Bracket | # Households | % Households |
| Less than $10,000 | 3 | 0.1% |
| $10,000 to $14,999 | 0 | 0.0% |
| $15,000 to $24,999 | 49 | 1.5% |
| $25,000 to $34,999 | 29 | 0.9% |
| $35,000 to $49,999 | 192 | 5.9% |
| $50,000 to $74,999 | 156 | 4.8% |
| $75,000 to $99,999 | 318 | 9.8% |
| $100,000 to $149,999 | 874 | 26.9% |
| $150,000 to $199,999 | 757 | 23.3% |
| $200,000+ | 867 | 26.7% |
Household Income by Householder Age in Roxborough Park
The median household income in Roxborough Park is $150,086, with the highest median household income of $165,188 found in the 45 to 64 years age bracket for the primary householder. A total of 1,399 households (43.1%) fall into this category.
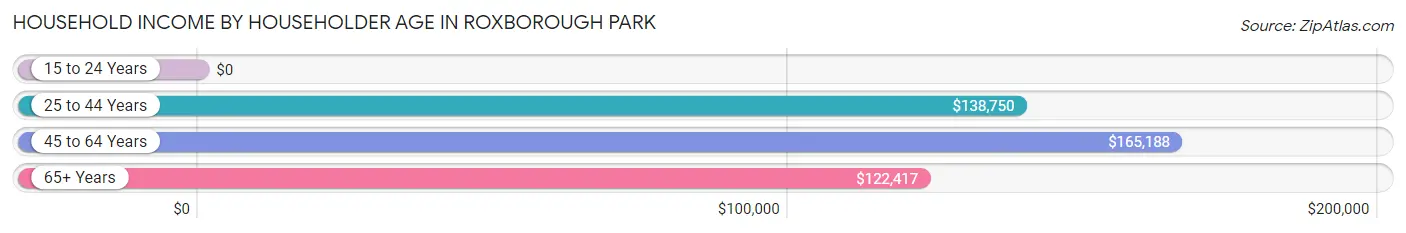
| Income Bracket | # Households | Median Income |
| 15 to 24 Years | 0 (0.0%) | $0 |
| 25 to 44 Years | 1,182 (36.4%) | $138,750 |
| 45 to 64 Years | 1,399 (43.1%) | $165,188 |
| 65+ Years | 667 (20.5%) | $122,417 |
| Total | 3,248 (100.0%) | $150,086 |
Poverty in Roxborough Park
Income Below Poverty by Sex and Age in Roxborough Park
With 0.9% poverty level for males and 5.0% for females among the residents of Roxborough Park, 18 to 24 year old males and 18 to 24 year old females are the most vulnerable to poverty, with 9 males (6.5%) and 129 females (35.0%) in their respective age groups living below the poverty level.
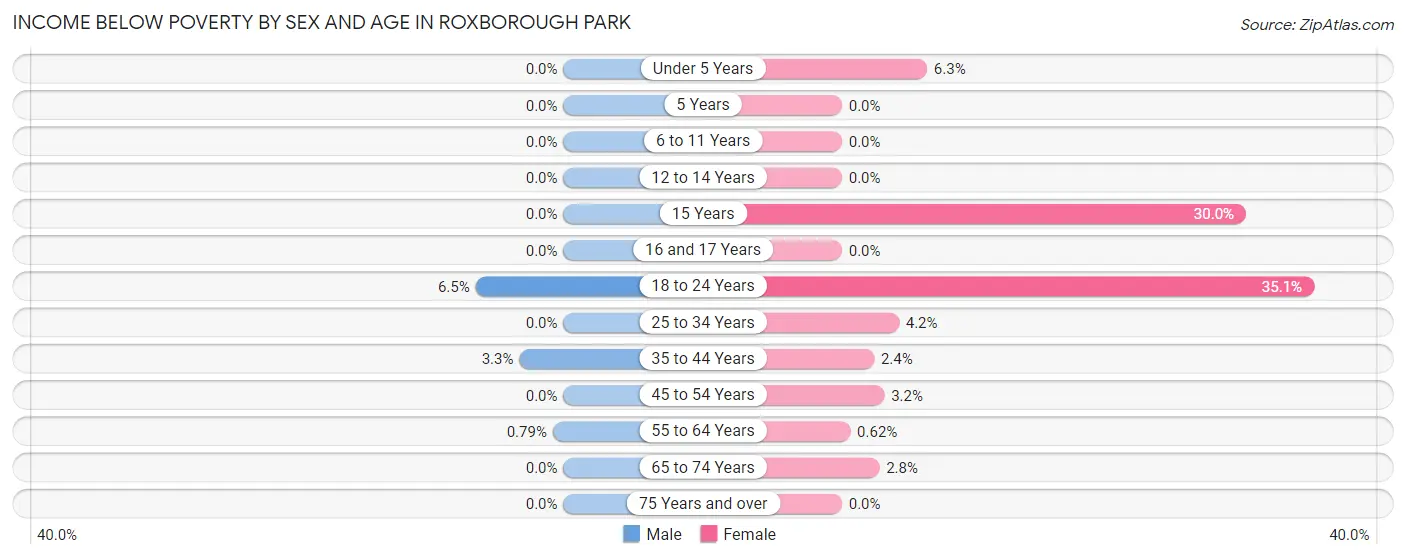
| Age Bracket | Male | Female |
| Under 5 Years | 0 (0.0%) | 12 (6.3%) |
| 5 Years | 0 (0.0%) | 0 (0.0%) |
| 6 to 11 Years | 0 (0.0%) | 0 (0.0%) |
| 12 to 14 Years | 0 (0.0%) | 0 (0.0%) |
| 15 Years | 0 (0.0%) | 6 (30.0%) |
| 16 and 17 Years | 0 (0.0%) | 0 (0.0%) |
| 18 to 24 Years | 9 (6.5%) | 129 (35.0%) |
| 25 to 34 Years | 0 (0.0%) | 19 (4.2%) |
| 35 to 44 Years | 29 (3.3%) | 21 (2.4%) |
| 45 to 54 Years | 0 (0.0%) | 18 (3.2%) |
| 55 to 64 Years | 5 (0.8%) | 4 (0.6%) |
| 65 to 74 Years | 0 (0.0%) | 11 (2.8%) |
| 75 Years and over | 0 (0.0%) | 0 (0.0%) |
| Total | 43 (0.9%) | 220 (5.0%) |
Income Above Poverty by Sex and Age in Roxborough Park
According to the poverty statistics in Roxborough Park, males aged under 5 years and females aged 5 years are the age groups that are most secure financially, with 100.0% of males and 100.0% of females in these age groups living above the poverty line.
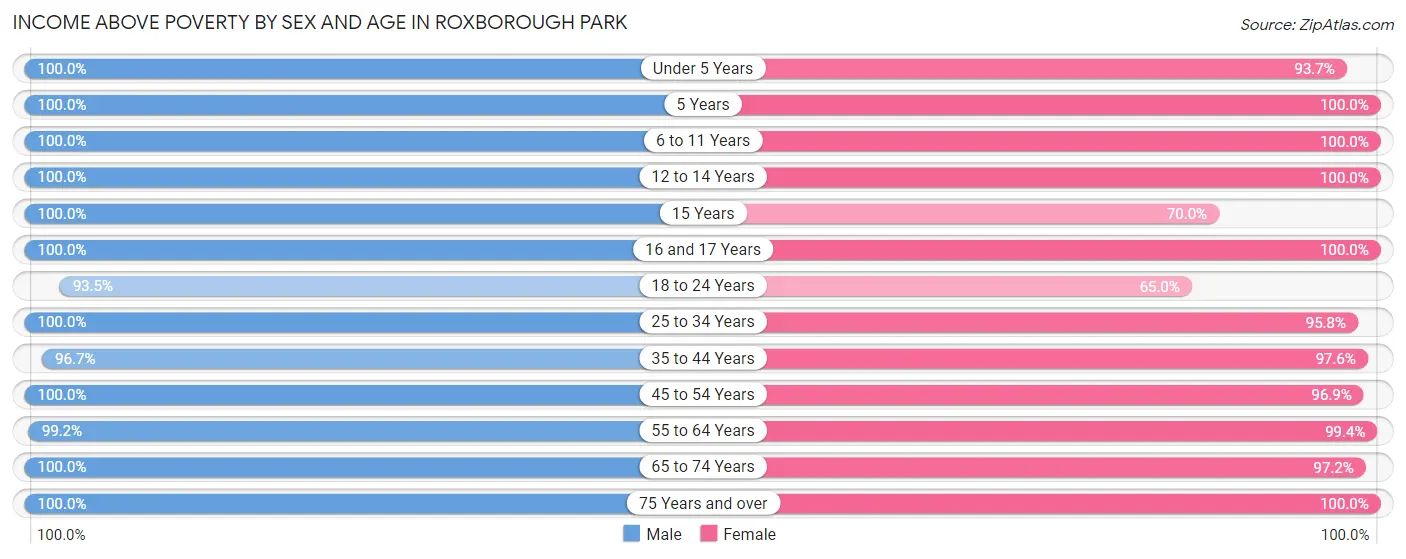
| Age Bracket | Male | Female |
| Under 5 Years | 199 (100.0%) | 178 (93.7%) |
| 5 Years | 74 (100.0%) | 85 (100.0%) |
| 6 to 11 Years | 417 (100.0%) | 306 (100.0%) |
| 12 to 14 Years | 306 (100.0%) | 88 (100.0%) |
| 15 Years | 52 (100.0%) | 14 (70.0%) |
| 16 and 17 Years | 100 (100.0%) | 188 (100.0%) |
| 18 to 24 Years | 129 (93.5%) | 239 (64.9%) |
| 25 to 34 Years | 453 (100.0%) | 430 (95.8%) |
| 35 to 44 Years | 857 (96.7%) | 858 (97.6%) |
| 45 to 54 Years | 772 (100.0%) | 554 (96.9%) |
| 55 to 64 Years | 624 (99.2%) | 645 (99.4%) |
| 65 to 74 Years | 367 (100.0%) | 385 (97.2%) |
| 75 Years and over | 180 (100.0%) | 214 (100.0%) |
| Total | 4,530 (99.1%) | 4,184 (95.0%) |
Income Below Poverty Among Married-Couple Families in Roxborough Park
The poverty statistics for married-couple families in Roxborough Park show that 0.2% or 4 of the total 2,475 families live below the poverty line. Families with no children have the highest poverty rate of 0.3%, comprising of 4 families. On the other hand, families with 1 or 2 children have the lowest poverty rate of 0.0%, which includes 0 families.
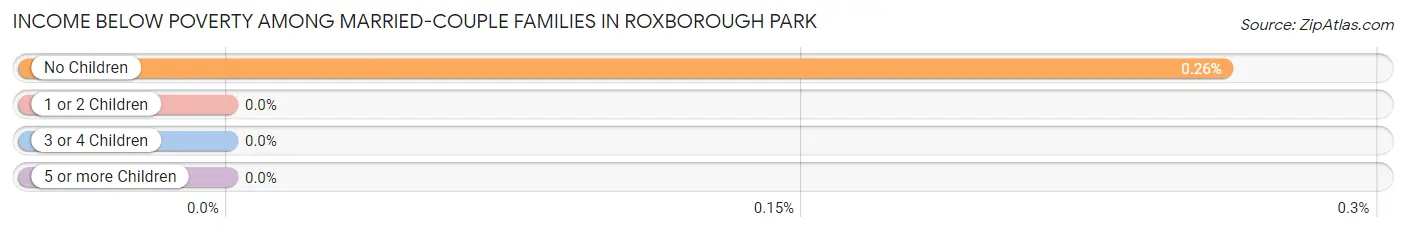
| Children | Above Poverty | Below Poverty |
| No Children | 1,526 (99.7%) | 4 (0.3%) |
| 1 or 2 Children | 724 (100.0%) | 0 (0.0%) |
| 3 or 4 Children | 221 (100.0%) | 0 (0.0%) |
| 5 or more Children | 0 (0.0%) | 0 (0.0%) |
| Total | 2,471 (99.8%) | 4 (0.2%) |
Income Below Poverty Among Single-Parent Households in Roxborough Park
According to the poverty data in Roxborough Park, 3.6% or 8 single-father households and 19.4% or 13 single-mother households are living below the poverty line. Among single-father households, those with 1 or 2 children have the highest poverty rate, with 8 households (4.9%) experiencing poverty. Likewise, among single-mother households, those with 1 or 2 children have the highest poverty rate, with 13 households (22.8%) falling below the poverty line.
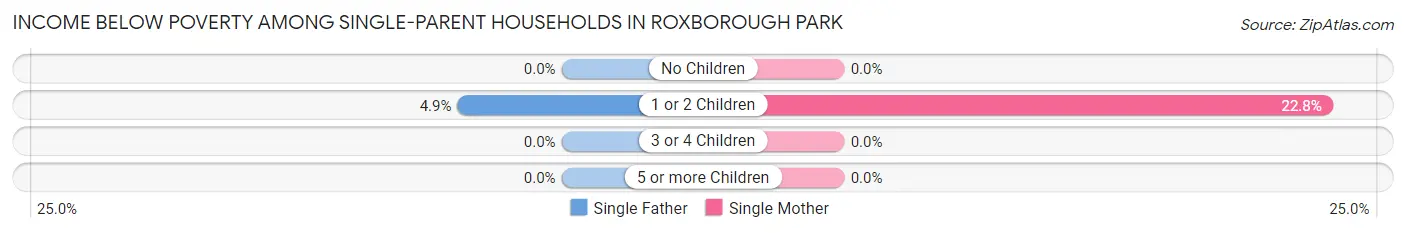
| Children | Single Father | Single Mother |
| No Children | 0 (0.0%) | 0 (0.0%) |
| 1 or 2 Children | 8 (4.9%) | 13 (22.8%) |
| 3 or 4 Children | 0 (0.0%) | 0 (0.0%) |
| 5 or more Children | 0 (0.0%) | 0 (0.0%) |
| Total | 8 (3.6%) | 13 (19.4%) |
Income Below Poverty Among Married-Couple vs Single-Parent Households in Roxborough Park
The poverty data for Roxborough Park shows that 4 of the married-couple family households (0.2%) and 21 of the single-parent households (7.2%) are living below the poverty level. Within the married-couple family households, those with no children have the highest poverty rate, with 4 households (0.3%) falling below the poverty line. Among the single-parent households, those with 1 or 2 children have the highest poverty rate, with 21 household (9.5%) living below poverty.
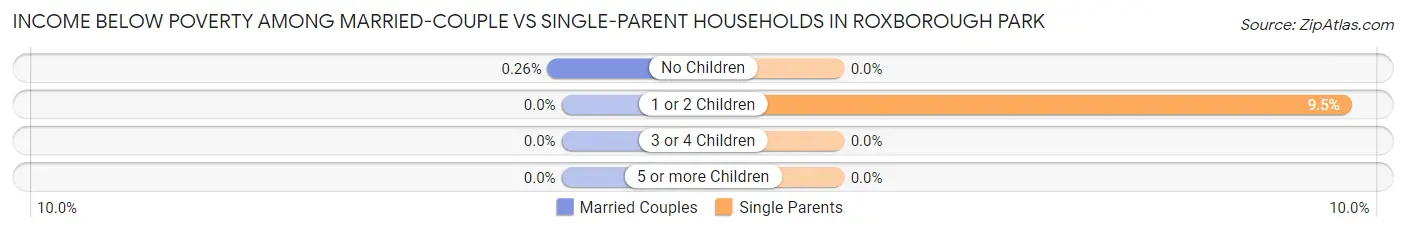
| Children | Married-Couple Families | Single-Parent Households |
| No Children | 4 (0.3%) | 0 (0.0%) |
| 1 or 2 Children | 0 (0.0%) | 21 (9.5%) |
| 3 or 4 Children | 0 (0.0%) | 0 (0.0%) |
| 5 or more Children | 0 (0.0%) | 0 (0.0%) |
| Total | 4 (0.2%) | 21 (7.2%) |
Race in Roxborough Park
The most populous races in Roxborough Park are White / Caucasian (7,683 | 84.8%), Hispanic or Latino (1,053 | 11.6%), and Two or more Races (986 | 10.9%).
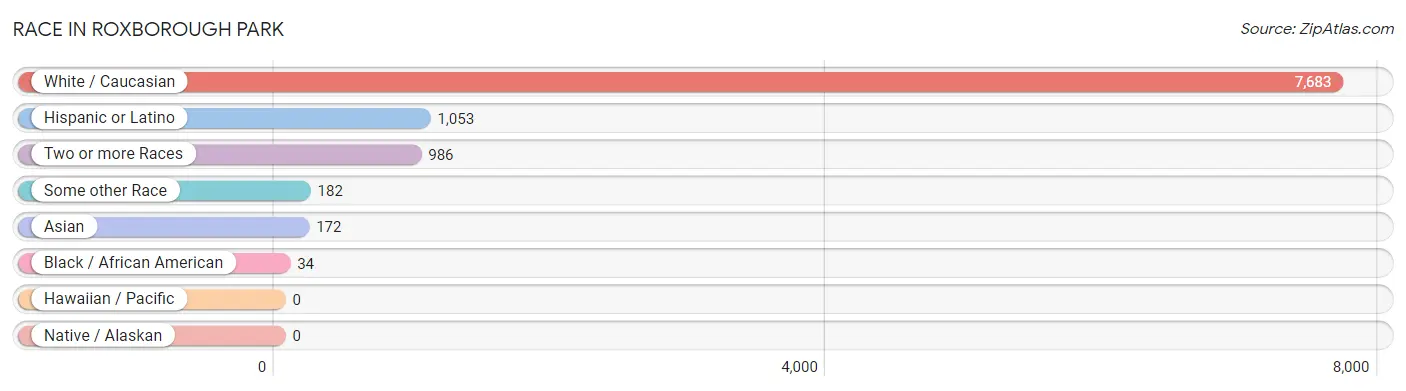
| Race | # Population | % Population |
| Asian | 172 | 1.9% |
| Black / African American | 34 | 0.4% |
| Hawaiian / Pacific | 0 | 0.0% |
| Hispanic or Latino | 1,053 | 11.6% |
| Native / Alaskan | 0 | 0.0% |
| White / Caucasian | 7,683 | 84.8% |
| Two or more Races | 986 | 10.9% |
| Some other Race | 182 | 2.0% |
| Total | 9,057 | 100.0% |
Ancestry in Roxborough Park
The most populous ancestries reported in Roxborough Park are German (2,184 | 24.1%), English (1,487 | 16.4%), Irish (974 | 10.7%), Scottish (815 | 9.0%), and Italian (784 | 8.7%), together accounting for 68.9% of all Roxborough Park residents.
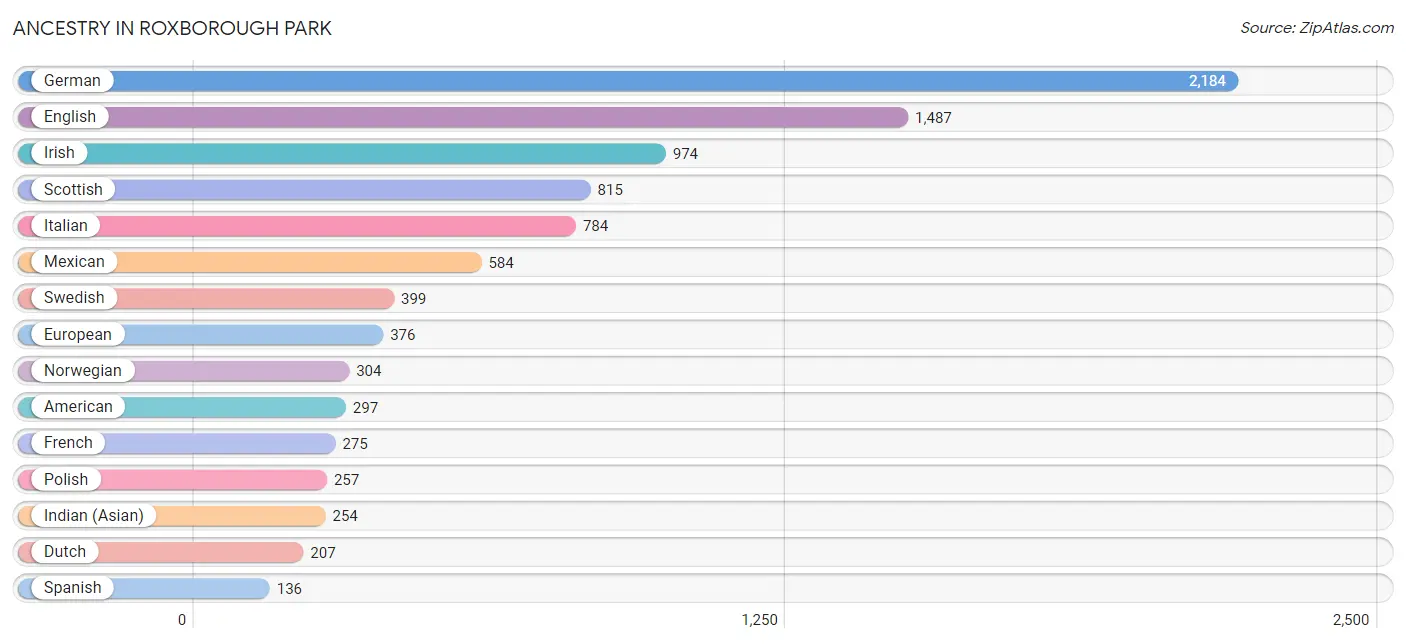
| Ancestry | # Population | % Population |
| American | 297 | 3.3% |
| Arab | 28 | 0.3% |
| Basque | 49 | 0.5% |
| Bhutanese | 64 | 0.7% |
| British | 20 | 0.2% |
| Burmese | 20 | 0.2% |
| Canadian | 19 | 0.2% |
| Central American | 93 | 1.0% |
| Cherokee | 7 | 0.1% |
| Chippewa | 5 | 0.1% |
| Choctaw | 19 | 0.2% |
| Costa Rican | 40 | 0.4% |
| Cuban | 54 | 0.6% |
| Czech | 95 | 1.1% |
| Danish | 86 | 0.9% |
| Dutch | 207 | 2.3% |
| Eastern European | 53 | 0.6% |
| English | 1,487 | 16.4% |
| European | 376 | 4.2% |
| Finnish | 22 | 0.2% |
| French | 275 | 3.0% |
| German | 2,184 | 24.1% |
| Greek | 59 | 0.6% |
| Hungarian | 25 | 0.3% |
| Indian (Asian) | 254 | 2.8% |
| Irish | 974 | 10.7% |
| Italian | 784 | 8.7% |
| Jamaican | 12 | 0.1% |
| Korean | 125 | 1.4% |
| Lithuanian | 6 | 0.1% |
| Mexican | 584 | 6.5% |
| Mexican American Indian | 11 | 0.1% |
| Navajo | 31 | 0.3% |
| Northern European | 31 | 0.3% |
| Norwegian | 304 | 3.4% |
| Pakistani | 10 | 0.1% |
| Palestinian | 6 | 0.1% |
| Panamanian | 53 | 0.6% |
| Pima | 9 | 0.1% |
| Polish | 257 | 2.8% |
| Puerto Rican | 25 | 0.3% |
| Romanian | 11 | 0.1% |
| Russian | 35 | 0.4% |
| Scandinavian | 32 | 0.4% |
| Scottish | 815 | 9.0% |
| Sioux | 13 | 0.1% |
| Spaniard | 78 | 0.9% |
| Spanish | 136 | 1.5% |
| Swedish | 399 | 4.4% |
| Swiss | 14 | 0.2% |
| Ute | 3 | 0.0% |
| Welsh | 94 | 1.0% | View All 52 Rows |
Immigrants in Roxborough Park
The most numerous immigrant groups reported in Roxborough Park came from Europe (161 | 1.8%), Southern Europe (91 | 1.0%), Asia (87 | 1.0%), Latin America (82 | 0.9%), and Spain (50 | 0.5%), together accounting for 5.2% of all Roxborough Park residents.
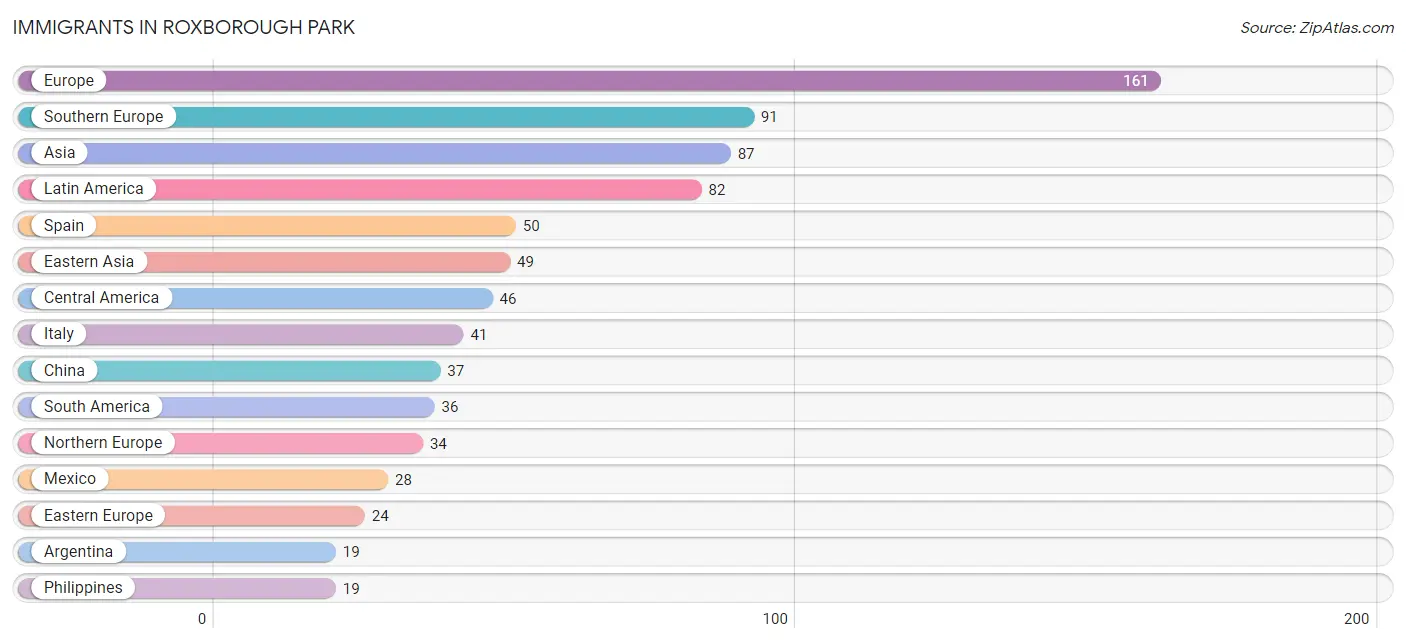
| Immigration Origin | # Population | % Population |
| Argentina | 19 | 0.2% |
| Asia | 87 | 1.0% |
| Australia | 11 | 0.1% |
| Belarus | 7 | 0.1% |
| Canada | 17 | 0.2% |
| Central America | 46 | 0.5% |
| China | 37 | 0.4% |
| Eastern Asia | 49 | 0.5% |
| Eastern Europe | 24 | 0.3% |
| Europe | 161 | 1.8% |
| Germany | 12 | 0.1% |
| Guyana | 17 | 0.2% |
| Hong Kong | 11 | 0.1% |
| Italy | 41 | 0.4% |
| Korea | 12 | 0.1% |
| Latin America | 82 | 0.9% |
| Mexico | 28 | 0.3% |
| Northern Europe | 34 | 0.4% |
| Oceania | 11 | 0.1% |
| Panama | 18 | 0.2% |
| Philippines | 19 | 0.2% |
| Poland | 17 | 0.2% |
| South America | 36 | 0.4% |
| South Central Asia | 19 | 0.2% |
| South Eastern Asia | 19 | 0.2% |
| Southern Europe | 91 | 1.0% |
| Spain | 50 | 0.5% |
| Uzbekistan | 19 | 0.2% |
| Western Europe | 12 | 0.1% | View All 29 Rows |
Sex and Age in Roxborough Park
Sex and Age in Roxborough Park
The most populous age groups in Roxborough Park are 10 to 14 Years (530 | 11.4%) for men and 40 to 44 Years (470 | 10.7%) for women.
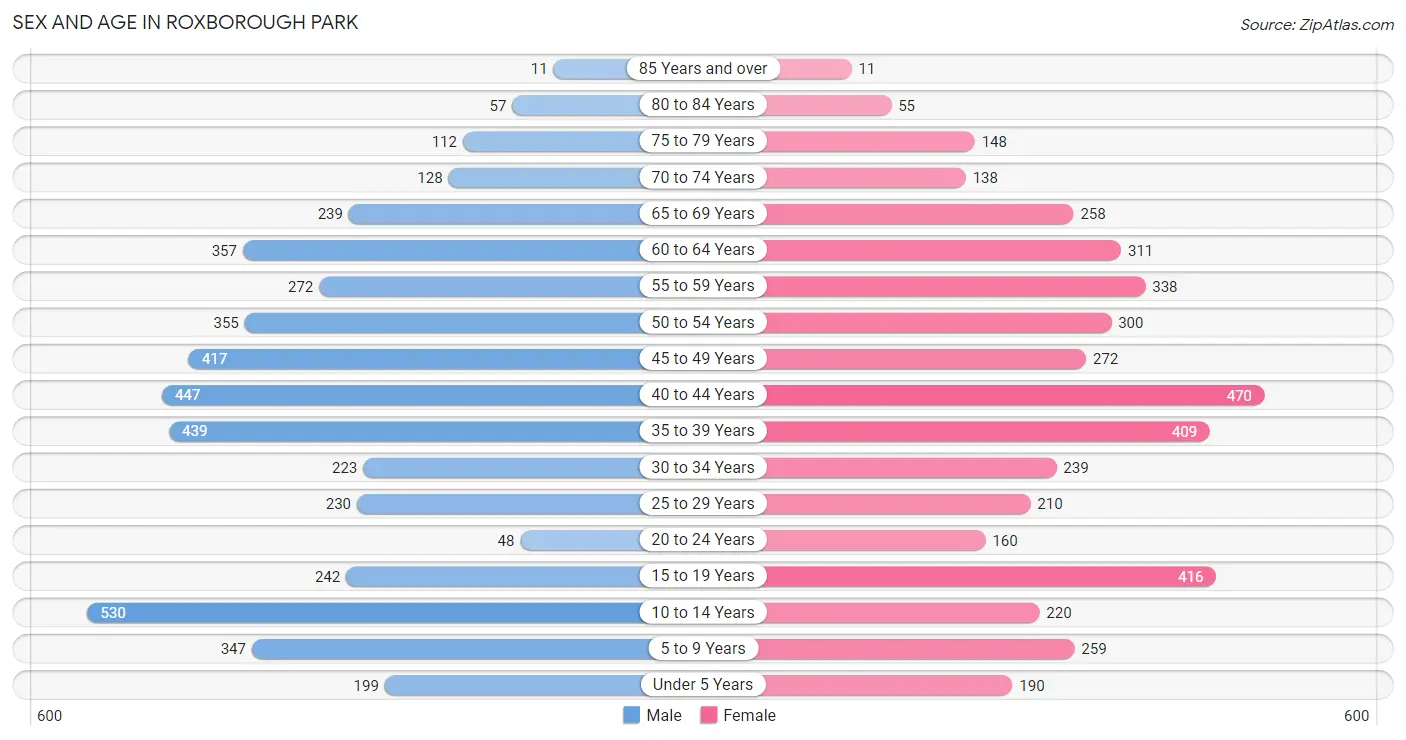
| Age Bracket | Male | Female |
| Under 5 Years | 199 (4.3%) | 190 (4.3%) |
| 5 to 9 Years | 347 (7.5%) | 259 (5.9%) |
| 10 to 14 Years | 530 (11.4%) | 220 (5.0%) |
| 15 to 19 Years | 242 (5.2%) | 416 (9.5%) |
| 20 to 24 Years | 48 (1.0%) | 160 (3.6%) |
| 25 to 29 Years | 230 (4.9%) | 210 (4.8%) |
| 30 to 34 Years | 223 (4.8%) | 239 (5.4%) |
| 35 to 39 Years | 439 (9.4%) | 409 (9.3%) |
| 40 to 44 Years | 447 (9.6%) | 470 (10.7%) |
| 45 to 49 Years | 417 (9.0%) | 272 (6.2%) |
| 50 to 54 Years | 355 (7.6%) | 300 (6.8%) |
| 55 to 59 Years | 272 (5.9%) | 338 (7.7%) |
| 60 to 64 Years | 357 (7.7%) | 311 (7.1%) |
| 65 to 69 Years | 239 (5.1%) | 258 (5.9%) |
| 70 to 74 Years | 128 (2.8%) | 138 (3.1%) |
| 75 to 79 Years | 112 (2.4%) | 148 (3.4%) |
| 80 to 84 Years | 57 (1.2%) | 55 (1.3%) |
| 85 Years and over | 11 (0.2%) | 11 (0.3%) |
| Total | 4,653 (100.0%) | 4,404 (100.0%) |
Families and Households in Roxborough Park
Median Family Size in Roxborough Park
The median family size in Roxborough Park is 2.90 persons per family, with married-couple families (2,475 | 89.5%) accounting for the largest median family size of 2.91 persons per family. On the other hand, single male/father families (224 | 8.1%) represent the smallest median family size with 2.74 persons per family.
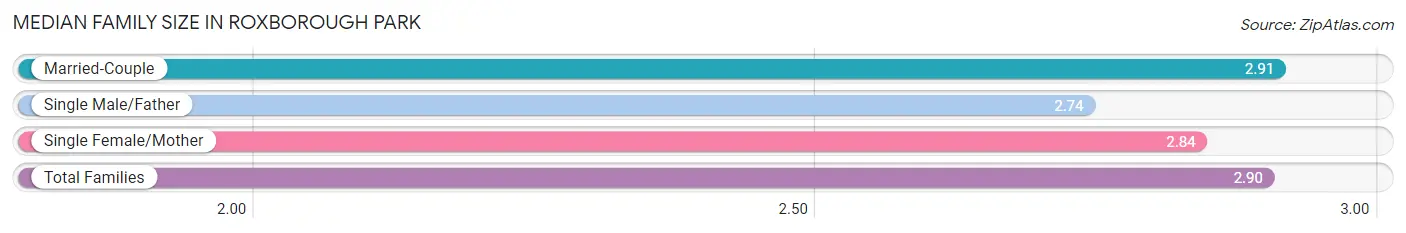
| Family Type | # Families | Family Size |
| Married-Couple | 2,475 (89.5%) | 2.91 |
| Single Male/Father | 224 (8.1%) | 2.74 |
| Single Female/Mother | 67 (2.4%) | 2.84 |
| Total Families | 2,766 (100.0%) | 2.90 |
Median Household Size in Roxborough Park
The median household size in Roxborough Park is 2.79 persons per household, with single male/father households (224 | 6.9%) accounting for the largest median household size of 4.21 persons per household. non-family households (482 | 14.8%) represent the smallest median household size with 1.40 persons per household.
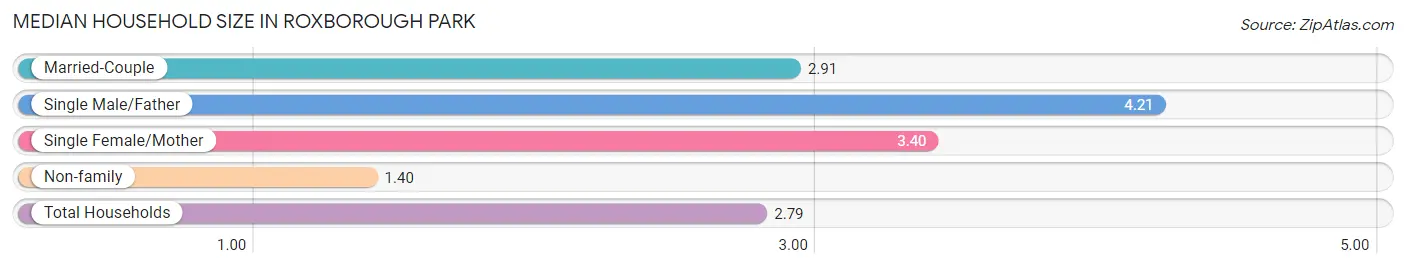
| Household Type | # Households | Household Size |
| Married-Couple | 2,475 (76.2%) | 2.91 |
| Single Male/Father | 224 (6.9%) | 4.21 |
| Single Female/Mother | 67 (2.1%) | 3.40 |
| Non-family | 482 (14.8%) | 1.40 |
| Total Households | 3,248 (100.0%) | 2.79 |
Household Size by Marriage Status in Roxborough Park
Out of a total of 3,248 households in Roxborough Park, 2,766 (85.2%) are family households, while 482 (14.8%) are nonfamily households. The most numerous type of family households are 2-person households, comprising 1,375, and the most common type of nonfamily households are 1-person households, comprising 322.
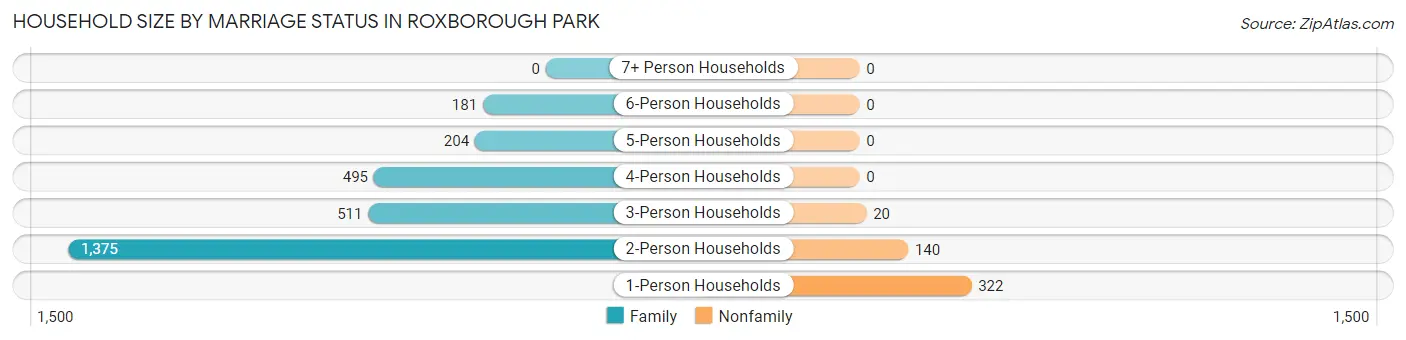
| Household Size | Family Households | Nonfamily Households |
| 1-Person Households | - | 322 (9.9%) |
| 2-Person Households | 1,375 (42.3%) | 140 (4.3%) |
| 3-Person Households | 511 (15.7%) | 20 (0.6%) |
| 4-Person Households | 495 (15.2%) | 0 (0.0%) |
| 5-Person Households | 204 (6.3%) | 0 (0.0%) |
| 6-Person Households | 181 (5.6%) | 0 (0.0%) |
| 7+ Person Households | 0 (0.0%) | 0 (0.0%) |
| Total | 2,766 (85.2%) | 482 (14.8%) |
Female Fertility in Roxborough Park
Fertility by Age in Roxborough Park
Average fertility rate in Roxborough Park is 48.0 births per 1,000 women. Women in the age bracket of 35 to 50 years have the highest fertility rate with 69.0 births per 1,000 women. Women in the age bracket of 35 to 50 years acount for 77.8% of all women with births.
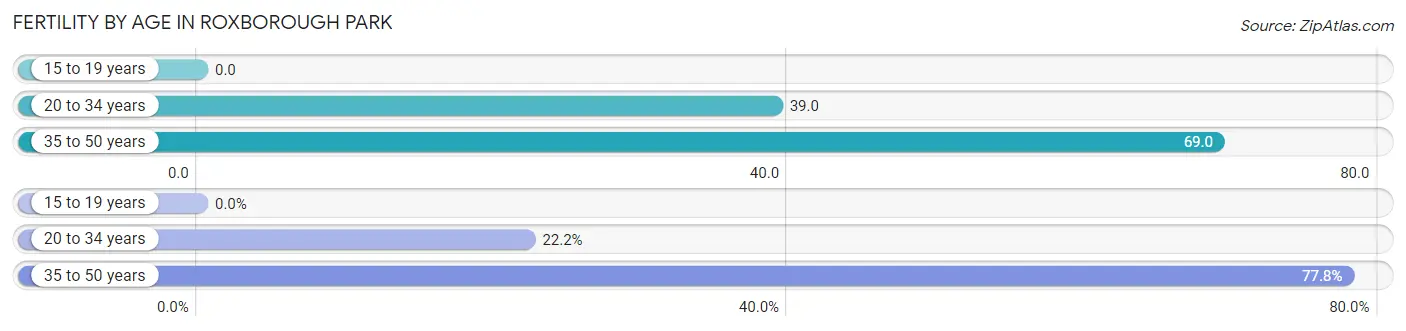
| Age Bracket | Women with Births | Births / 1,000 Women |
| 15 to 19 years | 0 (0.0%) | 0.0 |
| 20 to 34 years | 24 (22.2%) | 39.0 |
| 35 to 50 years | 84 (77.8%) | 69.0 |
| Total | 108 (100.0%) | 48.0 |
Fertility by Age by Marriage Status in Roxborough Park
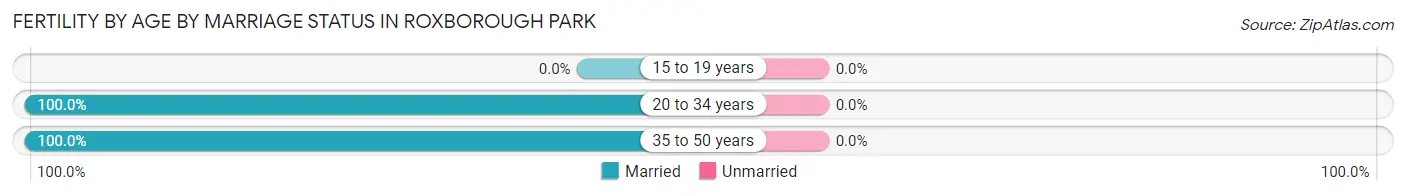
| Age Bracket | Married | Unmarried |
| 15 to 19 years | 0 (0.0%) | 0 (0.0%) |
| 20 to 34 years | 24 (100.0%) | 0 (0.0%) |
| 35 to 50 years | 84 (100.0%) | 0 (0.0%) |
| Total | 108 (100.0%) | 0 (0.0%) |
Fertility by Education in Roxborough Park
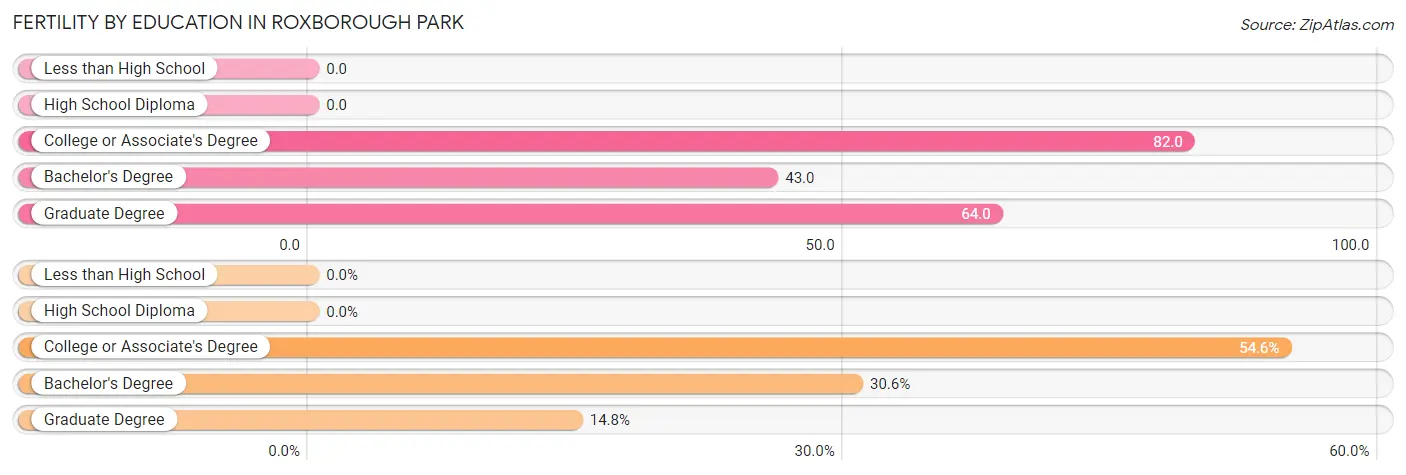
| Educational Attainment | Women with Births | Births / 1,000 Women |
| Less than High School | 0 (0.0%) | 0.0 |
| High School Diploma | 0 (0.0%) | 0.0 |
| College or Associate's Degree | 59 (54.6%) | 82.0 |
| Bachelor's Degree | 33 (30.6%) | 43.0 |
| Graduate Degree | 16 (14.8%) | 64.0 |
| Total | 108 (100.0%) | 48.0 |
Fertility by Education by Marriage Status in Roxborough Park
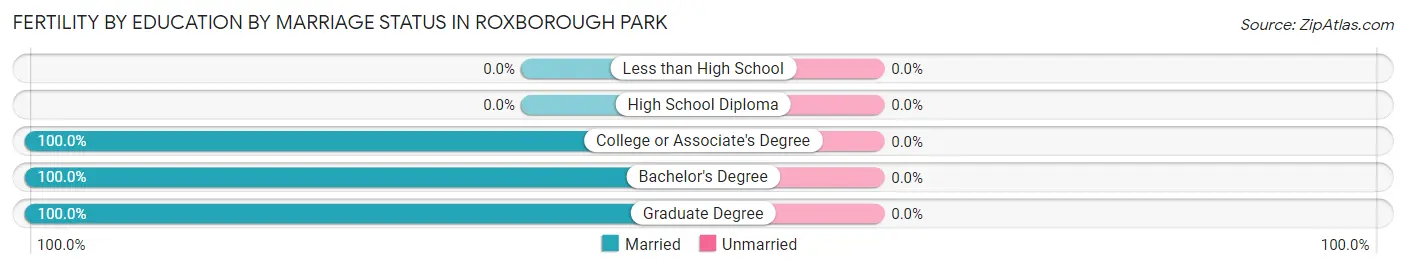
| Educational Attainment | Married | Unmarried |
| Less than High School | 0 (0.0%) | 0 (0.0%) |
| High School Diploma | 0 (0.0%) | 0 (0.0%) |
| College or Associate's Degree | 59 (100.0%) | 0 (0.0%) |
| Bachelor's Degree | 33 (100.0%) | 0 (0.0%) |
| Graduate Degree | 16 (100.0%) | 0 (0.0%) |
| Total | 108 (100.0%) | 0 (0.0%) |
Employment Characteristics in Roxborough Park
Employment by Class of Employer in Roxborough Park
Among the 4,648 employed individuals in Roxborough Park, private company employees (3,288 | 70.7%), local government employees (342 | 7.4%), and not-for-profit organizations (296 | 6.4%) make up the most common classes of employment.
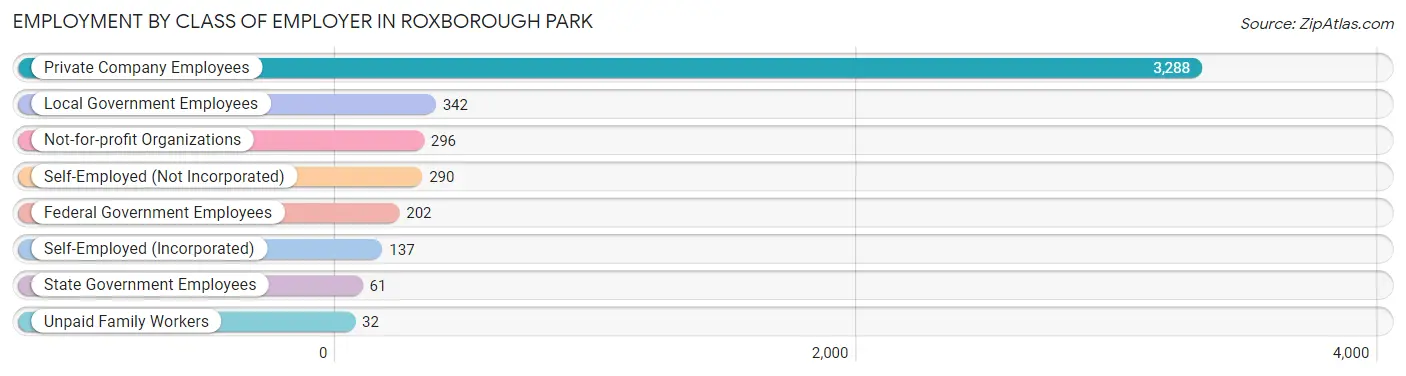
| Employer Class | # Employees | % Employees |
| Private Company Employees | 3,288 | 70.7% |
| Self-Employed (Incorporated) | 137 | 2.9% |
| Self-Employed (Not Incorporated) | 290 | 6.2% |
| Not-for-profit Organizations | 296 | 6.4% |
| Local Government Employees | 342 | 7.4% |
| State Government Employees | 61 | 1.3% |
| Federal Government Employees | 202 | 4.3% |
| Unpaid Family Workers | 32 | 0.7% |
| Total | 4,648 | 100.0% |
Employment Status by Age in Roxborough Park
According to the labor force statistics for Roxborough Park, out of the total population over 16 years of age (7,240), 65.9% or 4,771 individuals are in the labor force, with 1.1% or 52 of them unemployed. The age group with the highest labor force participation rate is 45 to 54 years, with 89.1% or 1,198 individuals in the labor force. Within the labor force, the 16 to 19 years age range has the highest percentage of unemployed individuals, with 10.4% or 14 of them being unemployed.
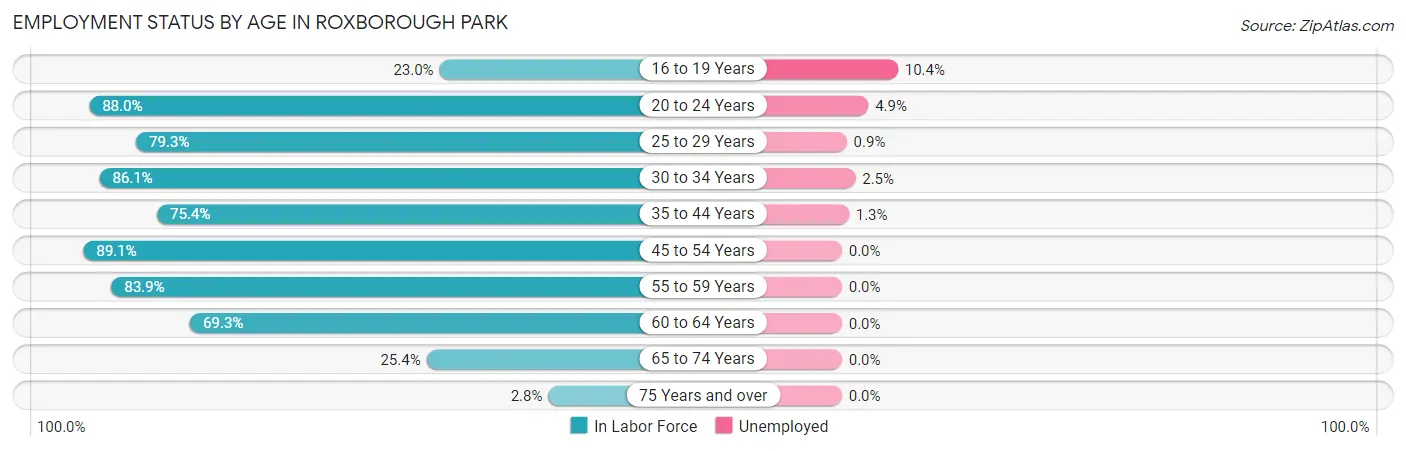
| Age Bracket | In Labor Force | Unemployed |
| 16 to 19 Years | 135 (23.0%) | 14 (10.4%) |
| 20 to 24 Years | 183 (88.0%) | 9 (4.9%) |
| 25 to 29 Years | 349 (79.3%) | 3 (0.9%) |
| 30 to 34 Years | 398 (86.1%) | 10 (2.5%) |
| 35 to 44 Years | 1,331 (75.4%) | 17 (1.3%) |
| 45 to 54 Years | 1,198 (89.1%) | 0 (0.0%) |
| 55 to 59 Years | 512 (83.9%) | 0 (0.0%) |
| 60 to 64 Years | 463 (69.3%) | 0 (0.0%) |
| 65 to 74 Years | 194 (25.4%) | 0 (0.0%) |
| 75 Years and over | 11 (2.8%) | 0 (0.0%) |
| Total | 4,771 (65.9%) | 52 (1.1%) |
Employment Status by Educational Attainment in Roxborough Park
According to labor force statistics for Roxborough Park, 80.3% of individuals (4,247) out of the total population between 25 and 64 years of age (5,289) are in the labor force, with 0.7% or 30 of them being unemployed. The group with the highest labor force participation rate are those with the educational attainment of bachelor's degree or higher, with 84.1% or 2,466 individuals in the labor force. Within the labor force, individuals with high school diploma education have the highest percentage of unemployment, with 3.5% or 14 of them being unemployed.
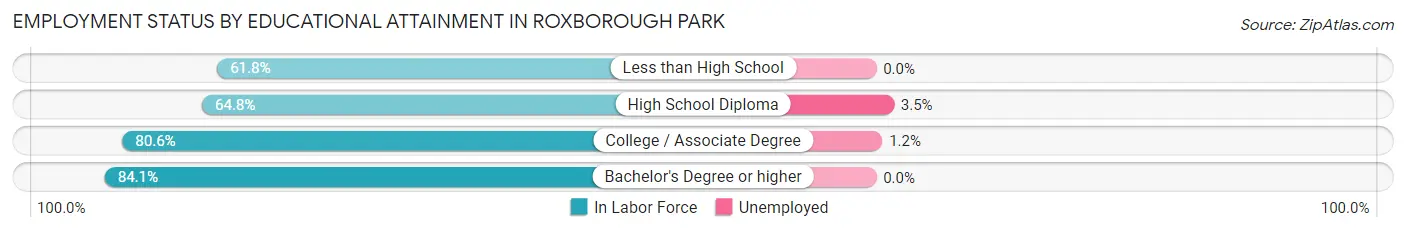
| Educational Attainment | In Labor Force | Unemployed |
| Less than High School | 63 (61.8%) | 0 (0.0%) |
| High School Diploma | 398 (64.8%) | 21 (3.5%) |
| College / Associate Degree | 1,323 (80.6%) | 20 (1.2%) |
| Bachelor's Degree or higher | 2,466 (84.1%) | 0 (0.0%) |
| Total | 4,247 (80.3%) | 37 (0.7%) |
Employment Occupations by Sex in Roxborough Park
Management, Business, Science and Arts Occupations
The most common Management, Business, Science and Arts occupations in Roxborough Park are Management (824 | 17.5%), Computers, Engineering & Science (665 | 14.1%), Community & Social Service (389 | 8.2%), Business & Financial (384 | 8.1%), and Computers & Mathematics (337 | 7.1%).
Management, Business, Science and Arts Occupations by Sex
Within the Management, Business, Science and Arts occupations in Roxborough Park, the most male-oriented occupations are Computers & Mathematics (87.8%), Computers, Engineering & Science (86.3%), and Life, Physical & Social Science (85.7%), while the most female-oriented occupations are Legal Services & Support (100.0%), Education Instruction & Library (97.1%), and Community & Social Service (88.2%).
| Occupation | Male | Female |
| Management | 438 (53.2%) | 386 (46.8%) |
| Business & Financial | 123 (32.0%) | 261 (68.0%) |
| Computers, Engineering & Science | 574 (86.3%) | 91 (13.7%) |
| Computers & Mathematics | 296 (87.8%) | 41 (12.2%) |
| Architecture & Engineering | 242 (84.6%) | 44 (15.4%) |
| Life, Physical & Social Science | 36 (85.7%) | 6 (14.3%) |
| Community & Social Service | 46 (11.8%) | 343 (88.2%) |
| Education, Arts & Media | 15 (50.0%) | 15 (50.0%) |
| Legal Services & Support | 0 (0.0%) | 22 (100.0%) |
| Education Instruction & Library | 8 (2.9%) | 265 (97.1%) |
| Arts, Media & Entertainment | 23 (35.9%) | 41 (64.1%) |
| Health Diagnosing & Treating | 48 (18.4%) | 213 (81.6%) |
| Health Technologists | 48 (19.7%) | 196 (80.3%) |
| Total (Category) | 1,229 (48.7%) | 1,294 (51.3%) |
| Total (Overall) | 2,532 (53.7%) | 2,187 (46.3%) |
Services Occupations
The most common Services occupations in Roxborough Park are Personal Care & Service (246 | 5.2%), Food Preparation & Serving (116 | 2.5%), Healthcare Support (98 | 2.1%), Security & Protection (80 | 1.7%), and Law Enforcement (62 | 1.3%).
Services Occupations by Sex
Within the Services occupations in Roxborough Park, the most male-oriented occupations are Firefighting & Prevention (100.0%), Cleaning & Maintenance (100.0%), and Security & Protection (86.3%), while the most female-oriented occupations are Food Preparation & Serving (81.9%), Personal Care & Service (80.1%), and Healthcare Support (75.5%).
| Occupation | Male | Female |
| Healthcare Support | 24 (24.5%) | 74 (75.5%) |
| Security & Protection | 69 (86.3%) | 11 (13.8%) |
| Firefighting & Prevention | 18 (100.0%) | 0 (0.0%) |
| Law Enforcement | 51 (82.3%) | 11 (17.7%) |
| Food Preparation & Serving | 21 (18.1%) | 95 (81.9%) |
| Cleaning & Maintenance | 5 (100.0%) | 0 (0.0%) |
| Personal Care & Service | 49 (19.9%) | 197 (80.1%) |
| Total (Category) | 168 (30.8%) | 377 (69.2%) |
| Total (Overall) | 2,532 (53.7%) | 2,187 (46.3%) |
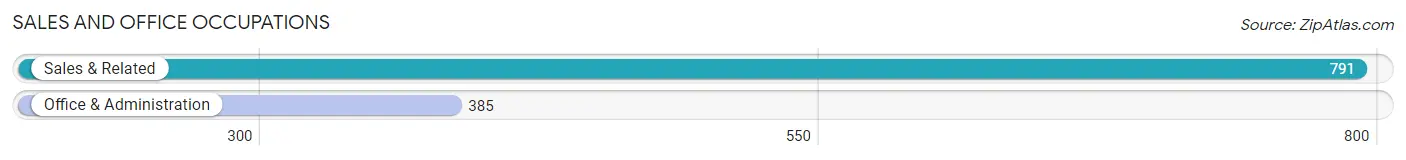
Sales and Office Occupations
The most common Sales and Office occupations in Roxborough Park are Sales & Related (791 | 16.8%), and Office & Administration (385 | 8.2%).
Sales and Office Occupations by Sex
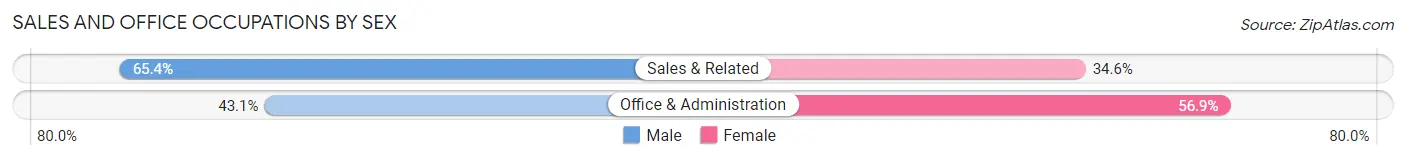
| Occupation | Male | Female |
| Sales & Related | 517 (65.4%) | 274 (34.6%) |
| Office & Administration | 166 (43.1%) | 219 (56.9%) |
| Total (Category) | 683 (58.1%) | 493 (41.9%) |
| Total (Overall) | 2,532 (53.7%) | 2,187 (46.3%) |
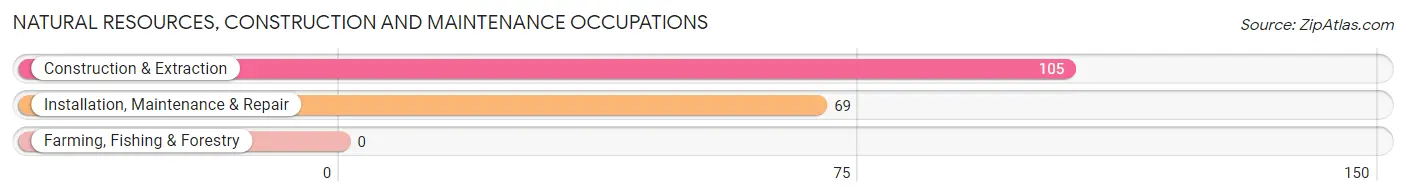
Natural Resources, Construction and Maintenance Occupations
The most common Natural Resources, Construction and Maintenance occupations in Roxborough Park are Construction & Extraction (105 | 2.2%), and Installation, Maintenance & Repair (69 | 1.5%).
Natural Resources, Construction and Maintenance Occupations by Sex
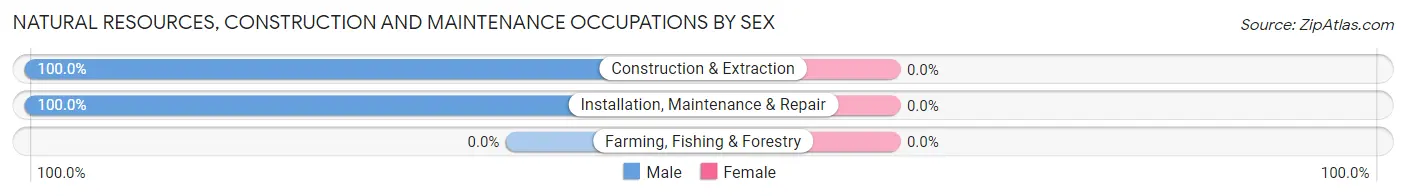
| Occupation | Male | Female |
| Farming, Fishing & Forestry | 0 (0.0%) | 0 (0.0%) |
| Construction & Extraction | 105 (100.0%) | 0 (0.0%) |
| Installation, Maintenance & Repair | 69 (100.0%) | 0 (0.0%) |
| Total (Category) | 174 (100.0%) | 0 (0.0%) |
| Total (Overall) | 2,532 (53.7%) | 2,187 (46.3%) |
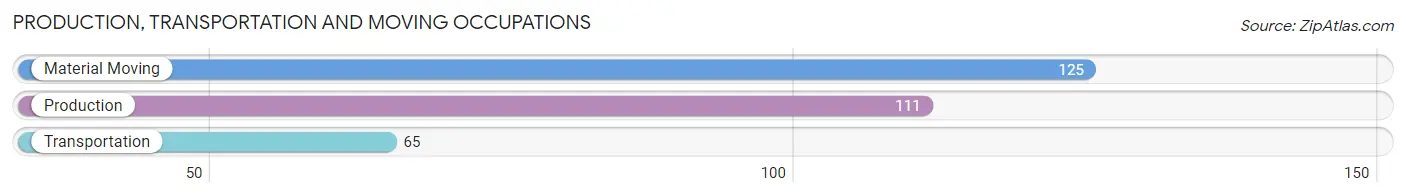
Production, Transportation and Moving Occupations
The most common Production, Transportation and Moving occupations in Roxborough Park are Material Moving (125 | 2.6%), Production (111 | 2.4%), and Transportation (65 | 1.4%).
Production, Transportation and Moving Occupations by Sex
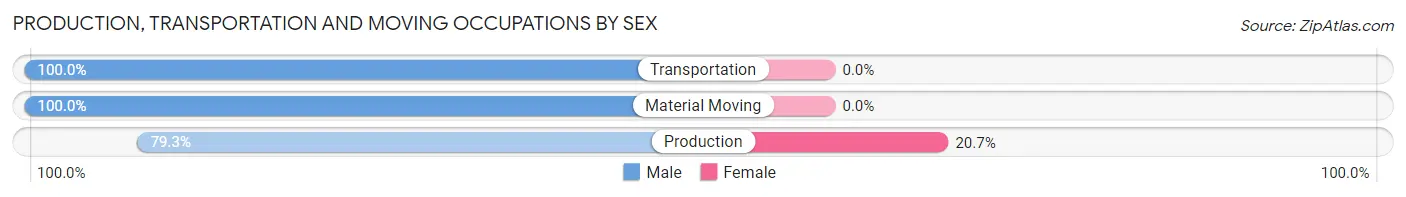
| Occupation | Male | Female |
| Production | 88 (79.3%) | 23 (20.7%) |
| Transportation | 65 (100.0%) | 0 (0.0%) |
| Material Moving | 125 (100.0%) | 0 (0.0%) |
| Total (Category) | 278 (92.4%) | 23 (7.6%) |
| Total (Overall) | 2,532 (53.7%) | 2,187 (46.3%) |
Employment Industries by Sex in Roxborough Park
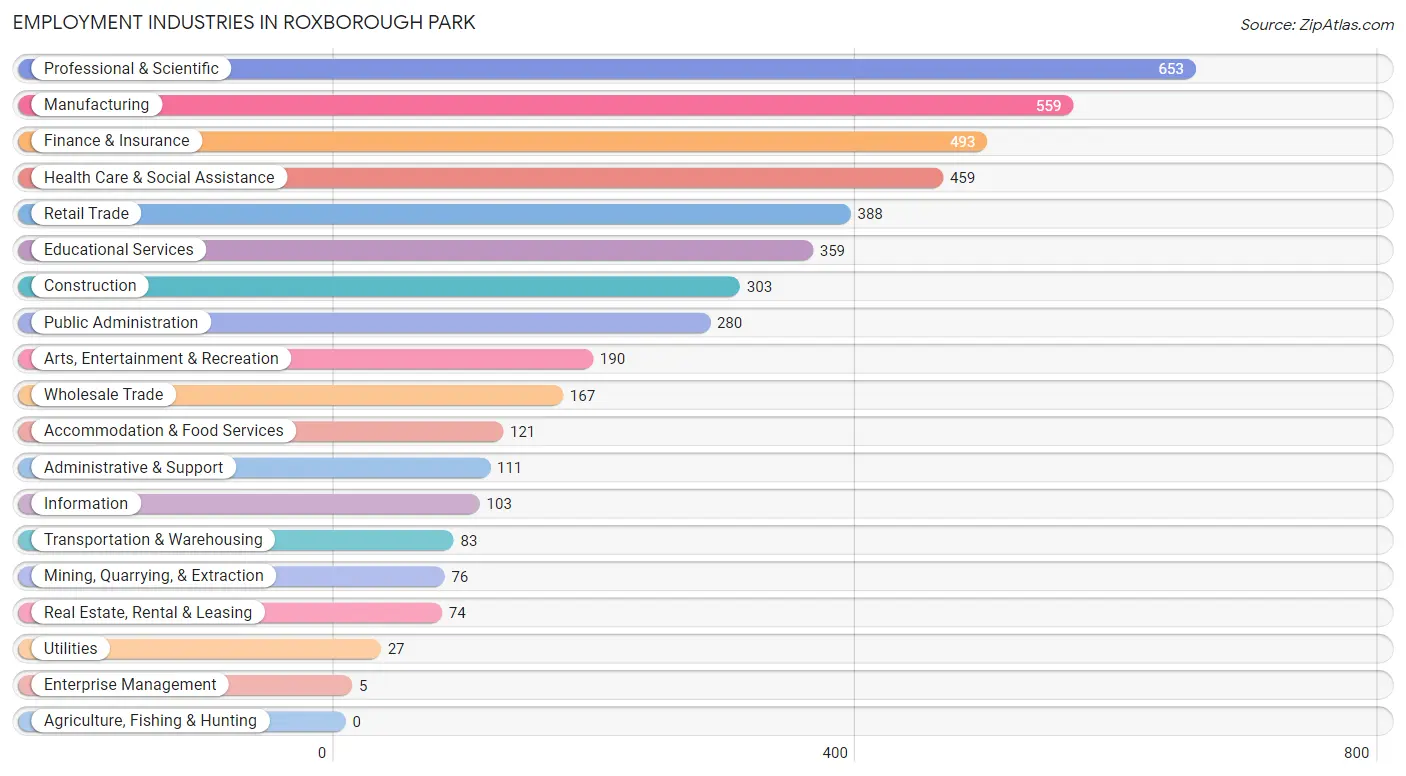
Employment Industries in Roxborough Park
The major employment industries in Roxborough Park include Professional & Scientific (653 | 13.8%), Manufacturing (559 | 11.8%), Finance & Insurance (493 | 10.4%), Health Care & Social Assistance (459 | 9.7%), and Retail Trade (388 | 8.2%).
Employment Industries by Sex in Roxborough Park
The Roxborough Park industries that see more men than women are Utilities (100.0%), Construction (90.1%), and Transportation & Warehousing (89.2%), whereas the industries that tend to have a higher number of women are Enterprise Management (100.0%), Educational Services (90.8%), and Mining, Quarrying, & Extraction (86.8%).
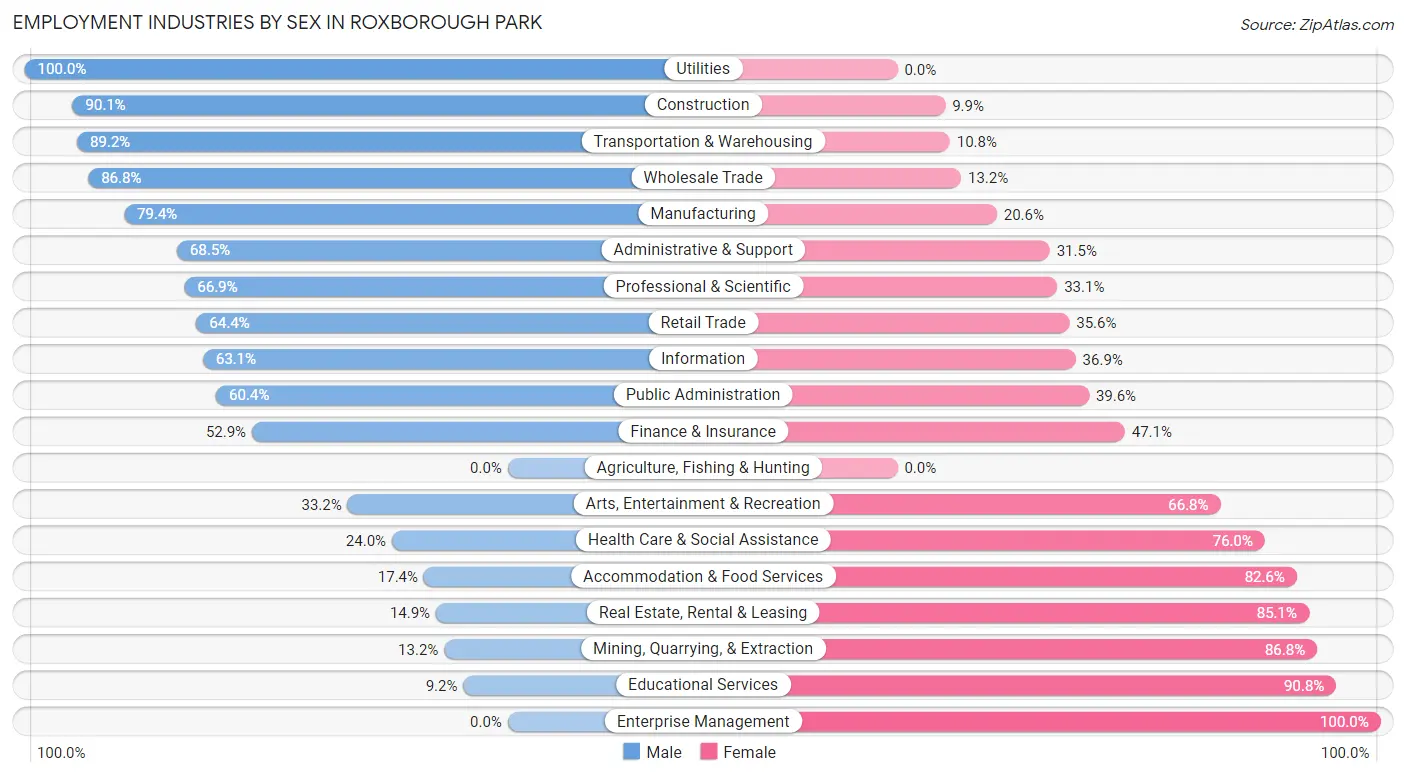
| Industry | Male | Female |
| Agriculture, Fishing & Hunting | 0 (0.0%) | 0 (0.0%) |
| Mining, Quarrying, & Extraction | 10 (13.2%) | 66 (86.8%) |
| Construction | 273 (90.1%) | 30 (9.9%) |
| Manufacturing | 444 (79.4%) | 115 (20.6%) |
| Wholesale Trade | 145 (86.8%) | 22 (13.2%) |
| Retail Trade | 250 (64.4%) | 138 (35.6%) |
| Transportation & Warehousing | 74 (89.2%) | 9 (10.8%) |
| Utilities | 27 (100.0%) | 0 (0.0%) |
| Information | 65 (63.1%) | 38 (36.9%) |
| Finance & Insurance | 261 (52.9%) | 232 (47.1%) |
| Real Estate, Rental & Leasing | 11 (14.9%) | 63 (85.1%) |
| Professional & Scientific | 437 (66.9%) | 216 (33.1%) |
| Enterprise Management | 0 (0.0%) | 5 (100.0%) |
| Administrative & Support | 76 (68.5%) | 35 (31.5%) |
| Educational Services | 33 (9.2%) | 326 (90.8%) |
| Health Care & Social Assistance | 110 (24.0%) | 349 (76.0%) |
| Arts, Entertainment & Recreation | 63 (33.2%) | 127 (66.8%) |
| Accommodation & Food Services | 21 (17.4%) | 100 (82.6%) |
| Public Administration | 169 (60.4%) | 111 (39.6%) |
| Total | 2,532 (53.7%) | 2,187 (46.3%) |
Education in Roxborough Park
School Enrollment in Roxborough Park
The most common levels of schooling among the 2,229 students in Roxborough Park are middle school (578 | 25.9%), elementary school (464 | 20.8%), and high school (456 | 20.5%).
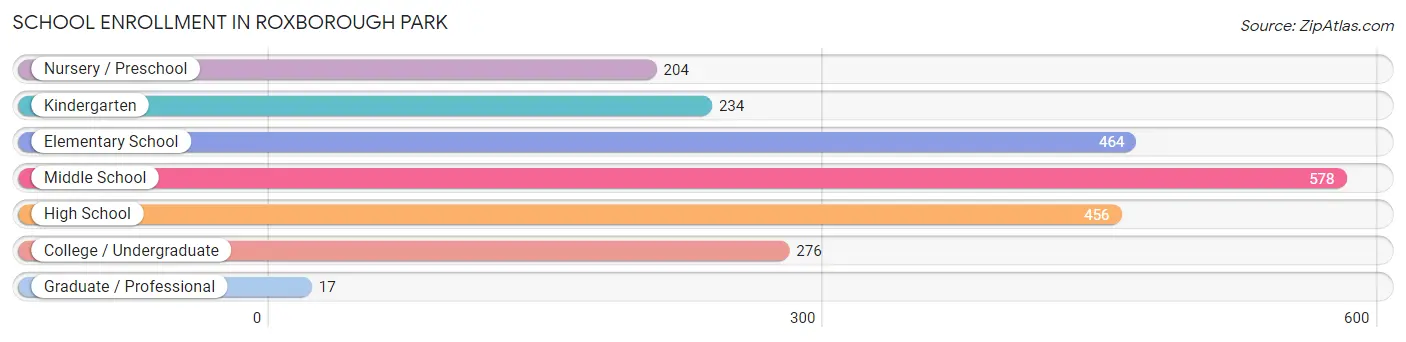
| School Level | # Students | % Students |
| Nursery / Preschool | 204 | 9.1% |
| Kindergarten | 234 | 10.5% |
| Elementary School | 464 | 20.8% |
| Middle School | 578 | 25.9% |
| High School | 456 | 20.5% |
| College / Undergraduate | 276 | 12.4% |
| Graduate / Professional | 17 | 0.8% |
| Total | 2,229 | 100.0% |
School Enrollment by Age by Funding Source in Roxborough Park
Out of a total of 2,229 students who are enrolled in schools in Roxborough Park, 399 (17.9%) attend a private institution, while the remaining 1,830 (82.1%) are enrolled in public schools. The age group of 3 to 4 year olds has the highest likelihood of being enrolled in private schools, with 99 (68.3% in the age bracket) enrolled. Conversely, the age group of 18 to 19 year olds has the lowest likelihood of being enrolled in a private school, with 186 (100.0% in the age bracket) attending a public institution.
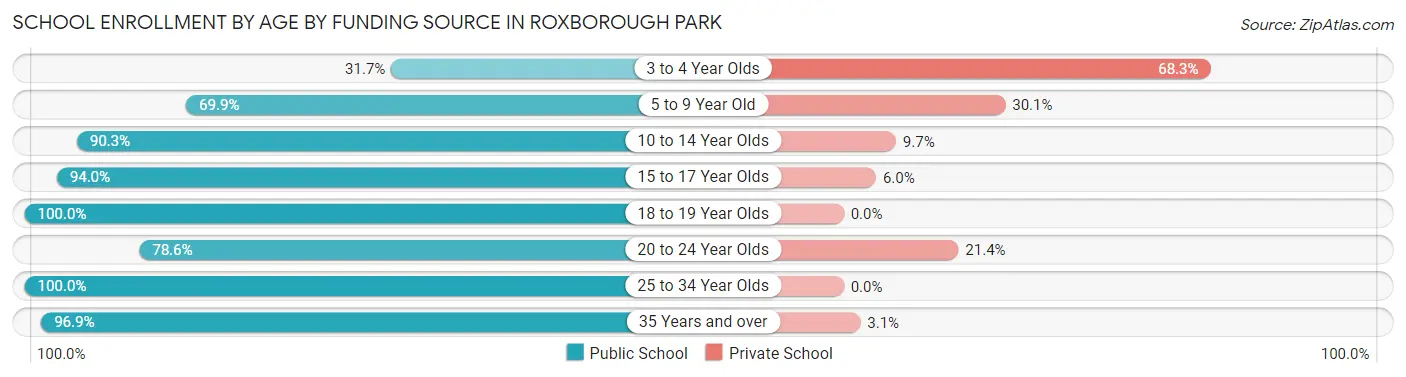
| Age Bracket | Public School | Private School |
| 3 to 4 Year Olds | 46 (31.7%) | 99 (68.3%) |
| 5 to 9 Year Old | 418 (69.9%) | 180 (30.1%) |
| 10 to 14 Year Olds | 677 (90.3%) | 73 (9.7%) |
| 15 to 17 Year Olds | 281 (94.0%) | 18 (6.0%) |
| 18 to 19 Year Olds | 186 (100.0%) | 0 (0.0%) |
| 20 to 24 Year Olds | 92 (78.6%) | 25 (21.4%) |
| 25 to 34 Year Olds | 5 (100.0%) | 0 (0.0%) |
| 35 Years and over | 125 (96.9%) | 4 (3.1%) |
| Total | 1,830 (82.1%) | 399 (17.9%) |
Educational Attainment by Field of Study in Roxborough Park
Business (779 | 19.3%), engineering (566 | 14.1%), arts & humanities (377 | 9.4%), science & technology (351 | 8.7%), and computers & mathematics (323 | 8.0%) are the most common fields of study among 4,029 individuals in Roxborough Park who have obtained a bachelor's degree or higher.
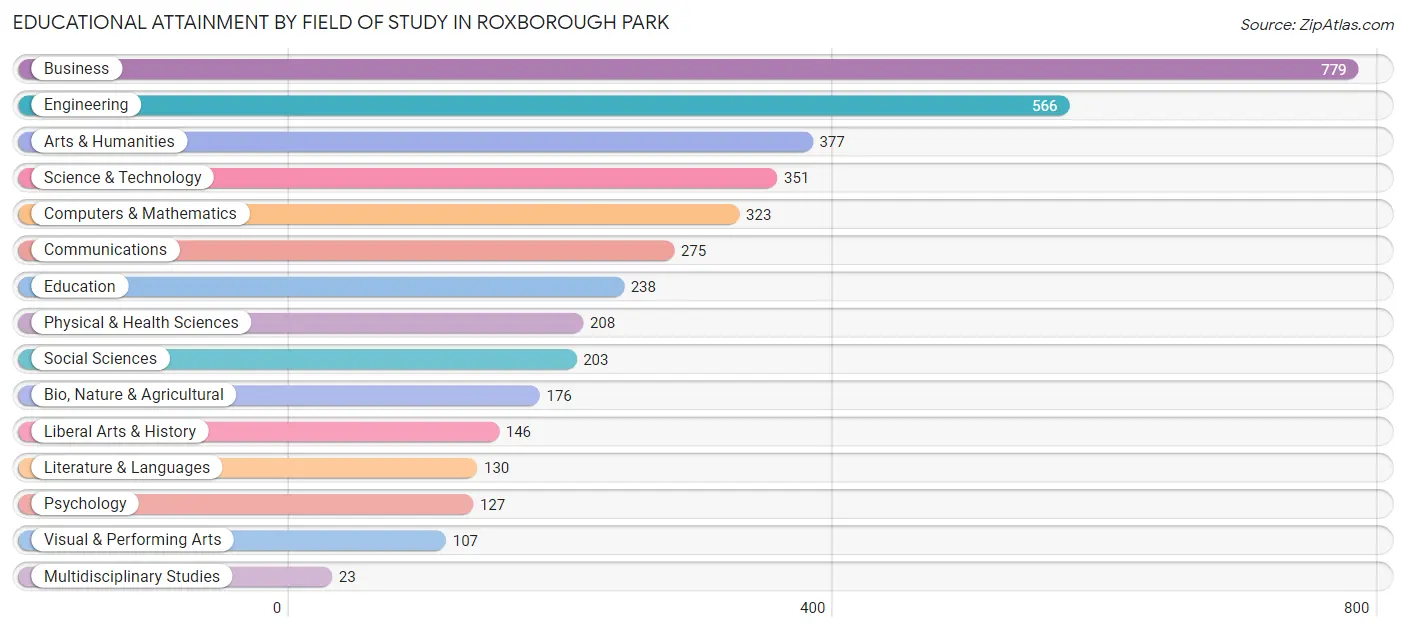
| Field of Study | # Graduates | % Graduates |
| Computers & Mathematics | 323 | 8.0% |
| Bio, Nature & Agricultural | 176 | 4.4% |
| Physical & Health Sciences | 208 | 5.2% |
| Psychology | 127 | 3.2% |
| Social Sciences | 203 | 5.0% |
| Engineering | 566 | 14.1% |
| Multidisciplinary Studies | 23 | 0.6% |
| Science & Technology | 351 | 8.7% |
| Business | 779 | 19.3% |
| Education | 238 | 5.9% |
| Literature & Languages | 130 | 3.2% |
| Liberal Arts & History | 146 | 3.6% |
| Visual & Performing Arts | 107 | 2.7% |
| Communications | 275 | 6.8% |
| Arts & Humanities | 377 | 9.4% |
| Total | 4,029 | 100.0% |
Transportation & Commute in Roxborough Park
Vehicle Availability by Sex in Roxborough Park
The most prevalent vehicle ownership categories in Roxborough Park are males with 2 vehicles (1,346, accounting for 53.6%) and females with 2 vehicles (1,081, making up 63.0%).
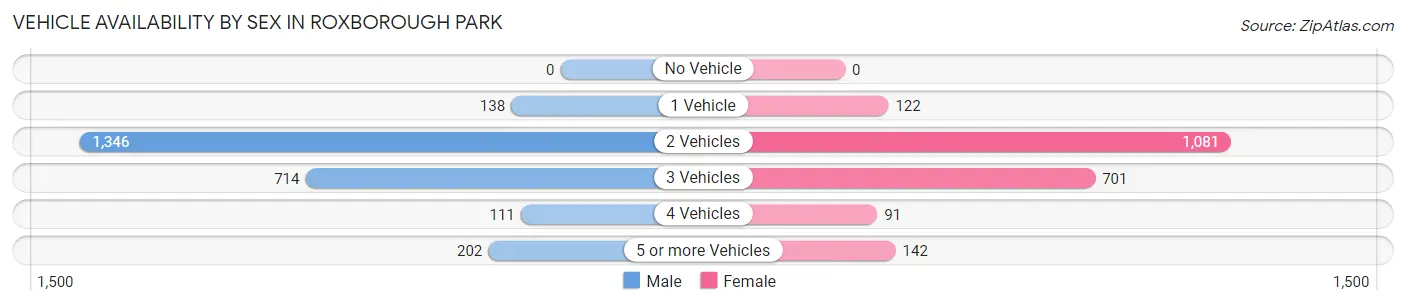
| Vehicles Available | Male | Female |
| No Vehicle | 0 (0.0%) | 0 (0.0%) |
| 1 Vehicle | 138 (5.5%) | 122 (5.7%) |
| 2 Vehicles | 1,346 (53.6%) | 1,081 (50.6%) |
| 3 Vehicles | 714 (28.4%) | 701 (32.8%) |
| 4 Vehicles | 111 (4.4%) | 91 (4.3%) |
| 5 or more Vehicles | 202 (8.0%) | 142 (6.6%) |
| Total | 2,511 (100.0%) | 2,137 (100.0%) |
Commute Time in Roxborough Park
The most frequently occuring commute durations in Roxborough Park are 45 to 59 minutes (643 commuters, 18.3%), 30 to 34 minutes (469 commuters, 13.4%), and 40 to 44 minutes (405 commuters, 11.5%).
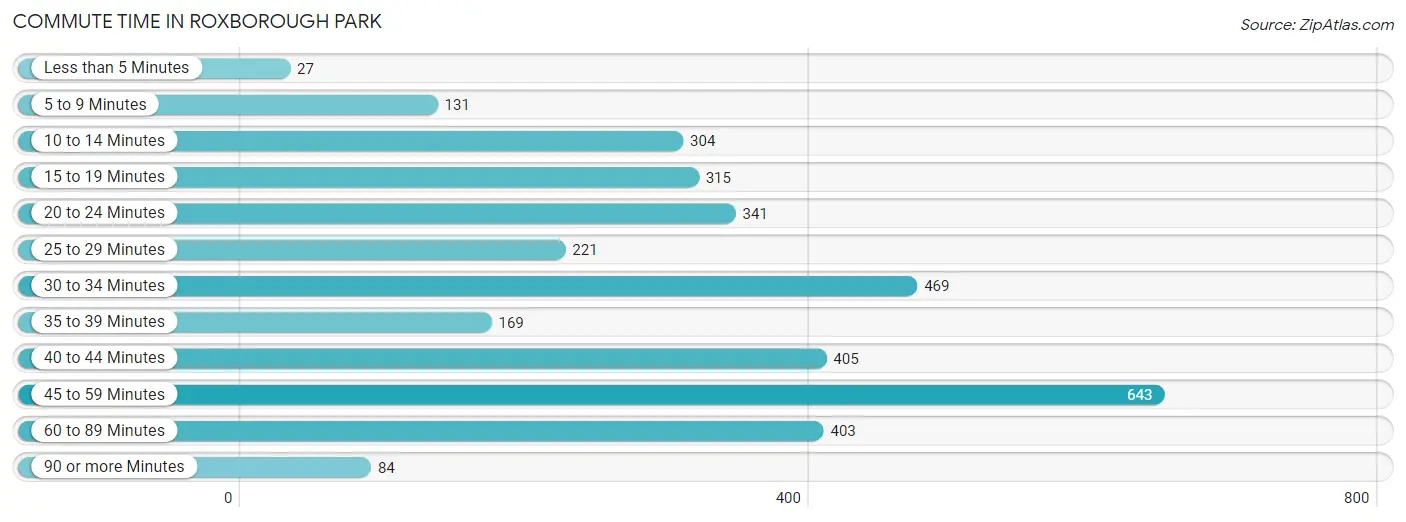
| Commute Time | # Commuters | % Commuters |
| Less than 5 Minutes | 27 | 0.8% |
| 5 to 9 Minutes | 131 | 3.7% |
| 10 to 14 Minutes | 304 | 8.7% |
| 15 to 19 Minutes | 315 | 9.0% |
| 20 to 24 Minutes | 341 | 9.7% |
| 25 to 29 Minutes | 221 | 6.3% |
| 30 to 34 Minutes | 469 | 13.4% |
| 35 to 39 Minutes | 169 | 4.8% |
| 40 to 44 Minutes | 405 | 11.5% |
| 45 to 59 Minutes | 643 | 18.3% |
| 60 to 89 Minutes | 403 | 11.5% |
| 90 or more Minutes | 84 | 2.4% |
Commute Time by Sex in Roxborough Park
The most common commute times in Roxborough Park are 60 to 89 minutes (300 commuters, 16.1%) for males and 45 to 59 minutes (358 commuters, 21.7%) for females.
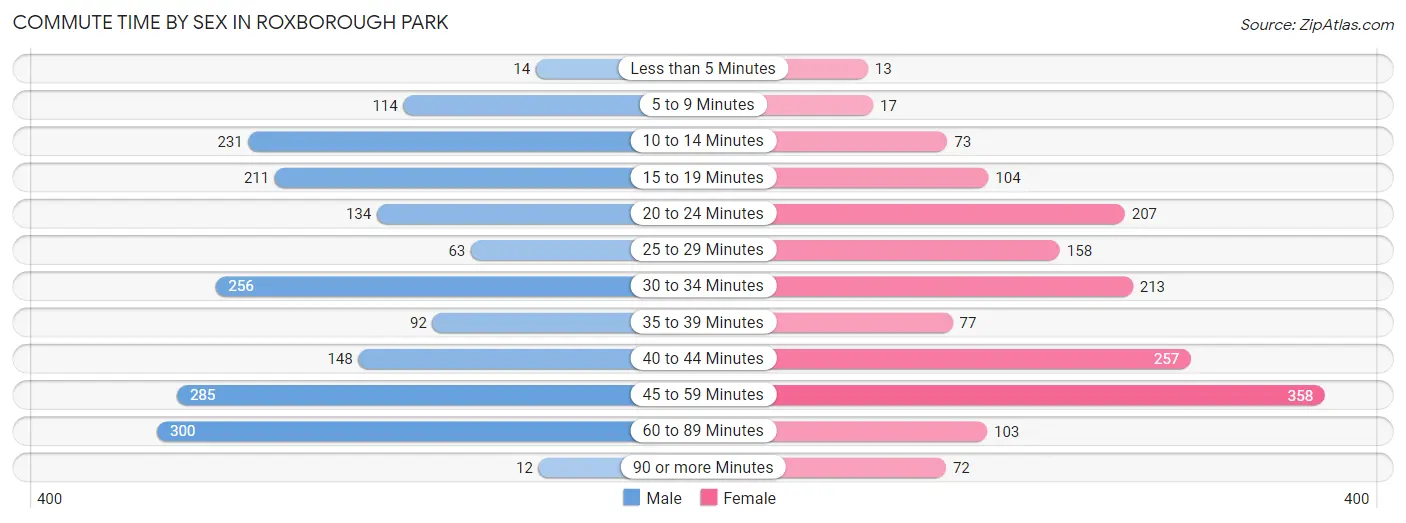
| Commute Time | Male | Female |
| Less than 5 Minutes | 14 (0.7%) | 13 (0.8%) |
| 5 to 9 Minutes | 114 (6.1%) | 17 (1.0%) |
| 10 to 14 Minutes | 231 (12.4%) | 73 (4.4%) |
| 15 to 19 Minutes | 211 (11.3%) | 104 (6.3%) |
| 20 to 24 Minutes | 134 (7.2%) | 207 (12.5%) |
| 25 to 29 Minutes | 63 (3.4%) | 158 (9.6%) |
| 30 to 34 Minutes | 256 (13.8%) | 213 (12.9%) |
| 35 to 39 Minutes | 92 (5.0%) | 77 (4.7%) |
| 40 to 44 Minutes | 148 (8.0%) | 257 (15.6%) |
| 45 to 59 Minutes | 285 (15.3%) | 358 (21.7%) |
| 60 to 89 Minutes | 300 (16.1%) | 103 (6.2%) |
| 90 or more Minutes | 12 (0.6%) | 72 (4.4%) |
Time of Departure to Work by Sex in Roxborough Park
The most frequent times of departure to work in Roxborough Park are 7:00 AM to 7:29 AM (374, 20.1%) for males and 6:00 AM to 6:29 AM (322, 19.5%) for females.
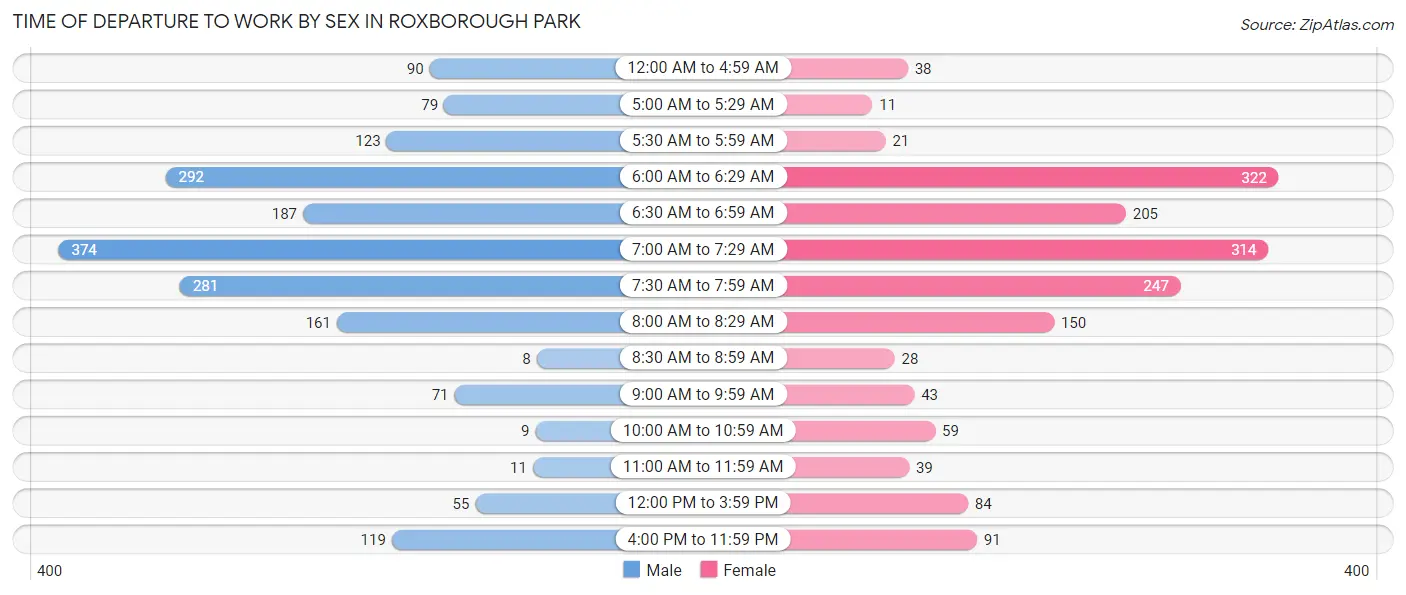
| Time of Departure | Male | Female |
| 12:00 AM to 4:59 AM | 90 (4.8%) | 38 (2.3%) |
| 5:00 AM to 5:29 AM | 79 (4.3%) | 11 (0.7%) |
| 5:30 AM to 5:59 AM | 123 (6.6%) | 21 (1.3%) |
| 6:00 AM to 6:29 AM | 292 (15.7%) | 322 (19.5%) |
| 6:30 AM to 6:59 AM | 187 (10.1%) | 205 (12.4%) |
| 7:00 AM to 7:29 AM | 374 (20.1%) | 314 (19.0%) |
| 7:30 AM to 7:59 AM | 281 (15.1%) | 247 (14.9%) |
| 8:00 AM to 8:29 AM | 161 (8.7%) | 150 (9.1%) |
| 8:30 AM to 8:59 AM | 8 (0.4%) | 28 (1.7%) |
| 9:00 AM to 9:59 AM | 71 (3.8%) | 43 (2.6%) |
| 10:00 AM to 10:59 AM | 9 (0.5%) | 59 (3.6%) |
| 11:00 AM to 11:59 AM | 11 (0.6%) | 39 (2.4%) |
| 12:00 PM to 3:59 PM | 55 (3.0%) | 84 (5.1%) |
| 4:00 PM to 11:59 PM | 119 (6.4%) | 91 (5.5%) |
| Total | 1,860 (100.0%) | 1,652 (100.0%) |
Housing Occupancy in Roxborough Park
Occupancy by Ownership in Roxborough Park
Of the total 3,248 dwellings in Roxborough Park, owner-occupied units account for 3,110 (95.8%), while renter-occupied units make up 138 (4.3%).
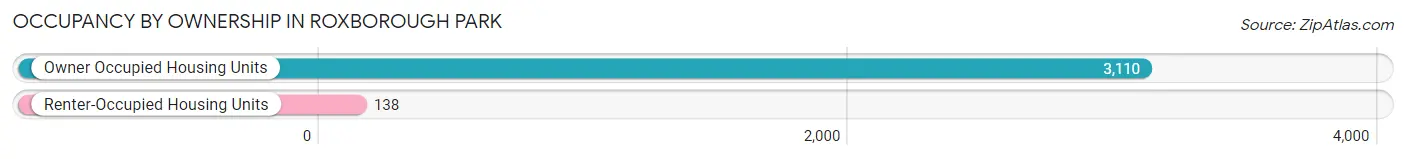
| Occupancy | # Housing Units | % Housing Units |
| Owner Occupied Housing Units | 3,110 | 95.8% |
| Renter-Occupied Housing Units | 138 | 4.3% |
| Total Occupied Housing Units | 3,248 | 100.0% |
Occupancy by Household Size in Roxborough Park
| Household Size | # Housing Units | % Housing Units |
| 1-Person Household | 322 | 9.9% |
| 2-Person Household | 1,515 | 46.6% |
| 3-Person Household | 531 | 16.4% |
| 4+ Person Household | 880 | 27.1% |
| Total Housing Units | 3,248 | 100.0% |
Occupancy by Ownership by Household Size in Roxborough Park
| Household Size | Owner-occupied | Renter-occupied |
| 1-Person Household | 314 (97.5%) | 8 (2.5%) |
| 2-Person Household | 1,504 (99.3%) | 11 (0.7%) |
| 3-Person Household | 485 (91.3%) | 46 (8.7%) |
| 4+ Person Household | 807 (91.7%) | 73 (8.3%) |
| Total Housing Units | 3,110 (95.8%) | 138 (4.3%) |
Occupancy by Educational Attainment in Roxborough Park
| Household Size | Owner-occupied | Renter-occupied |
| Less than High School | 27 (100.0%) | 0 (0.0%) |
| High School Diploma | 259 (100.0%) | 0 (0.0%) |
| College/Associate Degree | 750 (90.6%) | 78 (9.4%) |
| Bachelor's Degree or higher | 2,074 (97.2%) | 60 (2.8%) |
Occupancy by Age of Householder in Roxborough Park
| Age Bracket | # Households | % Households |
| Under 35 Years | 371 | 11.4% |
| 35 to 44 Years | 811 | 25.0% |
| 45 to 54 Years | 744 | 22.9% |
| 55 to 64 Years | 655 | 20.2% |
| 65 to 74 Years | 469 | 14.4% |
| 75 to 84 Years | 176 | 5.4% |
| 85 Years and Over | 22 | 0.7% |
| Total | 3,248 | 100.0% |
Housing Finances in Roxborough Park
Median Income by Occupancy in Roxborough Park
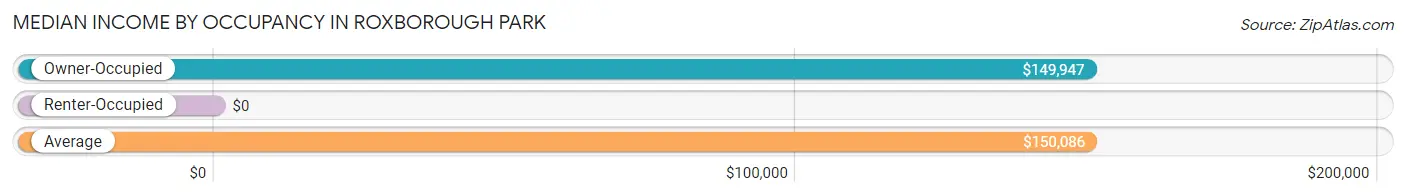
| Occupancy Type | # Households | Median Income |
| Owner-Occupied | 3,110 (95.8%) | $149,947 |
| Renter-Occupied | 138 (4.3%) | $0 |
| Average | 3,248 (100.0%) | $150,086 |
Occupancy by Householder Income Bracket in Roxborough Park
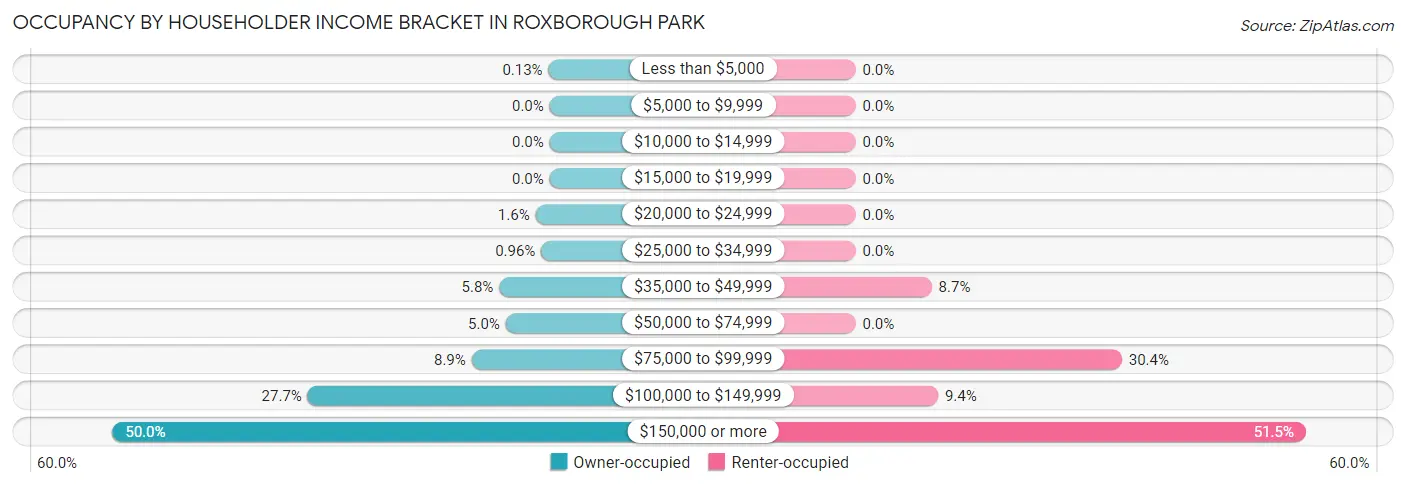
| Income Bracket | Owner-occupied | Renter-occupied |
| Less than $5,000 | 4 (0.1%) | 0 (0.0%) |
| $5,000 to $9,999 | 0 (0.0%) | 0 (0.0%) |
| $10,000 to $14,999 | 0 (0.0%) | 0 (0.0%) |
| $15,000 to $19,999 | 0 (0.0%) | 0 (0.0%) |
| $20,000 to $24,999 | 50 (1.6%) | 0 (0.0%) |
| $25,000 to $34,999 | 30 (1.0%) | 0 (0.0%) |
| $35,000 to $49,999 | 179 (5.8%) | 12 (8.7%) |
| $50,000 to $74,999 | 156 (5.0%) | 0 (0.0%) |
| $75,000 to $99,999 | 277 (8.9%) | 42 (30.4%) |
| $100,000 to $149,999 | 860 (27.7%) | 13 (9.4%) |
| $150,000 or more | 1,554 (50.0%) | 71 (51.4%) |
| Total | 3,110 (100.0%) | 138 (100.0%) |
Monthly Housing Cost Tiers in Roxborough Park
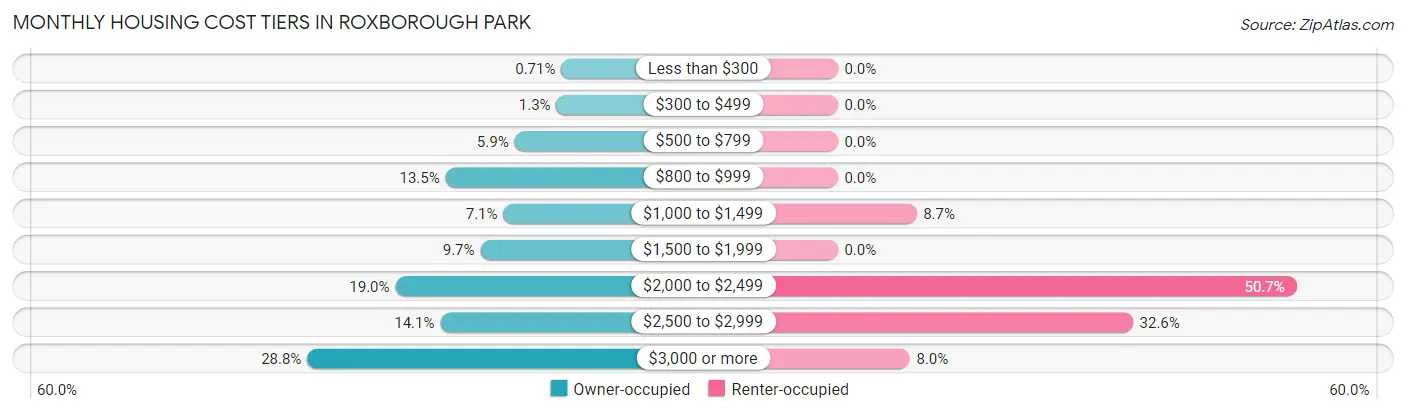
| Monthly Cost | Owner-occupied | Renter-occupied |
| Less than $300 | 22 (0.7%) | 0 (0.0%) |
| $300 to $499 | 39 (1.3%) | 0 (0.0%) |
| $500 to $799 | 183 (5.9%) | 0 (0.0%) |
| $800 to $999 | 420 (13.5%) | 0 (0.0%) |
| $1,000 to $1,499 | 221 (7.1%) | 12 (8.7%) |
| $1,500 to $1,999 | 300 (9.7%) | 0 (0.0%) |
| $2,000 to $2,499 | 592 (19.0%) | 70 (50.7%) |
| $2,500 to $2,999 | 438 (14.1%) | 45 (32.6%) |
| $3,000 or more | 895 (28.8%) | 11 (8.0%) |
| Total | 3,110 (100.0%) | 138 (100.0%) |
Physical Housing Characteristics in Roxborough Park
Housing Structures in Roxborough Park
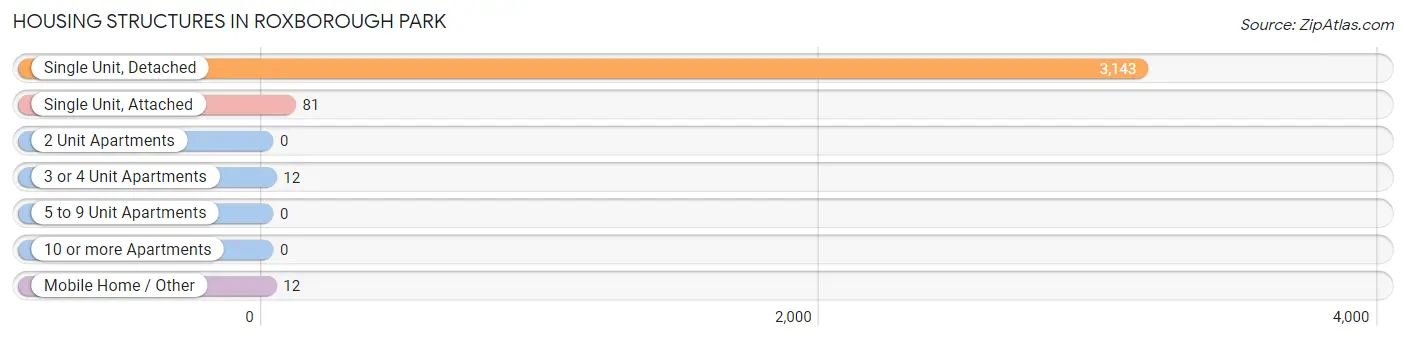
| Structure Type | # Housing Units | % Housing Units |
| Single Unit, Detached | 3,143 | 96.8% |
| Single Unit, Attached | 81 | 2.5% |
| 2 Unit Apartments | 0 | 0.0% |
| 3 or 4 Unit Apartments | 12 | 0.4% |
| 5 to 9 Unit Apartments | 0 | 0.0% |
| 10 or more Apartments | 0 | 0.0% |
| Mobile Home / Other | 12 | 0.4% |
| Total | 3,248 | 100.0% |
Housing Structures by Occupancy in Roxborough Park
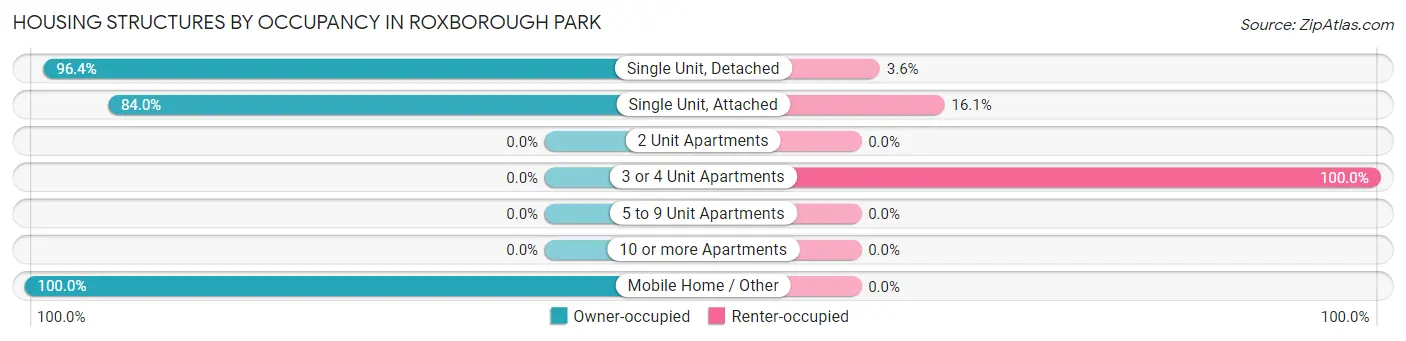
| Structure Type | Owner-occupied | Renter-occupied |
| Single Unit, Detached | 3,030 (96.4%) | 113 (3.6%) |
| Single Unit, Attached | 68 (84.0%) | 13 (16.1%) |
| 2 Unit Apartments | 0 (0.0%) | 0 (0.0%) |
| 3 or 4 Unit Apartments | 0 (0.0%) | 12 (100.0%) |
| 5 to 9 Unit Apartments | 0 (0.0%) | 0 (0.0%) |
| 10 or more Apartments | 0 (0.0%) | 0 (0.0%) |
| Mobile Home / Other | 12 (100.0%) | 0 (0.0%) |
| Total | 3,110 (95.8%) | 138 (4.3%) |
Housing Structures by Number of Rooms in Roxborough Park
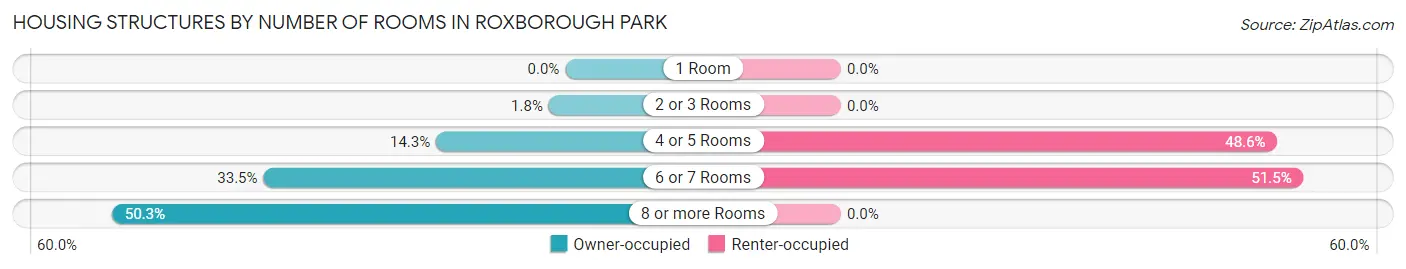
| Number of Rooms | Owner-occupied | Renter-occupied |
| 1 Room | 0 (0.0%) | 0 (0.0%) |
| 2 or 3 Rooms | 57 (1.8%) | 0 (0.0%) |
| 4 or 5 Rooms | 446 (14.3%) | 67 (48.5%) |
| 6 or 7 Rooms | 1,042 (33.5%) | 71 (51.4%) |
| 8 or more Rooms | 1,565 (50.3%) | 0 (0.0%) |
| Total | 3,110 (100.0%) | 138 (100.0%) |
Housing Structure by Heating Type in Roxborough Park
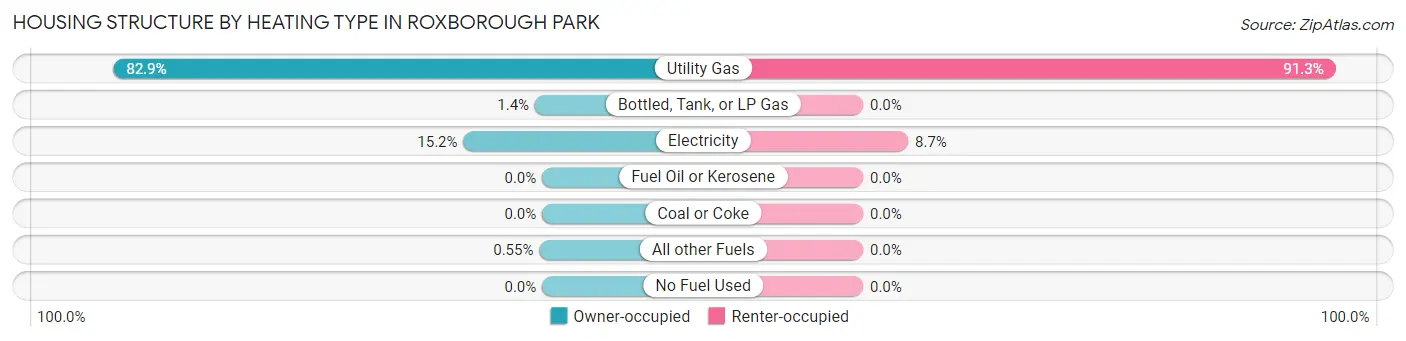
| Heating Type | Owner-occupied | Renter-occupied |
| Utility Gas | 2,577 (82.9%) | 126 (91.3%) |
| Bottled, Tank, or LP Gas | 43 (1.4%) | 0 (0.0%) |
| Electricity | 473 (15.2%) | 12 (8.7%) |
| Fuel Oil or Kerosene | 0 (0.0%) | 0 (0.0%) |
| Coal or Coke | 0 (0.0%) | 0 (0.0%) |
| All other Fuels | 17 (0.5%) | 0 (0.0%) |
| No Fuel Used | 0 (0.0%) | 0 (0.0%) |
| Total | 3,110 (100.0%) | 138 (100.0%) |
Household Vehicle Usage in Roxborough Park
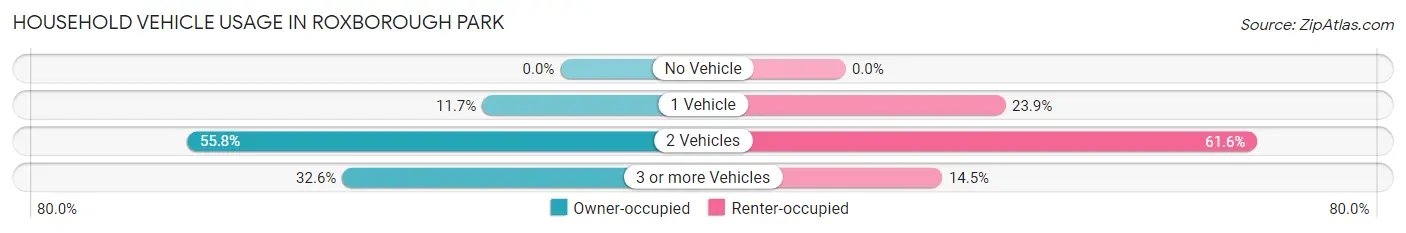
| Vehicles per Household | Owner-occupied | Renter-occupied |
| No Vehicle | 0 (0.0%) | 0 (0.0%) |
| 1 Vehicle | 363 (11.7%) | 33 (23.9%) |
| 2 Vehicles | 1,734 (55.8%) | 85 (61.6%) |
| 3 or more Vehicles | 1,013 (32.6%) | 20 (14.5%) |
| Total | 3,110 (100.0%) | 138 (100.0%) |
Real Estate & Mortgages in Roxborough Park
Real Estate and Mortgage Overview in Roxborough Park
| Characteristic | Without Mortgage | With Mortgage |
| Housing Units | 720 | 2,390 |
| Median Property Value | $671,200 | $538,700 |
| Median Household Income | $118,500 | $1,301 |
| Monthly Housing Costs | $867 | $874 |
| Real Estate Taxes | $4,411 | $98 |
Property Value by Mortgage Status in Roxborough Park
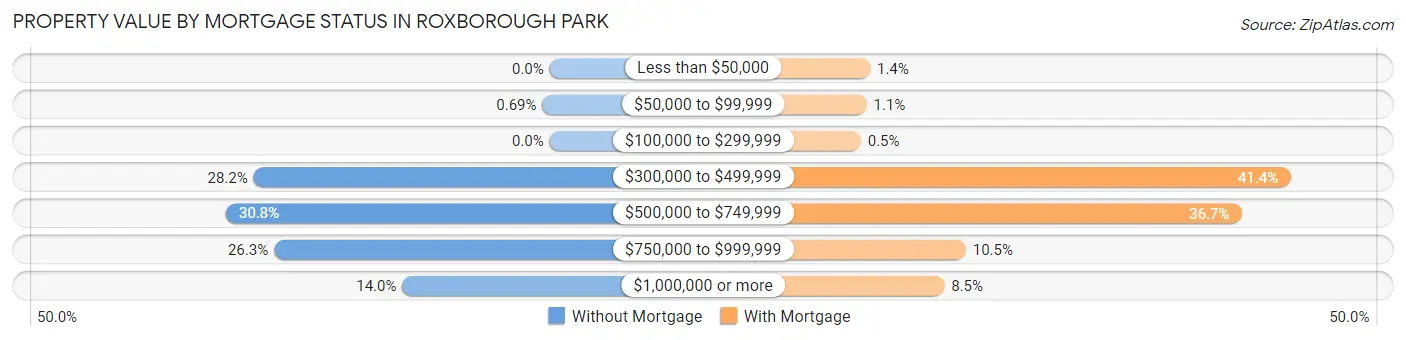
| Property Value | Without Mortgage | With Mortgage |
| Less than $50,000 | 0 (0.0%) | 33 (1.4%) |
| $50,000 to $99,999 | 5 (0.7%) | 25 (1.1%) |
| $100,000 to $299,999 | 0 (0.0%) | 12 (0.5%) |
| $300,000 to $499,999 | 203 (28.2%) | 989 (41.4%) |
| $500,000 to $749,999 | 222 (30.8%) | 878 (36.7%) |
| $750,000 to $999,999 | 189 (26.3%) | 251 (10.5%) |
| $1,000,000 or more | 101 (14.0%) | 202 (8.5%) |
| Total | 720 (100.0%) | 2,390 (100.0%) |
Household Income by Mortgage Status in Roxborough Park
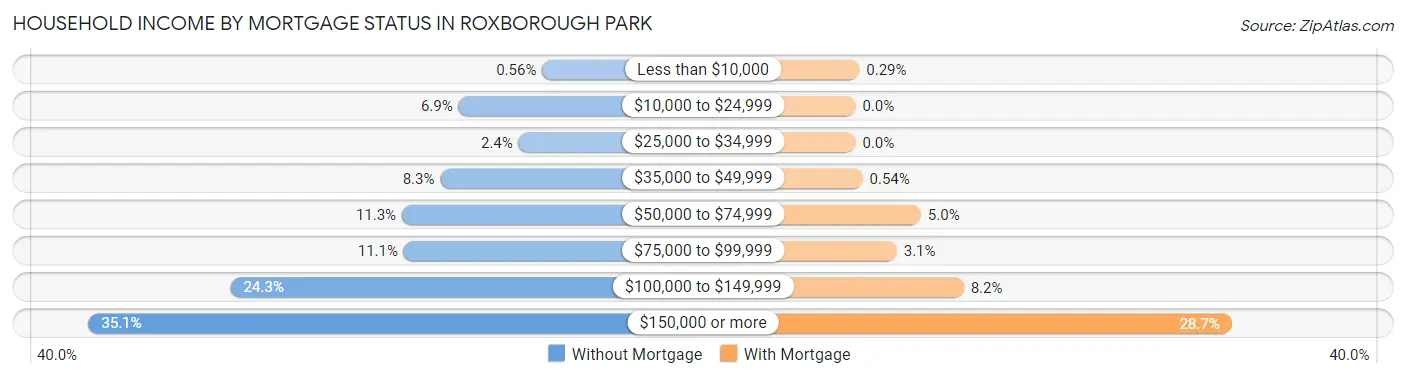
| Household Income | Without Mortgage | With Mortgage |
| Less than $10,000 | 4 (0.6%) | 7 (0.3%) |
| $10,000 to $24,999 | 50 (6.9%) | 0 (0.0%) |
| $25,000 to $34,999 | 17 (2.4%) | 0 (0.0%) |
| $35,000 to $49,999 | 60 (8.3%) | 13 (0.5%) |
| $50,000 to $74,999 | 81 (11.3%) | 119 (5.0%) |
| $75,000 to $99,999 | 80 (11.1%) | 75 (3.1%) |
| $100,000 to $149,999 | 175 (24.3%) | 197 (8.2%) |
| $150,000 or more | 253 (35.1%) | 685 (28.7%) |
| Total | 720 (100.0%) | 2,390 (100.0%) |
Property Value to Household Income Ratio in Roxborough Park
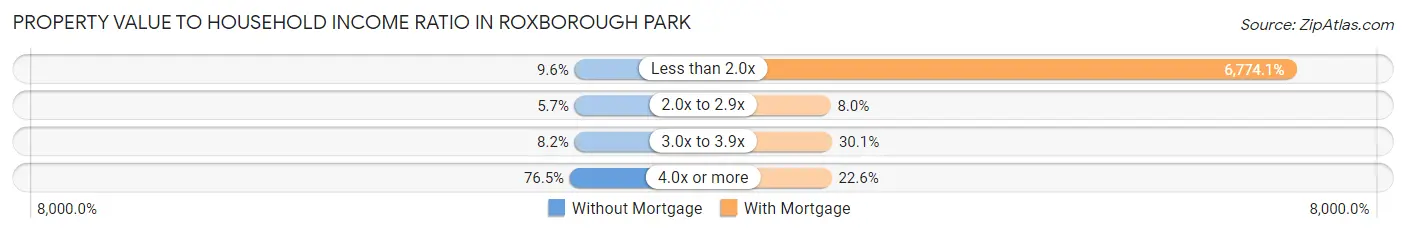
| Value-to-Income Ratio | Without Mortgage | With Mortgage |
| Less than 2.0x | 69 (9.6%) | 161,902 (6,774.1%) |
| 2.0x to 2.9x | 41 (5.7%) | 191 (8.0%) |
| 3.0x to 3.9x | 59 (8.2%) | 720 (30.1%) |
| 4.0x or more | 551 (76.5%) | 539 (22.6%) |
| Total | 720 (100.0%) | 2,390 (100.0%) |
Real Estate Taxes by Mortgage Status in Roxborough Park
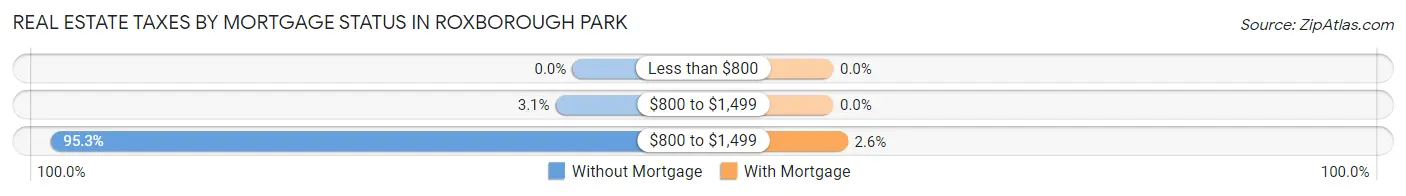
| Property Taxes | Without Mortgage | With Mortgage |
| Less than $800 | 0 (0.0%) | 0 (0.0%) |
| $800 to $1,499 | 22 (3.1%) | 0 (0.0%) |
| $800 to $1,499 | 686 (95.3%) | 63 (2.6%) |
| Total | 720 (100.0%) | 2,390 (100.0%) |
Health & Disability in Roxborough Park
Health Insurance Coverage by Age in Roxborough Park
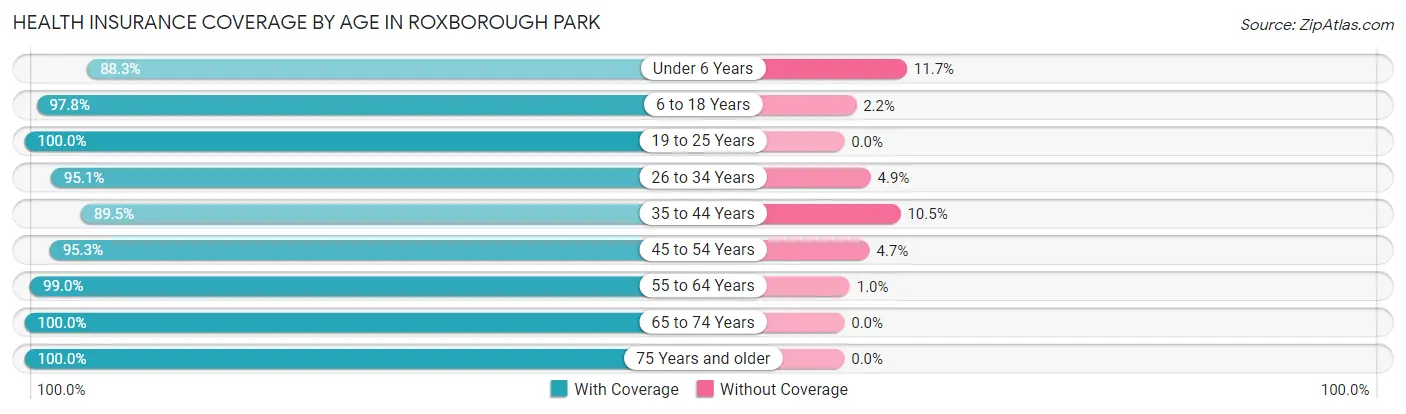
| Age Bracket | With Coverage | Without Coverage |
| Under 6 Years | 484 (88.3%) | 64 (11.7%) |
| 6 to 18 Years | 1,672 (97.8%) | 38 (2.2%) |
| 19 to 25 Years | 380 (100.0%) | 0 (0.0%) |
| 26 to 34 Years | 832 (95.1%) | 43 (4.9%) |
| 35 to 44 Years | 1,580 (89.5%) | 185 (10.5%) |
| 45 to 54 Years | 1,281 (95.3%) | 63 (4.7%) |
| 55 to 64 Years | 1,265 (99.0%) | 13 (1.0%) |
| 65 to 74 Years | 763 (100.0%) | 0 (0.0%) |
| 75 Years and older | 394 (100.0%) | 0 (0.0%) |
| Total | 8,651 (95.5%) | 406 (4.5%) |
Health Insurance Coverage by Citizenship Status in Roxborough Park
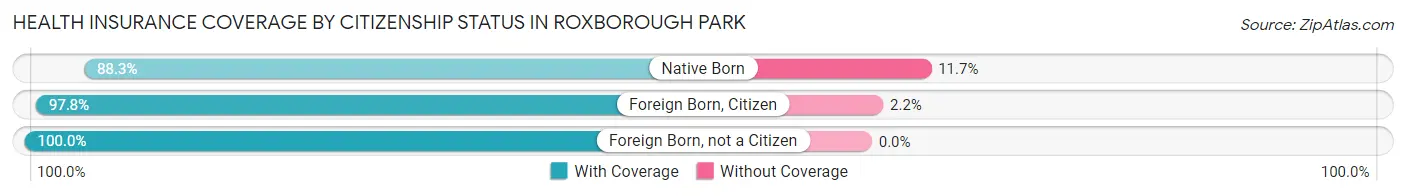
| Citizenship Status | With Coverage | Without Coverage |
| Native Born | 484 (88.3%) | 64 (11.7%) |
| Foreign Born, Citizen | 1,672 (97.8%) | 38 (2.2%) |
| Foreign Born, not a Citizen | 380 (100.0%) | 0 (0.0%) |
Health Insurance Coverage by Household Income in Roxborough Park
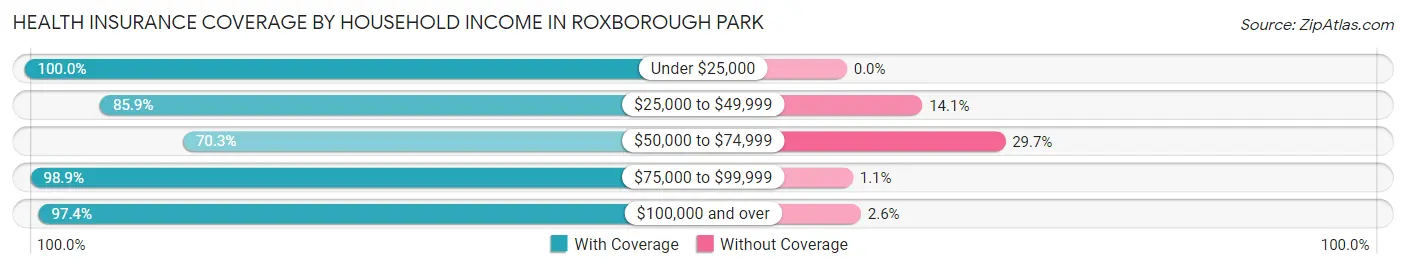
| Household Income | With Coverage | Without Coverage |
| Under $25,000 | 59 (100.0%) | 0 (0.0%) |
| $25,000 to $49,999 | 535 (85.9%) | 88 (14.1%) |
| $50,000 to $74,999 | 282 (70.3%) | 119 (29.7%) |
| $75,000 to $99,999 | 709 (98.9%) | 8 (1.1%) |
| $100,000 and over | 7,066 (97.4%) | 191 (2.6%) |
Public vs Private Health Insurance Coverage by Age in Roxborough Park
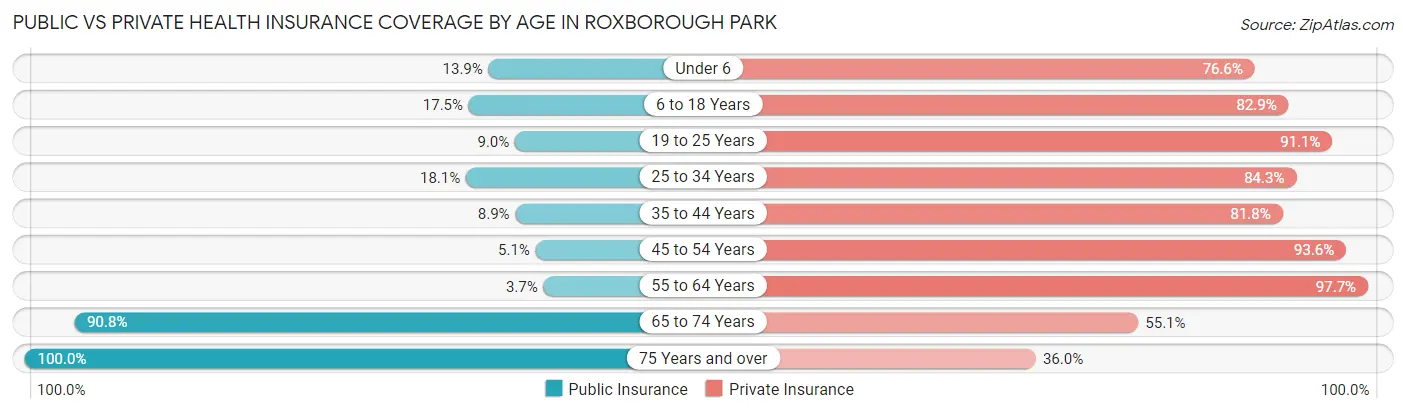
| Age Bracket | Public Insurance | Private Insurance |
| Under 6 | 76 (13.9%) | 420 (76.6%) |
| 6 to 18 Years | 300 (17.5%) | 1,418 (82.9%) |
| 19 to 25 Years | 34 (8.9%) | 346 (91.0%) |
| 25 to 34 Years | 158 (18.1%) | 738 (84.3%) |
| 35 to 44 Years | 157 (8.9%) | 1,444 (81.8%) |
| 45 to 54 Years | 69 (5.1%) | 1,258 (93.6%) |
| 55 to 64 Years | 47 (3.7%) | 1,248 (97.7%) |
| 65 to 74 Years | 693 (90.8%) | 420 (55.0%) |
| 75 Years and over | 394 (100.0%) | 142 (36.0%) |
| Total | 1,928 (21.3%) | 7,434 (82.1%) |
Disability Status by Sex by Age in Roxborough Park
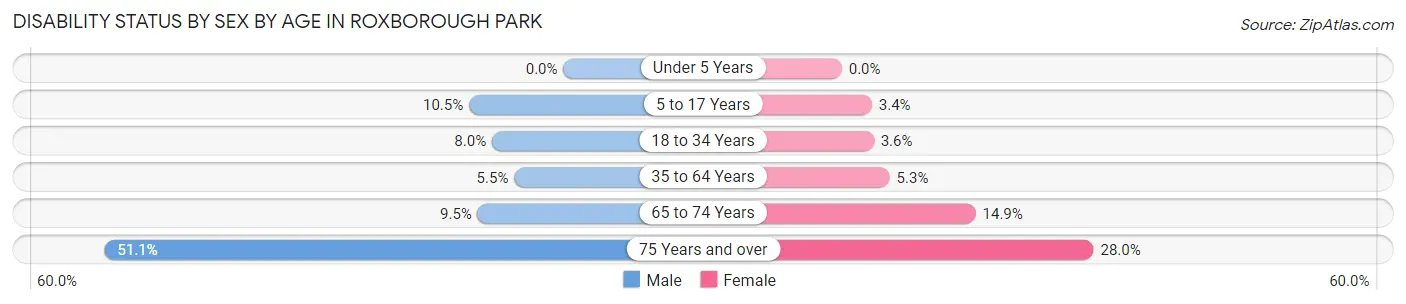
| Age Bracket | Male | Female |
| Under 5 Years | 0 (0.0%) | 0 (0.0%) |
| 5 to 17 Years | 108 (10.5%) | 23 (3.4%) |
| 18 to 34 Years | 47 (8.0%) | 29 (3.5%) |
| 35 to 64 Years | 125 (5.5%) | 112 (5.3%) |
| 65 to 74 Years | 35 (9.5%) | 59 (14.9%) |
| 75 Years and over | 92 (51.1%) | 60 (28.0%) |
Disability Class by Sex by Age in Roxborough Park
Disability Class: Hearing Difficulty
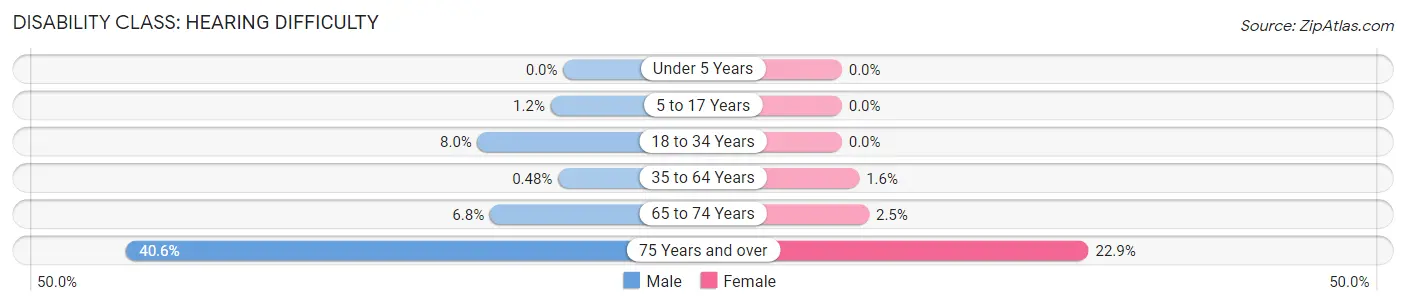
| Age Bracket | Male | Female |
| Under 5 Years | 0 (0.0%) | 0 (0.0%) |
| 5 to 17 Years | 12 (1.2%) | 0 (0.0%) |
| 18 to 34 Years | 47 (8.0%) | 0 (0.0%) |
| 35 to 64 Years | 11 (0.5%) | 34 (1.6%) |
| 65 to 74 Years | 25 (6.8%) | 10 (2.5%) |
| 75 Years and over | 73 (40.6%) | 49 (22.9%) |
Disability Class: Vision Difficulty
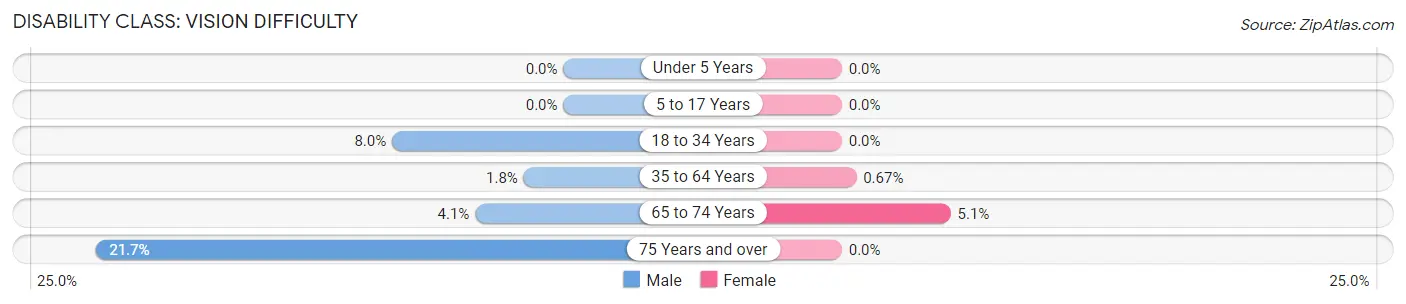
| Age Bracket | Male | Female |
| Under 5 Years | 0 (0.0%) | 0 (0.0%) |
| 5 to 17 Years | 0 (0.0%) | 0 (0.0%) |
| 18 to 34 Years | 47 (8.0%) | 0 (0.0%) |
| 35 to 64 Years | 42 (1.8%) | 14 (0.7%) |
| 65 to 74 Years | 15 (4.1%) | 20 (5.1%) |
| 75 Years and over | 39 (21.7%) | 0 (0.0%) |
Disability Class: Cognitive Difficulty
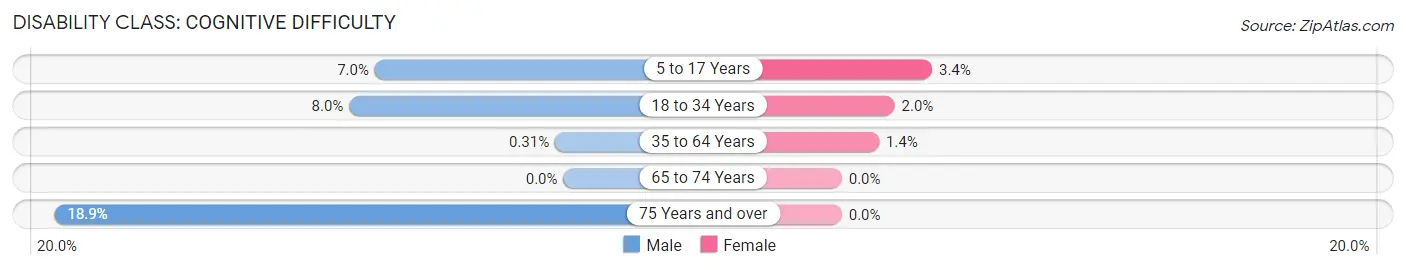
| Age Bracket | Male | Female |
| 5 to 17 Years | 72 (7.0%) | 23 (3.4%) |
| 18 to 34 Years | 47 (8.0%) | 16 (2.0%) |
| 35 to 64 Years | 7 (0.3%) | 29 (1.4%) |
| 65 to 74 Years | 0 (0.0%) | 0 (0.0%) |
| 75 Years and over | 34 (18.9%) | 0 (0.0%) |
Disability Class: Ambulatory Difficulty
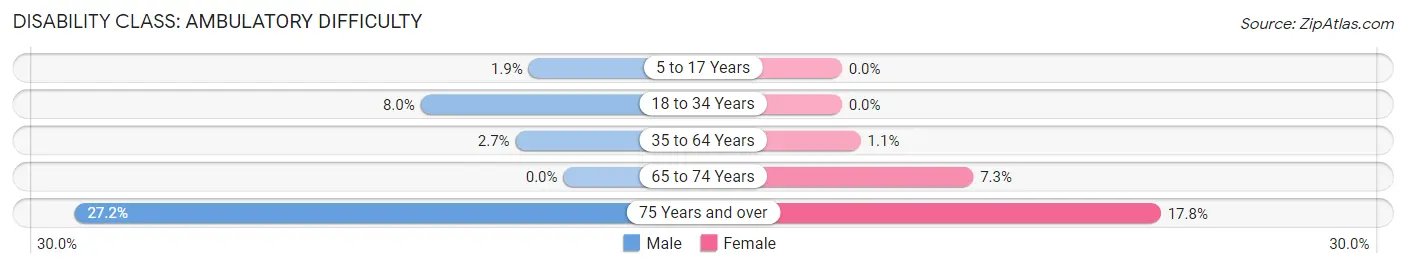
| Age Bracket | Male | Female |
| 5 to 17 Years | 20 (1.9%) | 0 (0.0%) |
| 18 to 34 Years | 47 (8.0%) | 0 (0.0%) |
| 35 to 64 Years | 61 (2.7%) | 22 (1.1%) |
| 65 to 74 Years | 0 (0.0%) | 29 (7.3%) |
| 75 Years and over | 49 (27.2%) | 38 (17.8%) |
Disability Class: Self-Care Difficulty
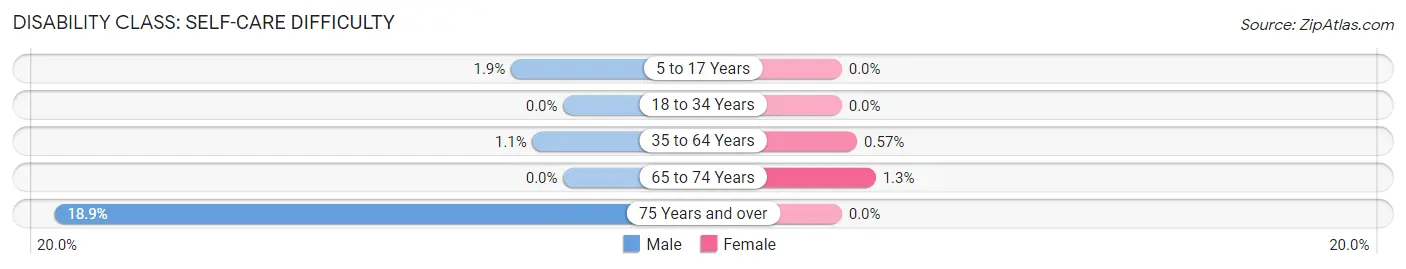
| Age Bracket | Male | Female |
| 5 to 17 Years | 20 (1.9%) | 0 (0.0%) |
| 18 to 34 Years | 0 (0.0%) | 0 (0.0%) |
| 35 to 64 Years | 26 (1.1%) | 12 (0.6%) |
| 65 to 74 Years | 0 (0.0%) | 5 (1.3%) |
| 75 Years and over | 34 (18.9%) | 0 (0.0%) |
Technology Access in Roxborough Park
Computing Device Access in Roxborough Park
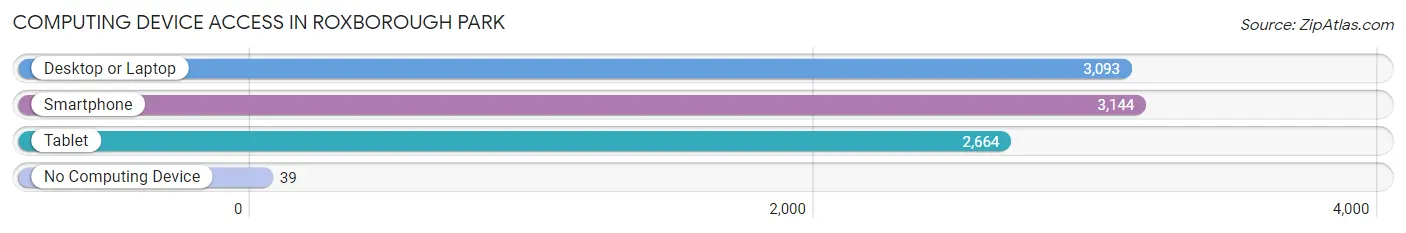
| Device Type | # Households | % Households |
| Desktop or Laptop | 3,093 | 95.2% |
| Smartphone | 3,144 | 96.8% |
| Tablet | 2,664 | 82.0% |
| No Computing Device | 39 | 1.2% |
| Total | 3,248 | 100.0% |
Internet Access in Roxborough Park
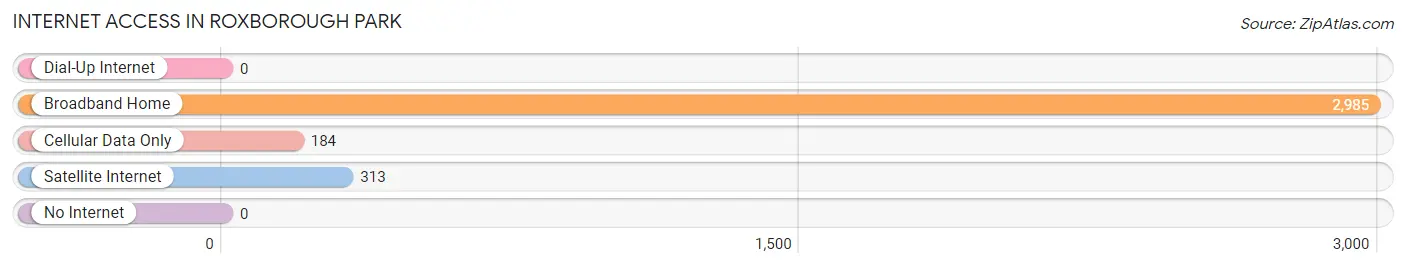
| Internet Type | # Households | % Households |
| Dial-Up Internet | 0 | 0.0% |
| Broadband Home | 2,985 | 91.9% |
| Cellular Data Only | 184 | 5.7% |
| Satellite Internet | 313 | 9.6% |
| No Internet | 0 | 0.0% |
| Total | 3,248 | 100.0% |
Roxborough Park Summary
Roxborough Park is a census-designated place located in Douglas County, Colorado, United States. It is situated at the base of the foothills of the Rocky Mountains, approximately 20 miles south of Denver. The population was 8,421 at the 2010 census.
History
Roxborough Park was first settled in the late 1800s by homesteaders who were attracted to the area by its natural beauty and abundant wildlife. The area was originally known as “Roxborough” and was named after the Roxborough family, who were among the first settlers in the area. The family owned a large ranch in the area and the name was eventually adopted by the local post office.
In the early 1900s, the area began to develop as a residential community. The first homes were built in the 1920s and 1930s, and the area was officially incorporated as a town in 1945.
Geography
Roxborough Park is located at 39°30'17" North, 105°2'17" West (39.504722, -105.038333). It is situated at the base of the foothills of the Rocky Mountains, approximately 20 miles south of Denver. The area is characterized by rolling hills, open meadows, and dense stands of ponderosa pine and Douglas fir.
The area is home to several parks and open spaces, including Roxborough State Park, which is a 4,000-acre park that features red rock formations, hiking trails, and wildlife.
Economy
Roxborough Park is primarily a residential community, with most of its residents commuting to nearby Denver for work. The area is home to several small businesses, including restaurants, retail stores, and professional services.
The area is also home to several technology companies, including the software development firm, Apptio, and the data analytics firm, Splunk.
Demographics
As of the 2010 census, there were 8,421 people, 3,093 households, and 2,521 families residing in the area. The population density was 1,845.3 people per square mile (715.3/km2). The racial makeup of the area was 91.2% White, 1.2% African American, 0.4% Native American, 2.2% Asian, 0.1% Pacific Islander, 3.2% from other races, and 1.9% from two or more races. Hispanic or Latino of any race were 8.3% of the population.
The median income for a household in the area was $90,945, and the median income for a family was $103,945. The per capita income for the area was $41,945. About 2.2% of families and 3.2% of the population were below the poverty line, including 4.2% of those under age 18 and 2.2% of those age 65 or over.
Common Questions
What is Per Capita Income in Roxborough Park?
Per Capita income in Roxborough Park is $65,325.
What is the Median Family Income in Roxborough Park?
Median Family Income in Roxborough Park is $152,241.
What is the Median Household income in Roxborough Park?
Median Household Income in Roxborough Park is $150,086.
What is Income or Wage Gap in Roxborough Park?
Income or Wage Gap in Roxborough Park is 36.6%.
Women in Roxborough Park earn 63.4 cents for every dollar earned by a man.
What is Inequality or Gini Index in Roxborough Park?
Inequality or Gini Index in Roxborough Park is 0.35.
What is the Total Population of Roxborough Park?
Total Population of Roxborough Park is 9,057.
What is the Total Male Population of Roxborough Park?
Total Male Population of Roxborough Park is 4,653.
What is the Total Female Population of Roxborough Park?
Total Female Population of Roxborough Park is 4,404.
What is the Ratio of Males per 100 Females in Roxborough Park?
There are 105.65 Males per 100 Females in Roxborough Park.
What is the Ratio of Females per 100 Males in Roxborough Park?
There are 94.65 Females per 100 Males in Roxborough Park.
What is the Median Population Age in Roxborough Park?
Median Population Age in Roxborough Park is 40.5 Years.
What is the Average Family Size in Roxborough Park
Average Family Size in Roxborough Park is 2.9 People.
What is the Average Household Size in Roxborough Park
Average Household Size in Roxborough Park is 2.8 People.
How Large is the Labor Force in Roxborough Park?
There are 4,771 People in the Labor Forcein in Roxborough Park.
What is the Percentage of People in the Labor Force in Roxborough Park?
65.9% of People are in the Labor Force in Roxborough Park.
What is the Unemployment Rate in Roxborough Park?
Unemployment Rate in Roxborough Park is 1.1%.