Talty, TX Map & Demographics
Talty Map
Talty Overview
$48,715
PER CAPITA INCOME
$137,237
AVG FAMILY INCOME
$128,864
AVG HOUSEHOLD INCOME
35.8%
WAGE / INCOME GAP [ % ]
64.2¢/ $1
WAGE / INCOME GAP [ $ ]
0.33
INEQUALITY / GINI INDEX
2,568
TOTAL POPULATION
1,331
MALE POPULATION
1,237
FEMALE POPULATION
107.60
MALES / 100 FEMALES
92.94
FEMALES / 100 MALES
41.0
MEDIAN AGE
3.3
AVG FAMILY SIZE
3.1
AVG HOUSEHOLD SIZE
1,433
LABOR FORCE [ PEOPLE ]
71.3%
PERCENT IN LABOR FORCE
4.3%
UNEMPLOYMENT RATE
Income in Talty
Income Overview in Talty
Per Capita Income in Talty is $48,715, while median incomes of families and households are $137,237 and $128,864 respectively.
| Characteristic | Number | Measure |
| Per Capita Income | 2,568 | $48,715 |
| Median Family Income | 716 | $137,237 |
| Mean Family Income | 716 | $161,373 |
| Median Household Income | 834 | $128,864 |
| Mean Household Income | 834 | $149,100 |
| Income Deficit | 716 | $0 |
| Wage / Income Gap (%) | 2,568 | 35.81% |
| Wage / Income Gap ($) | 2,568 | 64.19¢ per $1 |
| Gini / Inequality Index | 2,568 | 0.33 |
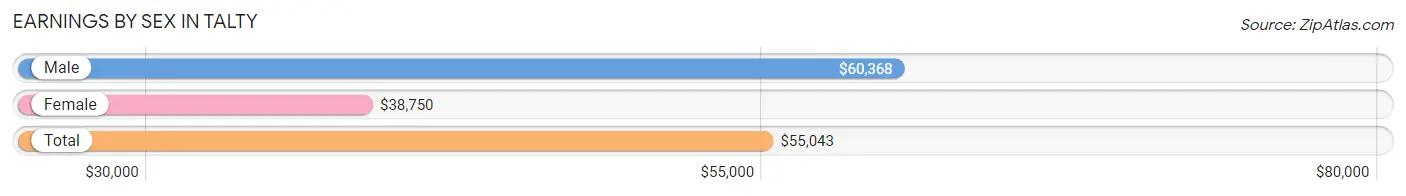
Earnings by Sex in Talty
Average Earnings in Talty are $55,043, $60,368 for men and $38,750 for women, a difference of 35.8%.
| Sex | Number | Average Earnings |
| Male | 900 (59.6%) | $60,368 |
| Female | 610 (40.4%) | $38,750 |
| Total | 1,510 (100.0%) | $55,043 |
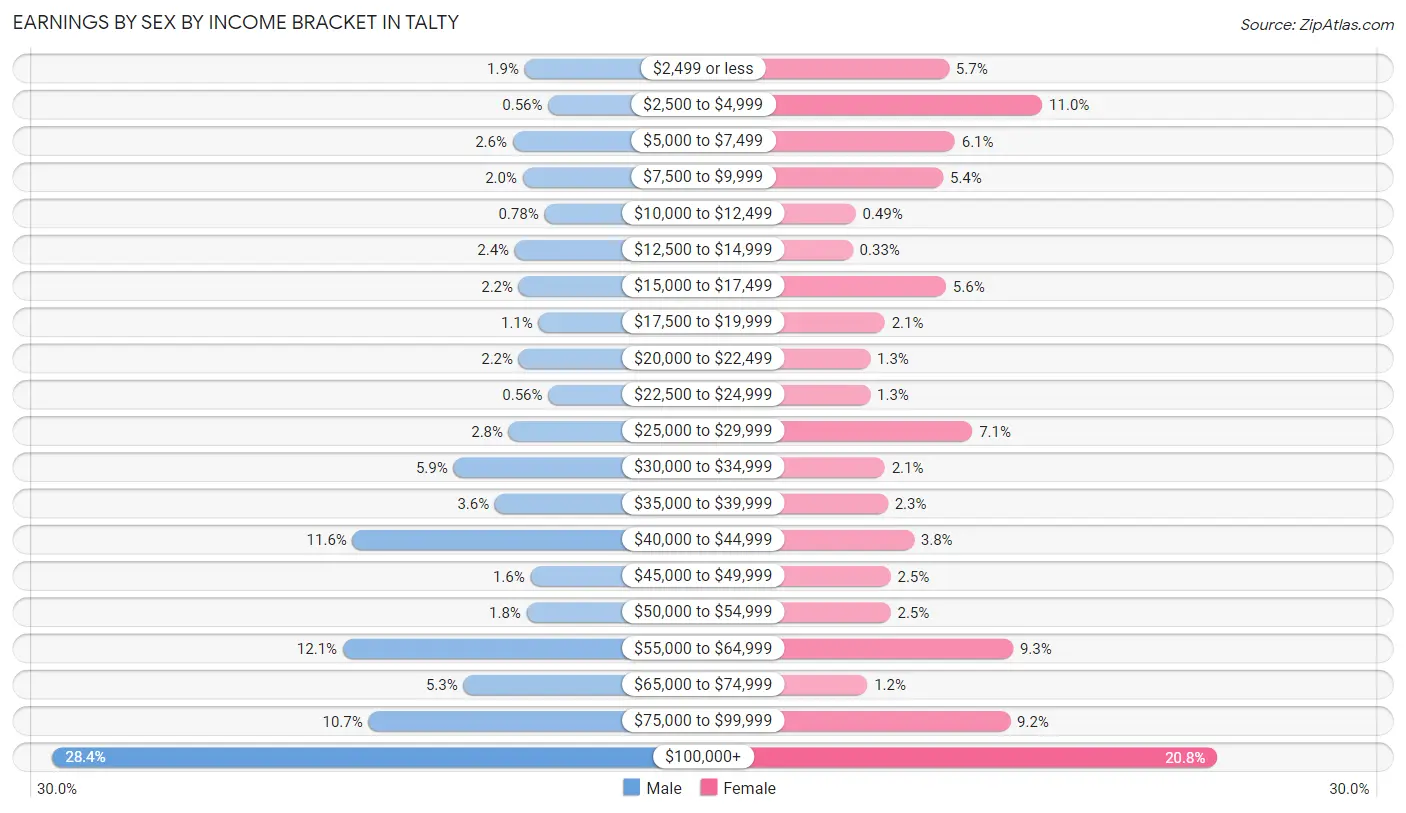
Earnings by Sex by Income Bracket in Talty
The most common earnings brackets in Talty are $100,000+ for men (256 | 28.4%) and $100,000+ for women (127 | 20.8%).
| Income | Male | Female |
| $2,499 or less | 17 (1.9%) | 35 (5.7%) |
| $2,500 to $4,999 | 5 (0.6%) | 67 (11.0%) |
| $5,000 to $7,499 | 23 (2.6%) | 37 (6.1%) |
| $7,500 to $9,999 | 18 (2.0%) | 33 (5.4%) |
| $10,000 to $12,499 | 7 (0.8%) | 3 (0.5%) |
| $12,500 to $14,999 | 22 (2.4%) | 2 (0.3%) |
| $15,000 to $17,499 | 20 (2.2%) | 34 (5.6%) |
| $17,500 to $19,999 | 10 (1.1%) | 13 (2.1%) |
| $20,000 to $22,499 | 20 (2.2%) | 8 (1.3%) |
| $22,500 to $24,999 | 5 (0.6%) | 8 (1.3%) |
| $25,000 to $29,999 | 25 (2.8%) | 43 (7.0%) |
| $30,000 to $34,999 | 53 (5.9%) | 13 (2.1%) |
| $35,000 to $39,999 | 32 (3.6%) | 14 (2.3%) |
| $40,000 to $44,999 | 104 (11.6%) | 23 (3.8%) |
| $45,000 to $49,999 | 14 (1.6%) | 15 (2.5%) |
| $50,000 to $54,999 | 16 (1.8%) | 15 (2.5%) |
| $55,000 to $64,999 | 109 (12.1%) | 57 (9.3%) |
| $65,000 to $74,999 | 48 (5.3%) | 7 (1.1%) |
| $75,000 to $99,999 | 96 (10.7%) | 56 (9.2%) |
| $100,000+ | 256 (28.4%) | 127 (20.8%) |
| Total | 900 (100.0%) | 610 (100.0%) |
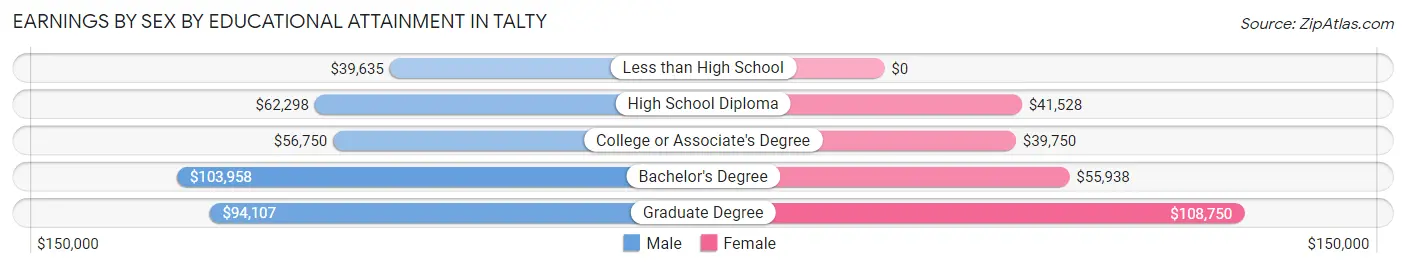
Earnings by Sex by Educational Attainment in Talty
Average earnings in Talty are $64,583 for men and $55,278 for women, a difference of 14.4%. Men with an educational attainment of bachelor's degree enjoy the highest average annual earnings of $103,958, while those with less than high school education earn the least with $39,635. Women with an educational attainment of graduate degree earn the most with the average annual earnings of $108,750, while those with college or associate's degree education have the smallest earnings of $39,750.
| Educational Attainment | Male Income | Female Income |
| Less than High School | $39,635 | $0 |
| High School Diploma | $62,298 | $41,528 |
| College or Associate's Degree | $56,750 | $39,750 |
| Bachelor's Degree | $103,958 | $55,938 |
| Graduate Degree | $94,107 | $108,750 |
| Total | $64,583 | $55,278 |
Family Income in Talty
Family Income Brackets in Talty
According to the Talty family income data, there are 228 families falling into the $200,000+ income range, which is the most common income bracket and makes up 31.8% of all families.
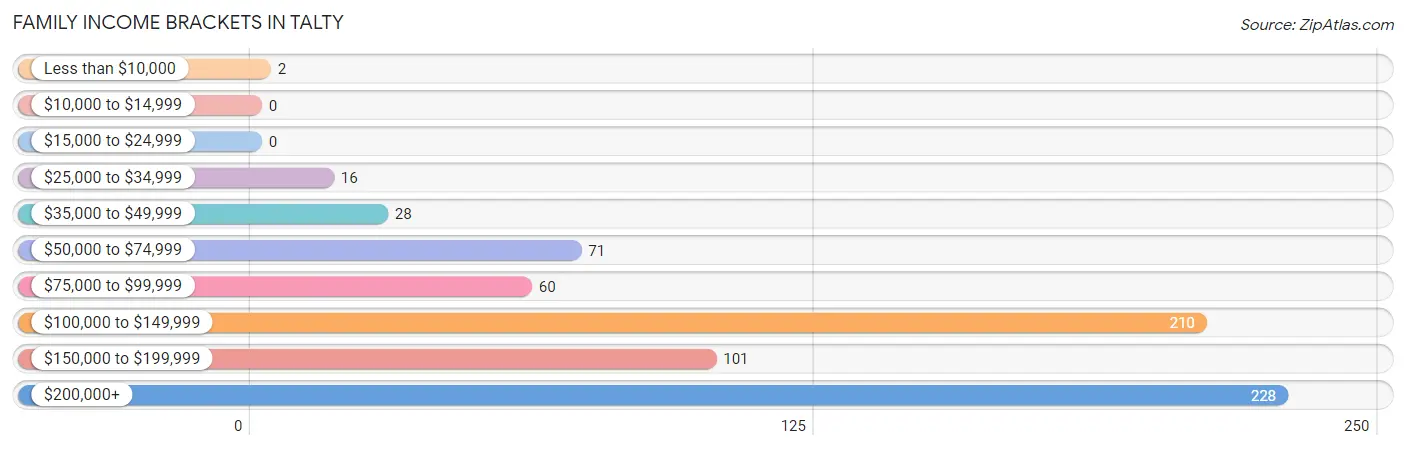
| Income Bracket | # Families | % Families |
| Less than $10,000 | 2 | 0.3% |
| $10,000 to $14,999 | 0 | 0.0% |
| $15,000 to $24,999 | 0 | 0.0% |
| $25,000 to $34,999 | 16 | 2.2% |
| $35,000 to $49,999 | 28 | 3.9% |
| $50,000 to $74,999 | 71 | 9.9% |
| $75,000 to $99,999 | 60 | 8.4% |
| $100,000 to $149,999 | 210 | 29.3% |
| $150,000 to $199,999 | 101 | 14.1% |
| $200,000+ | 228 | 31.8% |
Family Income by Famaliy Size in Talty
3-person families (111 | 15.5%) account for the highest median family income in Talty with $174,125 per family, while 3-person families (111 | 15.5%) have the highest median income of $58,042 per family member.
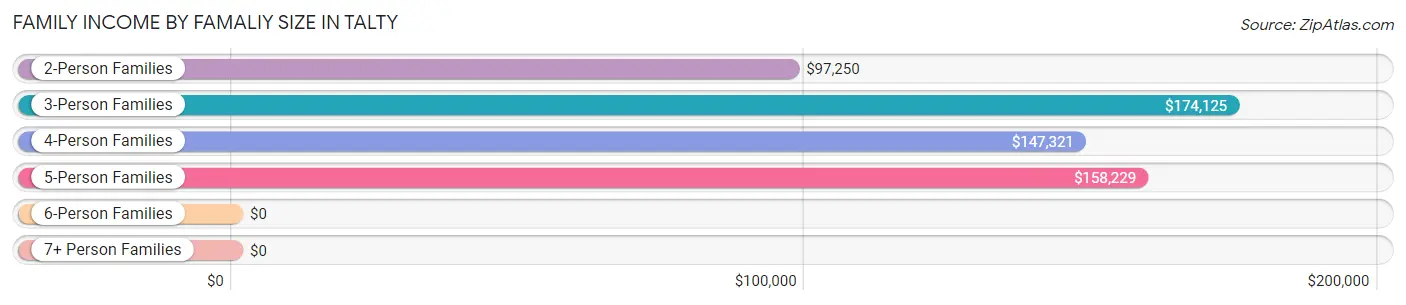
| Income Bracket | # Families | Median Income |
| 2-Person Families | 264 (36.9%) | $97,250 |
| 3-Person Families | 111 (15.5%) | $174,125 |
| 4-Person Families | 259 (36.2%) | $147,321 |
| 5-Person Families | 59 (8.2%) | $158,229 |
| 6-Person Families | 8 (1.1%) | $0 |
| 7+ Person Families | 15 (2.1%) | $0 |
| Total | 716 (100.0%) | $137,237 |
Family Income by Number of Earners in Talty
The median family income in Talty is $137,237, with families comprising 2 earners (338) having the highest median family income of $151,731, while families with no earners (53) have the lowest median family income of $66,250, accounting for 47.2% and 7.4% of families, respectively.
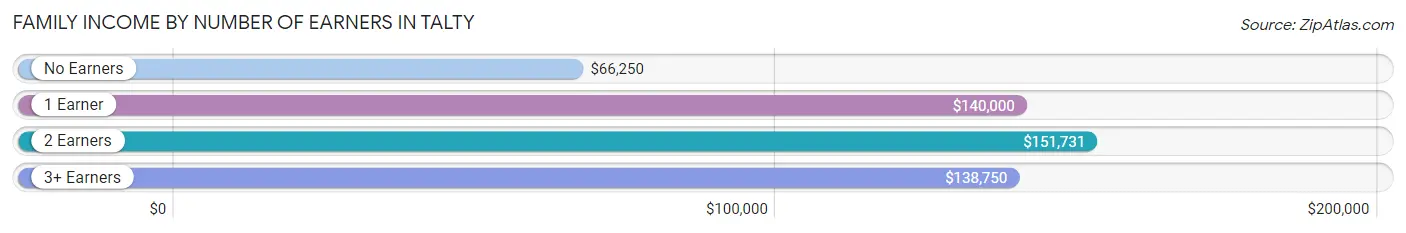
| Number of Earners | # Families | Median Income |
| No Earners | 53 (7.4%) | $66,250 |
| 1 Earner | 182 (25.4%) | $140,000 |
| 2 Earners | 338 (47.2%) | $151,731 |
| 3+ Earners | 143 (20.0%) | $138,750 |
| Total | 716 (100.0%) | $137,237 |
Household Income in Talty
Household Income Brackets in Talty
With 238 households falling in the category, the $200,000+ income range is the most frequent in Talty, accounting for 28.5% of all households.
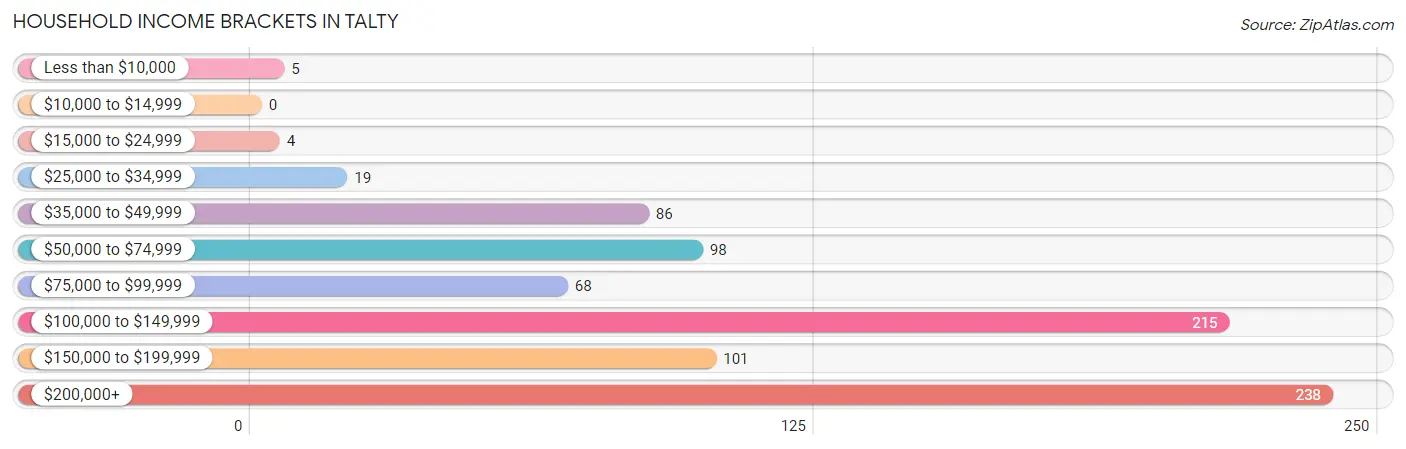
| Income Bracket | # Households | % Households |
| Less than $10,000 | 5 | 0.6% |
| $10,000 to $14,999 | 0 | 0.0% |
| $15,000 to $24,999 | 4 | 0.5% |
| $25,000 to $34,999 | 19 | 2.3% |
| $35,000 to $49,999 | 86 | 10.3% |
| $50,000 to $74,999 | 98 | 11.8% |
| $75,000 to $99,999 | 68 | 8.2% |
| $100,000 to $149,999 | 215 | 25.8% |
| $150,000 to $199,999 | 101 | 12.1% |
| $200,000+ | 238 | 28.5% |
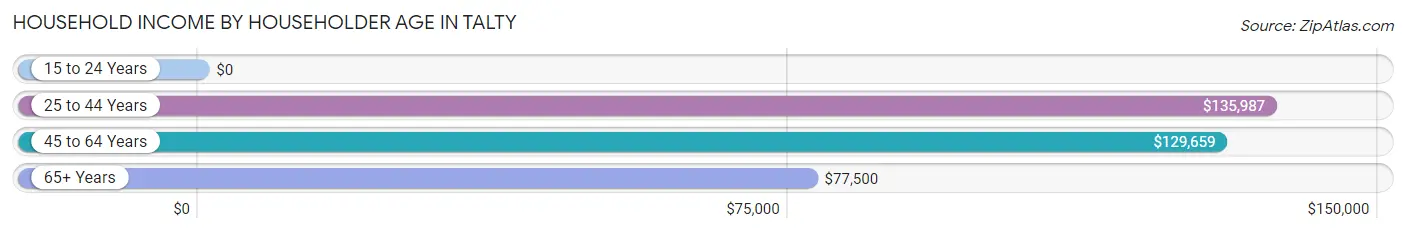
Household Income by Householder Age in Talty
The median household income in Talty is $128,864, with the highest median household income of $135,987 found in the 25 to 44 years age bracket for the primary householder. A total of 271 households (32.5%) fall into this category.
| Income Bracket | # Households | Median Income |
| 15 to 24 Years | 0 (0.0%) | $0 |
| 25 to 44 Years | 271 (32.5%) | $135,987 |
| 45 to 64 Years | 463 (55.5%) | $129,659 |
| 65+ Years | 100 (12.0%) | $77,500 |
| Total | 834 (100.0%) | $128,864 |
Poverty in Talty
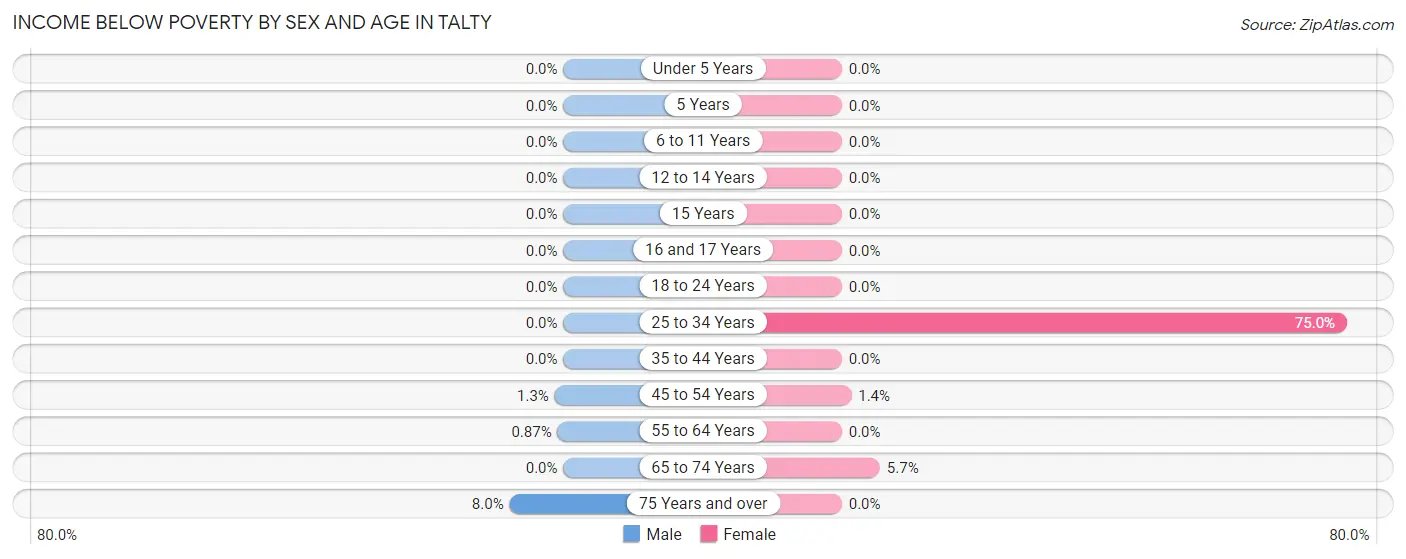
Income Below Poverty by Sex and Age in Talty
With 0.5% poverty level for males and 4.6% for females among the residents of Talty, 75 year old and over males and 25 to 34 year old females are the most vulnerable to poverty, with 2 males (8.0%) and 48 females (75.0%) in their respective age groups living below the poverty level.
| Age Bracket | Male | Female |
| Under 5 Years | 0 (0.0%) | 0 (0.0%) |
| 5 Years | 0 (0.0%) | 0 (0.0%) |
| 6 to 11 Years | 0 (0.0%) | 0 (0.0%) |
| 12 to 14 Years | 0 (0.0%) | 0 (0.0%) |
| 15 Years | 0 (0.0%) | 0 (0.0%) |
| 16 and 17 Years | 0 (0.0%) | 0 (0.0%) |
| 18 to 24 Years | 0 (0.0%) | 0 (0.0%) |
| 25 to 34 Years | 0 (0.0%) | 48 (75.0%) |
| 35 to 44 Years | 0 (0.0%) | 0 (0.0%) |
| 45 to 54 Years | 3 (1.3%) | 3 (1.4%) |
| 55 to 64 Years | 2 (0.9%) | 0 (0.0%) |
| 65 to 74 Years | 0 (0.0%) | 6 (5.7%) |
| 75 Years and over | 2 (8.0%) | 0 (0.0%) |
| Total | 7 (0.5%) | 57 (4.6%) |
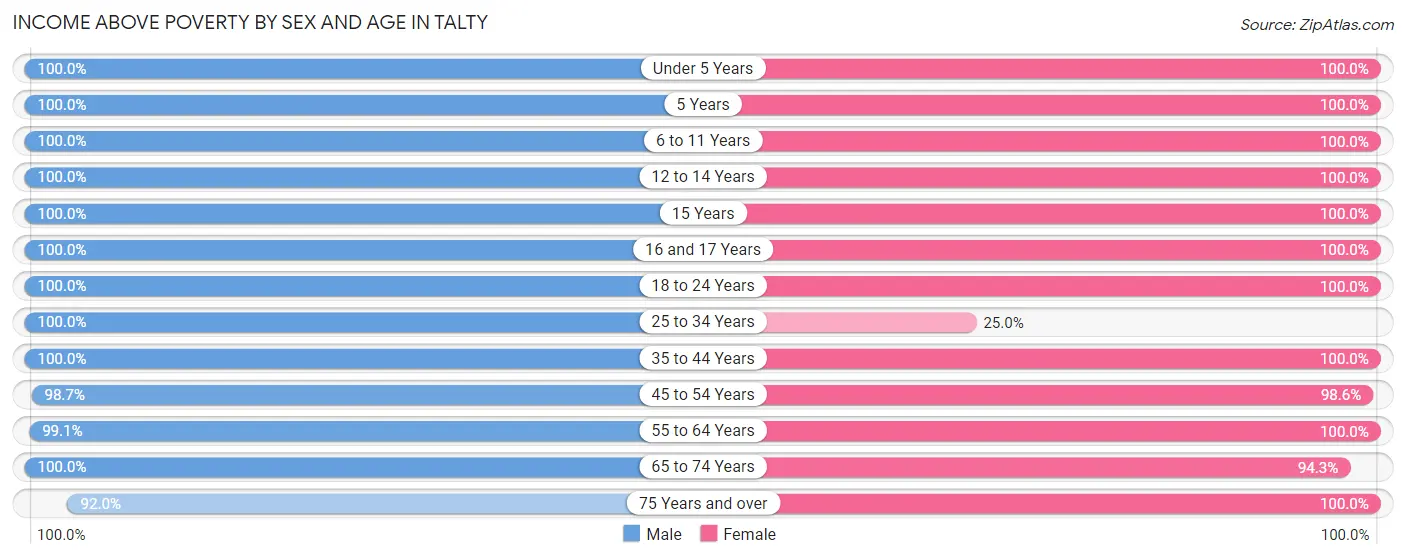
Income Above Poverty by Sex and Age in Talty
According to the poverty statistics in Talty, males aged under 5 years and females aged under 5 years are the age groups that are most secure financially, with 100.0% of males and 100.0% of females in these age groups living above the poverty line.
| Age Bracket | Male | Female |
| Under 5 Years | 35 (100.0%) | 103 (100.0%) |
| 5 Years | 21 (100.0%) | 10 (100.0%) |
| 6 to 11 Years | 100 (100.0%) | 93 (100.0%) |
| 12 to 14 Years | 61 (100.0%) | 73 (100.0%) |
| 15 Years | 38 (100.0%) | 19 (100.0%) |
| 16 and 17 Years | 42 (100.0%) | 28 (100.0%) |
| 18 to 24 Years | 80 (100.0%) | 138 (100.0%) |
| 25 to 34 Years | 116 (100.0%) | 16 (25.0%) |
| 35 to 44 Years | 255 (100.0%) | 182 (100.0%) |
| 45 to 54 Years | 229 (98.7%) | 210 (98.6%) |
| 55 to 64 Years | 229 (99.1%) | 169 (100.0%) |
| 65 to 74 Years | 90 (100.0%) | 100 (94.3%) |
| 75 Years and over | 23 (92.0%) | 39 (100.0%) |
| Total | 1,319 (99.5%) | 1,180 (95.4%) |
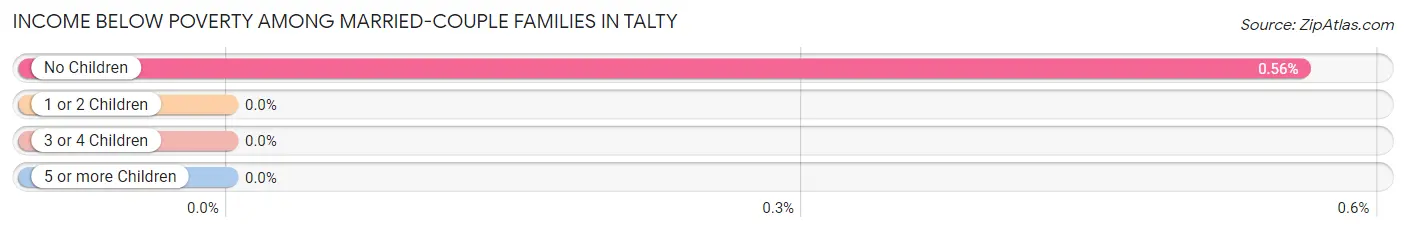
Income Below Poverty Among Married-Couple Families in Talty
The poverty statistics for married-couple families in Talty show that 0.3% or 2 of the total 686 families live below the poverty line. Families with no children have the highest poverty rate of 0.6%, comprising of 2 families. On the other hand, families with 1 or 2 children have the lowest poverty rate of 0.0%, which includes 0 families.
| Children | Above Poverty | Below Poverty |
| No Children | 358 (99.4%) | 2 (0.6%) |
| 1 or 2 Children | 279 (100.0%) | 0 (0.0%) |
| 3 or 4 Children | 42 (100.0%) | 0 (0.0%) |
| 5 or more Children | 5 (100.0%) | 0 (0.0%) |
| Total | 684 (99.7%) | 2 (0.3%) |
Income Below Poverty Among Single-Parent Households in Talty
| Children | Single Father | Single Mother |
| No Children | 0 (0.0%) | 0 (0.0%) |
| 1 or 2 Children | 0 (0.0%) | 0 (0.0%) |
| 3 or 4 Children | 0 (0.0%) | 0 (0.0%) |
| 5 or more Children | 0 (0.0%) | 0 (0.0%) |
| Total | 0 (0.0%) | 0 (0.0%) |
Income Below Poverty Among Married-Couple vs Single-Parent Households in Talty
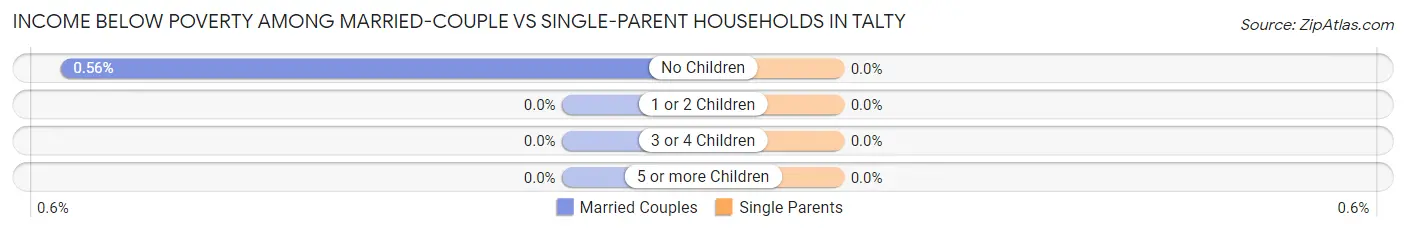
| Children | Married-Couple Families | Single-Parent Households |
| No Children | 2 (0.6%) | 0 (0.0%) |
| 1 or 2 Children | 0 (0.0%) | 0 (0.0%) |
| 3 or 4 Children | 0 (0.0%) | 0 (0.0%) |
| 5 or more Children | 0 (0.0%) | 0 (0.0%) |
| Total | 2 (0.3%) | 0 (0.0%) |
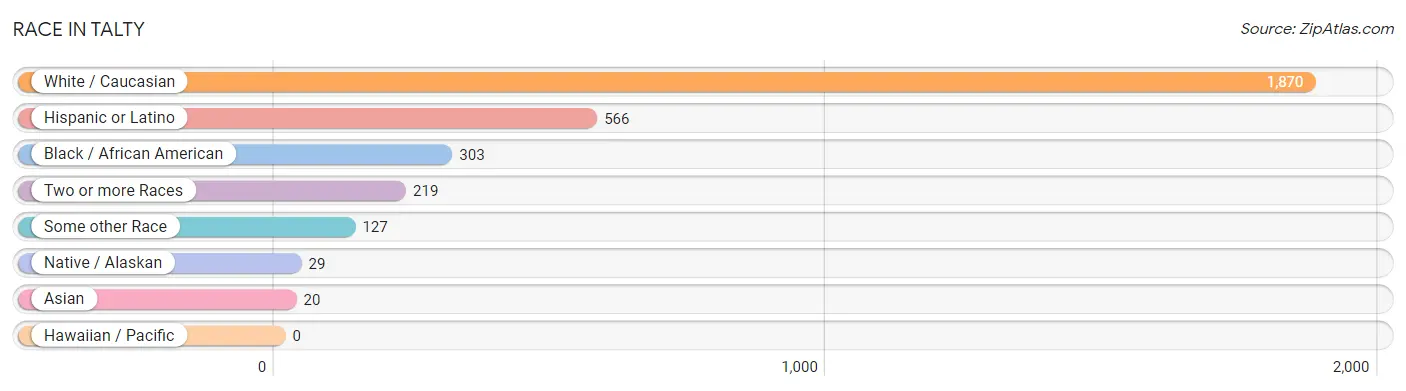
Race in Talty
The most populous races in Talty are White / Caucasian (1,870 | 72.8%), Hispanic or Latino (566 | 22.0%), and Black / African American (303 | 11.8%).
| Race | # Population | % Population |
| Asian | 20 | 0.8% |
| Black / African American | 303 | 11.8% |
| Hawaiian / Pacific | 0 | 0.0% |
| Hispanic or Latino | 566 | 22.0% |
| Native / Alaskan | 29 | 1.1% |
| White / Caucasian | 1,870 | 72.8% |
| Two or more Races | 219 | 8.5% |
| Some other Race | 127 | 5.0% |
| Total | 2,568 | 100.0% |
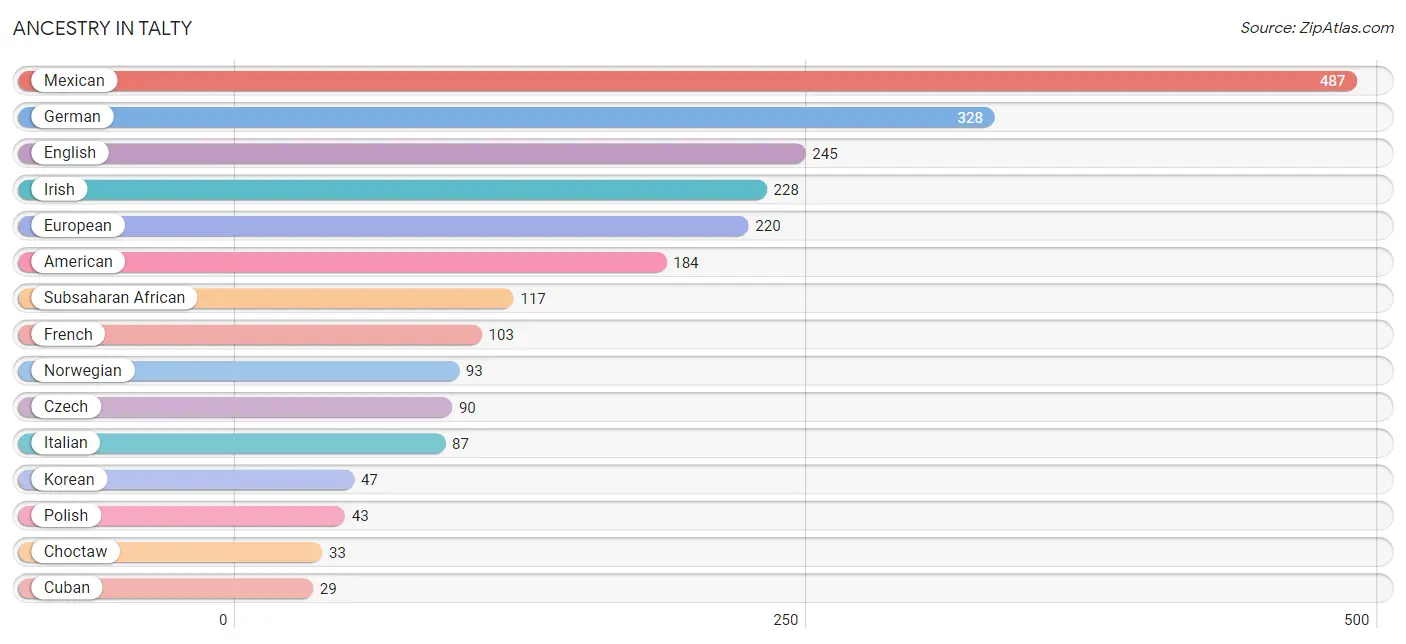
Ancestry in Talty
The most populous ancestries reported in Talty are Mexican (487 | 19.0%), German (328 | 12.8%), English (245 | 9.5%), Irish (228 | 8.9%), and European (220 | 8.6%), together accounting for 58.7% of all Talty residents.
| Ancestry | # Population | % Population |
| American | 184 | 7.2% |
| British | 24 | 0.9% |
| Choctaw | 33 | 1.3% |
| Colombian | 6 | 0.2% |
| Croatian | 3 | 0.1% |
| Cuban | 29 | 1.1% |
| Czech | 90 | 3.5% |
| Danish | 3 | 0.1% |
| Dutch | 22 | 0.9% |
| Eastern European | 3 | 0.1% |
| English | 245 | 9.5% |
| European | 220 | 8.6% |
| French | 103 | 4.0% |
| German | 328 | 12.8% |
| Irish | 228 | 8.9% |
| Italian | 87 | 3.4% |
| Korean | 47 | 1.8% |
| Mexican | 487 | 19.0% |
| Nigerian | 9 | 0.4% |
| Norwegian | 93 | 3.6% |
| Polish | 43 | 1.7% |
| Portuguese | 6 | 0.2% |
| Puerto Rican | 16 | 0.6% |
| Russian | 21 | 0.8% |
| Scotch-Irish | 9 | 0.4% |
| Scottish | 18 | 0.7% |
| Slovene | 6 | 0.2% |
| South American | 6 | 0.2% |
| Spanish | 3 | 0.1% |
| Subsaharan African | 117 | 4.6% |
| Swedish | 28 | 1.1% |
| Ugandan | 5 | 0.2% |
| Welsh | 14 | 0.5% | View All 33 Rows |
Immigrants in Talty
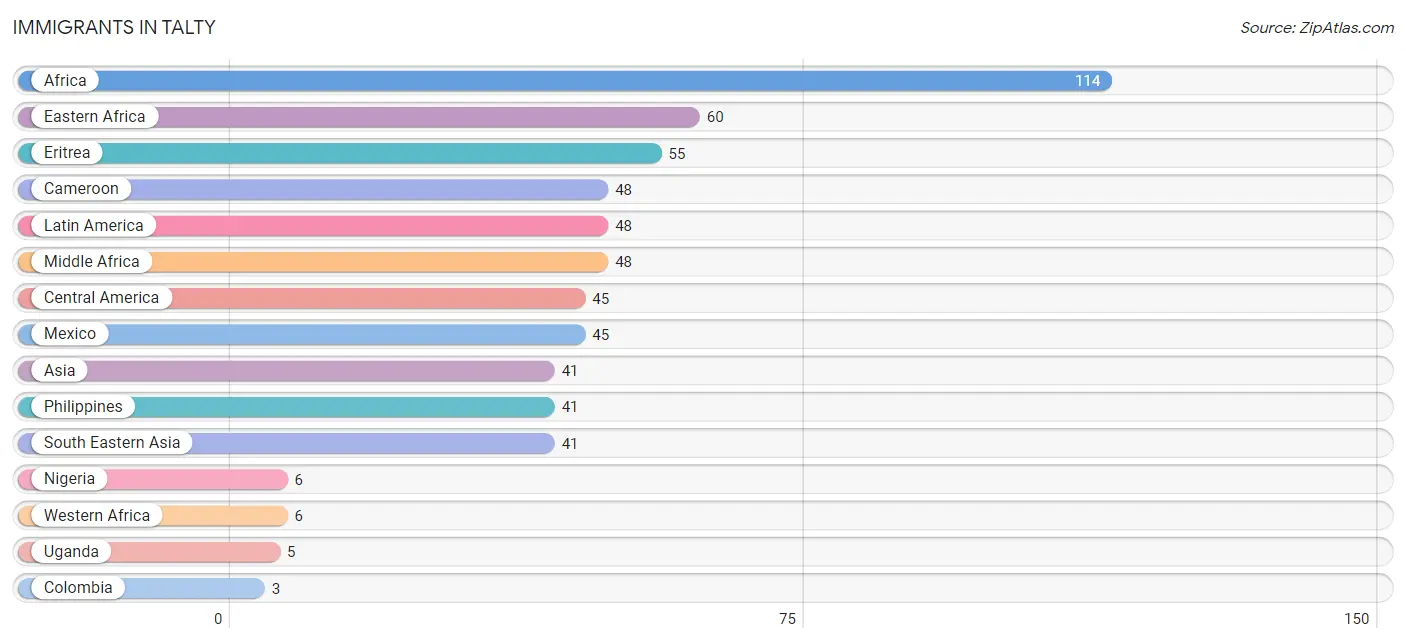
The most numerous immigrant groups reported in Talty came from Africa (114 | 4.4%), Eastern Africa (60 | 2.3%), Eritrea (55 | 2.1%), Cameroon (48 | 1.9%), and Latin America (48 | 1.9%), together accounting for 12.7% of all Talty residents.
| Immigration Origin | # Population | % Population |
| Africa | 114 | 4.4% |
| Asia | 41 | 1.6% |
| Cameroon | 48 | 1.9% |
| Central America | 45 | 1.8% |
| Colombia | 3 | 0.1% |
| Eastern Africa | 60 | 2.3% |
| Eritrea | 55 | 2.1% |
| Latin America | 48 | 1.9% |
| Mexico | 45 | 1.8% |
| Middle Africa | 48 | 1.9% |
| Nigeria | 6 | 0.2% |
| Philippines | 41 | 1.6% |
| South America | 3 | 0.1% |
| South Eastern Asia | 41 | 1.6% |
| Uganda | 5 | 0.2% |
| Western Africa | 6 | 0.2% | View All 16 Rows |
Sex and Age in Talty
Sex and Age in Talty
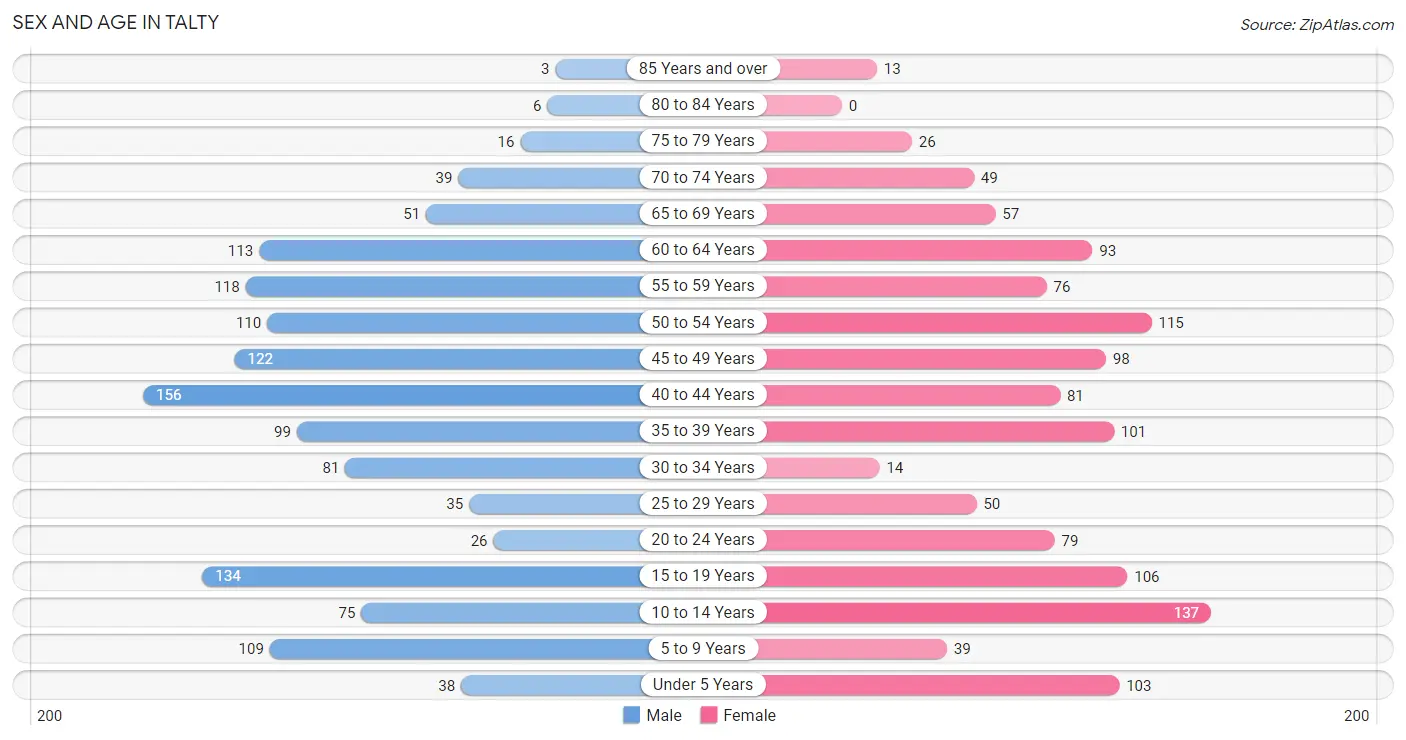
The most populous age groups in Talty are 40 to 44 Years (156 | 11.7%) for men and 10 to 14 Years (137 | 11.1%) for women.
| Age Bracket | Male | Female |
| Under 5 Years | 38 (2.9%) | 103 (8.3%) |
| 5 to 9 Years | 109 (8.2%) | 39 (3.2%) |
| 10 to 14 Years | 75 (5.6%) | 137 (11.1%) |
| 15 to 19 Years | 134 (10.1%) | 106 (8.6%) |
| 20 to 24 Years | 26 (1.9%) | 79 (6.4%) |
| 25 to 29 Years | 35 (2.6%) | 50 (4.0%) |
| 30 to 34 Years | 81 (6.1%) | 14 (1.1%) |
| 35 to 39 Years | 99 (7.4%) | 101 (8.2%) |
| 40 to 44 Years | 156 (11.7%) | 81 (6.6%) |
| 45 to 49 Years | 122 (9.2%) | 98 (7.9%) |
| 50 to 54 Years | 110 (8.3%) | 115 (9.3%) |
| 55 to 59 Years | 118 (8.9%) | 76 (6.1%) |
| 60 to 64 Years | 113 (8.5%) | 93 (7.5%) |
| 65 to 69 Years | 51 (3.8%) | 57 (4.6%) |
| 70 to 74 Years | 39 (2.9%) | 49 (4.0%) |
| 75 to 79 Years | 16 (1.2%) | 26 (2.1%) |
| 80 to 84 Years | 6 (0.4%) | 0 (0.0%) |
| 85 Years and over | 3 (0.2%) | 13 (1.1%) |
| Total | 1,331 (100.0%) | 1,237 (100.0%) |
Families and Households in Talty
Median Family Size in Talty
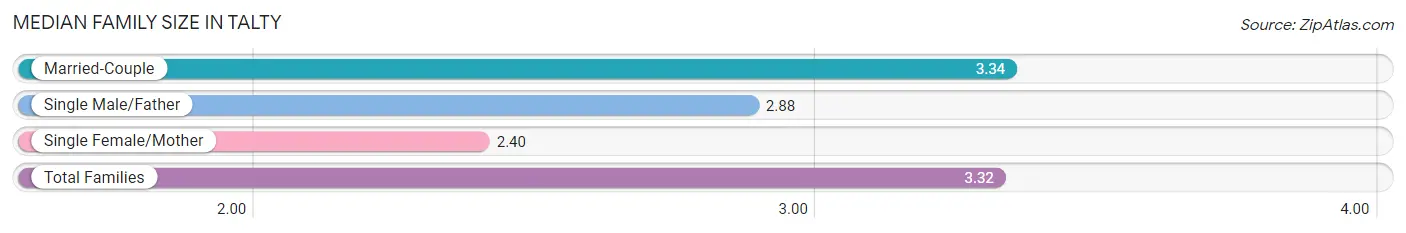
The median family size in Talty is 3.32 persons per family, with married-couple families (686 | 95.8%) accounting for the largest median family size of 3.34 persons per family. On the other hand, single female/mother families (5 | 0.7%) represent the smallest median family size with 2.40 persons per family.
| Family Type | # Families | Family Size |
| Married-Couple | 686 (95.8%) | 3.34 |
| Single Male/Father | 25 (3.5%) | 2.88 |
| Single Female/Mother | 5 (0.7%) | 2.40 |
| Total Families | 716 (100.0%) | 3.32 |
Median Household Size in Talty
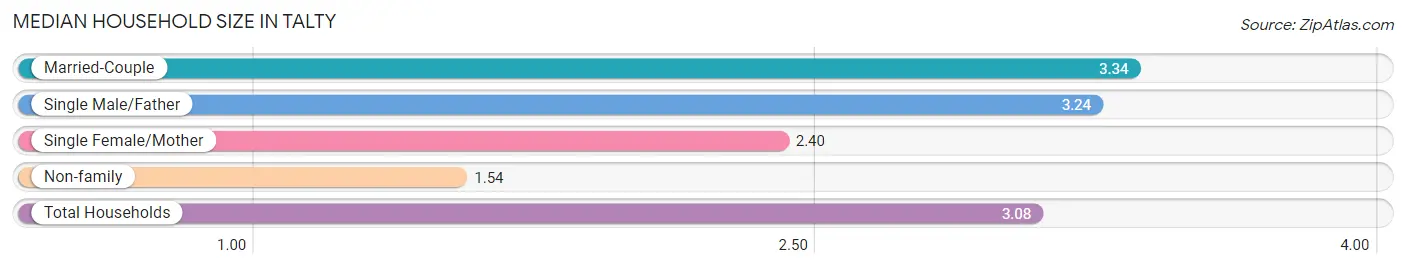
The median household size in Talty is 3.08 persons per household, with married-couple households (686 | 82.3%) accounting for the largest median household size of 3.34 persons per household. non-family households (118 | 14.1%) represent the smallest median household size with 1.54 persons per household.
| Household Type | # Households | Household Size |
| Married-Couple | 686 (82.3%) | 3.34 |
| Single Male/Father | 25 (3.0%) | 3.24 |
| Single Female/Mother | 5 (0.6%) | 2.40 |
| Non-family | 118 (14.1%) | 1.54 |
| Total Households | 834 (100.0%) | 3.08 |
Household Size by Marriage Status in Talty
Out of a total of 834 households in Talty, 716 (85.9%) are family households, while 118 (14.1%) are nonfamily households. The most numerous type of family households are 2-person households, comprising 264, and the most common type of nonfamily households are 2-person households, comprising 69.
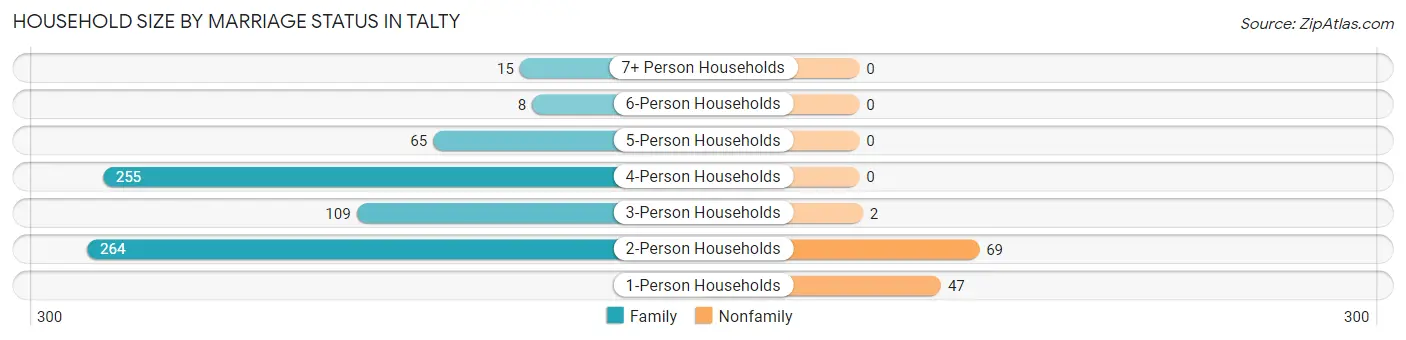
| Household Size | Family Households | Nonfamily Households |
| 1-Person Households | - | 47 (5.6%) |
| 2-Person Households | 264 (31.7%) | 69 (8.3%) |
| 3-Person Households | 109 (13.1%) | 2 (0.2%) |
| 4-Person Households | 255 (30.6%) | 0 (0.0%) |
| 5-Person Households | 65 (7.8%) | 0 (0.0%) |
| 6-Person Households | 8 (1.0%) | 0 (0.0%) |
| 7+ Person Households | 15 (1.8%) | 0 (0.0%) |
| Total | 716 (85.9%) | 118 (14.1%) |
Female Fertility in Talty
Fertility by Age in Talty
Average fertility rate in Talty is 28.0 births per 1,000 women. Women in the age bracket of 35 to 50 years have the highest fertility rate with 51.0 births per 1,000 women. Women in the age bracket of 35 to 50 years acount for 100.0% of all women with births.
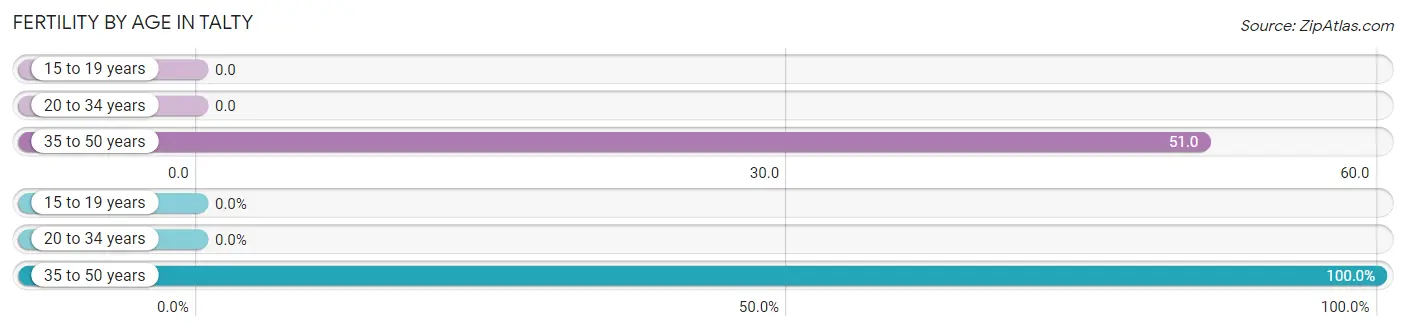
| Age Bracket | Women with Births | Births / 1,000 Women |
| 15 to 19 years | 0 (0.0%) | 0.0 |
| 20 to 34 years | 0 (0.0%) | 0.0 |
| 35 to 50 years | 15 (100.0%) | 51.0 |
| Total | 15 (100.0%) | 28.0 |
Fertility by Age by Marriage Status in Talty
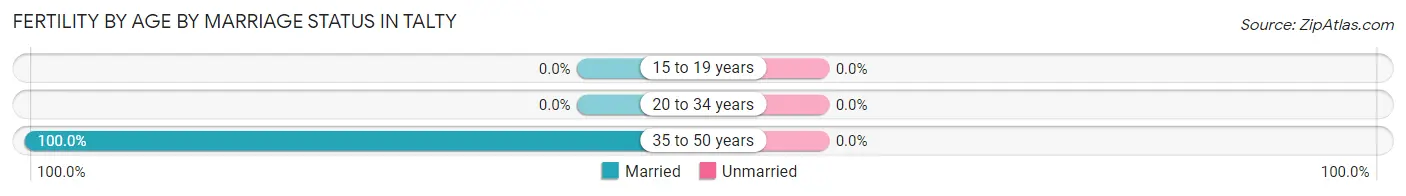
| Age Bracket | Married | Unmarried |
| 15 to 19 years | 0 (0.0%) | 0 (0.0%) |
| 20 to 34 years | 0 (0.0%) | 0 (0.0%) |
| 35 to 50 years | 15 (100.0%) | 0 (0.0%) |
| Total | 15 (100.0%) | 0 (0.0%) |
Fertility by Education in Talty
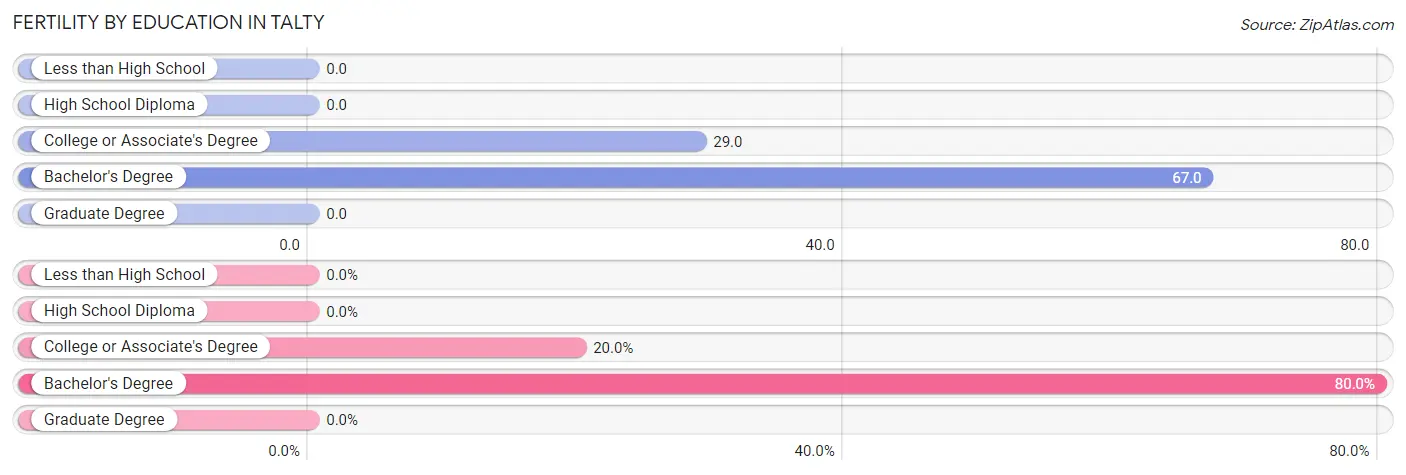
| Educational Attainment | Women with Births | Births / 1,000 Women |
| Less than High School | 0 (0.0%) | 0.0 |
| High School Diploma | 0 (0.0%) | 0.0 |
| College or Associate's Degree | 3 (20.0%) | 29.0 |
| Bachelor's Degree | 12 (80.0%) | 67.0 |
| Graduate Degree | 0 (0.0%) | 0.0 |
| Total | 15 (100.0%) | 28.0 |
Fertility by Education by Marriage Status in Talty
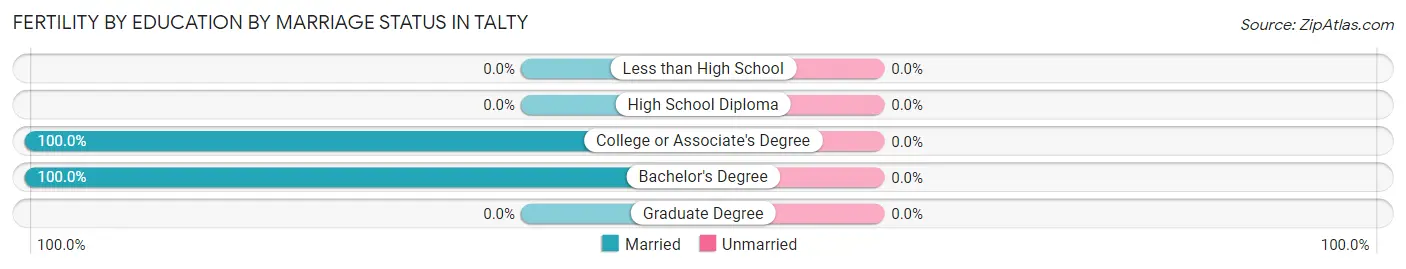
| Educational Attainment | Married | Unmarried |
| Less than High School | 0 (0.0%) | 0 (0.0%) |
| High School Diploma | 0 (0.0%) | 0 (0.0%) |
| College or Associate's Degree | 3 (100.0%) | 0 (0.0%) |
| Bachelor's Degree | 12 (100.0%) | 0 (0.0%) |
| Graduate Degree | 0 (0.0%) | 0 (0.0%) |
| Total | 15 (100.0%) | 0 (0.0%) |
Employment Characteristics in Talty
Employment by Class of Employer in Talty
Among the 1,342 employed individuals in Talty, private company employees (954 | 71.1%), self-employed (incorporated) (112 | 8.4%), and not-for-profit organizations (86 | 6.4%) make up the most common classes of employment.
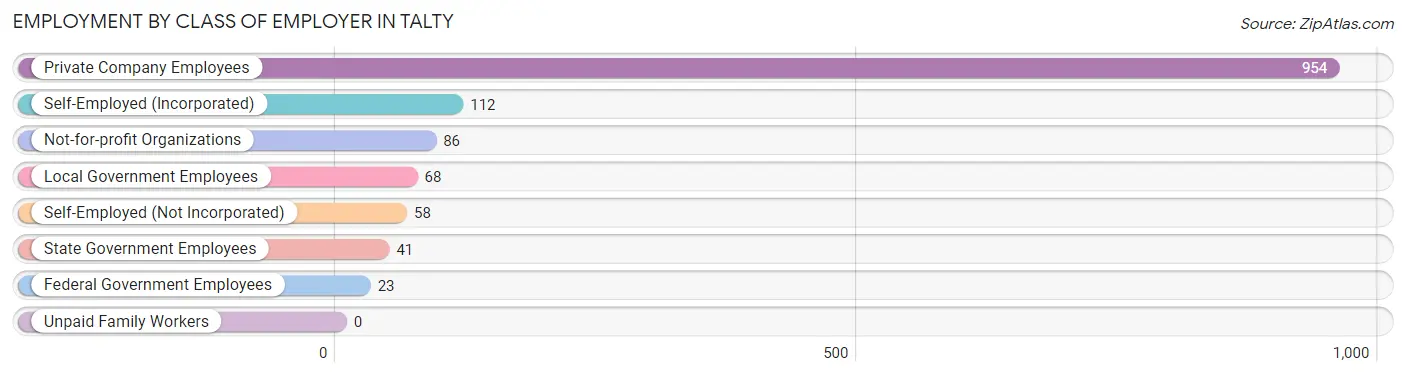
| Employer Class | # Employees | % Employees |
| Private Company Employees | 954 | 71.1% |
| Self-Employed (Incorporated) | 112 | 8.4% |
| Self-Employed (Not Incorporated) | 58 | 4.3% |
| Not-for-profit Organizations | 86 | 6.4% |
| Local Government Employees | 68 | 5.1% |
| State Government Employees | 41 | 3.1% |
| Federal Government Employees | 23 | 1.7% |
| Unpaid Family Workers | 0 | 0.0% |
| Total | 1,342 | 100.0% |
Employment Status by Age in Talty
According to the labor force statistics for Talty, out of the total population over 16 years of age (2,010), 71.3% or 1,433 individuals are in the labor force, with 4.3% or 62 of them unemployed. The age group with the highest labor force participation rate is 25 to 29 years, with 100.0% or 85 individuals in the labor force. Within the labor force, the 25 to 29 years age range has the highest percentage of unemployed individuals, with 56.5% or 48 of them being unemployed.
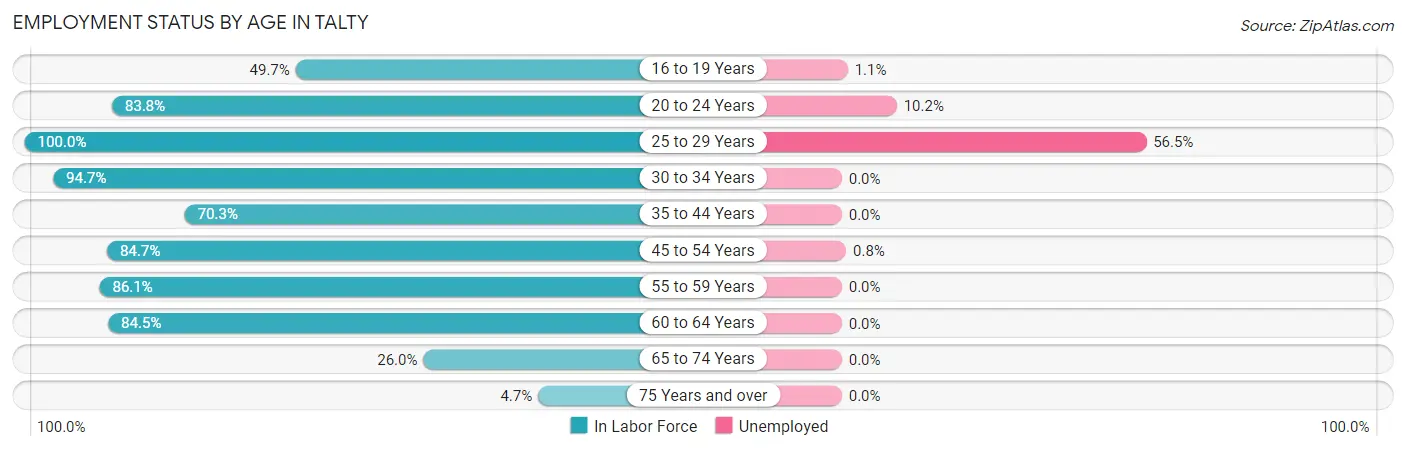
| Age Bracket | In Labor Force | Unemployed |
| 16 to 19 Years | 91 (49.7%) | 1 (1.1%) |
| 20 to 24 Years | 88 (83.8%) | 9 (10.2%) |
| 25 to 29 Years | 85 (100.0%) | 48 (56.5%) |
| 30 to 34 Years | 90 (94.7%) | 0 (0.0%) |
| 35 to 44 Years | 307 (70.3%) | 0 (0.0%) |
| 45 to 54 Years | 377 (84.7%) | 3 (0.8%) |
| 55 to 59 Years | 167 (86.1%) | 0 (0.0%) |
| 60 to 64 Years | 174 (84.5%) | 0 (0.0%) |
| 65 to 74 Years | 51 (26.0%) | 0 (0.0%) |
| 75 Years and over | 3 (4.7%) | 0 (0.0%) |
| Total | 1,433 (71.3%) | 62 (4.3%) |
Employment Status by Educational Attainment in Talty
According to labor force statistics for Talty, 82.1% of individuals (1,200) out of the total population between 25 and 64 years of age (1,462) are in the labor force, with 4.3% or 52 of them being unemployed. The group with the highest labor force participation rate are those with the educational attainment of less than high school, with 92.5% or 74 individuals in the labor force. Within the labor force, individuals with bachelor's degree or higher education have the highest percentage of unemployment, with 9.0% or 48 of them being unemployed.
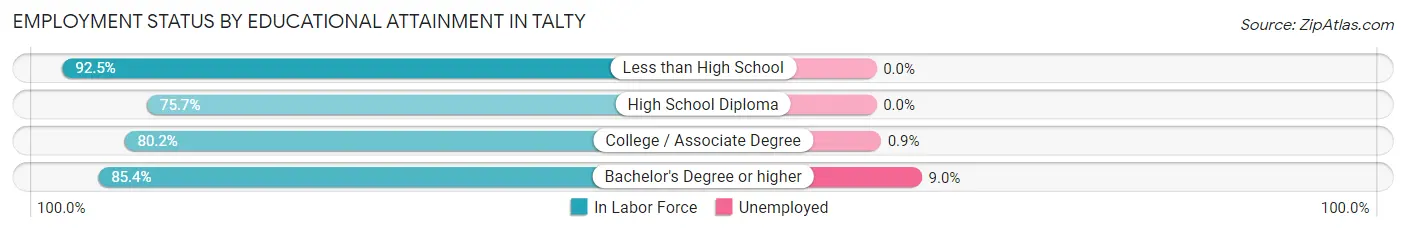
| Educational Attainment | In Labor Force | Unemployed |
| Less than High School | 74 (92.5%) | 0 (0.0%) |
| High School Diploma | 246 (75.7%) | 0 (0.0%) |
| College / Associate Degree | 349 (80.2%) | 4 (0.9%) |
| Bachelor's Degree or higher | 531 (85.4%) | 56 (9.0%) |
| Total | 1,200 (82.1%) | 63 (4.3%) |
Employment Occupations by Sex in Talty
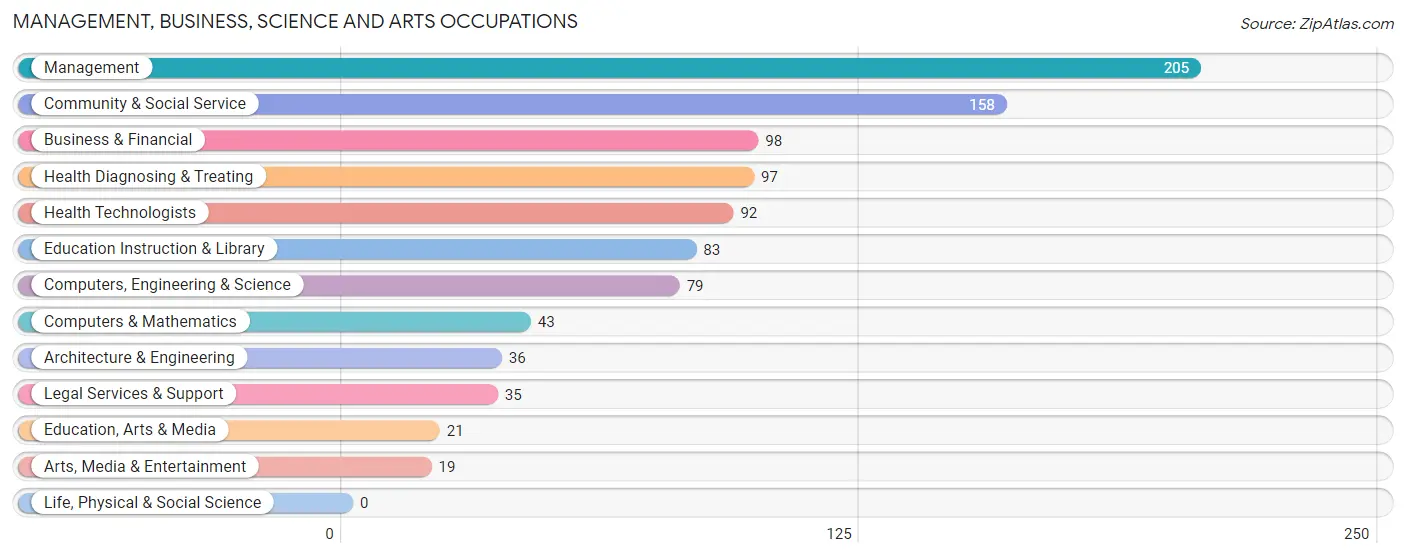
Management, Business, Science and Arts Occupations
The most common Management, Business, Science and Arts occupations in Talty are Management (205 | 14.9%), Community & Social Service (158 | 11.5%), Business & Financial (98 | 7.1%), Health Diagnosing & Treating (97 | 7.1%), and Health Technologists (92 | 6.7%).
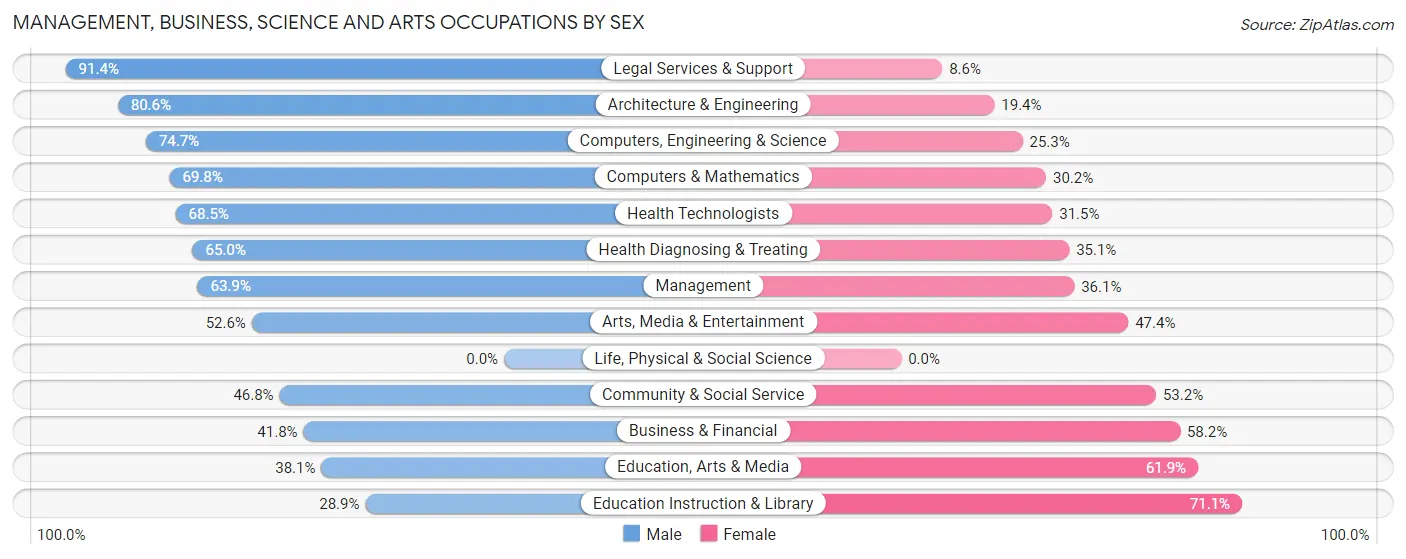
Management, Business, Science and Arts Occupations by Sex
Within the Management, Business, Science and Arts occupations in Talty, the most male-oriented occupations are Legal Services & Support (91.4%), Architecture & Engineering (80.6%), and Computers, Engineering & Science (74.7%), while the most female-oriented occupations are Education Instruction & Library (71.1%), Education, Arts & Media (61.9%), and Business & Financial (58.2%).
| Occupation | Male | Female |
| Management | 131 (63.9%) | 74 (36.1%) |
| Business & Financial | 41 (41.8%) | 57 (58.2%) |
| Computers, Engineering & Science | 59 (74.7%) | 20 (25.3%) |
| Computers & Mathematics | 30 (69.8%) | 13 (30.2%) |
| Architecture & Engineering | 29 (80.6%) | 7 (19.4%) |
| Life, Physical & Social Science | 0 (0.0%) | 0 (0.0%) |
| Community & Social Service | 74 (46.8%) | 84 (53.2%) |
| Education, Arts & Media | 8 (38.1%) | 13 (61.9%) |
| Legal Services & Support | 32 (91.4%) | 3 (8.6%) |
| Education Instruction & Library | 24 (28.9%) | 59 (71.1%) |
| Arts, Media & Entertainment | 10 (52.6%) | 9 (47.4%) |
| Health Diagnosing & Treating | 63 (64.9%) | 34 (35.0%) |
| Health Technologists | 63 (68.5%) | 29 (31.5%) |
| Total (Category) | 368 (57.8%) | 269 (42.2%) |
| Total (Overall) | 824 (60.1%) | 548 (39.9%) |
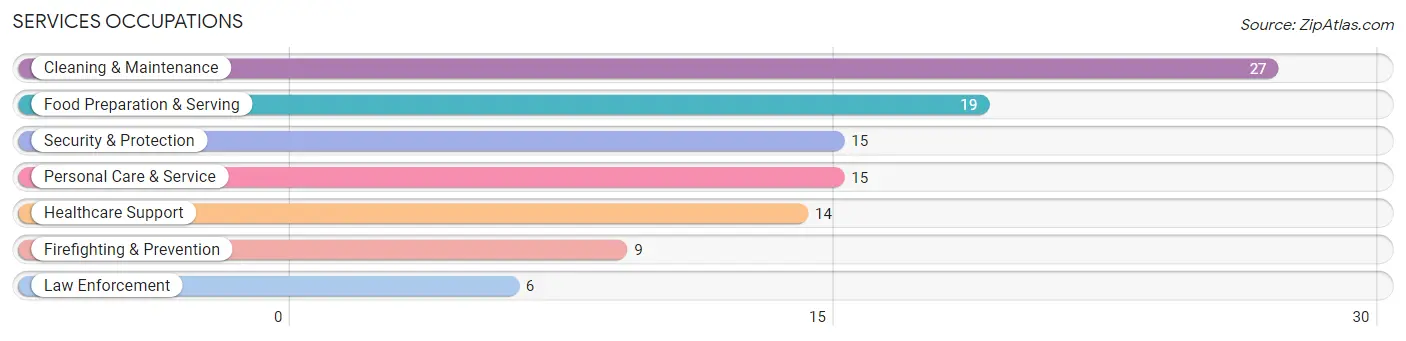
Services Occupations
The most common Services occupations in Talty are Cleaning & Maintenance (27 | 2.0%), Food Preparation & Serving (19 | 1.4%), Security & Protection (15 | 1.1%), Personal Care & Service (15 | 1.1%), and Healthcare Support (14 | 1.0%).
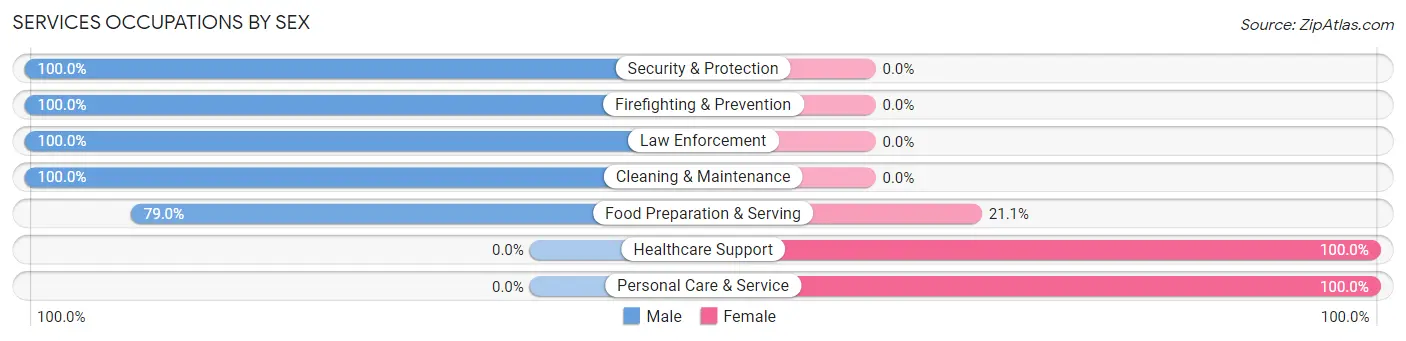
Services Occupations by Sex
Within the Services occupations in Talty, the most male-oriented occupations are Security & Protection (100.0%), Firefighting & Prevention (100.0%), and Law Enforcement (100.0%), while the most female-oriented occupations are Healthcare Support (100.0%), Personal Care & Service (100.0%), and Food Preparation & Serving (21.0%).
| Occupation | Male | Female |
| Healthcare Support | 0 (0.0%) | 14 (100.0%) |
| Security & Protection | 15 (100.0%) | 0 (0.0%) |
| Firefighting & Prevention | 9 (100.0%) | 0 (0.0%) |
| Law Enforcement | 6 (100.0%) | 0 (0.0%) |
| Food Preparation & Serving | 15 (78.9%) | 4 (21.0%) |
| Cleaning & Maintenance | 27 (100.0%) | 0 (0.0%) |
| Personal Care & Service | 0 (0.0%) | 15 (100.0%) |
| Total (Category) | 57 (63.3%) | 33 (36.7%) |
| Total (Overall) | 824 (60.1%) | 548 (39.9%) |
Sales and Office Occupations
The most common Sales and Office occupations in Talty are Sales & Related (192 | 14.0%), and Office & Administration (177 | 12.9%).
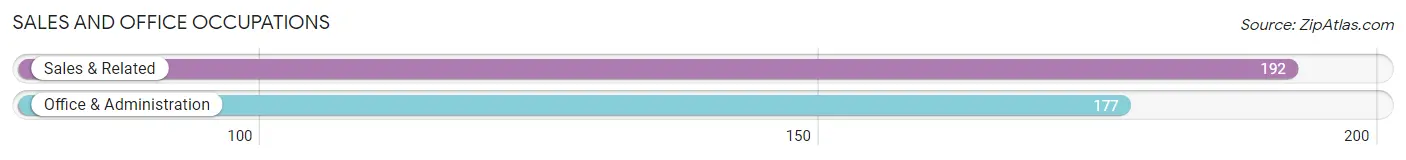
Sales and Office Occupations by Sex
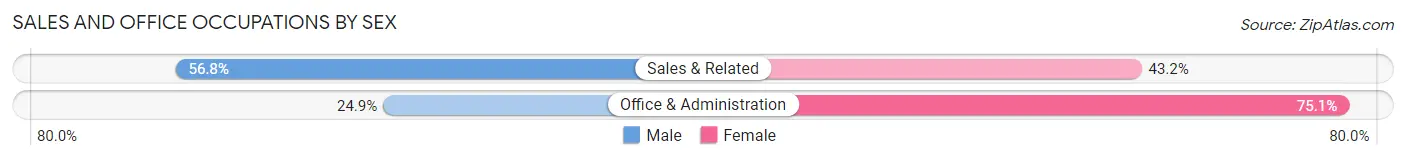
| Occupation | Male | Female |
| Sales & Related | 109 (56.8%) | 83 (43.2%) |
| Office & Administration | 44 (24.9%) | 133 (75.1%) |
| Total (Category) | 153 (41.5%) | 216 (58.5%) |
| Total (Overall) | 824 (60.1%) | 548 (39.9%) |
Natural Resources, Construction and Maintenance Occupations
The most common Natural Resources, Construction and Maintenance occupations in Talty are Construction & Extraction (73 | 5.3%), and Installation, Maintenance & Repair (49 | 3.6%).
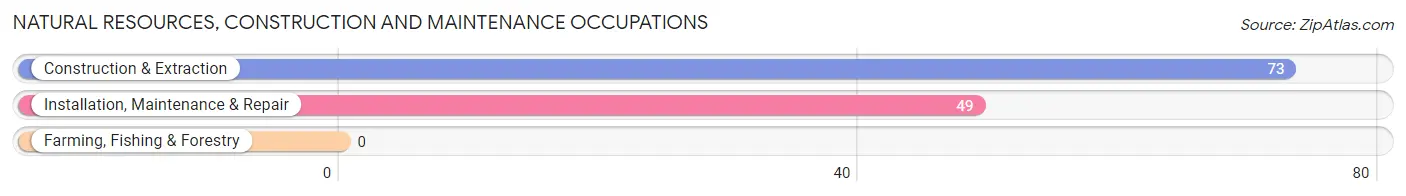
Natural Resources, Construction and Maintenance Occupations by Sex
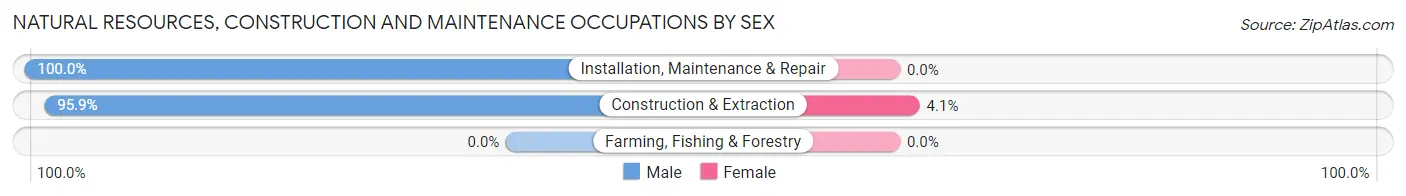
| Occupation | Male | Female |
| Farming, Fishing & Forestry | 0 (0.0%) | 0 (0.0%) |
| Construction & Extraction | 70 (95.9%) | 3 (4.1%) |
| Installation, Maintenance & Repair | 49 (100.0%) | 0 (0.0%) |
| Total (Category) | 119 (97.5%) | 3 (2.5%) |
| Total (Overall) | 824 (60.1%) | 548 (39.9%) |
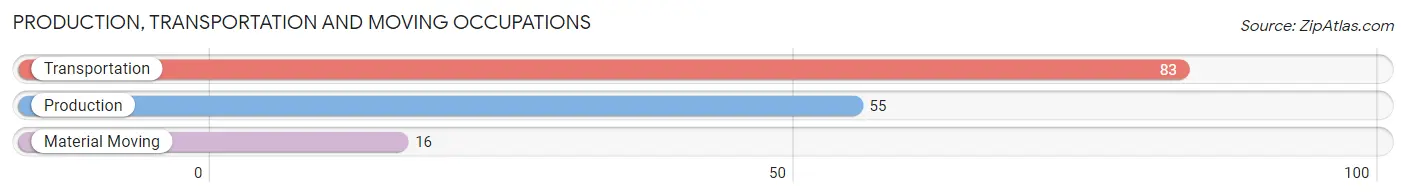
Production, Transportation and Moving Occupations
The most common Production, Transportation and Moving occupations in Talty are Transportation (83 | 6.0%), Production (55 | 4.0%), and Material Moving (16 | 1.2%).
Production, Transportation and Moving Occupations by Sex
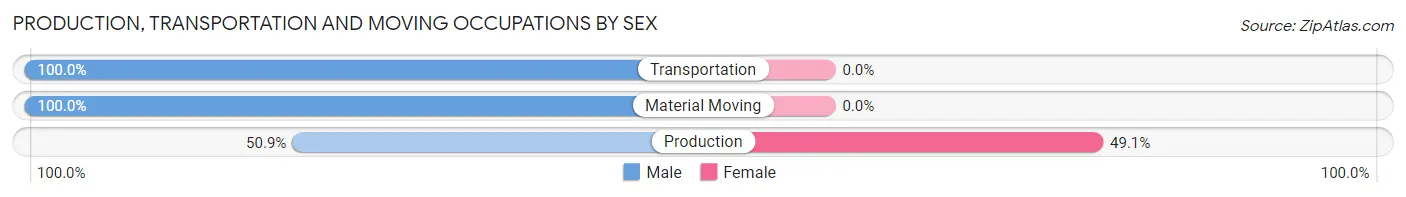
| Occupation | Male | Female |
| Production | 28 (50.9%) | 27 (49.1%) |
| Transportation | 83 (100.0%) | 0 (0.0%) |
| Material Moving | 16 (100.0%) | 0 (0.0%) |
| Total (Category) | 127 (82.5%) | 27 (17.5%) |
| Total (Overall) | 824 (60.1%) | 548 (39.9%) |
Employment Industries by Sex in Talty
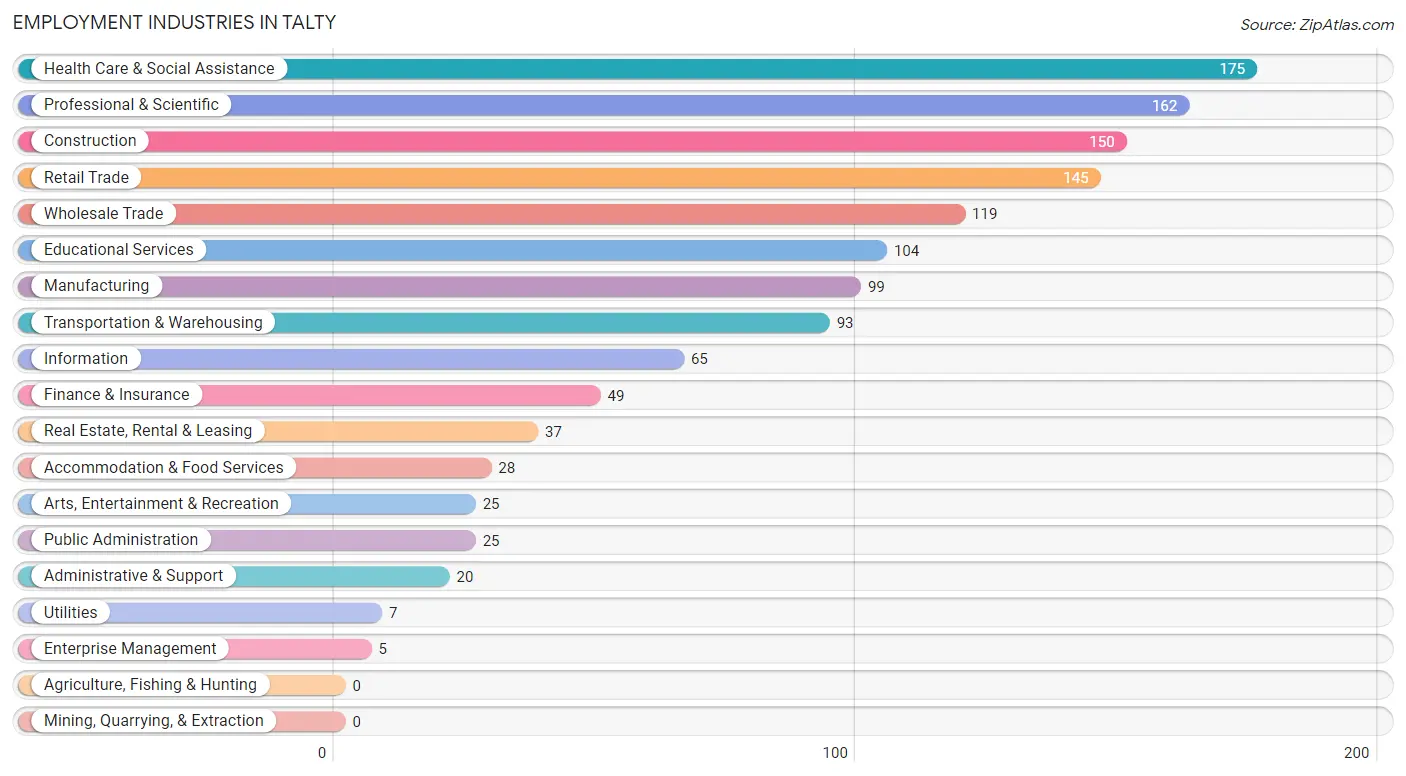
Employment Industries in Talty
The major employment industries in Talty include Health Care & Social Assistance (175 | 12.8%), Professional & Scientific (162 | 11.8%), Construction (150 | 10.9%), Retail Trade (145 | 10.6%), and Wholesale Trade (119 | 8.7%).
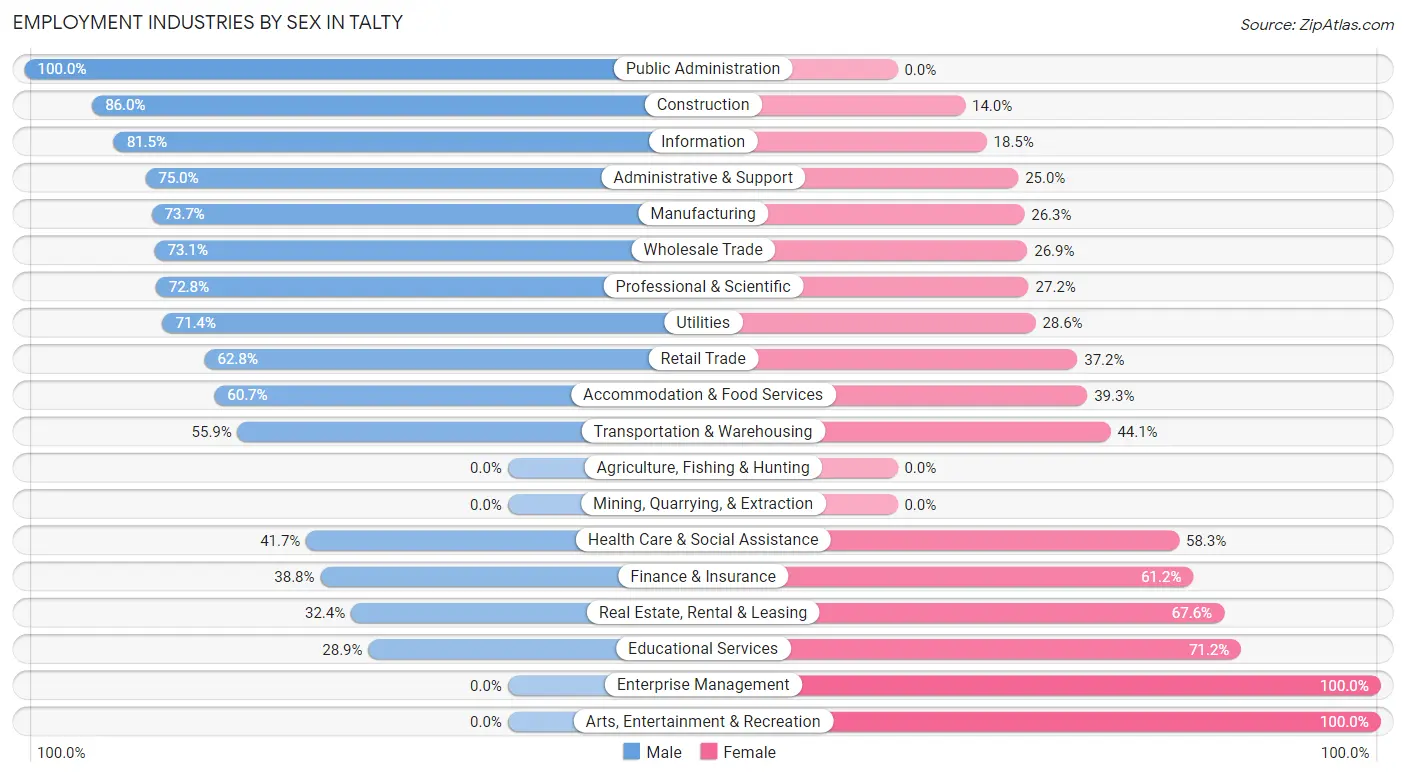
Employment Industries by Sex in Talty
The Talty industries that see more men than women are Public Administration (100.0%), Construction (86.0%), and Information (81.5%), whereas the industries that tend to have a higher number of women are Enterprise Management (100.0%), Arts, Entertainment & Recreation (100.0%), and Educational Services (71.2%).
| Industry | Male | Female |
| Agriculture, Fishing & Hunting | 0 (0.0%) | 0 (0.0%) |
| Mining, Quarrying, & Extraction | 0 (0.0%) | 0 (0.0%) |
| Construction | 129 (86.0%) | 21 (14.0%) |
| Manufacturing | 73 (73.7%) | 26 (26.3%) |
| Wholesale Trade | 87 (73.1%) | 32 (26.9%) |
| Retail Trade | 91 (62.8%) | 54 (37.2%) |
| Transportation & Warehousing | 52 (55.9%) | 41 (44.1%) |
| Utilities | 5 (71.4%) | 2 (28.6%) |
| Information | 53 (81.5%) | 12 (18.5%) |
| Finance & Insurance | 19 (38.8%) | 30 (61.2%) |
| Real Estate, Rental & Leasing | 12 (32.4%) | 25 (67.6%) |
| Professional & Scientific | 118 (72.8%) | 44 (27.2%) |
| Enterprise Management | 0 (0.0%) | 5 (100.0%) |
| Administrative & Support | 15 (75.0%) | 5 (25.0%) |
| Educational Services | 30 (28.8%) | 74 (71.2%) |
| Health Care & Social Assistance | 73 (41.7%) | 102 (58.3%) |
| Arts, Entertainment & Recreation | 0 (0.0%) | 25 (100.0%) |
| Accommodation & Food Services | 17 (60.7%) | 11 (39.3%) |
| Public Administration | 25 (100.0%) | 0 (0.0%) |
| Total | 824 (60.1%) | 548 (39.9%) |
Education in Talty
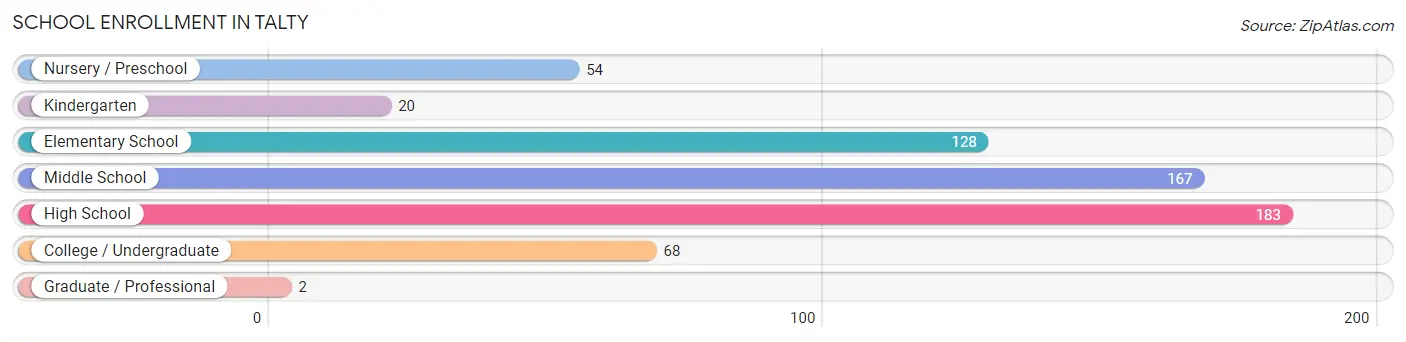
School Enrollment in Talty
The most common levels of schooling among the 622 students in Talty are high school (183 | 29.4%), middle school (167 | 26.9%), and elementary school (128 | 20.6%).
| School Level | # Students | % Students |
| Nursery / Preschool | 54 | 8.7% |
| Kindergarten | 20 | 3.2% |
| Elementary School | 128 | 20.6% |
| Middle School | 167 | 26.9% |
| High School | 183 | 29.4% |
| College / Undergraduate | 68 | 10.9% |
| Graduate / Professional | 2 | 0.3% |
| Total | 622 | 100.0% |
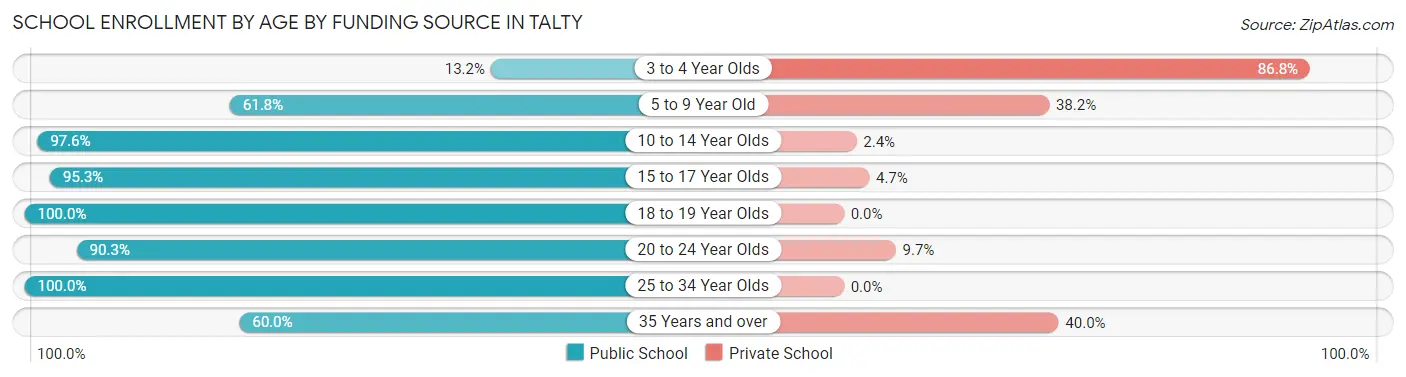
School Enrollment by Age by Funding Source in Talty
Out of a total of 622 students who are enrolled in schools in Talty, 101 (16.2%) attend a private institution, while the remaining 521 (83.8%) are enrolled in public schools. The age group of 3 to 4 year olds has the highest likelihood of being enrolled in private schools, with 33 (86.8% in the age bracket) enrolled. Conversely, the age group of 18 to 19 year olds has the lowest likelihood of being enrolled in a private school, with 66 (100.0% in the age bracket) attending a public institution.
| Age Bracket | Public School | Private School |
| 3 to 4 Year Olds | 5 (13.2%) | 33 (86.8%) |
| 5 to 9 Year Old | 84 (61.8%) | 52 (38.2%) |
| 10 to 14 Year Olds | 207 (97.6%) | 5 (2.4%) |
| 15 to 17 Year Olds | 121 (95.3%) | 6 (4.7%) |
| 18 to 19 Year Olds | 66 (100.0%) | 0 (0.0%) |
| 20 to 24 Year Olds | 28 (90.3%) | 3 (9.7%) |
| 25 to 34 Year Olds | 7 (100.0%) | 0 (0.0%) |
| 35 Years and over | 3 (60.0%) | 2 (40.0%) |
| Total | 521 (83.8%) | 101 (16.2%) |
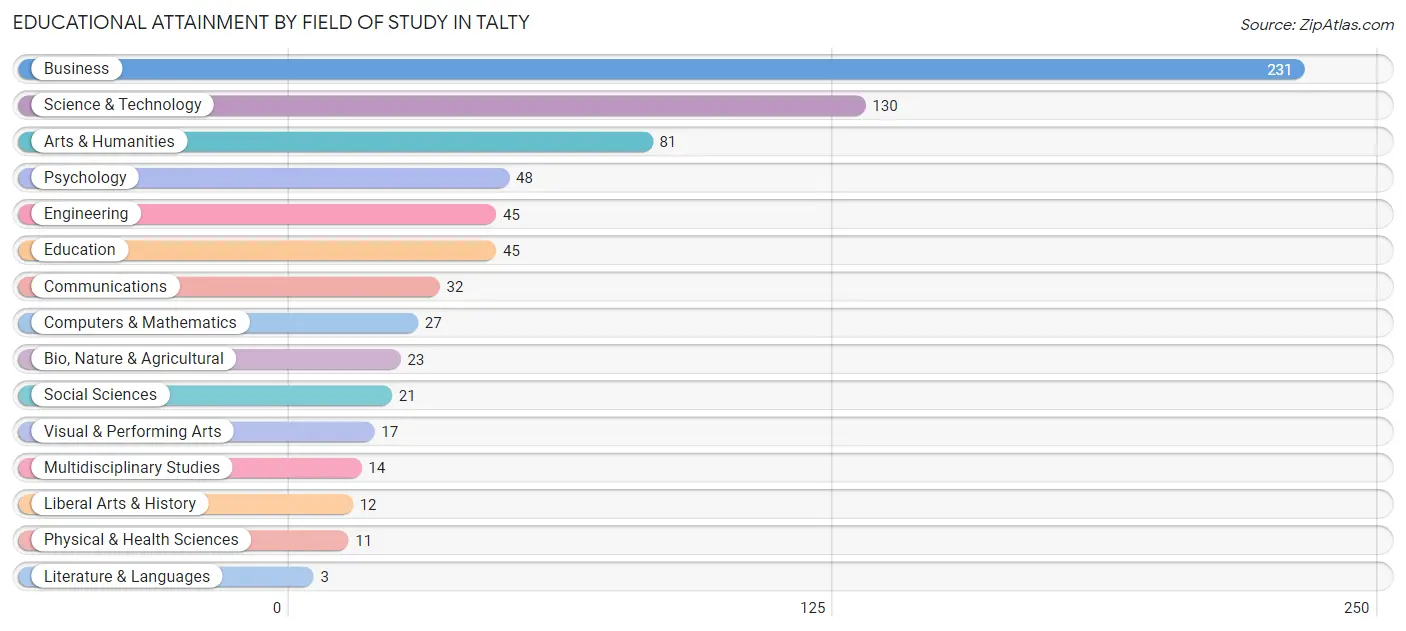
Educational Attainment by Field of Study in Talty
Business (231 | 31.2%), science & technology (130 | 17.6%), arts & humanities (81 | 11.0%), psychology (48 | 6.5%), and engineering (45 | 6.1%) are the most common fields of study among 740 individuals in Talty who have obtained a bachelor's degree or higher.
| Field of Study | # Graduates | % Graduates |
| Computers & Mathematics | 27 | 3.6% |
| Bio, Nature & Agricultural | 23 | 3.1% |
| Physical & Health Sciences | 11 | 1.5% |
| Psychology | 48 | 6.5% |
| Social Sciences | 21 | 2.8% |
| Engineering | 45 | 6.1% |
| Multidisciplinary Studies | 14 | 1.9% |
| Science & Technology | 130 | 17.6% |
| Business | 231 | 31.2% |
| Education | 45 | 6.1% |
| Literature & Languages | 3 | 0.4% |
| Liberal Arts & History | 12 | 1.6% |
| Visual & Performing Arts | 17 | 2.3% |
| Communications | 32 | 4.3% |
| Arts & Humanities | 81 | 11.0% |
| Total | 740 | 100.0% |
Transportation & Commute in Talty
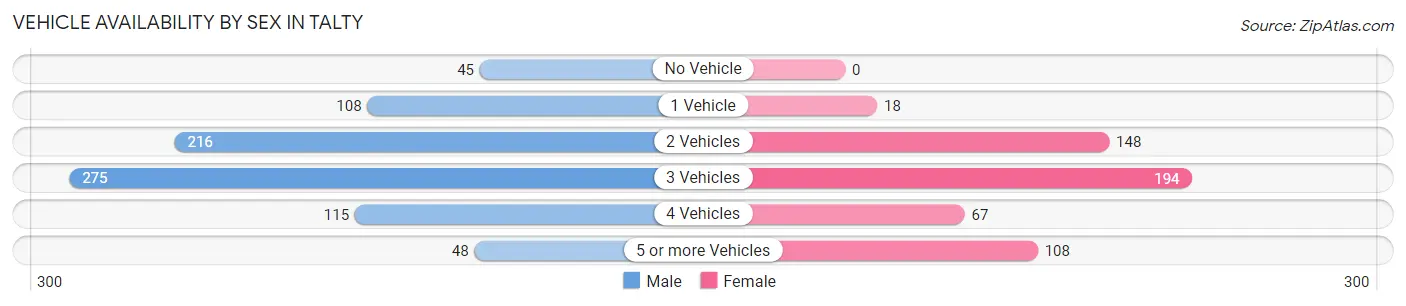
Vehicle Availability by Sex in Talty
The most prevalent vehicle ownership categories in Talty are males with 3 vehicles (275, accounting for 34.1%) and females with 3 vehicles (194, making up 51.4%).
| Vehicles Available | Male | Female |
| No Vehicle | 45 (5.6%) | 0 (0.0%) |
| 1 Vehicle | 108 (13.4%) | 18 (3.4%) |
| 2 Vehicles | 216 (26.8%) | 148 (27.7%) |
| 3 Vehicles | 275 (34.1%) | 194 (36.3%) |
| 4 Vehicles | 115 (14.2%) | 67 (12.5%) |
| 5 or more Vehicles | 48 (5.9%) | 108 (20.2%) |
| Total | 807 (100.0%) | 535 (100.0%) |
Commute Time in Talty
The most frequently occuring commute durations in Talty are 45 to 59 minutes (314 commuters, 26.7%), 10 to 14 minutes (201 commuters, 17.1%), and 30 to 34 minutes (154 commuters, 13.1%).
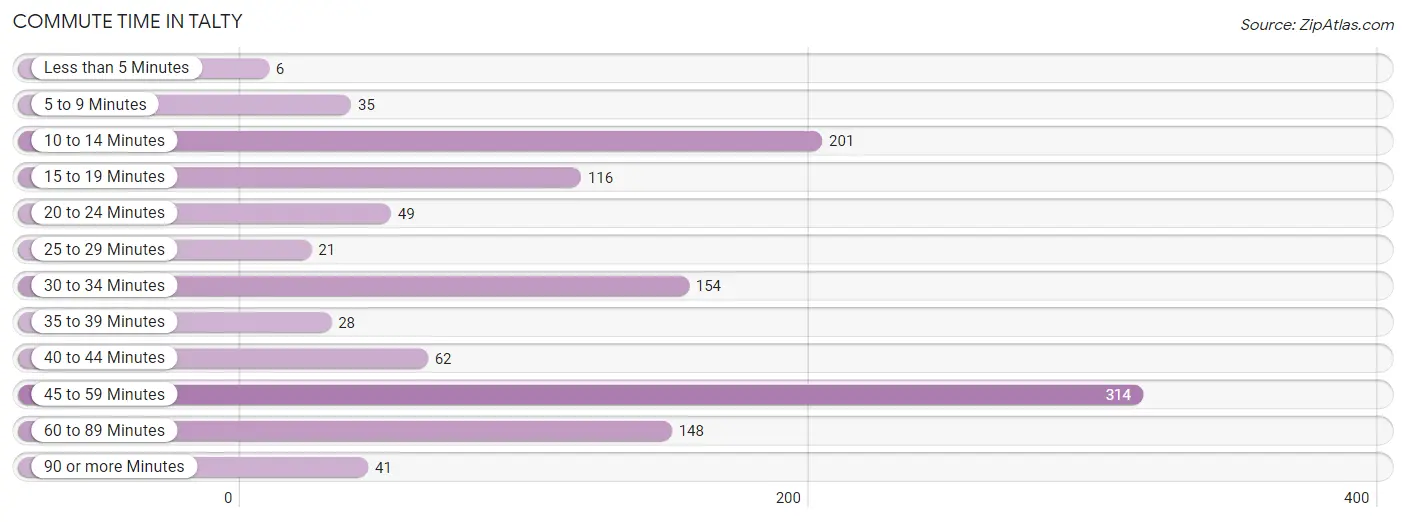
| Commute Time | # Commuters | % Commuters |
| Less than 5 Minutes | 6 | 0.5% |
| 5 to 9 Minutes | 35 | 3.0% |
| 10 to 14 Minutes | 201 | 17.1% |
| 15 to 19 Minutes | 116 | 9.9% |
| 20 to 24 Minutes | 49 | 4.2% |
| 25 to 29 Minutes | 21 | 1.8% |
| 30 to 34 Minutes | 154 | 13.1% |
| 35 to 39 Minutes | 28 | 2.4% |
| 40 to 44 Minutes | 62 | 5.3% |
| 45 to 59 Minutes | 314 | 26.7% |
| 60 to 89 Minutes | 148 | 12.6% |
| 90 or more Minutes | 41 | 3.5% |
Commute Time by Sex in Talty
The most common commute times in Talty are 45 to 59 minutes (195 commuters, 27.4%) for males and 45 to 59 minutes (119 commuters, 25.7%) for females.
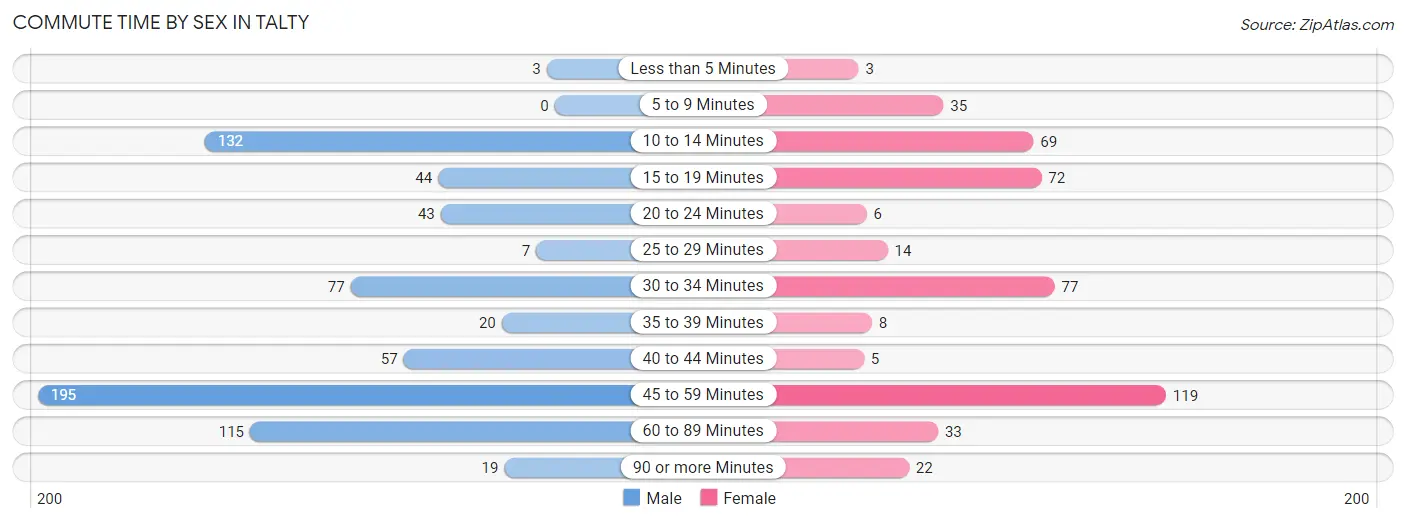
| Commute Time | Male | Female |
| Less than 5 Minutes | 3 (0.4%) | 3 (0.6%) |
| 5 to 9 Minutes | 0 (0.0%) | 35 (7.6%) |
| 10 to 14 Minutes | 132 (18.5%) | 69 (14.9%) |
| 15 to 19 Minutes | 44 (6.2%) | 72 (15.5%) |
| 20 to 24 Minutes | 43 (6.0%) | 6 (1.3%) |
| 25 to 29 Minutes | 7 (1.0%) | 14 (3.0%) |
| 30 to 34 Minutes | 77 (10.8%) | 77 (16.6%) |
| 35 to 39 Minutes | 20 (2.8%) | 8 (1.7%) |
| 40 to 44 Minutes | 57 (8.0%) | 5 (1.1%) |
| 45 to 59 Minutes | 195 (27.4%) | 119 (25.7%) |
| 60 to 89 Minutes | 115 (16.2%) | 33 (7.1%) |
| 90 or more Minutes | 19 (2.7%) | 22 (4.8%) |
Time of Departure to Work by Sex in Talty
The most frequent times of departure to work in Talty are 6:30 AM to 6:59 AM (121, 17.0%) for males and 7:00 AM to 7:29 AM (113, 24.4%) for females.
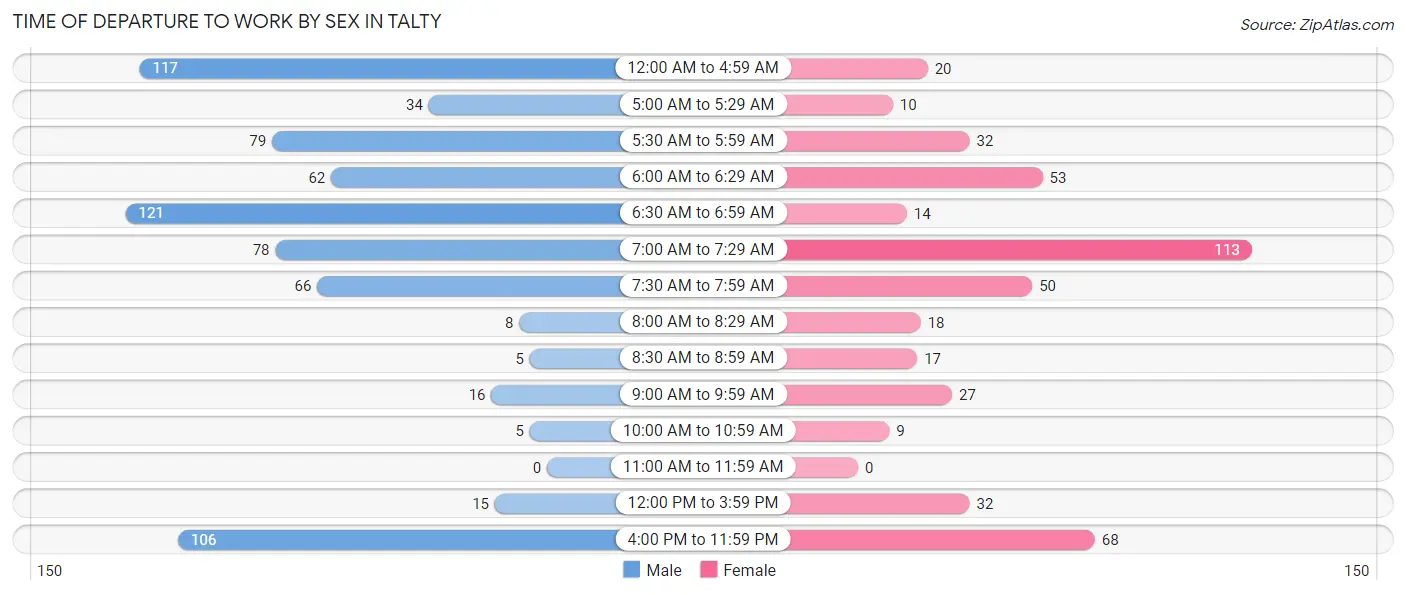
| Time of Departure | Male | Female |
| 12:00 AM to 4:59 AM | 117 (16.4%) | 20 (4.3%) |
| 5:00 AM to 5:29 AM | 34 (4.8%) | 10 (2.2%) |
| 5:30 AM to 5:59 AM | 79 (11.1%) | 32 (6.9%) |
| 6:00 AM to 6:29 AM | 62 (8.7%) | 53 (11.5%) |
| 6:30 AM to 6:59 AM | 121 (17.0%) | 14 (3.0%) |
| 7:00 AM to 7:29 AM | 78 (11.0%) | 113 (24.4%) |
| 7:30 AM to 7:59 AM | 66 (9.3%) | 50 (10.8%) |
| 8:00 AM to 8:29 AM | 8 (1.1%) | 18 (3.9%) |
| 8:30 AM to 8:59 AM | 5 (0.7%) | 17 (3.7%) |
| 9:00 AM to 9:59 AM | 16 (2.2%) | 27 (5.8%) |
| 10:00 AM to 10:59 AM | 5 (0.7%) | 9 (1.9%) |
| 11:00 AM to 11:59 AM | 0 (0.0%) | 0 (0.0%) |
| 12:00 PM to 3:59 PM | 15 (2.1%) | 32 (6.9%) |
| 4:00 PM to 11:59 PM | 106 (14.9%) | 68 (14.7%) |
| Total | 712 (100.0%) | 463 (100.0%) |
Housing Occupancy in Talty
Occupancy by Ownership in Talty
Of the total 834 dwellings in Talty, owner-occupied units account for 812 (97.4%), while renter-occupied units make up 22 (2.6%).
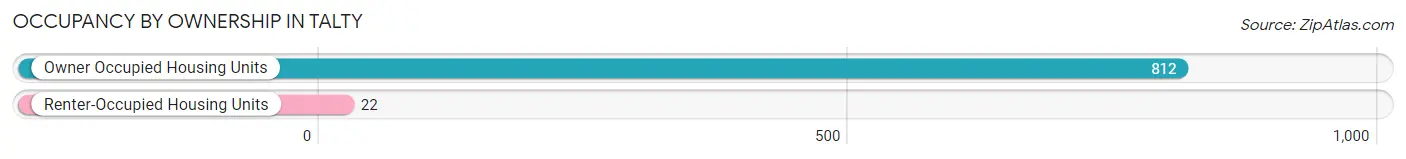
| Occupancy | # Housing Units | % Housing Units |
| Owner Occupied Housing Units | 812 | 97.4% |
| Renter-Occupied Housing Units | 22 | 2.6% |
| Total Occupied Housing Units | 834 | 100.0% |
Occupancy by Household Size in Talty
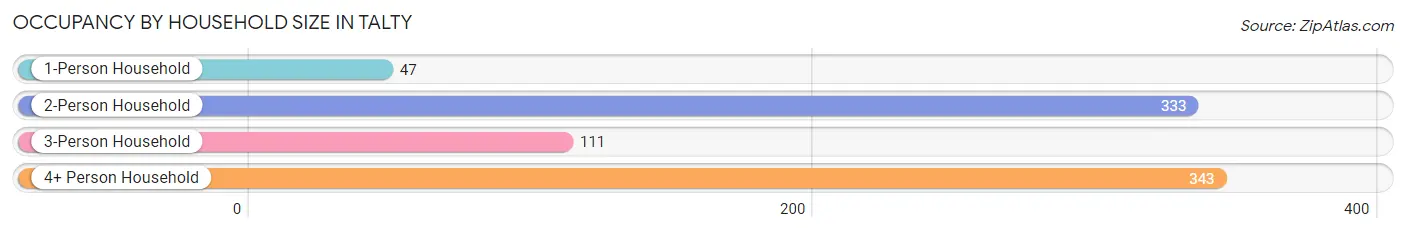
| Household Size | # Housing Units | % Housing Units |
| 1-Person Household | 47 | 5.6% |
| 2-Person Household | 333 | 39.9% |
| 3-Person Household | 111 | 13.3% |
| 4+ Person Household | 343 | 41.1% |
| Total Housing Units | 834 | 100.0% |
Occupancy by Ownership by Household Size in Talty
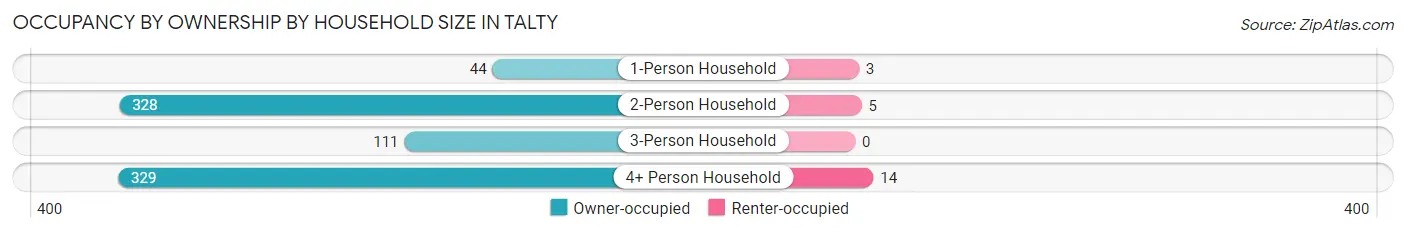
| Household Size | Owner-occupied | Renter-occupied |
| 1-Person Household | 44 (93.6%) | 3 (6.4%) |
| 2-Person Household | 328 (98.5%) | 5 (1.5%) |
| 3-Person Household | 111 (100.0%) | 0 (0.0%) |
| 4+ Person Household | 329 (95.9%) | 14 (4.1%) |
| Total Housing Units | 812 (97.4%) | 22 (2.6%) |
Occupancy by Educational Attainment in Talty
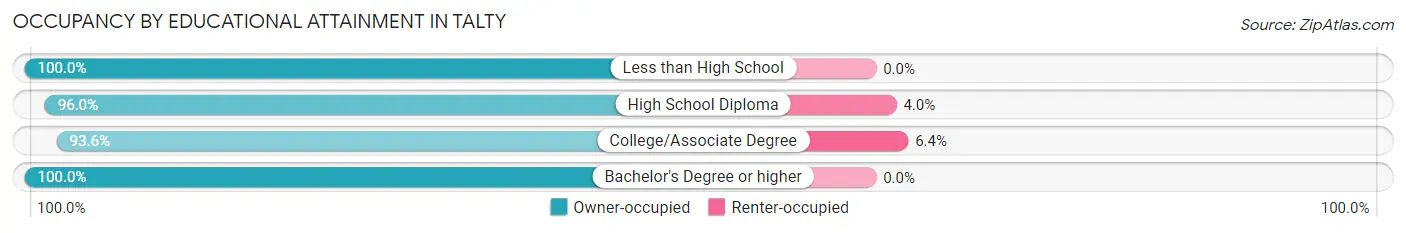
| Household Size | Owner-occupied | Renter-occupied |
| Less than High School | 33 (100.0%) | 0 (0.0%) |
| High School Diploma | 167 (96.0%) | 7 (4.0%) |
| College/Associate Degree | 221 (93.6%) | 15 (6.4%) |
| Bachelor's Degree or higher | 391 (100.0%) | 0 (0.0%) |
Occupancy by Age of Householder in Talty
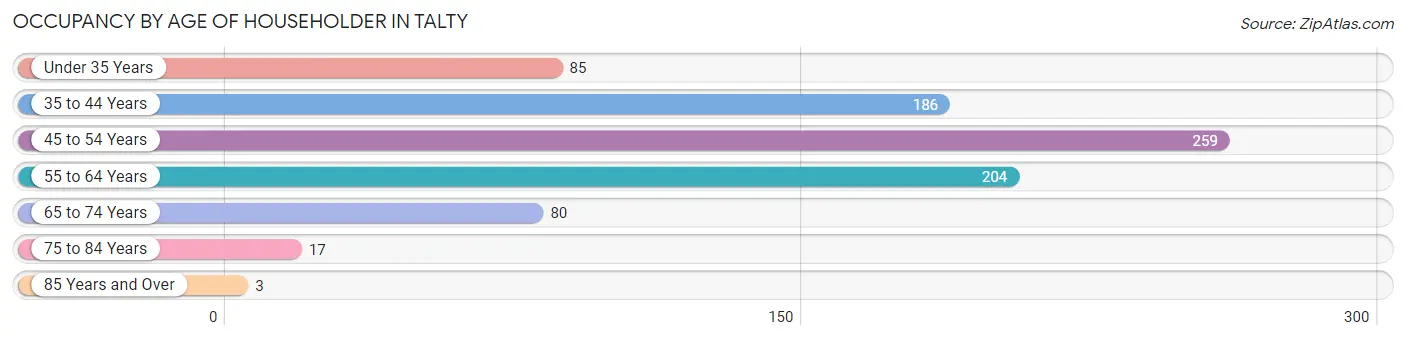
| Age Bracket | # Households | % Households |
| Under 35 Years | 85 | 10.2% |
| 35 to 44 Years | 186 | 22.3% |
| 45 to 54 Years | 259 | 31.1% |
| 55 to 64 Years | 204 | 24.5% |
| 65 to 74 Years | 80 | 9.6% |
| 75 to 84 Years | 17 | 2.0% |
| 85 Years and Over | 3 | 0.4% |
| Total | 834 | 100.0% |
Housing Finances in Talty
Median Income by Occupancy in Talty
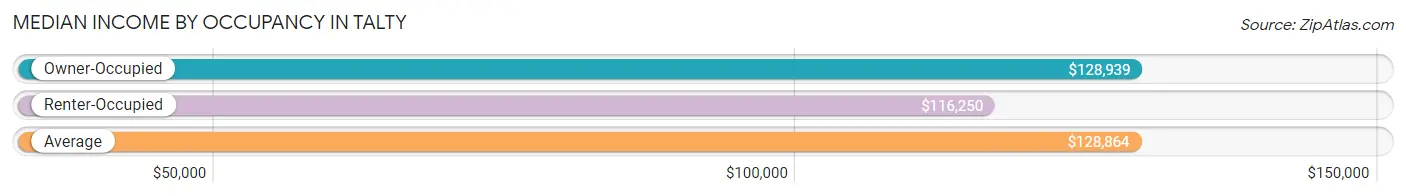
| Occupancy Type | # Households | Median Income |
| Owner-Occupied | 812 (97.4%) | $128,939 |
| Renter-Occupied | 22 (2.6%) | $116,250 |
| Average | 834 (100.0%) | $128,864 |
Occupancy by Householder Income Bracket in Talty
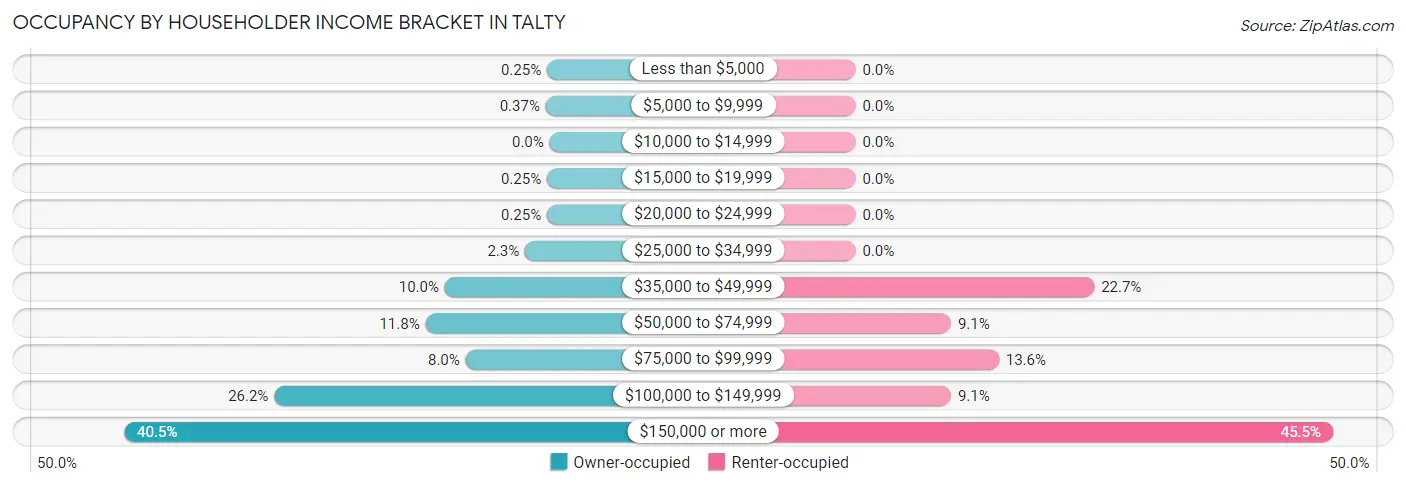
| Income Bracket | Owner-occupied | Renter-occupied |
| Less than $5,000 | 2 (0.3%) | 0 (0.0%) |
| $5,000 to $9,999 | 3 (0.4%) | 0 (0.0%) |
| $10,000 to $14,999 | 0 (0.0%) | 0 (0.0%) |
| $15,000 to $19,999 | 2 (0.3%) | 0 (0.0%) |
| $20,000 to $24,999 | 2 (0.3%) | 0 (0.0%) |
| $25,000 to $34,999 | 19 (2.3%) | 0 (0.0%) |
| $35,000 to $49,999 | 81 (10.0%) | 5 (22.7%) |
| $50,000 to $74,999 | 96 (11.8%) | 2 (9.1%) |
| $75,000 to $99,999 | 65 (8.0%) | 3 (13.6%) |
| $100,000 to $149,999 | 213 (26.2%) | 2 (9.1%) |
| $150,000 or more | 329 (40.5%) | 10 (45.5%) |
| Total | 812 (100.0%) | 22 (100.0%) |
Monthly Housing Cost Tiers in Talty
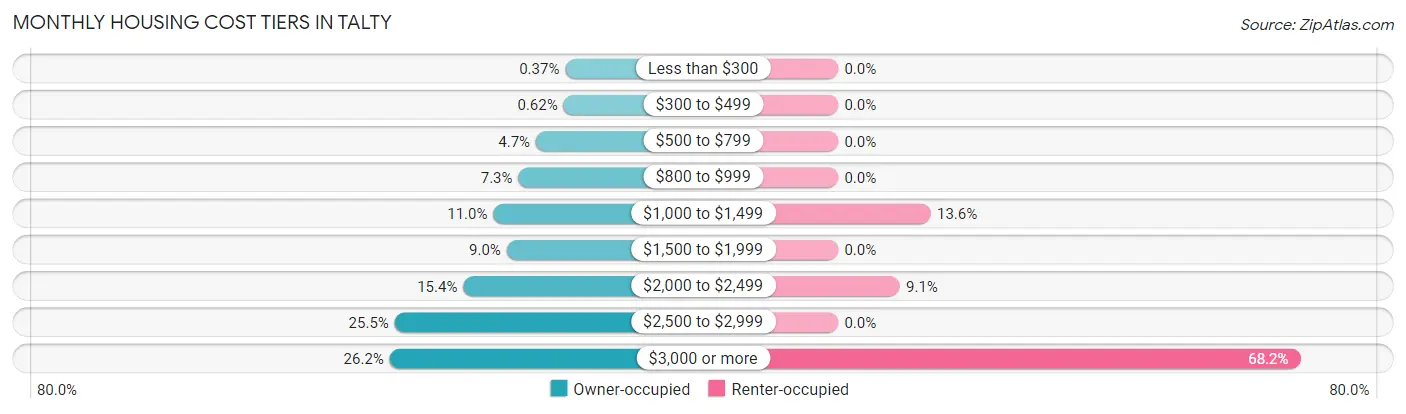
| Monthly Cost | Owner-occupied | Renter-occupied |
| Less than $300 | 3 (0.4%) | 0 (0.0%) |
| $300 to $499 | 5 (0.6%) | 0 (0.0%) |
| $500 to $799 | 38 (4.7%) | 0 (0.0%) |
| $800 to $999 | 59 (7.3%) | 0 (0.0%) |
| $1,000 to $1,499 | 89 (11.0%) | 3 (13.6%) |
| $1,500 to $1,999 | 73 (9.0%) | 0 (0.0%) |
| $2,000 to $2,499 | 125 (15.4%) | 2 (9.1%) |
| $2,500 to $2,999 | 207 (25.5%) | 0 (0.0%) |
| $3,000 or more | 213 (26.2%) | 15 (68.2%) |
| Total | 812 (100.0%) | 22 (100.0%) |
Physical Housing Characteristics in Talty
Housing Structures in Talty
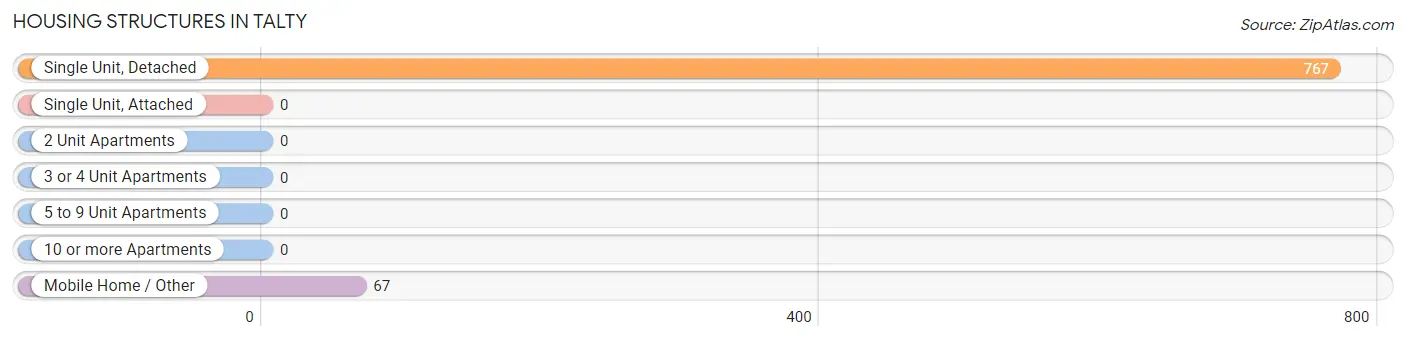
| Structure Type | # Housing Units | % Housing Units |
| Single Unit, Detached | 767 | 92.0% |
| Single Unit, Attached | 0 | 0.0% |
| 2 Unit Apartments | 0 | 0.0% |
| 3 or 4 Unit Apartments | 0 | 0.0% |
| 5 to 9 Unit Apartments | 0 | 0.0% |
| 10 or more Apartments | 0 | 0.0% |
| Mobile Home / Other | 67 | 8.0% |
| Total | 834 | 100.0% |
Housing Structures by Occupancy in Talty
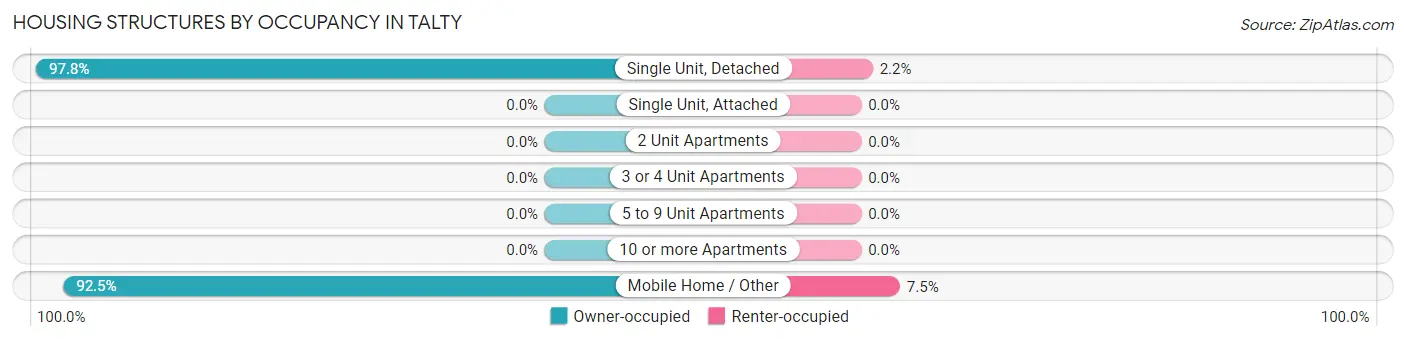
| Structure Type | Owner-occupied | Renter-occupied |
| Single Unit, Detached | 750 (97.8%) | 17 (2.2%) |
| Single Unit, Attached | 0 (0.0%) | 0 (0.0%) |
| 2 Unit Apartments | 0 (0.0%) | 0 (0.0%) |
| 3 or 4 Unit Apartments | 0 (0.0%) | 0 (0.0%) |
| 5 to 9 Unit Apartments | 0 (0.0%) | 0 (0.0%) |
| 10 or more Apartments | 0 (0.0%) | 0 (0.0%) |
| Mobile Home / Other | 62 (92.5%) | 5 (7.5%) |
| Total | 812 (97.4%) | 22 (2.6%) |
Housing Structures by Number of Rooms in Talty
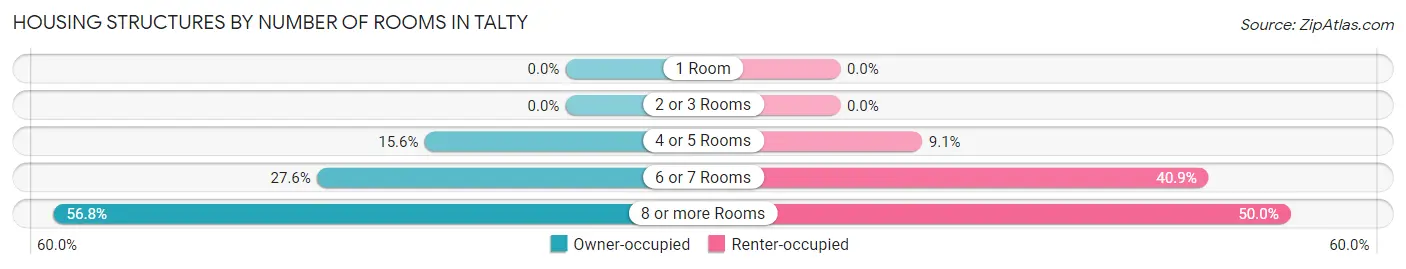
| Number of Rooms | Owner-occupied | Renter-occupied |
| 1 Room | 0 (0.0%) | 0 (0.0%) |
| 2 or 3 Rooms | 0 (0.0%) | 0 (0.0%) |
| 4 or 5 Rooms | 127 (15.6%) | 2 (9.1%) |
| 6 or 7 Rooms | 224 (27.6%) | 9 (40.9%) |
| 8 or more Rooms | 461 (56.8%) | 11 (50.0%) |
| Total | 812 (100.0%) | 22 (100.0%) |
Housing Structure by Heating Type in Talty
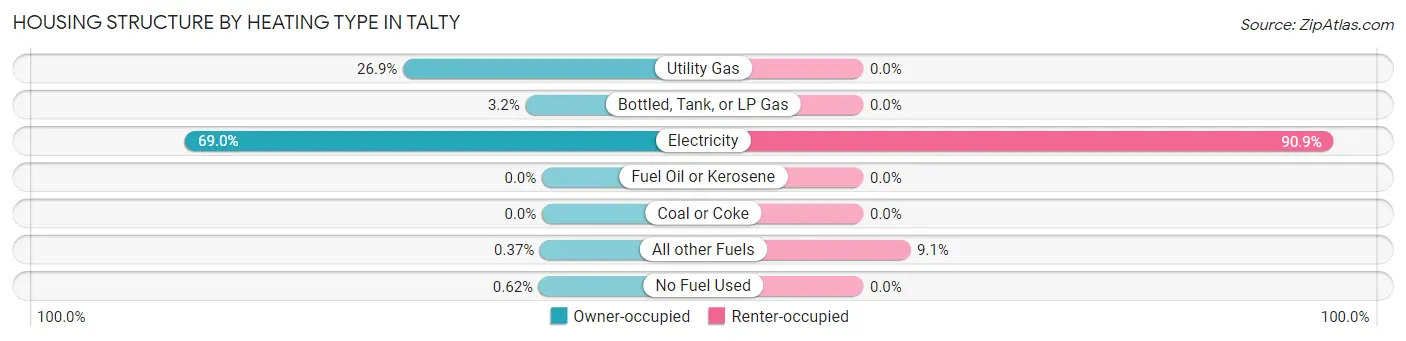
| Heating Type | Owner-occupied | Renter-occupied |
| Utility Gas | 218 (26.9%) | 0 (0.0%) |
| Bottled, Tank, or LP Gas | 26 (3.2%) | 0 (0.0%) |
| Electricity | 560 (69.0%) | 20 (90.9%) |
| Fuel Oil or Kerosene | 0 (0.0%) | 0 (0.0%) |
| Coal or Coke | 0 (0.0%) | 0 (0.0%) |
| All other Fuels | 3 (0.4%) | 2 (9.1%) |
| No Fuel Used | 5 (0.6%) | 0 (0.0%) |
| Total | 812 (100.0%) | 22 (100.0%) |
Household Vehicle Usage in Talty
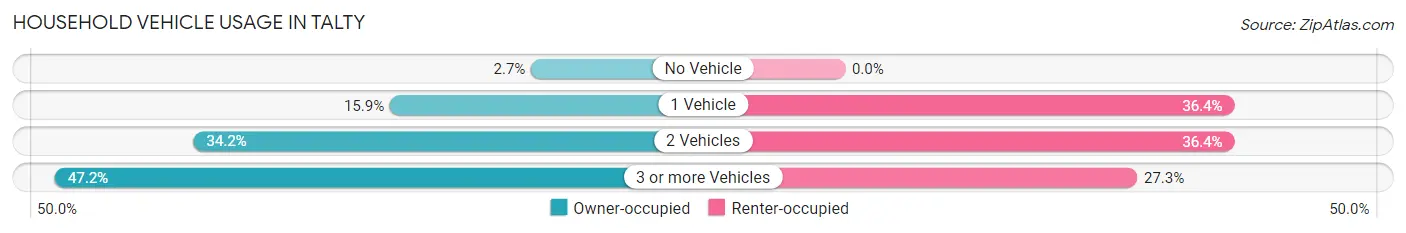
| Vehicles per Household | Owner-occupied | Renter-occupied |
| No Vehicle | 22 (2.7%) | 0 (0.0%) |
| 1 Vehicle | 129 (15.9%) | 8 (36.4%) |
| 2 Vehicles | 278 (34.2%) | 8 (36.4%) |
| 3 or more Vehicles | 383 (47.2%) | 6 (27.3%) |
| Total | 812 (100.0%) | 22 (100.0%) |
Real Estate & Mortgages in Talty
Real Estate and Mortgage Overview in Talty
| Characteristic | Without Mortgage | With Mortgage |
| Housing Units | 163 | 649 |
| Median Property Value | $411,000 | $413,400 |
| Median Household Income | $121,793 | $287 |
| Monthly Housing Costs | $1,016 | $213 |
| Real Estate Taxes | $5,927 | $2 |
Property Value by Mortgage Status in Talty
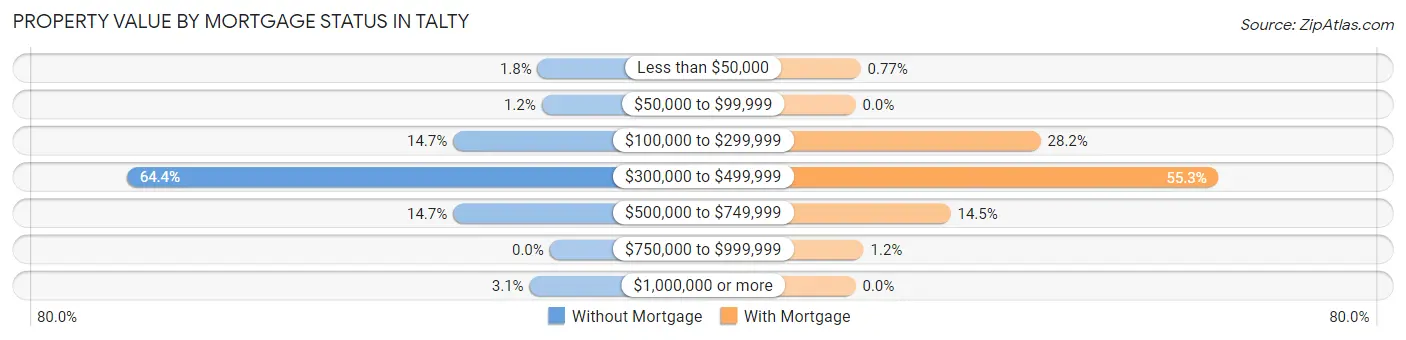
| Property Value | Without Mortgage | With Mortgage |
| Less than $50,000 | 3 (1.8%) | 5 (0.8%) |
| $50,000 to $99,999 | 2 (1.2%) | 0 (0.0%) |
| $100,000 to $299,999 | 24 (14.7%) | 183 (28.2%) |
| $300,000 to $499,999 | 105 (64.4%) | 359 (55.3%) |
| $500,000 to $749,999 | 24 (14.7%) | 94 (14.5%) |
| $750,000 to $999,999 | 0 (0.0%) | 8 (1.2%) |
| $1,000,000 or more | 5 (3.1%) | 0 (0.0%) |
| Total | 163 (100.0%) | 649 (100.0%) |
Household Income by Mortgage Status in Talty
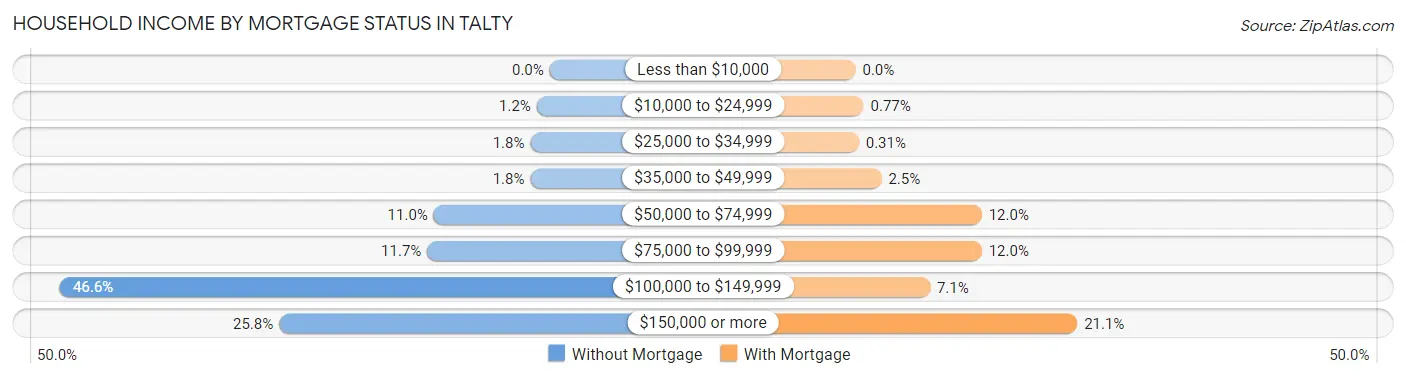
| Household Income | Without Mortgage | With Mortgage |
| Less than $10,000 | 0 (0.0%) | 0 (0.0%) |
| $10,000 to $24,999 | 2 (1.2%) | 5 (0.8%) |
| $25,000 to $34,999 | 3 (1.8%) | 2 (0.3%) |
| $35,000 to $49,999 | 3 (1.8%) | 16 (2.5%) |
| $50,000 to $74,999 | 18 (11.0%) | 78 (12.0%) |
| $75,000 to $99,999 | 19 (11.7%) | 78 (12.0%) |
| $100,000 to $149,999 | 76 (46.6%) | 46 (7.1%) |
| $150,000 or more | 42 (25.8%) | 137 (21.1%) |
| Total | 163 (100.0%) | 649 (100.0%) |
Property Value to Household Income Ratio in Talty
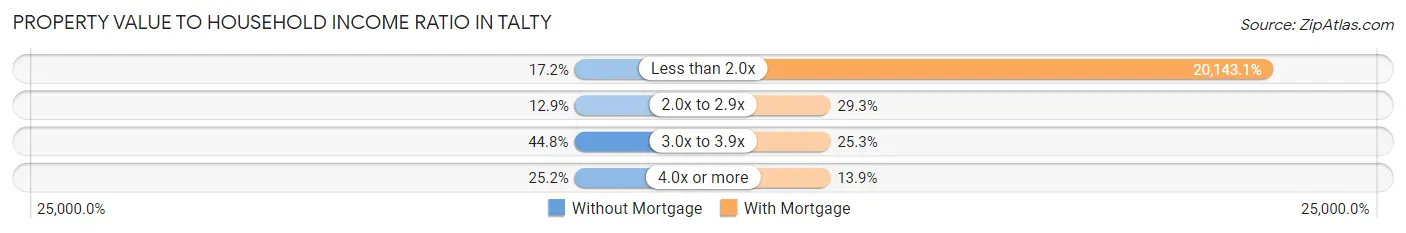
| Value-to-Income Ratio | Without Mortgage | With Mortgage |
| Less than 2.0x | 28 (17.2%) | 130,729 (20,143.1%) |
| 2.0x to 2.9x | 21 (12.9%) | 190 (29.3%) |
| 3.0x to 3.9x | 73 (44.8%) | 164 (25.3%) |
| 4.0x or more | 41 (25.2%) | 90 (13.9%) |
| Total | 163 (100.0%) | 649 (100.0%) |
Real Estate Taxes by Mortgage Status in Talty
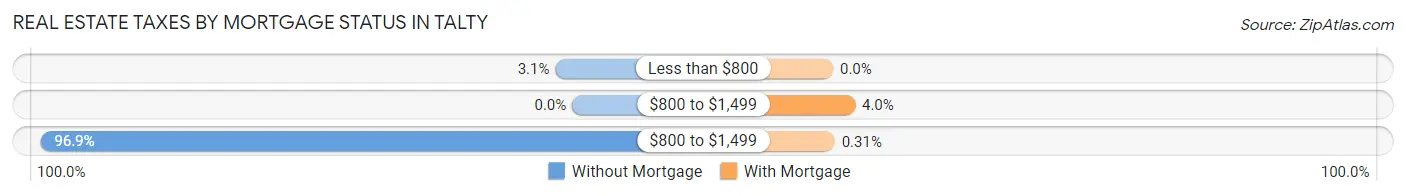
| Property Taxes | Without Mortgage | With Mortgage |
| Less than $800 | 5 (3.1%) | 0 (0.0%) |
| $800 to $1,499 | 0 (0.0%) | 26 (4.0%) |
| $800 to $1,499 | 158 (96.9%) | 2 (0.3%) |
| Total | 163 (100.0%) | 649 (100.0%) |
Health & Disability in Talty
Health Insurance Coverage by Age in Talty
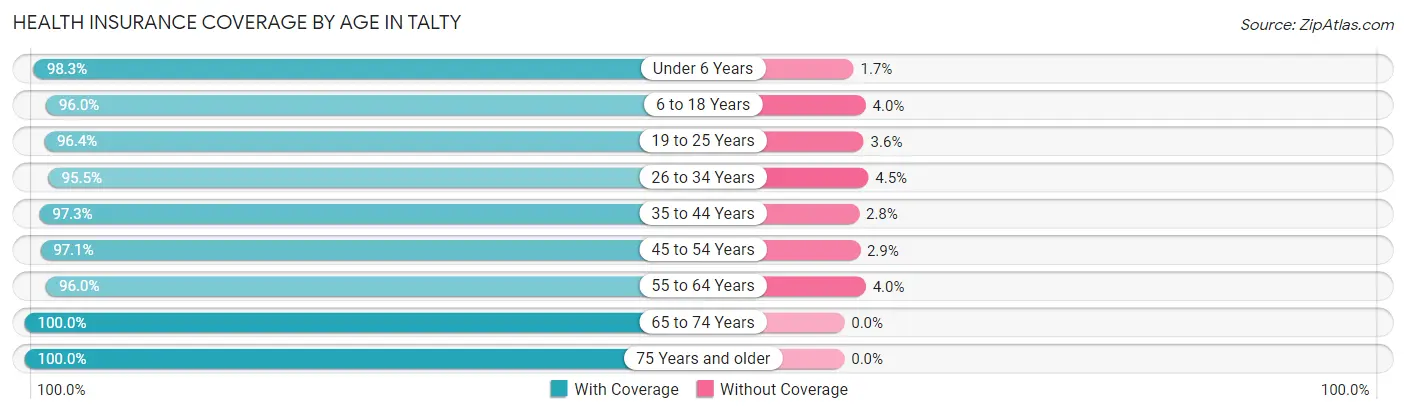
| Age Bracket | With Coverage | Without Coverage |
| Under 6 Years | 171 (98.3%) | 3 (1.7%) |
| 6 to 18 Years | 482 (96.0%) | 20 (4.0%) |
| 19 to 25 Years | 187 (96.4%) | 7 (3.6%) |
| 26 to 34 Years | 149 (95.5%) | 7 (4.5%) |
| 35 to 44 Years | 425 (97.3%) | 12 (2.8%) |
| 45 to 54 Years | 432 (97.1%) | 13 (2.9%) |
| 55 to 64 Years | 384 (96.0%) | 16 (4.0%) |
| 65 to 74 Years | 196 (100.0%) | 0 (0.0%) |
| 75 Years and older | 64 (100.0%) | 0 (0.0%) |
| Total | 2,490 (97.0%) | 78 (3.0%) |
Health Insurance Coverage by Citizenship Status in Talty
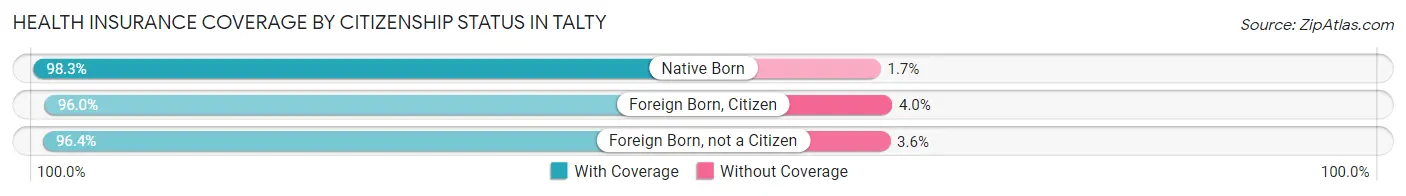
| Citizenship Status | With Coverage | Without Coverage |
| Native Born | 171 (98.3%) | 3 (1.7%) |
| Foreign Born, Citizen | 482 (96.0%) | 20 (4.0%) |
| Foreign Born, not a Citizen | 187 (96.4%) | 7 (3.6%) |
Health Insurance Coverage by Household Income in Talty
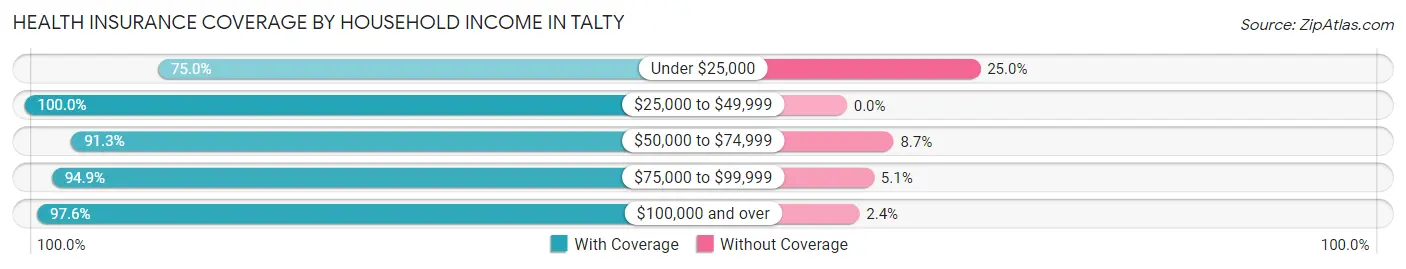
| Household Income | With Coverage | Without Coverage |
| Under $25,000 | 15 (75.0%) | 5 (25.0%) |
| $25,000 to $49,999 | 219 (100.0%) | 0 (0.0%) |
| $50,000 to $74,999 | 188 (91.3%) | 18 (8.7%) |
| $75,000 to $99,999 | 168 (94.9%) | 9 (5.1%) |
| $100,000 and over | 1,900 (97.6%) | 46 (2.4%) |
Public vs Private Health Insurance Coverage by Age in Talty
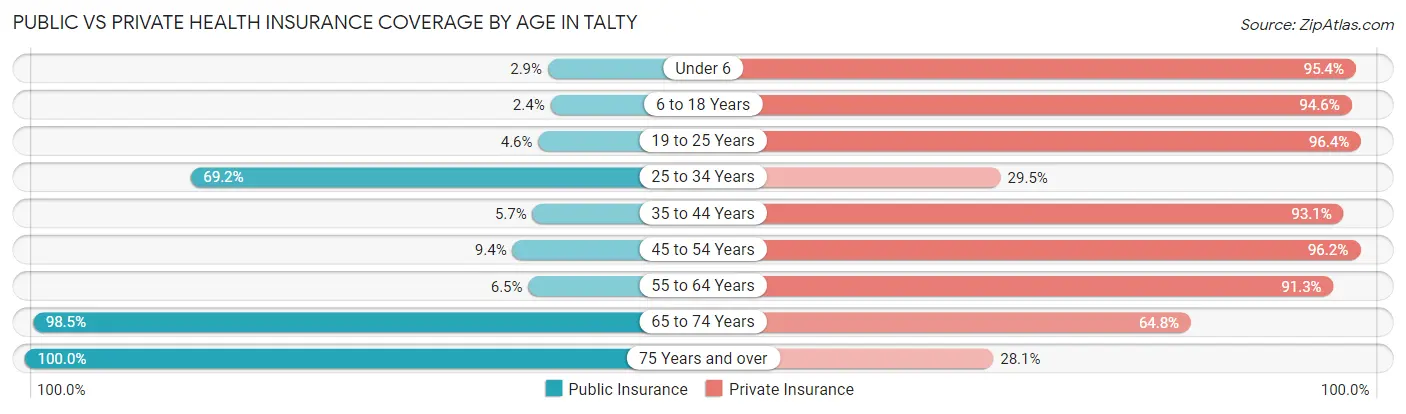
| Age Bracket | Public Insurance | Private Insurance |
| Under 6 | 5 (2.9%) | 166 (95.4%) |
| 6 to 18 Years | 12 (2.4%) | 475 (94.6%) |
| 19 to 25 Years | 9 (4.6%) | 187 (96.4%) |
| 25 to 34 Years | 108 (69.2%) | 46 (29.5%) |
| 35 to 44 Years | 25 (5.7%) | 407 (93.1%) |
| 45 to 54 Years | 42 (9.4%) | 428 (96.2%) |
| 55 to 64 Years | 26 (6.5%) | 365 (91.2%) |
| 65 to 74 Years | 193 (98.5%) | 127 (64.8%) |
| 75 Years and over | 64 (100.0%) | 18 (28.1%) |
| Total | 484 (18.9%) | 2,219 (86.4%) |
Disability Status by Sex by Age in Talty
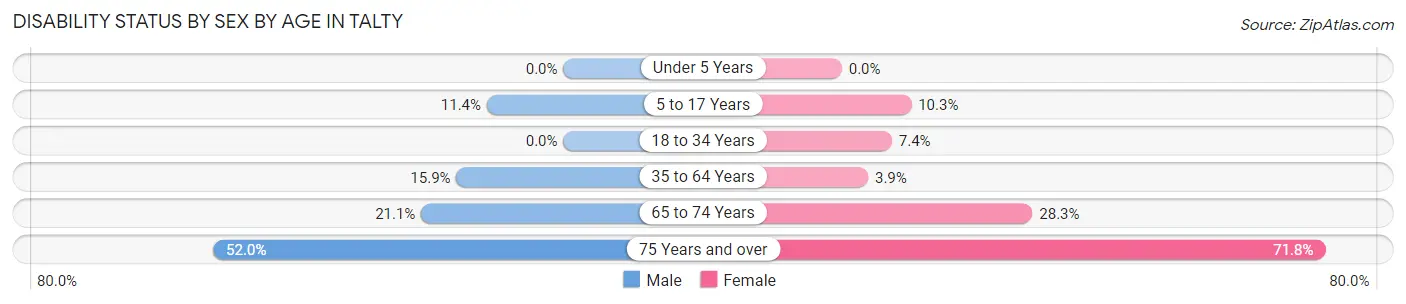
| Age Bracket | Male | Female |
| Under 5 Years | 0 (0.0%) | 0 (0.0%) |
| 5 to 17 Years | 30 (11.4%) | 23 (10.3%) |
| 18 to 34 Years | 0 (0.0%) | 15 (7.4%) |
| 35 to 64 Years | 114 (15.9%) | 22 (3.9%) |
| 65 to 74 Years | 19 (21.1%) | 30 (28.3%) |
| 75 Years and over | 13 (52.0%) | 28 (71.8%) |
Disability Class by Sex by Age in Talty
Disability Class: Hearing Difficulty
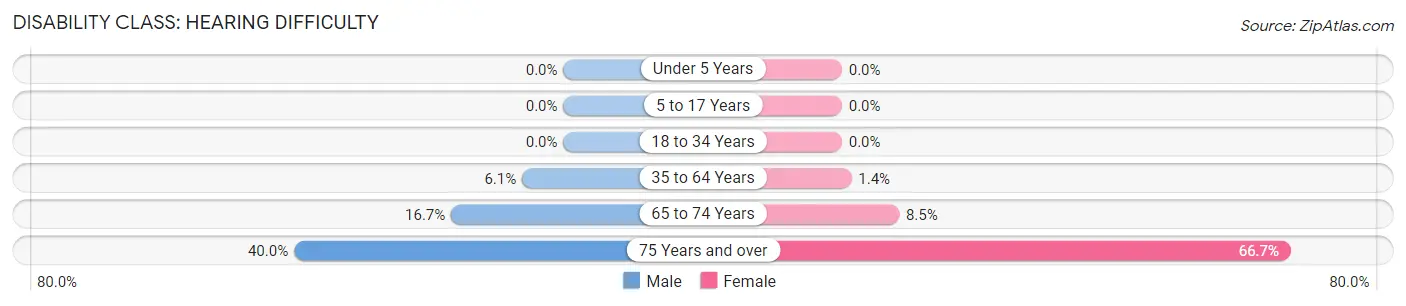
| Age Bracket | Male | Female |
| Under 5 Years | 0 (0.0%) | 0 (0.0%) |
| 5 to 17 Years | 0 (0.0%) | 0 (0.0%) |
| 18 to 34 Years | 0 (0.0%) | 0 (0.0%) |
| 35 to 64 Years | 44 (6.1%) | 8 (1.4%) |
| 65 to 74 Years | 15 (16.7%) | 9 (8.5%) |
| 75 Years and over | 10 (40.0%) | 26 (66.7%) |
Disability Class: Vision Difficulty
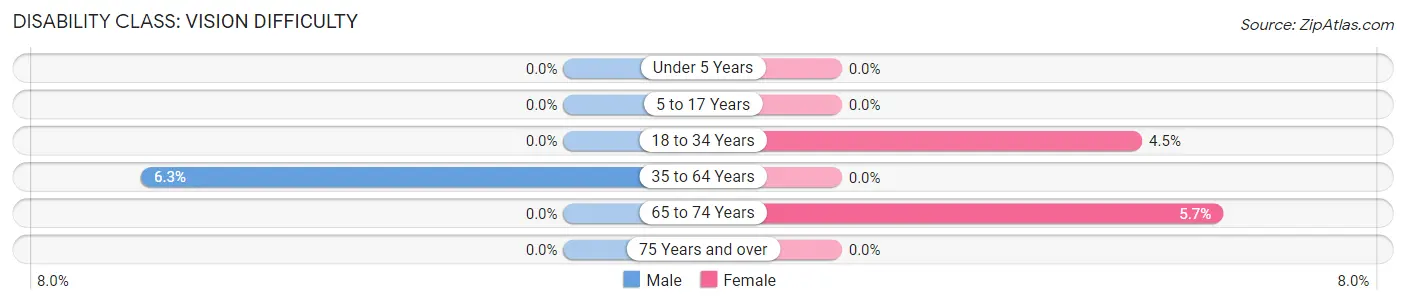
| Age Bracket | Male | Female |
| Under 5 Years | 0 (0.0%) | 0 (0.0%) |
| 5 to 17 Years | 0 (0.0%) | 0 (0.0%) |
| 18 to 34 Years | 0 (0.0%) | 9 (4.5%) |
| 35 to 64 Years | 45 (6.3%) | 0 (0.0%) |
| 65 to 74 Years | 0 (0.0%) | 6 (5.7%) |
| 75 Years and over | 0 (0.0%) | 0 (0.0%) |
Disability Class: Cognitive Difficulty
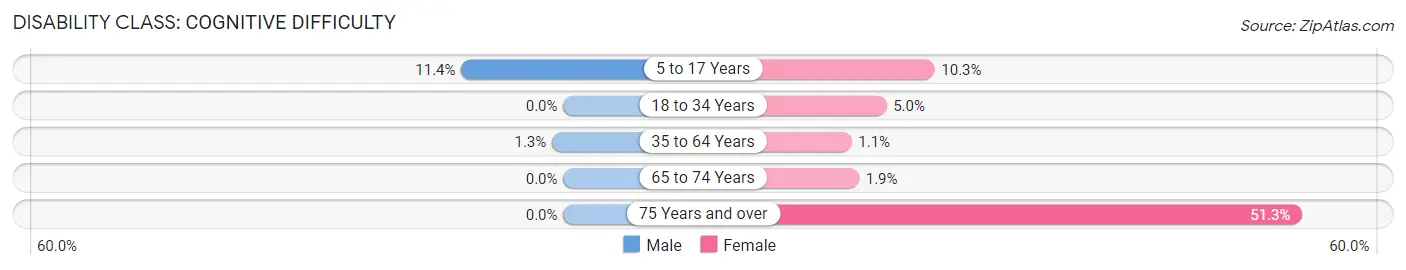
| Age Bracket | Male | Female |
| 5 to 17 Years | 30 (11.4%) | 23 (10.3%) |
| 18 to 34 Years | 0 (0.0%) | 10 (5.0%) |
| 35 to 64 Years | 9 (1.3%) | 6 (1.1%) |
| 65 to 74 Years | 0 (0.0%) | 2 (1.9%) |
| 75 Years and over | 0 (0.0%) | 20 (51.3%) |
Disability Class: Ambulatory Difficulty
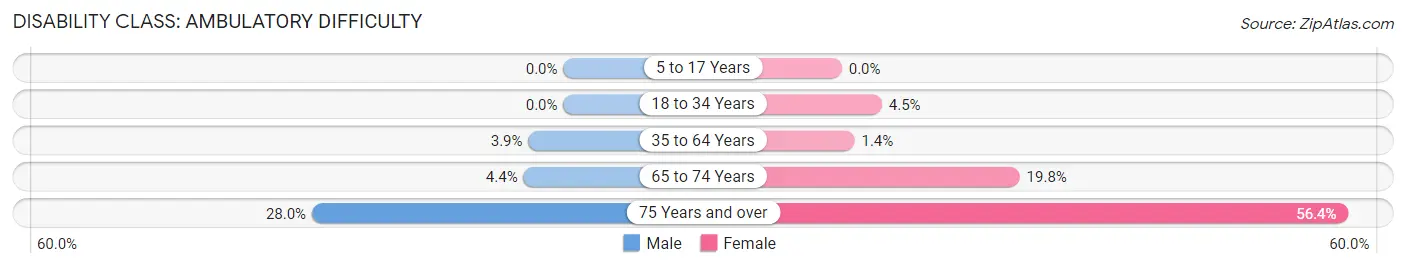
| Age Bracket | Male | Female |
| 5 to 17 Years | 0 (0.0%) | 0 (0.0%) |
| 18 to 34 Years | 0 (0.0%) | 9 (4.5%) |
| 35 to 64 Years | 28 (3.9%) | 8 (1.4%) |
| 65 to 74 Years | 4 (4.4%) | 21 (19.8%) |
| 75 Years and over | 7 (28.0%) | 22 (56.4%) |
Disability Class: Self-Care Difficulty
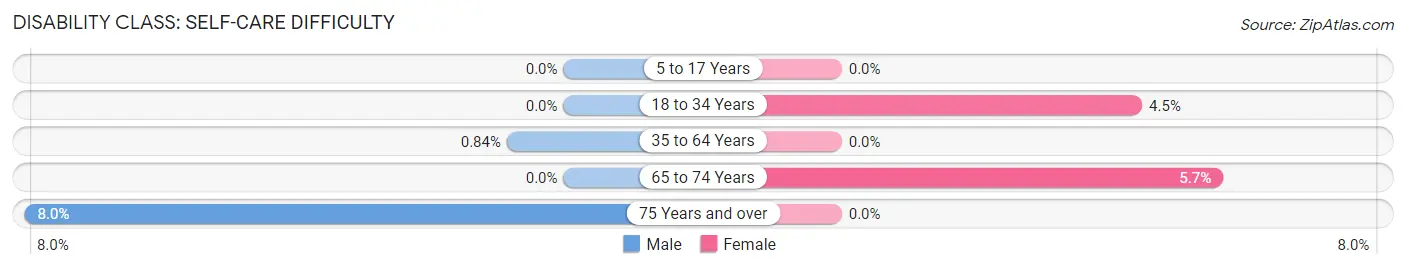
| Age Bracket | Male | Female |
| 5 to 17 Years | 0 (0.0%) | 0 (0.0%) |
| 18 to 34 Years | 0 (0.0%) | 9 (4.5%) |
| 35 to 64 Years | 6 (0.8%) | 0 (0.0%) |
| 65 to 74 Years | 0 (0.0%) | 6 (5.7%) |
| 75 Years and over | 2 (8.0%) | 0 (0.0%) |
Technology Access in Talty
Computing Device Access in Talty
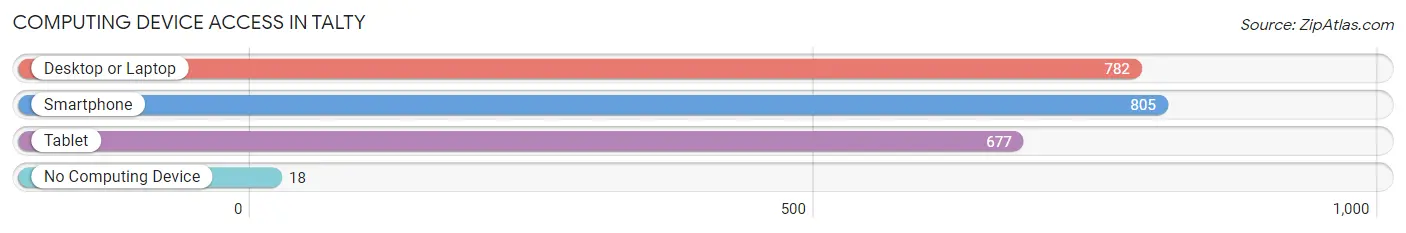
| Device Type | # Households | % Households |
| Desktop or Laptop | 782 | 93.8% |
| Smartphone | 805 | 96.5% |
| Tablet | 677 | 81.2% |
| No Computing Device | 18 | 2.2% |
| Total | 834 | 100.0% |
Internet Access in Talty
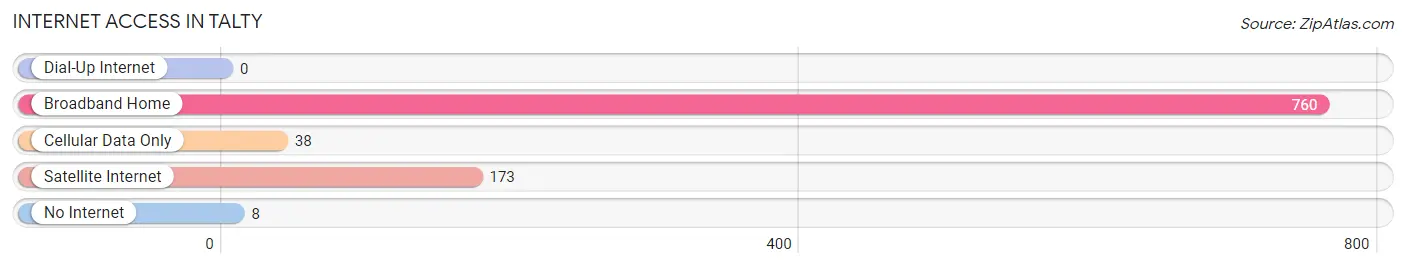
| Internet Type | # Households | % Households |
| Dial-Up Internet | 0 | 0.0% |
| Broadband Home | 760 | 91.1% |
| Cellular Data Only | 38 | 4.6% |
| Satellite Internet | 173 | 20.7% |
| No Internet | 8 | 1.0% |
| Total | 834 | 100.0% |
Talty Summary
Talty is a small town located in Dallas County, Texas. It is situated about 25 miles southeast of Dallas and is part of the Dallas-Fort Worth-Arlington metropolitan area. The town has a population of approximately 1,400 people and is known for its rural atmosphere and small-town charm.
History
Talty was founded in 1873 by a group of settlers from Kentucky. The town was named after the Talty family, who were among the first settlers. The town was originally a farming community, but it soon developed into a small trading center. In the early 1900s, the town was home to several businesses, including a general store, a blacksmith shop, and a cotton gin.
In the 1920s, the town began to experience a period of growth. The population increased from around 500 to over 1,000 people. During this time, the town was home to several churches, a school, and a post office.
In the 1950s, the town experienced a decline in population as many of its residents moved to larger cities in search of better job opportunities. However, the town has since experienced a resurgence in population and is now home to over 1,400 people.
Geography
Talty is located in Dallas County, Texas. It is situated about 25 miles southeast of Dallas and is part of the Dallas-Fort Worth-Arlington metropolitan area. The town is located on the banks of the Trinity River and is surrounded by rolling hills and farmland.
The climate in Talty is generally mild, with temperatures ranging from the mid-50s in the winter to the mid-90s in the summer. The town receives an average of 37 inches of rain per year.
Economy
Talty’s economy is largely based on agriculture. The town is home to several farms, which produce a variety of crops, including corn, wheat, and hay. The town is also home to several small businesses, including a general store, a hardware store, and a restaurant.
Demographics
As of the 2010 census, Talty had a population of 1,400 people. The racial makeup of the town was 94.3% White, 1.9% African American, 0.4% Native American, 0.4% Asian, 0.1% Pacific Islander, and 2.9% from other races. The median household income was $45,000, and the median family income was $50,000.
Talty is a small town with a rich history and a strong sense of community. The town is home to a diverse population and offers a variety of amenities and activities for its residents. With its rural atmosphere and small-town charm, Talty is a great place to call home.
Common Questions
What is Per Capita Income in Talty?
Per Capita income in Talty is $48,715.
What is the Median Family Income in Talty?
Median Family Income in Talty is $137,237.
What is the Median Household income in Talty?
Median Household Income in Talty is $128,864.
What is Income or Wage Gap in Talty?
Income or Wage Gap in Talty is 35.8%.
Women in Talty earn 64.2 cents for every dollar earned by a man.
What is Inequality or Gini Index in Talty?
Inequality or Gini Index in Talty is 0.33.
What is the Total Population of Talty?
Total Population of Talty is 2,568.
What is the Total Male Population of Talty?
Total Male Population of Talty is 1,331.
What is the Total Female Population of Talty?
Total Female Population of Talty is 1,237.
What is the Ratio of Males per 100 Females in Talty?
There are 107.60 Males per 100 Females in Talty.
What is the Ratio of Females per 100 Males in Talty?
There are 92.94 Females per 100 Males in Talty.
What is the Median Population Age in Talty?
Median Population Age in Talty is 41.0 Years.
What is the Average Family Size in Talty
Average Family Size in Talty is 3.3 People.
What is the Average Household Size in Talty
Average Household Size in Talty is 3.1 People.
How Large is the Labor Force in Talty?
There are 1,433 People in the Labor Forcein in Talty.
What is the Percentage of People in the Labor Force in Talty?
71.3% of People are in the Labor Force in Talty.
What is the Unemployment Rate in Talty?
Unemployment Rate in Talty is 4.3%.