Pinetop Country Club, AZ Map & Demographics
Pinetop Country Club Map
Pinetop Country Club Overview
$51,139
PER CAPITA INCOME
$111,500
AVG FAMILY INCOME
$86,417
AVG HOUSEHOLD INCOME
0.34
INEQUALITY / GINI INDEX
1,769
TOTAL POPULATION
893
MALE POPULATION
876
FEMALE POPULATION
101.94
MALES / 100 FEMALES
98.10
FEMALES / 100 MALES
66.8
MEDIAN AGE
2.2
AVG FAMILY SIZE
1.9
AVG HOUSEHOLD SIZE
411
LABOR FORCE [ PEOPLE ]
24.5%
PERCENT IN LABOR FORCE
8.3%
UNEMPLOYMENT RATE
Income in Pinetop Country Club
Income Overview in Pinetop Country Club
Per Capita Income in Pinetop Country Club is $51,139, while median incomes of families and households are $111,500 and $86,417 respectively.
| Characteristic | Number | Measure |
| Per Capita Income | 1,769 | $51,139 |
| Median Family Income | 682 | $111,500 |
| Mean Family Income | 682 | $112,870 |
| Median Household Income | 911 | $86,417 |
| Mean Household Income | 911 | $99,454 |
| Income Deficit | 682 | $0 |
| Wage / Income Gap (%) | 1,769 | 0.00% |
| Wage / Income Gap ($) | 1,769 | 100.00¢ per $1 |
| Gini / Inequality Index | 1,769 | 0.34 |
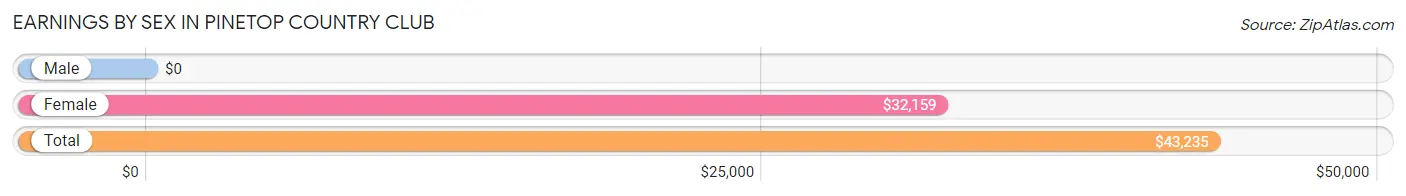
Earnings by Sex in Pinetop Country Club
| Sex | Number | Average Earnings |
| Male | 273 (61.2%) | $0 |
| Female | 173 (38.8%) | $32,159 |
| Total | 446 (100.0%) | $43,235 |
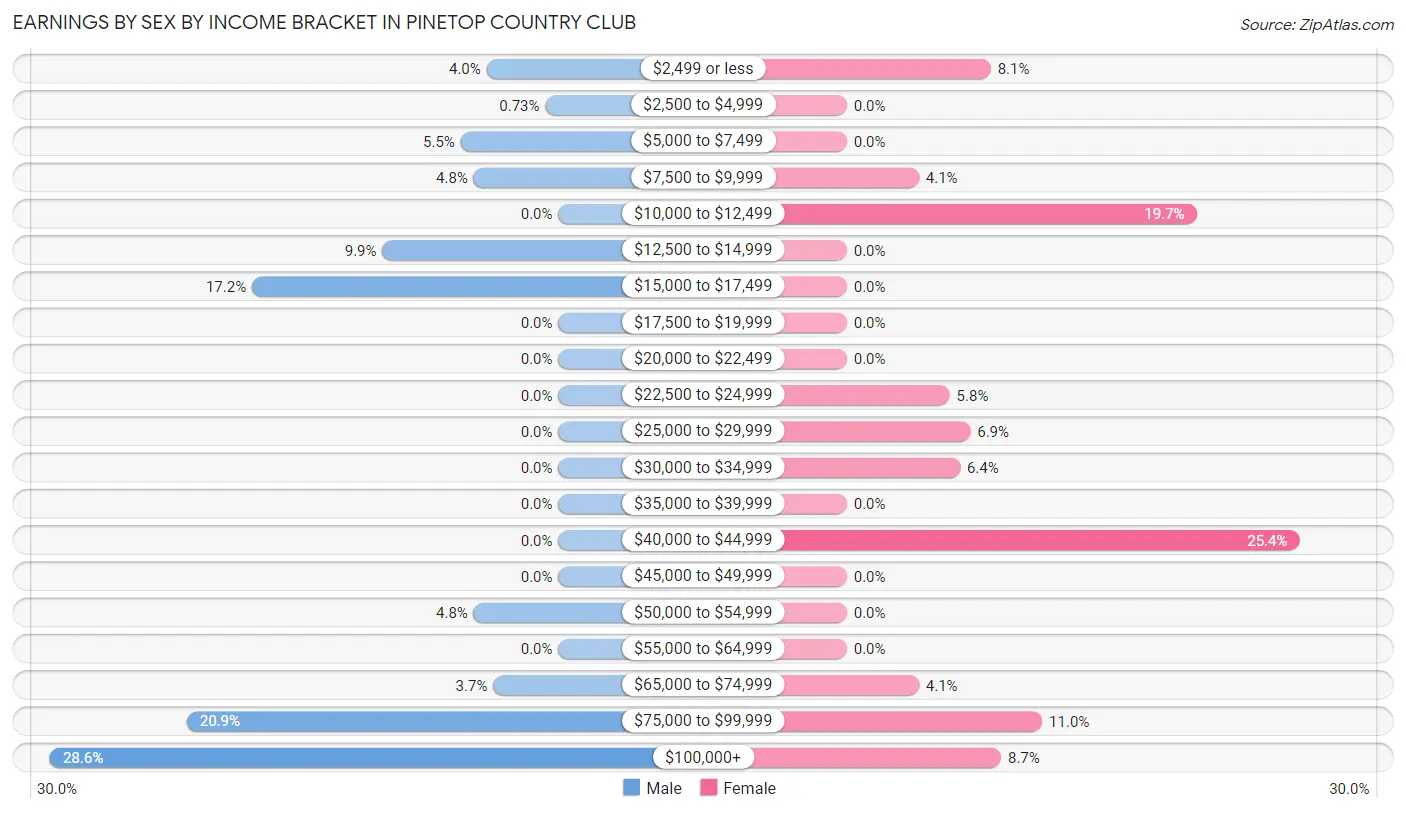
Earnings by Sex by Income Bracket in Pinetop Country Club
The most common earnings brackets in Pinetop Country Club are $100,000+ for men (78 | 28.6%) and $40,000 to $44,999 for women (44 | 25.4%).
| Income | Male | Female |
| $2,499 or less | 11 (4.0%) | 14 (8.1%) |
| $2,500 to $4,999 | 2 (0.7%) | 0 (0.0%) |
| $5,000 to $7,499 | 15 (5.5%) | 0 (0.0%) |
| $7,500 to $9,999 | 13 (4.8%) | 7 (4.1%) |
| $10,000 to $12,499 | 0 (0.0%) | 34 (19.7%) |
| $12,500 to $14,999 | 27 (9.9%) | 0 (0.0%) |
| $15,000 to $17,499 | 47 (17.2%) | 0 (0.0%) |
| $17,500 to $19,999 | 0 (0.0%) | 0 (0.0%) |
| $20,000 to $22,499 | 0 (0.0%) | 0 (0.0%) |
| $22,500 to $24,999 | 0 (0.0%) | 10 (5.8%) |
| $25,000 to $29,999 | 0 (0.0%) | 12 (6.9%) |
| $30,000 to $34,999 | 0 (0.0%) | 11 (6.4%) |
| $35,000 to $39,999 | 0 (0.0%) | 0 (0.0%) |
| $40,000 to $44,999 | 0 (0.0%) | 44 (25.4%) |
| $45,000 to $49,999 | 0 (0.0%) | 0 (0.0%) |
| $50,000 to $54,999 | 13 (4.8%) | 0 (0.0%) |
| $55,000 to $64,999 | 0 (0.0%) | 0 (0.0%) |
| $65,000 to $74,999 | 10 (3.7%) | 7 (4.1%) |
| $75,000 to $99,999 | 57 (20.9%) | 19 (11.0%) |
| $100,000+ | 78 (28.6%) | 15 (8.7%) |
| Total | 273 (100.0%) | 173 (100.0%) |
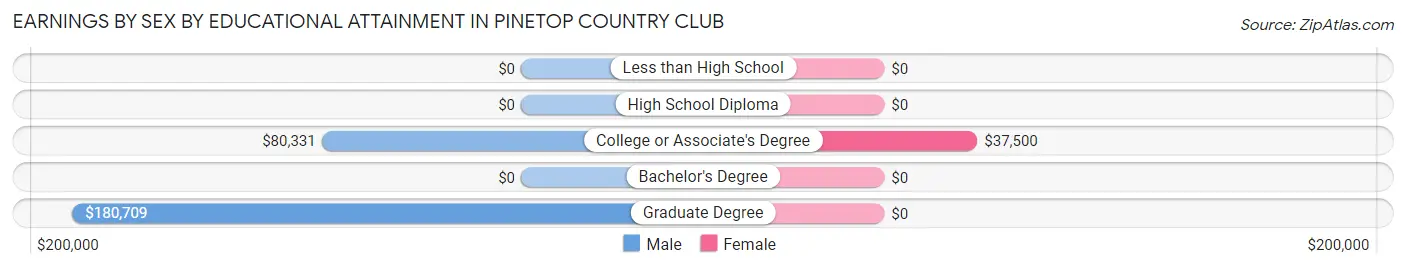
Earnings by Sex by Educational Attainment in Pinetop Country Club
Average earnings in Pinetop Country Club are $80,404 for men and $32,159 for women, a difference of 60.0%. Men with an educational attainment of graduate degree enjoy the highest average annual earnings of $180,709, while those with college or associate's degree education earn the least with $80,331. Women with an educational attainment of college or associate's degree earn the most with the average annual earnings of $37,500, while those with college or associate's degree education have the smallest earnings of $37,500.
| Educational Attainment | Male Income | Female Income |
| Less than High School | - | - |
| High School Diploma | - | - |
| College or Associate's Degree | $80,331 | $37,500 |
| Bachelor's Degree | - | - |
| Graduate Degree | $180,709 | $0 |
| Total | $80,404 | $32,159 |
Family Income in Pinetop Country Club
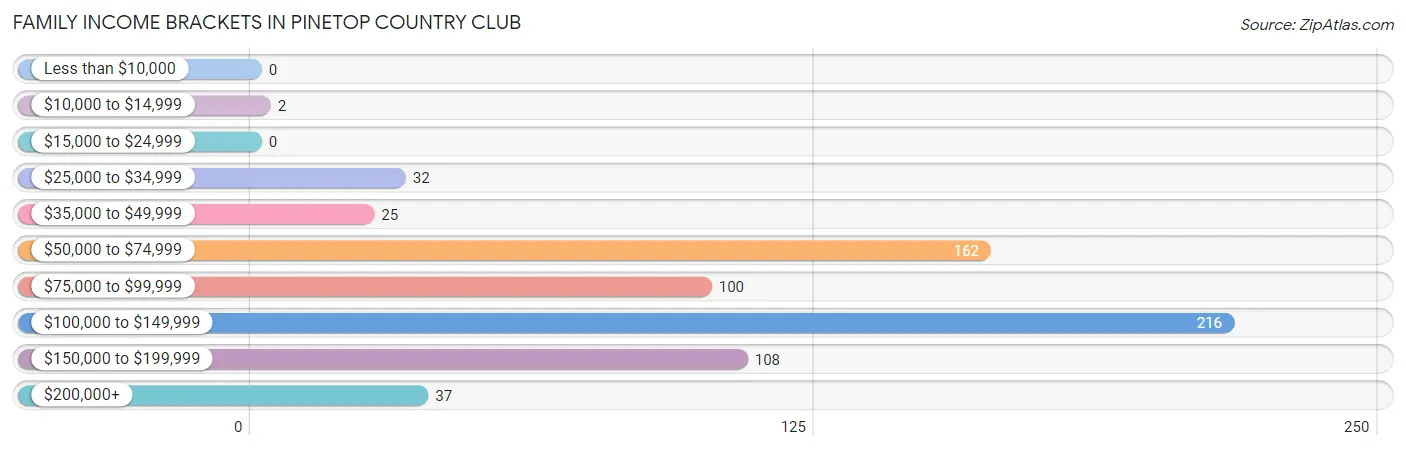
Family Income Brackets in Pinetop Country Club
According to the Pinetop Country Club family income data, there are 216 families falling into the $100,000 to $149,999 income range, which is the most common income bracket and makes up 31.7% of all families.
| Income Bracket | # Families | % Families |
| Less than $10,000 | 0 | 0.0% |
| $10,000 to $14,999 | 2 | 0.3% |
| $15,000 to $24,999 | 0 | 0.0% |
| $25,000 to $34,999 | 32 | 4.7% |
| $35,000 to $49,999 | 25 | 3.7% |
| $50,000 to $74,999 | 162 | 23.8% |
| $75,000 to $99,999 | 100 | 14.7% |
| $100,000 to $149,999 | 216 | 31.7% |
| $150,000 to $199,999 | 108 | 15.8% |
| $200,000+ | 37 | 5.4% |
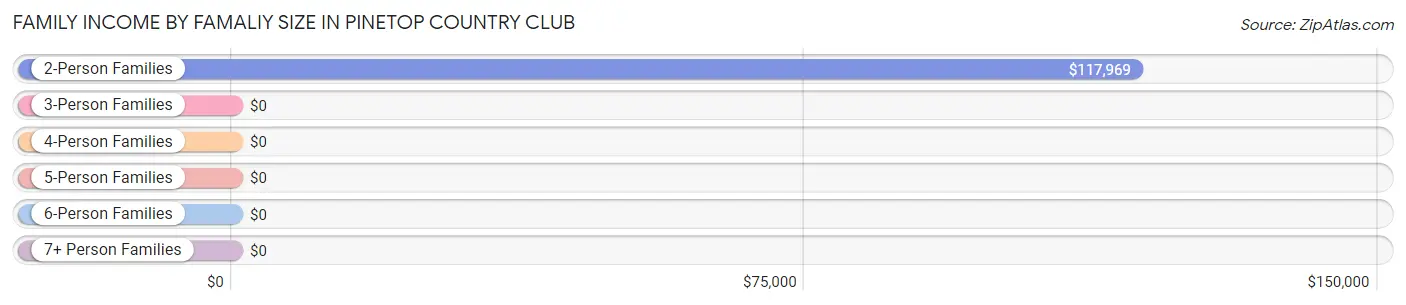
Family Income by Famaliy Size in Pinetop Country Club
2-person families (567 | 83.1%) account for the highest median family income in Pinetop Country Club with $117,969 per family, while 2-person families (567 | 83.1%) have the highest median income of $58,984 per family member.
| Income Bracket | # Families | Median Income |
| 2-Person Families | 567 (83.1%) | $117,969 |
| 3-Person Families | 81 (11.9%) | $0 |
| 4-Person Families | 34 (5.0%) | $0 |
| 5-Person Families | 0 (0.0%) | $0 |
| 6-Person Families | 0 (0.0%) | $0 |
| 7+ Person Families | 0 (0.0%) | $0 |
| Total | 682 (100.0%) | $111,500 |
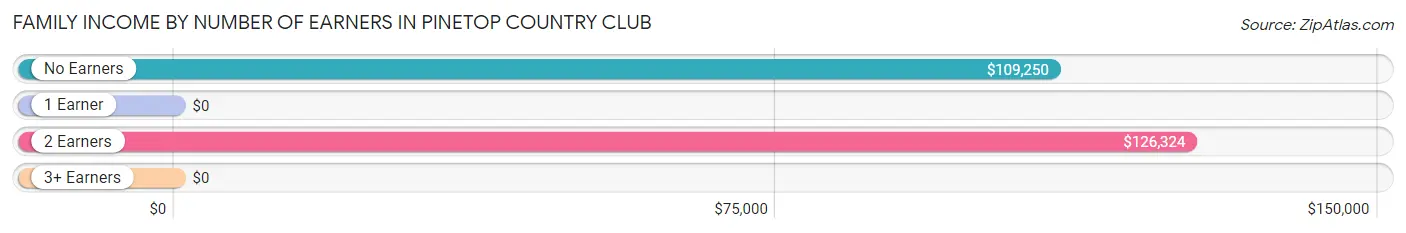
Family Income by Number of Earners in Pinetop Country Club
| Number of Earners | # Families | Median Income |
| No Earners | 409 (60.0%) | $109,250 |
| 1 Earner | 169 (24.8%) | $0 |
| 2 Earners | 92 (13.5%) | $126,324 |
| 3+ Earners | 12 (1.8%) | $0 |
| Total | 682 (100.0%) | $111,500 |
Household Income in Pinetop Country Club
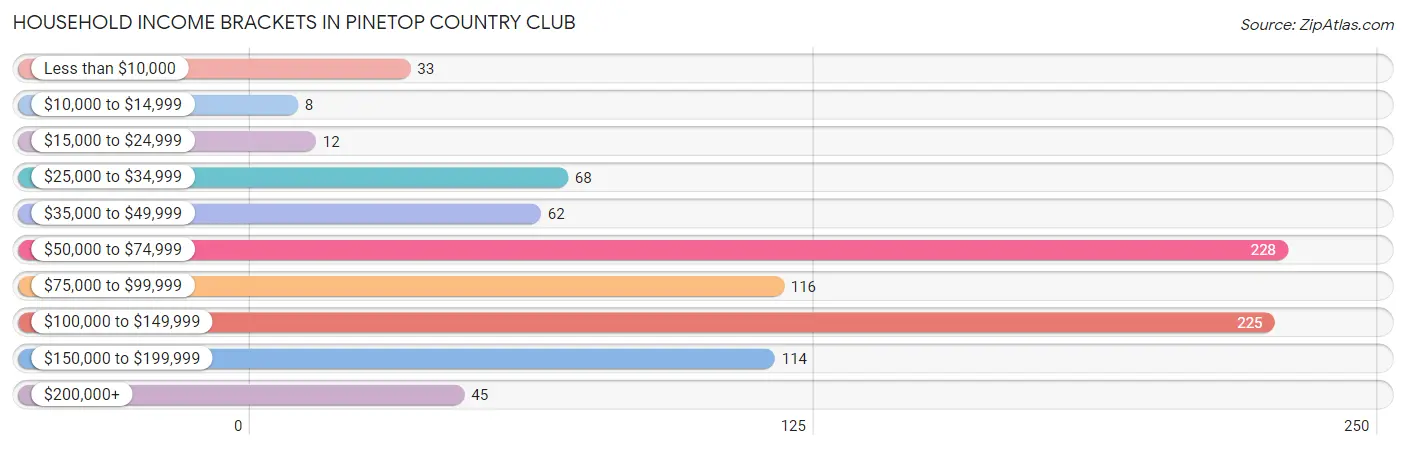
Household Income Brackets in Pinetop Country Club
With 228 households falling in the category, the $50,000 to $74,999 income range is the most frequent in Pinetop Country Club, accounting for 25.0% of all households. In contrast, only 8 households (0.9%) fall into the $10,000 to $14,999 income bracket, making it the least populous group.
| Income Bracket | # Households | % Households |
| Less than $10,000 | 33 | 3.6% |
| $10,000 to $14,999 | 8 | 0.9% |
| $15,000 to $24,999 | 12 | 1.3% |
| $25,000 to $34,999 | 68 | 7.5% |
| $35,000 to $49,999 | 62 | 6.8% |
| $50,000 to $74,999 | 228 | 25.0% |
| $75,000 to $99,999 | 116 | 12.7% |
| $100,000 to $149,999 | 225 | 24.7% |
| $150,000 to $199,999 | 114 | 12.5% |
| $200,000+ | 45 | 4.9% |
Household Income by Householder Age in Pinetop Country Club
The median household income in Pinetop Country Club is $86,417, with the highest median household income of $126,103 found in the 25 to 44 years age bracket for the primary householder. A total of 56 households (6.1%) fall into this category.
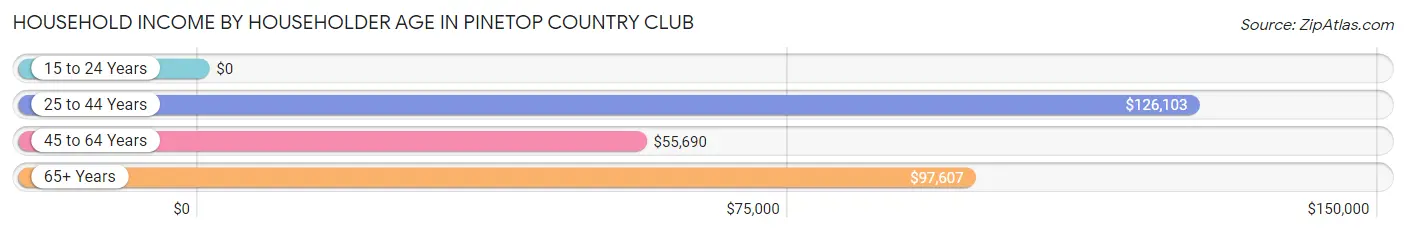
| Income Bracket | # Households | Median Income |
| 15 to 24 Years | 0 (0.0%) | $0 |
| 25 to 44 Years | 56 (6.1%) | $126,103 |
| 45 to 64 Years | 280 (30.7%) | $55,690 |
| 65+ Years | 575 (63.1%) | $97,607 |
| Total | 911 (100.0%) | $86,417 |
Poverty in Pinetop Country Club
Income Below Poverty by Sex and Age in Pinetop Country Club
With 7.4% poverty level for males and 2.9% for females among the residents of Pinetop Country Club, 25 to 34 year old males and 55 to 64 year old females are the most vulnerable to poverty, with 21 males (100.0%) and 25 females (8.8%) in their respective age groups living below the poverty level.
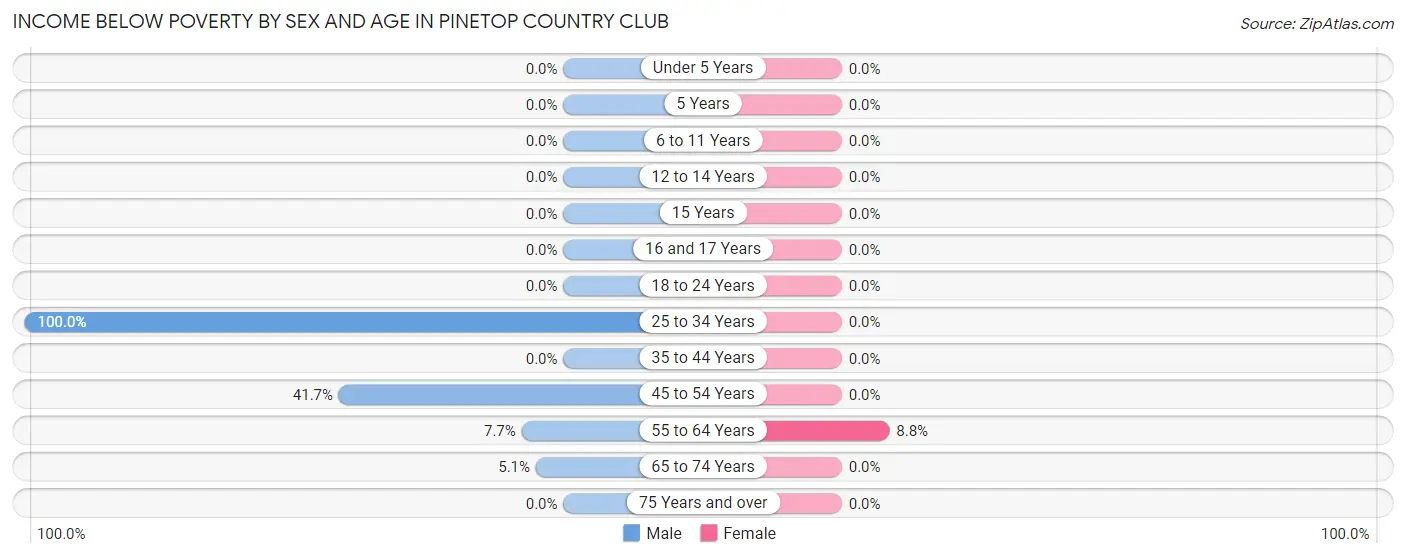
| Age Bracket | Male | Female |
| Under 5 Years | 0 (0.0%) | 0 (0.0%) |
| 5 Years | 0 (0.0%) | 0 (0.0%) |
| 6 to 11 Years | 0 (0.0%) | 0 (0.0%) |
| 12 to 14 Years | 0 (0.0%) | 0 (0.0%) |
| 15 Years | 0 (0.0%) | 0 (0.0%) |
| 16 and 17 Years | 0 (0.0%) | 0 (0.0%) |
| 18 to 24 Years | 0 (0.0%) | 0 (0.0%) |
| 25 to 34 Years | 21 (100.0%) | 0 (0.0%) |
| 35 to 44 Years | 0 (0.0%) | 0 (0.0%) |
| 45 to 54 Years | 15 (41.7%) | 0 (0.0%) |
| 55 to 64 Years | 12 (7.7%) | 25 (8.8%) |
| 65 to 74 Years | 18 (5.1%) | 0 (0.0%) |
| 75 Years and over | 0 (0.0%) | 0 (0.0%) |
| Total | 66 (7.4%) | 25 (2.9%) |
Income Above Poverty by Sex and Age in Pinetop Country Club
According to the poverty statistics in Pinetop Country Club, males aged under 5 years and females aged 6 to 11 years are the age groups that are most secure financially, with 100.0% of males and 100.0% of females in these age groups living above the poverty line.
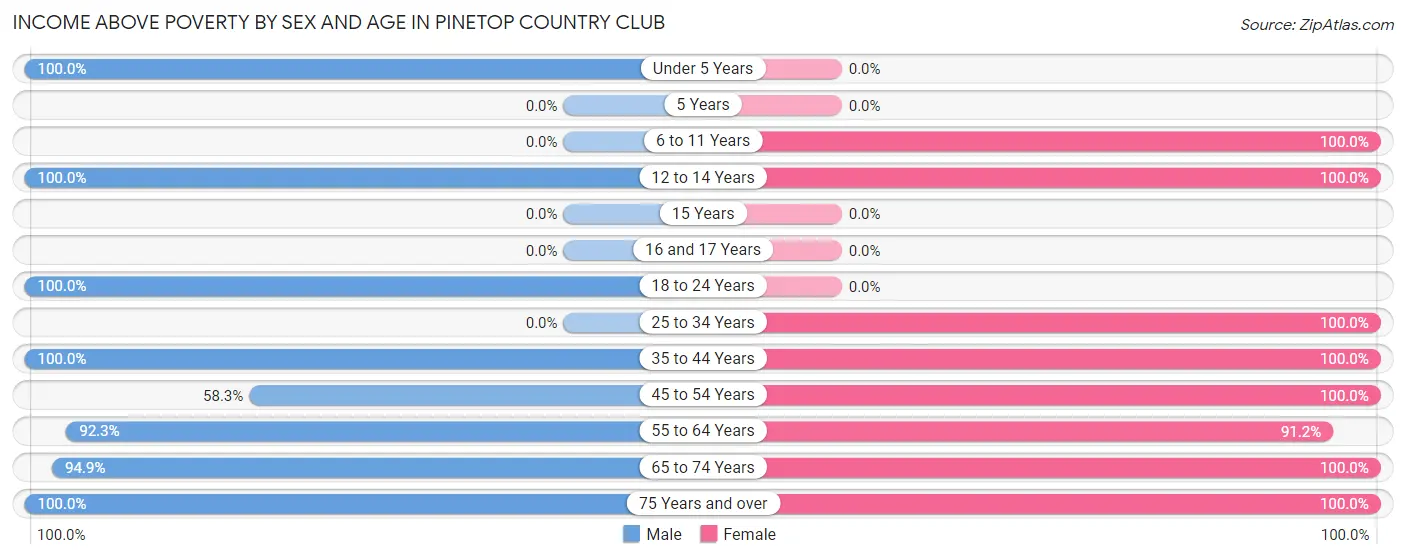
| Age Bracket | Male | Female |
| Under 5 Years | 31 (100.0%) | 0 (0.0%) |
| 5 Years | 0 (0.0%) | 0 (0.0%) |
| 6 to 11 Years | 0 (0.0%) | 28 (100.0%) |
| 12 to 14 Years | 24 (100.0%) | 10 (100.0%) |
| 15 Years | 0 (0.0%) | 0 (0.0%) |
| 16 and 17 Years | 0 (0.0%) | 0 (0.0%) |
| 18 to 24 Years | 60 (100.0%) | 0 (0.0%) |
| 25 to 34 Years | 0 (0.0%) | 13 (100.0%) |
| 35 to 44 Years | 44 (100.0%) | 43 (100.0%) |
| 45 to 54 Years | 21 (58.3%) | 30 (100.0%) |
| 55 to 64 Years | 143 (92.3%) | 258 (91.2%) |
| 65 to 74 Years | 335 (94.9%) | 306 (100.0%) |
| 75 Years and over | 169 (100.0%) | 163 (100.0%) |
| Total | 827 (92.6%) | 851 (97.2%) |
Income Below Poverty Among Married-Couple Families in Pinetop Country Club
The poverty statistics for married-couple families in Pinetop Country Club show that 0.3% or 2 of the total 663 families live below the poverty line. Families with no children have the highest poverty rate of 0.3%, comprising of 2 families. On the other hand, families with 1 or 2 children have the lowest poverty rate of 0.0%, which includes 0 families.
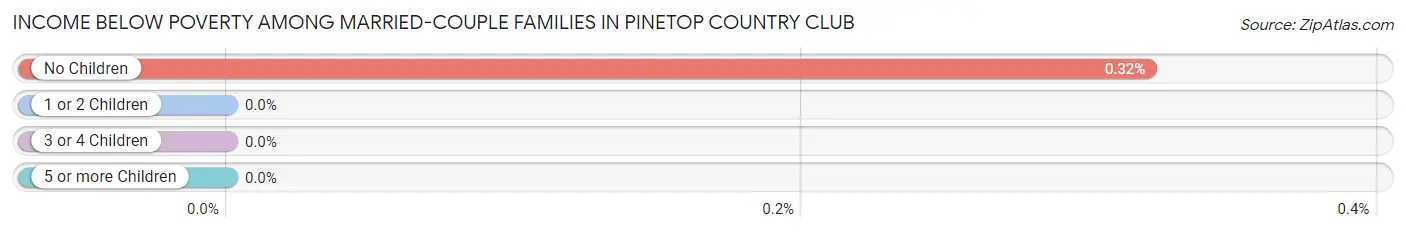
| Children | Above Poverty | Below Poverty |
| No Children | 618 (99.7%) | 2 (0.3%) |
| 1 or 2 Children | 43 (100.0%) | 0 (0.0%) |
| 3 or 4 Children | 0 (0.0%) | 0 (0.0%) |
| 5 or more Children | 0 (0.0%) | 0 (0.0%) |
| Total | 661 (99.7%) | 2 (0.3%) |
Income Below Poverty Among Single-Parent Households in Pinetop Country Club
| Children | Single Father | Single Mother |
| No Children | 0 (0.0%) | 0 (0.0%) |
| 1 or 2 Children | 0 (0.0%) | 0 (0.0%) |
| 3 or 4 Children | 0 (0.0%) | 0 (0.0%) |
| 5 or more Children | 0 (0.0%) | 0 (0.0%) |
| Total | 0 (0.0%) | 0 (0.0%) |
Income Below Poverty Among Married-Couple vs Single-Parent Households in Pinetop Country Club
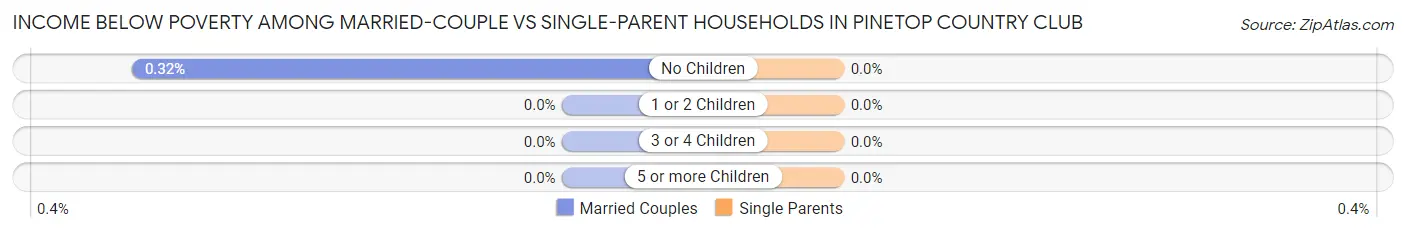
| Children | Married-Couple Families | Single-Parent Households |
| No Children | 2 (0.3%) | 0 (0.0%) |
| 1 or 2 Children | 0 (0.0%) | 0 (0.0%) |
| 3 or 4 Children | 0 (0.0%) | 0 (0.0%) |
| 5 or more Children | 0 (0.0%) | 0 (0.0%) |
| Total | 2 (0.3%) | 0 (0.0%) |
Race in Pinetop Country Club
The most populous races in Pinetop Country Club are White / Caucasian (1,560 | 88.2%), Native / Alaskan (113 | 6.4%), and Two or more Races (85 | 4.8%).
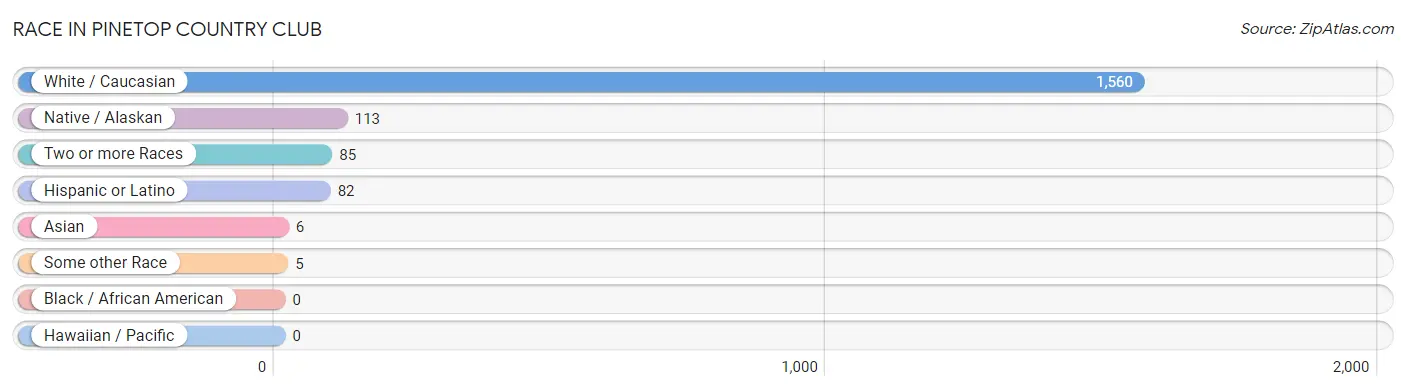
| Race | # Population | % Population |
| Asian | 6 | 0.3% |
| Black / African American | 0 | 0.0% |
| Hawaiian / Pacific | 0 | 0.0% |
| Hispanic or Latino | 82 | 4.6% |
| Native / Alaskan | 113 | 6.4% |
| White / Caucasian | 1,560 | 88.2% |
| Two or more Races | 85 | 4.8% |
| Some other Race | 5 | 0.3% |
| Total | 1,769 | 100.0% |
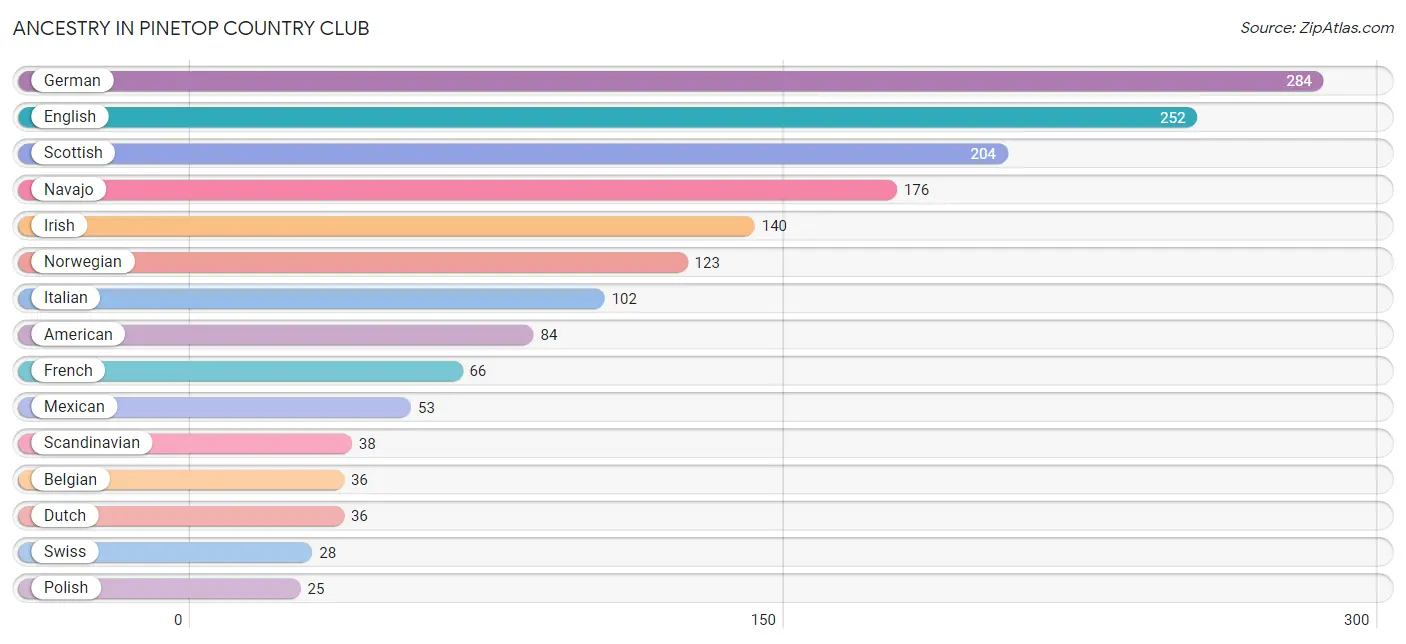
Ancestry in Pinetop Country Club
The most populous ancestries reported in Pinetop Country Club are German (284 | 16.1%), English (252 | 14.2%), Scottish (204 | 11.5%), Navajo (176 | 10.0%), and Irish (140 | 7.9%), together accounting for 59.7% of all Pinetop Country Club residents.
| Ancestry | # Population | % Population |
| American | 84 | 4.8% |
| Austrian | 17 | 1.0% |
| Belgian | 36 | 2.0% |
| British | 19 | 1.1% |
| Canadian | 7 | 0.4% |
| Czech | 22 | 1.2% |
| Dutch | 36 | 2.0% |
| Eastern European | 7 | 0.4% |
| English | 252 | 14.2% |
| French | 66 | 3.7% |
| German | 284 | 16.1% |
| Hungarian | 15 | 0.9% |
| Irish | 140 | 7.9% |
| Italian | 102 | 5.8% |
| Lithuanian | 10 | 0.6% |
| Mexican | 53 | 3.0% |
| Navajo | 176 | 10.0% |
| Norwegian | 123 | 7.0% |
| Polish | 25 | 1.4% |
| Puerto Rican | 21 | 1.2% |
| Russian | 13 | 0.7% |
| Scandinavian | 38 | 2.1% |
| Scotch-Irish | 9 | 0.5% |
| Scottish | 204 | 11.5% |
| Swedish | 9 | 0.5% |
| Swiss | 28 | 1.6% |
| Thai | 6 | 0.3% |
| Welsh | 24 | 1.4% |
| West Indian | 9 | 0.5% | View All 29 Rows |
Immigrants in Pinetop Country Club
The most numerous immigrant groups reported in Pinetop Country Club came from Europe (37 | 2.1%), Western Europe (37 | 2.1%), Netherlands (21 | 1.2%), Belgium (10 | 0.6%), and France (6 | 0.3%), together accounting for 6.3% of all Pinetop Country Club residents.
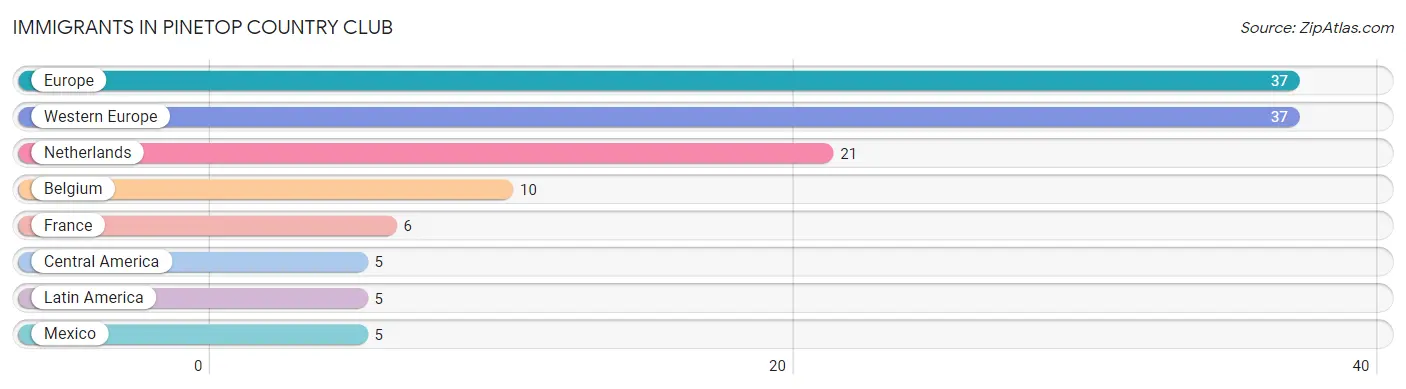
| Immigration Origin | # Population | % Population |
| Belgium | 10 | 0.6% |
| Central America | 5 | 0.3% |
| Europe | 37 | 2.1% |
| France | 6 | 0.3% |
| Latin America | 5 | 0.3% |
| Mexico | 5 | 0.3% |
| Netherlands | 21 | 1.2% |
| Western Europe | 37 | 2.1% | View All 8 Rows |
Sex and Age in Pinetop Country Club
Sex and Age in Pinetop Country Club
The most populous age groups in Pinetop Country Club are 65 to 69 Years (249 | 27.9%) for men and 60 to 64 Years (175 | 20.0%) for women.
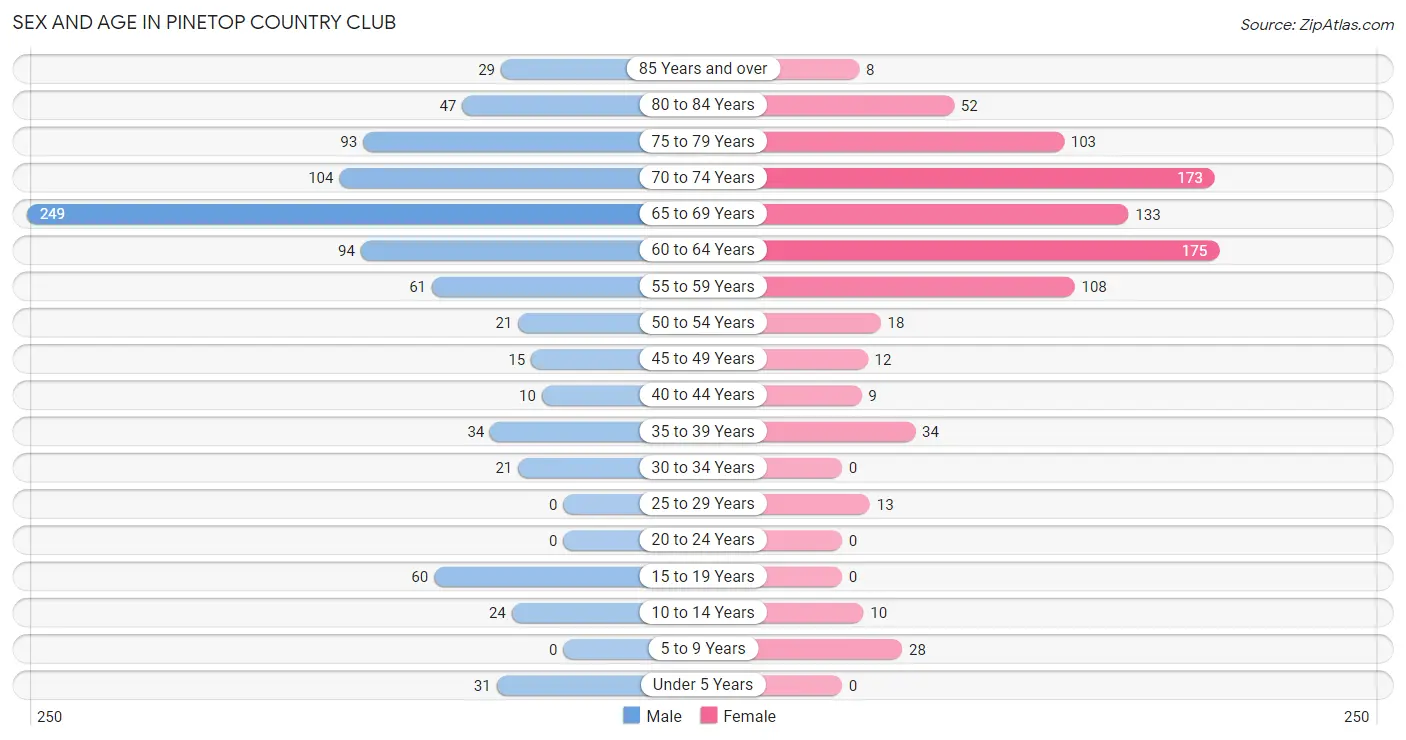
| Age Bracket | Male | Female |
| Under 5 Years | 31 (3.5%) | 0 (0.0%) |
| 5 to 9 Years | 0 (0.0%) | 28 (3.2%) |
| 10 to 14 Years | 24 (2.7%) | 10 (1.1%) |
| 15 to 19 Years | 60 (6.7%) | 0 (0.0%) |
| 20 to 24 Years | 0 (0.0%) | 0 (0.0%) |
| 25 to 29 Years | 0 (0.0%) | 13 (1.5%) |
| 30 to 34 Years | 21 (2.4%) | 0 (0.0%) |
| 35 to 39 Years | 34 (3.8%) | 34 (3.9%) |
| 40 to 44 Years | 10 (1.1%) | 9 (1.0%) |
| 45 to 49 Years | 15 (1.7%) | 12 (1.4%) |
| 50 to 54 Years | 21 (2.4%) | 18 (2.1%) |
| 55 to 59 Years | 61 (6.8%) | 108 (12.3%) |
| 60 to 64 Years | 94 (10.5%) | 175 (20.0%) |
| 65 to 69 Years | 249 (27.9%) | 133 (15.2%) |
| 70 to 74 Years | 104 (11.7%) | 173 (19.8%) |
| 75 to 79 Years | 93 (10.4%) | 103 (11.8%) |
| 80 to 84 Years | 47 (5.3%) | 52 (5.9%) |
| 85 Years and over | 29 (3.3%) | 8 (0.9%) |
| Total | 893 (100.0%) | 876 (100.0%) |
Families and Households in Pinetop Country Club
Median Family Size in Pinetop Country Club
The median family size in Pinetop Country Club is 2.19 persons per family, with single female/mother families (13 | 1.9%) accounting for the largest median family size of 3.38 persons per family. On the other hand, single male/father families (6 | 0.9%) represent the smallest median family size with 2.00 persons per family.
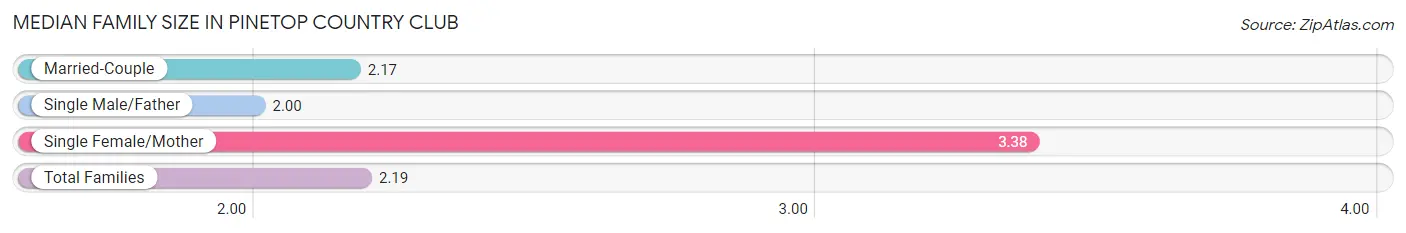
| Family Type | # Families | Family Size |
| Married-Couple | 663 (97.2%) | 2.17 |
| Single Male/Father | 6 (0.9%) | 2.00 |
| Single Female/Mother | 13 (1.9%) | 3.38 |
| Total Families | 682 (100.0%) | 2.19 |
Median Household Size in Pinetop Country Club
The median household size in Pinetop Country Club is 1.94 persons per household, with single female/mother households (13 | 1.4%) accounting for the largest median household size of 5 persons per household. non-family households (229 | 25.1%) represent the smallest median household size with 1.11 persons per household.
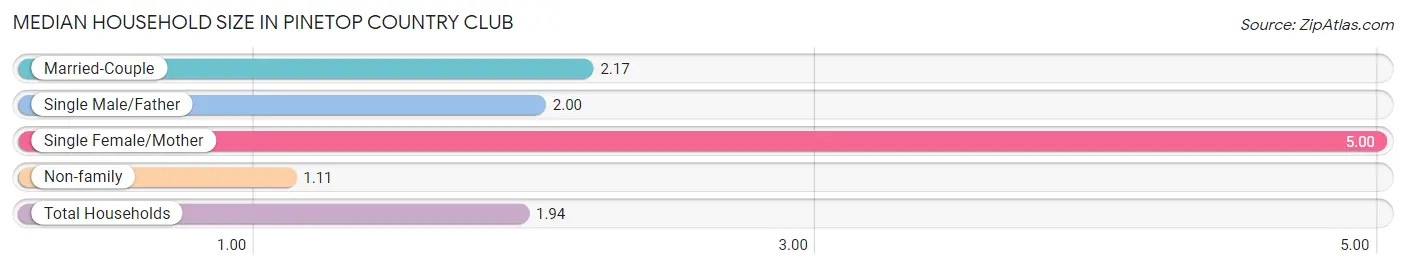
| Household Type | # Households | Household Size |
| Married-Couple | 663 (72.8%) | 2.17 |
| Single Male/Father | 6 (0.7%) | 2.00 |
| Single Female/Mother | 13 (1.4%) | 5.00 |
| Non-family | 229 (25.1%) | 1.11 |
| Total Households | 911 (100.0%) | 1.94 |
Household Size by Marriage Status in Pinetop Country Club
Out of a total of 911 households in Pinetop Country Club, 682 (74.9%) are family households, while 229 (25.1%) are nonfamily households. The most numerous type of family households are 2-person households, comprising 567, and the most common type of nonfamily households are 1-person households, comprising 200.
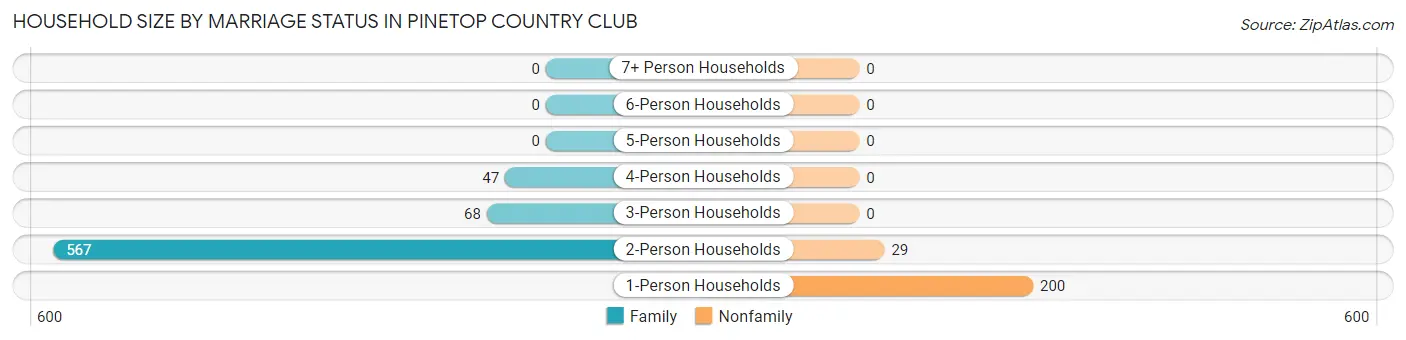
| Household Size | Family Households | Nonfamily Households |
| 1-Person Households | - | 200 (22.0%) |
| 2-Person Households | 567 (62.2%) | 29 (3.2%) |
| 3-Person Households | 68 (7.5%) | 0 (0.0%) |
| 4-Person Households | 47 (5.2%) | 0 (0.0%) |
| 5-Person Households | 0 (0.0%) | 0 (0.0%) |
| 6-Person Households | 0 (0.0%) | 0 (0.0%) |
| 7+ Person Households | 0 (0.0%) | 0 (0.0%) |
| Total | 682 (74.9%) | 229 (25.1%) |
Female Fertility in Pinetop Country Club
Fertility by Age in Pinetop Country Club
| Age Bracket | Women with Births | Births / 1,000 Women |
| 15 to 19 years | 0 (0.0%) | 0.0 |
| 20 to 34 years | 0 (0.0%) | 0.0 |
| 35 to 50 years | 0 (0.0%) | 0.0 |
| Total | 0 (0.0%) | 0.0 |
Fertility by Age by Marriage Status in Pinetop Country Club
| Age Bracket | Married | Unmarried |
| 15 to 19 years | 0 (0.0%) | 0 (0.0%) |
| 20 to 34 years | 0 (0.0%) | 0 (0.0%) |
| 35 to 50 years | 0 (0.0%) | 0 (0.0%) |
| Total | 0 (0.0%) | 0 (0.0%) |
Fertility by Education in Pinetop Country Club
| Educational Attainment | Women with Births | Births / 1,000 Women |
| Less than High School | 0 (0.0%) | 0.0 |
| High School Diploma | 0 (0.0%) | 0.0 |
| College or Associate's Degree | 0 (0.0%) | 0.0 |
| Bachelor's Degree | 0 (0.0%) | 0.0 |
| Graduate Degree | 0 (0.0%) | 0.0 |
| Total | 0 (0.0%) | 0.0 |
Fertility by Education by Marriage Status in Pinetop Country Club
| Educational Attainment | Married | Unmarried |
| Less than High School | 0 (0.0%) | 0 (0.0%) |
| High School Diploma | 0 (0.0%) | 0 (0.0%) |
| College or Associate's Degree | 0 (0.0%) | 0 (0.0%) |
| Bachelor's Degree | 0 (0.0%) | 0 (0.0%) |
| Graduate Degree | 0 (0.0%) | 0 (0.0%) |
| Total | 0 (0.0%) | 0 (0.0%) |
Employment Characteristics in Pinetop Country Club
Employment by Class of Employer in Pinetop Country Club
Among the 376 employed individuals in Pinetop Country Club, private company employees (127 | 33.8%), self-employed (incorporated) (70 | 18.6%), and self-employed (not incorporated) (70 | 18.6%) make up the most common classes of employment.
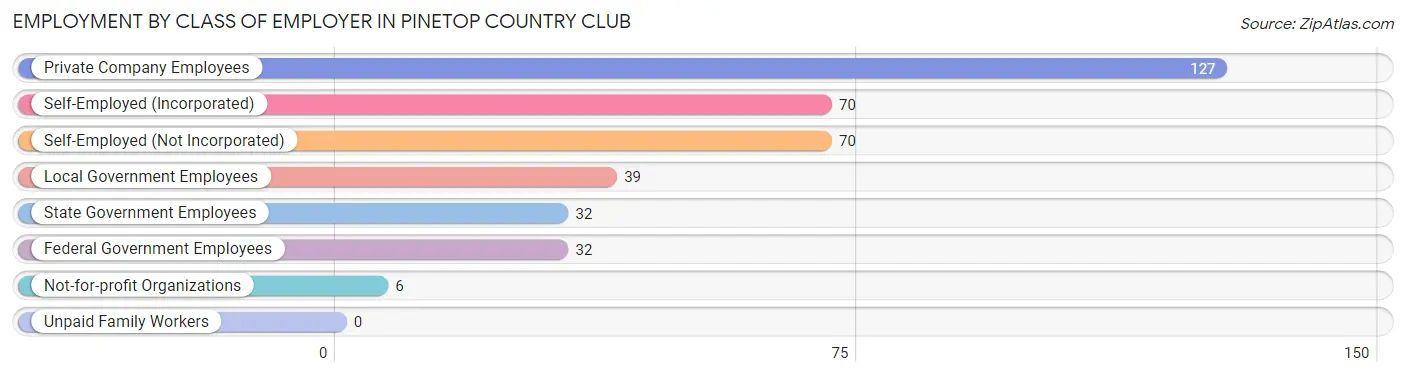
| Employer Class | # Employees | % Employees |
| Private Company Employees | 127 | 33.8% |
| Self-Employed (Incorporated) | 70 | 18.6% |
| Self-Employed (Not Incorporated) | 70 | 18.6% |
| Not-for-profit Organizations | 6 | 1.6% |
| Local Government Employees | 39 | 10.4% |
| State Government Employees | 32 | 8.5% |
| Federal Government Employees | 32 | 8.5% |
| Unpaid Family Workers | 0 | 0.0% |
| Total | 376 | 100.0% |
Employment Status by Age in Pinetop Country Club
According to the labor force statistics for Pinetop Country Club, out of the total population over 16 years of age (1,676), 24.5% or 411 individuals are in the labor force, with 8.3% or 34 of them unemployed. The age group with the highest labor force participation rate is 16 to 19 years, with 100.0% or 60 individuals in the labor force. Within the labor force, the 30 to 34 years age range has the highest percentage of unemployed individuals, with 100.0% or 21 of them being unemployed.
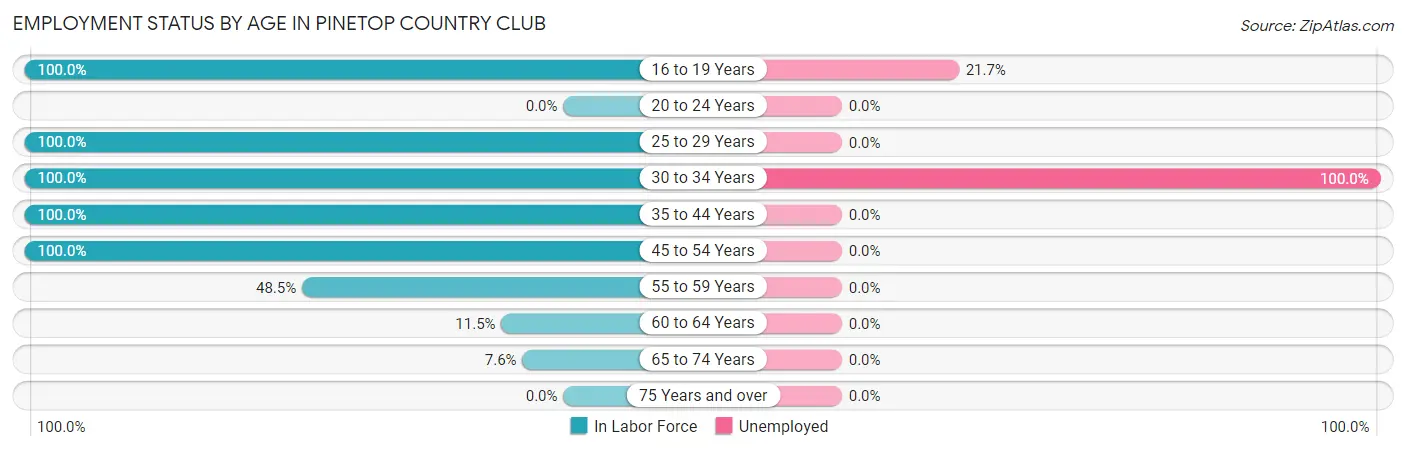
| Age Bracket | In Labor Force | Unemployed |
| 16 to 19 Years | 60 (100.0%) | 13 (21.7%) |
| 20 to 24 Years | 0 (0.0%) | 0 (0.0%) |
| 25 to 29 Years | 13 (100.0%) | 0 (0.0%) |
| 30 to 34 Years | 21 (100.0%) | 21 (100.0%) |
| 35 to 44 Years | 87 (100.0%) | 0 (0.0%) |
| 45 to 54 Years | 66 (100.0%) | 0 (0.0%) |
| 55 to 59 Years | 82 (48.5%) | 0 (0.0%) |
| 60 to 64 Years | 31 (11.5%) | 0 (0.0%) |
| 65 to 74 Years | 50 (7.6%) | 0 (0.0%) |
| 75 Years and over | 0 (0.0%) | 0 (0.0%) |
| Total | 411 (24.5%) | 34 (8.3%) |
Employment Status by Educational Attainment in Pinetop Country Club
According to labor force statistics for Pinetop Country Club, 48.0% of individuals (300) out of the total population between 25 and 64 years of age (625) are in the labor force, with 7.0% or 21 of them being unemployed. The group with the highest labor force participation rate are those with the educational attainment of less than high school, with 100.0% or 6 individuals in the labor force. Within the labor force, individuals with college / associate degree education have the highest percentage of unemployment, with 13.8% or 21 of them being unemployed.
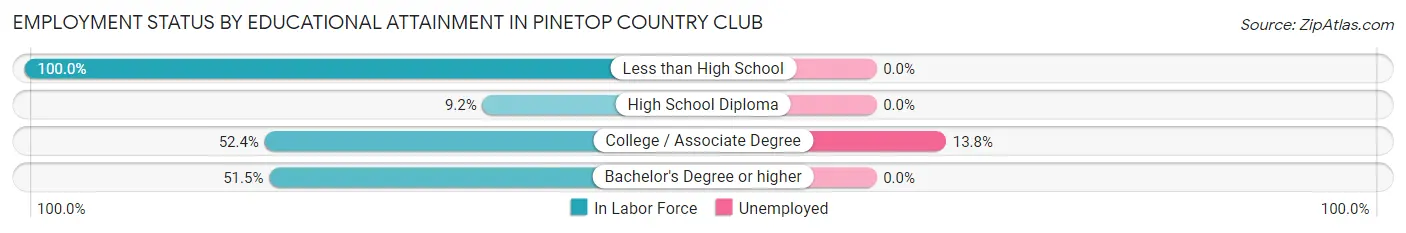
| Educational Attainment | In Labor Force | Unemployed |
| Less than High School | 6 (100.0%) | 0 (0.0%) |
| High School Diploma | 6 (9.2%) | 0 (0.0%) |
| College / Associate Degree | 152 (52.4%) | 40 (13.8%) |
| Bachelor's Degree or higher | 136 (51.5%) | 0 (0.0%) |
| Total | 300 (48.0%) | 44 (7.0%) |
Employment Occupations by Sex in Pinetop Country Club
Management, Business, Science and Arts Occupations
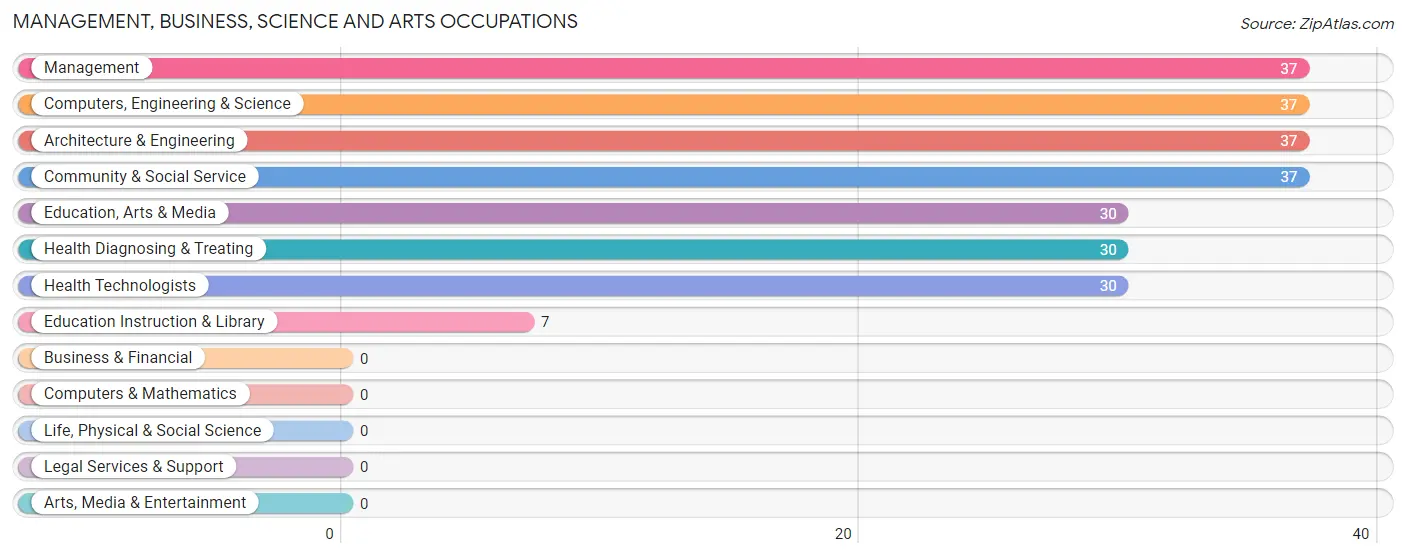
The most common Management, Business, Science and Arts occupations in Pinetop Country Club are Management (37 | 9.8%), Computers, Engineering & Science (37 | 9.8%), Architecture & Engineering (37 | 9.8%), Community & Social Service (37 | 9.8%), and Education, Arts & Media (30 | 8.0%).
Management, Business, Science and Arts Occupations by Sex
Within the Management, Business, Science and Arts occupations in Pinetop Country Club, the most male-oriented occupations are Computers, Engineering & Science (100.0%), Architecture & Engineering (100.0%), and Education, Arts & Media (100.0%), while the most female-oriented occupations are Education Instruction & Library (100.0%), Management (78.4%), and Health Diagnosing & Treating (20.0%).
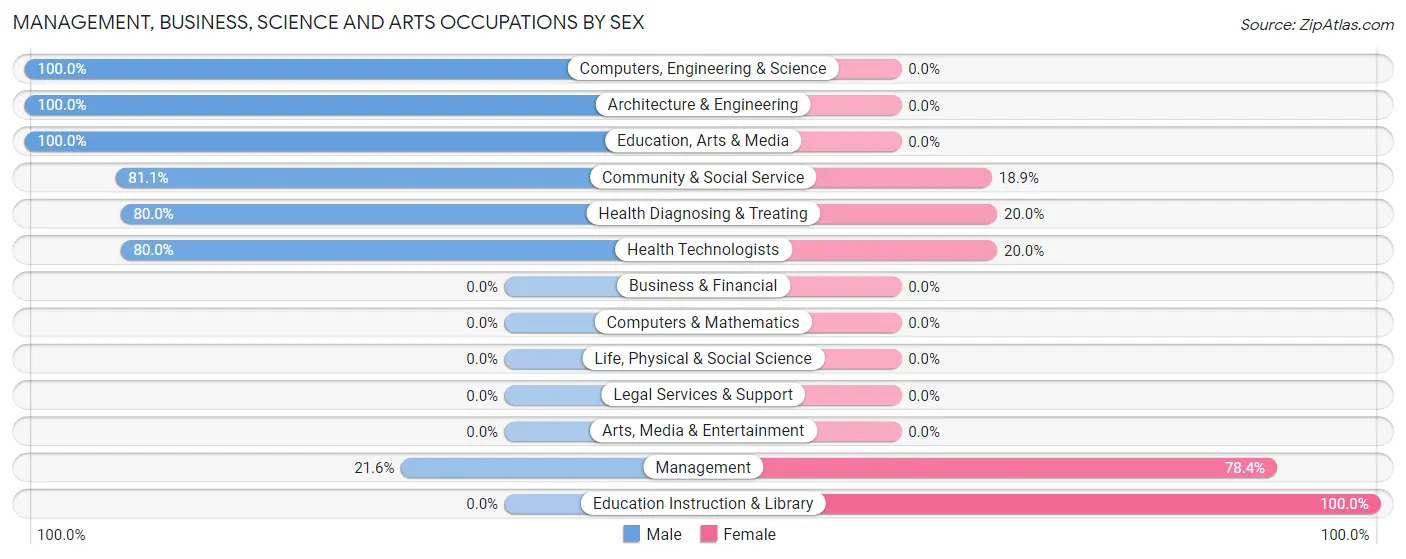
| Occupation | Male | Female |
| Management | 8 (21.6%) | 29 (78.4%) |
| Business & Financial | 0 (0.0%) | 0 (0.0%) |
| Computers, Engineering & Science | 37 (100.0%) | 0 (0.0%) |
| Computers & Mathematics | 0 (0.0%) | 0 (0.0%) |
| Architecture & Engineering | 37 (100.0%) | 0 (0.0%) |
| Life, Physical & Social Science | 0 (0.0%) | 0 (0.0%) |
| Community & Social Service | 30 (81.1%) | 7 (18.9%) |
| Education, Arts & Media | 30 (100.0%) | 0 (0.0%) |
| Legal Services & Support | 0 (0.0%) | 0 (0.0%) |
| Education Instruction & Library | 0 (0.0%) | 7 (100.0%) |
| Arts, Media & Entertainment | 0 (0.0%) | 0 (0.0%) |
| Health Diagnosing & Treating | 24 (80.0%) | 6 (20.0%) |
| Health Technologists | 24 (80.0%) | 6 (20.0%) |
| Total (Category) | 99 (70.2%) | 42 (29.8%) |
| Total (Overall) | 247 (65.7%) | 129 (34.3%) |
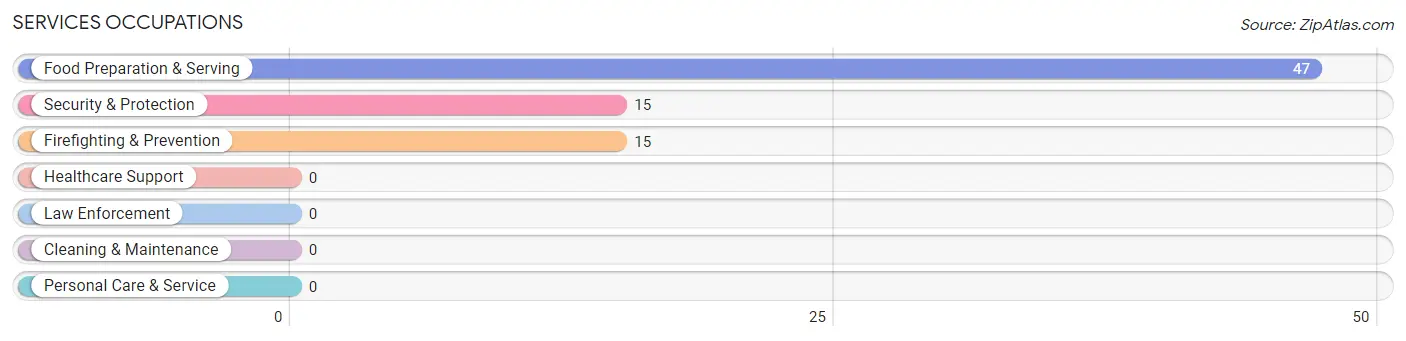
Services Occupations
The most common Services occupations in Pinetop Country Club are Food Preparation & Serving (47 | 12.5%), Security & Protection (15 | 4.0%), and Firefighting & Prevention (15 | 4.0%).
Services Occupations by Sex
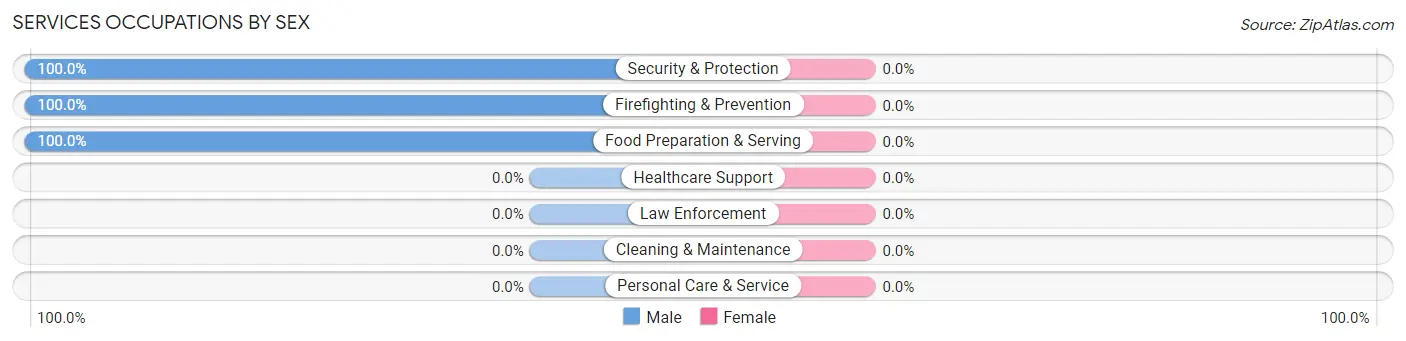
| Occupation | Male | Female |
| Healthcare Support | 0 (0.0%) | 0 (0.0%) |
| Security & Protection | 15 (100.0%) | 0 (0.0%) |
| Firefighting & Prevention | 15 (100.0%) | 0 (0.0%) |
| Law Enforcement | 0 (0.0%) | 0 (0.0%) |
| Food Preparation & Serving | 47 (100.0%) | 0 (0.0%) |
| Cleaning & Maintenance | 0 (0.0%) | 0 (0.0%) |
| Personal Care & Service | 0 (0.0%) | 0 (0.0%) |
| Total (Category) | 62 (100.0%) | 0 (0.0%) |
| Total (Overall) | 247 (65.7%) | 129 (34.3%) |
Sales and Office Occupations
The most common Sales and Office occupations in Pinetop Country Club are Office & Administration (64 | 17.0%), and Sales & Related (38 | 10.1%).
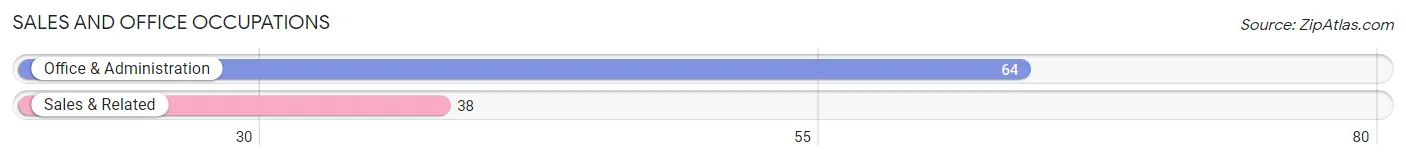
Sales and Office Occupations by Sex
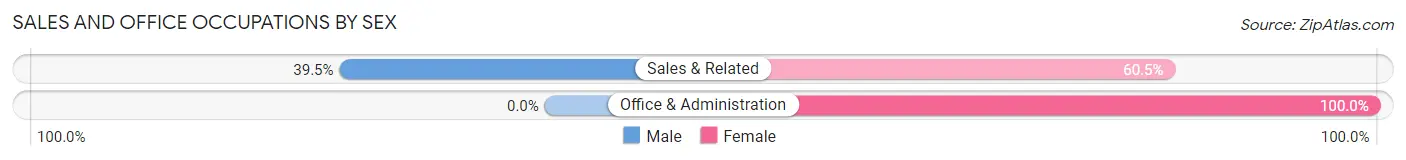
| Occupation | Male | Female |
| Sales & Related | 15 (39.5%) | 23 (60.5%) |
| Office & Administration | 0 (0.0%) | 64 (100.0%) |
| Total (Category) | 15 (14.7%) | 87 (85.3%) |
| Total (Overall) | 247 (65.7%) | 129 (34.3%) |
Natural Resources, Construction and Maintenance Occupations
The most common Natural Resources, Construction and Maintenance occupations in Pinetop Country Club are Construction & Extraction (37 | 9.8%), and Installation, Maintenance & Repair (34 | 9.0%).
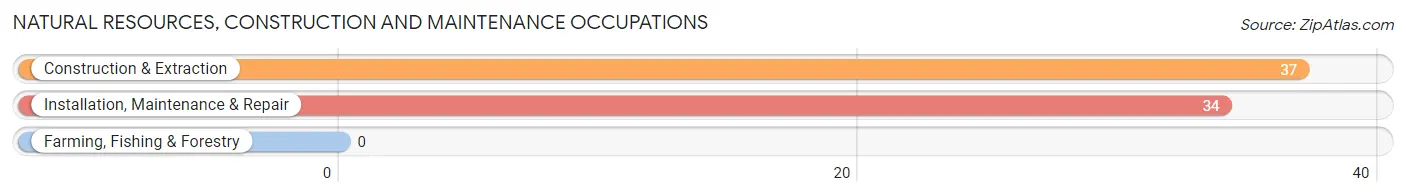
Natural Resources, Construction and Maintenance Occupations by Sex
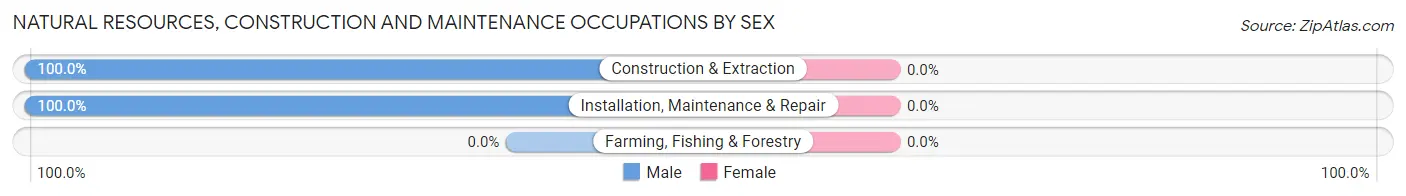
| Occupation | Male | Female |
| Farming, Fishing & Forestry | 0 (0.0%) | 0 (0.0%) |
| Construction & Extraction | 37 (100.0%) | 0 (0.0%) |
| Installation, Maintenance & Repair | 34 (100.0%) | 0 (0.0%) |
| Total (Category) | 71 (100.0%) | 0 (0.0%) |
| Total (Overall) | 247 (65.7%) | 129 (34.3%) |
Production, Transportation and Moving Occupations
Production, Transportation and Moving Occupations by Sex
| Occupation | Male | Female |
| Production | 0 (0.0%) | 0 (0.0%) |
| Transportation | 0 (0.0%) | 0 (0.0%) |
| Material Moving | 0 (0.0%) | 0 (0.0%) |
| Total (Category) | 0 (0.0%) | 0 (0.0%) |
| Total (Overall) | 247 (65.7%) | 129 (34.3%) |
Employment Industries by Sex in Pinetop Country Club
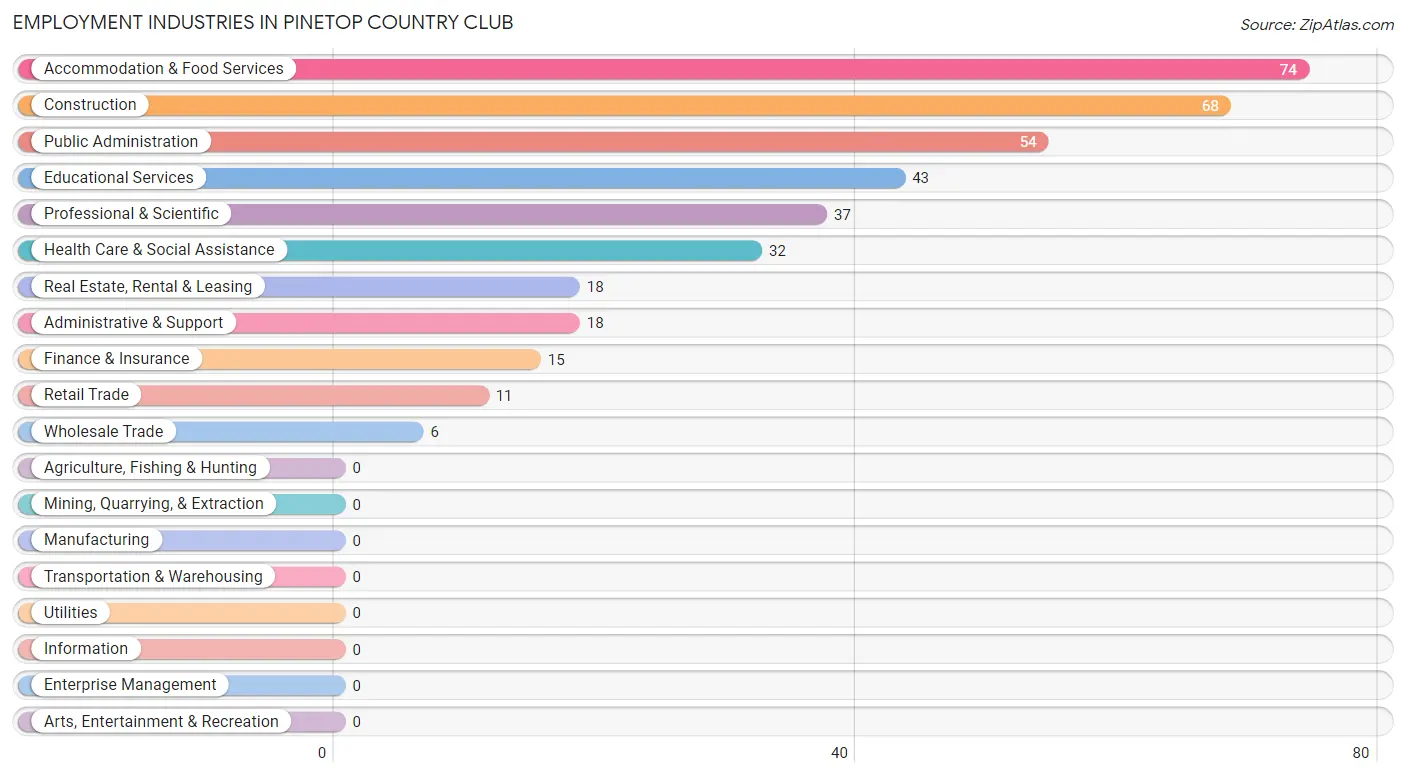
Employment Industries in Pinetop Country Club
The major employment industries in Pinetop Country Club include Accommodation & Food Services (74 | 19.7%), Construction (68 | 18.1%), Public Administration (54 | 14.4%), Educational Services (43 | 11.4%), and Professional & Scientific (37 | 9.8%).
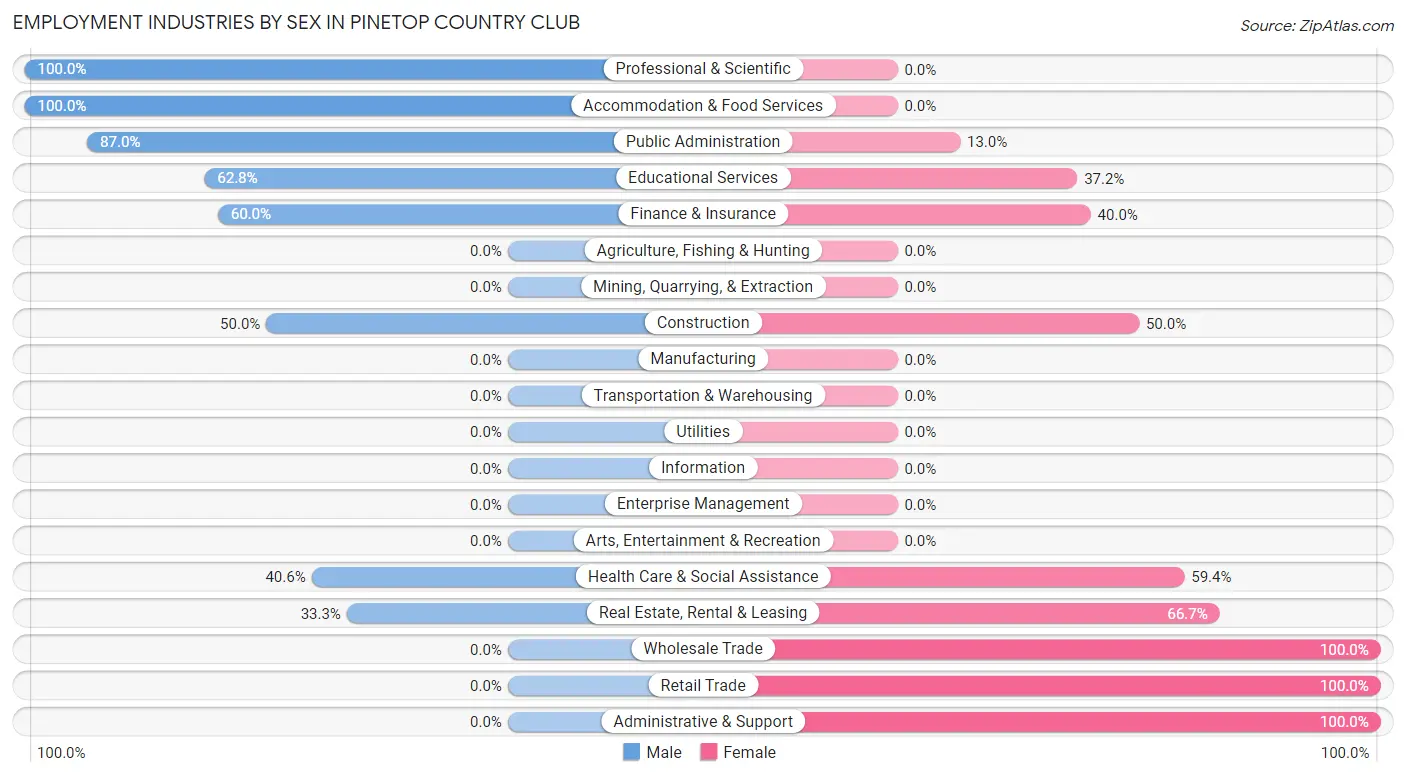
Employment Industries by Sex in Pinetop Country Club
The Pinetop Country Club industries that see more men than women are Professional & Scientific (100.0%), Accommodation & Food Services (100.0%), and Public Administration (87.0%), whereas the industries that tend to have a higher number of women are Wholesale Trade (100.0%), Retail Trade (100.0%), and Administrative & Support (100.0%).
| Industry | Male | Female |
| Agriculture, Fishing & Hunting | 0 (0.0%) | 0 (0.0%) |
| Mining, Quarrying, & Extraction | 0 (0.0%) | 0 (0.0%) |
| Construction | 34 (50.0%) | 34 (50.0%) |
| Manufacturing | 0 (0.0%) | 0 (0.0%) |
| Wholesale Trade | 0 (0.0%) | 6 (100.0%) |
| Retail Trade | 0 (0.0%) | 11 (100.0%) |
| Transportation & Warehousing | 0 (0.0%) | 0 (0.0%) |
| Utilities | 0 (0.0%) | 0 (0.0%) |
| Information | 0 (0.0%) | 0 (0.0%) |
| Finance & Insurance | 9 (60.0%) | 6 (40.0%) |
| Real Estate, Rental & Leasing | 6 (33.3%) | 12 (66.7%) |
| Professional & Scientific | 37 (100.0%) | 0 (0.0%) |
| Enterprise Management | 0 (0.0%) | 0 (0.0%) |
| Administrative & Support | 0 (0.0%) | 18 (100.0%) |
| Educational Services | 27 (62.8%) | 16 (37.2%) |
| Health Care & Social Assistance | 13 (40.6%) | 19 (59.4%) |
| Arts, Entertainment & Recreation | 0 (0.0%) | 0 (0.0%) |
| Accommodation & Food Services | 74 (100.0%) | 0 (0.0%) |
| Public Administration | 47 (87.0%) | 7 (13.0%) |
| Total | 247 (65.7%) | 129 (34.3%) |
Education in Pinetop Country Club
School Enrollment in Pinetop Country Club
The most common levels of schooling among the 150 students in Pinetop Country Club are high school (60 | 40.0%), middle school (34 | 22.7%), and elementary school (28 | 18.7%).
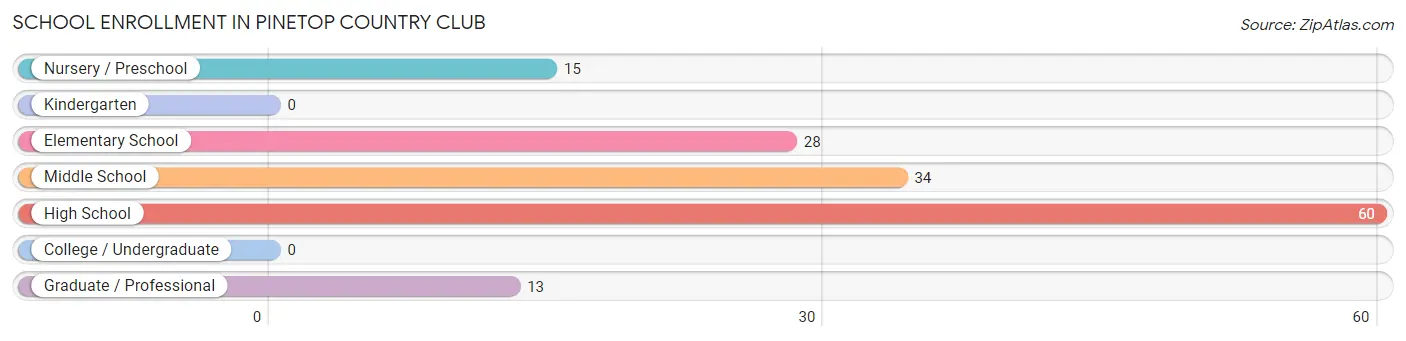
| School Level | # Students | % Students |
| Nursery / Preschool | 15 | 10.0% |
| Kindergarten | 0 | 0.0% |
| Elementary School | 28 | 18.7% |
| Middle School | 34 | 22.7% |
| High School | 60 | 40.0% |
| College / Undergraduate | 0 | 0.0% |
| Graduate / Professional | 13 | 8.7% |
| Total | 150 | 100.0% |
School Enrollment by Age by Funding Source in Pinetop Country Club
Out of a total of 150 students who are enrolled in schools in Pinetop Country Club, 15 (10.0%) attend a private institution, while the remaining 135 (90.0%) are enrolled in public schools. The age group of 3 to 4 year olds has the highest likelihood of being enrolled in private schools, with 15 (100.0% in the age bracket) enrolled. Conversely, the age group of 5 to 9 year old has the lowest likelihood of being enrolled in a private school, with 28 (100.0% in the age bracket) attending a public institution.
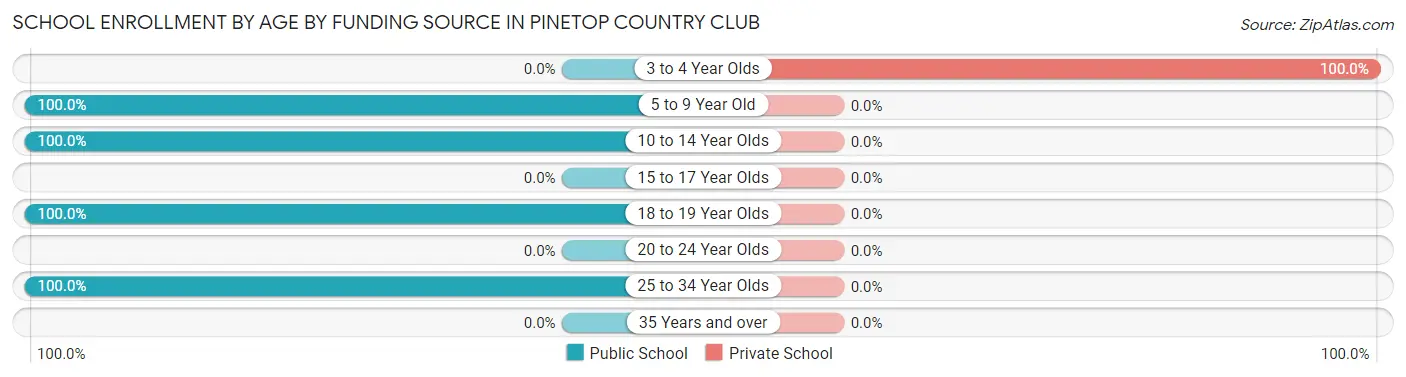
| Age Bracket | Public School | Private School |
| 3 to 4 Year Olds | 0 (0.0%) | 15 (100.0%) |
| 5 to 9 Year Old | 28 (100.0%) | 0 (0.0%) |
| 10 to 14 Year Olds | 34 (100.0%) | 0 (0.0%) |
| 15 to 17 Year Olds | 0 (0.0%) | 0 (0.0%) |
| 18 to 19 Year Olds | 60 (100.0%) | 0 (0.0%) |
| 20 to 24 Year Olds | 0 (0.0%) | 0 (0.0%) |
| 25 to 34 Year Olds | 13 (100.0%) | 0 (0.0%) |
| 35 Years and over | 0 (0.0%) | 0 (0.0%) |
| Total | 135 (90.0%) | 15 (10.0%) |
Educational Attainment by Field of Study in Pinetop Country Club
Business (221 | 26.2%), education (163 | 19.3%), visual & performing arts (103 | 12.2%), social sciences (71 | 8.4%), and bio, nature & agricultural (56 | 6.6%) are the most common fields of study among 843 individuals in Pinetop Country Club who have obtained a bachelor's degree or higher.
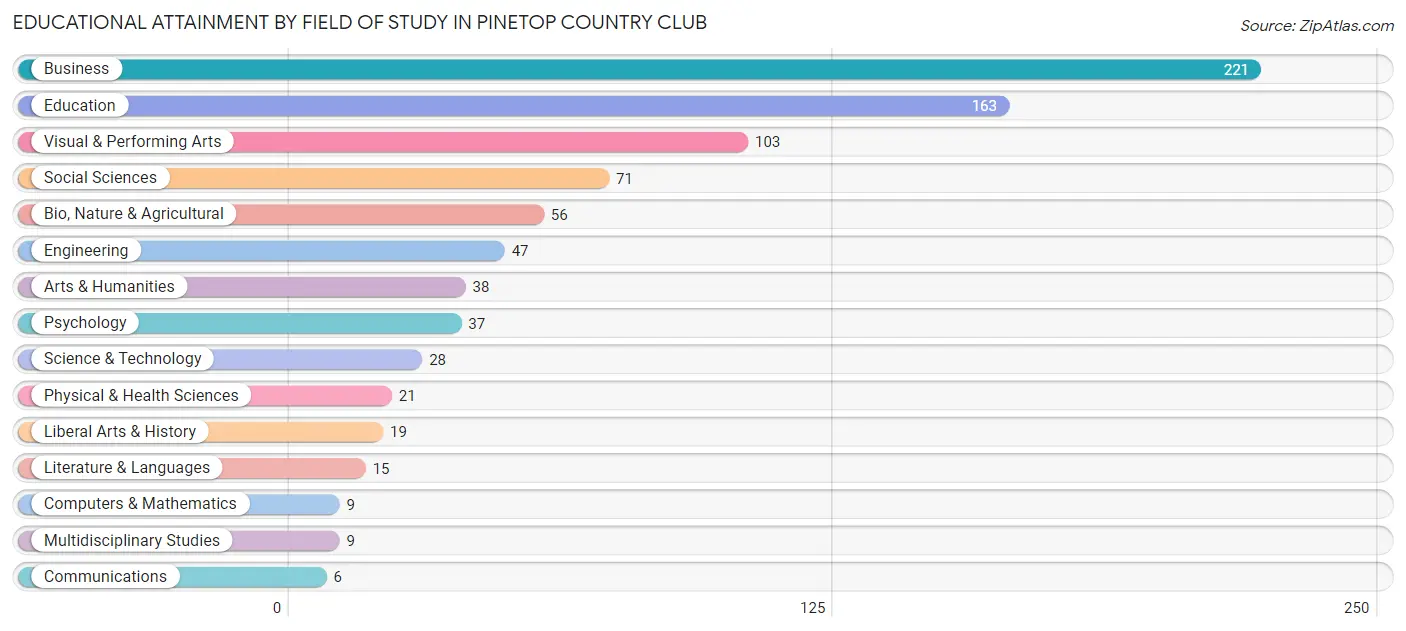
| Field of Study | # Graduates | % Graduates |
| Computers & Mathematics | 9 | 1.1% |
| Bio, Nature & Agricultural | 56 | 6.6% |
| Physical & Health Sciences | 21 | 2.5% |
| Psychology | 37 | 4.4% |
| Social Sciences | 71 | 8.4% |
| Engineering | 47 | 5.6% |
| Multidisciplinary Studies | 9 | 1.1% |
| Science & Technology | 28 | 3.3% |
| Business | 221 | 26.2% |
| Education | 163 | 19.3% |
| Literature & Languages | 15 | 1.8% |
| Liberal Arts & History | 19 | 2.2% |
| Visual & Performing Arts | 103 | 12.2% |
| Communications | 6 | 0.7% |
| Arts & Humanities | 38 | 4.5% |
| Total | 843 | 100.0% |
Transportation & Commute in Pinetop Country Club
Vehicle Availability by Sex in Pinetop Country Club
The most prevalent vehicle ownership categories in Pinetop Country Club are males with 2 vehicles (118, accounting for 47.8%) and females with 2 vehicles (45, making up 91.5%).
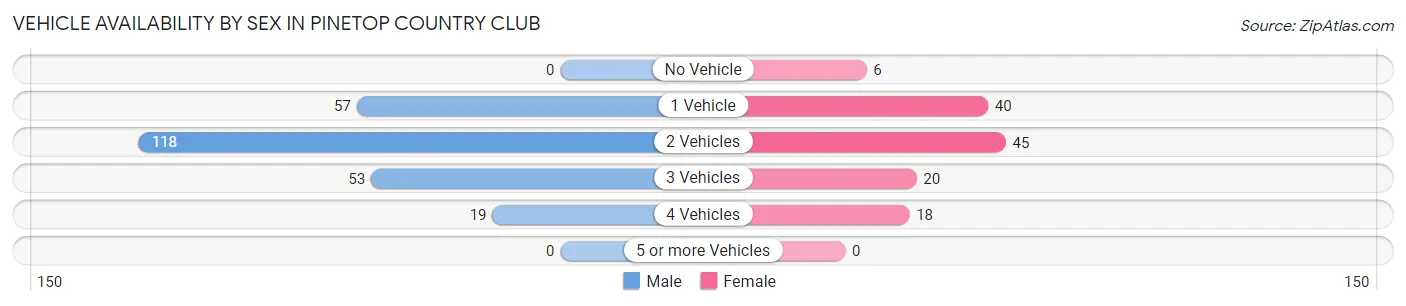
| Vehicles Available | Male | Female |
| No Vehicle | 0 (0.0%) | 6 (4.6%) |
| 1 Vehicle | 57 (23.1%) | 40 (31.0%) |
| 2 Vehicles | 118 (47.8%) | 45 (34.9%) |
| 3 Vehicles | 53 (21.5%) | 20 (15.5%) |
| 4 Vehicles | 19 (7.7%) | 18 (14.0%) |
| 5 or more Vehicles | 0 (0.0%) | 0 (0.0%) |
| Total | 247 (100.0%) | 129 (100.0%) |
Commute Time in Pinetop Country Club
The most frequently occuring commute durations in Pinetop Country Club are 10 to 14 minutes (99 commuters, 30.0%), 35 to 39 minutes (83 commuters, 25.2%), and 15 to 19 minutes (45 commuters, 13.6%).
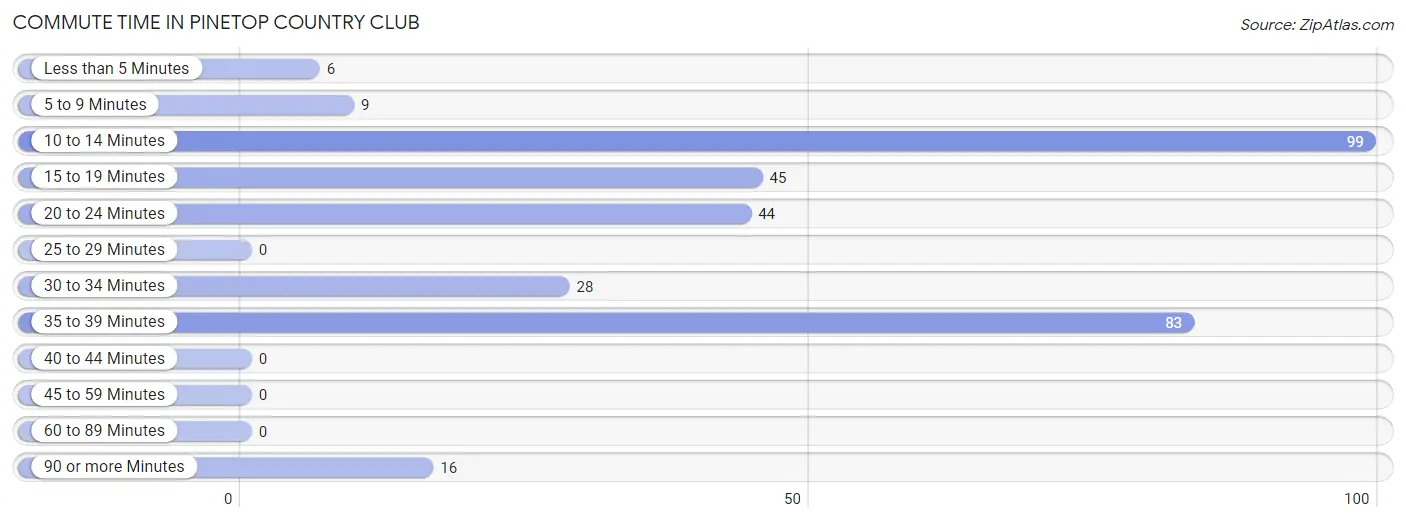
| Commute Time | # Commuters | % Commuters |
| Less than 5 Minutes | 6 | 1.8% |
| 5 to 9 Minutes | 9 | 2.7% |
| 10 to 14 Minutes | 99 | 30.0% |
| 15 to 19 Minutes | 45 | 13.6% |
| 20 to 24 Minutes | 44 | 13.3% |
| 25 to 29 Minutes | 0 | 0.0% |
| 30 to 34 Minutes | 28 | 8.5% |
| 35 to 39 Minutes | 83 | 25.2% |
| 40 to 44 Minutes | 0 | 0.0% |
| 45 to 59 Minutes | 0 | 0.0% |
| 60 to 89 Minutes | 0 | 0.0% |
| 90 or more Minutes | 16 | 4.9% |
Commute Time by Sex in Pinetop Country Club
The most common commute times in Pinetop Country Club are 10 to 14 minutes (99 commuters, 46.9%) for males and 35 to 39 minutes (49 commuters, 41.2%) for females.
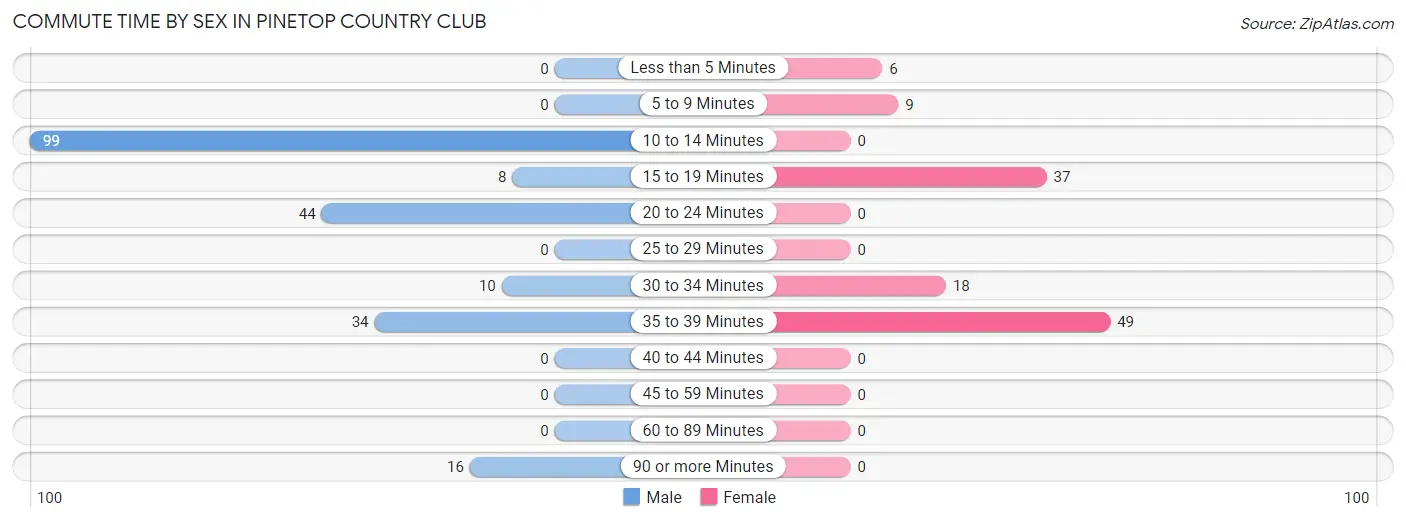
| Commute Time | Male | Female |
| Less than 5 Minutes | 0 (0.0%) | 6 (5.0%) |
| 5 to 9 Minutes | 0 (0.0%) | 9 (7.6%) |
| 10 to 14 Minutes | 99 (46.9%) | 0 (0.0%) |
| 15 to 19 Minutes | 8 (3.8%) | 37 (31.1%) |
| 20 to 24 Minutes | 44 (20.8%) | 0 (0.0%) |
| 25 to 29 Minutes | 0 (0.0%) | 0 (0.0%) |
| 30 to 34 Minutes | 10 (4.7%) | 18 (15.1%) |
| 35 to 39 Minutes | 34 (16.1%) | 49 (41.2%) |
| 40 to 44 Minutes | 0 (0.0%) | 0 (0.0%) |
| 45 to 59 Minutes | 0 (0.0%) | 0 (0.0%) |
| 60 to 89 Minutes | 0 (0.0%) | 0 (0.0%) |
| 90 or more Minutes | 16 (7.6%) | 0 (0.0%) |
Time of Departure to Work by Sex in Pinetop Country Club
The most frequent times of departure to work in Pinetop Country Club are 8:00 AM to 8:29 AM (97, 46.0%) for males and 7:00 AM to 7:29 AM (42, 35.3%) for females.
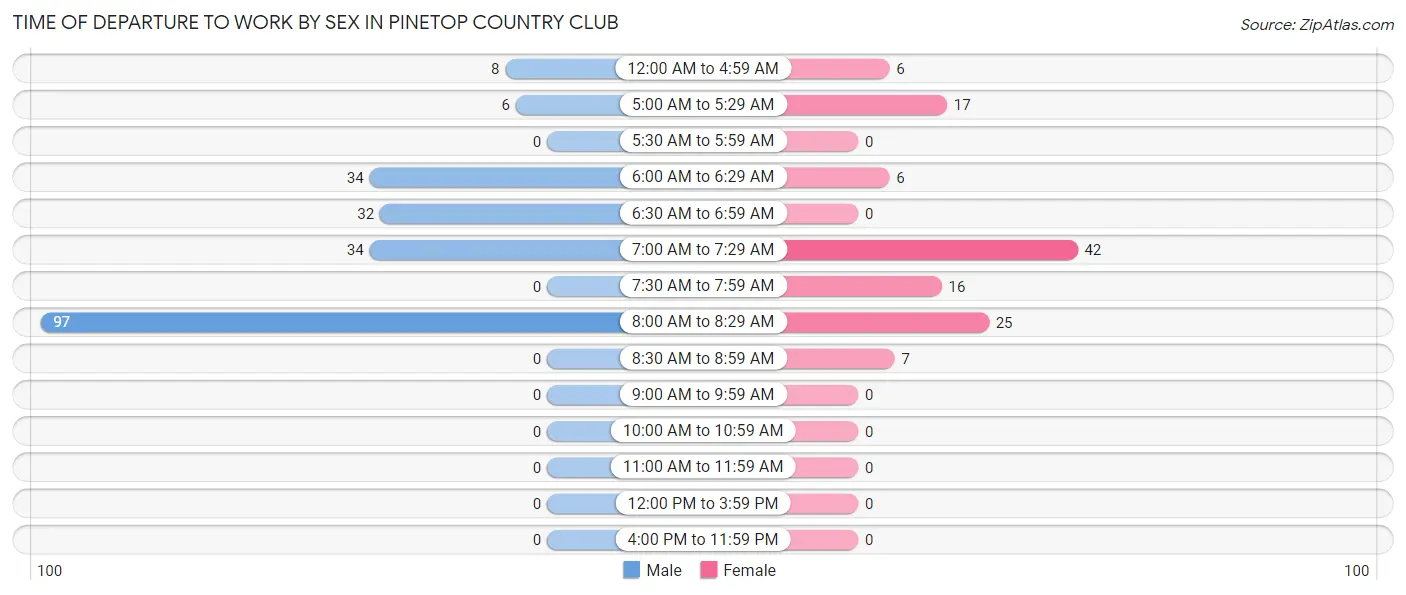
| Time of Departure | Male | Female |
| 12:00 AM to 4:59 AM | 8 (3.8%) | 6 (5.0%) |
| 5:00 AM to 5:29 AM | 6 (2.8%) | 17 (14.3%) |
| 5:30 AM to 5:59 AM | 0 (0.0%) | 0 (0.0%) |
| 6:00 AM to 6:29 AM | 34 (16.1%) | 6 (5.0%) |
| 6:30 AM to 6:59 AM | 32 (15.2%) | 0 (0.0%) |
| 7:00 AM to 7:29 AM | 34 (16.1%) | 42 (35.3%) |
| 7:30 AM to 7:59 AM | 0 (0.0%) | 16 (13.5%) |
| 8:00 AM to 8:29 AM | 97 (46.0%) | 25 (21.0%) |
| 8:30 AM to 8:59 AM | 0 (0.0%) | 7 (5.9%) |
| 9:00 AM to 9:59 AM | 0 (0.0%) | 0 (0.0%) |
| 10:00 AM to 10:59 AM | 0 (0.0%) | 0 (0.0%) |
| 11:00 AM to 11:59 AM | 0 (0.0%) | 0 (0.0%) |
| 12:00 PM to 3:59 PM | 0 (0.0%) | 0 (0.0%) |
| 4:00 PM to 11:59 PM | 0 (0.0%) | 0 (0.0%) |
| Total | 211 (100.0%) | 119 (100.0%) |
Housing Occupancy in Pinetop Country Club
Occupancy by Ownership in Pinetop Country Club
Of the total 911 dwellings in Pinetop Country Club, owner-occupied units account for 868 (95.3%), while renter-occupied units make up 43 (4.7%).
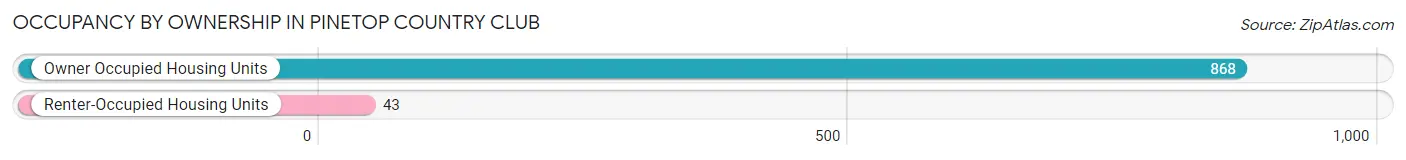
| Occupancy | # Housing Units | % Housing Units |
| Owner Occupied Housing Units | 868 | 95.3% |
| Renter-Occupied Housing Units | 43 | 4.7% |
| Total Occupied Housing Units | 911 | 100.0% |
Occupancy by Household Size in Pinetop Country Club
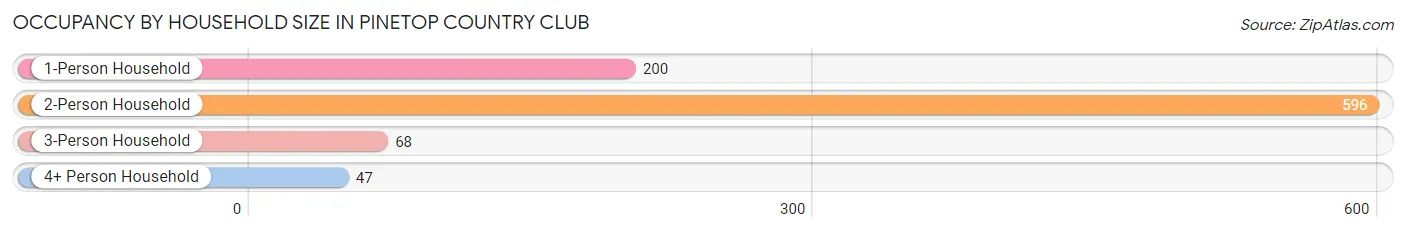
| Household Size | # Housing Units | % Housing Units |
| 1-Person Household | 200 | 22.0% |
| 2-Person Household | 596 | 65.4% |
| 3-Person Household | 68 | 7.5% |
| 4+ Person Household | 47 | 5.2% |
| Total Housing Units | 911 | 100.0% |
Occupancy by Ownership by Household Size in Pinetop Country Club
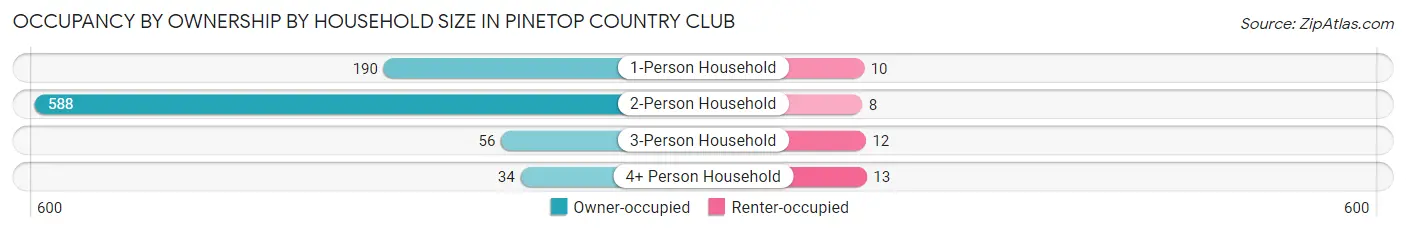
| Household Size | Owner-occupied | Renter-occupied |
| 1-Person Household | 190 (95.0%) | 10 (5.0%) |
| 2-Person Household | 588 (98.7%) | 8 (1.3%) |
| 3-Person Household | 56 (82.4%) | 12 (17.6%) |
| 4+ Person Household | 34 (72.3%) | 13 (27.7%) |
| Total Housing Units | 868 (95.3%) | 43 (4.7%) |
Occupancy by Educational Attainment in Pinetop Country Club
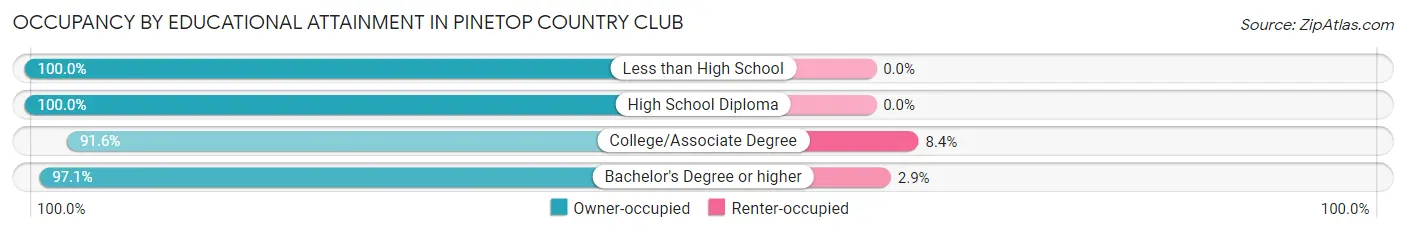
| Household Size | Owner-occupied | Renter-occupied |
| Less than High School | 11 (100.0%) | 0 (0.0%) |
| High School Diploma | 97 (100.0%) | 0 (0.0%) |
| College/Associate Degree | 327 (91.6%) | 30 (8.4%) |
| Bachelor's Degree or higher | 433 (97.1%) | 13 (2.9%) |
Occupancy by Age of Householder in Pinetop Country Club
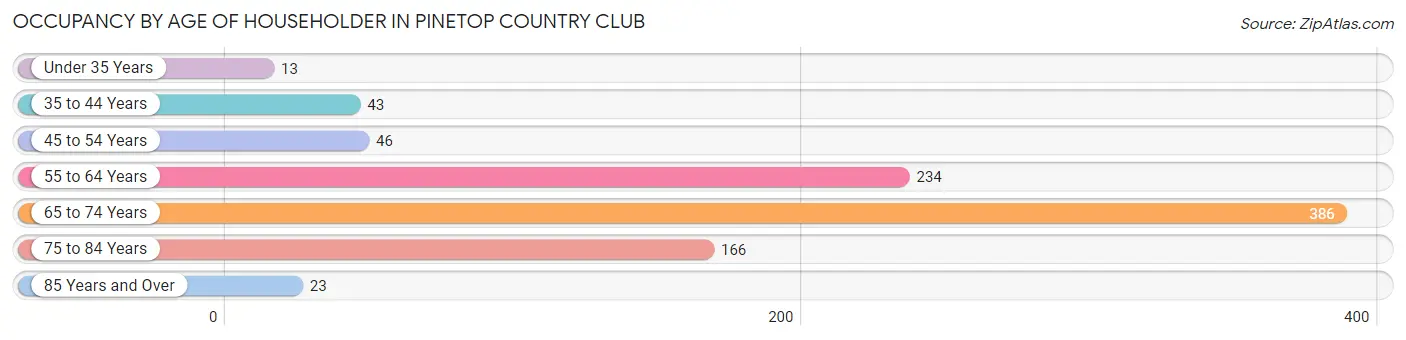
| Age Bracket | # Households | % Households |
| Under 35 Years | 13 | 1.4% |
| 35 to 44 Years | 43 | 4.7% |
| 45 to 54 Years | 46 | 5.1% |
| 55 to 64 Years | 234 | 25.7% |
| 65 to 74 Years | 386 | 42.4% |
| 75 to 84 Years | 166 | 18.2% |
| 85 Years and Over | 23 | 2.5% |
| Total | 911 | 100.0% |
Housing Finances in Pinetop Country Club
Median Income by Occupancy in Pinetop Country Club
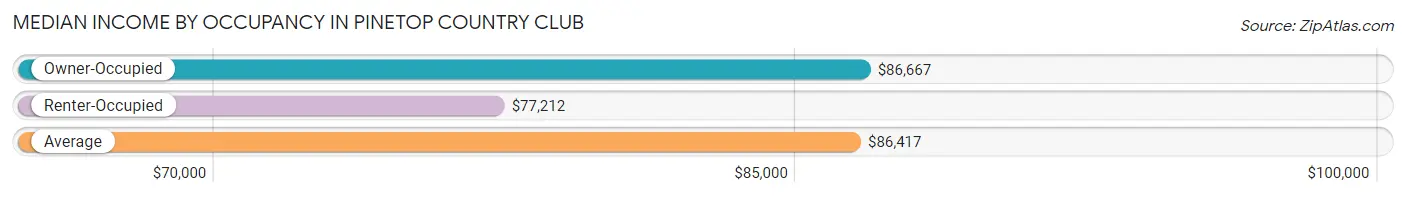
| Occupancy Type | # Households | Median Income |
| Owner-Occupied | 868 (95.3%) | $86,667 |
| Renter-Occupied | 43 (4.7%) | $77,212 |
| Average | 911 (100.0%) | $86,417 |
Occupancy by Householder Income Bracket in Pinetop Country Club
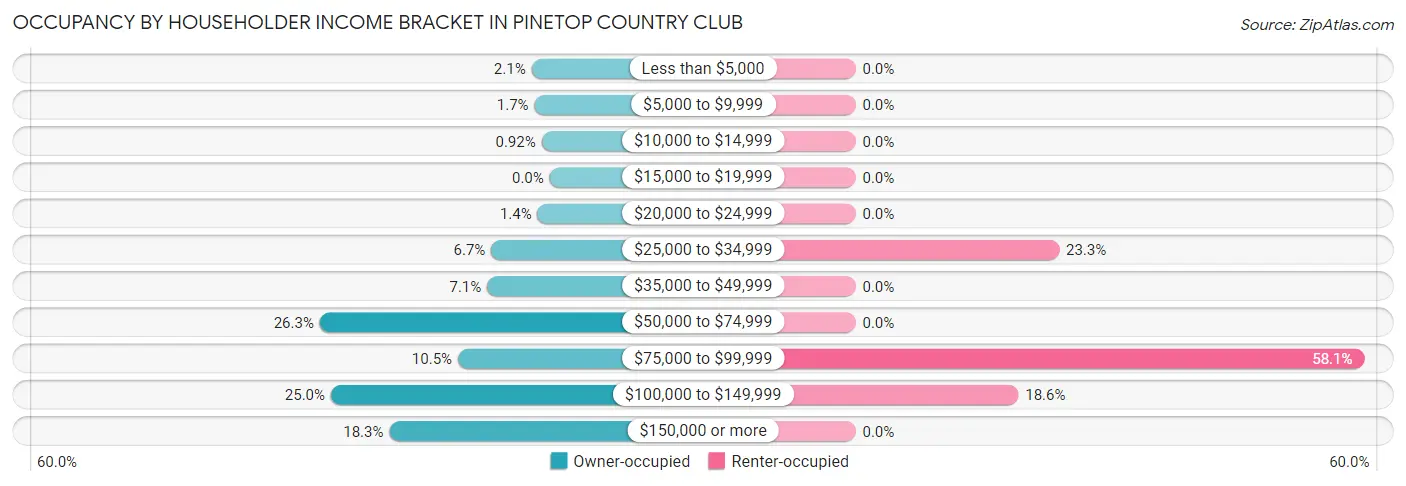
| Income Bracket | Owner-occupied | Renter-occupied |
| Less than $5,000 | 18 (2.1%) | 0 (0.0%) |
| $5,000 to $9,999 | 15 (1.7%) | 0 (0.0%) |
| $10,000 to $14,999 | 8 (0.9%) | 0 (0.0%) |
| $15,000 to $19,999 | 0 (0.0%) | 0 (0.0%) |
| $20,000 to $24,999 | 12 (1.4%) | 0 (0.0%) |
| $25,000 to $34,999 | 58 (6.7%) | 10 (23.3%) |
| $35,000 to $49,999 | 62 (7.1%) | 0 (0.0%) |
| $50,000 to $74,999 | 228 (26.3%) | 0 (0.0%) |
| $75,000 to $99,999 | 91 (10.5%) | 25 (58.1%) |
| $100,000 to $149,999 | 217 (25.0%) | 8 (18.6%) |
| $150,000 or more | 159 (18.3%) | 0 (0.0%) |
| Total | 868 (100.0%) | 43 (100.0%) |
Monthly Housing Cost Tiers in Pinetop Country Club
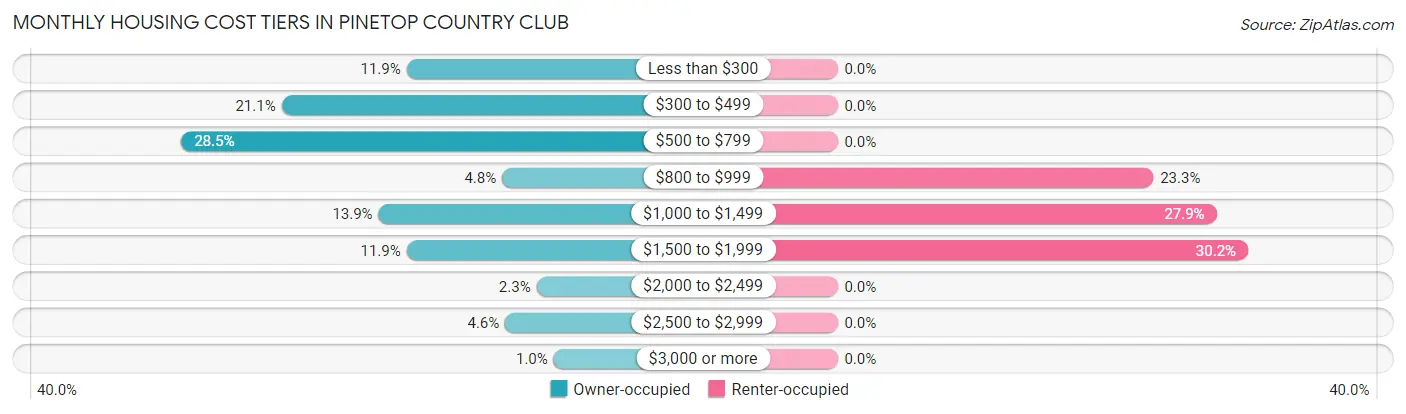
| Monthly Cost | Owner-occupied | Renter-occupied |
| Less than $300 | 103 (11.9%) | 0 (0.0%) |
| $300 to $499 | 183 (21.1%) | 0 (0.0%) |
| $500 to $799 | 247 (28.5%) | 0 (0.0%) |
| $800 to $999 | 42 (4.8%) | 10 (23.3%) |
| $1,000 to $1,499 | 121 (13.9%) | 12 (27.9%) |
| $1,500 to $1,999 | 103 (11.9%) | 13 (30.2%) |
| $2,000 to $2,499 | 20 (2.3%) | 0 (0.0%) |
| $2,500 to $2,999 | 40 (4.6%) | 0 (0.0%) |
| $3,000 or more | 9 (1.0%) | 0 (0.0%) |
| Total | 868 (100.0%) | 43 (100.0%) |
Physical Housing Characteristics in Pinetop Country Club
Housing Structures in Pinetop Country Club
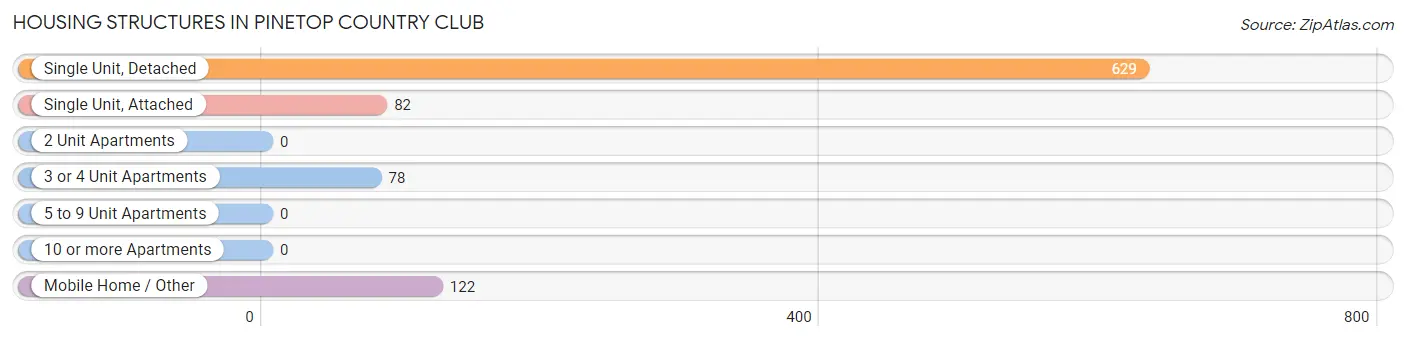
| Structure Type | # Housing Units | % Housing Units |
| Single Unit, Detached | 629 | 69.1% |
| Single Unit, Attached | 82 | 9.0% |
| 2 Unit Apartments | 0 | 0.0% |
| 3 or 4 Unit Apartments | 78 | 8.6% |
| 5 to 9 Unit Apartments | 0 | 0.0% |
| 10 or more Apartments | 0 | 0.0% |
| Mobile Home / Other | 122 | 13.4% |
| Total | 911 | 100.0% |
Housing Structures by Occupancy in Pinetop Country Club
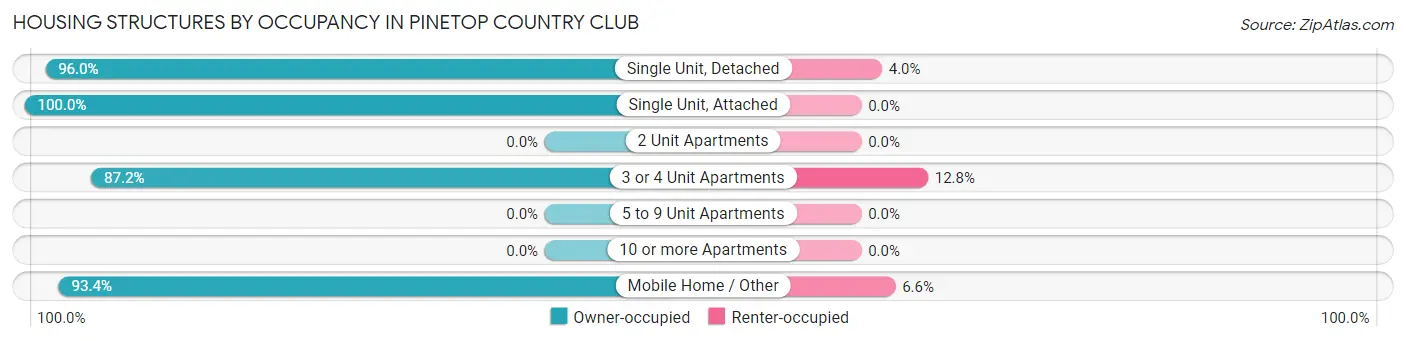
| Structure Type | Owner-occupied | Renter-occupied |
| Single Unit, Detached | 604 (96.0%) | 25 (4.0%) |
| Single Unit, Attached | 82 (100.0%) | 0 (0.0%) |
| 2 Unit Apartments | 0 (0.0%) | 0 (0.0%) |
| 3 or 4 Unit Apartments | 68 (87.2%) | 10 (12.8%) |
| 5 to 9 Unit Apartments | 0 (0.0%) | 0 (0.0%) |
| 10 or more Apartments | 0 (0.0%) | 0 (0.0%) |
| Mobile Home / Other | 114 (93.4%) | 8 (6.6%) |
| Total | 868 (95.3%) | 43 (4.7%) |
Housing Structures by Number of Rooms in Pinetop Country Club
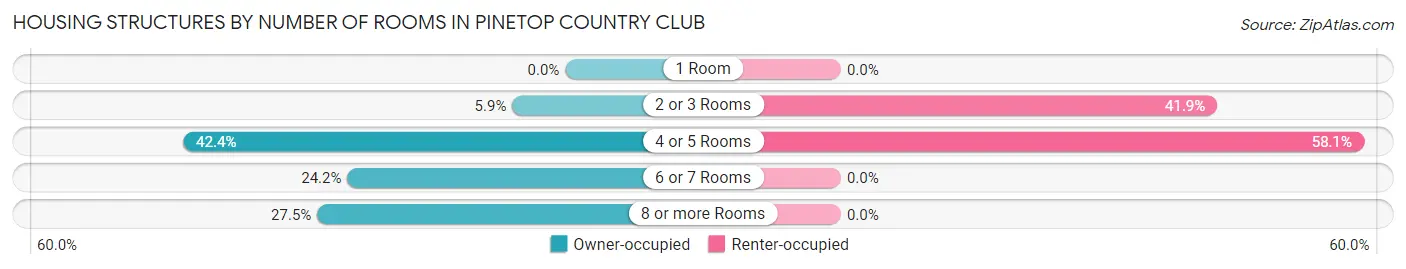
| Number of Rooms | Owner-occupied | Renter-occupied |
| 1 Room | 0 (0.0%) | 0 (0.0%) |
| 2 or 3 Rooms | 51 (5.9%) | 18 (41.9%) |
| 4 or 5 Rooms | 368 (42.4%) | 25 (58.1%) |
| 6 or 7 Rooms | 210 (24.2%) | 0 (0.0%) |
| 8 or more Rooms | 239 (27.5%) | 0 (0.0%) |
| Total | 868 (100.0%) | 43 (100.0%) |
Housing Structure by Heating Type in Pinetop Country Club
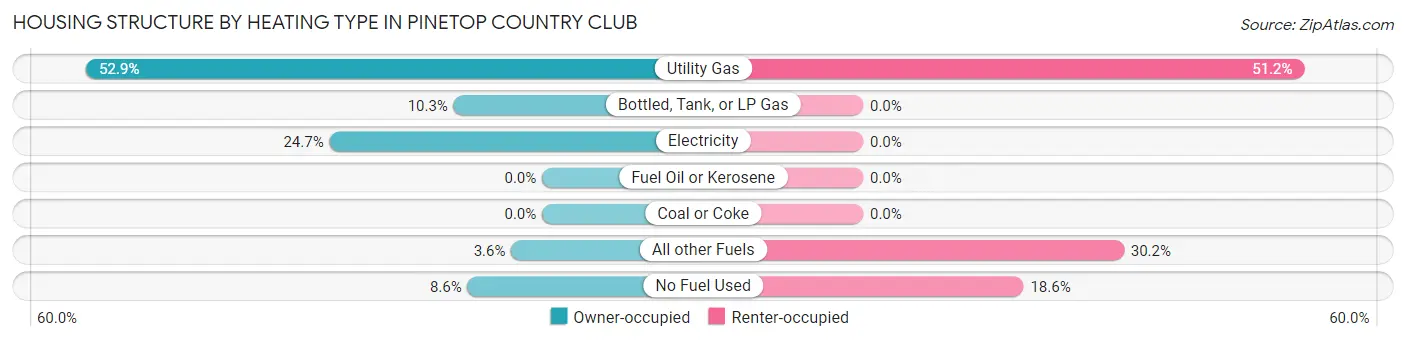
| Heating Type | Owner-occupied | Renter-occupied |
| Utility Gas | 459 (52.9%) | 22 (51.2%) |
| Bottled, Tank, or LP Gas | 89 (10.2%) | 0 (0.0%) |
| Electricity | 214 (24.6%) | 0 (0.0%) |
| Fuel Oil or Kerosene | 0 (0.0%) | 0 (0.0%) |
| Coal or Coke | 0 (0.0%) | 0 (0.0%) |
| All other Fuels | 31 (3.6%) | 13 (30.2%) |
| No Fuel Used | 75 (8.6%) | 8 (18.6%) |
| Total | 868 (100.0%) | 43 (100.0%) |
Household Vehicle Usage in Pinetop Country Club
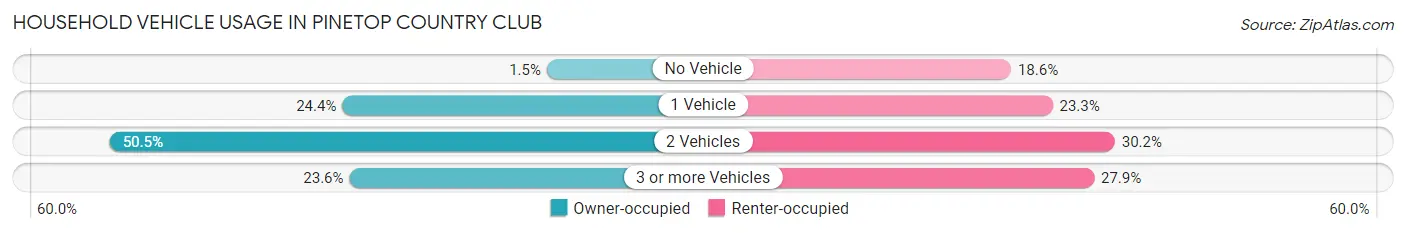
| Vehicles per Household | Owner-occupied | Renter-occupied |
| No Vehicle | 13 (1.5%) | 8 (18.6%) |
| 1 Vehicle | 212 (24.4%) | 10 (23.3%) |
| 2 Vehicles | 438 (50.5%) | 13 (30.2%) |
| 3 or more Vehicles | 205 (23.6%) | 12 (27.9%) |
| Total | 868 (100.0%) | 43 (100.0%) |
Real Estate & Mortgages in Pinetop Country Club
Real Estate and Mortgage Overview in Pinetop Country Club
| Characteristic | Without Mortgage | With Mortgage |
| Housing Units | 552 | 316 |
| Median Property Value | $388,500 | $307,200 |
| Median Household Income | $83,438 | $77 |
| Monthly Housing Costs | $493 | $9 |
| Real Estate Taxes | $2,529 | $0 |
Property Value by Mortgage Status in Pinetop Country Club
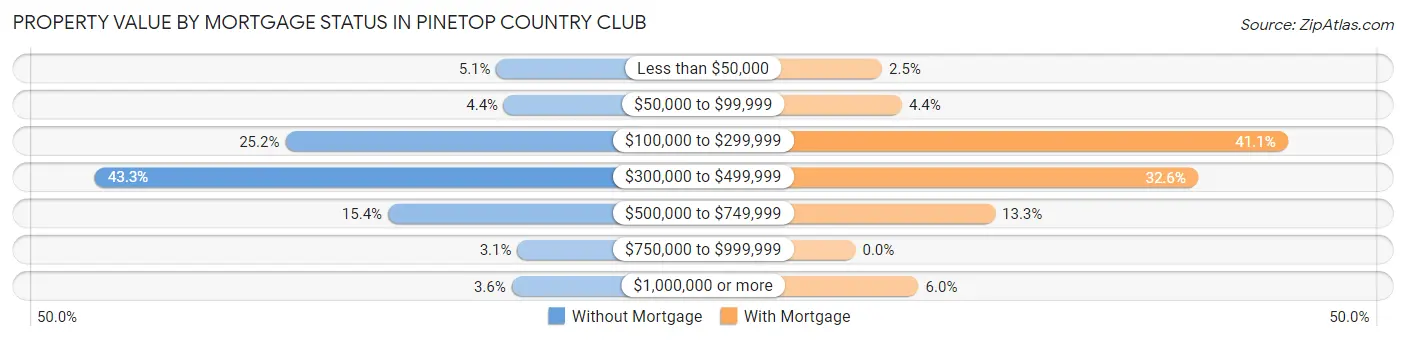
| Property Value | Without Mortgage | With Mortgage |
| Less than $50,000 | 28 (5.1%) | 8 (2.5%) |
| $50,000 to $99,999 | 24 (4.3%) | 14 (4.4%) |
| $100,000 to $299,999 | 139 (25.2%) | 130 (41.1%) |
| $300,000 to $499,999 | 239 (43.3%) | 103 (32.6%) |
| $500,000 to $749,999 | 85 (15.4%) | 42 (13.3%) |
| $750,000 to $999,999 | 17 (3.1%) | 0 (0.0%) |
| $1,000,000 or more | 20 (3.6%) | 19 (6.0%) |
| Total | 552 (100.0%) | 316 (100.0%) |
Household Income by Mortgage Status in Pinetop Country Club
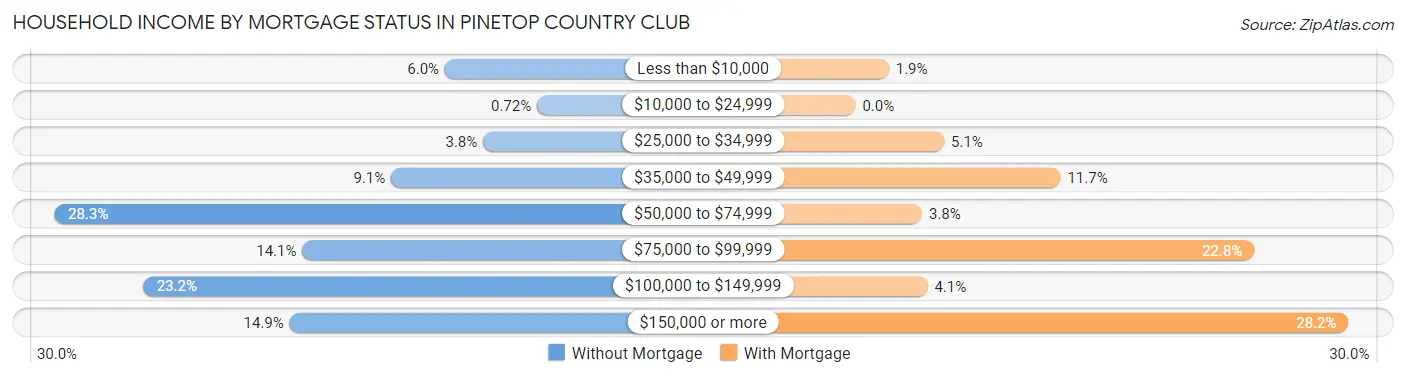
| Household Income | Without Mortgage | With Mortgage |
| Less than $10,000 | 33 (6.0%) | 6 (1.9%) |
| $10,000 to $24,999 | 4 (0.7%) | 0 (0.0%) |
| $25,000 to $34,999 | 21 (3.8%) | 16 (5.1%) |
| $35,000 to $49,999 | 50 (9.1%) | 37 (11.7%) |
| $50,000 to $74,999 | 156 (28.3%) | 12 (3.8%) |
| $75,000 to $99,999 | 78 (14.1%) | 72 (22.8%) |
| $100,000 to $149,999 | 128 (23.2%) | 13 (4.1%) |
| $150,000 or more | 82 (14.9%) | 89 (28.2%) |
| Total | 552 (100.0%) | 316 (100.0%) |
Property Value to Household Income Ratio in Pinetop Country Club
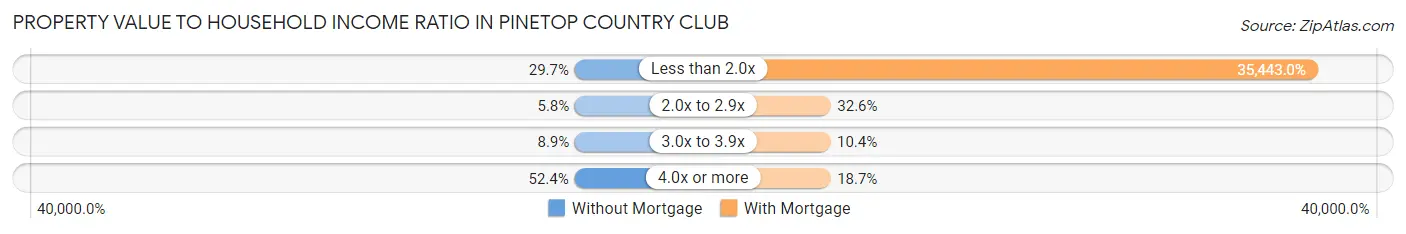
| Value-to-Income Ratio | Without Mortgage | With Mortgage |
| Less than 2.0x | 164 (29.7%) | 112,000 (35,443.0%) |
| 2.0x to 2.9x | 32 (5.8%) | 103 (32.6%) |
| 3.0x to 3.9x | 49 (8.9%) | 33 (10.4%) |
| 4.0x or more | 289 (52.4%) | 59 (18.7%) |
| Total | 552 (100.0%) | 316 (100.0%) |
Real Estate Taxes by Mortgage Status in Pinetop Country Club
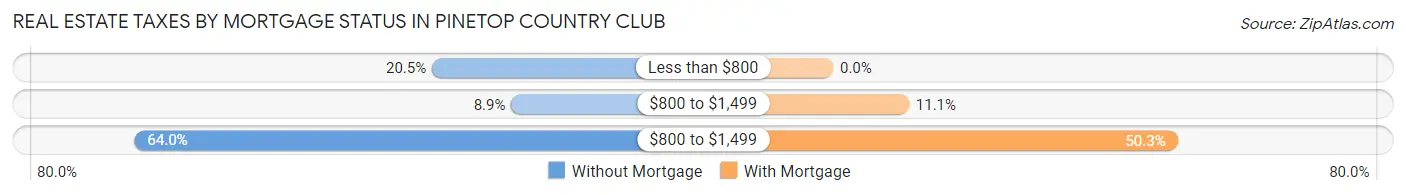
| Property Taxes | Without Mortgage | With Mortgage |
| Less than $800 | 113 (20.5%) | 0 (0.0%) |
| $800 to $1,499 | 49 (8.9%) | 35 (11.1%) |
| $800 to $1,499 | 353 (63.9%) | 159 (50.3%) |
| Total | 552 (100.0%) | 316 (100.0%) |
Health & Disability in Pinetop Country Club
Health Insurance Coverage by Age in Pinetop Country Club
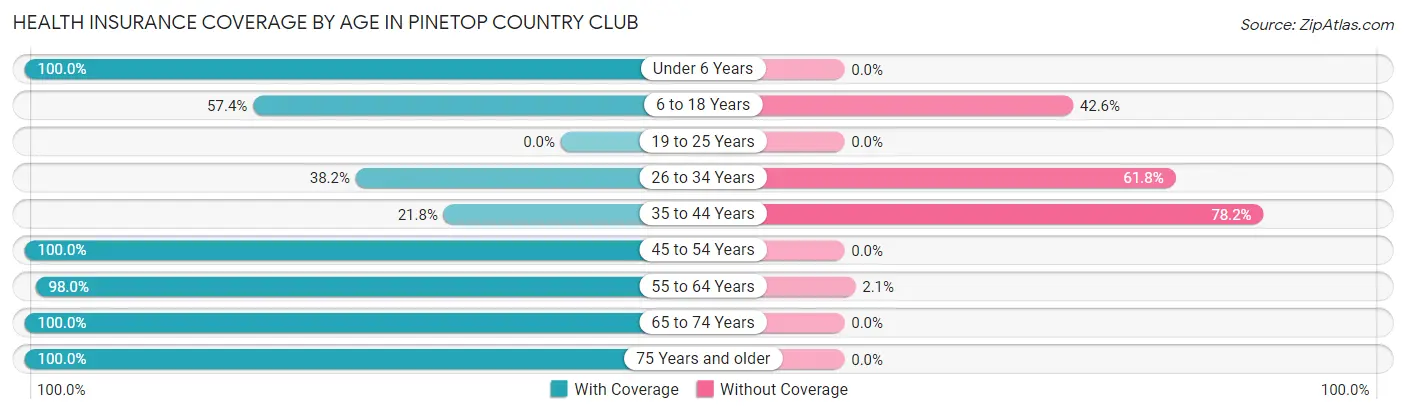
| Age Bracket | With Coverage | Without Coverage |
| Under 6 Years | 31 (100.0%) | 0 (0.0%) |
| 6 to 18 Years | 70 (57.4%) | 52 (42.6%) |
| 19 to 25 Years | 0 (0.0%) | 0 (0.0%) |
| 26 to 34 Years | 13 (38.2%) | 21 (61.8%) |
| 35 to 44 Years | 19 (21.8%) | 68 (78.2%) |
| 45 to 54 Years | 66 (100.0%) | 0 (0.0%) |
| 55 to 64 Years | 429 (98.0%) | 9 (2.1%) |
| 65 to 74 Years | 659 (100.0%) | 0 (0.0%) |
| 75 Years and older | 332 (100.0%) | 0 (0.0%) |
| Total | 1,619 (91.5%) | 150 (8.5%) |
Health Insurance Coverage by Citizenship Status in Pinetop Country Club
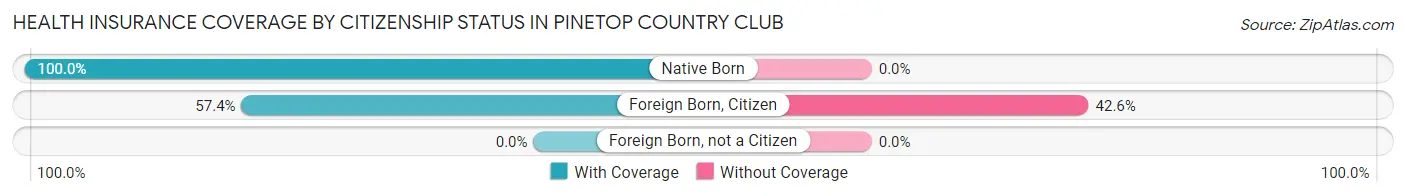
| Citizenship Status | With Coverage | Without Coverage |
| Native Born | 31 (100.0%) | 0 (0.0%) |
| Foreign Born, Citizen | 70 (57.4%) | 52 (42.6%) |
| Foreign Born, not a Citizen | 0 (0.0%) | 0 (0.0%) |
Health Insurance Coverage by Household Income in Pinetop Country Club
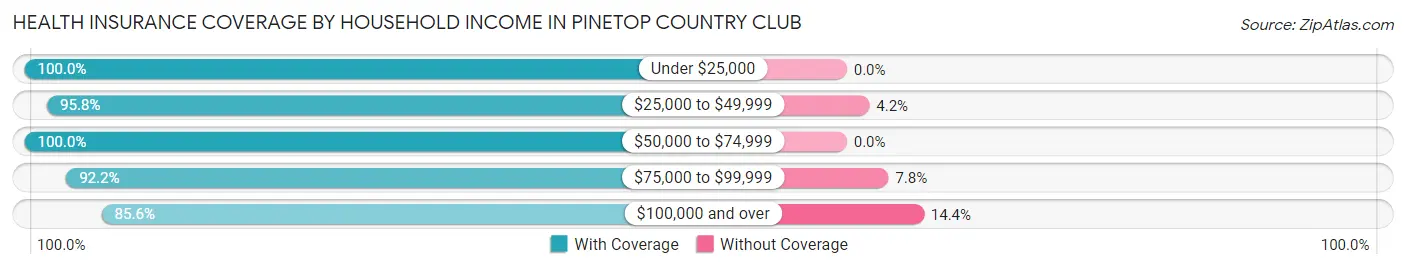
| Household Income | With Coverage | Without Coverage |
| Under $25,000 | 55 (100.0%) | 0 (0.0%) |
| $25,000 to $49,999 | 204 (95.8%) | 9 (4.2%) |
| $50,000 to $74,999 | 401 (100.0%) | 0 (0.0%) |
| $75,000 to $99,999 | 248 (92.2%) | 21 (7.8%) |
| $100,000 and over | 711 (85.6%) | 120 (14.4%) |
Public vs Private Health Insurance Coverage by Age in Pinetop Country Club
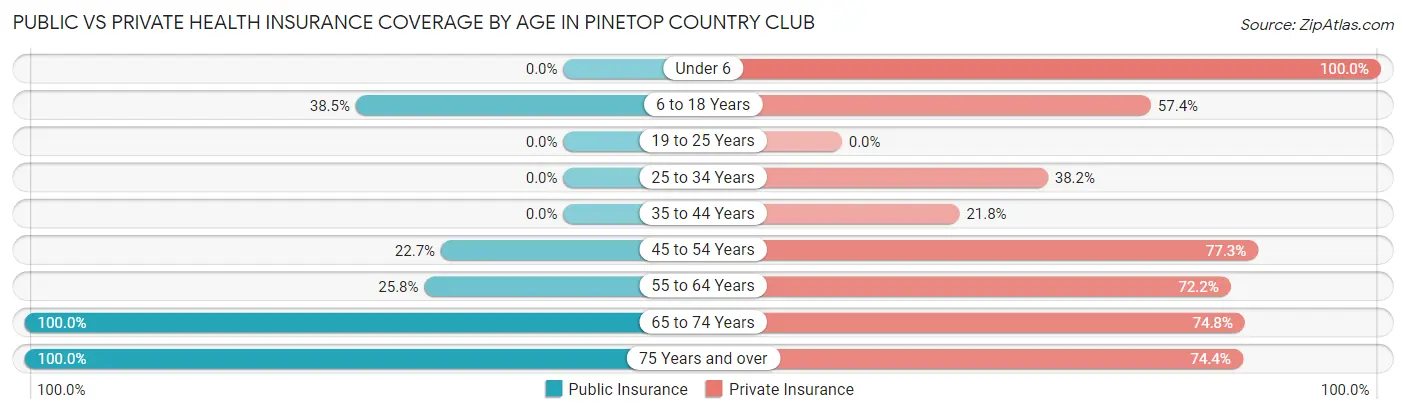
| Age Bracket | Public Insurance | Private Insurance |
| Under 6 | 0 (0.0%) | 31 (100.0%) |
| 6 to 18 Years | 47 (38.5%) | 70 (57.4%) |
| 19 to 25 Years | 0 (0.0%) | 0 (0.0%) |
| 25 to 34 Years | 0 (0.0%) | 13 (38.2%) |
| 35 to 44 Years | 0 (0.0%) | 19 (21.8%) |
| 45 to 54 Years | 15 (22.7%) | 51 (77.3%) |
| 55 to 64 Years | 113 (25.8%) | 316 (72.2%) |
| 65 to 74 Years | 659 (100.0%) | 493 (74.8%) |
| 75 Years and over | 332 (100.0%) | 247 (74.4%) |
| Total | 1,166 (65.9%) | 1,240 (70.1%) |
Disability Status by Sex by Age in Pinetop Country Club
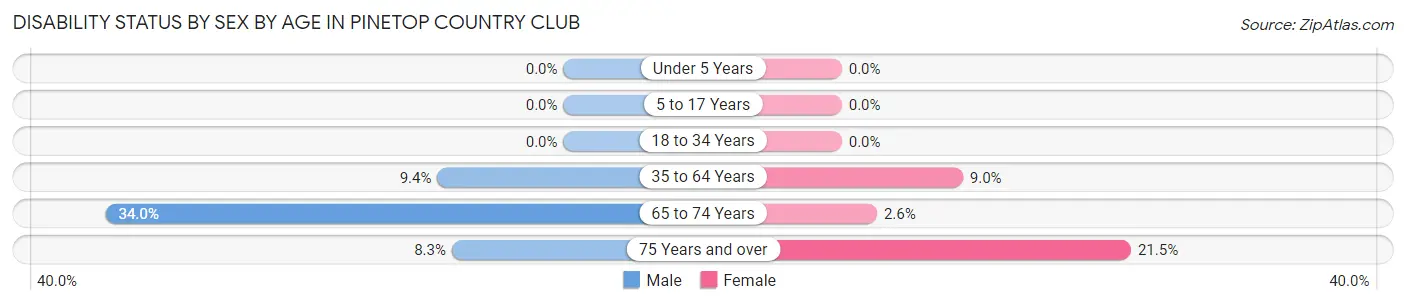
| Age Bracket | Male | Female |
| Under 5 Years | 0 (0.0%) | 0 (0.0%) |
| 5 to 17 Years | 0 (0.0%) | 0 (0.0%) |
| 18 to 34 Years | 0 (0.0%) | 0 (0.0%) |
| 35 to 64 Years | 22 (9.4%) | 32 (9.0%) |
| 65 to 74 Years | 120 (34.0%) | 8 (2.6%) |
| 75 Years and over | 14 (8.3%) | 35 (21.5%) |
Disability Class by Sex by Age in Pinetop Country Club
Disability Class: Hearing Difficulty
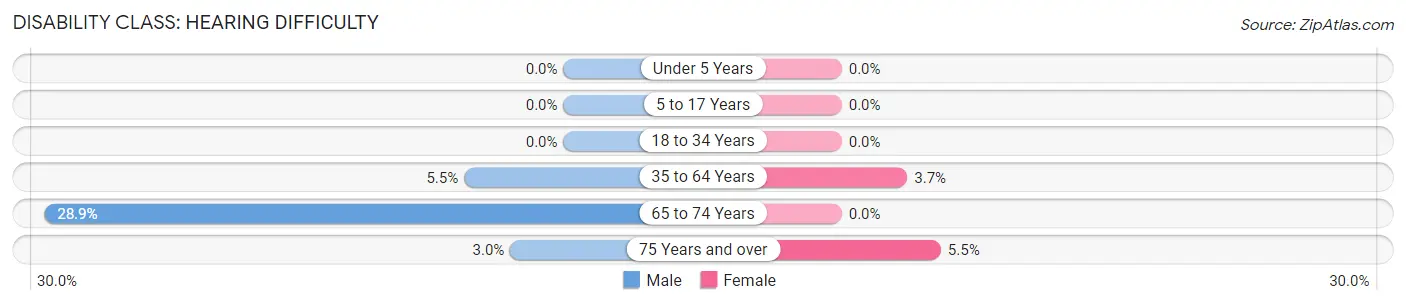
| Age Bracket | Male | Female |
| Under 5 Years | 0 (0.0%) | 0 (0.0%) |
| 5 to 17 Years | 0 (0.0%) | 0 (0.0%) |
| 18 to 34 Years | 0 (0.0%) | 0 (0.0%) |
| 35 to 64 Years | 13 (5.5%) | 13 (3.6%) |
| 65 to 74 Years | 102 (28.9%) | 0 (0.0%) |
| 75 Years and over | 5 (3.0%) | 9 (5.5%) |
Disability Class: Vision Difficulty
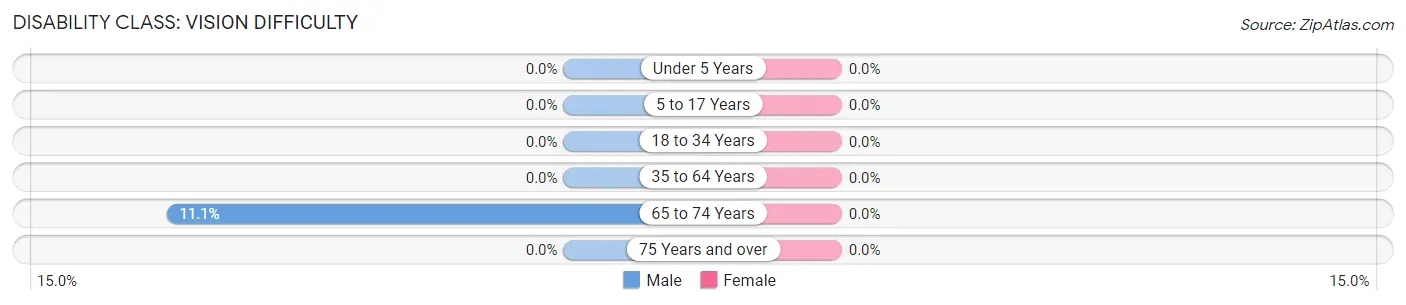
| Age Bracket | Male | Female |
| Under 5 Years | 0 (0.0%) | 0 (0.0%) |
| 5 to 17 Years | 0 (0.0%) | 0 (0.0%) |
| 18 to 34 Years | 0 (0.0%) | 0 (0.0%) |
| 35 to 64 Years | 0 (0.0%) | 0 (0.0%) |
| 65 to 74 Years | 39 (11.1%) | 0 (0.0%) |
| 75 Years and over | 0 (0.0%) | 0 (0.0%) |
Disability Class: Cognitive Difficulty
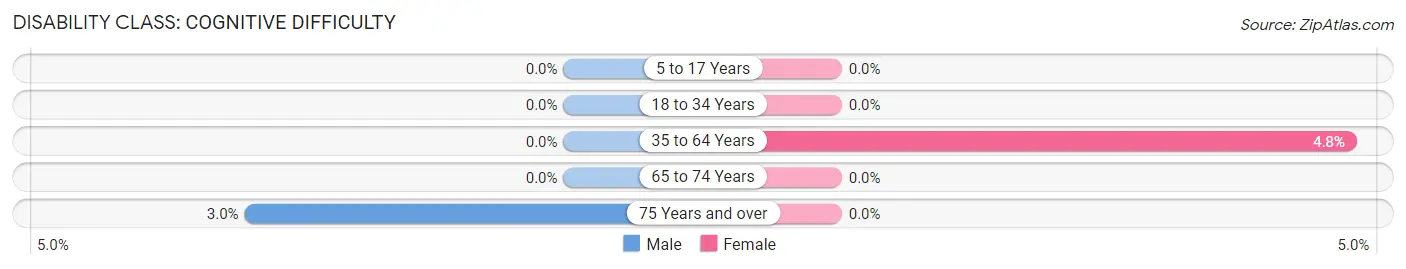
| Age Bracket | Male | Female |
| 5 to 17 Years | 0 (0.0%) | 0 (0.0%) |
| 18 to 34 Years | 0 (0.0%) | 0 (0.0%) |
| 35 to 64 Years | 0 (0.0%) | 17 (4.8%) |
| 65 to 74 Years | 0 (0.0%) | 0 (0.0%) |
| 75 Years and over | 5 (3.0%) | 0 (0.0%) |
Disability Class: Ambulatory Difficulty
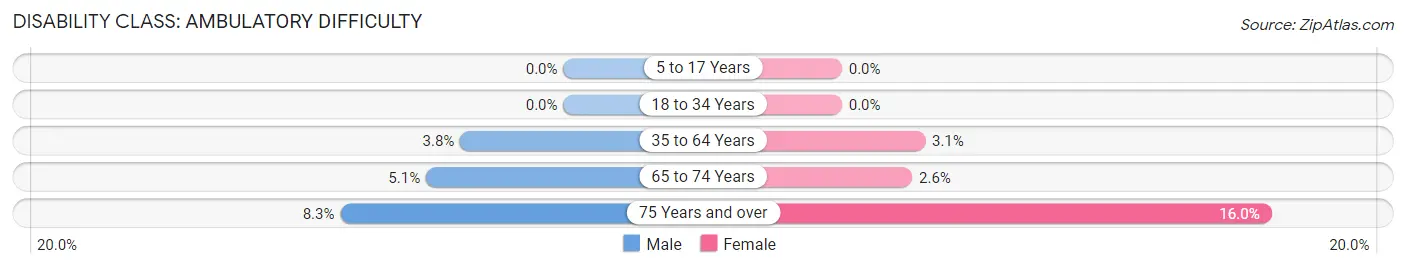
| Age Bracket | Male | Female |
| 5 to 17 Years | 0 (0.0%) | 0 (0.0%) |
| 18 to 34 Years | 0 (0.0%) | 0 (0.0%) |
| 35 to 64 Years | 9 (3.8%) | 11 (3.1%) |
| 65 to 74 Years | 18 (5.1%) | 8 (2.6%) |
| 75 Years and over | 14 (8.3%) | 26 (16.0%) |
Disability Class: Self-Care Difficulty
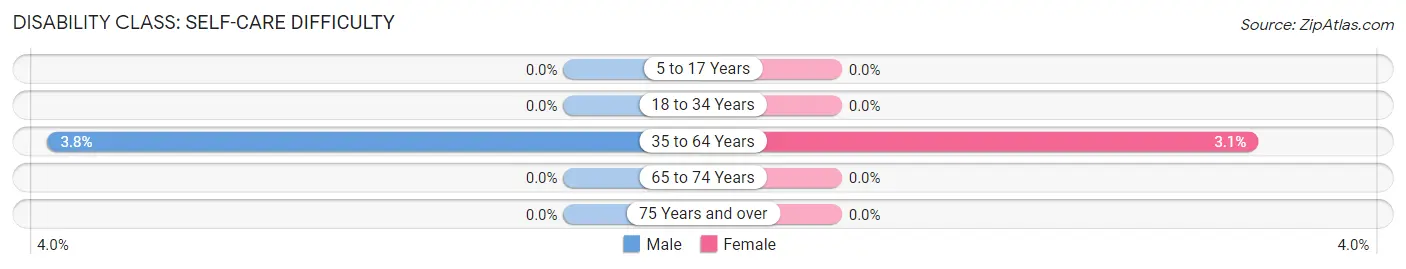
| Age Bracket | Male | Female |
| 5 to 17 Years | 0 (0.0%) | 0 (0.0%) |
| 18 to 34 Years | 0 (0.0%) | 0 (0.0%) |
| 35 to 64 Years | 9 (3.8%) | 11 (3.1%) |
| 65 to 74 Years | 0 (0.0%) | 0 (0.0%) |
| 75 Years and over | 0 (0.0%) | 0 (0.0%) |
Technology Access in Pinetop Country Club
Computing Device Access in Pinetop Country Club
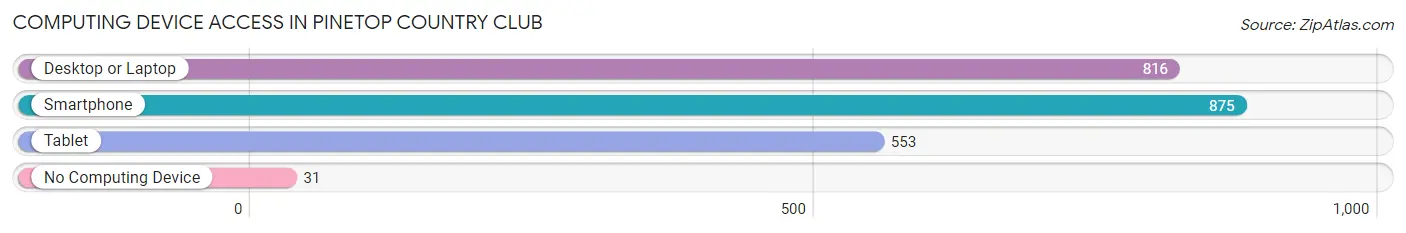
| Device Type | # Households | % Households |
| Desktop or Laptop | 816 | 89.6% |
| Smartphone | 875 | 96.1% |
| Tablet | 553 | 60.7% |
| No Computing Device | 31 | 3.4% |
| Total | 911 | 100.0% |
Internet Access in Pinetop Country Club
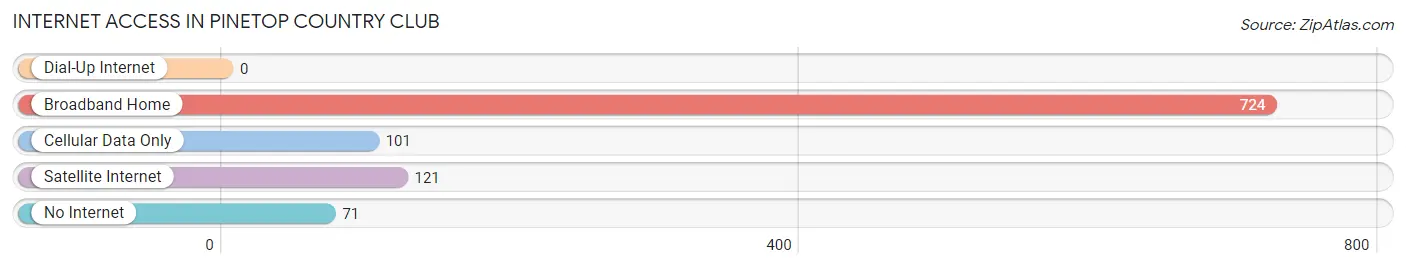
| Internet Type | # Households | % Households |
| Dial-Up Internet | 0 | 0.0% |
| Broadband Home | 724 | 79.5% |
| Cellular Data Only | 101 | 11.1% |
| Satellite Internet | 121 | 13.3% |
| No Internet | 71 | 7.8% |
| Total | 911 | 100.0% |
Pinetop Country Club Summary
Pinetop Country Club, AZ is a small unincorporated community located in Navajo County, Arizona. It is situated in the White Mountains of Arizona, approximately two hours east of Phoenix. The community is located in the Apache-Sitgreaves National Forest and is surrounded by the Apache-Sitgreaves National Forest, the White Mountain Apache Reservation, and the Fort Apache Indian Reservation. The community is home to approximately 1,000 people and is a popular destination for outdoor recreation, including camping, fishing, hiking, and skiing.
History
Pinetop Country Club, AZ was founded in the early 1900s by a group of settlers who were looking for a place to settle and build a community. The settlers were attracted to the area due to its abundance of natural resources, including timber, water, and wildlife. The settlers built a small community and named it Pinetop Country Club, after the nearby Pinetop Mountain. The community quickly grew and by the 1920s, it had become a popular destination for outdoor recreation.
In the 1950s, the community began to experience a decline in population as people moved away to larger cities. However, in the 1970s, the community experienced a resurgence in popularity as people began to move back to the area to take advantage of the outdoor recreation opportunities. Today, Pinetop Country Club, AZ is a popular destination for outdoor recreation and is home to a variety of businesses, including restaurants, lodging, and retail stores.
Geography
Pinetop Country Club, AZ is located in the White Mountains of Arizona, approximately two hours east of Phoenix. The community is situated in the Apache-Sitgreaves National Forest and is surrounded by the Apache-Sitgreaves National Forest, the White Mountain Apache Reservation, and the Fort Apache Indian Reservation. The community is located at an elevation of 6,000 feet and is home to a variety of wildlife, including elk, deer, and bear.
The climate in Pinetop Country Club, AZ is generally mild, with temperatures ranging from the low 30s in the winter to the high 80s in the summer. The area receives an average of 18 inches of precipitation per year, with most of the precipitation occurring in the summer months.
Economy
The economy of Pinetop Country Club, AZ is largely driven by tourism and outdoor recreation. The community is home to a variety of businesses, including restaurants, lodging, and retail stores. The community is also home to a number of outdoor recreation businesses, including ski resorts, fishing guides, and hiking guides.
In addition to tourism and outdoor recreation, the community is also home to a number of small businesses, including a grocery store, a hardware store, and a gas station. The community is also home to a number of manufacturing businesses, including a furniture factory and a woodworking shop.
Demographics
As of the 2010 census, the population of Pinetop Country Club, AZ was 1,000. The population is primarily white (90.2%), with the remaining population being made up of Native American (4.2%), Hispanic (2.7%), and other (2.9%). The median household income in the community is $41,250, and the median age is 44. The community is home to a variety of religious denominations, including Catholic, Protestant, and Mormon.
Common Questions
What is Per Capita Income in Pinetop Country Club?
Per Capita income in Pinetop Country Club is $51,139.
What is the Median Family Income in Pinetop Country Club?
Median Family Income in Pinetop Country Club is $111,500.
What is the Median Household income in Pinetop Country Club?
Median Household Income in Pinetop Country Club is $86,417.
What is Inequality or Gini Index in Pinetop Country Club?
Inequality or Gini Index in Pinetop Country Club is 0.34.
What is the Total Population of Pinetop Country Club?
Total Population of Pinetop Country Club is 1,769.
What is the Total Male Population of Pinetop Country Club?
Total Male Population of Pinetop Country Club is 893.
What is the Total Female Population of Pinetop Country Club?
Total Female Population of Pinetop Country Club is 876.
What is the Ratio of Males per 100 Females in Pinetop Country Club?
There are 101.94 Males per 100 Females in Pinetop Country Club.
What is the Ratio of Females per 100 Males in Pinetop Country Club?
There are 98.10 Females per 100 Males in Pinetop Country Club.
What is the Median Population Age in Pinetop Country Club?
Median Population Age in Pinetop Country Club is 66.8 Years.
What is the Average Family Size in Pinetop Country Club
Average Family Size in Pinetop Country Club is 2.2 People.
What is the Average Household Size in Pinetop Country Club
Average Household Size in Pinetop Country Club is 1.9 People.
How Large is the Labor Force in Pinetop Country Club?
There are 411 People in the Labor Forcein in Pinetop Country Club.
What is the Percentage of People in the Labor Force in Pinetop Country Club?
24.5% of People are in the Labor Force in Pinetop Country Club.
What is the Unemployment Rate in Pinetop Country Club?
Unemployment Rate in Pinetop Country Club is 8.3%.