Thomaston, ME Map & Demographics
Thomaston Map
Thomaston Overview
$27,673
PER CAPITA INCOME
$60,394
AVG FAMILY INCOME
$54,155
AVG HOUSEHOLD INCOME
11.6%
WAGE / INCOME GAP [ % ]
88.4¢/ $1
WAGE / INCOME GAP [ $ ]
0.34
INEQUALITY / GINI INDEX
2,101
TOTAL POPULATION
1,124
MALE POPULATION
977
FEMALE POPULATION
115.05
MALES / 100 FEMALES
86.92
FEMALES / 100 MALES
52.6
MEDIAN AGE
2.5
AVG FAMILY SIZE
2.2
AVG HOUSEHOLD SIZE
1,097
LABOR FORCE [ PEOPLE ]
60.2%
PERCENT IN LABOR FORCE
2.3%
UNEMPLOYMENT RATE
Thomaston Zip Codes
Thomaston Area Codes
Income in Thomaston
Income Overview in Thomaston
Per Capita Income in Thomaston is $27,673, while median incomes of families and households are $60,394 and $54,155 respectively.
| Characteristic | Number | Measure |
| Per Capita Income | 2,101 | $27,673 |
| Median Family Income | 595 | $60,394 |
| Mean Family Income | 595 | $66,470 |
| Median Household Income | 949 | $54,155 |
| Mean Household Income | 949 | $62,178 |
| Income Deficit | 595 | $0 |
| Wage / Income Gap (%) | 2,101 | 11.59% |
| Wage / Income Gap ($) | 2,101 | 88.41¢ per $1 |
| Gini / Inequality Index | 2,101 | 0.34 |
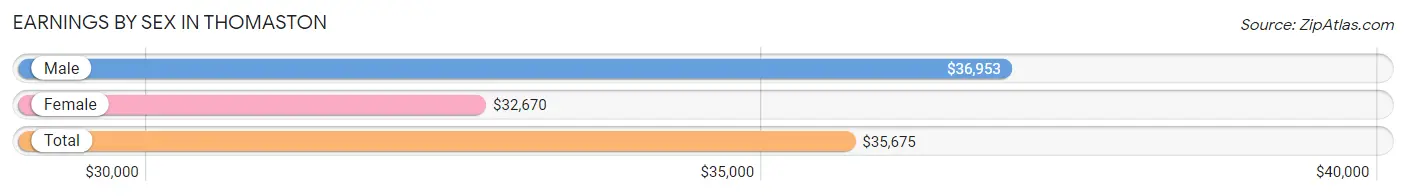
Earnings by Sex in Thomaston
Average Earnings in Thomaston are $35,675, $36,953 for men and $32,670 for women, a difference of 11.6%.
| Sex | Number | Average Earnings |
| Male | 637 (56.9%) | $36,953 |
| Female | 483 (43.1%) | $32,670 |
| Total | 1,120 (100.0%) | $35,675 |
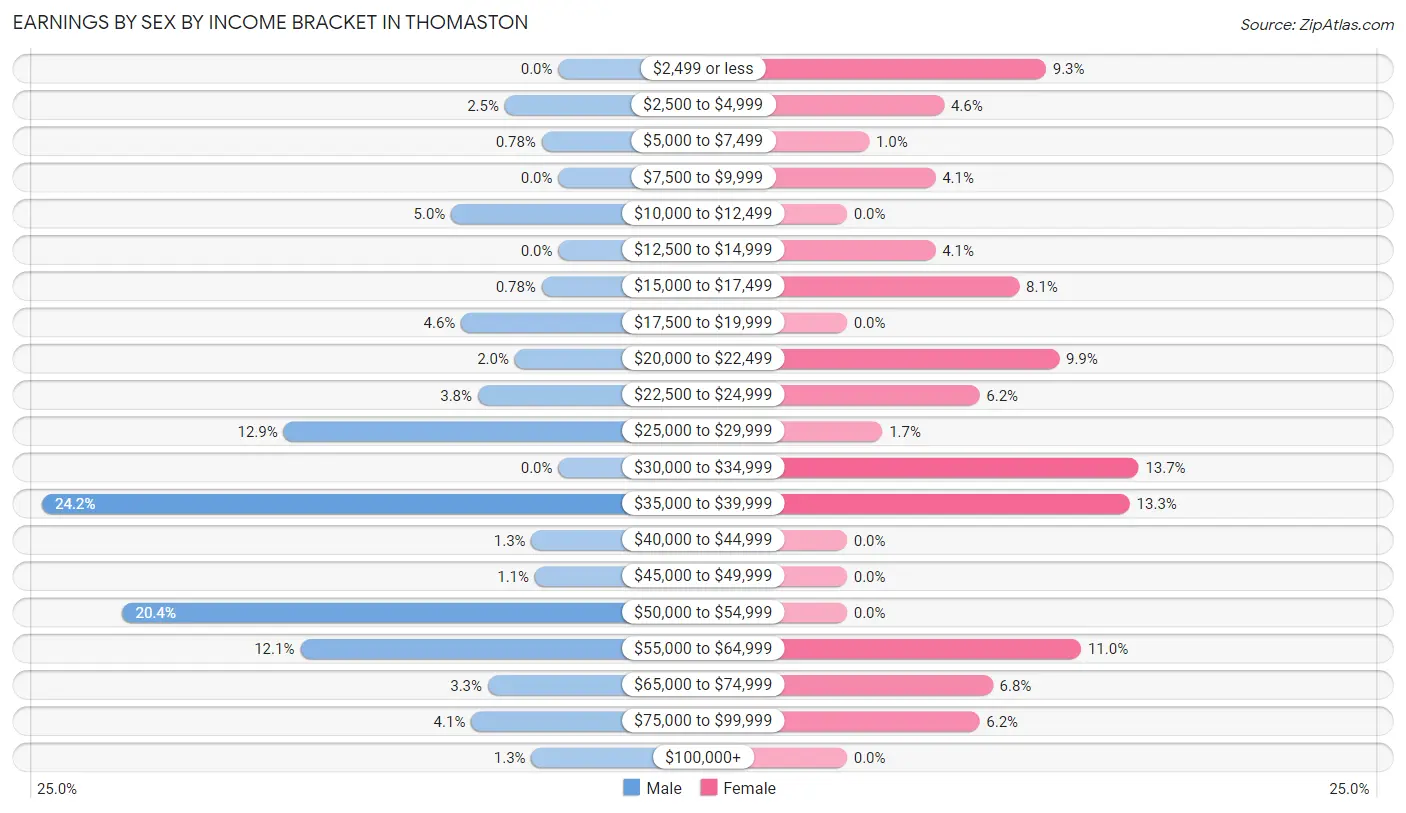
Earnings by Sex by Income Bracket in Thomaston
The most common earnings brackets in Thomaston are $35,000 to $39,999 for men (154 | 24.2%) and $30,000 to $34,999 for women (66 | 13.7%).
| Income | Male | Female |
| $2,499 or less | 0 (0.0%) | 45 (9.3%) |
| $2,500 to $4,999 | 16 (2.5%) | 22 (4.5%) |
| $5,000 to $7,499 | 5 (0.8%) | 5 (1.0%) |
| $7,500 to $9,999 | 0 (0.0%) | 20 (4.1%) |
| $10,000 to $12,499 | 32 (5.0%) | 0 (0.0%) |
| $12,500 to $14,999 | 0 (0.0%) | 20 (4.1%) |
| $15,000 to $17,499 | 5 (0.8%) | 39 (8.1%) |
| $17,500 to $19,999 | 29 (4.5%) | 0 (0.0%) |
| $20,000 to $22,499 | 13 (2.0%) | 48 (9.9%) |
| $22,500 to $24,999 | 24 (3.8%) | 30 (6.2%) |
| $25,000 to $29,999 | 82 (12.9%) | 8 (1.7%) |
| $30,000 to $34,999 | 0 (0.0%) | 66 (13.7%) |
| $35,000 to $39,999 | 154 (24.2%) | 64 (13.3%) |
| $40,000 to $44,999 | 8 (1.3%) | 0 (0.0%) |
| $45,000 to $49,999 | 7 (1.1%) | 0 (0.0%) |
| $50,000 to $54,999 | 130 (20.4%) | 0 (0.0%) |
| $55,000 to $64,999 | 77 (12.1%) | 53 (11.0%) |
| $65,000 to $74,999 | 21 (3.3%) | 33 (6.8%) |
| $75,000 to $99,999 | 26 (4.1%) | 30 (6.2%) |
| $100,000+ | 8 (1.3%) | 0 (0.0%) |
| Total | 637 (100.0%) | 483 (100.0%) |
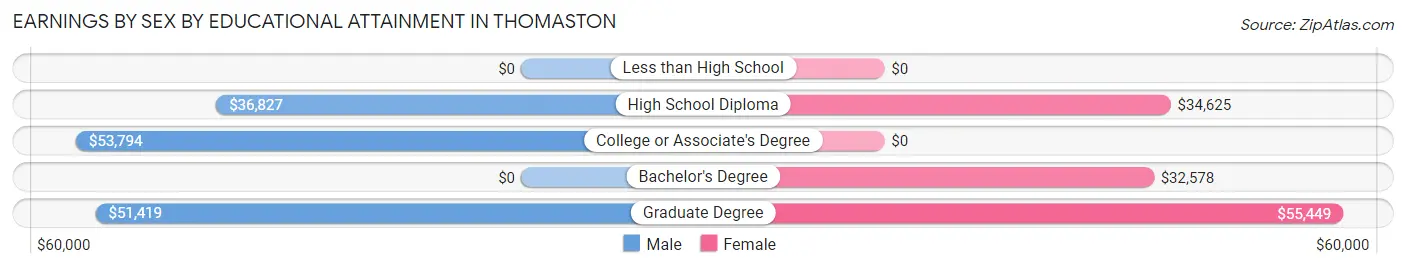
Earnings by Sex by Educational Attainment in Thomaston
Average earnings in Thomaston are $51,056 for men and $33,409 for women, a difference of 34.6%. Men with an educational attainment of college or associate's degree enjoy the highest average annual earnings of $53,794, while those with high school diploma education earn the least with $36,827. Women with an educational attainment of graduate degree earn the most with the average annual earnings of $55,449, while those with bachelor's degree education have the smallest earnings of $32,578.
| Educational Attainment | Male Income | Female Income |
| Less than High School | - | - |
| High School Diploma | $36,827 | $34,625 |
| College or Associate's Degree | $53,794 | $0 |
| Bachelor's Degree | - | - |
| Graduate Degree | $51,419 | $55,449 |
| Total | $51,056 | $33,409 |
Family Income in Thomaston
Family Income Brackets in Thomaston
According to the Thomaston family income data, there are 175 families falling into the $75,000 to $99,999 income range, which is the most common income bracket and makes up 29.4% of all families.
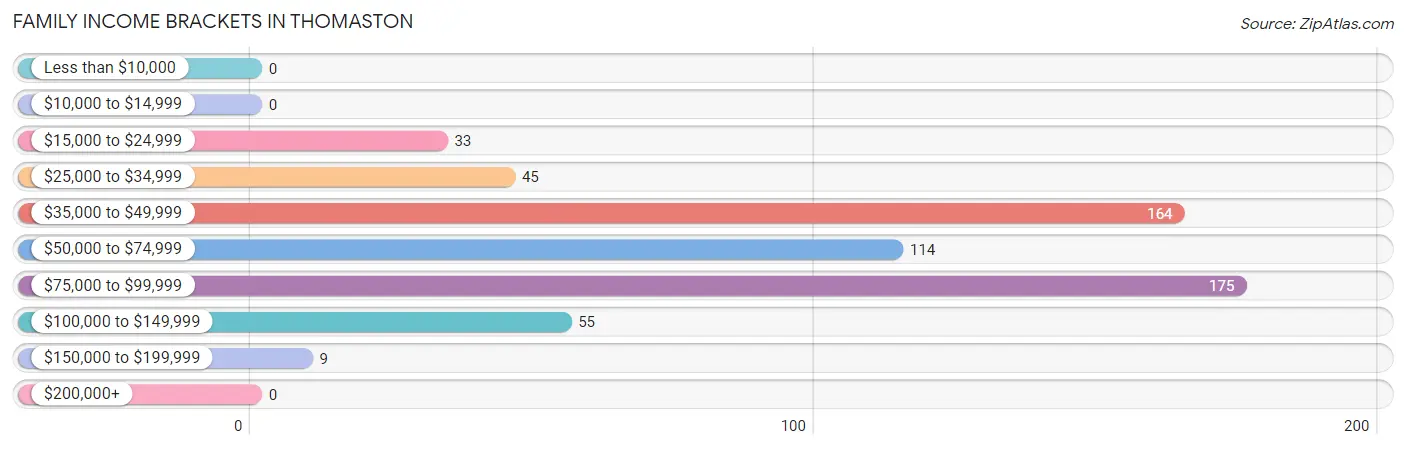
| Income Bracket | # Families | % Families |
| Less than $10,000 | 0 | 0.0% |
| $10,000 to $14,999 | 0 | 0.0% |
| $15,000 to $24,999 | 33 | 5.5% |
| $25,000 to $34,999 | 45 | 7.6% |
| $35,000 to $49,999 | 164 | 27.6% |
| $50,000 to $74,999 | 114 | 19.2% |
| $75,000 to $99,999 | 175 | 29.4% |
| $100,000 to $149,999 | 55 | 9.2% |
| $150,000 to $199,999 | 9 | 1.5% |
| $200,000+ | 0 | 0.0% |
Family Income by Famaliy Size in Thomaston
4-person families (58 | 9.8%) account for the highest median family income in Thomaston with $76,818 per family, while 2-person families (409 | 68.7%) have the highest median income of $23,688 per family member.
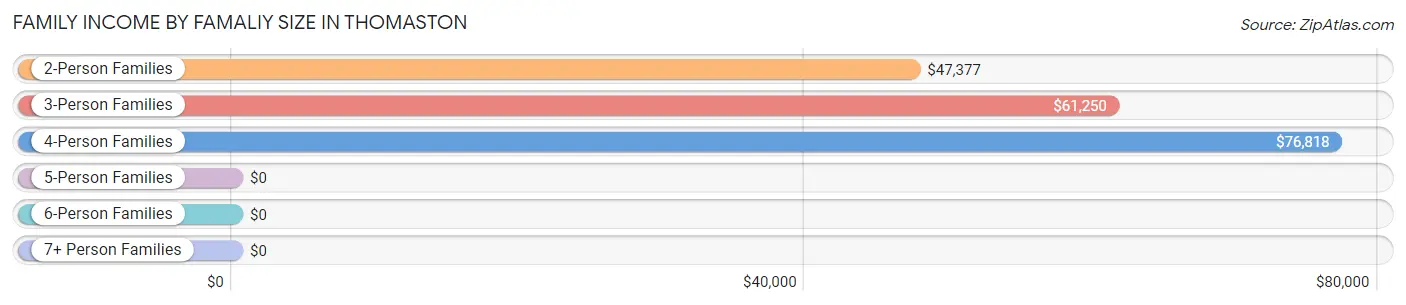
| Income Bracket | # Families | Median Income |
| 2-Person Families | 409 (68.7%) | $47,377 |
| 3-Person Families | 113 (19.0%) | $61,250 |
| 4-Person Families | 58 (9.8%) | $76,818 |
| 5-Person Families | 1 (0.2%) | $0 |
| 6-Person Families | 14 (2.4%) | $0 |
| 7+ Person Families | 0 (0.0%) | $0 |
| Total | 595 (100.0%) | $60,394 |
Family Income by Number of Earners in Thomaston
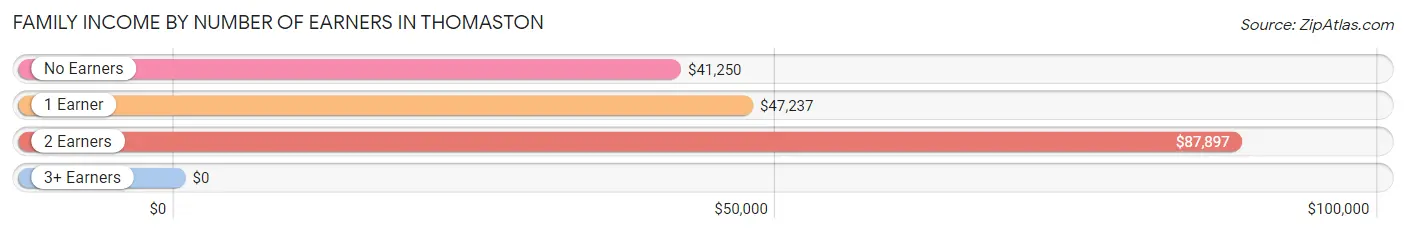
| Number of Earners | # Families | Median Income |
| No Earners | 154 (25.9%) | $41,250 |
| 1 Earner | 192 (32.3%) | $47,237 |
| 2 Earners | 235 (39.5%) | $87,897 |
| 3+ Earners | 14 (2.4%) | $0 |
| Total | 595 (100.0%) | $60,394 |
Household Income in Thomaston
Household Income Brackets in Thomaston
With 220 households falling in the category, the $75,000 to $99,999 income range is the most frequent in Thomaston, accounting for 23.2% of all households.
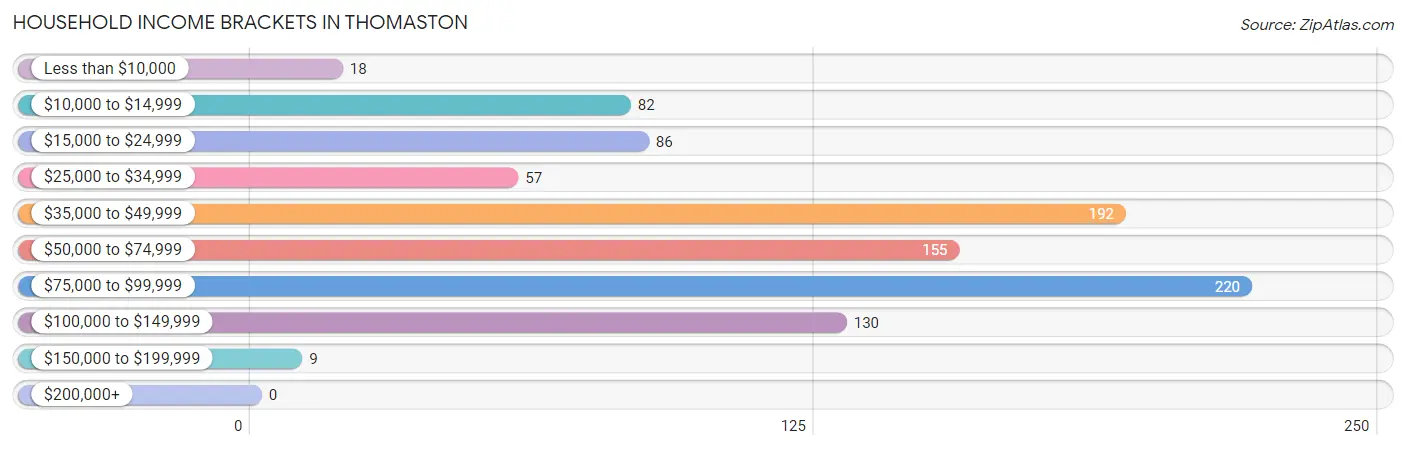
| Income Bracket | # Households | % Households |
| Less than $10,000 | 18 | 1.9% |
| $10,000 to $14,999 | 82 | 8.6% |
| $15,000 to $24,999 | 86 | 9.1% |
| $25,000 to $34,999 | 57 | 6.0% |
| $35,000 to $49,999 | 192 | 20.2% |
| $50,000 to $74,999 | 155 | 16.3% |
| $75,000 to $99,999 | 220 | 23.2% |
| $100,000 to $149,999 | 130 | 13.7% |
| $150,000 to $199,999 | 9 | 0.9% |
| $200,000+ | 0 | 0.0% |
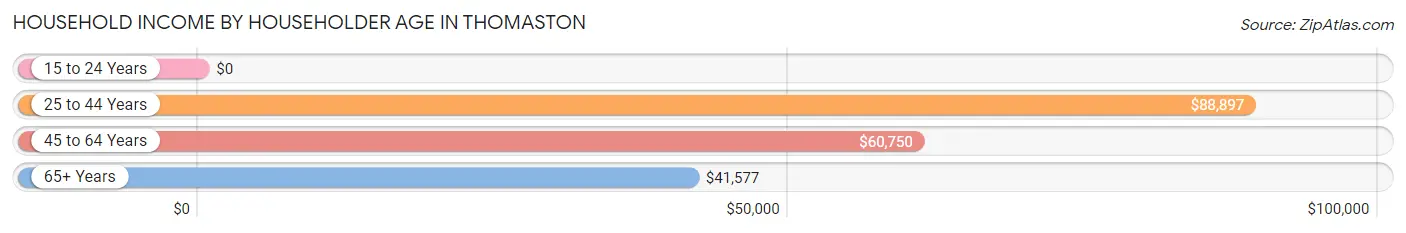
Household Income by Householder Age in Thomaston
The median household income in Thomaston is $54,155, with the highest median household income of $88,897 found in the 25 to 44 years age bracket for the primary householder. A total of 203 households (21.4%) fall into this category.
| Income Bracket | # Households | Median Income |
| 15 to 24 Years | 0 (0.0%) | $0 |
| 25 to 44 Years | 203 (21.4%) | $88,897 |
| 45 to 64 Years | 283 (29.8%) | $60,750 |
| 65+ Years | 463 (48.8%) | $41,577 |
| Total | 949 (100.0%) | $54,155 |
Poverty in Thomaston
Income Below Poverty by Sex and Age in Thomaston
With 0.8% poverty level for males and 21.3% for females among the residents of Thomaston, 55 to 64 year old males and 18 to 24 year old females are the most vulnerable to poverty, with 4 males (3.7%) and 39 females (100.0%) in their respective age groups living below the poverty level.
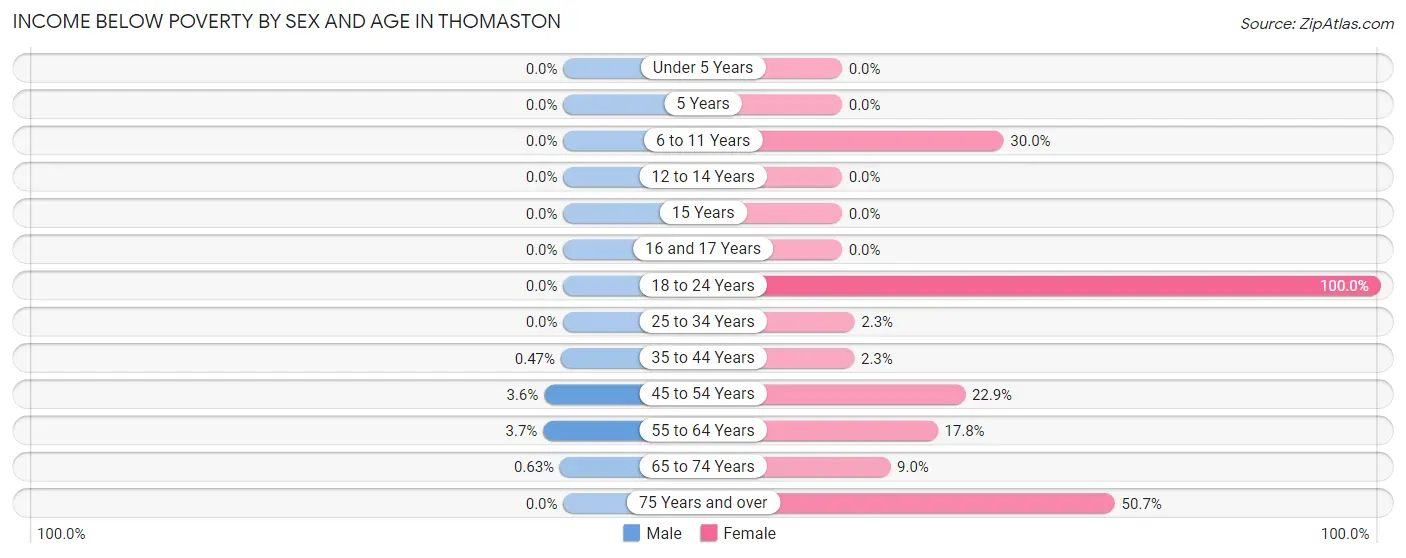
| Age Bracket | Male | Female |
| Under 5 Years | 0 (0.0%) | 0 (0.0%) |
| 5 Years | 0 (0.0%) | 0 (0.0%) |
| 6 to 11 Years | 0 (0.0%) | 3 (30.0%) |
| 12 to 14 Years | 0 (0.0%) | 0 (0.0%) |
| 15 Years | 0 (0.0%) | 0 (0.0%) |
| 16 and 17 Years | 0 (0.0%) | 0 (0.0%) |
| 18 to 24 Years | 0 (0.0%) | 39 (100.0%) |
| 25 to 34 Years | 0 (0.0%) | 2 (2.3%) |
| 35 to 44 Years | 1 (0.5%) | 1 (2.3%) |
| 45 to 54 Years | 3 (3.6%) | 16 (22.9%) |
| 55 to 64 Years | 4 (3.7%) | 41 (17.7%) |
| 65 to 74 Years | 1 (0.6%) | 28 (9.0%) |
| 75 Years and over | 0 (0.0%) | 78 (50.6%) |
| Total | 9 (0.8%) | 208 (21.3%) |
Income Above Poverty by Sex and Age in Thomaston
According to the poverty statistics in Thomaston, males aged under 5 years and females aged under 5 years are the age groups that are most secure financially, with 100.0% of males and 100.0% of females in these age groups living above the poverty line.
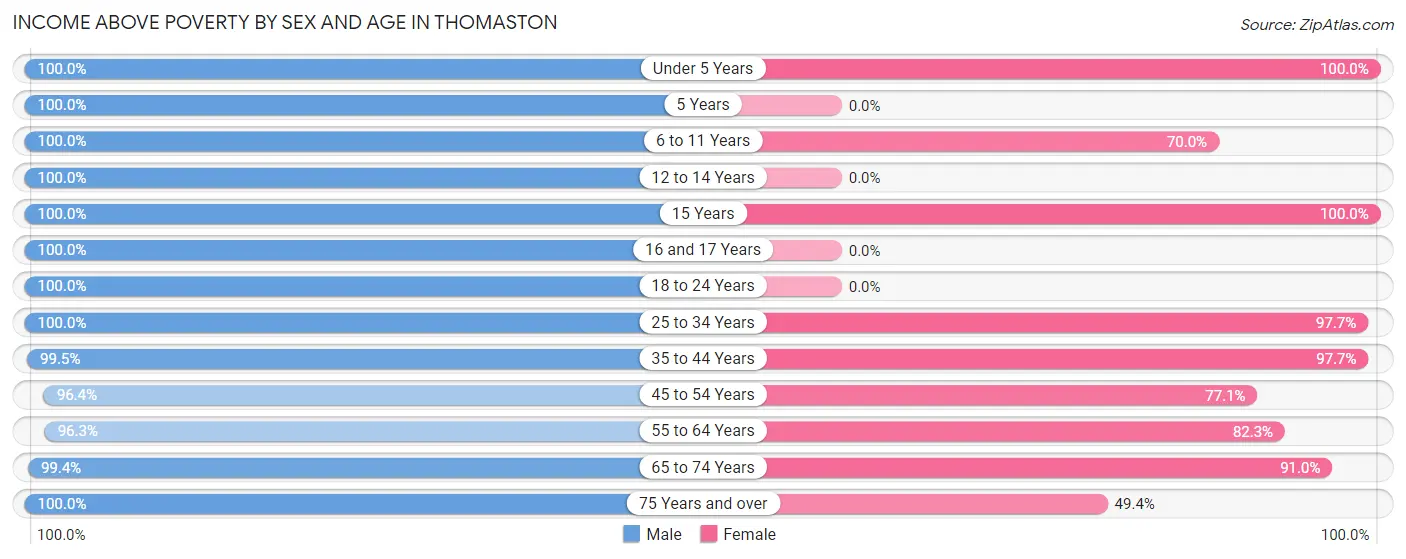
| Age Bracket | Male | Female |
| Under 5 Years | 41 (100.0%) | 20 (100.0%) |
| 5 Years | 16 (100.0%) | 0 (0.0%) |
| 6 to 11 Years | 87 (100.0%) | 7 (70.0%) |
| 12 to 14 Years | 88 (100.0%) | 0 (0.0%) |
| 15 Years | 6 (100.0%) | 11 (100.0%) |
| 16 and 17 Years | 111 (100.0%) | 0 (0.0%) |
| 18 to 24 Years | 121 (100.0%) | 0 (0.0%) |
| 25 to 34 Years | 62 (100.0%) | 84 (97.7%) |
| 35 to 44 Years | 211 (99.5%) | 43 (97.7%) |
| 45 to 54 Years | 81 (96.4%) | 54 (77.1%) |
| 55 to 64 Years | 103 (96.3%) | 190 (82.3%) |
| 65 to 74 Years | 157 (99.4%) | 284 (91.0%) |
| 75 Years and over | 31 (100.0%) | 76 (49.3%) |
| Total | 1,115 (99.2%) | 769 (78.7%) |
Income Below Poverty Among Married-Couple Families in Thomaston
The poverty statistics for married-couple families in Thomaston show that 0.3% or 1 of the total 392 families live below the poverty line. Families with 3 or 4 children have the highest poverty rate of 100.0%, comprising of 1 families. On the other hand, families with no children have the lowest poverty rate of 0.0%, which includes 0 families.
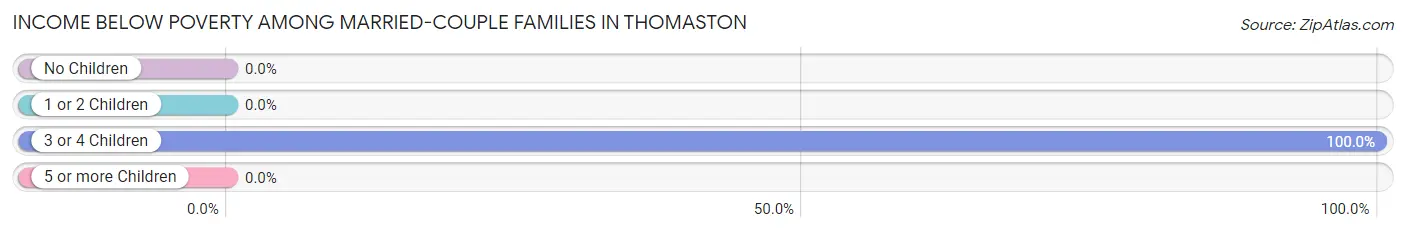
| Children | Above Poverty | Below Poverty |
| No Children | 299 (100.0%) | 0 (0.0%) |
| 1 or 2 Children | 92 (100.0%) | 0 (0.0%) |
| 3 or 4 Children | 0 (0.0%) | 1 (100.0%) |
| 5 or more Children | 0 (0.0%) | 0 (0.0%) |
| Total | 391 (99.7%) | 1 (0.3%) |
Income Below Poverty Among Single-Parent Households in Thomaston
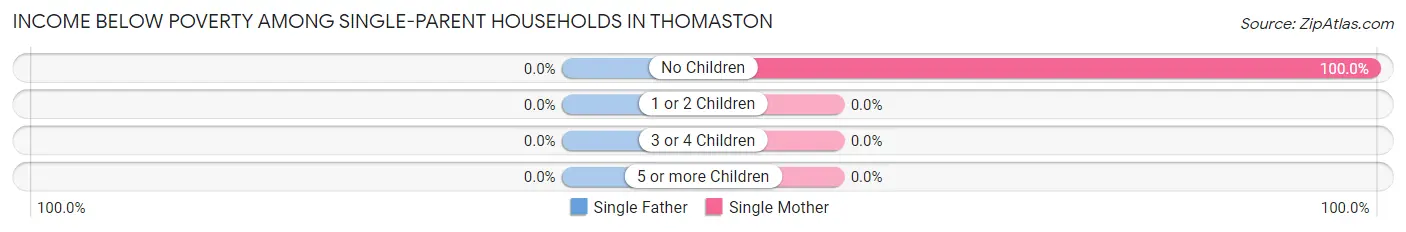
| Children | Single Father | Single Mother |
| No Children | 0 (0.0%) | 17 (100.0%) |
| 1 or 2 Children | 0 (0.0%) | 0 (0.0%) |
| 3 or 4 Children | 0 (0.0%) | 0 (0.0%) |
| 5 or more Children | 0 (0.0%) | 0 (0.0%) |
| Total | 0 (0.0%) | 17 (20.2%) |
Income Below Poverty Among Married-Couple vs Single-Parent Households in Thomaston
The poverty data for Thomaston shows that 1 of the married-couple family households (0.3%) and 17 of the single-parent households (8.4%) are living below the poverty level. Within the married-couple family households, those with 3 or 4 children have the highest poverty rate, with 1 households (100.0%) falling below the poverty line. Among the single-parent households, those with no children have the highest poverty rate, with 17 household (15.7%) living below poverty.
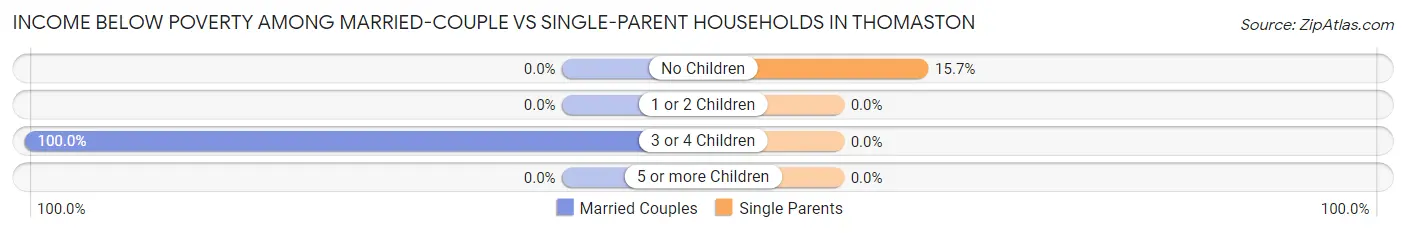
| Children | Married-Couple Families | Single-Parent Households |
| No Children | 0 (0.0%) | 17 (15.7%) |
| 1 or 2 Children | 0 (0.0%) | 0 (0.0%) |
| 3 or 4 Children | 1 (100.0%) | 0 (0.0%) |
| 5 or more Children | 0 (0.0%) | 0 (0.0%) |
| Total | 1 (0.3%) | 17 (8.4%) |
Race in Thomaston
The most populous races in Thomaston are White / Caucasian (1,786 | 85.0%), Hispanic or Latino (234 | 11.1%), and Some other Race (222 | 10.6%).
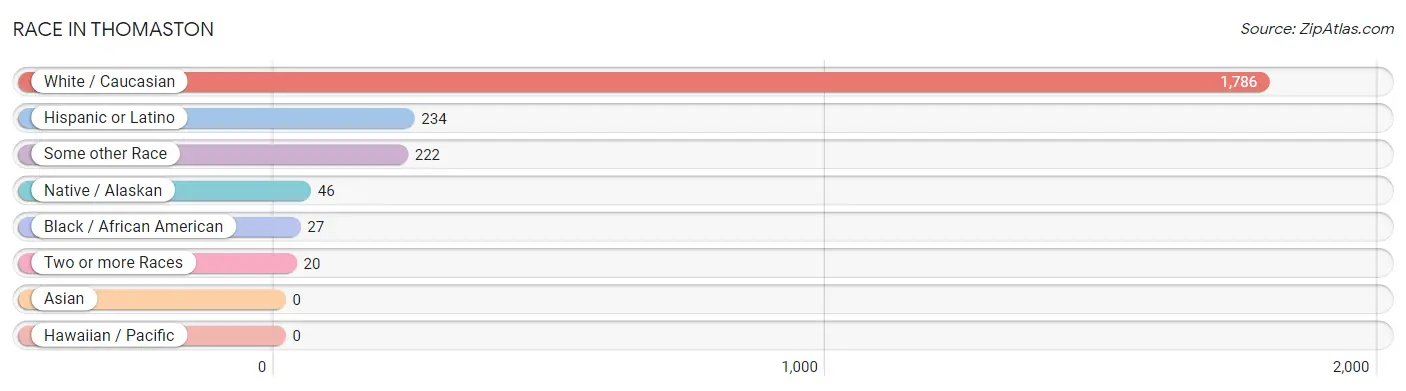
| Race | # Population | % Population |
| Asian | 0 | 0.0% |
| Black / African American | 27 | 1.3% |
| Hawaiian / Pacific | 0 | 0.0% |
| Hispanic or Latino | 234 | 11.1% |
| Native / Alaskan | 46 | 2.2% |
| White / Caucasian | 1,786 | 85.0% |
| Two or more Races | 20 | 0.9% |
| Some other Race | 222 | 10.6% |
| Total | 2,101 | 100.0% |
Ancestry in Thomaston
The most populous ancestries reported in Thomaston are Irish (268 | 12.8%), English (241 | 11.5%), South American (199 | 9.5%), Peruvian (187 | 8.9%), and French (167 | 8.0%), together accounting for 50.5% of all Thomaston residents.
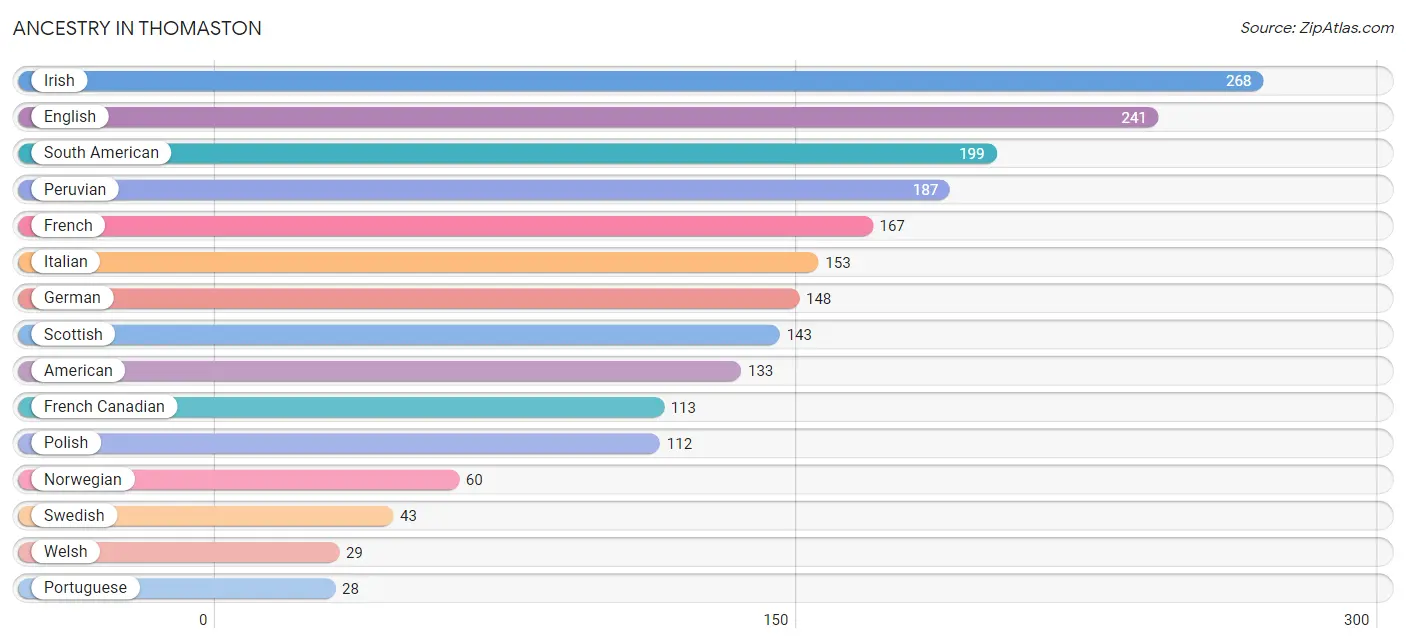
| Ancestry | # Population | % Population |
| American | 133 | 6.3% |
| Colombian | 12 | 0.6% |
| Danish | 9 | 0.4% |
| English | 241 | 11.5% |
| Finnish | 2 | 0.1% |
| French | 167 | 8.0% |
| French Canadian | 113 | 5.4% |
| German | 148 | 7.0% |
| Irish | 268 | 12.8% |
| Italian | 153 | 7.3% |
| Norwegian | 60 | 2.9% |
| Peruvian | 187 | 8.9% |
| Polish | 112 | 5.3% |
| Portuguese | 28 | 1.3% |
| Scotch-Irish | 14 | 0.7% |
| Scottish | 143 | 6.8% |
| South American | 199 | 9.5% |
| Swedish | 43 | 2.1% |
| Welsh | 29 | 1.4% | View All 19 Rows |
Immigrants in Thomaston
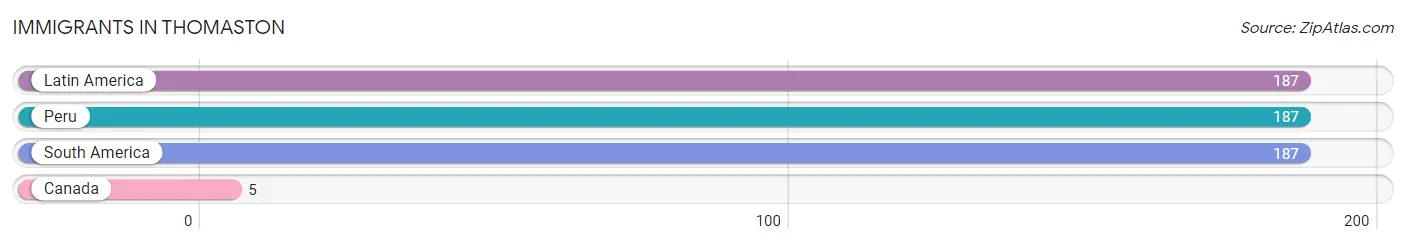
The most numerous immigrant groups reported in Thomaston came from Latin America (187 | 8.9%), Peru (187 | 8.9%), South America (187 | 8.9%), and Canada (5 | 0.2%), together accounting for 26.9% of all Thomaston residents.
| Immigration Origin | # Population | % Population |
| Canada | 5 | 0.2% |
| Latin America | 187 | 8.9% |
| Peru | 187 | 8.9% |
| South America | 187 | 8.9% | View All 4 Rows |
Sex and Age in Thomaston
Sex and Age in Thomaston
The most populous age groups in Thomaston are 15 to 19 Years (133 | 11.8%) for men and 65 to 69 Years (230 | 23.5%) for women.
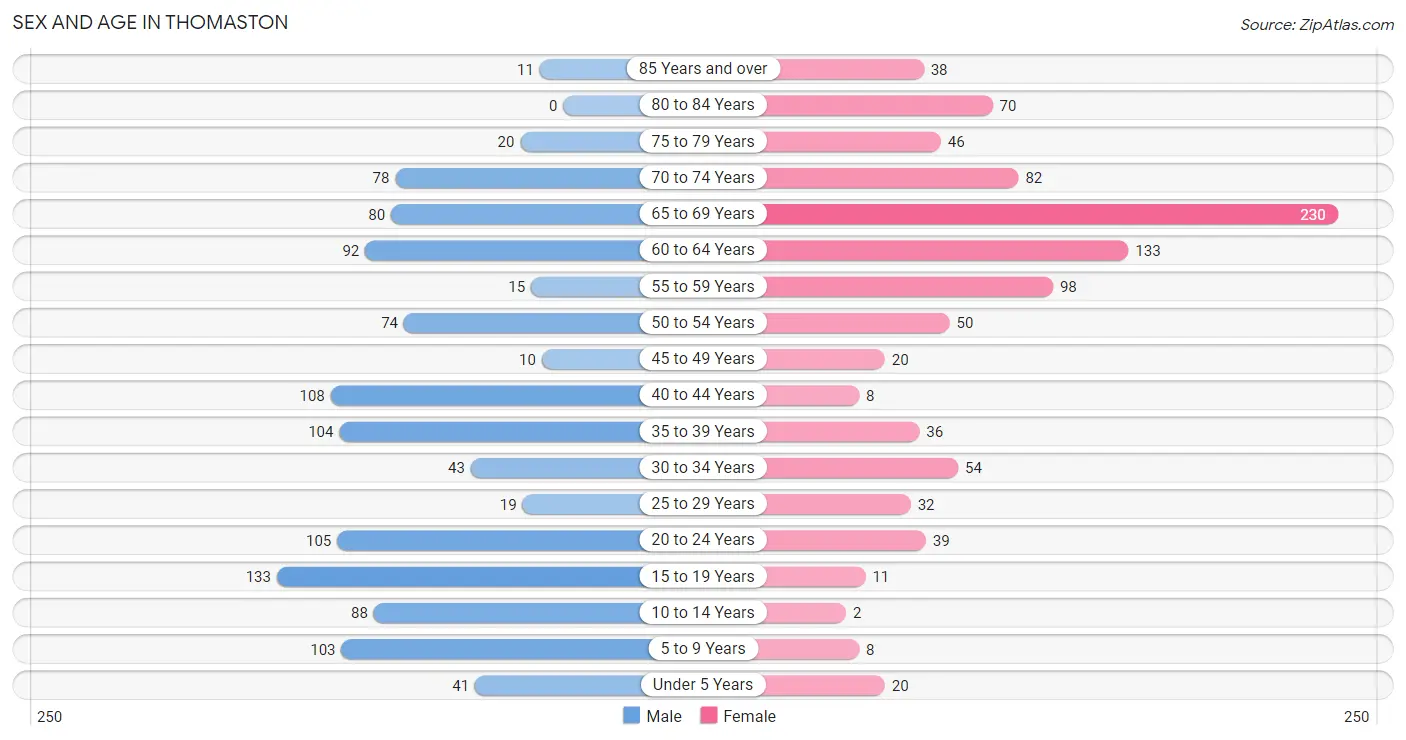
| Age Bracket | Male | Female |
| Under 5 Years | 41 (3.6%) | 20 (2.1%) |
| 5 to 9 Years | 103 (9.2%) | 8 (0.8%) |
| 10 to 14 Years | 88 (7.8%) | 2 (0.2%) |
| 15 to 19 Years | 133 (11.8%) | 11 (1.1%) |
| 20 to 24 Years | 105 (9.3%) | 39 (4.0%) |
| 25 to 29 Years | 19 (1.7%) | 32 (3.3%) |
| 30 to 34 Years | 43 (3.8%) | 54 (5.5%) |
| 35 to 39 Years | 104 (9.2%) | 36 (3.7%) |
| 40 to 44 Years | 108 (9.6%) | 8 (0.8%) |
| 45 to 49 Years | 10 (0.9%) | 20 (2.1%) |
| 50 to 54 Years | 74 (6.6%) | 50 (5.1%) |
| 55 to 59 Years | 15 (1.3%) | 98 (10.0%) |
| 60 to 64 Years | 92 (8.2%) | 133 (13.6%) |
| 65 to 69 Years | 80 (7.1%) | 230 (23.5%) |
| 70 to 74 Years | 78 (6.9%) | 82 (8.4%) |
| 75 to 79 Years | 20 (1.8%) | 46 (4.7%) |
| 80 to 84 Years | 0 (0.0%) | 70 (7.2%) |
| 85 Years and over | 11 (1.0%) | 38 (3.9%) |
| Total | 1,124 (100.0%) | 977 (100.0%) |
Families and Households in Thomaston
Median Family Size in Thomaston
The median family size in Thomaston is 2.52 persons per family, with single female/mother families (84 | 14.1%) accounting for the largest median family size of 2.95 persons per family. On the other hand, married-couple families (392 | 65.9%) represent the smallest median family size with 2.39 persons per family.
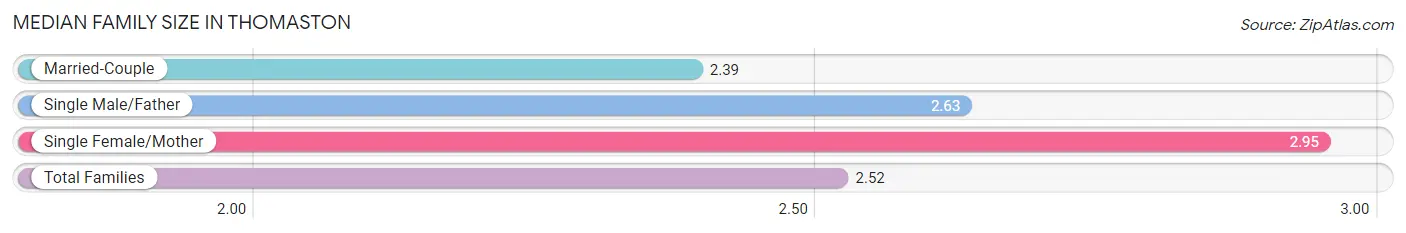
| Family Type | # Families | Family Size |
| Married-Couple | 392 (65.9%) | 2.39 |
| Single Male/Father | 119 (20.0%) | 2.63 |
| Single Female/Mother | 84 (14.1%) | 2.95 |
| Total Families | 595 (100.0%) | 2.52 |
Median Household Size in Thomaston
The median household size in Thomaston is 2.19 persons per household, with single female/mother households (84 | 8.8%) accounting for the largest median household size of 2.95 persons per household. non-family households (354 | 37.3%) represent the smallest median household size with 1.49 persons per household.
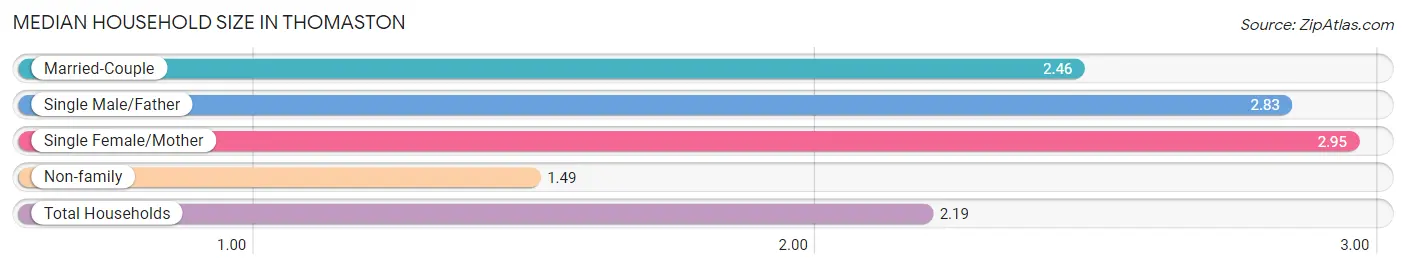
| Household Type | # Households | Household Size |
| Married-Couple | 392 (41.3%) | 2.46 |
| Single Male/Father | 119 (12.5%) | 2.83 |
| Single Female/Mother | 84 (8.8%) | 2.95 |
| Non-family | 354 (37.3%) | 1.49 |
| Total Households | 949 (100.0%) | 2.19 |
Household Size by Marriage Status in Thomaston
Out of a total of 949 households in Thomaston, 595 (62.7%) are family households, while 354 (37.3%) are nonfamily households. The most numerous type of family households are 2-person households, comprising 403, and the most common type of nonfamily households are 1-person households, comprising 262.
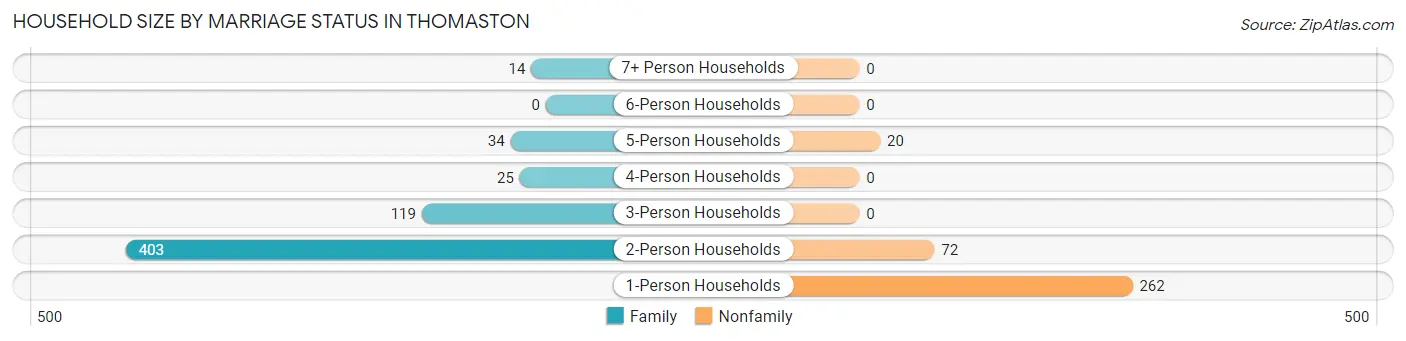
| Household Size | Family Households | Nonfamily Households |
| 1-Person Households | - | 262 (27.6%) |
| 2-Person Households | 403 (42.5%) | 72 (7.6%) |
| 3-Person Households | 119 (12.5%) | 0 (0.0%) |
| 4-Person Households | 25 (2.6%) | 0 (0.0%) |
| 5-Person Households | 34 (3.6%) | 20 (2.1%) |
| 6-Person Households | 0 (0.0%) | 0 (0.0%) |
| 7+ Person Households | 14 (1.5%) | 0 (0.0%) |
| Total | 595 (62.7%) | 354 (37.3%) |
Female Fertility in Thomaston
Fertility by Age in Thomaston
Average fertility rate in Thomaston is 70.0 births per 1,000 women. Women in the age bracket of 20 to 34 years have the highest fertility rate with 112.0 births per 1,000 women. Women in the age bracket of 20 to 34 years acount for 100.0% of all women with births.
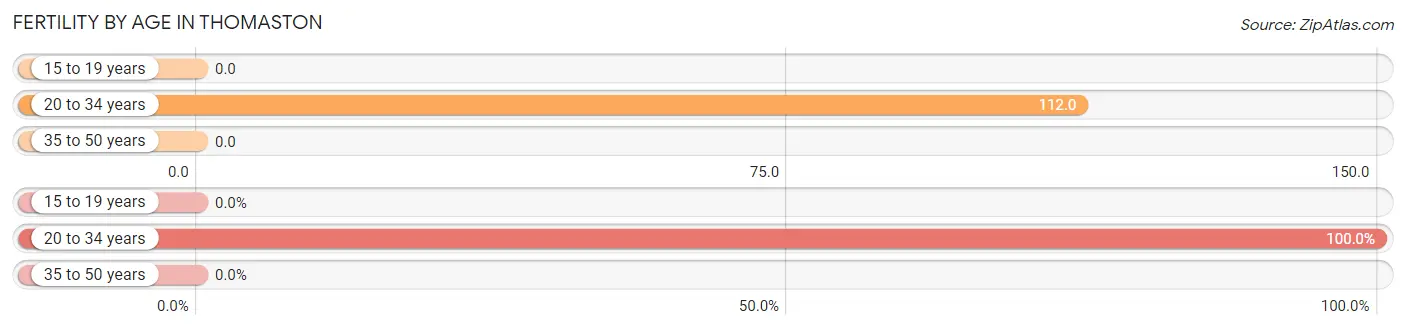
| Age Bracket | Women with Births | Births / 1,000 Women |
| 15 to 19 years | 0 (0.0%) | 0.0 |
| 20 to 34 years | 14 (100.0%) | 112.0 |
| 35 to 50 years | 0 (0.0%) | 0.0 |
| Total | 14 (100.0%) | 70.0 |
Fertility by Age by Marriage Status in Thomaston
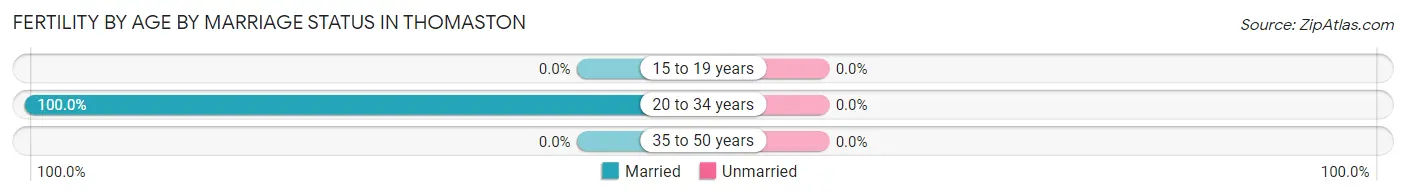
| Age Bracket | Married | Unmarried |
| 15 to 19 years | 0 (0.0%) | 0 (0.0%) |
| 20 to 34 years | 14 (100.0%) | 0 (0.0%) |
| 35 to 50 years | 0 (0.0%) | 0 (0.0%) |
| Total | 14 (100.0%) | 0 (0.0%) |
Fertility by Education in Thomaston
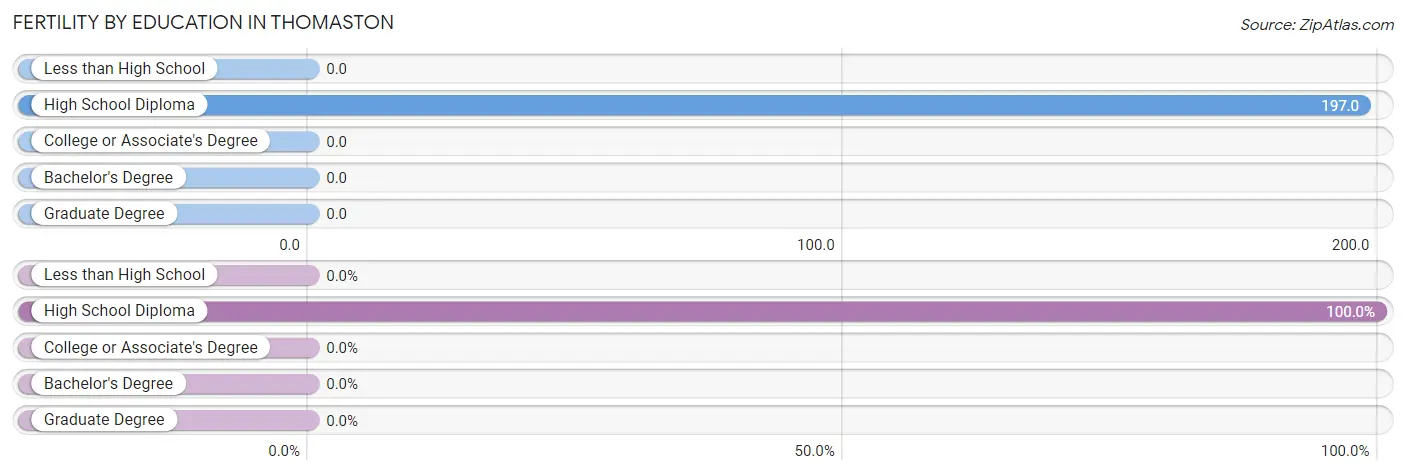
| Educational Attainment | Women with Births | Births / 1,000 Women |
| Less than High School | 0 (0.0%) | 0.0 |
| High School Diploma | 14 (100.0%) | 197.0 |
| College or Associate's Degree | 0 (0.0%) | 0.0 |
| Bachelor's Degree | 0 (0.0%) | 0.0 |
| Graduate Degree | 0 (0.0%) | 0.0 |
| Total | 14 (100.0%) | 70.0 |
Fertility by Education by Marriage Status in Thomaston
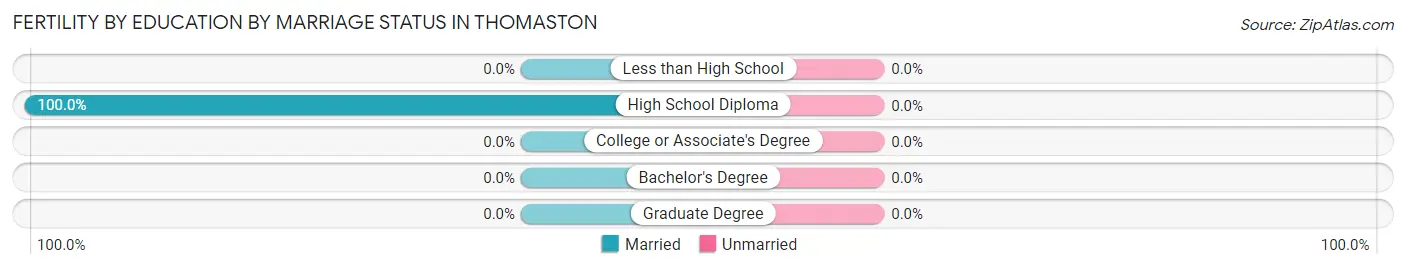
| Educational Attainment | Married | Unmarried |
| Less than High School | 0 (0.0%) | 0 (0.0%) |
| High School Diploma | 14 (100.0%) | 0 (0.0%) |
| College or Associate's Degree | 0 (0.0%) | 0 (0.0%) |
| Bachelor's Degree | 0 (0.0%) | 0 (0.0%) |
| Graduate Degree | 0 (0.0%) | 0 (0.0%) |
| Total | 14 (100.0%) | 0 (0.0%) |
Employment Characteristics in Thomaston
Employment by Class of Employer in Thomaston
Among the 1,018 employed individuals in Thomaston, private company employees (620 | 60.9%), self-employed (not incorporated) (245 | 24.1%), and not-for-profit organizations (60 | 5.9%) make up the most common classes of employment.
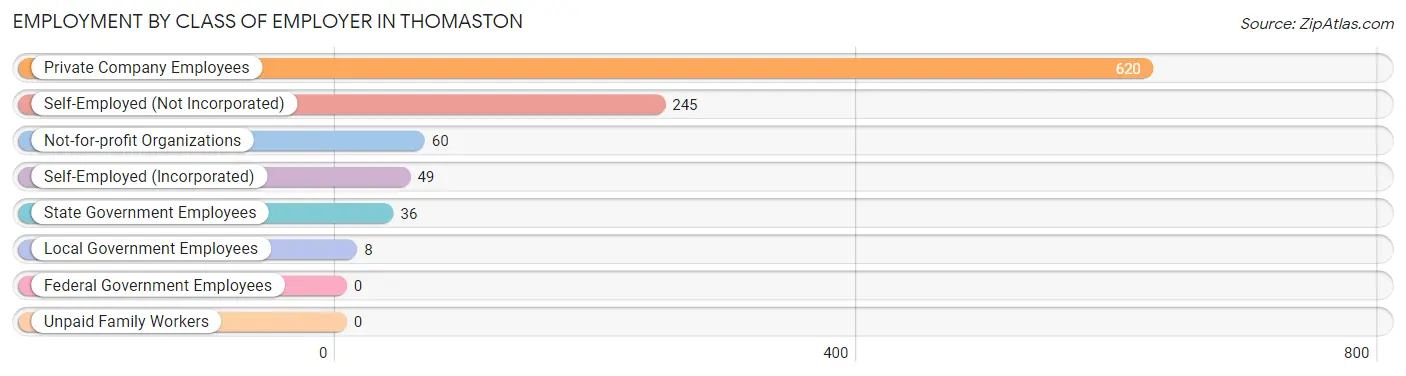
| Employer Class | # Employees | % Employees |
| Private Company Employees | 620 | 60.9% |
| Self-Employed (Incorporated) | 49 | 4.8% |
| Self-Employed (Not Incorporated) | 245 | 24.1% |
| Not-for-profit Organizations | 60 | 5.9% |
| Local Government Employees | 8 | 0.8% |
| State Government Employees | 36 | 3.5% |
| Federal Government Employees | 0 | 0.0% |
| Unpaid Family Workers | 0 | 0.0% |
| Total | 1,018 | 100.0% |
Employment Status by Age in Thomaston
According to the labor force statistics for Thomaston, out of the total population over 16 years of age (1,822), 60.2% or 1,097 individuals are in the labor force, with 2.3% or 25 of them unemployed. The age group with the highest labor force participation rate is 20 to 24 years, with 100.0% or 144 individuals in the labor force. Within the labor force, the 75 years and over age range has the highest percentage of unemployed individuals, with 38.5% or 5 of them being unemployed.
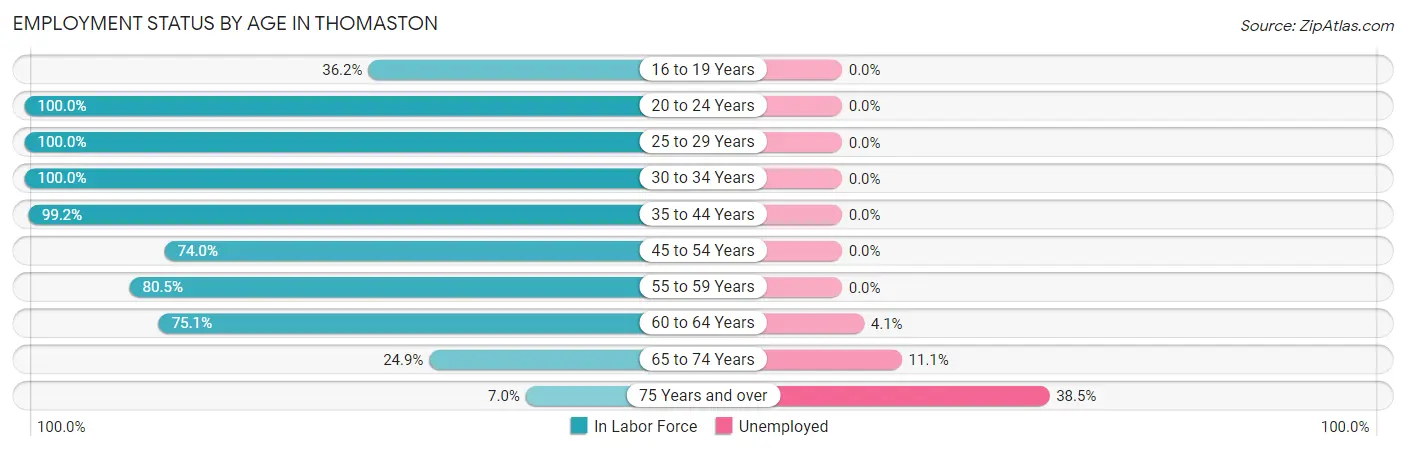
| Age Bracket | In Labor Force | Unemployed |
| 16 to 19 Years | 46 (36.2%) | 0 (0.0%) |
| 20 to 24 Years | 144 (100.0%) | 0 (0.0%) |
| 25 to 29 Years | 51 (100.0%) | 0 (0.0%) |
| 30 to 34 Years | 97 (100.0%) | 0 (0.0%) |
| 35 to 44 Years | 254 (99.2%) | 0 (0.0%) |
| 45 to 54 Years | 114 (74.0%) | 0 (0.0%) |
| 55 to 59 Years | 91 (80.5%) | 0 (0.0%) |
| 60 to 64 Years | 169 (75.1%) | 7 (4.1%) |
| 65 to 74 Years | 117 (24.9%) | 13 (11.1%) |
| 75 Years and over | 13 (7.0%) | 5 (38.5%) |
| Total | 1,097 (60.2%) | 25 (2.3%) |
Employment Status by Educational Attainment in Thomaston
According to labor force statistics for Thomaston, 86.6% of individuals (776) out of the total population between 25 and 64 years of age (896) are in the labor force, with 0.9% or 7 of them being unemployed. The group with the highest labor force participation rate are those with the educational attainment of bachelor's degree or higher, with 98.1% or 153 individuals in the labor force. Within the labor force, individuals with bachelor's degree or higher education have the highest percentage of unemployment, with 4.6% or 7 of them being unemployed.
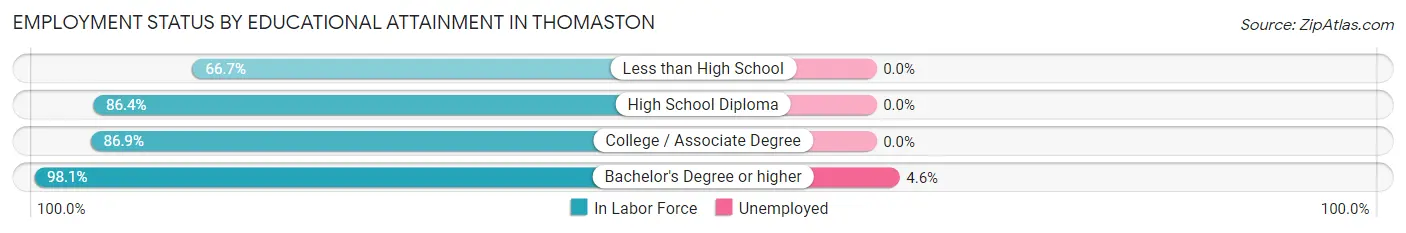
| Educational Attainment | In Labor Force | Unemployed |
| Less than High School | 60 (66.7%) | 0 (0.0%) |
| High School Diploma | 324 (86.4%) | 0 (0.0%) |
| College / Associate Degree | 239 (86.9%) | 0 (0.0%) |
| Bachelor's Degree or higher | 153 (98.1%) | 7 (4.6%) |
| Total | 776 (86.6%) | 8 (0.9%) |
Employment Occupations by Sex in Thomaston
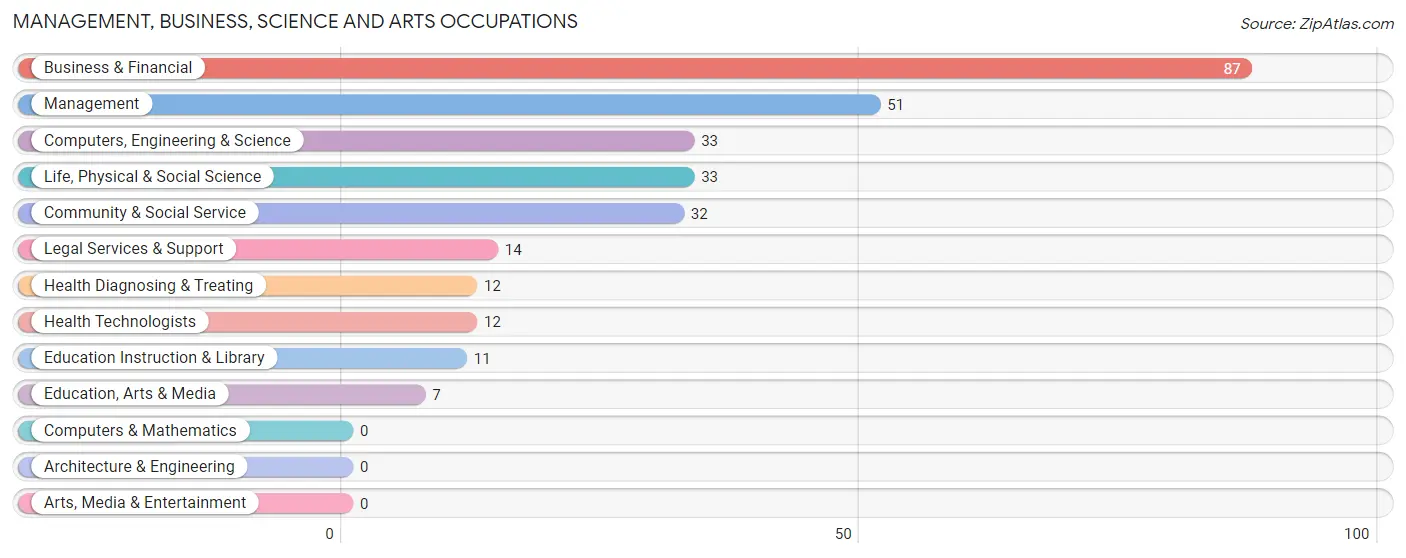
Management, Business, Science and Arts Occupations
The most common Management, Business, Science and Arts occupations in Thomaston are Business & Financial (87 | 8.1%), Management (51 | 4.8%), Computers, Engineering & Science (33 | 3.1%), Life, Physical & Social Science (33 | 3.1%), and Community & Social Service (32 | 3.0%).
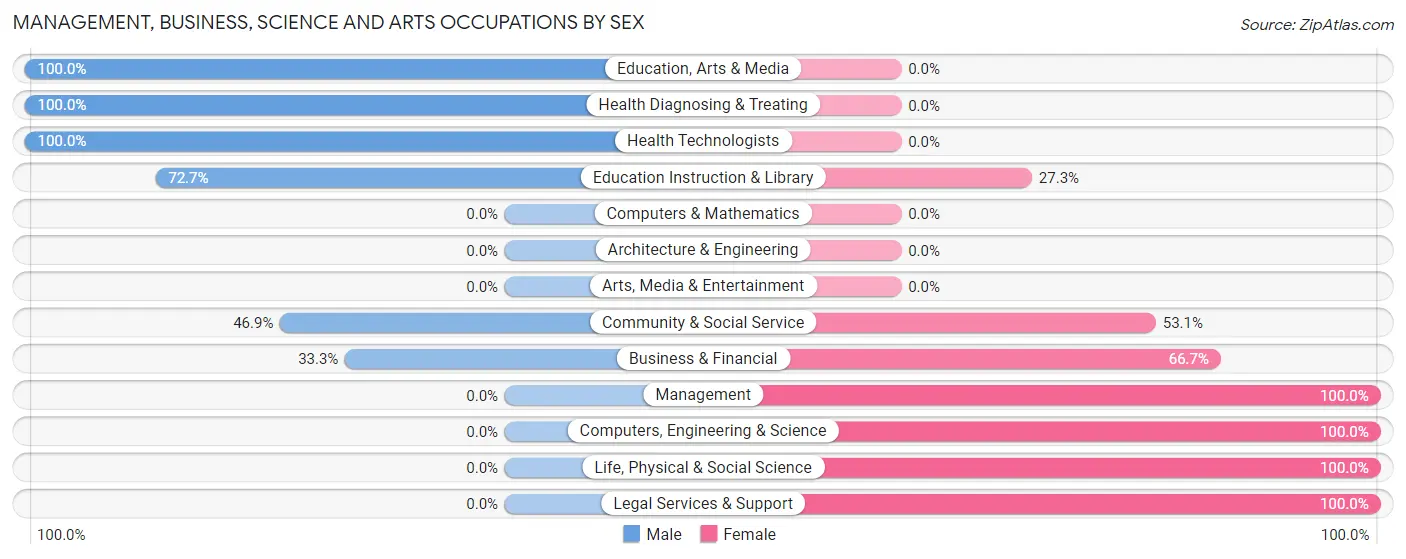
Management, Business, Science and Arts Occupations by Sex
Within the Management, Business, Science and Arts occupations in Thomaston, the most male-oriented occupations are Education, Arts & Media (100.0%), Health Diagnosing & Treating (100.0%), and Health Technologists (100.0%), while the most female-oriented occupations are Management (100.0%), Computers, Engineering & Science (100.0%), and Life, Physical & Social Science (100.0%).
| Occupation | Male | Female |
| Management | 0 (0.0%) | 51 (100.0%) |
| Business & Financial | 29 (33.3%) | 58 (66.7%) |
| Computers, Engineering & Science | 0 (0.0%) | 33 (100.0%) |
| Computers & Mathematics | 0 (0.0%) | 0 (0.0%) |
| Architecture & Engineering | 0 (0.0%) | 0 (0.0%) |
| Life, Physical & Social Science | 0 (0.0%) | 33 (100.0%) |
| Community & Social Service | 15 (46.9%) | 17 (53.1%) |
| Education, Arts & Media | 7 (100.0%) | 0 (0.0%) |
| Legal Services & Support | 0 (0.0%) | 14 (100.0%) |
| Education Instruction & Library | 8 (72.7%) | 3 (27.3%) |
| Arts, Media & Entertainment | 0 (0.0%) | 0 (0.0%) |
| Health Diagnosing & Treating | 12 (100.0%) | 0 (0.0%) |
| Health Technologists | 12 (100.0%) | 0 (0.0%) |
| Total (Category) | 56 (26.1%) | 159 (74.0%) |
| Total (Overall) | 622 (58.1%) | 449 (41.9%) |
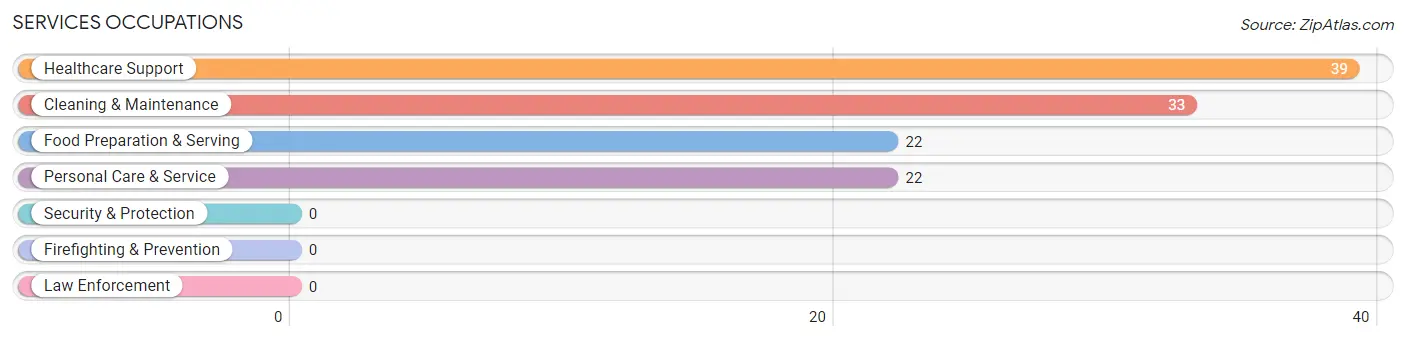
Services Occupations
The most common Services occupations in Thomaston are Healthcare Support (39 | 3.6%), Cleaning & Maintenance (33 | 3.1%), Food Preparation & Serving (22 | 2.1%), and Personal Care & Service (22 | 2.1%).
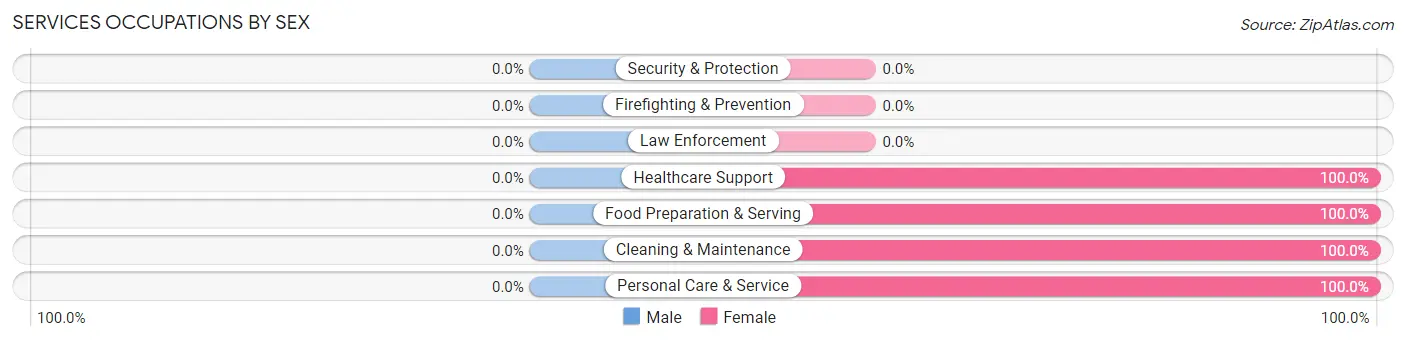
Services Occupations by Sex
| Occupation | Male | Female |
| Healthcare Support | 0 (0.0%) | 39 (100.0%) |
| Security & Protection | 0 (0.0%) | 0 (0.0%) |
| Firefighting & Prevention | 0 (0.0%) | 0 (0.0%) |
| Law Enforcement | 0 (0.0%) | 0 (0.0%) |
| Food Preparation & Serving | 0 (0.0%) | 22 (100.0%) |
| Cleaning & Maintenance | 0 (0.0%) | 33 (100.0%) |
| Personal Care & Service | 0 (0.0%) | 22 (100.0%) |
| Total (Category) | 0 (0.0%) | 116 (100.0%) |
| Total (Overall) | 622 (58.1%) | 449 (41.9%) |
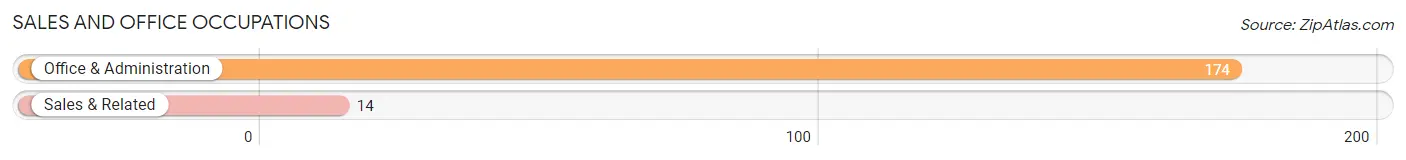
Sales and Office Occupations
The most common Sales and Office occupations in Thomaston are Office & Administration (174 | 16.3%), and Sales & Related (14 | 1.3%).
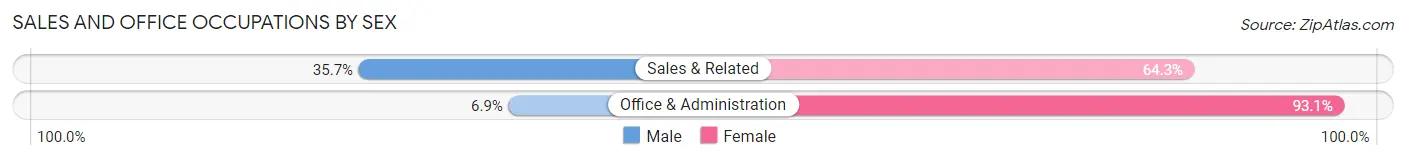
Sales and Office Occupations by Sex
| Occupation | Male | Female |
| Sales & Related | 5 (35.7%) | 9 (64.3%) |
| Office & Administration | 12 (6.9%) | 162 (93.1%) |
| Total (Category) | 17 (9.0%) | 171 (91.0%) |
| Total (Overall) | 622 (58.1%) | 449 (41.9%) |
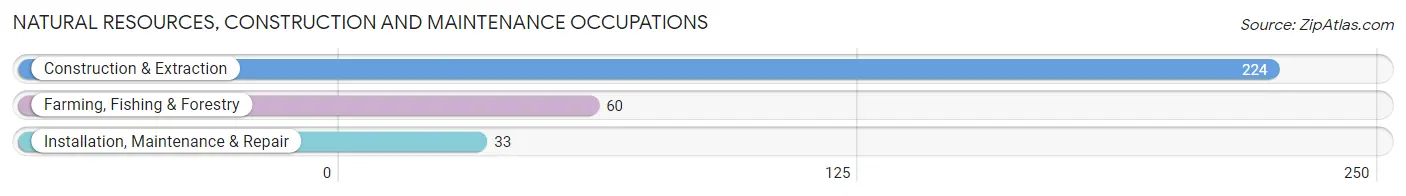
Natural Resources, Construction and Maintenance Occupations
The most common Natural Resources, Construction and Maintenance occupations in Thomaston are Construction & Extraction (224 | 20.9%), Farming, Fishing & Forestry (60 | 5.6%), and Installation, Maintenance & Repair (33 | 3.1%).
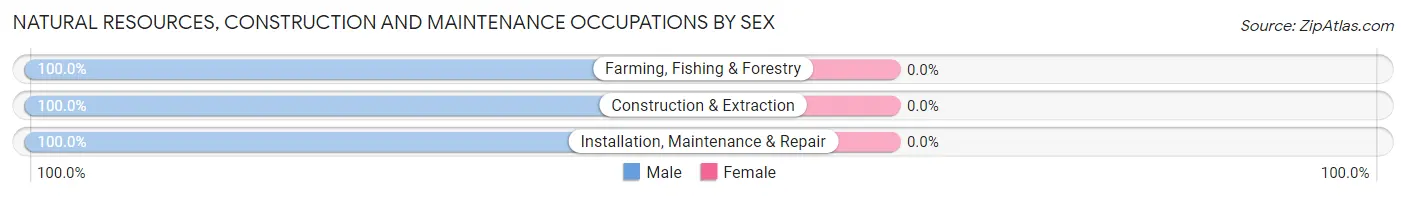
Natural Resources, Construction and Maintenance Occupations by Sex
| Occupation | Male | Female |
| Farming, Fishing & Forestry | 60 (100.0%) | 0 (0.0%) |
| Construction & Extraction | 224 (100.0%) | 0 (0.0%) |
| Installation, Maintenance & Repair | 33 (100.0%) | 0 (0.0%) |
| Total (Category) | 317 (100.0%) | 0 (0.0%) |
| Total (Overall) | 622 (58.1%) | 449 (41.9%) |
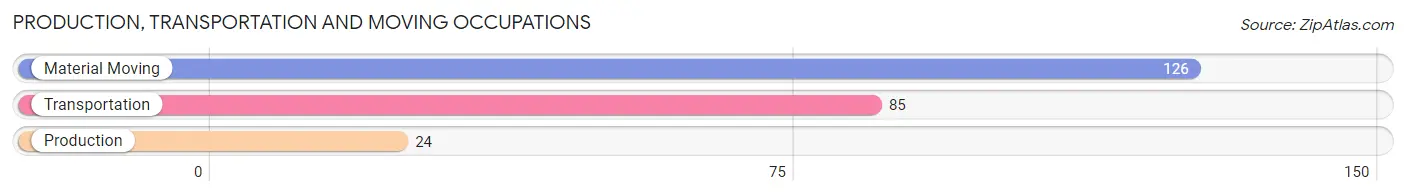
Production, Transportation and Moving Occupations
The most common Production, Transportation and Moving occupations in Thomaston are Material Moving (126 | 11.8%), Transportation (85 | 7.9%), and Production (24 | 2.2%).
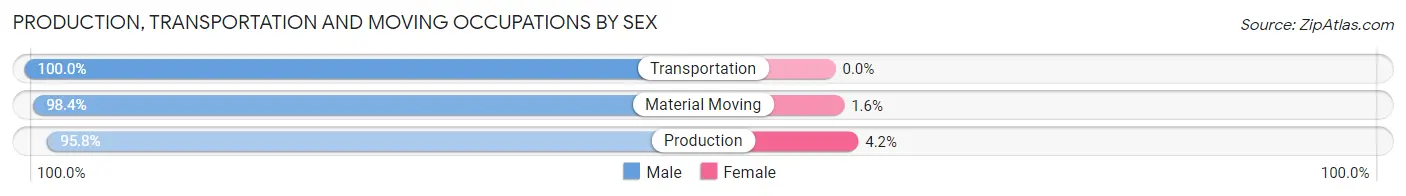
Production, Transportation and Moving Occupations by Sex
| Occupation | Male | Female |
| Production | 23 (95.8%) | 1 (4.2%) |
| Transportation | 85 (100.0%) | 0 (0.0%) |
| Material Moving | 124 (98.4%) | 2 (1.6%) |
| Total (Category) | 232 (98.7%) | 3 (1.3%) |
| Total (Overall) | 622 (58.1%) | 449 (41.9%) |
Employment Industries by Sex in Thomaston
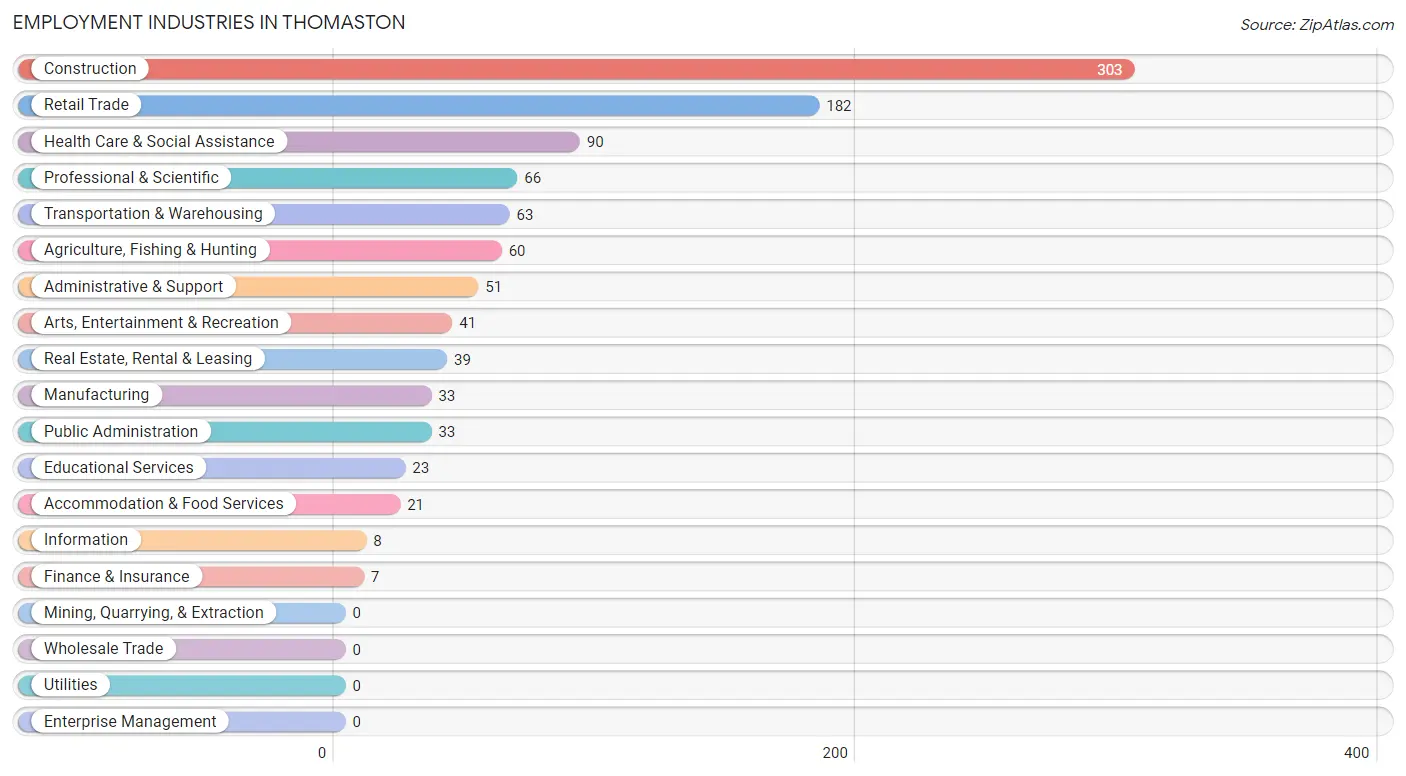
Employment Industries in Thomaston
The major employment industries in Thomaston include Construction (303 | 28.3%), Retail Trade (182 | 17.0%), Health Care & Social Assistance (90 | 8.4%), Professional & Scientific (66 | 6.2%), and Transportation & Warehousing (63 | 5.9%).
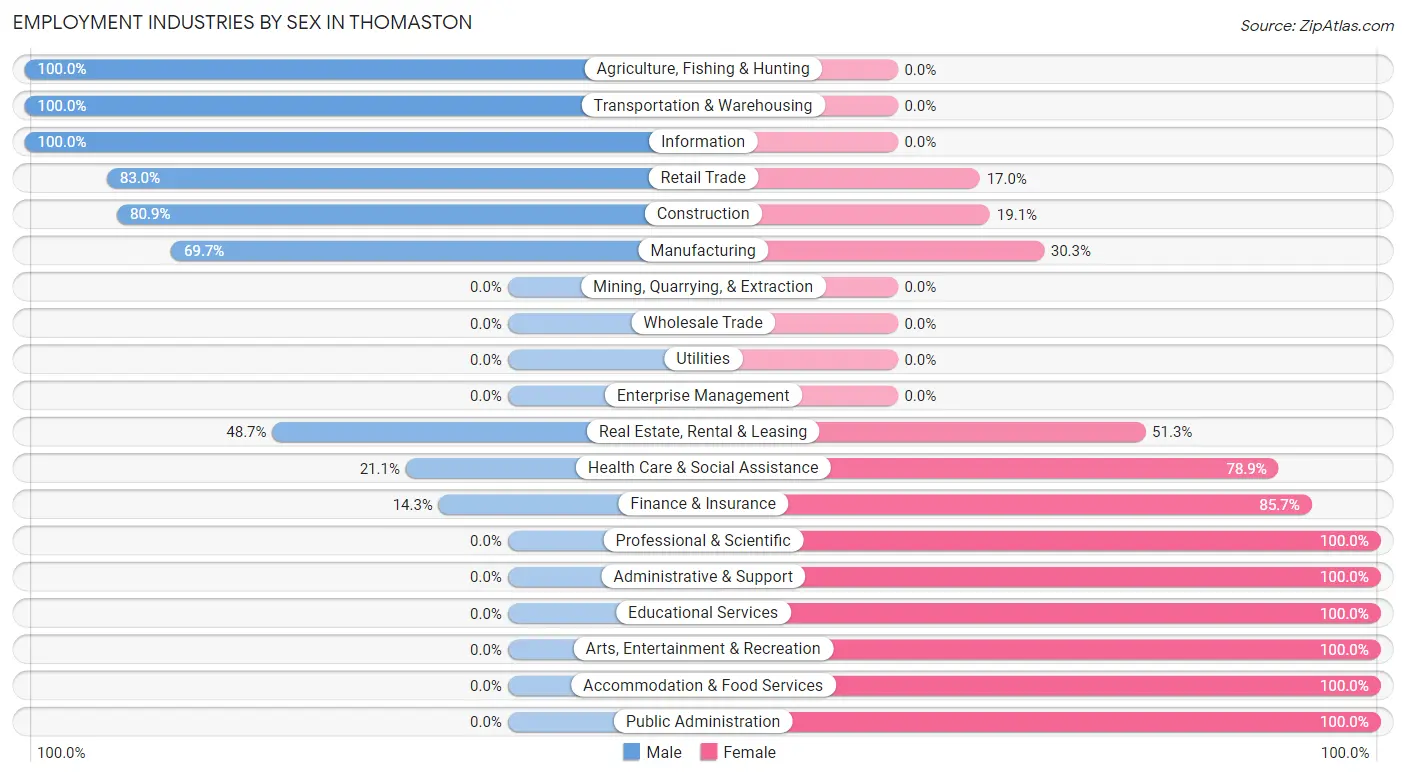
Employment Industries by Sex in Thomaston
The Thomaston industries that see more men than women are Agriculture, Fishing & Hunting (100.0%), Transportation & Warehousing (100.0%), and Information (100.0%), whereas the industries that tend to have a higher number of women are Professional & Scientific (100.0%), Administrative & Support (100.0%), and Educational Services (100.0%).
| Industry | Male | Female |
| Agriculture, Fishing & Hunting | 60 (100.0%) | 0 (0.0%) |
| Mining, Quarrying, & Extraction | 0 (0.0%) | 0 (0.0%) |
| Construction | 245 (80.9%) | 58 (19.1%) |
| Manufacturing | 23 (69.7%) | 10 (30.3%) |
| Wholesale Trade | 0 (0.0%) | 0 (0.0%) |
| Retail Trade | 151 (83.0%) | 31 (17.0%) |
| Transportation & Warehousing | 63 (100.0%) | 0 (0.0%) |
| Utilities | 0 (0.0%) | 0 (0.0%) |
| Information | 8 (100.0%) | 0 (0.0%) |
| Finance & Insurance | 1 (14.3%) | 6 (85.7%) |
| Real Estate, Rental & Leasing | 19 (48.7%) | 20 (51.3%) |
| Professional & Scientific | 0 (0.0%) | 66 (100.0%) |
| Enterprise Management | 0 (0.0%) | 0 (0.0%) |
| Administrative & Support | 0 (0.0%) | 51 (100.0%) |
| Educational Services | 0 (0.0%) | 23 (100.0%) |
| Health Care & Social Assistance | 19 (21.1%) | 71 (78.9%) |
| Arts, Entertainment & Recreation | 0 (0.0%) | 41 (100.0%) |
| Accommodation & Food Services | 0 (0.0%) | 21 (100.0%) |
| Public Administration | 0 (0.0%) | 33 (100.0%) |
| Total | 622 (58.1%) | 449 (41.9%) |
Education in Thomaston
School Enrollment in Thomaston
The most common levels of schooling among the 380 students in Thomaston are high school (105 | 27.6%), elementary school (95 | 25.0%), and middle school (67 | 17.6%).
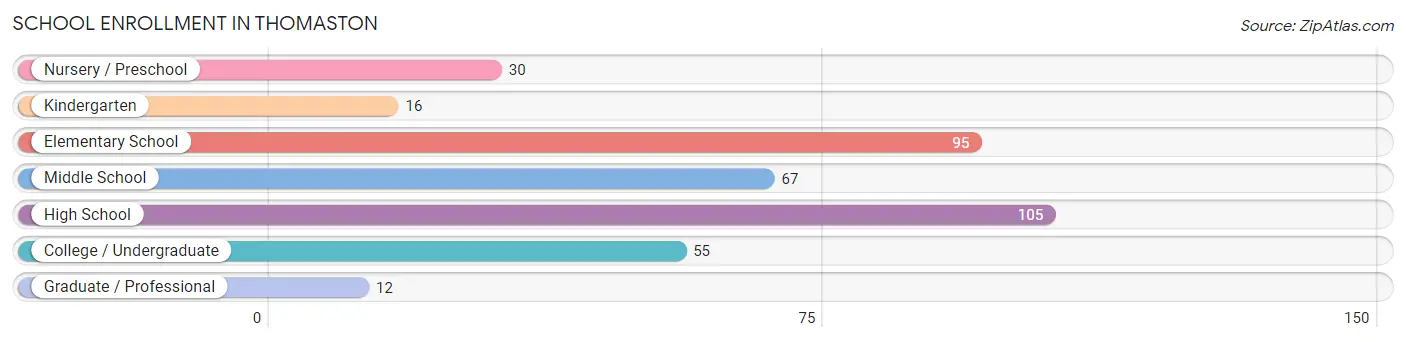
| School Level | # Students | % Students |
| Nursery / Preschool | 30 | 7.9% |
| Kindergarten | 16 | 4.2% |
| Elementary School | 95 | 25.0% |
| Middle School | 67 | 17.6% |
| High School | 105 | 27.6% |
| College / Undergraduate | 55 | 14.5% |
| Graduate / Professional | 12 | 3.2% |
| Total | 380 | 100.0% |
School Enrollment by Age by Funding Source in Thomaston
Out of a total of 380 students who are enrolled in schools in Thomaston, 30 (7.9%) attend a private institution, while the remaining 350 (92.1%) are enrolled in public schools. The age group of 3 to 4 year olds has the highest likelihood of being enrolled in private schools, with 30 (100.0% in the age bracket) enrolled. Conversely, the age group of 5 to 9 year old has the lowest likelihood of being enrolled in a private school, with 111 (100.0% in the age bracket) attending a public institution.
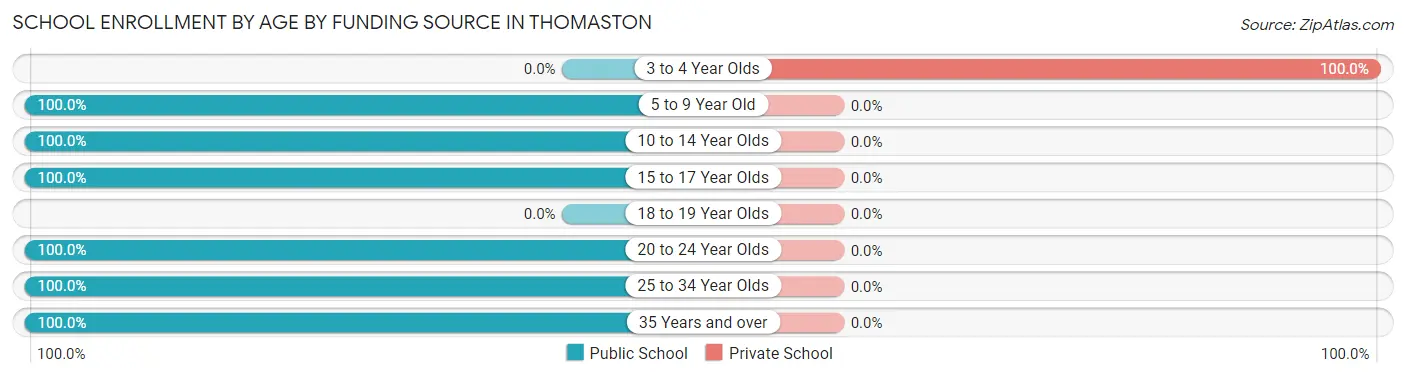
| Age Bracket | Public School | Private School |
| 3 to 4 Year Olds | 0 (0.0%) | 30 (100.0%) |
| 5 to 9 Year Old | 111 (100.0%) | 0 (0.0%) |
| 10 to 14 Year Olds | 90 (100.0%) | 0 (0.0%) |
| 15 to 17 Year Olds | 82 (100.0%) | 0 (0.0%) |
| 18 to 19 Year Olds | 0 (0.0%) | 0 (0.0%) |
| 20 to 24 Year Olds | 39 (100.0%) | 0 (0.0%) |
| 25 to 34 Year Olds | 16 (100.0%) | 0 (0.0%) |
| 35 Years and over | 12 (100.0%) | 0 (0.0%) |
| Total | 350 (92.1%) | 30 (7.9%) |
Educational Attainment by Field of Study in Thomaston
Science & technology (63 | 17.8%), bio, nature & agricultural (55 | 15.6%), computers & mathematics (46 | 13.0%), education (45 | 12.8%), and social sciences (41 | 11.6%) are the most common fields of study among 353 individuals in Thomaston who have obtained a bachelor's degree or higher.
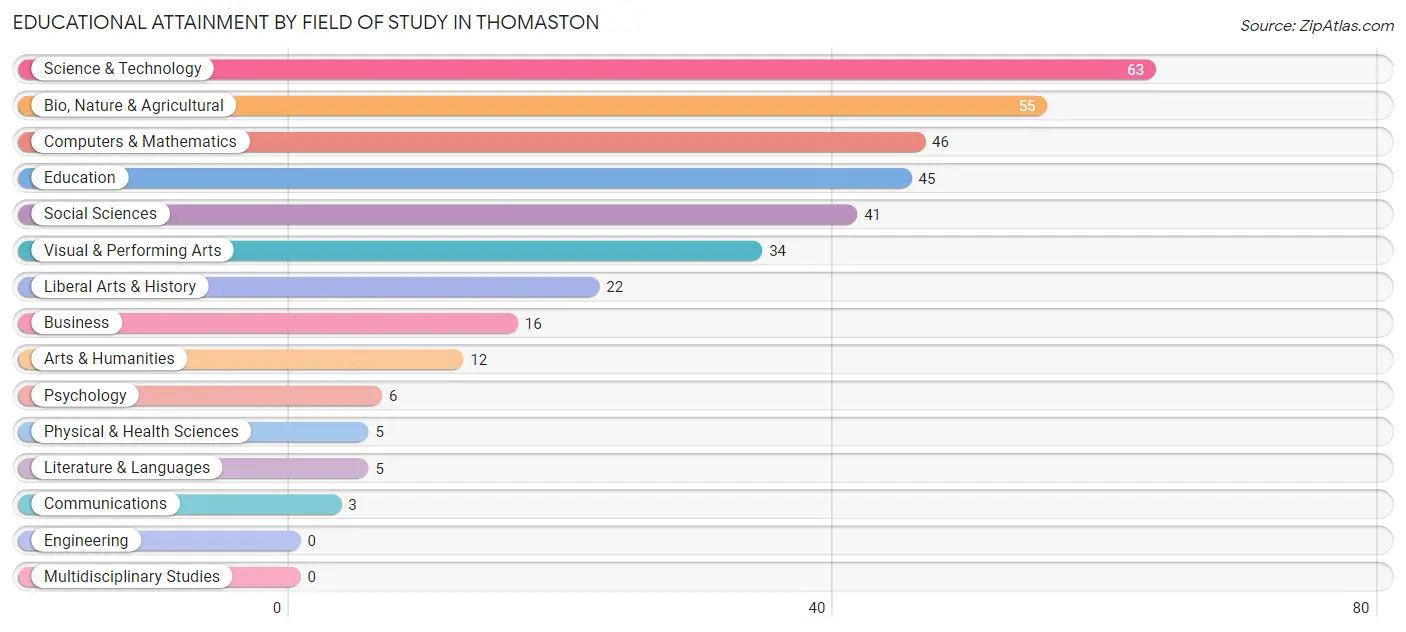
| Field of Study | # Graduates | % Graduates |
| Computers & Mathematics | 46 | 13.0% |
| Bio, Nature & Agricultural | 55 | 15.6% |
| Physical & Health Sciences | 5 | 1.4% |
| Psychology | 6 | 1.7% |
| Social Sciences | 41 | 11.6% |
| Engineering | 0 | 0.0% |
| Multidisciplinary Studies | 0 | 0.0% |
| Science & Technology | 63 | 17.8% |
| Business | 16 | 4.5% |
| Education | 45 | 12.8% |
| Literature & Languages | 5 | 1.4% |
| Liberal Arts & History | 22 | 6.2% |
| Visual & Performing Arts | 34 | 9.6% |
| Communications | 3 | 0.9% |
| Arts & Humanities | 12 | 3.4% |
| Total | 353 | 100.0% |
Transportation & Commute in Thomaston
Vehicle Availability by Sex in Thomaston
The most prevalent vehicle ownership categories in Thomaston are males with 1 vehicle (281, accounting for 45.3%) and females with 1 vehicle (128, making up 71.5%).
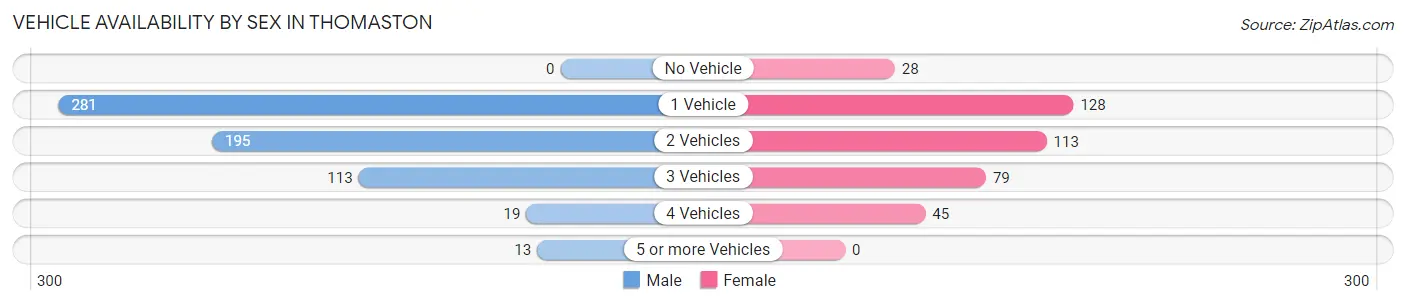
| Vehicles Available | Male | Female |
| No Vehicle | 0 (0.0%) | 28 (7.1%) |
| 1 Vehicle | 281 (45.3%) | 128 (32.6%) |
| 2 Vehicles | 195 (31.4%) | 113 (28.7%) |
| 3 Vehicles | 113 (18.2%) | 79 (20.1%) |
| 4 Vehicles | 19 (3.1%) | 45 (11.5%) |
| 5 or more Vehicles | 13 (2.1%) | 0 (0.0%) |
| Total | 621 (100.0%) | 393 (100.0%) |
Commute Time in Thomaston
The most frequently occuring commute durations in Thomaston are 15 to 19 minutes (278 commuters, 27.8%), 5 to 9 minutes (209 commuters, 20.9%), and 10 to 14 minutes (186 commuters, 18.6%).
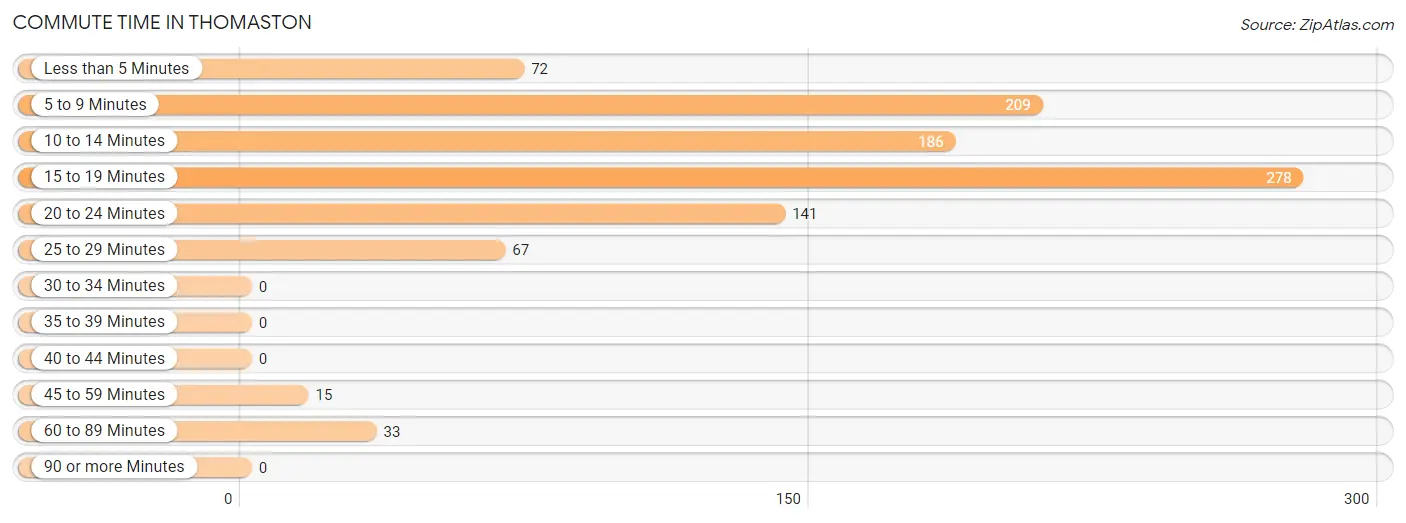
| Commute Time | # Commuters | % Commuters |
| Less than 5 Minutes | 72 | 7.2% |
| 5 to 9 Minutes | 209 | 20.9% |
| 10 to 14 Minutes | 186 | 18.6% |
| 15 to 19 Minutes | 278 | 27.8% |
| 20 to 24 Minutes | 141 | 14.1% |
| 25 to 29 Minutes | 67 | 6.7% |
| 30 to 34 Minutes | 0 | 0.0% |
| 35 to 39 Minutes | 0 | 0.0% |
| 40 to 44 Minutes | 0 | 0.0% |
| 45 to 59 Minutes | 15 | 1.5% |
| 60 to 89 Minutes | 33 | 3.3% |
| 90 or more Minutes | 0 | 0.0% |
Commute Time by Sex in Thomaston
The most common commute times in Thomaston are 5 to 9 minutes (143 commuters, 23.0%) for males and 15 to 19 minutes (160 commuters, 42.2%) for females.
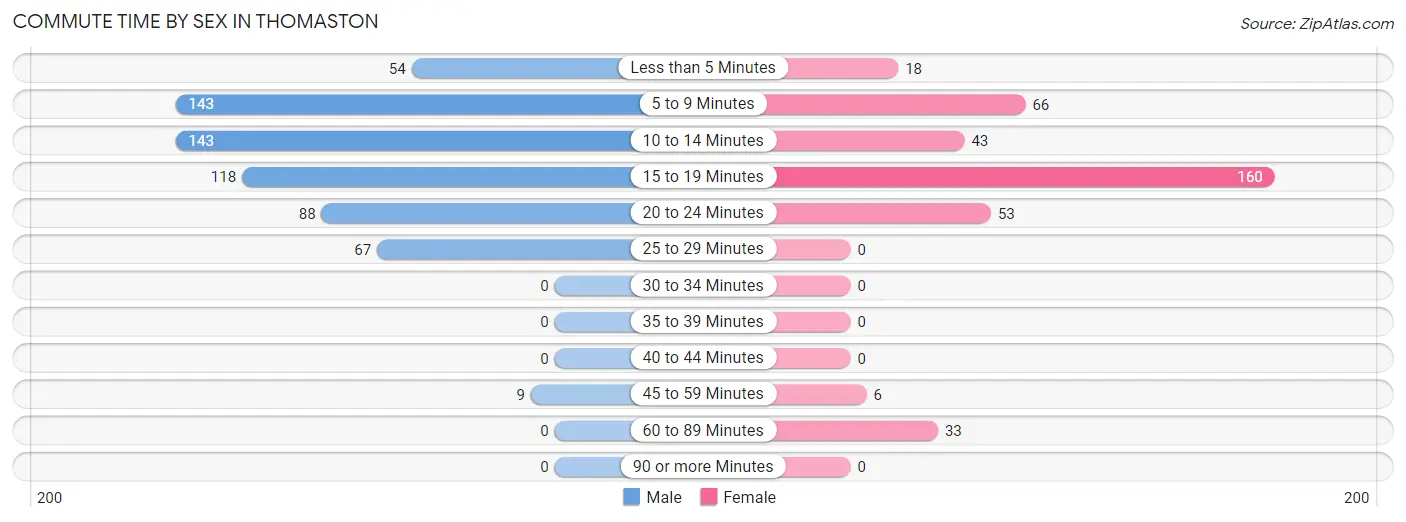
| Commute Time | Male | Female |
| Less than 5 Minutes | 54 (8.7%) | 18 (4.8%) |
| 5 to 9 Minutes | 143 (23.0%) | 66 (17.4%) |
| 10 to 14 Minutes | 143 (23.0%) | 43 (11.4%) |
| 15 to 19 Minutes | 118 (19.0%) | 160 (42.2%) |
| 20 to 24 Minutes | 88 (14.1%) | 53 (14.0%) |
| 25 to 29 Minutes | 67 (10.8%) | 0 (0.0%) |
| 30 to 34 Minutes | 0 (0.0%) | 0 (0.0%) |
| 35 to 39 Minutes | 0 (0.0%) | 0 (0.0%) |
| 40 to 44 Minutes | 0 (0.0%) | 0 (0.0%) |
| 45 to 59 Minutes | 9 (1.5%) | 6 (1.6%) |
| 60 to 89 Minutes | 0 (0.0%) | 33 (8.7%) |
| 90 or more Minutes | 0 (0.0%) | 0 (0.0%) |
Time of Departure to Work by Sex in Thomaston
The most frequent times of departure to work in Thomaston are 6:30 AM to 6:59 AM (113, 18.2%) for males and 7:00 AM to 7:29 AM (106, 28.0%) for females.
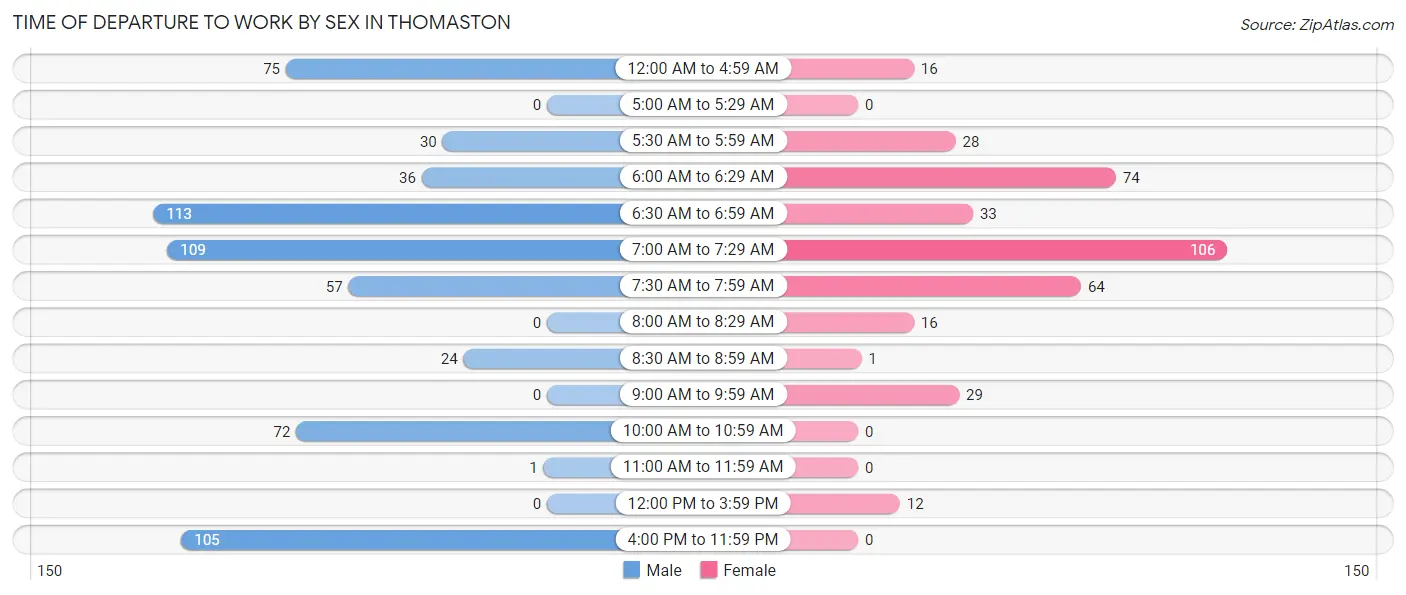
| Time of Departure | Male | Female |
| 12:00 AM to 4:59 AM | 75 (12.1%) | 16 (4.2%) |
| 5:00 AM to 5:29 AM | 0 (0.0%) | 0 (0.0%) |
| 5:30 AM to 5:59 AM | 30 (4.8%) | 28 (7.4%) |
| 6:00 AM to 6:29 AM | 36 (5.8%) | 74 (19.5%) |
| 6:30 AM to 6:59 AM | 113 (18.2%) | 33 (8.7%) |
| 7:00 AM to 7:29 AM | 109 (17.5%) | 106 (28.0%) |
| 7:30 AM to 7:59 AM | 57 (9.2%) | 64 (16.9%) |
| 8:00 AM to 8:29 AM | 0 (0.0%) | 16 (4.2%) |
| 8:30 AM to 8:59 AM | 24 (3.9%) | 1 (0.3%) |
| 9:00 AM to 9:59 AM | 0 (0.0%) | 29 (7.6%) |
| 10:00 AM to 10:59 AM | 72 (11.6%) | 0 (0.0%) |
| 11:00 AM to 11:59 AM | 1 (0.2%) | 0 (0.0%) |
| 12:00 PM to 3:59 PM | 0 (0.0%) | 12 (3.2%) |
| 4:00 PM to 11:59 PM | 105 (16.9%) | 0 (0.0%) |
| Total | 622 (100.0%) | 379 (100.0%) |
Housing Occupancy in Thomaston
Occupancy by Ownership in Thomaston
Of the total 949 dwellings in Thomaston, owner-occupied units account for 589 (62.1%), while renter-occupied units make up 360 (37.9%).
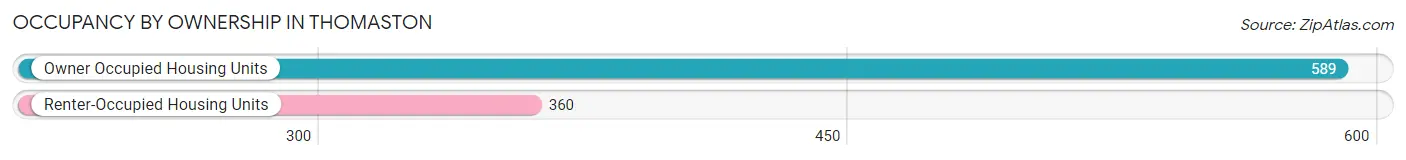
| Occupancy | # Housing Units | % Housing Units |
| Owner Occupied Housing Units | 589 | 62.1% |
| Renter-Occupied Housing Units | 360 | 37.9% |
| Total Occupied Housing Units | 949 | 100.0% |
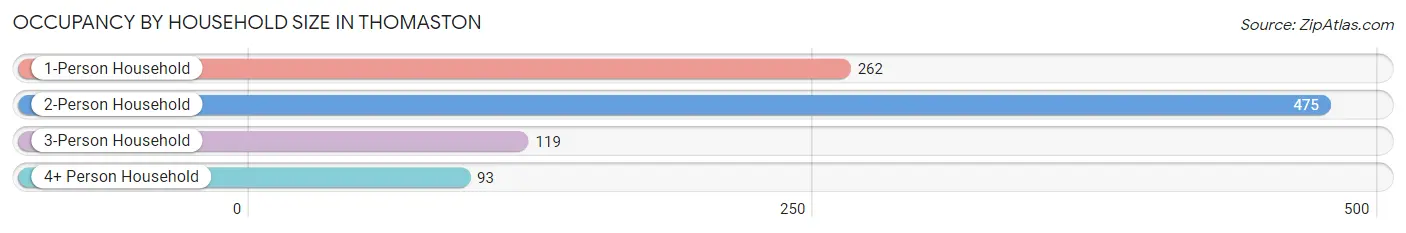
Occupancy by Household Size in Thomaston
| Household Size | # Housing Units | % Housing Units |
| 1-Person Household | 262 | 27.6% |
| 2-Person Household | 475 | 50.0% |
| 3-Person Household | 119 | 12.5% |
| 4+ Person Household | 93 | 9.8% |
| Total Housing Units | 949 | 100.0% |
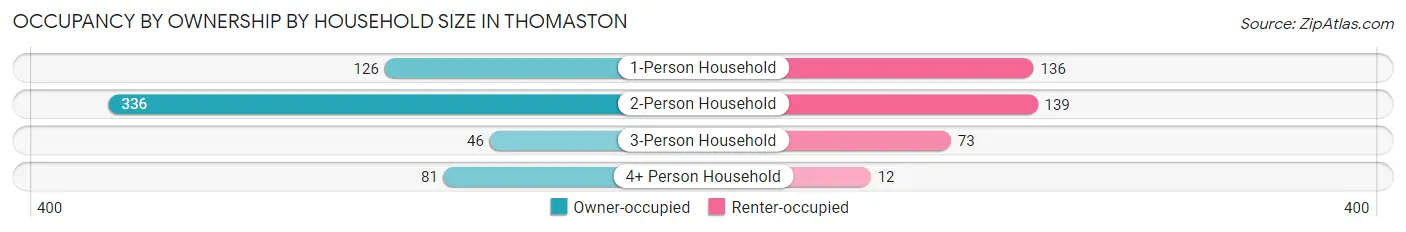
Occupancy by Ownership by Household Size in Thomaston
| Household Size | Owner-occupied | Renter-occupied |
| 1-Person Household | 126 (48.1%) | 136 (51.9%) |
| 2-Person Household | 336 (70.7%) | 139 (29.3%) |
| 3-Person Household | 46 (38.7%) | 73 (61.3%) |
| 4+ Person Household | 81 (87.1%) | 12 (12.9%) |
| Total Housing Units | 589 (62.1%) | 360 (37.9%) |
Occupancy by Educational Attainment in Thomaston
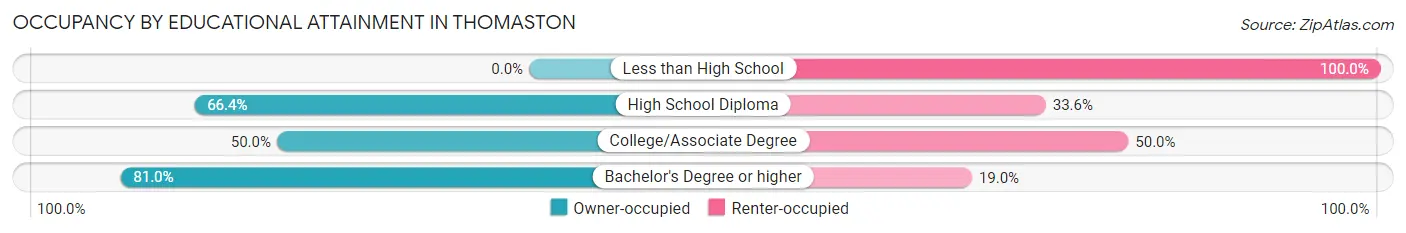
| Household Size | Owner-occupied | Renter-occupied |
| Less than High School | 0 (0.0%) | 40 (100.0%) |
| High School Diploma | 221 (66.4%) | 112 (33.6%) |
| College/Associate Degree | 159 (50.0%) | 159 (50.0%) |
| Bachelor's Degree or higher | 209 (81.0%) | 49 (19.0%) |
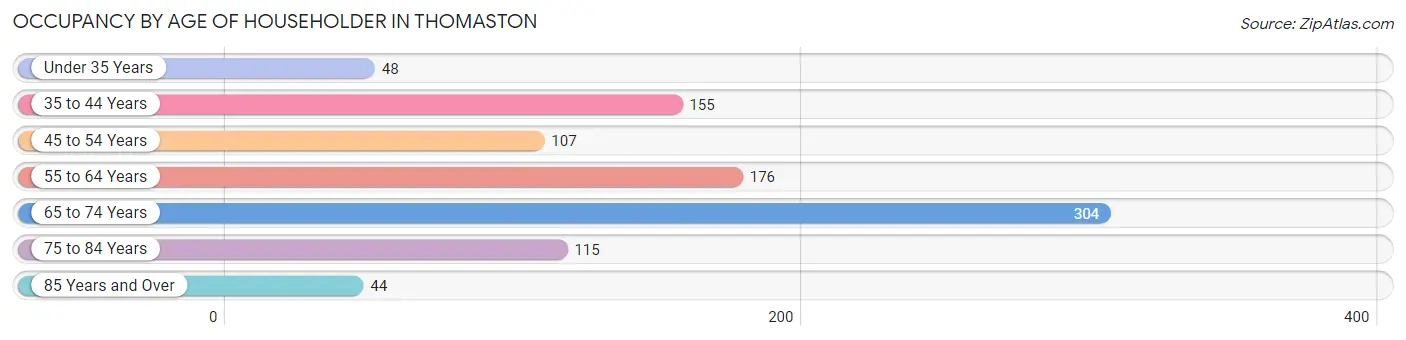
Occupancy by Age of Householder in Thomaston
| Age Bracket | # Households | % Households |
| Under 35 Years | 48 | 5.1% |
| 35 to 44 Years | 155 | 16.3% |
| 45 to 54 Years | 107 | 11.3% |
| 55 to 64 Years | 176 | 18.5% |
| 65 to 74 Years | 304 | 32.0% |
| 75 to 84 Years | 115 | 12.1% |
| 85 Years and Over | 44 | 4.6% |
| Total | 949 | 100.0% |
Housing Finances in Thomaston
Median Income by Occupancy in Thomaston
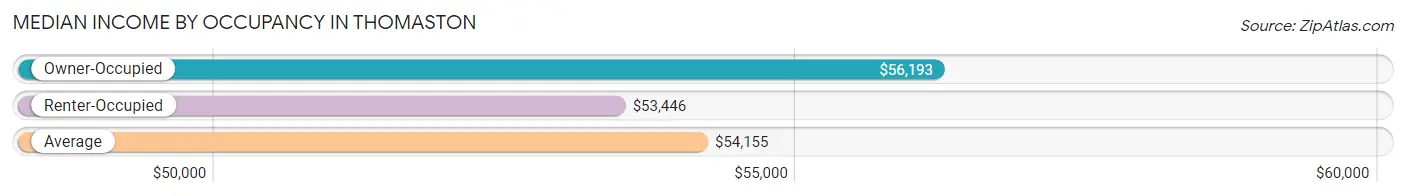
| Occupancy Type | # Households | Median Income |
| Owner-Occupied | 589 (62.1%) | $56,193 |
| Renter-Occupied | 360 (37.9%) | $53,446 |
| Average | 949 (100.0%) | $54,155 |
Occupancy by Householder Income Bracket in Thomaston
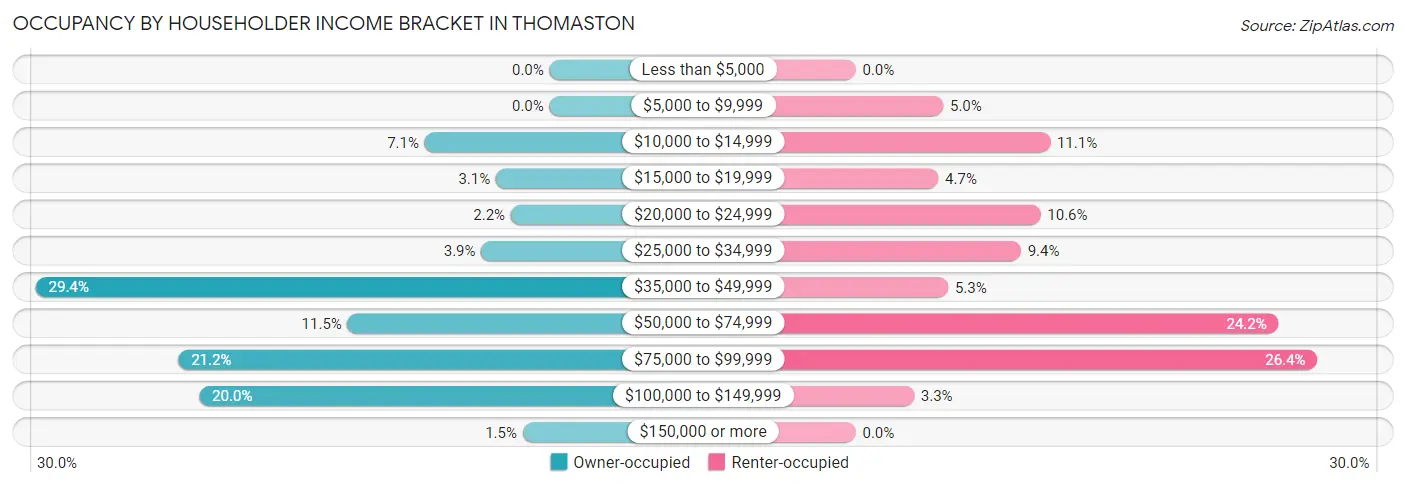
| Income Bracket | Owner-occupied | Renter-occupied |
| Less than $5,000 | 0 (0.0%) | 0 (0.0%) |
| $5,000 to $9,999 | 0 (0.0%) | 18 (5.0%) |
| $10,000 to $14,999 | 42 (7.1%) | 40 (11.1%) |
| $15,000 to $19,999 | 18 (3.1%) | 17 (4.7%) |
| $20,000 to $24,999 | 13 (2.2%) | 38 (10.6%) |
| $25,000 to $34,999 | 23 (3.9%) | 34 (9.4%) |
| $35,000 to $49,999 | 173 (29.4%) | 19 (5.3%) |
| $50,000 to $74,999 | 68 (11.5%) | 87 (24.2%) |
| $75,000 to $99,999 | 125 (21.2%) | 95 (26.4%) |
| $100,000 to $149,999 | 118 (20.0%) | 12 (3.3%) |
| $150,000 or more | 9 (1.5%) | 0 (0.0%) |
| Total | 589 (100.0%) | 360 (100.0%) |
Monthly Housing Cost Tiers in Thomaston
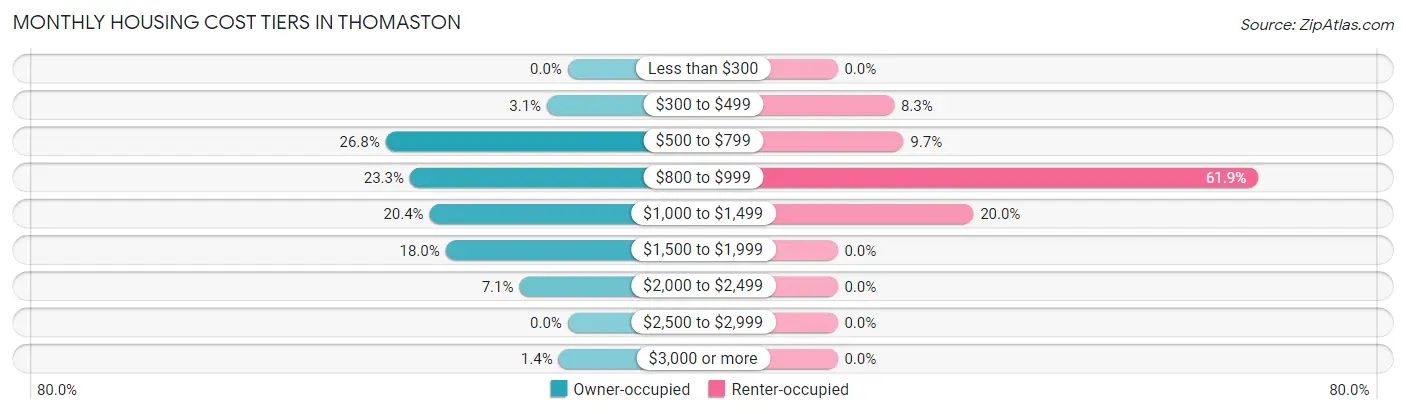
| Monthly Cost | Owner-occupied | Renter-occupied |
| Less than $300 | 0 (0.0%) | 0 (0.0%) |
| $300 to $499 | 18 (3.1%) | 30 (8.3%) |
| $500 to $799 | 158 (26.8%) | 35 (9.7%) |
| $800 to $999 | 137 (23.3%) | 223 (61.9%) |
| $1,000 to $1,499 | 120 (20.4%) | 72 (20.0%) |
| $1,500 to $1,999 | 106 (18.0%) | 0 (0.0%) |
| $2,000 to $2,499 | 42 (7.1%) | 0 (0.0%) |
| $2,500 to $2,999 | 0 (0.0%) | 0 (0.0%) |
| $3,000 or more | 8 (1.4%) | 0 (0.0%) |
| Total | 589 (100.0%) | 360 (100.0%) |
Physical Housing Characteristics in Thomaston
Housing Structures in Thomaston
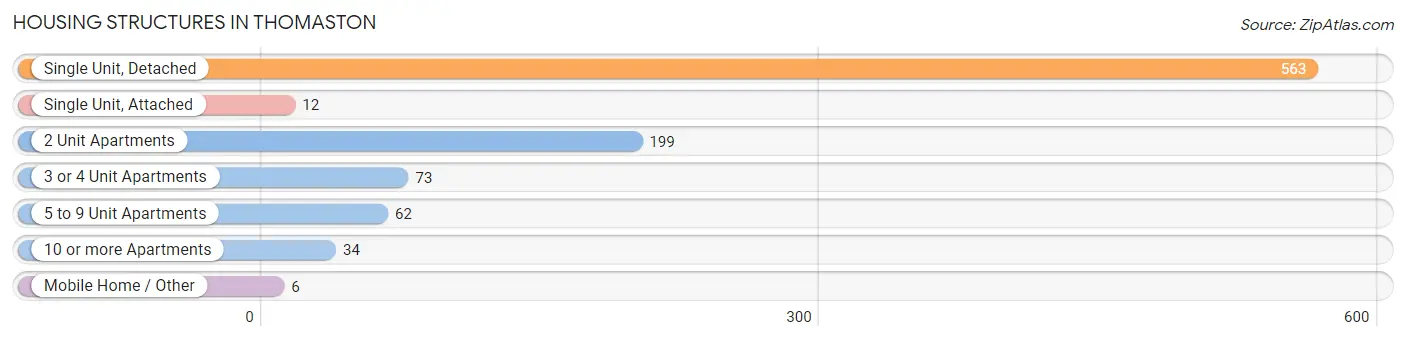
| Structure Type | # Housing Units | % Housing Units |
| Single Unit, Detached | 563 | 59.3% |
| Single Unit, Attached | 12 | 1.3% |
| 2 Unit Apartments | 199 | 21.0% |
| 3 or 4 Unit Apartments | 73 | 7.7% |
| 5 to 9 Unit Apartments | 62 | 6.5% |
| 10 or more Apartments | 34 | 3.6% |
| Mobile Home / Other | 6 | 0.6% |
| Total | 949 | 100.0% |
Housing Structures by Occupancy in Thomaston
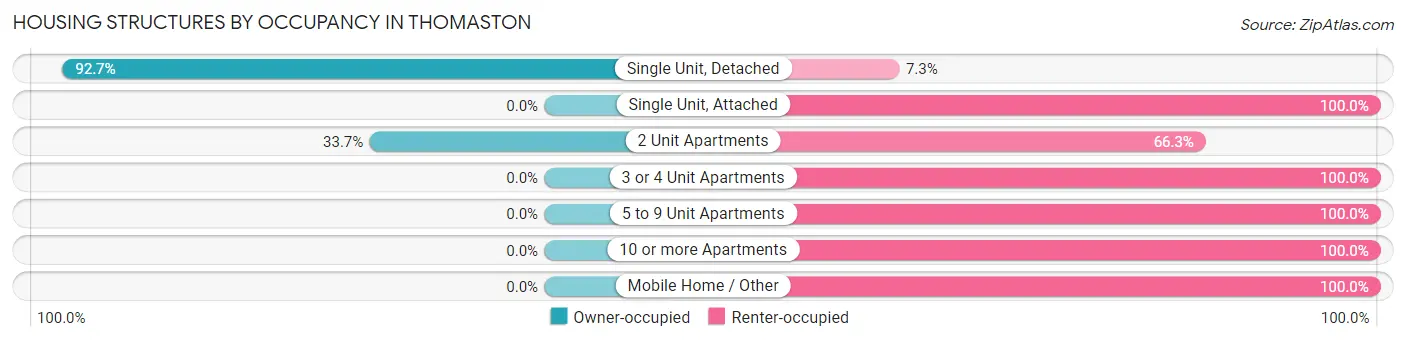
| Structure Type | Owner-occupied | Renter-occupied |
| Single Unit, Detached | 522 (92.7%) | 41 (7.3%) |
| Single Unit, Attached | 0 (0.0%) | 12 (100.0%) |
| 2 Unit Apartments | 67 (33.7%) | 132 (66.3%) |
| 3 or 4 Unit Apartments | 0 (0.0%) | 73 (100.0%) |
| 5 to 9 Unit Apartments | 0 (0.0%) | 62 (100.0%) |
| 10 or more Apartments | 0 (0.0%) | 34 (100.0%) |
| Mobile Home / Other | 0 (0.0%) | 6 (100.0%) |
| Total | 589 (62.1%) | 360 (37.9%) |
Housing Structures by Number of Rooms in Thomaston
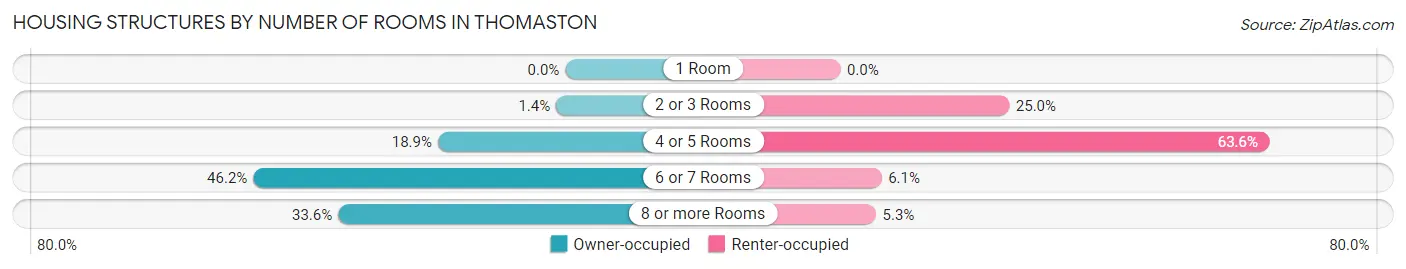
| Number of Rooms | Owner-occupied | Renter-occupied |
| 1 Room | 0 (0.0%) | 0 (0.0%) |
| 2 or 3 Rooms | 8 (1.4%) | 90 (25.0%) |
| 4 or 5 Rooms | 111 (18.9%) | 229 (63.6%) |
| 6 or 7 Rooms | 272 (46.2%) | 22 (6.1%) |
| 8 or more Rooms | 198 (33.6%) | 19 (5.3%) |
| Total | 589 (100.0%) | 360 (100.0%) |
Housing Structure by Heating Type in Thomaston
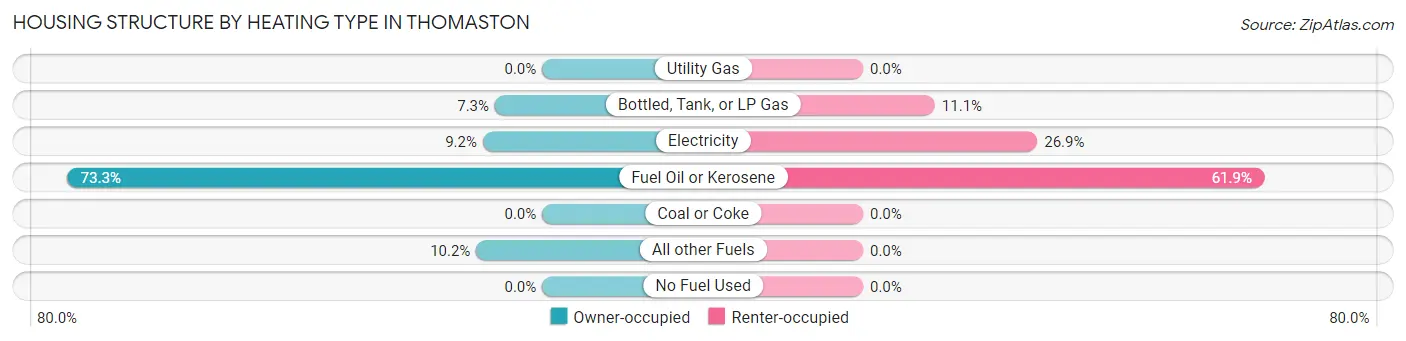
| Heating Type | Owner-occupied | Renter-occupied |
| Utility Gas | 0 (0.0%) | 0 (0.0%) |
| Bottled, Tank, or LP Gas | 43 (7.3%) | 40 (11.1%) |
| Electricity | 54 (9.2%) | 97 (26.9%) |
| Fuel Oil or Kerosene | 432 (73.3%) | 223 (61.9%) |
| Coal or Coke | 0 (0.0%) | 0 (0.0%) |
| All other Fuels | 60 (10.2%) | 0 (0.0%) |
| No Fuel Used | 0 (0.0%) | 0 (0.0%) |
| Total | 589 (100.0%) | 360 (100.0%) |
Household Vehicle Usage in Thomaston
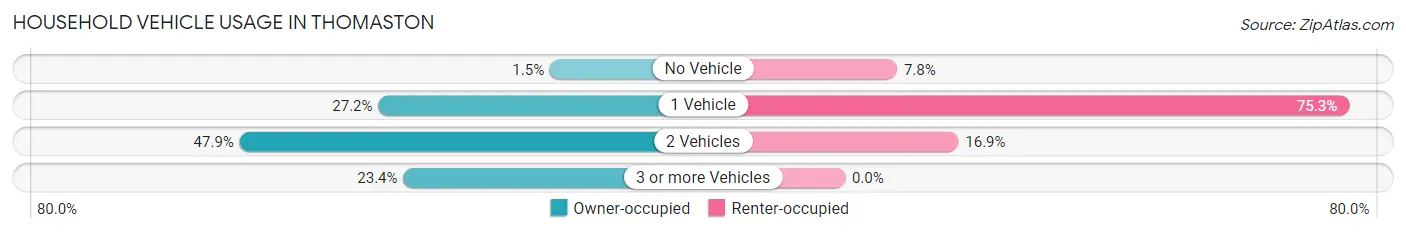
| Vehicles per Household | Owner-occupied | Renter-occupied |
| No Vehicle | 9 (1.5%) | 28 (7.8%) |
| 1 Vehicle | 160 (27.2%) | 271 (75.3%) |
| 2 Vehicles | 282 (47.9%) | 61 (16.9%) |
| 3 or more Vehicles | 138 (23.4%) | 0 (0.0%) |
| Total | 589 (100.0%) | 360 (100.0%) |
Real Estate & Mortgages in Thomaston
Real Estate and Mortgage Overview in Thomaston
| Characteristic | Without Mortgage | With Mortgage |
| Housing Units | 320 | 269 |
| Median Property Value | $260,900 | $245,500 |
| Median Household Income | $42,472 | $0 |
| Monthly Housing Costs | $801 | $8 |
| Real Estate Taxes | $4,475 | $0 |
Property Value by Mortgage Status in Thomaston
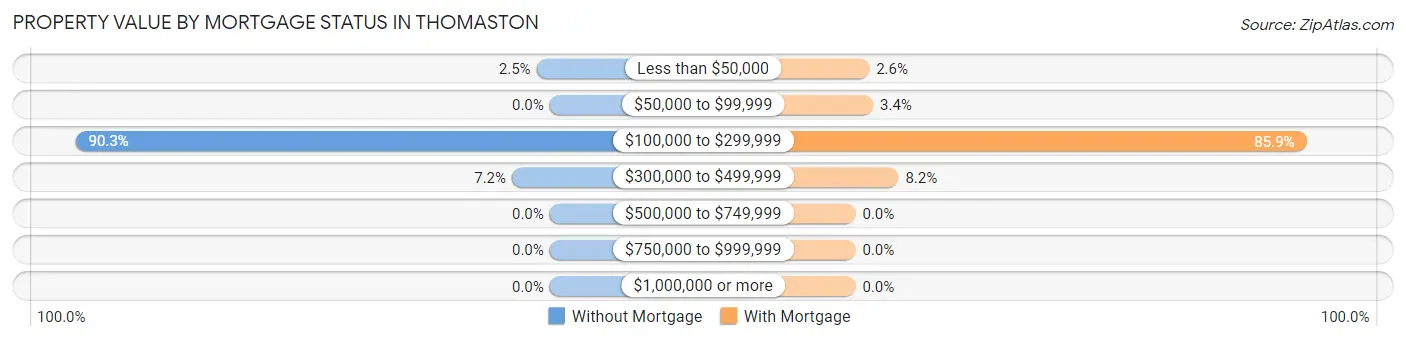
| Property Value | Without Mortgage | With Mortgage |
| Less than $50,000 | 8 (2.5%) | 7 (2.6%) |
| $50,000 to $99,999 | 0 (0.0%) | 9 (3.4%) |
| $100,000 to $299,999 | 289 (90.3%) | 231 (85.9%) |
| $300,000 to $499,999 | 23 (7.2%) | 22 (8.2%) |
| $500,000 to $749,999 | 0 (0.0%) | 0 (0.0%) |
| $750,000 to $999,999 | 0 (0.0%) | 0 (0.0%) |
| $1,000,000 or more | 0 (0.0%) | 0 (0.0%) |
| Total | 320 (100.0%) | 269 (100.0%) |
Household Income by Mortgage Status in Thomaston
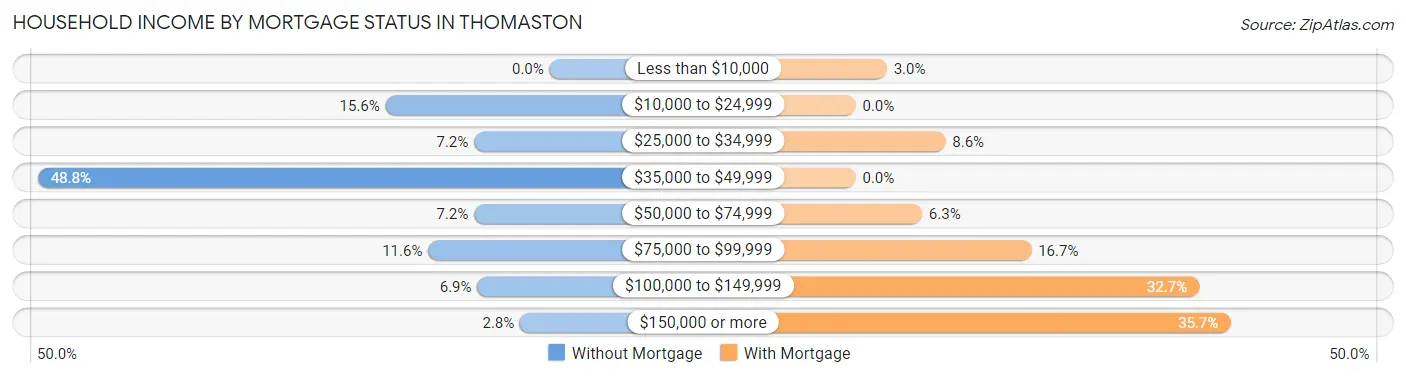
| Household Income | Without Mortgage | With Mortgage |
| Less than $10,000 | 0 (0.0%) | 8 (3.0%) |
| $10,000 to $24,999 | 50 (15.6%) | 0 (0.0%) |
| $25,000 to $34,999 | 23 (7.2%) | 23 (8.6%) |
| $35,000 to $49,999 | 156 (48.7%) | 0 (0.0%) |
| $50,000 to $74,999 | 23 (7.2%) | 17 (6.3%) |
| $75,000 to $99,999 | 37 (11.6%) | 45 (16.7%) |
| $100,000 to $149,999 | 22 (6.9%) | 88 (32.7%) |
| $150,000 or more | 9 (2.8%) | 96 (35.7%) |
| Total | 320 (100.0%) | 269 (100.0%) |
Property Value to Household Income Ratio in Thomaston
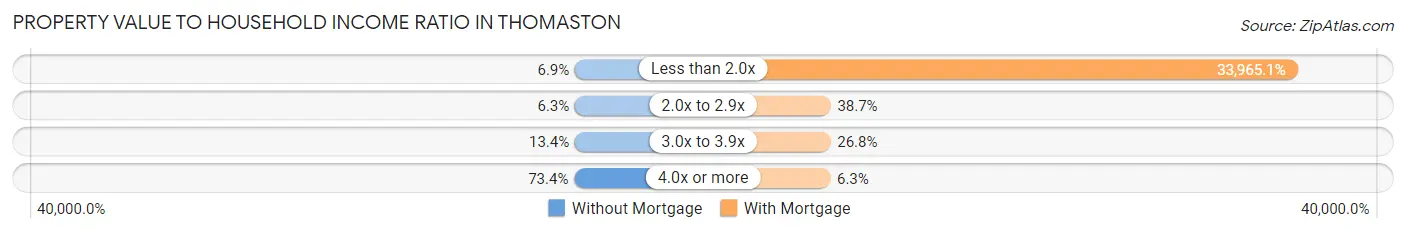
| Value-to-Income Ratio | Without Mortgage | With Mortgage |
| Less than 2.0x | 22 (6.9%) | 91,366 (33,965.1%) |
| 2.0x to 2.9x | 20 (6.2%) | 104 (38.7%) |
| 3.0x to 3.9x | 43 (13.4%) | 72 (26.8%) |
| 4.0x or more | 235 (73.4%) | 17 (6.3%) |
| Total | 320 (100.0%) | 269 (100.0%) |
Real Estate Taxes by Mortgage Status in Thomaston
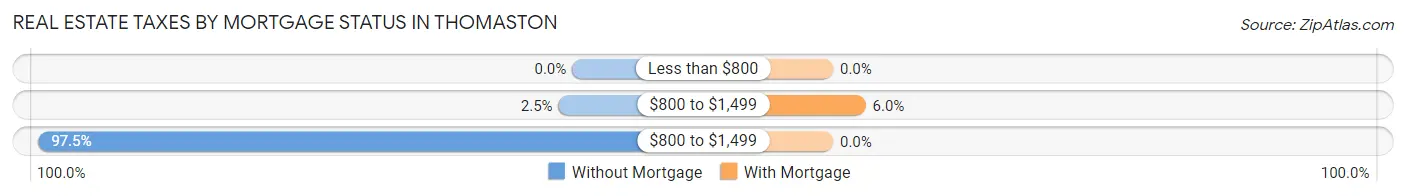
| Property Taxes | Without Mortgage | With Mortgage |
| Less than $800 | 0 (0.0%) | 0 (0.0%) |
| $800 to $1,499 | 8 (2.5%) | 16 (5.9%) |
| $800 to $1,499 | 312 (97.5%) | 0 (0.0%) |
| Total | 320 (100.0%) | 269 (100.0%) |
Health & Disability in Thomaston
Health Insurance Coverage by Age in Thomaston
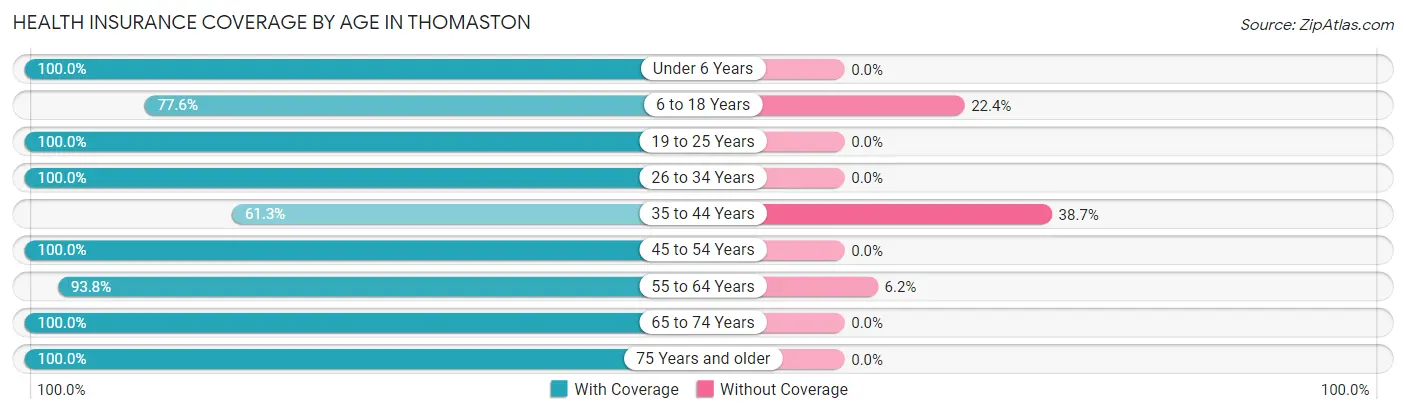
| Age Bracket | With Coverage | Without Coverage |
| Under 6 Years | 77 (100.0%) | 0 (0.0%) |
| 6 to 18 Years | 243 (77.6%) | 70 (22.4%) |
| 19 to 25 Years | 179 (100.0%) | 0 (0.0%) |
| 26 to 34 Years | 129 (100.0%) | 0 (0.0%) |
| 35 to 44 Years | 157 (61.3%) | 99 (38.7%) |
| 45 to 54 Years | 154 (100.0%) | 0 (0.0%) |
| 55 to 64 Years | 317 (93.8%) | 21 (6.2%) |
| 65 to 74 Years | 470 (100.0%) | 0 (0.0%) |
| 75 Years and older | 185 (100.0%) | 0 (0.0%) |
| Total | 1,911 (91.0%) | 190 (9.0%) |
Health Insurance Coverage by Citizenship Status in Thomaston
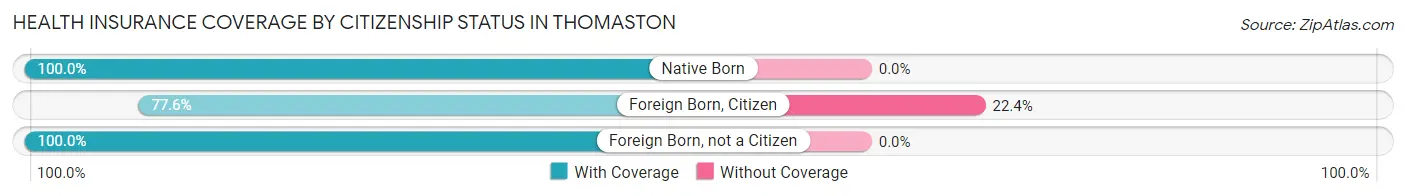
| Citizenship Status | With Coverage | Without Coverage |
| Native Born | 77 (100.0%) | 0 (0.0%) |
| Foreign Born, Citizen | 243 (77.6%) | 70 (22.4%) |
| Foreign Born, not a Citizen | 179 (100.0%) | 0 (0.0%) |
Health Insurance Coverage by Household Income in Thomaston
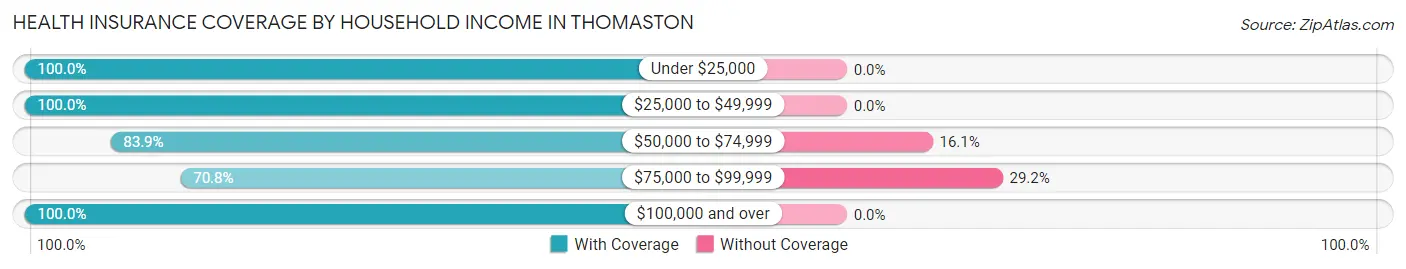
| Household Income | With Coverage | Without Coverage |
| Under $25,000 | 234 (100.0%) | 0 (0.0%) |
| $25,000 to $49,999 | 395 (100.0%) | 0 (0.0%) |
| $50,000 to $74,999 | 282 (83.9%) | 54 (16.1%) |
| $75,000 to $99,999 | 330 (70.8%) | 136 (29.2%) |
| $100,000 and over | 649 (100.0%) | 0 (0.0%) |
Public vs Private Health Insurance Coverage by Age in Thomaston
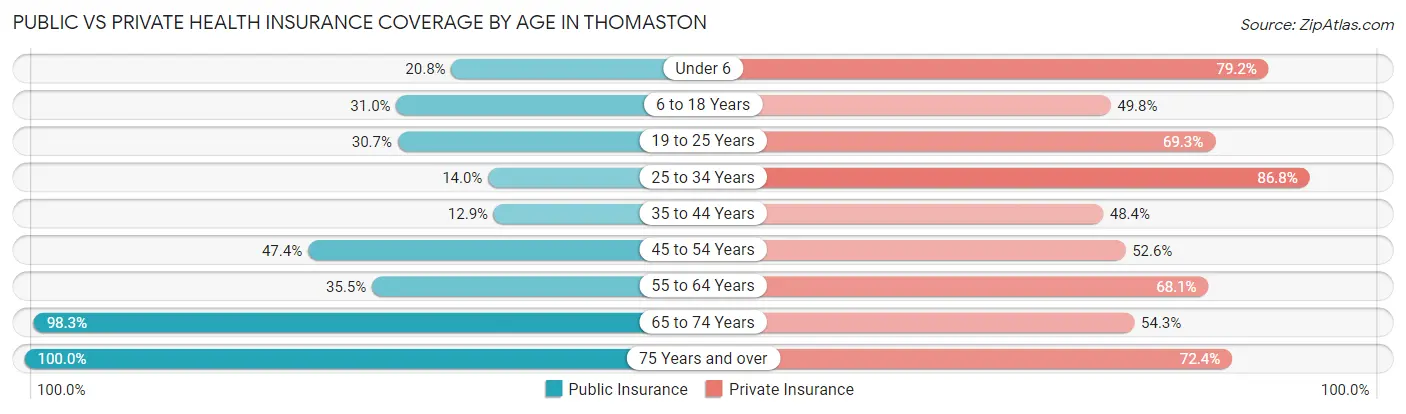
| Age Bracket | Public Insurance | Private Insurance |
| Under 6 | 16 (20.8%) | 61 (79.2%) |
| 6 to 18 Years | 97 (31.0%) | 156 (49.8%) |
| 19 to 25 Years | 55 (30.7%) | 124 (69.3%) |
| 25 to 34 Years | 18 (14.0%) | 112 (86.8%) |
| 35 to 44 Years | 33 (12.9%) | 124 (48.4%) |
| 45 to 54 Years | 73 (47.4%) | 81 (52.6%) |
| 55 to 64 Years | 120 (35.5%) | 230 (68.0%) |
| 65 to 74 Years | 462 (98.3%) | 255 (54.3%) |
| 75 Years and over | 185 (100.0%) | 134 (72.4%) |
| Total | 1,059 (50.4%) | 1,277 (60.8%) |
Disability Status by Sex by Age in Thomaston
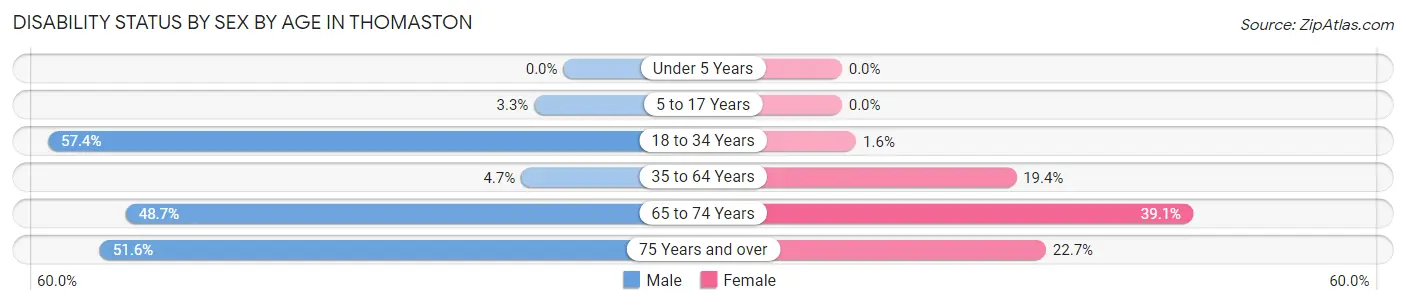
| Age Bracket | Male | Female |
| Under 5 Years | 0 (0.0%) | 0 (0.0%) |
| 5 to 17 Years | 10 (3.3%) | 0 (0.0%) |
| 18 to 34 Years | 105 (57.4%) | 2 (1.6%) |
| 35 to 64 Years | 19 (4.7%) | 67 (19.4%) |
| 65 to 74 Years | 77 (48.7%) | 122 (39.1%) |
| 75 Years and over | 16 (51.6%) | 35 (22.7%) |
Disability Class by Sex by Age in Thomaston
Disability Class: Hearing Difficulty
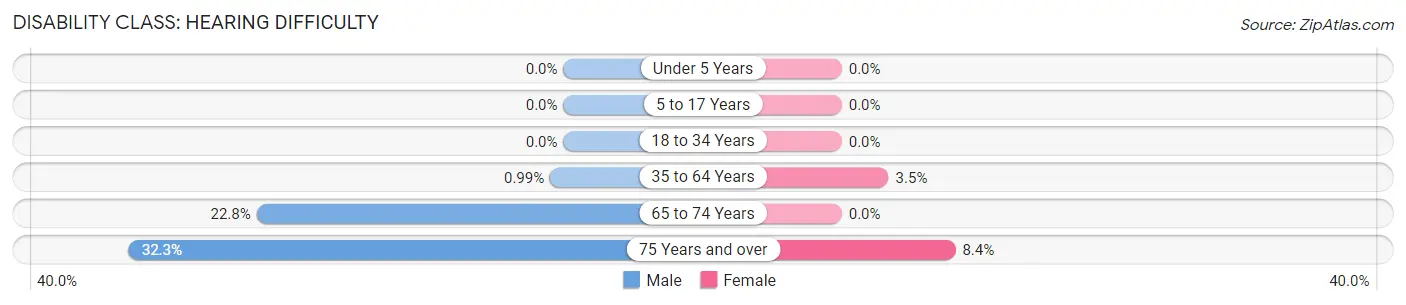
| Age Bracket | Male | Female |
| Under 5 Years | 0 (0.0%) | 0 (0.0%) |
| 5 to 17 Years | 0 (0.0%) | 0 (0.0%) |
| 18 to 34 Years | 0 (0.0%) | 0 (0.0%) |
| 35 to 64 Years | 4 (1.0%) | 12 (3.5%) |
| 65 to 74 Years | 36 (22.8%) | 0 (0.0%) |
| 75 Years and over | 10 (32.3%) | 13 (8.4%) |
Disability Class: Vision Difficulty
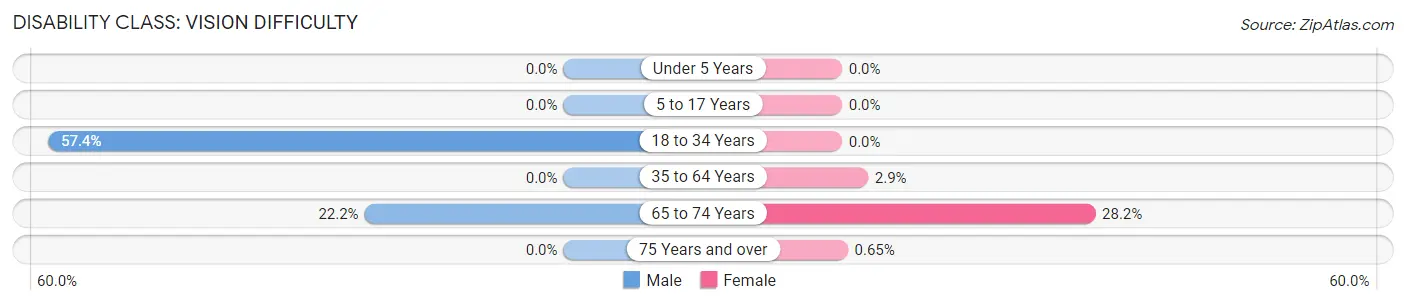
| Age Bracket | Male | Female |
| Under 5 Years | 0 (0.0%) | 0 (0.0%) |
| 5 to 17 Years | 0 (0.0%) | 0 (0.0%) |
| 18 to 34 Years | 105 (57.4%) | 0 (0.0%) |
| 35 to 64 Years | 0 (0.0%) | 10 (2.9%) |
| 65 to 74 Years | 35 (22.2%) | 88 (28.2%) |
| 75 Years and over | 0 (0.0%) | 1 (0.6%) |
Disability Class: Cognitive Difficulty
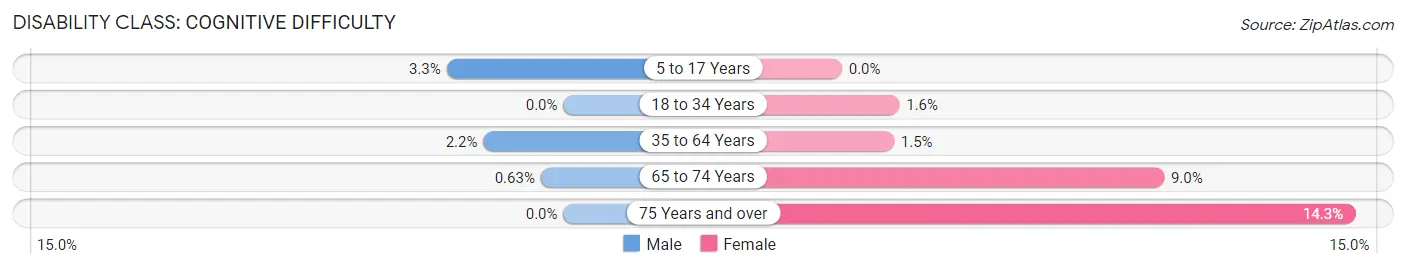
| Age Bracket | Male | Female |
| 5 to 17 Years | 10 (3.3%) | 0 (0.0%) |
| 18 to 34 Years | 0 (0.0%) | 2 (1.6%) |
| 35 to 64 Years | 9 (2.2%) | 5 (1.5%) |
| 65 to 74 Years | 1 (0.6%) | 28 (9.0%) |
| 75 Years and over | 0 (0.0%) | 22 (14.3%) |
Disability Class: Ambulatory Difficulty
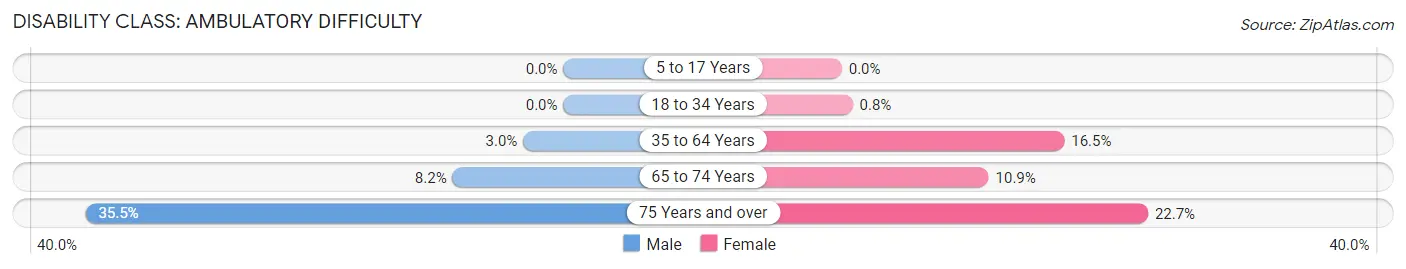
| Age Bracket | Male | Female |
| 5 to 17 Years | 0 (0.0%) | 0 (0.0%) |
| 18 to 34 Years | 0 (0.0%) | 1 (0.8%) |
| 35 to 64 Years | 12 (3.0%) | 57 (16.5%) |
| 65 to 74 Years | 13 (8.2%) | 34 (10.9%) |
| 75 Years and over | 11 (35.5%) | 35 (22.7%) |
Disability Class: Self-Care Difficulty
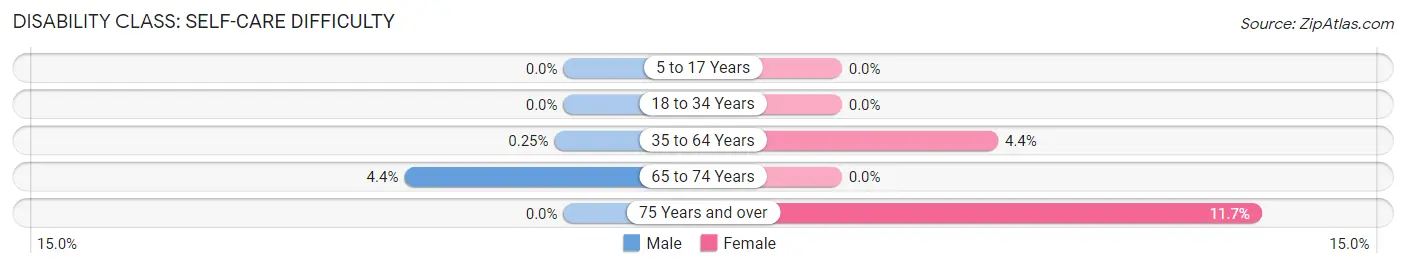
| Age Bracket | Male | Female |
| 5 to 17 Years | 0 (0.0%) | 0 (0.0%) |
| 18 to 34 Years | 0 (0.0%) | 0 (0.0%) |
| 35 to 64 Years | 1 (0.3%) | 15 (4.3%) |
| 65 to 74 Years | 7 (4.4%) | 0 (0.0%) |
| 75 Years and over | 0 (0.0%) | 18 (11.7%) |
Technology Access in Thomaston
Computing Device Access in Thomaston
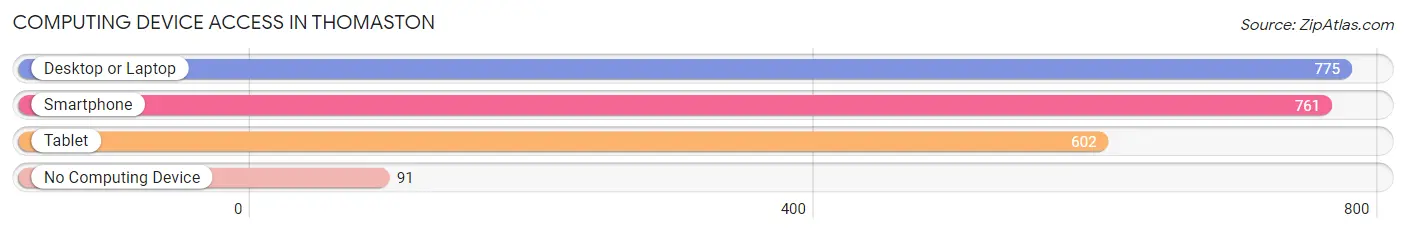
| Device Type | # Households | % Households |
| Desktop or Laptop | 775 | 81.7% |
| Smartphone | 761 | 80.2% |
| Tablet | 602 | 63.4% |
| No Computing Device | 91 | 9.6% |
| Total | 949 | 100.0% |
Internet Access in Thomaston
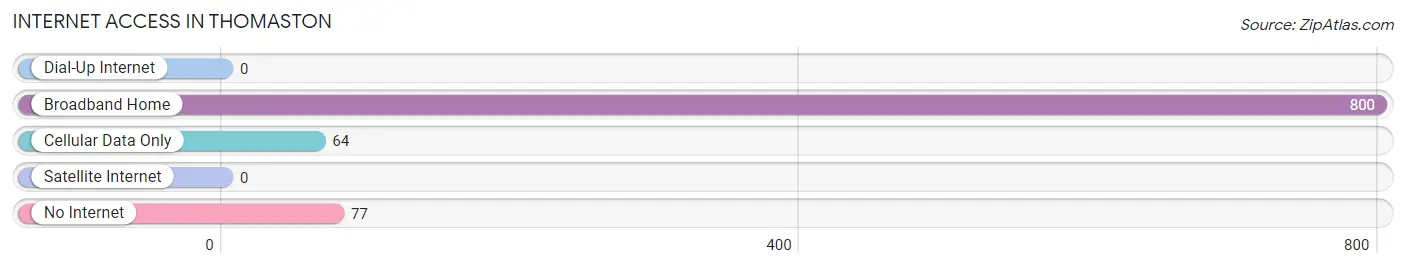
| Internet Type | # Households | % Households |
| Dial-Up Internet | 0 | 0.0% |
| Broadband Home | 800 | 84.3% |
| Cellular Data Only | 64 | 6.7% |
| Satellite Internet | 0 | 0.0% |
| No Internet | 77 | 8.1% |
| Total | 949 | 100.0% |
Thomaston Summary
Thomaston, Maine is a small town located in Knox County, Maine. It is situated on the St. George River, which is a tributary of the Penobscot River. The town was incorporated in 1777 and is the oldest town in Knox County. The population of Thomaston was 2,781 in the 2010 census.
History
Thomaston was first settled in 1717 by a group of settlers from Plymouth, Massachusetts. The town was named after General John Thomas, who was a Revolutionary War hero. The town was incorporated in 1777 and was the first town in Knox County.
In the early 19th century, Thomaston was a major shipbuilding center. The town was home to several shipyards, including the Thomaston Shipyard, which was founded in 1812. The shipyard was responsible for building many of the ships that were used in the War of 1812.
In the late 19th century, Thomaston was a major center for the granite industry. The town was home to several granite quarries, which supplied granite for many of the buildings in the area.
Geography
Thomaston is located in Knox County, Maine. It is situated on the St. George River, which is a tributary of the Penobscot River. The town is bordered by the towns of Rockland to the north, Warren to the east, and St. George to the south.
The town has a total area of 11.3 square miles, of which 10.9 square miles is land and 0.4 square miles is water. The highest point in Thomaston is the summit of Thomaston Hill, which has an elevation of 545 feet.
Economy
The economy of Thomaston is largely based on tourism and the service industry. The town is home to several restaurants, hotels, and other businesses that cater to tourists.
The town is also home to several manufacturing companies, including the Thomaston Mills, which produces textiles, and the Thomaston Boat Works, which builds boats.
Demographics
As of the 2010 census, there were 2,781 people, 1,093 households, and 745 families living in Thomaston. The population density was 254.3 people per square mile. The racial makeup of the town was 97.2% White, 0.7% African American, 0.3% Native American, 0.3% Asian, 0.1% Pacific Islander, 0.3% from other races, and 1.2% from two or more races.
The median income for a household in Thomaston was $41,944, and the median income for a family was $50,000. The per capita income for the town was $20,945. About 11.2% of families and 14.2% of the population were below the poverty line, including 18.2% of those under age 18 and 8.2% of those age 65 or over.
Common Questions
What is Per Capita Income in Thomaston?
Per Capita income in Thomaston is $27,673.
What is the Median Family Income in Thomaston?
Median Family Income in Thomaston is $60,394.
What is the Median Household income in Thomaston?
Median Household Income in Thomaston is $54,155.
What is Income or Wage Gap in Thomaston?
Income or Wage Gap in Thomaston is 11.6%.
Women in Thomaston earn 88.4 cents for every dollar earned by a man.
What is Inequality or Gini Index in Thomaston?
Inequality or Gini Index in Thomaston is 0.34.
What is the Total Population of Thomaston?
Total Population of Thomaston is 2,101.
What is the Total Male Population of Thomaston?
Total Male Population of Thomaston is 1,124.
What is the Total Female Population of Thomaston?
Total Female Population of Thomaston is 977.
What is the Ratio of Males per 100 Females in Thomaston?
There are 115.05 Males per 100 Females in Thomaston.
What is the Ratio of Females per 100 Males in Thomaston?
There are 86.92 Females per 100 Males in Thomaston.
What is the Median Population Age in Thomaston?
Median Population Age in Thomaston is 52.6 Years.
What is the Average Family Size in Thomaston
Average Family Size in Thomaston is 2.5 People.
What is the Average Household Size in Thomaston
Average Household Size in Thomaston is 2.2 People.
How Large is the Labor Force in Thomaston?
There are 1,097 People in the Labor Forcein in Thomaston.
What is the Percentage of People in the Labor Force in Thomaston?
60.2% of People are in the Labor Force in Thomaston.
What is the Unemployment Rate in Thomaston?
Unemployment Rate in Thomaston is 2.3%.