Park River, ND Map & Demographics
Park River Map
Park River Overview
$34,971
PER CAPITA INCOME
$82,353
AVG FAMILY INCOME
$70,764
AVG HOUSEHOLD INCOME
15.8%
WAGE / INCOME GAP [ % ]
84.2¢/ $1
WAGE / INCOME GAP [ $ ]
0.38
INEQUALITY / GINI INDEX
1,556
TOTAL POPULATION
753
MALE POPULATION
803
FEMALE POPULATION
93.77
MALES / 100 FEMALES
106.64
FEMALES / 100 MALES
47.2
MEDIAN AGE
3.0
AVG FAMILY SIZE
2.3
AVG HOUSEHOLD SIZE
711
LABOR FORCE [ PEOPLE ]
56.4%
PERCENT IN LABOR FORCE
1.0%
UNEMPLOYMENT RATE
Park River Zip Codes
Park River Area Codes
Income in Park River
Income Overview in Park River
Per Capita Income in Park River is $34,971, while median incomes of families and households are $82,353 and $70,764 respectively.
| Characteristic | Number | Measure |
| Per Capita Income | 1,556 | $34,971 |
| Median Family Income | 406 | $82,353 |
| Mean Family Income | 406 | $96,262 |
| Median Household Income | 639 | $70,764 |
| Mean Household Income | 639 | $81,137 |
| Income Deficit | 406 | $0 |
| Wage / Income Gap (%) | 1,556 | 15.83% |
| Wage / Income Gap ($) | 1,556 | 84.17¢ per $1 |
| Gini / Inequality Index | 1,556 | 0.38 |
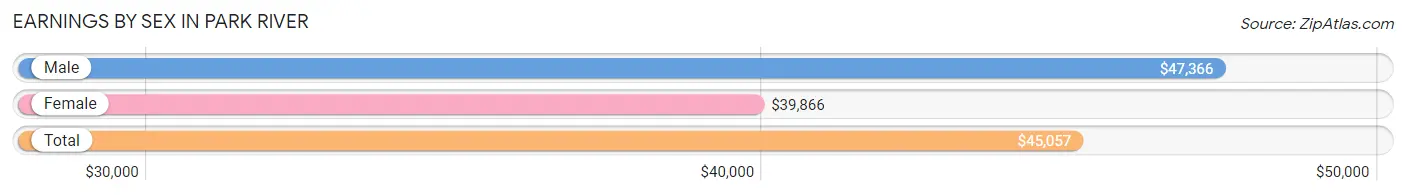
Earnings by Sex in Park River
Average Earnings in Park River are $45,057, $47,366 for men and $39,866 for women, a difference of 15.8%.
| Sex | Number | Average Earnings |
| Male | 395 (49.2%) | $47,366 |
| Female | 407 (50.7%) | $39,866 |
| Total | 802 (100.0%) | $45,057 |
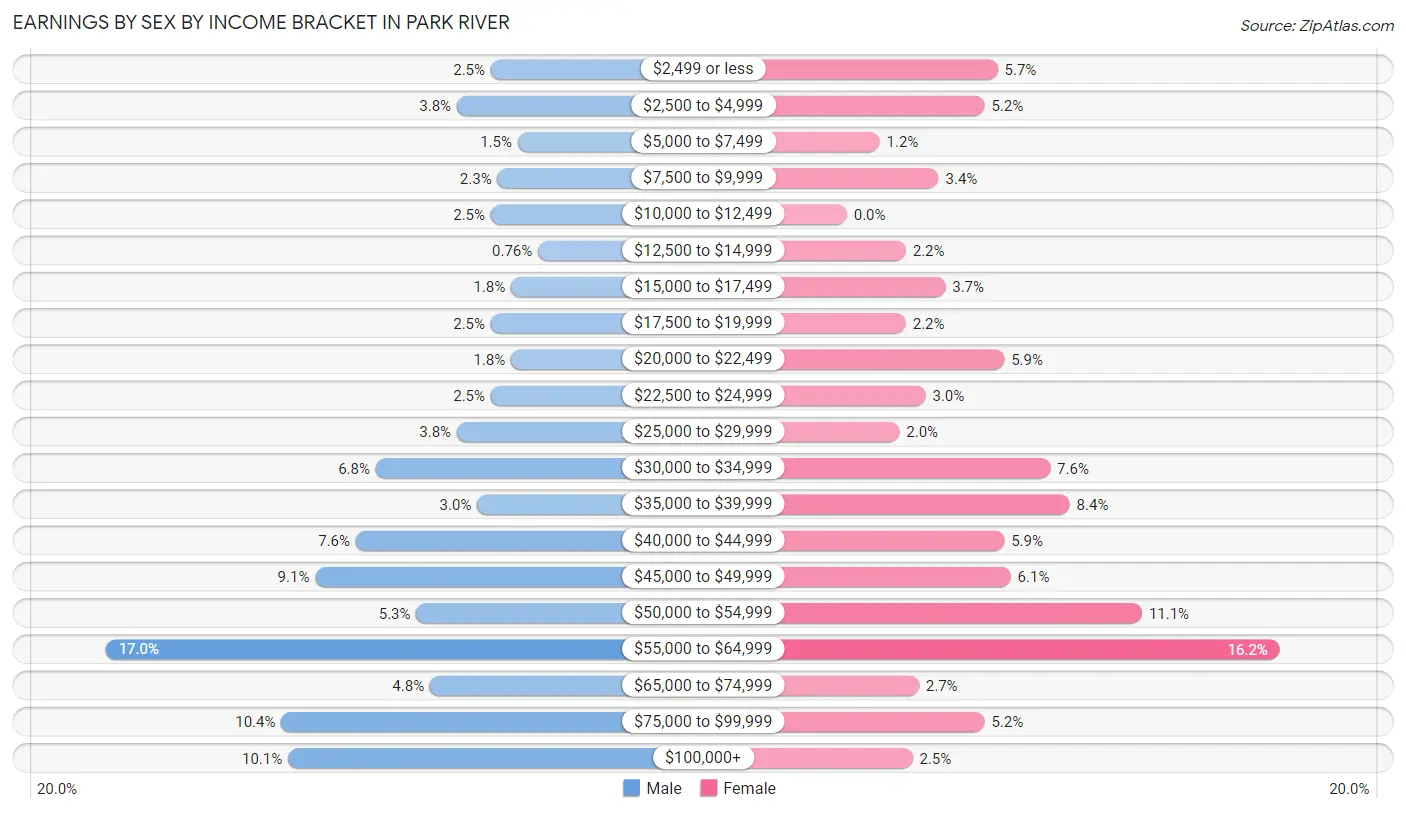
Earnings by Sex by Income Bracket in Park River
The most common earnings brackets in Park River are $55,000 to $64,999 for men (67 | 17.0%) and $55,000 to $64,999 for women (66 | 16.2%).
| Income | Male | Female |
| $2,499 or less | 10 (2.5%) | 23 (5.7%) |
| $2,500 to $4,999 | 15 (3.8%) | 21 (5.2%) |
| $5,000 to $7,499 | 6 (1.5%) | 5 (1.2%) |
| $7,500 to $9,999 | 9 (2.3%) | 14 (3.4%) |
| $10,000 to $12,499 | 10 (2.5%) | 0 (0.0%) |
| $12,500 to $14,999 | 3 (0.8%) | 9 (2.2%) |
| $15,000 to $17,499 | 7 (1.8%) | 15 (3.7%) |
| $17,500 to $19,999 | 10 (2.5%) | 9 (2.2%) |
| $20,000 to $22,499 | 7 (1.8%) | 24 (5.9%) |
| $22,500 to $24,999 | 10 (2.5%) | 12 (2.9%) |
| $25,000 to $29,999 | 15 (3.8%) | 8 (2.0%) |
| $30,000 to $34,999 | 27 (6.8%) | 31 (7.6%) |
| $35,000 to $39,999 | 12 (3.0%) | 34 (8.4%) |
| $40,000 to $44,999 | 30 (7.6%) | 24 (5.9%) |
| $45,000 to $49,999 | 36 (9.1%) | 25 (6.1%) |
| $50,000 to $54,999 | 21 (5.3%) | 45 (11.1%) |
| $55,000 to $64,999 | 67 (17.0%) | 66 (16.2%) |
| $65,000 to $74,999 | 19 (4.8%) | 11 (2.7%) |
| $75,000 to $99,999 | 41 (10.4%) | 21 (5.2%) |
| $100,000+ | 40 (10.1%) | 10 (2.5%) |
| Total | 395 (100.0%) | 407 (100.0%) |
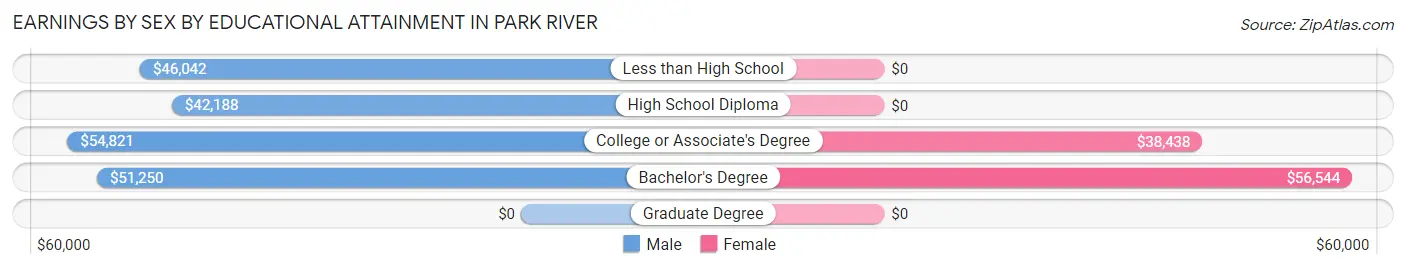
Earnings by Sex by Educational Attainment in Park River
Average earnings in Park River are $50,000 for men and $39,732 for women, a difference of 20.5%. Men with an educational attainment of college or associate's degree enjoy the highest average annual earnings of $54,821, while those with high school diploma education earn the least with $42,188. Women with an educational attainment of bachelor's degree earn the most with the average annual earnings of $56,544, while those with college or associate's degree education have the smallest earnings of $38,438.
| Educational Attainment | Male Income | Female Income |
| Less than High School | $46,042 | $0 |
| High School Diploma | $42,188 | $0 |
| College or Associate's Degree | $54,821 | $38,438 |
| Bachelor's Degree | $51,250 | $56,544 |
| Graduate Degree | - | - |
| Total | $50,000 | $39,732 |
Family Income in Park River
Family Income Brackets in Park River
According to the Park River family income data, there are 101 families falling into the $100,000 to $149,999 income range, which is the most common income bracket and makes up 24.9% of all families.
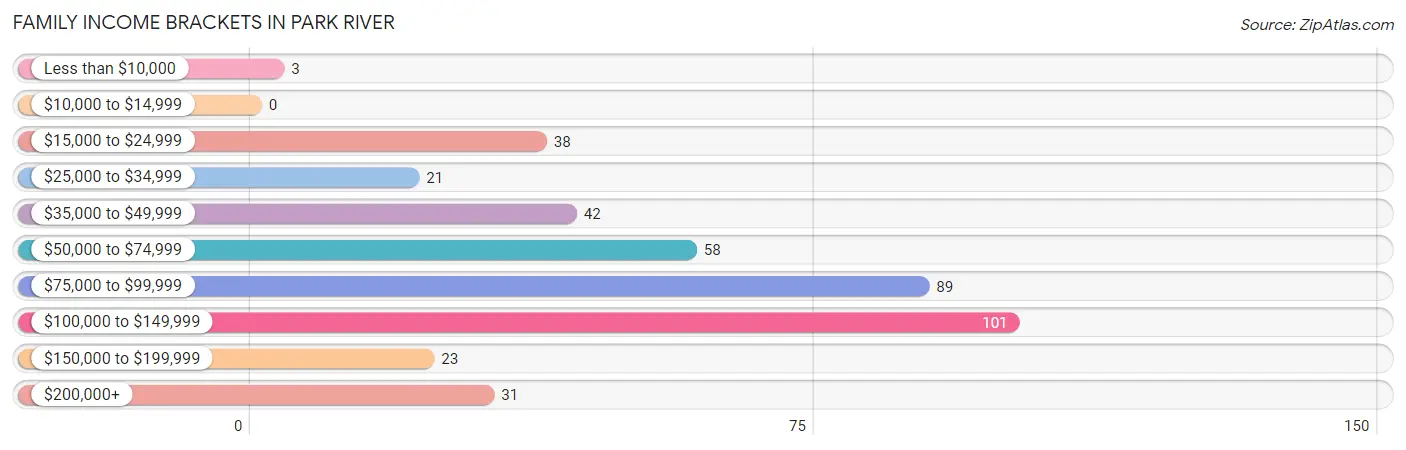
| Income Bracket | # Families | % Families |
| Less than $10,000 | 3 | 0.7% |
| $10,000 to $14,999 | 0 | 0.0% |
| $15,000 to $24,999 | 38 | 9.4% |
| $25,000 to $34,999 | 21 | 5.2% |
| $35,000 to $49,999 | 42 | 10.3% |
| $50,000 to $74,999 | 58 | 14.3% |
| $75,000 to $99,999 | 89 | 21.9% |
| $100,000 to $149,999 | 101 | 24.9% |
| $150,000 to $199,999 | 23 | 5.7% |
| $200,000+ | 31 | 7.6% |
Family Income by Famaliy Size in Park River
6-person families (17 | 4.2%) account for the highest median family income in Park River with $230,208 per family, while 6-person families (17 | 4.2%) have the highest median income of $38,368 per family member.
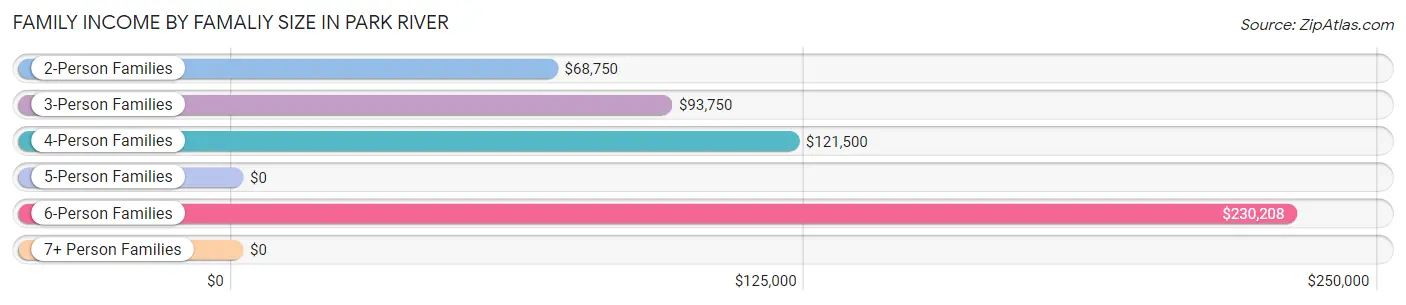
| Income Bracket | # Families | Median Income |
| 2-Person Families | 236 (58.1%) | $68,750 |
| 3-Person Families | 98 (24.1%) | $93,750 |
| 4-Person Families | 32 (7.9%) | $121,500 |
| 5-Person Families | 20 (4.9%) | $0 |
| 6-Person Families | 17 (4.2%) | $230,208 |
| 7+ Person Families | 3 (0.7%) | $0 |
| Total | 406 (100.0%) | $82,353 |
Family Income by Number of Earners in Park River
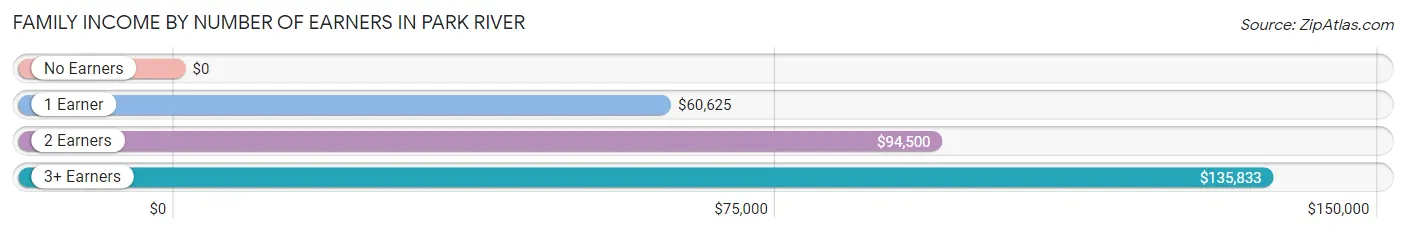
| Number of Earners | # Families | Median Income |
| No Earners | 59 (14.5%) | $0 |
| 1 Earner | 107 (26.4%) | $60,625 |
| 2 Earners | 210 (51.7%) | $94,500 |
| 3+ Earners | 30 (7.4%) | $135,833 |
| Total | 406 (100.0%) | $82,353 |
Household Income in Park River
Household Income Brackets in Park River
With 139 households falling in the category, the $50,000 to $74,999 income range is the most frequent in Park River, accounting for 21.7% of all households. In contrast, only 16 households (2.5%) fall into the $10,000 to $14,999 income bracket, making it the least populous group.
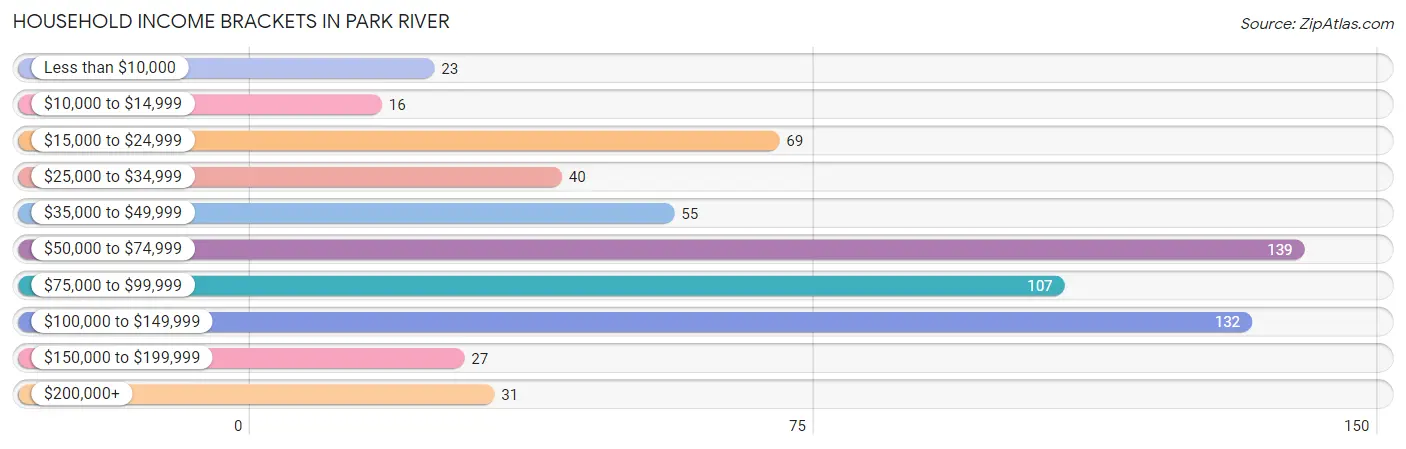
| Income Bracket | # Households | % Households |
| Less than $10,000 | 23 | 3.6% |
| $10,000 to $14,999 | 16 | 2.5% |
| $15,000 to $24,999 | 69 | 10.8% |
| $25,000 to $34,999 | 40 | 6.3% |
| $35,000 to $49,999 | 55 | 8.6% |
| $50,000 to $74,999 | 139 | 21.8% |
| $75,000 to $99,999 | 107 | 16.7% |
| $100,000 to $149,999 | 132 | 20.7% |
| $150,000 to $199,999 | 27 | 4.2% |
| $200,000+ | 31 | 4.9% |
Household Income by Householder Age in Park River
The median household income in Park River is $70,764, with the highest median household income of $81,979 found in the 45 to 64 years age bracket for the primary householder. A total of 181 households (28.3%) fall into this category. Meanwhile, the 15 to 24 years age bracket for the primary householder has the lowest median household income of $0, with 28 households (4.4%) in this group.
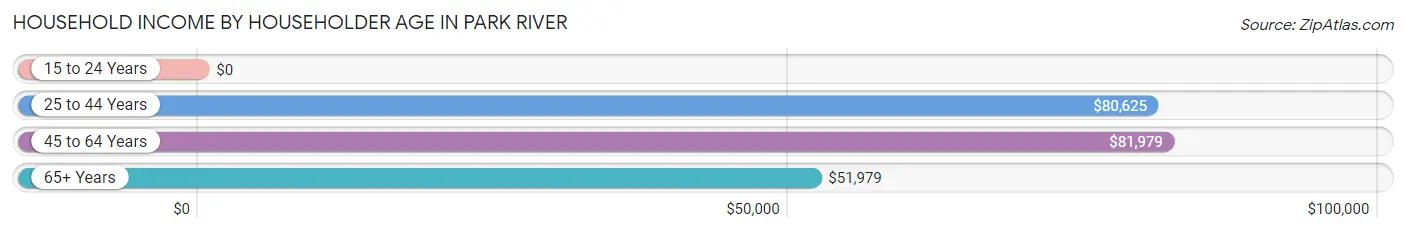
| Income Bracket | # Households | Median Income |
| 15 to 24 Years | 28 (4.4%) | $0 |
| 25 to 44 Years | 175 (27.4%) | $80,625 |
| 45 to 64 Years | 181 (28.3%) | $81,979 |
| 65+ Years | 255 (39.9%) | $51,979 |
| Total | 639 (100.0%) | $70,764 |
Poverty in Park River
Income Below Poverty by Sex and Age in Park River
With 5.2% poverty level for males and 13.6% for females among the residents of Park River, 18 to 24 year old males and 45 to 54 year old females are the most vulnerable to poverty, with 9 males (21.4%) and 45 females (38.1%) in their respective age groups living below the poverty level.
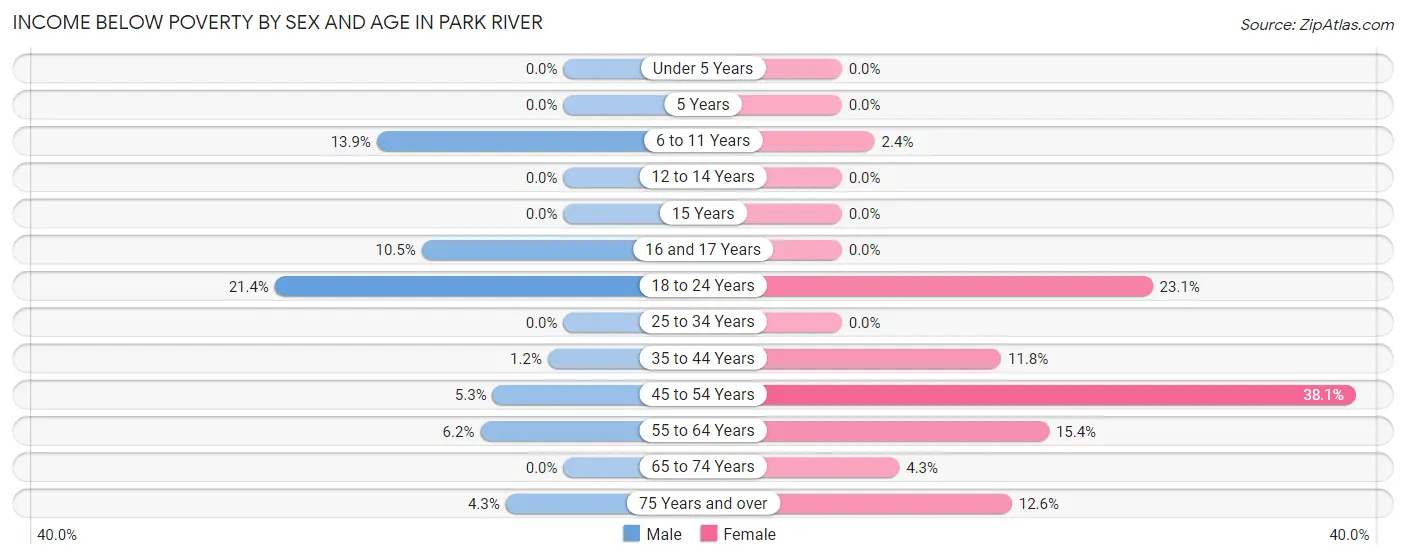
| Age Bracket | Male | Female |
| Under 5 Years | 0 (0.0%) | 0 (0.0%) |
| 5 Years | 0 (0.0%) | 0 (0.0%) |
| 6 to 11 Years | 14 (13.9%) | 1 (2.4%) |
| 12 to 14 Years | 0 (0.0%) | 0 (0.0%) |
| 15 Years | 0 (0.0%) | 0 (0.0%) |
| 16 and 17 Years | 2 (10.5%) | 0 (0.0%) |
| 18 to 24 Years | 9 (21.4%) | 15 (23.1%) |
| 25 to 34 Years | 0 (0.0%) | 0 (0.0%) |
| 35 to 44 Years | 1 (1.2%) | 11 (11.8%) |
| 45 to 54 Years | 4 (5.3%) | 45 (38.1%) |
| 55 to 64 Years | 5 (6.2%) | 12 (15.4%) |
| 65 to 74 Years | 0 (0.0%) | 5 (4.3%) |
| 75 Years and over | 3 (4.3%) | 13 (12.6%) |
| Total | 38 (5.2%) | 102 (13.6%) |
Income Above Poverty by Sex and Age in Park River
According to the poverty statistics in Park River, males aged under 5 years and females aged under 5 years are the age groups that are most secure financially, with 100.0% of males and 100.0% of females in these age groups living above the poverty line.
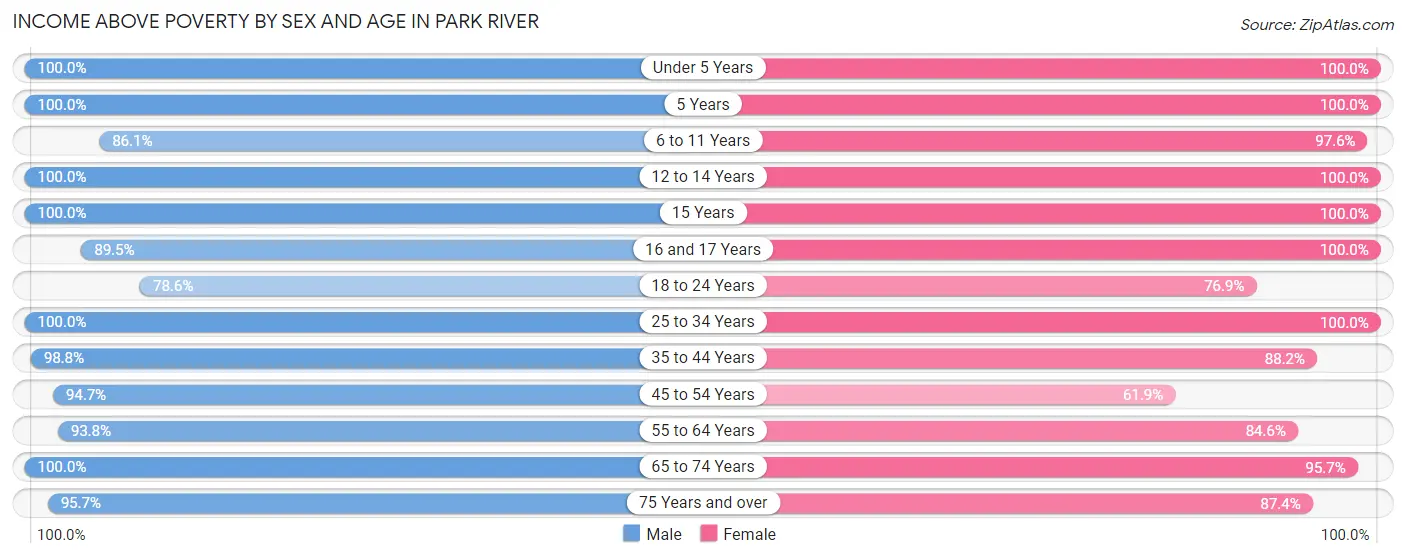
| Age Bracket | Male | Female |
| Under 5 Years | 37 (100.0%) | 28 (100.0%) |
| 5 Years | 26 (100.0%) | 5 (100.0%) |
| 6 to 11 Years | 87 (86.1%) | 40 (97.6%) |
| 12 to 14 Years | 34 (100.0%) | 13 (100.0%) |
| 15 Years | 2 (100.0%) | 8 (100.0%) |
| 16 and 17 Years | 17 (89.5%) | 15 (100.0%) |
| 18 to 24 Years | 33 (78.6%) | 50 (76.9%) |
| 25 to 34 Years | 68 (100.0%) | 68 (100.0%) |
| 35 to 44 Years | 85 (98.8%) | 82 (88.2%) |
| 45 to 54 Years | 72 (94.7%) | 73 (61.9%) |
| 55 to 64 Years | 76 (93.8%) | 66 (84.6%) |
| 65 to 74 Years | 95 (100.0%) | 112 (95.7%) |
| 75 Years and over | 67 (95.7%) | 90 (87.4%) |
| Total | 699 (94.8%) | 650 (86.4%) |
Income Below Poverty Among Married-Couple Families in Park River
The poverty statistics for married-couple families in Park River show that 0.3% or 1 of the total 306 families live below the poverty line. Families with no children have the highest poverty rate of 0.5%, comprising of 1 families. On the other hand, families with 1 or 2 children have the lowest poverty rate of 0.0%, which includes 0 families.
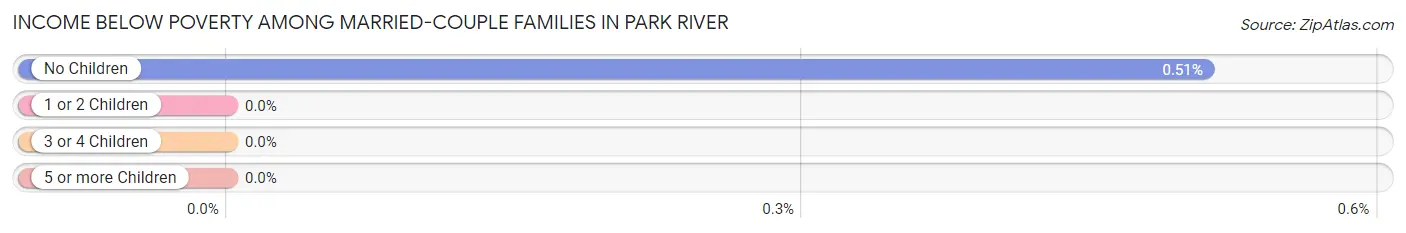
| Children | Above Poverty | Below Poverty |
| No Children | 194 (99.5%) | 1 (0.5%) |
| 1 or 2 Children | 75 (100.0%) | 0 (0.0%) |
| 3 or 4 Children | 33 (100.0%) | 0 (0.0%) |
| 5 or more Children | 3 (100.0%) | 0 (0.0%) |
| Total | 305 (99.7%) | 1 (0.3%) |
Income Below Poverty Among Single-Parent Households in Park River
According to the poverty data in Park River, 7.7% or 2 single-father households and 25.7% or 19 single-mother households are living below the poverty line. Among single-father households, those with 1 or 2 children have the highest poverty rate, with 2 households (7.7%) experiencing poverty. Likewise, among single-mother households, those with no children have the highest poverty rate, with 9 households (28.1%) falling below the poverty line.
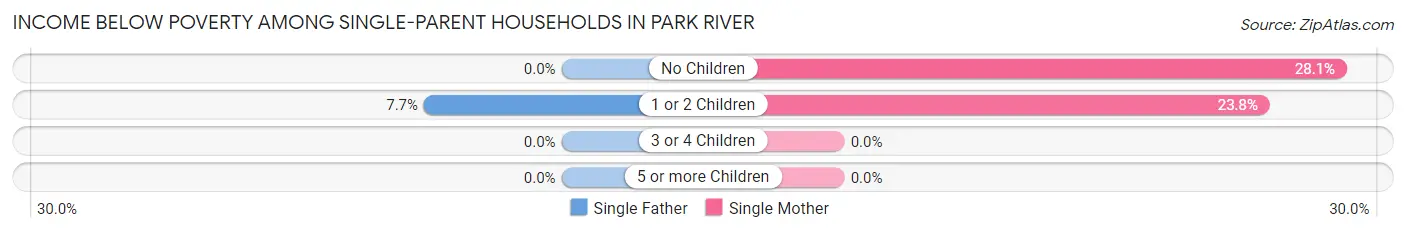
| Children | Single Father | Single Mother |
| No Children | 0 (0.0%) | 9 (28.1%) |
| 1 or 2 Children | 2 (7.7%) | 10 (23.8%) |
| 3 or 4 Children | 0 (0.0%) | 0 (0.0%) |
| 5 or more Children | 0 (0.0%) | 0 (0.0%) |
| Total | 2 (7.7%) | 19 (25.7%) |
Income Below Poverty Among Married-Couple vs Single-Parent Households in Park River
The poverty data for Park River shows that 1 of the married-couple family households (0.3%) and 21 of the single-parent households (21.0%) are living below the poverty level. Within the married-couple family households, those with no children have the highest poverty rate, with 1 households (0.5%) falling below the poverty line. Among the single-parent households, those with no children have the highest poverty rate, with 9 household (28.1%) living below poverty.
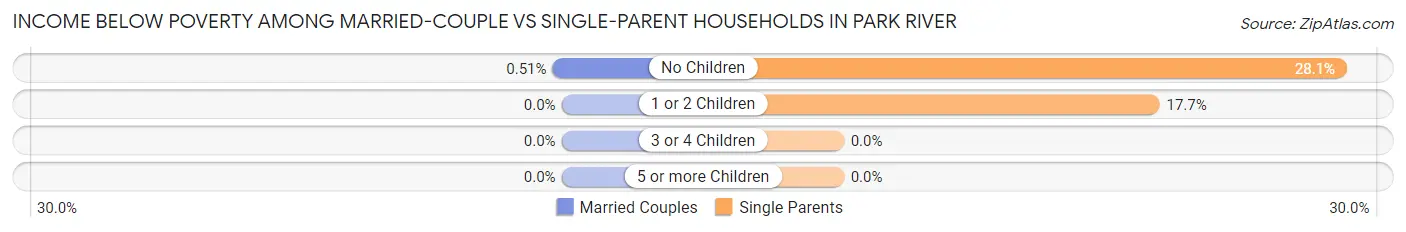
| Children | Married-Couple Families | Single-Parent Households |
| No Children | 1 (0.5%) | 9 (28.1%) |
| 1 or 2 Children | 0 (0.0%) | 12 (17.6%) |
| 3 or 4 Children | 0 (0.0%) | 0 (0.0%) |
| 5 or more Children | 0 (0.0%) | 0 (0.0%) |
| Total | 1 (0.3%) | 21 (21.0%) |
Race in Park River
The most populous races in Park River are White / Caucasian (1,464 | 94.1%), Two or more Races (46 | 3.0%), and Native / Alaskan (45 | 2.9%).
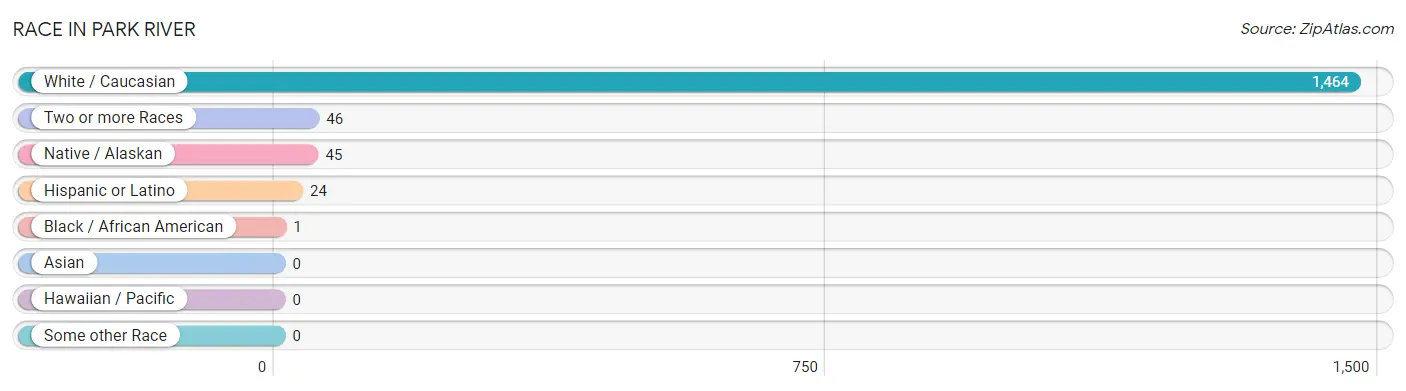
| Race | # Population | % Population |
| Asian | 0 | 0.0% |
| Black / African American | 1 | 0.1% |
| Hawaiian / Pacific | 0 | 0.0% |
| Hispanic or Latino | 24 | 1.5% |
| Native / Alaskan | 45 | 2.9% |
| White / Caucasian | 1,464 | 94.1% |
| Two or more Races | 46 | 3.0% |
| Some other Race | 0 | 0.0% |
| Total | 1,556 | 100.0% |
Ancestry in Park River
The most populous ancestries reported in Park River are Norwegian (646 | 41.5%), German (320 | 20.6%), Czech (146 | 9.4%), Swedish (69 | 4.4%), and English (68 | 4.4%), together accounting for 80.3% of all Park River residents.
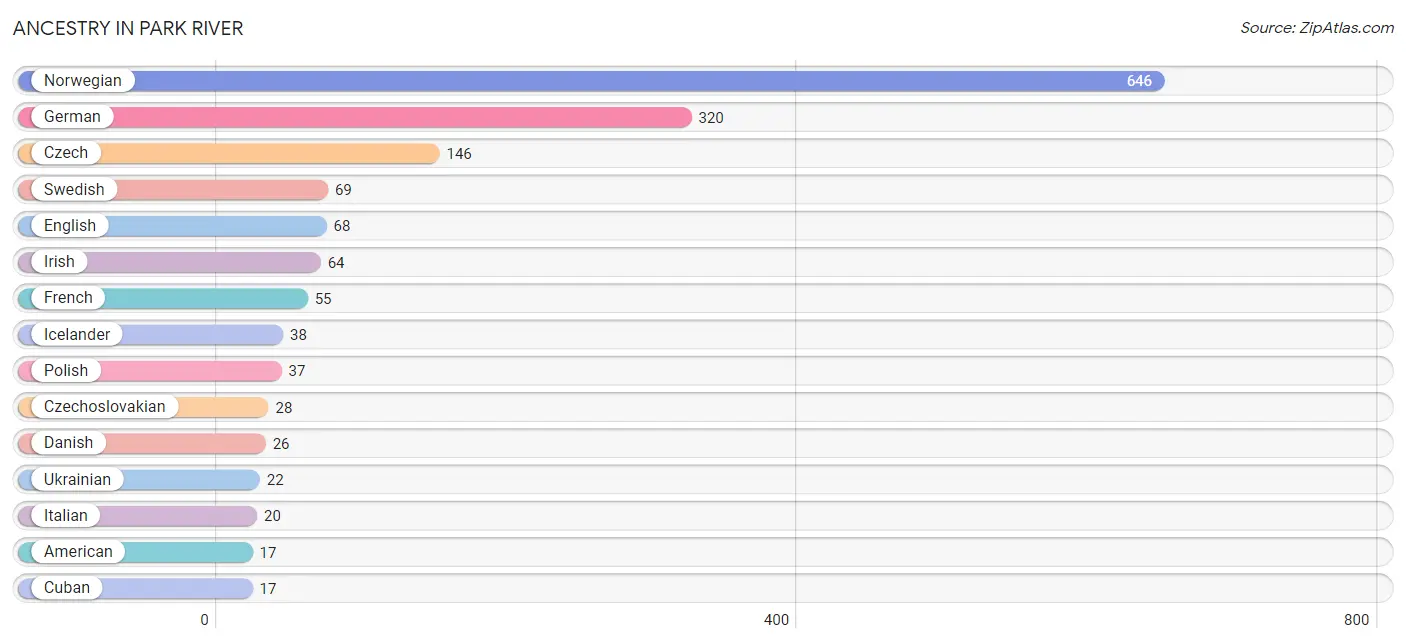
| Ancestry | # Population | % Population |
| American | 17 | 1.1% |
| Austrian | 1 | 0.1% |
| British | 5 | 0.3% |
| Cuban | 17 | 1.1% |
| Czech | 146 | 9.4% |
| Czechoslovakian | 28 | 1.8% |
| Danish | 26 | 1.7% |
| Dutch | 3 | 0.2% |
| English | 68 | 4.4% |
| European | 8 | 0.5% |
| Finnish | 5 | 0.3% |
| French | 55 | 3.5% |
| French American Indian | 15 | 1.0% |
| French Canadian | 11 | 0.7% |
| German | 320 | 20.6% |
| Icelander | 38 | 2.4% |
| Irish | 64 | 4.1% |
| Italian | 20 | 1.3% |
| Korean | 8 | 0.5% |
| Norwegian | 646 | 41.5% |
| Polish | 37 | 2.4% |
| Puerto Rican | 7 | 0.4% |
| Romanian | 5 | 0.3% |
| Russian | 5 | 0.3% |
| Scotch-Irish | 3 | 0.2% |
| Scottish | 5 | 0.3% |
| Serbian | 4 | 0.3% |
| Swedish | 69 | 4.4% |
| Ukrainian | 22 | 1.4% | View All 29 Rows |
Immigrants in Park River
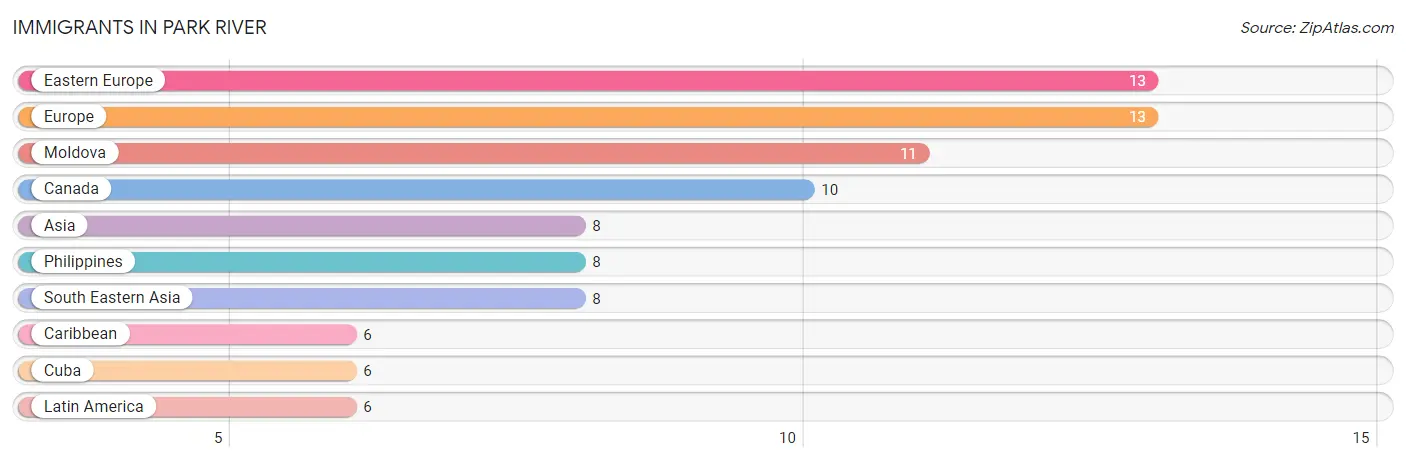
The most numerous immigrant groups reported in Park River came from Eastern Europe (13 | 0.8%), Europe (13 | 0.8%), Moldova (11 | 0.7%), Canada (10 | 0.6%), and Asia (8 | 0.5%), together accounting for 3.5% of all Park River residents.
| Immigration Origin | # Population | % Population |
| Asia | 8 | 0.5% |
| Canada | 10 | 0.6% |
| Caribbean | 6 | 0.4% |
| Cuba | 6 | 0.4% |
| Eastern Europe | 13 | 0.8% |
| Europe | 13 | 0.8% |
| Latin America | 6 | 0.4% |
| Moldova | 11 | 0.7% |
| Philippines | 8 | 0.5% |
| South Eastern Asia | 8 | 0.5% | View All 10 Rows |
Sex and Age in Park River
Sex and Age in Park River
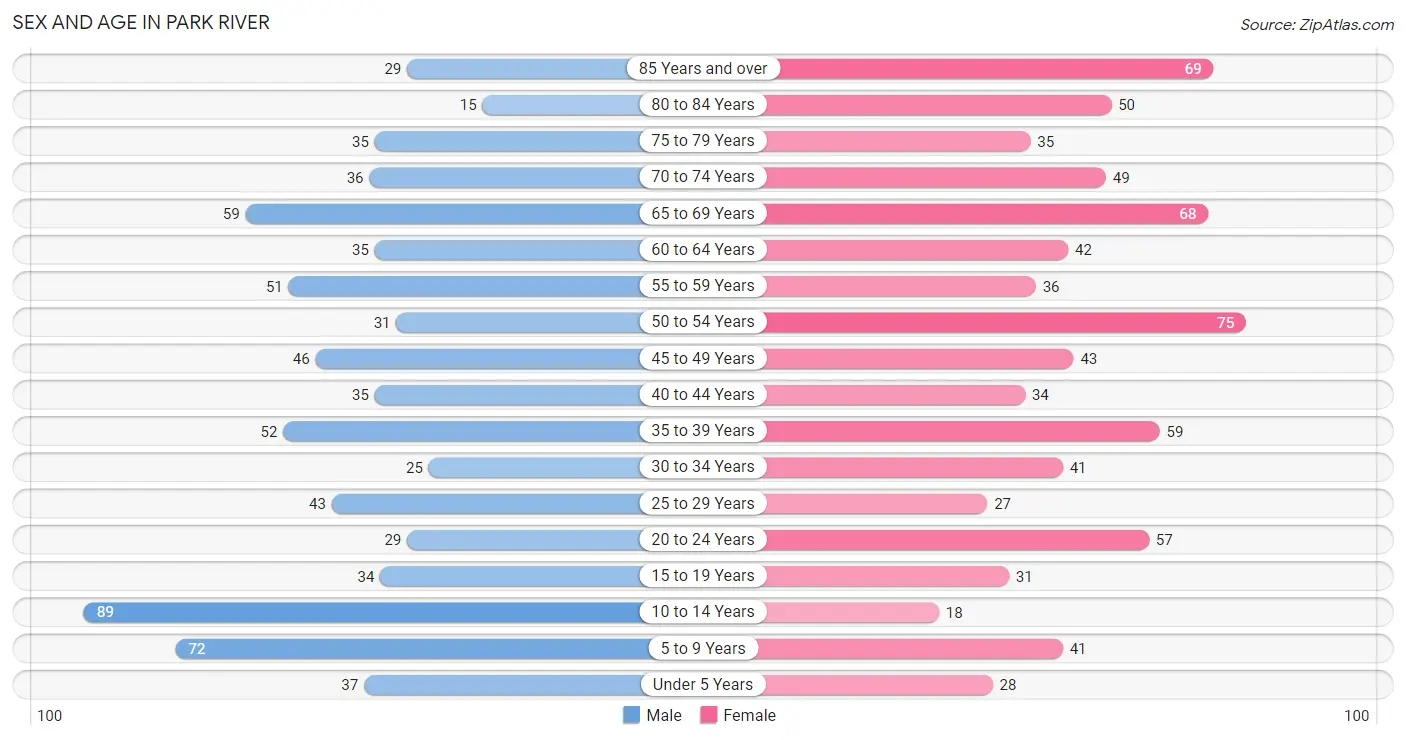
The most populous age groups in Park River are 10 to 14 Years (89 | 11.8%) for men and 50 to 54 Years (75 | 9.3%) for women.
| Age Bracket | Male | Female |
| Under 5 Years | 37 (4.9%) | 28 (3.5%) |
| 5 to 9 Years | 72 (9.6%) | 41 (5.1%) |
| 10 to 14 Years | 89 (11.8%) | 18 (2.2%) |
| 15 to 19 Years | 34 (4.5%) | 31 (3.9%) |
| 20 to 24 Years | 29 (3.8%) | 57 (7.1%) |
| 25 to 29 Years | 43 (5.7%) | 27 (3.4%) |
| 30 to 34 Years | 25 (3.3%) | 41 (5.1%) |
| 35 to 39 Years | 52 (6.9%) | 59 (7.3%) |
| 40 to 44 Years | 35 (4.6%) | 34 (4.2%) |
| 45 to 49 Years | 46 (6.1%) | 43 (5.3%) |
| 50 to 54 Years | 31 (4.1%) | 75 (9.3%) |
| 55 to 59 Years | 51 (6.8%) | 36 (4.5%) |
| 60 to 64 Years | 35 (4.6%) | 42 (5.2%) |
| 65 to 69 Years | 59 (7.8%) | 68 (8.5%) |
| 70 to 74 Years | 36 (4.8%) | 49 (6.1%) |
| 75 to 79 Years | 35 (4.6%) | 35 (4.4%) |
| 80 to 84 Years | 15 (2.0%) | 50 (6.2%) |
| 85 Years and over | 29 (3.8%) | 69 (8.6%) |
| Total | 753 (100.0%) | 803 (100.0%) |
Families and Households in Park River
Median Family Size in Park River
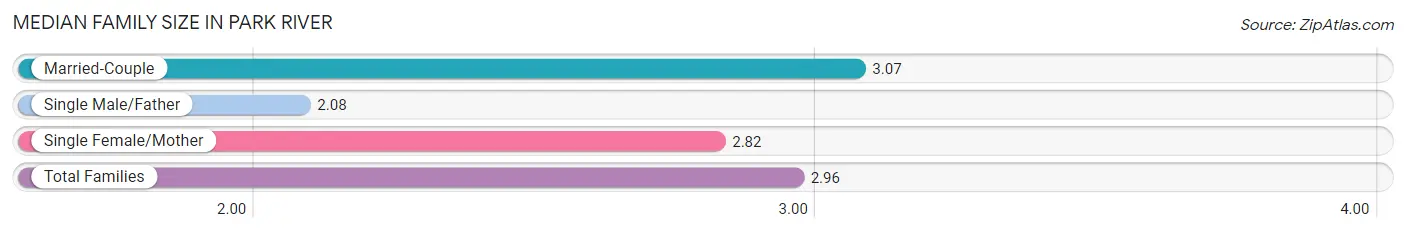
The median family size in Park River is 2.96 persons per family, with married-couple families (306 | 75.4%) accounting for the largest median family size of 3.07 persons per family. On the other hand, single male/father families (26 | 6.4%) represent the smallest median family size with 2.08 persons per family.
| Family Type | # Families | Family Size |
| Married-Couple | 306 (75.4%) | 3.07 |
| Single Male/Father | 26 (6.4%) | 2.08 |
| Single Female/Mother | 74 (18.2%) | 2.82 |
| Total Families | 406 (100.0%) | 2.96 |
Median Household Size in Park River
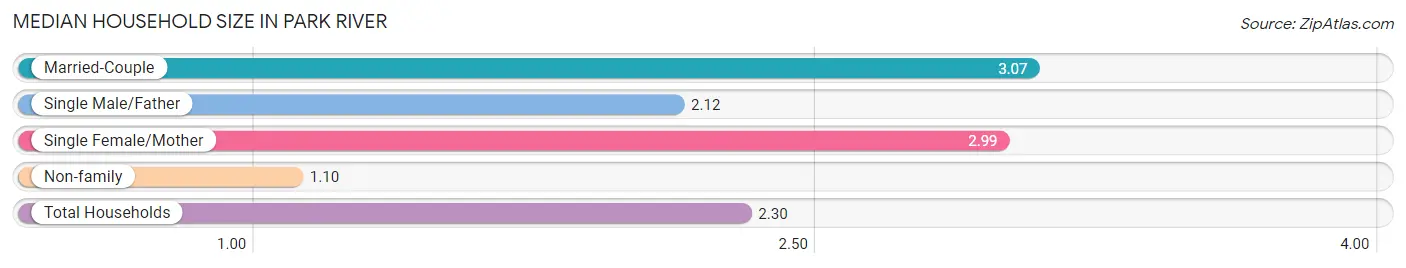
The median household size in Park River is 2.30 persons per household, with married-couple households (306 | 47.9%) accounting for the largest median household size of 3.07 persons per household. non-family households (233 | 36.5%) represent the smallest median household size with 1.10 persons per household.
| Household Type | # Households | Household Size |
| Married-Couple | 306 (47.9%) | 3.07 |
| Single Male/Father | 26 (4.1%) | 2.12 |
| Single Female/Mother | 74 (11.6%) | 2.99 |
| Non-family | 233 (36.5%) | 1.10 |
| Total Households | 639 (100.0%) | 2.30 |
Household Size by Marriage Status in Park River
Out of a total of 639 households in Park River, 406 (63.5%) are family households, while 233 (36.5%) are nonfamily households. The most numerous type of family households are 2-person households, comprising 218, and the most common type of nonfamily households are 1-person households, comprising 202.
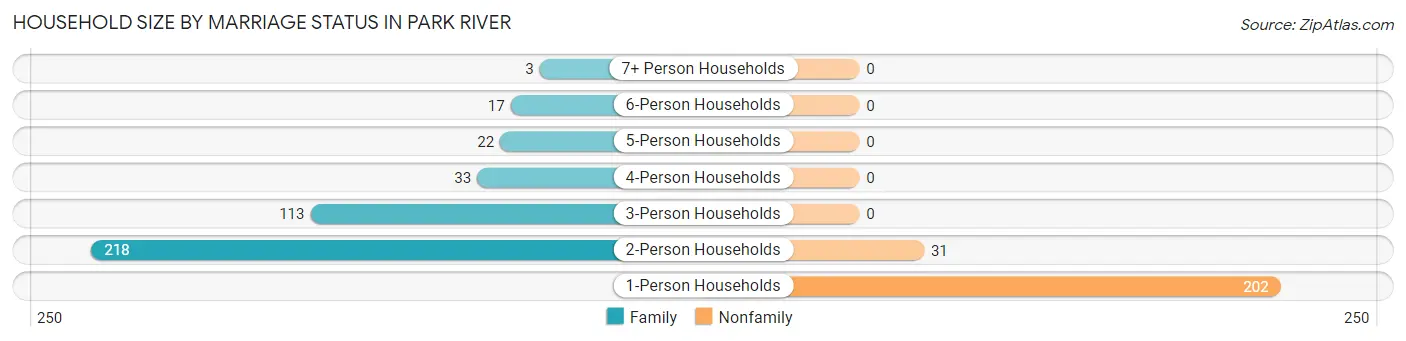
| Household Size | Family Households | Nonfamily Households |
| 1-Person Households | - | 202 (31.6%) |
| 2-Person Households | 218 (34.1%) | 31 (4.9%) |
| 3-Person Households | 113 (17.7%) | 0 (0.0%) |
| 4-Person Households | 33 (5.2%) | 0 (0.0%) |
| 5-Person Households | 22 (3.4%) | 0 (0.0%) |
| 6-Person Households | 17 (2.7%) | 0 (0.0%) |
| 7+ Person Households | 3 (0.5%) | 0 (0.0%) |
| Total | 406 (63.5%) | 233 (36.5%) |
Female Fertility in Park River
Fertility by Age in Park River
Average fertility rate in Park River is 55.0 births per 1,000 women. Women in the age bracket of 20 to 34 years have the highest fertility rate with 72.0 births per 1,000 women. Women in the age bracket of 20 to 34 years acount for 56.2% of all women with births.
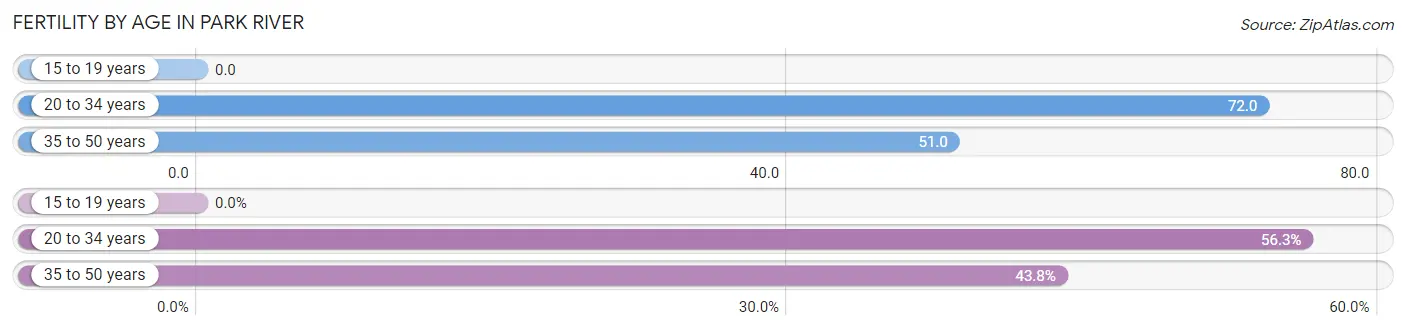
| Age Bracket | Women with Births | Births / 1,000 Women |
| 15 to 19 years | 0 (0.0%) | 0.0 |
| 20 to 34 years | 9 (56.2%) | 72.0 |
| 35 to 50 years | 7 (43.8%) | 51.0 |
| Total | 16 (100.0%) | 55.0 |
Fertility by Age by Marriage Status in Park River
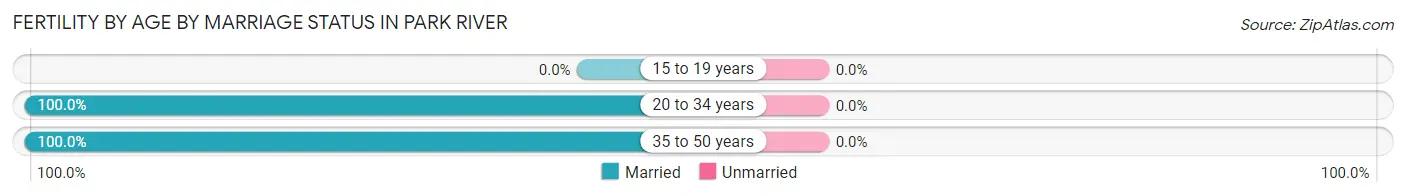
| Age Bracket | Married | Unmarried |
| 15 to 19 years | 0 (0.0%) | 0 (0.0%) |
| 20 to 34 years | 9 (100.0%) | 0 (0.0%) |
| 35 to 50 years | 7 (100.0%) | 0 (0.0%) |
| Total | 16 (100.0%) | 0 (0.0%) |
Fertility by Education in Park River
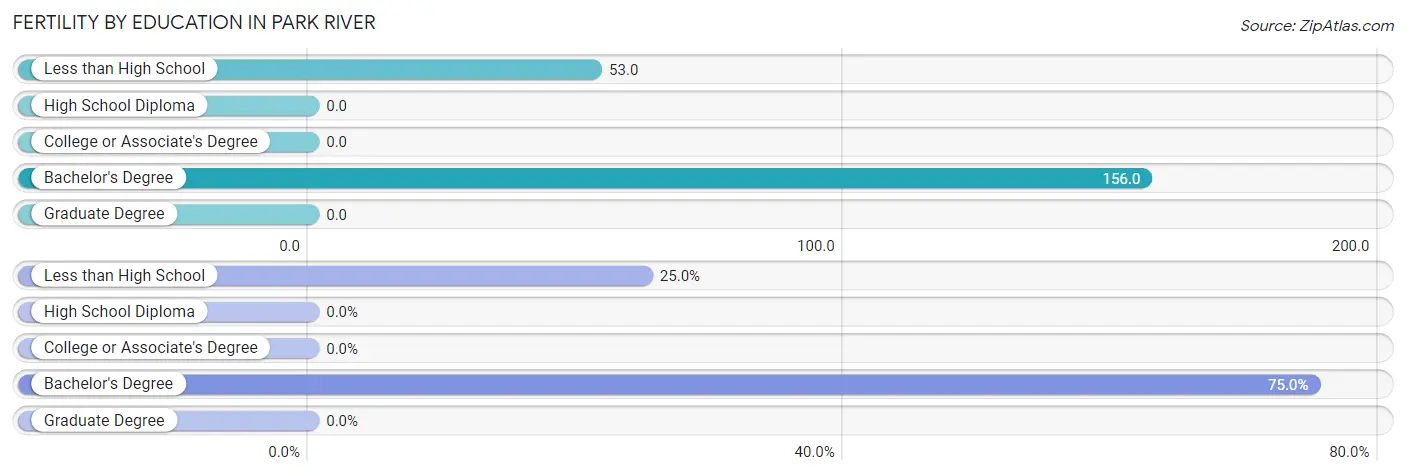
| Educational Attainment | Women with Births | Births / 1,000 Women |
| Less than High School | 4 (25.0%) | 53.0 |
| High School Diploma | 0 (0.0%) | 0.0 |
| College or Associate's Degree | 0 (0.0%) | 0.0 |
| Bachelor's Degree | 12 (75.0%) | 156.0 |
| Graduate Degree | 0 (0.0%) | 0.0 |
| Total | 16 (100.0%) | 55.0 |
Fertility by Education by Marriage Status in Park River
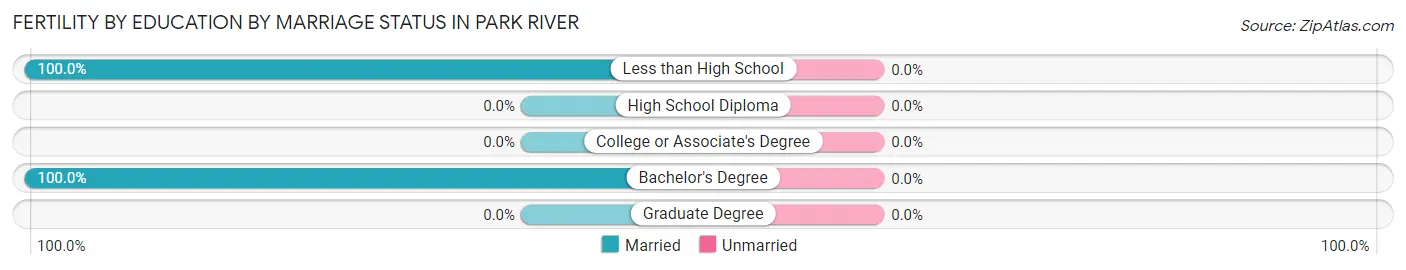
| Educational Attainment | Married | Unmarried |
| Less than High School | 4 (100.0%) | 0 (0.0%) |
| High School Diploma | 0 (0.0%) | 0 (0.0%) |
| College or Associate's Degree | 0 (0.0%) | 0 (0.0%) |
| Bachelor's Degree | 12 (100.0%) | 0 (0.0%) |
| Graduate Degree | 0 (0.0%) | 0 (0.0%) |
| Total | 16 (100.0%) | 0 (0.0%) |
Employment Characteristics in Park River
Employment by Class of Employer in Park River
Among the 694 employed individuals in Park River, private company employees (356 | 51.3%), not-for-profit organizations (103 | 14.8%), and self-employed (not incorporated) (81 | 11.7%) make up the most common classes of employment.
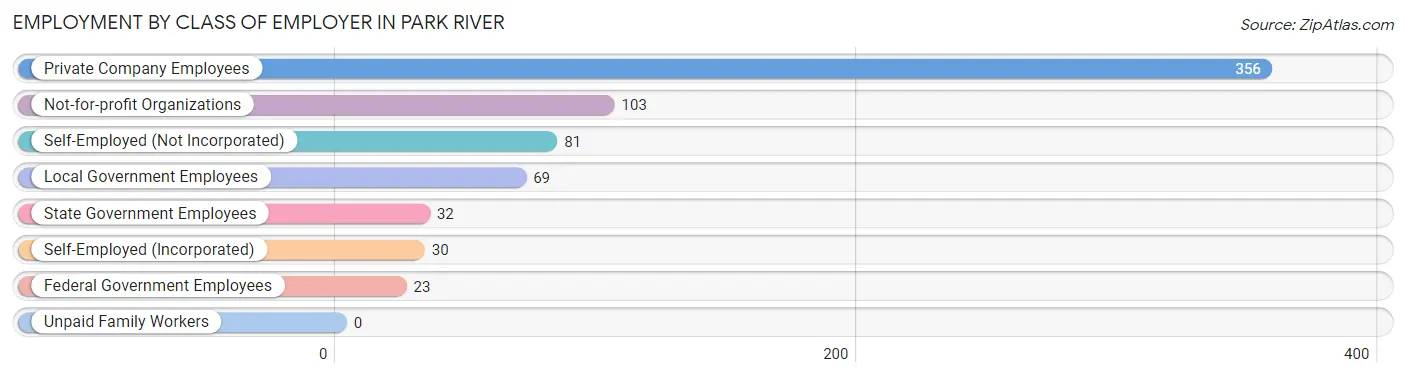
| Employer Class | # Employees | % Employees |
| Private Company Employees | 356 | 51.3% |
| Self-Employed (Incorporated) | 30 | 4.3% |
| Self-Employed (Not Incorporated) | 81 | 11.7% |
| Not-for-profit Organizations | 103 | 14.8% |
| Local Government Employees | 69 | 9.9% |
| State Government Employees | 32 | 4.6% |
| Federal Government Employees | 23 | 3.3% |
| Unpaid Family Workers | 0 | 0.0% |
| Total | 694 | 100.0% |
Employment Status by Age in Park River
According to the labor force statistics for Park River, out of the total population over 16 years of age (1,261), 56.4% or 711 individuals are in the labor force, with 1.0% or 7 of them unemployed. The age group with the highest labor force participation rate is 25 to 29 years, with 95.7% or 67 individuals in the labor force. Within the labor force, the 45 to 54 years age range has the highest percentage of unemployed individuals, with 3.3% or 4 of them being unemployed.
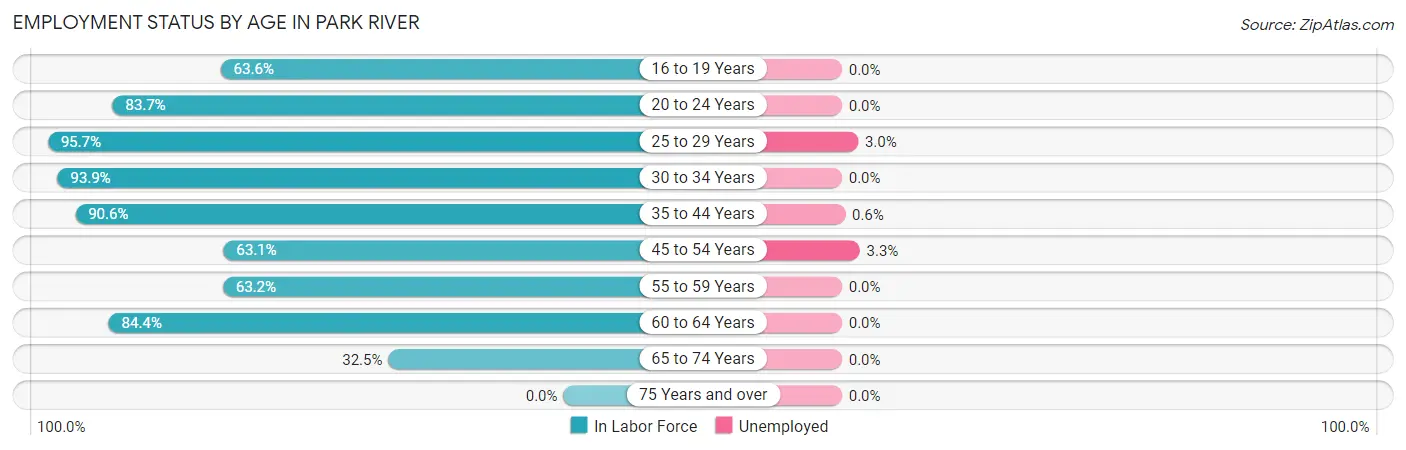
| Age Bracket | In Labor Force | Unemployed |
| 16 to 19 Years | 35 (63.6%) | 0 (0.0%) |
| 20 to 24 Years | 72 (83.7%) | 0 (0.0%) |
| 25 to 29 Years | 67 (95.7%) | 2 (3.0%) |
| 30 to 34 Years | 62 (93.9%) | 0 (0.0%) |
| 35 to 44 Years | 163 (90.6%) | 1 (0.6%) |
| 45 to 54 Years | 123 (63.1%) | 4 (3.3%) |
| 55 to 59 Years | 55 (63.2%) | 0 (0.0%) |
| 60 to 64 Years | 65 (84.4%) | 0 (0.0%) |
| 65 to 74 Years | 69 (32.5%) | 0 (0.0%) |
| 75 Years and over | 0 (0.0%) | 0 (0.0%) |
| Total | 711 (56.4%) | 7 (1.0%) |
Employment Status by Educational Attainment in Park River
According to labor force statistics for Park River, 79.3% of individuals (535) out of the total population between 25 and 64 years of age (675) are in the labor force, with 1.3% or 7 of them being unemployed. The group with the highest labor force participation rate are those with the educational attainment of bachelor's degree or higher, with 98.6% or 145 individuals in the labor force. Within the labor force, individuals with bachelor's degree or higher education have the highest percentage of unemployment, with 3.4% or 5 of them being unemployed.
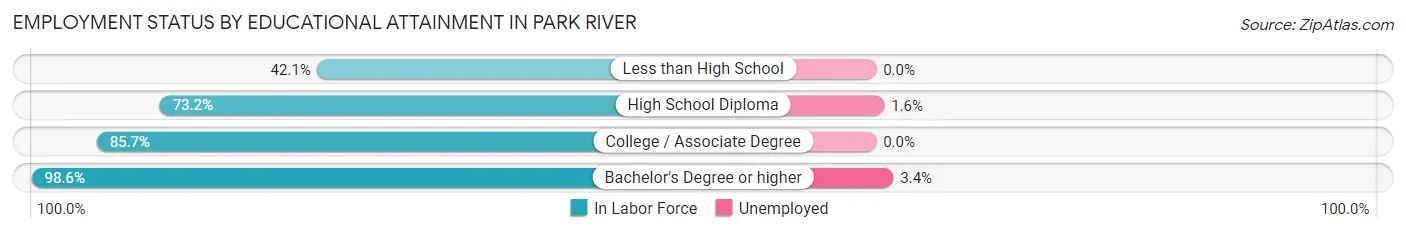
| Educational Attainment | In Labor Force | Unemployed |
| Less than High School | 40 (42.1%) | 0 (0.0%) |
| High School Diploma | 123 (73.2%) | 3 (1.6%) |
| College / Associate Degree | 227 (85.7%) | 0 (0.0%) |
| Bachelor's Degree or higher | 145 (98.6%) | 5 (3.4%) |
| Total | 535 (79.3%) | 9 (1.3%) |
Employment Occupations by Sex in Park River
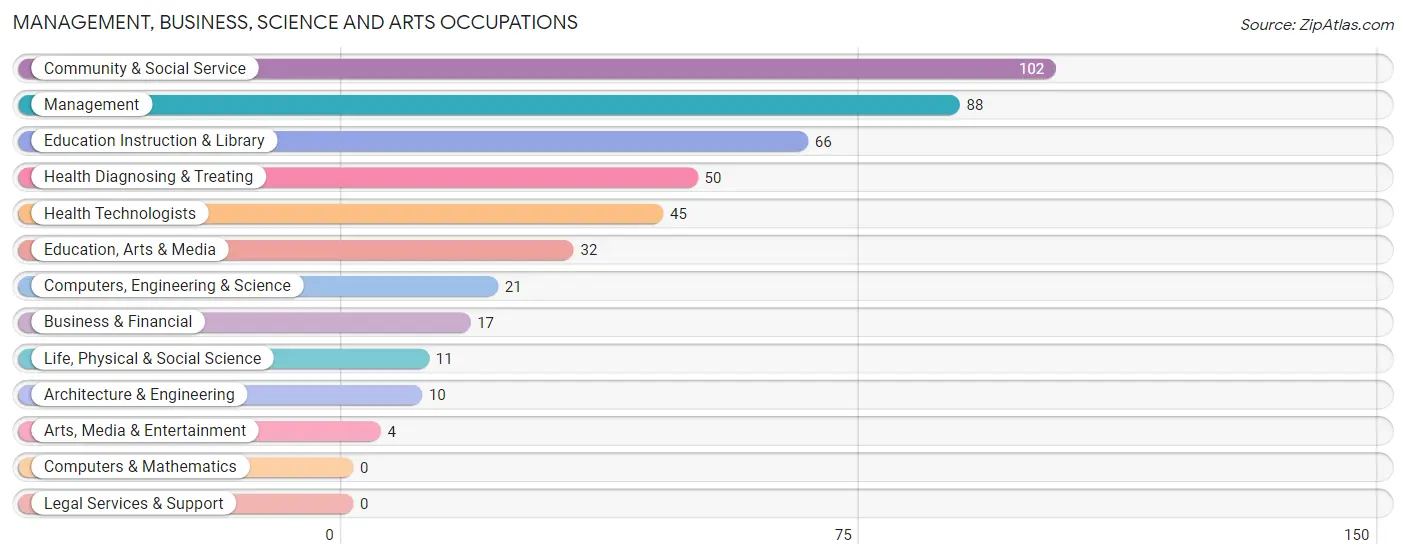
Management, Business, Science and Arts Occupations
The most common Management, Business, Science and Arts occupations in Park River are Community & Social Service (102 | 14.5%), Management (88 | 12.5%), Education Instruction & Library (66 | 9.4%), Health Diagnosing & Treating (50 | 7.1%), and Health Technologists (45 | 6.4%).
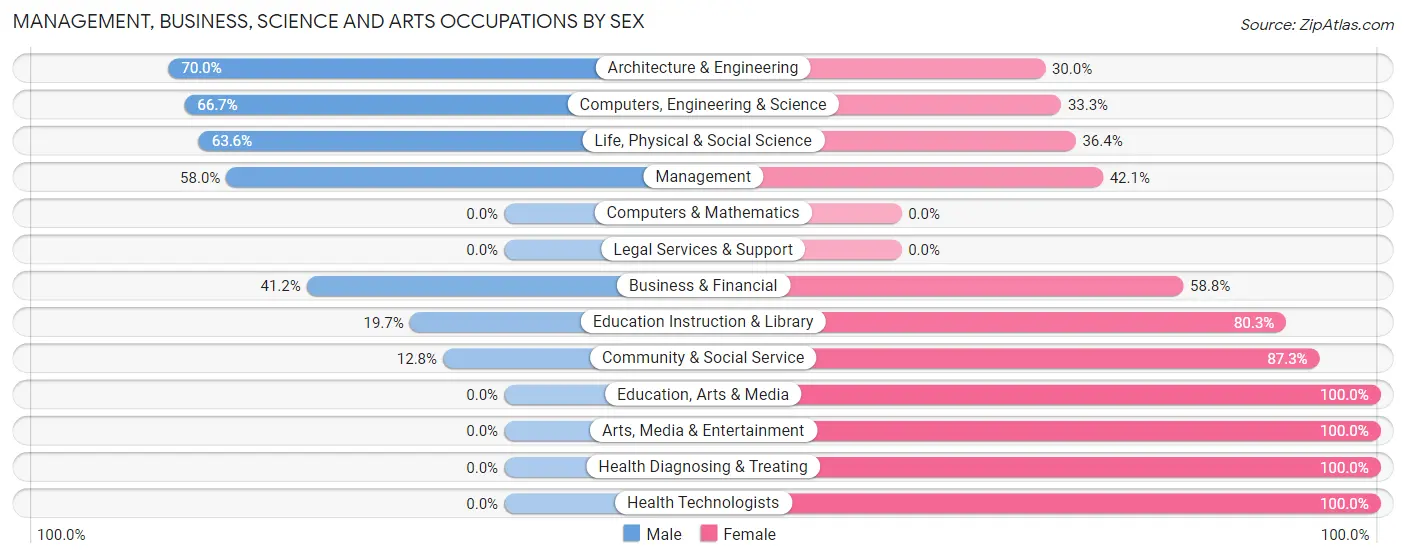
Management, Business, Science and Arts Occupations by Sex
Within the Management, Business, Science and Arts occupations in Park River, the most male-oriented occupations are Architecture & Engineering (70.0%), Computers, Engineering & Science (66.7%), and Life, Physical & Social Science (63.6%), while the most female-oriented occupations are Education, Arts & Media (100.0%), Arts, Media & Entertainment (100.0%), and Health Diagnosing & Treating (100.0%).
| Occupation | Male | Female |
| Management | 51 (58.0%) | 37 (42.0%) |
| Business & Financial | 7 (41.2%) | 10 (58.8%) |
| Computers, Engineering & Science | 14 (66.7%) | 7 (33.3%) |
| Computers & Mathematics | 0 (0.0%) | 0 (0.0%) |
| Architecture & Engineering | 7 (70.0%) | 3 (30.0%) |
| Life, Physical & Social Science | 7 (63.6%) | 4 (36.4%) |
| Community & Social Service | 13 (12.8%) | 89 (87.3%) |
| Education, Arts & Media | 0 (0.0%) | 32 (100.0%) |
| Legal Services & Support | 0 (0.0%) | 0 (0.0%) |
| Education Instruction & Library | 13 (19.7%) | 53 (80.3%) |
| Arts, Media & Entertainment | 0 (0.0%) | 4 (100.0%) |
| Health Diagnosing & Treating | 0 (0.0%) | 50 (100.0%) |
| Health Technologists | 0 (0.0%) | 45 (100.0%) |
| Total (Category) | 85 (30.6%) | 193 (69.4%) |
| Total (Overall) | 325 (46.2%) | 379 (53.8%) |
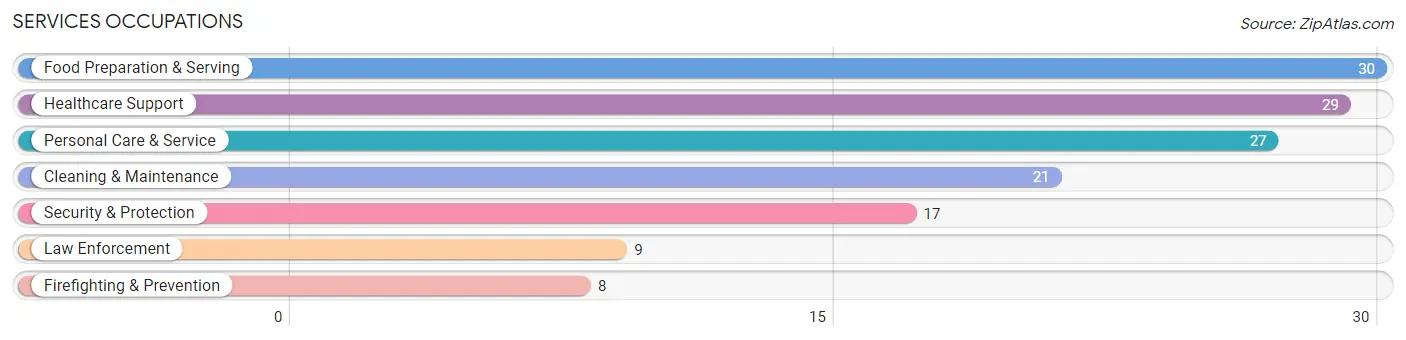
Services Occupations
The most common Services occupations in Park River are Food Preparation & Serving (30 | 4.3%), Healthcare Support (29 | 4.1%), Personal Care & Service (27 | 3.8%), Cleaning & Maintenance (21 | 3.0%), and Security & Protection (17 | 2.4%).
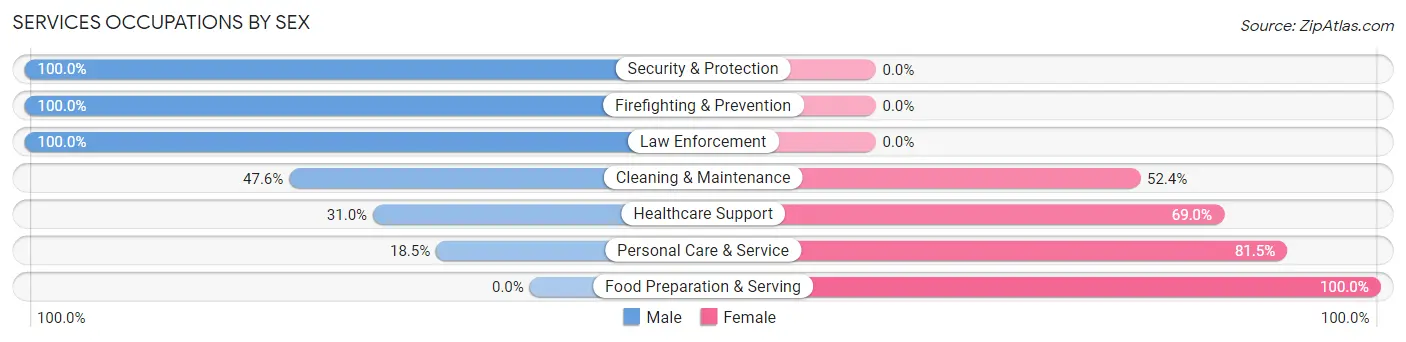
Services Occupations by Sex
Within the Services occupations in Park River, the most male-oriented occupations are Security & Protection (100.0%), Firefighting & Prevention (100.0%), and Law Enforcement (100.0%), while the most female-oriented occupations are Food Preparation & Serving (100.0%), Personal Care & Service (81.5%), and Healthcare Support (69.0%).
| Occupation | Male | Female |
| Healthcare Support | 9 (31.0%) | 20 (69.0%) |
| Security & Protection | 17 (100.0%) | 0 (0.0%) |
| Firefighting & Prevention | 8 (100.0%) | 0 (0.0%) |
| Law Enforcement | 9 (100.0%) | 0 (0.0%) |
| Food Preparation & Serving | 0 (0.0%) | 30 (100.0%) |
| Cleaning & Maintenance | 10 (47.6%) | 11 (52.4%) |
| Personal Care & Service | 5 (18.5%) | 22 (81.5%) |
| Total (Category) | 41 (33.1%) | 83 (66.9%) |
| Total (Overall) | 325 (46.2%) | 379 (53.8%) |
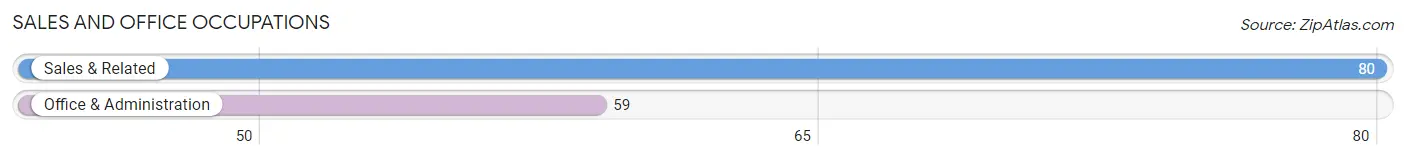
Sales and Office Occupations
The most common Sales and Office occupations in Park River are Sales & Related (80 | 11.4%), and Office & Administration (59 | 8.4%).
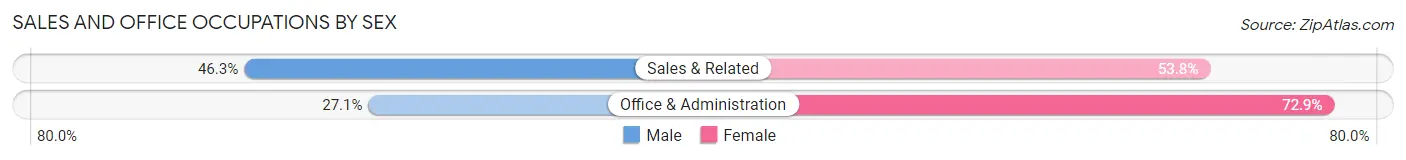
Sales and Office Occupations by Sex
| Occupation | Male | Female |
| Sales & Related | 37 (46.3%) | 43 (53.7%) |
| Office & Administration | 16 (27.1%) | 43 (72.9%) |
| Total (Category) | 53 (38.1%) | 86 (61.9%) |
| Total (Overall) | 325 (46.2%) | 379 (53.8%) |
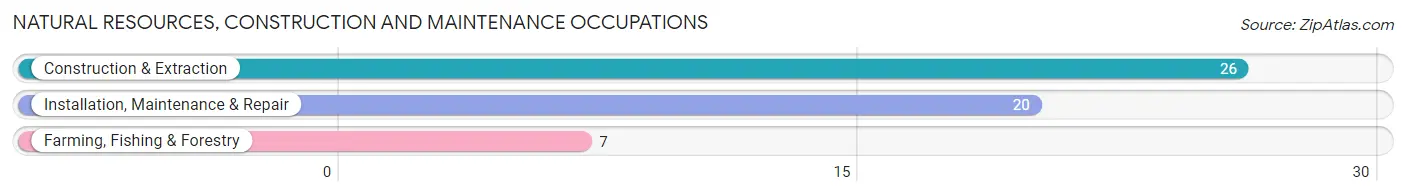
Natural Resources, Construction and Maintenance Occupations
The most common Natural Resources, Construction and Maintenance occupations in Park River are Construction & Extraction (26 | 3.7%), Installation, Maintenance & Repair (20 | 2.8%), and Farming, Fishing & Forestry (7 | 1.0%).
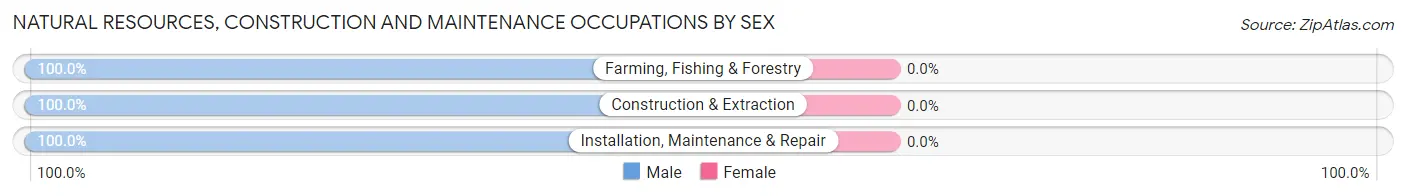
Natural Resources, Construction and Maintenance Occupations by Sex
| Occupation | Male | Female |
| Farming, Fishing & Forestry | 7 (100.0%) | 0 (0.0%) |
| Construction & Extraction | 26 (100.0%) | 0 (0.0%) |
| Installation, Maintenance & Repair | 20 (100.0%) | 0 (0.0%) |
| Total (Category) | 53 (100.0%) | 0 (0.0%) |
| Total (Overall) | 325 (46.2%) | 379 (53.8%) |
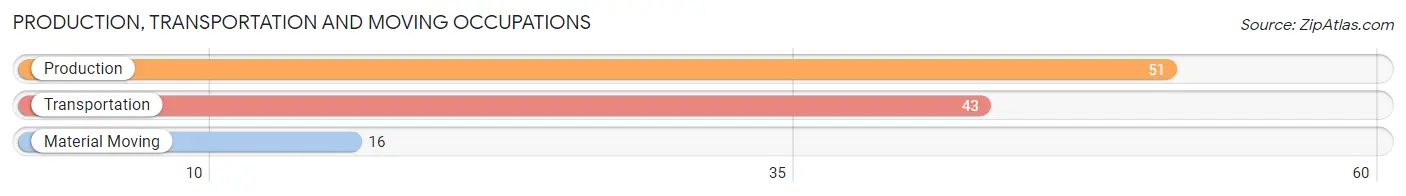
Production, Transportation and Moving Occupations
The most common Production, Transportation and Moving occupations in Park River are Production (51 | 7.2%), Transportation (43 | 6.1%), and Material Moving (16 | 2.3%).
Production, Transportation and Moving Occupations by Sex
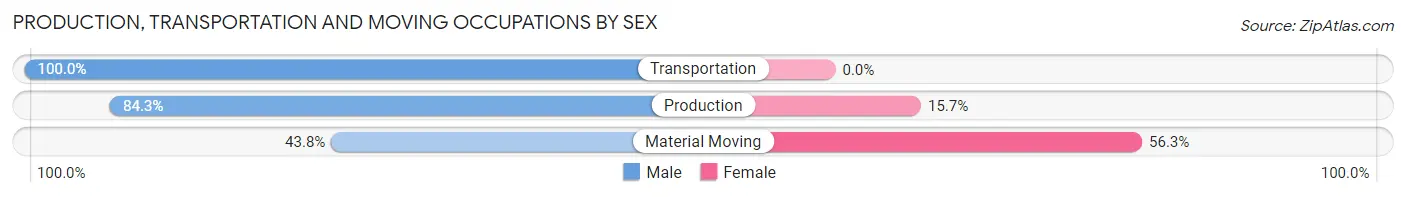
| Occupation | Male | Female |
| Production | 43 (84.3%) | 8 (15.7%) |
| Transportation | 43 (100.0%) | 0 (0.0%) |
| Material Moving | 7 (43.8%) | 9 (56.2%) |
| Total (Category) | 93 (84.6%) | 17 (15.4%) |
| Total (Overall) | 325 (46.2%) | 379 (53.8%) |
Employment Industries by Sex in Park River
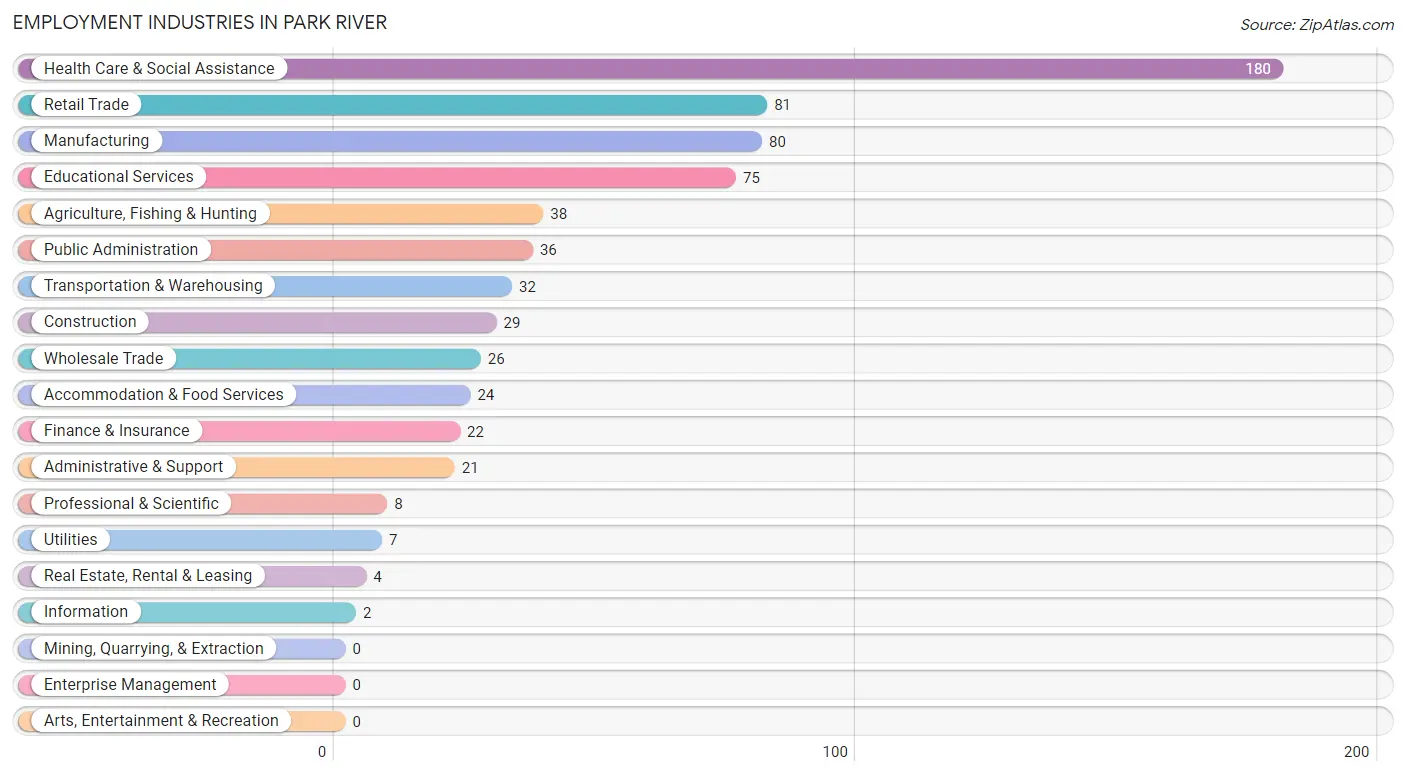
Employment Industries in Park River
The major employment industries in Park River include Health Care & Social Assistance (180 | 25.6%), Retail Trade (81 | 11.5%), Manufacturing (80 | 11.4%), Educational Services (75 | 10.6%), and Agriculture, Fishing & Hunting (38 | 5.4%).
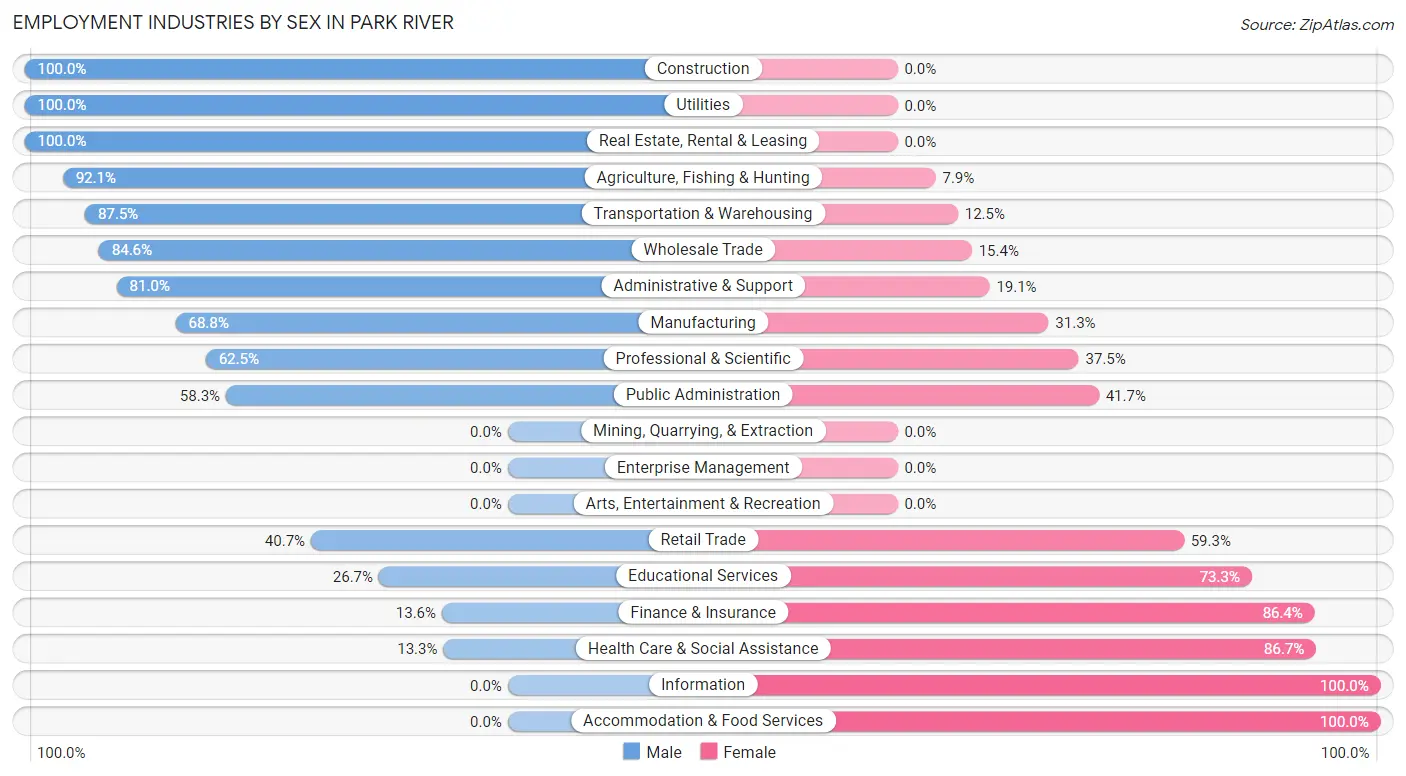
Employment Industries by Sex in Park River
The Park River industries that see more men than women are Construction (100.0%), Utilities (100.0%), and Real Estate, Rental & Leasing (100.0%), whereas the industries that tend to have a higher number of women are Information (100.0%), Accommodation & Food Services (100.0%), and Health Care & Social Assistance (86.7%).
| Industry | Male | Female |
| Agriculture, Fishing & Hunting | 35 (92.1%) | 3 (7.9%) |
| Mining, Quarrying, & Extraction | 0 (0.0%) | 0 (0.0%) |
| Construction | 29 (100.0%) | 0 (0.0%) |
| Manufacturing | 55 (68.8%) | 25 (31.2%) |
| Wholesale Trade | 22 (84.6%) | 4 (15.4%) |
| Retail Trade | 33 (40.7%) | 48 (59.3%) |
| Transportation & Warehousing | 28 (87.5%) | 4 (12.5%) |
| Utilities | 7 (100.0%) | 0 (0.0%) |
| Information | 0 (0.0%) | 2 (100.0%) |
| Finance & Insurance | 3 (13.6%) | 19 (86.4%) |
| Real Estate, Rental & Leasing | 4 (100.0%) | 0 (0.0%) |
| Professional & Scientific | 5 (62.5%) | 3 (37.5%) |
| Enterprise Management | 0 (0.0%) | 0 (0.0%) |
| Administrative & Support | 17 (80.9%) | 4 (19.1%) |
| Educational Services | 20 (26.7%) | 55 (73.3%) |
| Health Care & Social Assistance | 24 (13.3%) | 156 (86.7%) |
| Arts, Entertainment & Recreation | 0 (0.0%) | 0 (0.0%) |
| Accommodation & Food Services | 0 (0.0%) | 24 (100.0%) |
| Public Administration | 21 (58.3%) | 15 (41.7%) |
| Total | 325 (46.2%) | 379 (53.8%) |
Education in Park River
School Enrollment in Park River
The most common levels of schooling among the 349 students in Park River are middle school (86 | 24.6%), elementary school (81 | 23.2%), and college / undergraduate (56 | 16.1%).
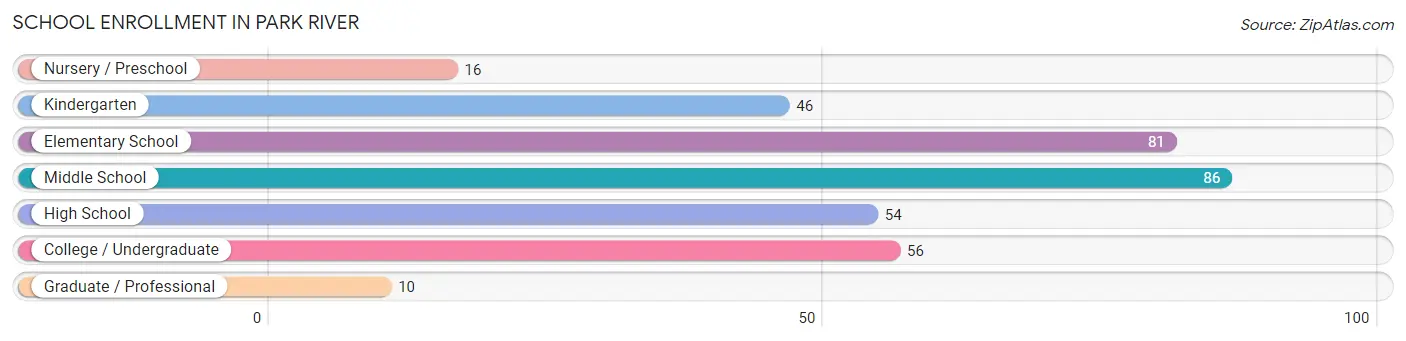
| School Level | # Students | % Students |
| Nursery / Preschool | 16 | 4.6% |
| Kindergarten | 46 | 13.2% |
| Elementary School | 81 | 23.2% |
| Middle School | 86 | 24.6% |
| High School | 54 | 15.5% |
| College / Undergraduate | 56 | 16.1% |
| Graduate / Professional | 10 | 2.9% |
| Total | 349 | 100.0% |
School Enrollment by Age by Funding Source in Park River
Out of a total of 349 students who are enrolled in schools in Park River, 38 (10.9%) attend a private institution, while the remaining 311 (89.1%) are enrolled in public schools. The age group of 20 to 24 year olds has the highest likelihood of being enrolled in private schools, with 14 (73.7% in the age bracket) enrolled. Conversely, the age group of 3 to 4 year olds has the lowest likelihood of being enrolled in a private school, with 16 (100.0% in the age bracket) attending a public institution.
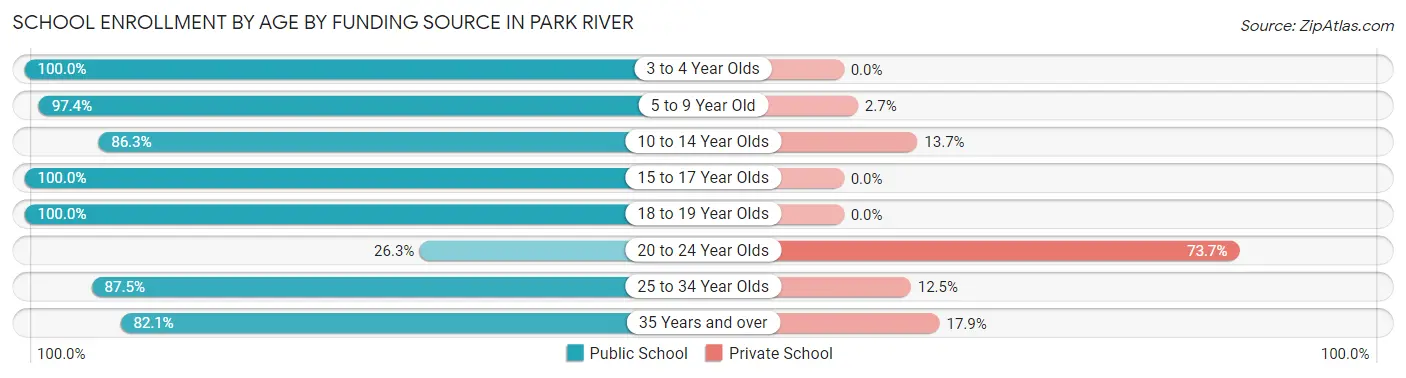
| Age Bracket | Public School | Private School |
| 3 to 4 Year Olds | 16 (100.0%) | 0 (0.0%) |
| 5 to 9 Year Old | 110 (97.4%) | 3 (2.6%) |
| 10 to 14 Year Olds | 88 (86.3%) | 14 (13.7%) |
| 15 to 17 Year Olds | 44 (100.0%) | 0 (0.0%) |
| 18 to 19 Year Olds | 11 (100.0%) | 0 (0.0%) |
| 20 to 24 Year Olds | 5 (26.3%) | 14 (73.7%) |
| 25 to 34 Year Olds | 14 (87.5%) | 2 (12.5%) |
| 35 Years and over | 23 (82.1%) | 5 (17.9%) |
| Total | 311 (89.1%) | 38 (10.9%) |
Educational Attainment by Field of Study in Park River
Education (57 | 26.9%), business (47 | 22.2%), liberal arts & history (22 | 10.4%), science & technology (20 | 9.4%), and bio, nature & agricultural (19 | 9.0%) are the most common fields of study among 212 individuals in Park River who have obtained a bachelor's degree or higher.
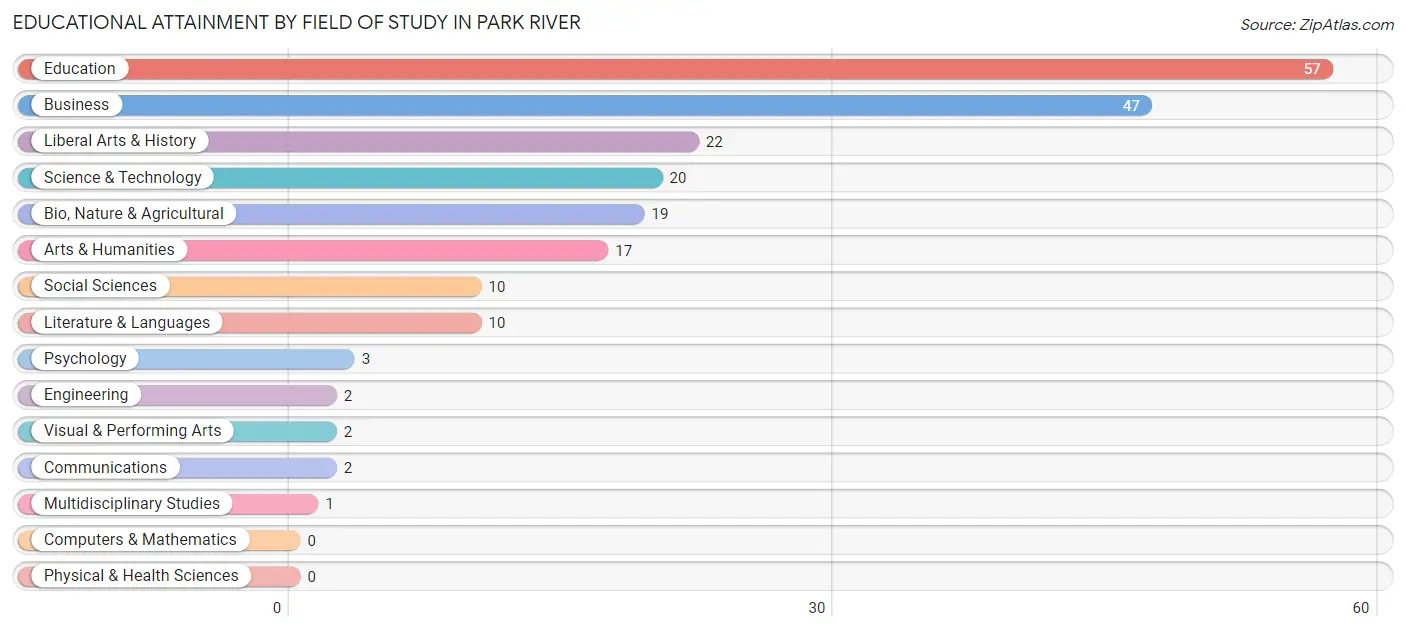
| Field of Study | # Graduates | % Graduates |
| Computers & Mathematics | 0 | 0.0% |
| Bio, Nature & Agricultural | 19 | 9.0% |
| Physical & Health Sciences | 0 | 0.0% |
| Psychology | 3 | 1.4% |
| Social Sciences | 10 | 4.7% |
| Engineering | 2 | 0.9% |
| Multidisciplinary Studies | 1 | 0.5% |
| Science & Technology | 20 | 9.4% |
| Business | 47 | 22.2% |
| Education | 57 | 26.9% |
| Literature & Languages | 10 | 4.7% |
| Liberal Arts & History | 22 | 10.4% |
| Visual & Performing Arts | 2 | 0.9% |
| Communications | 2 | 0.9% |
| Arts & Humanities | 17 | 8.0% |
| Total | 212 | 100.0% |
Transportation & Commute in Park River
Vehicle Availability by Sex in Park River
The most prevalent vehicle ownership categories in Park River are males with 2 vehicles (144, accounting for 45.6%) and females with 2 vehicles (147, making up 38.6%).
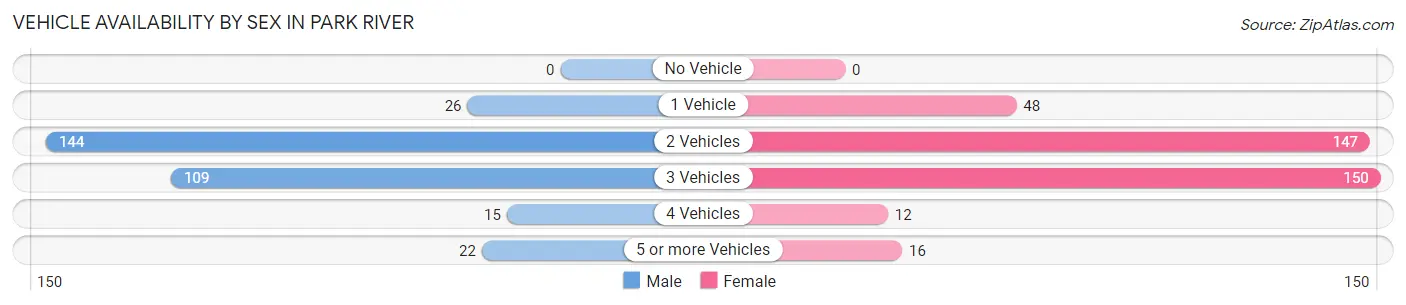
| Vehicles Available | Male | Female |
| No Vehicle | 0 (0.0%) | 0 (0.0%) |
| 1 Vehicle | 26 (8.2%) | 48 (12.9%) |
| 2 Vehicles | 144 (45.6%) | 147 (39.4%) |
| 3 Vehicles | 109 (34.5%) | 150 (40.2%) |
| 4 Vehicles | 15 (4.8%) | 12 (3.2%) |
| 5 or more Vehicles | 22 (7.0%) | 16 (4.3%) |
| Total | 316 (100.0%) | 373 (100.0%) |
Commute Time in Park River
The most frequently occuring commute durations in Park River are 5 to 9 minutes (146 commuters, 22.1%), 20 to 24 minutes (119 commuters, 18.0%), and 15 to 19 minutes (90 commuters, 13.6%).
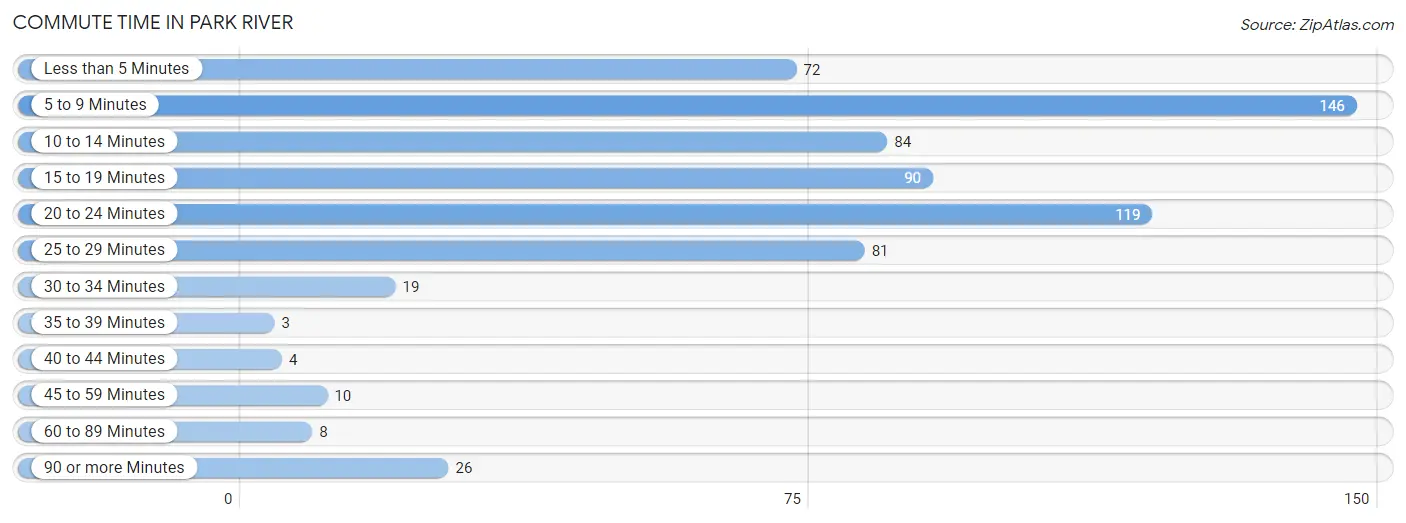
| Commute Time | # Commuters | % Commuters |
| Less than 5 Minutes | 72 | 10.9% |
| 5 to 9 Minutes | 146 | 22.1% |
| 10 to 14 Minutes | 84 | 12.7% |
| 15 to 19 Minutes | 90 | 13.6% |
| 20 to 24 Minutes | 119 | 18.0% |
| 25 to 29 Minutes | 81 | 12.2% |
| 30 to 34 Minutes | 19 | 2.9% |
| 35 to 39 Minutes | 3 | 0.4% |
| 40 to 44 Minutes | 4 | 0.6% |
| 45 to 59 Minutes | 10 | 1.5% |
| 60 to 89 Minutes | 8 | 1.2% |
| 90 or more Minutes | 26 | 3.9% |
Commute Time by Sex in Park River
The most common commute times in Park River are 5 to 9 minutes (60 commuters, 18.9%) for males and 5 to 9 minutes (86 commuters, 25.0%) for females.
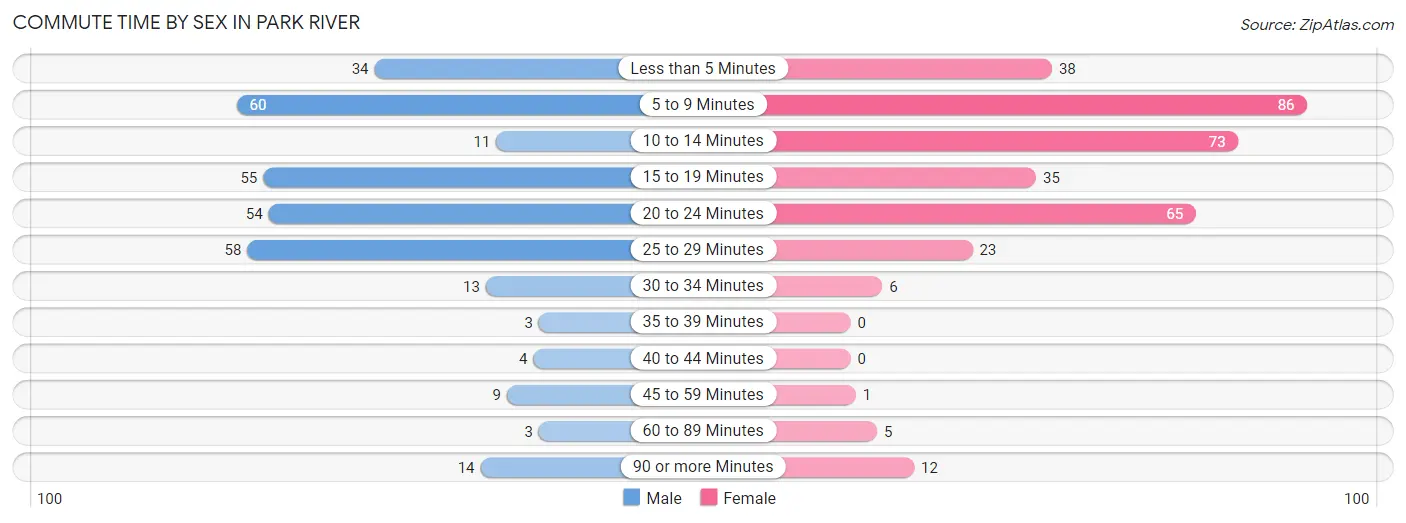
| Commute Time | Male | Female |
| Less than 5 Minutes | 34 (10.7%) | 38 (11.1%) |
| 5 to 9 Minutes | 60 (18.9%) | 86 (25.0%) |
| 10 to 14 Minutes | 11 (3.5%) | 73 (21.2%) |
| 15 to 19 Minutes | 55 (17.3%) | 35 (10.2%) |
| 20 to 24 Minutes | 54 (17.0%) | 65 (18.9%) |
| 25 to 29 Minutes | 58 (18.2%) | 23 (6.7%) |
| 30 to 34 Minutes | 13 (4.1%) | 6 (1.7%) |
| 35 to 39 Minutes | 3 (0.9%) | 0 (0.0%) |
| 40 to 44 Minutes | 4 (1.3%) | 0 (0.0%) |
| 45 to 59 Minutes | 9 (2.8%) | 1 (0.3%) |
| 60 to 89 Minutes | 3 (0.9%) | 5 (1.5%) |
| 90 or more Minutes | 14 (4.4%) | 12 (3.5%) |
Time of Departure to Work by Sex in Park River
The most frequent times of departure to work in Park River are 6:30 AM to 6:59 AM (65, 20.4%) for males and 7:30 AM to 7:59 AM (154, 44.8%) for females.
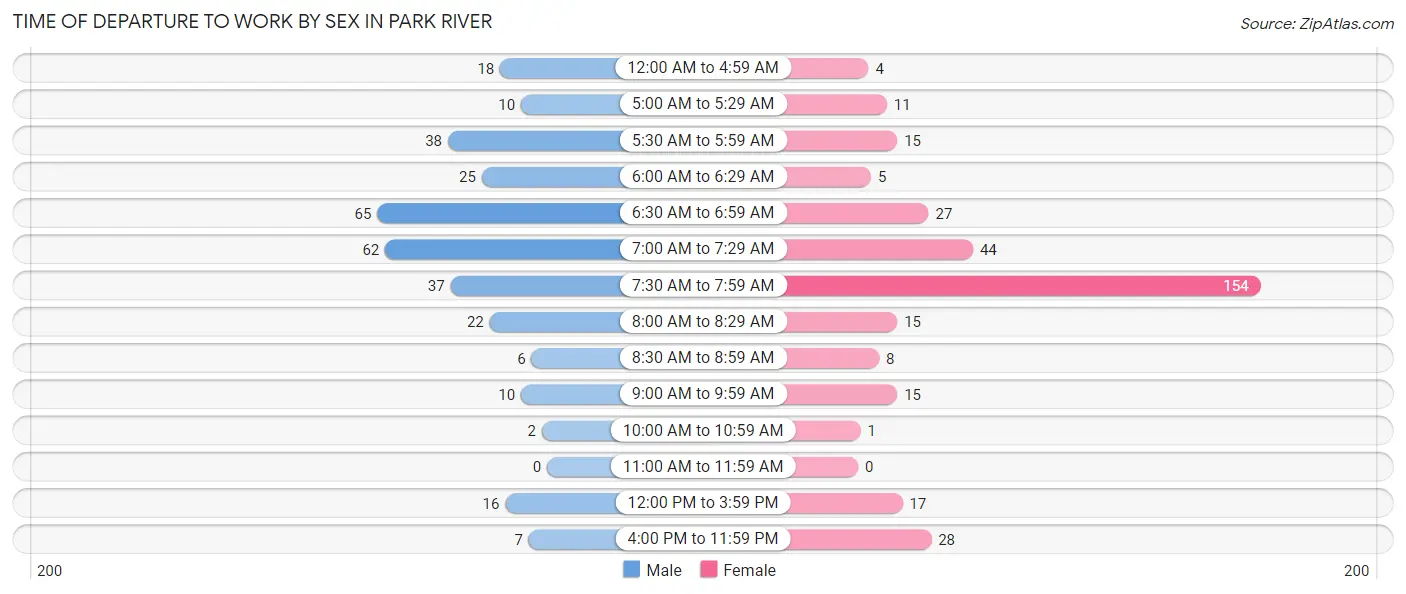
| Time of Departure | Male | Female |
| 12:00 AM to 4:59 AM | 18 (5.7%) | 4 (1.2%) |
| 5:00 AM to 5:29 AM | 10 (3.1%) | 11 (3.2%) |
| 5:30 AM to 5:59 AM | 38 (11.9%) | 15 (4.4%) |
| 6:00 AM to 6:29 AM | 25 (7.9%) | 5 (1.5%) |
| 6:30 AM to 6:59 AM | 65 (20.4%) | 27 (7.9%) |
| 7:00 AM to 7:29 AM | 62 (19.5%) | 44 (12.8%) |
| 7:30 AM to 7:59 AM | 37 (11.6%) | 154 (44.8%) |
| 8:00 AM to 8:29 AM | 22 (6.9%) | 15 (4.4%) |
| 8:30 AM to 8:59 AM | 6 (1.9%) | 8 (2.3%) |
| 9:00 AM to 9:59 AM | 10 (3.1%) | 15 (4.4%) |
| 10:00 AM to 10:59 AM | 2 (0.6%) | 1 (0.3%) |
| 11:00 AM to 11:59 AM | 0 (0.0%) | 0 (0.0%) |
| 12:00 PM to 3:59 PM | 16 (5.0%) | 17 (4.9%) |
| 4:00 PM to 11:59 PM | 7 (2.2%) | 28 (8.1%) |
| Total | 318 (100.0%) | 344 (100.0%) |
Housing Occupancy in Park River
Occupancy by Ownership in Park River
Of the total 639 dwellings in Park River, owner-occupied units account for 478 (74.8%), while renter-occupied units make up 161 (25.2%).
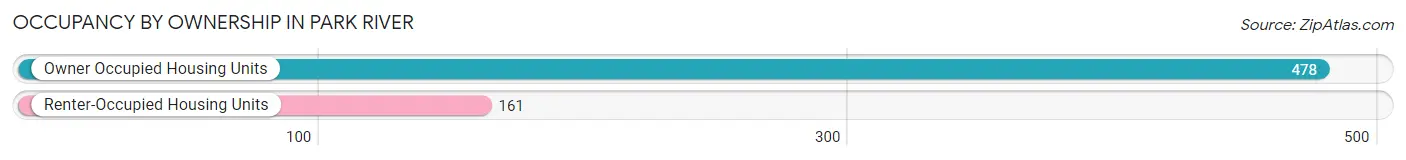
| Occupancy | # Housing Units | % Housing Units |
| Owner Occupied Housing Units | 478 | 74.8% |
| Renter-Occupied Housing Units | 161 | 25.2% |
| Total Occupied Housing Units | 639 | 100.0% |
Occupancy by Household Size in Park River
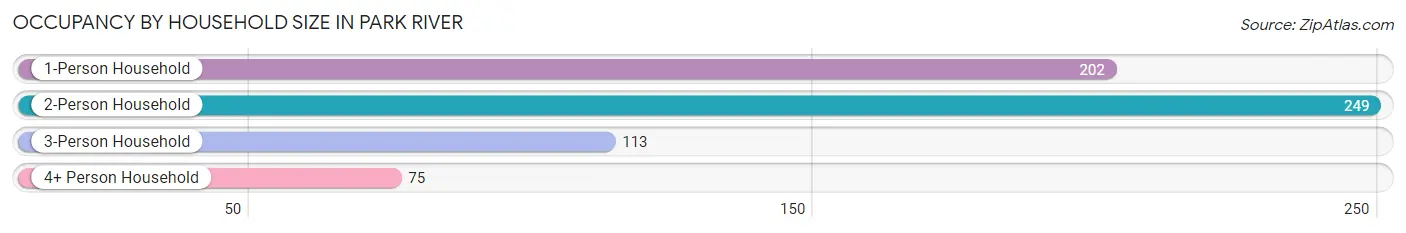
| Household Size | # Housing Units | % Housing Units |
| 1-Person Household | 202 | 31.6% |
| 2-Person Household | 249 | 39.0% |
| 3-Person Household | 113 | 17.7% |
| 4+ Person Household | 75 | 11.7% |
| Total Housing Units | 639 | 100.0% |
Occupancy by Ownership by Household Size in Park River
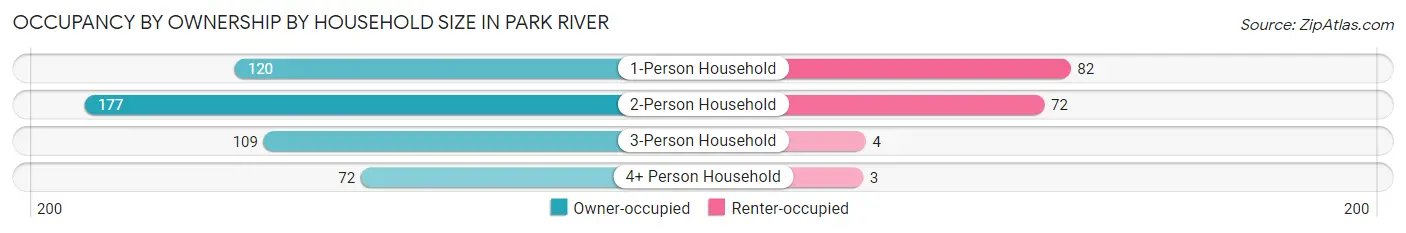
| Household Size | Owner-occupied | Renter-occupied |
| 1-Person Household | 120 (59.4%) | 82 (40.6%) |
| 2-Person Household | 177 (71.1%) | 72 (28.9%) |
| 3-Person Household | 109 (96.5%) | 4 (3.5%) |
| 4+ Person Household | 72 (96.0%) | 3 (4.0%) |
| Total Housing Units | 478 (74.8%) | 161 (25.2%) |
Occupancy by Educational Attainment in Park River
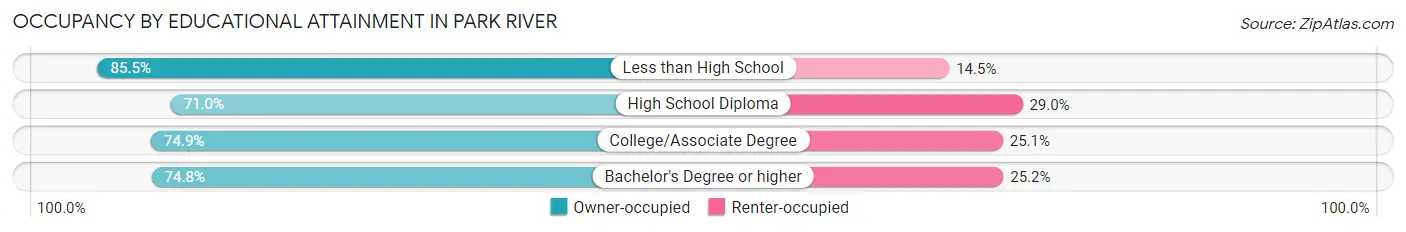
| Household Size | Owner-occupied | Renter-occupied |
| Less than High School | 59 (85.5%) | 10 (14.5%) |
| High School Diploma | 142 (71.0%) | 58 (29.0%) |
| College/Associate Degree | 185 (74.9%) | 62 (25.1%) |
| Bachelor's Degree or higher | 92 (74.8%) | 31 (25.2%) |
Occupancy by Age of Householder in Park River
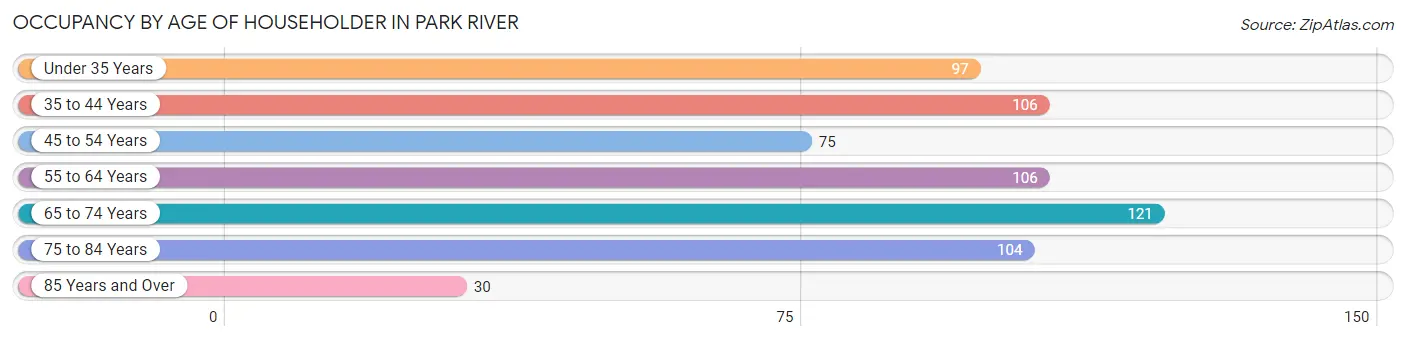
| Age Bracket | # Households | % Households |
| Under 35 Years | 97 | 15.2% |
| 35 to 44 Years | 106 | 16.6% |
| 45 to 54 Years | 75 | 11.7% |
| 55 to 64 Years | 106 | 16.6% |
| 65 to 74 Years | 121 | 18.9% |
| 75 to 84 Years | 104 | 16.3% |
| 85 Years and Over | 30 | 4.7% |
| Total | 639 | 100.0% |
Housing Finances in Park River
Median Income by Occupancy in Park River
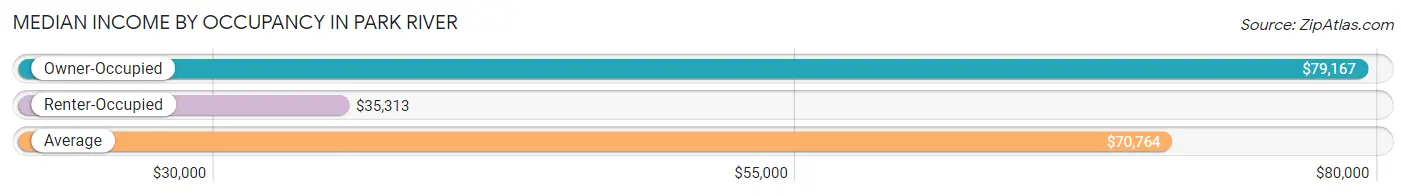
| Occupancy Type | # Households | Median Income |
| Owner-Occupied | 478 (74.8%) | $79,167 |
| Renter-Occupied | 161 (25.2%) | $35,313 |
| Average | 639 (100.0%) | $70,764 |
Occupancy by Householder Income Bracket in Park River
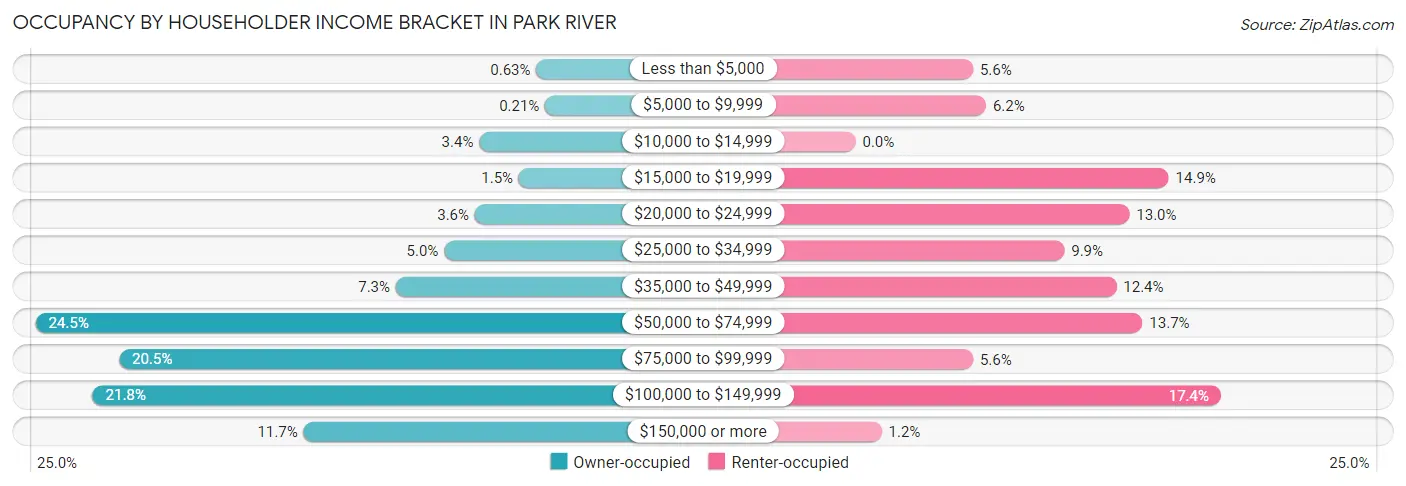
| Income Bracket | Owner-occupied | Renter-occupied |
| Less than $5,000 | 3 (0.6%) | 9 (5.6%) |
| $5,000 to $9,999 | 1 (0.2%) | 10 (6.2%) |
| $10,000 to $14,999 | 16 (3.4%) | 0 (0.0%) |
| $15,000 to $19,999 | 7 (1.5%) | 24 (14.9%) |
| $20,000 to $24,999 | 17 (3.6%) | 21 (13.0%) |
| $25,000 to $34,999 | 24 (5.0%) | 16 (9.9%) |
| $35,000 to $49,999 | 35 (7.3%) | 20 (12.4%) |
| $50,000 to $74,999 | 117 (24.5%) | 22 (13.7%) |
| $75,000 to $99,999 | 98 (20.5%) | 9 (5.6%) |
| $100,000 to $149,999 | 104 (21.8%) | 28 (17.4%) |
| $150,000 or more | 56 (11.7%) | 2 (1.2%) |
| Total | 478 (100.0%) | 161 (100.0%) |
Monthly Housing Cost Tiers in Park River
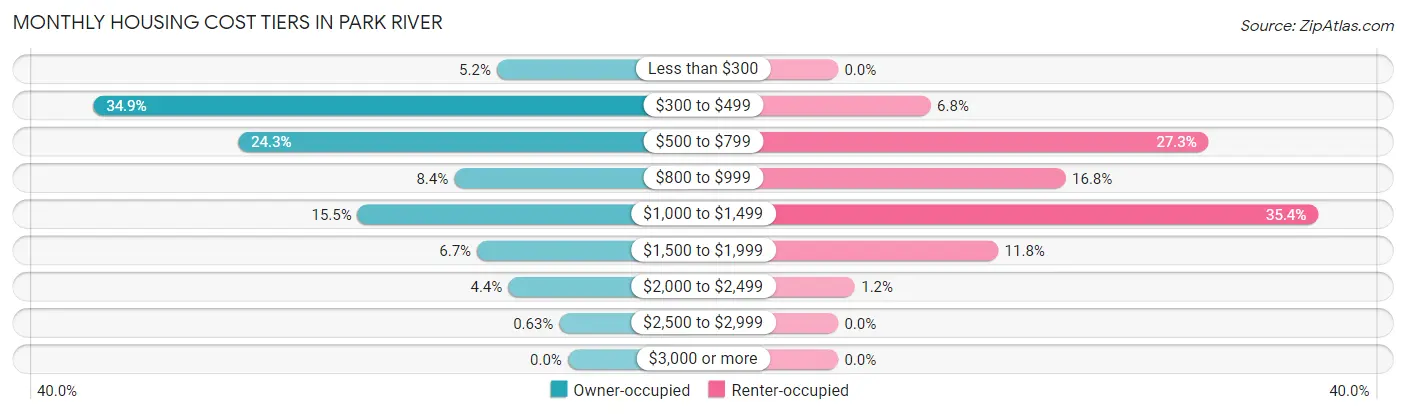
| Monthly Cost | Owner-occupied | Renter-occupied |
| Less than $300 | 25 (5.2%) | 0 (0.0%) |
| $300 to $499 | 167 (34.9%) | 11 (6.8%) |
| $500 to $799 | 116 (24.3%) | 44 (27.3%) |
| $800 to $999 | 40 (8.4%) | 27 (16.8%) |
| $1,000 to $1,499 | 74 (15.5%) | 57 (35.4%) |
| $1,500 to $1,999 | 32 (6.7%) | 19 (11.8%) |
| $2,000 to $2,499 | 21 (4.4%) | 2 (1.2%) |
| $2,500 to $2,999 | 3 (0.6%) | 0 (0.0%) |
| $3,000 or more | 0 (0.0%) | 0 (0.0%) |
| Total | 478 (100.0%) | 161 (100.0%) |
Physical Housing Characteristics in Park River
Housing Structures in Park River
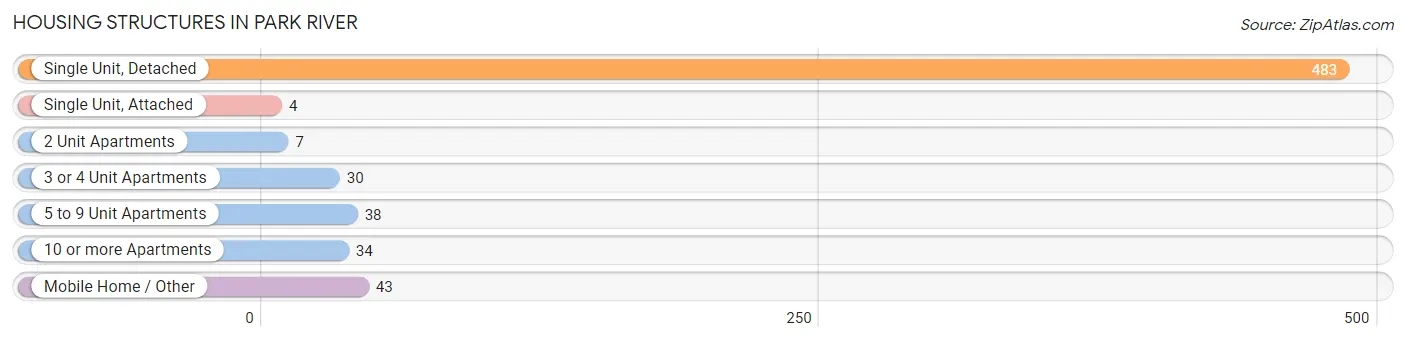
| Structure Type | # Housing Units | % Housing Units |
| Single Unit, Detached | 483 | 75.6% |
| Single Unit, Attached | 4 | 0.6% |
| 2 Unit Apartments | 7 | 1.1% |
| 3 or 4 Unit Apartments | 30 | 4.7% |
| 5 to 9 Unit Apartments | 38 | 5.9% |
| 10 or more Apartments | 34 | 5.3% |
| Mobile Home / Other | 43 | 6.7% |
| Total | 639 | 100.0% |
Housing Structures by Occupancy in Park River
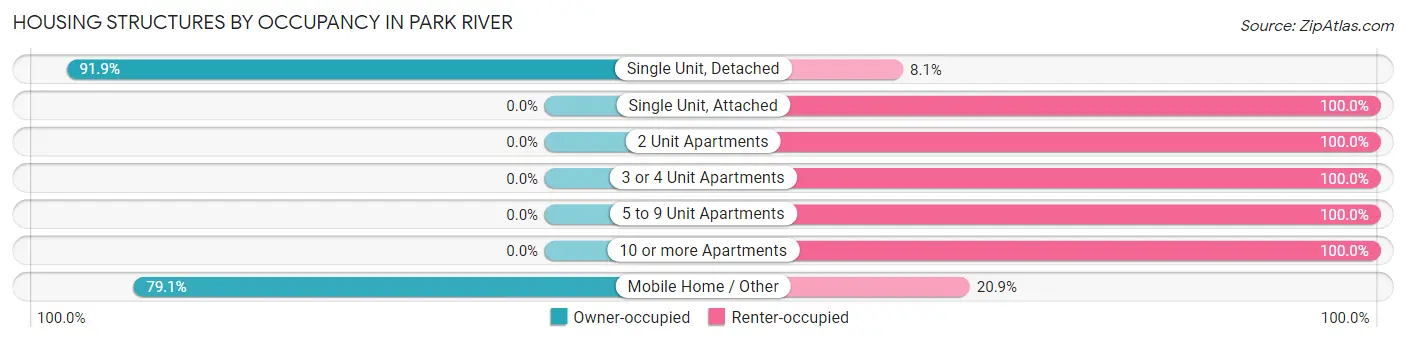
| Structure Type | Owner-occupied | Renter-occupied |
| Single Unit, Detached | 444 (91.9%) | 39 (8.1%) |
| Single Unit, Attached | 0 (0.0%) | 4 (100.0%) |
| 2 Unit Apartments | 0 (0.0%) | 7 (100.0%) |
| 3 or 4 Unit Apartments | 0 (0.0%) | 30 (100.0%) |
| 5 to 9 Unit Apartments | 0 (0.0%) | 38 (100.0%) |
| 10 or more Apartments | 0 (0.0%) | 34 (100.0%) |
| Mobile Home / Other | 34 (79.1%) | 9 (20.9%) |
| Total | 478 (74.8%) | 161 (25.2%) |
Housing Structures by Number of Rooms in Park River
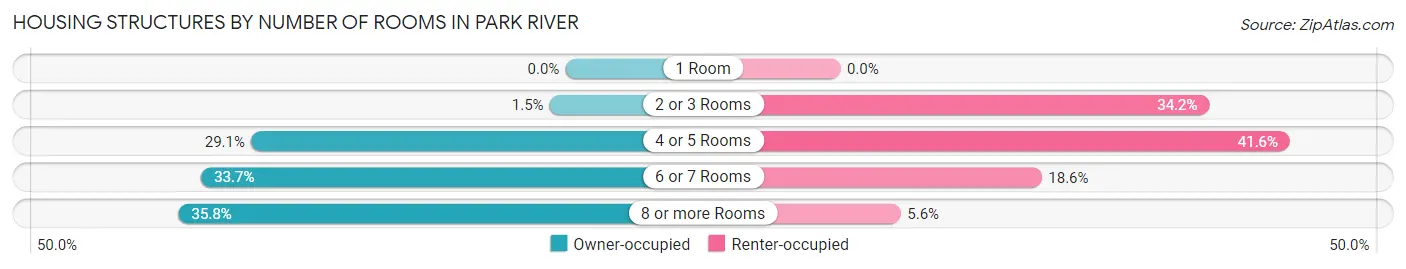
| Number of Rooms | Owner-occupied | Renter-occupied |
| 1 Room | 0 (0.0%) | 0 (0.0%) |
| 2 or 3 Rooms | 7 (1.5%) | 55 (34.2%) |
| 4 or 5 Rooms | 139 (29.1%) | 67 (41.6%) |
| 6 or 7 Rooms | 161 (33.7%) | 30 (18.6%) |
| 8 or more Rooms | 171 (35.8%) | 9 (5.6%) |
| Total | 478 (100.0%) | 161 (100.0%) |
Housing Structure by Heating Type in Park River
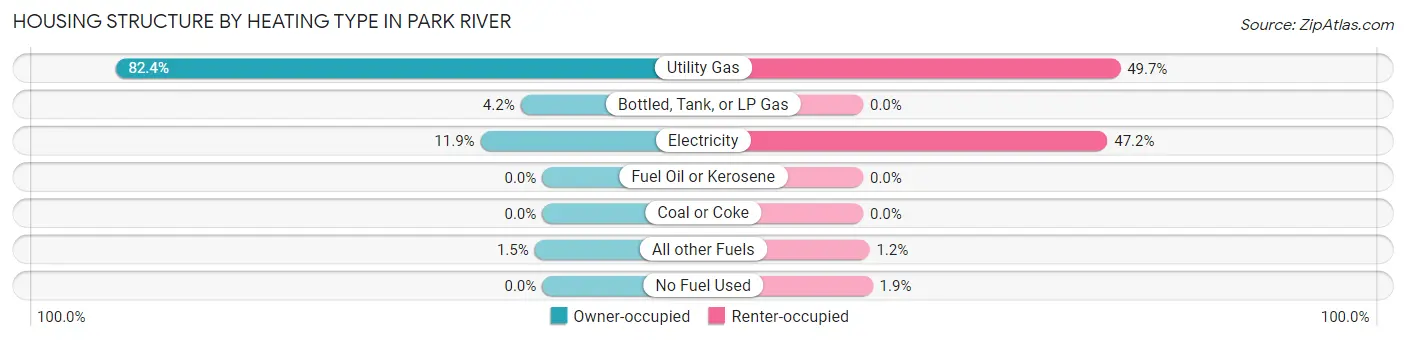
| Heating Type | Owner-occupied | Renter-occupied |
| Utility Gas | 394 (82.4%) | 80 (49.7%) |
| Bottled, Tank, or LP Gas | 20 (4.2%) | 0 (0.0%) |
| Electricity | 57 (11.9%) | 76 (47.2%) |
| Fuel Oil or Kerosene | 0 (0.0%) | 0 (0.0%) |
| Coal or Coke | 0 (0.0%) | 0 (0.0%) |
| All other Fuels | 7 (1.5%) | 2 (1.2%) |
| No Fuel Used | 0 (0.0%) | 3 (1.9%) |
| Total | 478 (100.0%) | 161 (100.0%) |
Household Vehicle Usage in Park River
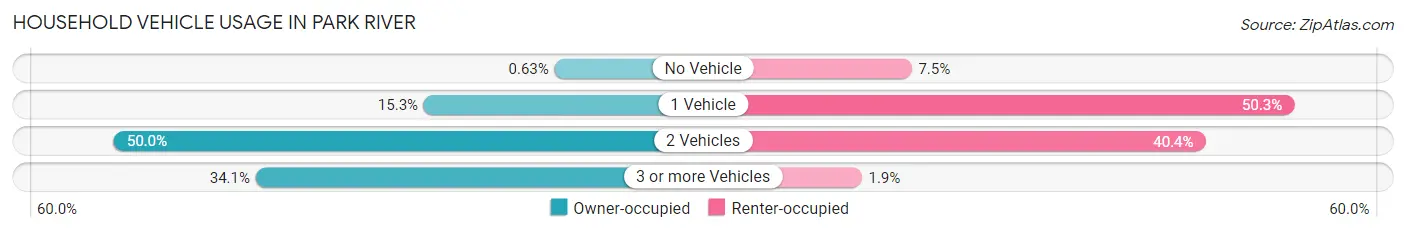
| Vehicles per Household | Owner-occupied | Renter-occupied |
| No Vehicle | 3 (0.6%) | 12 (7.4%) |
| 1 Vehicle | 73 (15.3%) | 81 (50.3%) |
| 2 Vehicles | 239 (50.0%) | 65 (40.4%) |
| 3 or more Vehicles | 163 (34.1%) | 3 (1.9%) |
| Total | 478 (100.0%) | 161 (100.0%) |
Real Estate & Mortgages in Park River
Real Estate and Mortgage Overview in Park River
| Characteristic | Without Mortgage | With Mortgage |
| Housing Units | 292 | 186 |
| Median Property Value | $112,100 | $103,000 |
| Median Household Income | $66,875 | $31 |
| Monthly Housing Costs | $461 | $0 |
| Real Estate Taxes | $1,625 | $0 |
Property Value by Mortgage Status in Park River
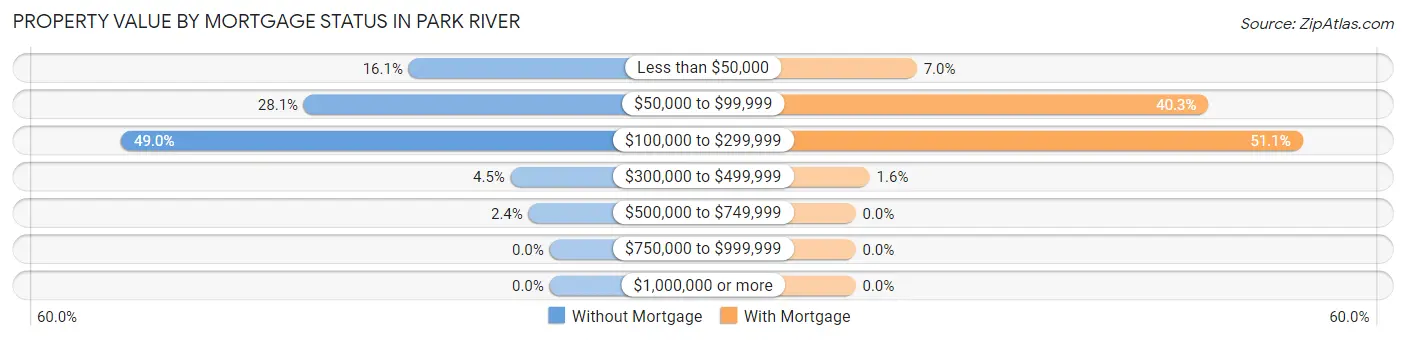
| Property Value | Without Mortgage | With Mortgage |
| Less than $50,000 | 47 (16.1%) | 13 (7.0%) |
| $50,000 to $99,999 | 82 (28.1%) | 75 (40.3%) |
| $100,000 to $299,999 | 143 (49.0%) | 95 (51.1%) |
| $300,000 to $499,999 | 13 (4.4%) | 3 (1.6%) |
| $500,000 to $749,999 | 7 (2.4%) | 0 (0.0%) |
| $750,000 to $999,999 | 0 (0.0%) | 0 (0.0%) |
| $1,000,000 or more | 0 (0.0%) | 0 (0.0%) |
| Total | 292 (100.0%) | 186 (100.0%) |
Household Income by Mortgage Status in Park River
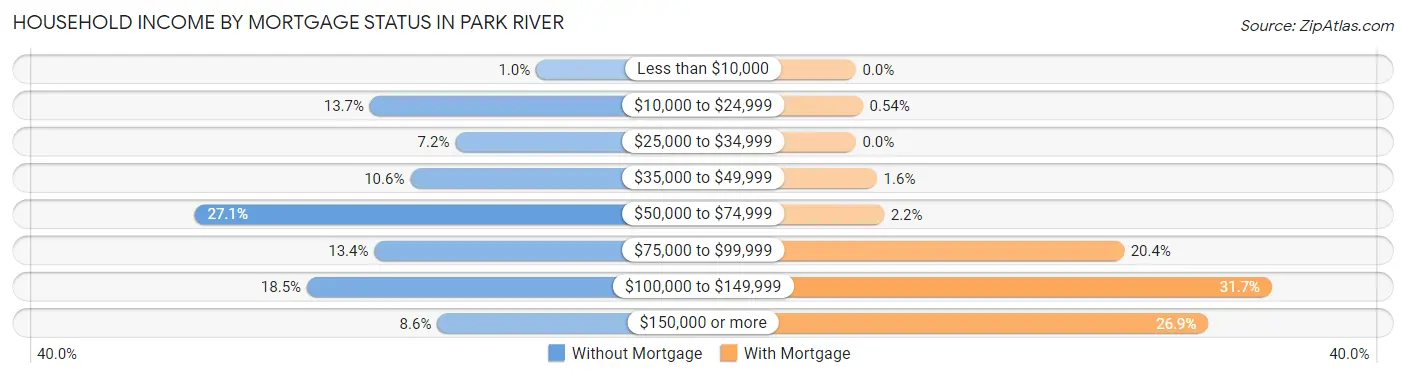
| Household Income | Without Mortgage | With Mortgage |
| Less than $10,000 | 3 (1.0%) | 0 (0.0%) |
| $10,000 to $24,999 | 40 (13.7%) | 1 (0.5%) |
| $25,000 to $34,999 | 21 (7.2%) | 0 (0.0%) |
| $35,000 to $49,999 | 31 (10.6%) | 3 (1.6%) |
| $50,000 to $74,999 | 79 (27.1%) | 4 (2.1%) |
| $75,000 to $99,999 | 39 (13.4%) | 38 (20.4%) |
| $100,000 to $149,999 | 54 (18.5%) | 59 (31.7%) |
| $150,000 or more | 25 (8.6%) | 50 (26.9%) |
| Total | 292 (100.0%) | 186 (100.0%) |
Property Value to Household Income Ratio in Park River
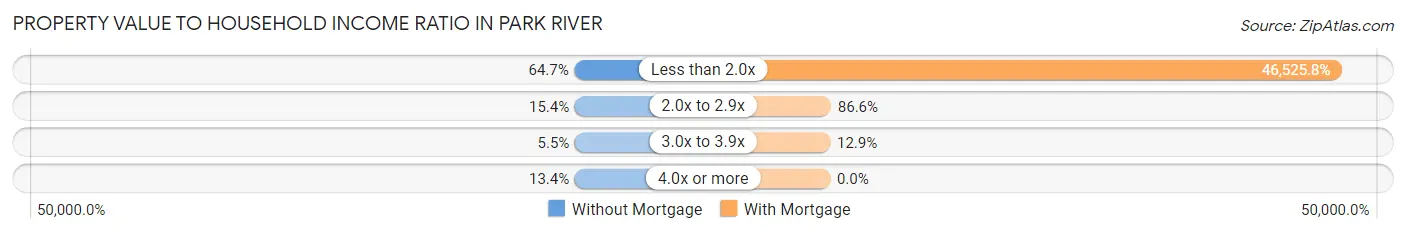
| Value-to-Income Ratio | Without Mortgage | With Mortgage |
| Less than 2.0x | 189 (64.7%) | 86,538 (46,525.8%) |
| 2.0x to 2.9x | 45 (15.4%) | 161 (86.6%) |
| 3.0x to 3.9x | 16 (5.5%) | 24 (12.9%) |
| 4.0x or more | 39 (13.4%) | 0 (0.0%) |
| Total | 292 (100.0%) | 186 (100.0%) |
Real Estate Taxes by Mortgage Status in Park River
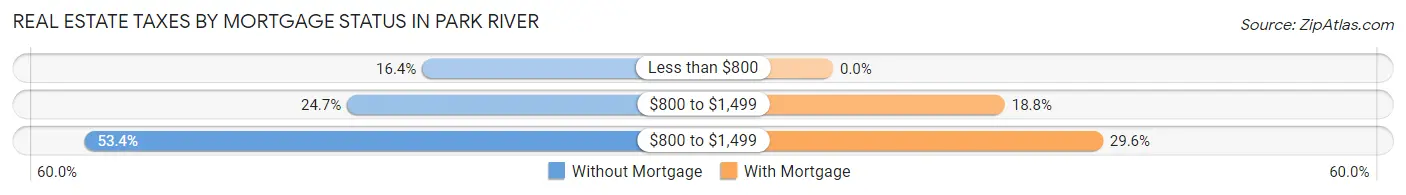
| Property Taxes | Without Mortgage | With Mortgage |
| Less than $800 | 48 (16.4%) | 0 (0.0%) |
| $800 to $1,499 | 72 (24.7%) | 35 (18.8%) |
| $800 to $1,499 | 156 (53.4%) | 55 (29.6%) |
| Total | 292 (100.0%) | 186 (100.0%) |
Health & Disability in Park River
Health Insurance Coverage by Age in Park River
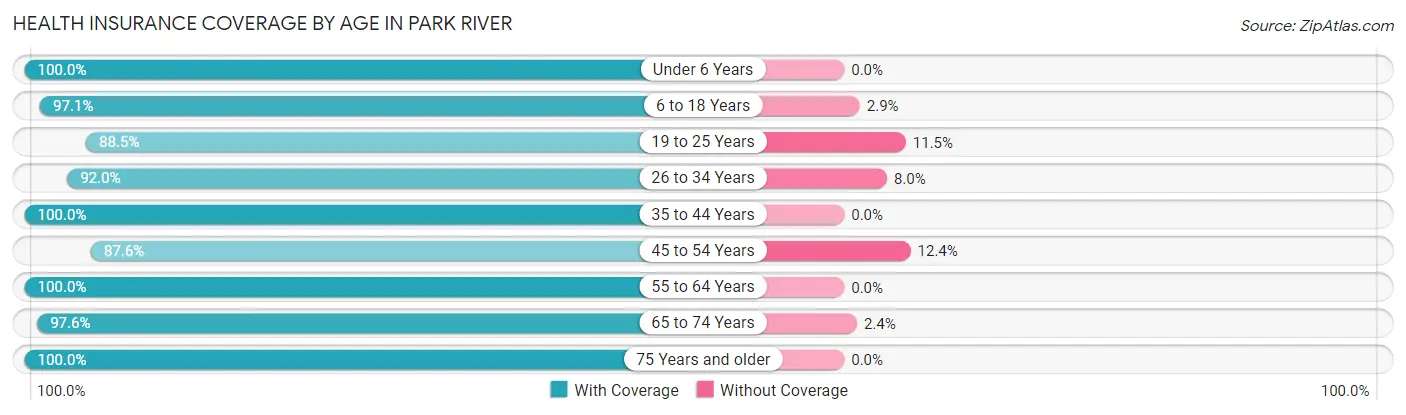
| Age Bracket | With Coverage | Without Coverage |
| Under 6 Years | 96 (100.0%) | 0 (0.0%) |
| 6 to 18 Years | 234 (97.1%) | 7 (2.9%) |
| 19 to 25 Years | 108 (88.5%) | 14 (11.5%) |
| 26 to 34 Years | 104 (92.0%) | 9 (8.0%) |
| 35 to 44 Years | 179 (100.0%) | 0 (0.0%) |
| 45 to 54 Years | 170 (87.6%) | 24 (12.4%) |
| 55 to 64 Years | 159 (100.0%) | 0 (0.0%) |
| 65 to 74 Years | 207 (97.6%) | 5 (2.4%) |
| 75 Years and older | 173 (100.0%) | 0 (0.0%) |
| Total | 1,430 (96.0%) | 59 (4.0%) |
Health Insurance Coverage by Citizenship Status in Park River
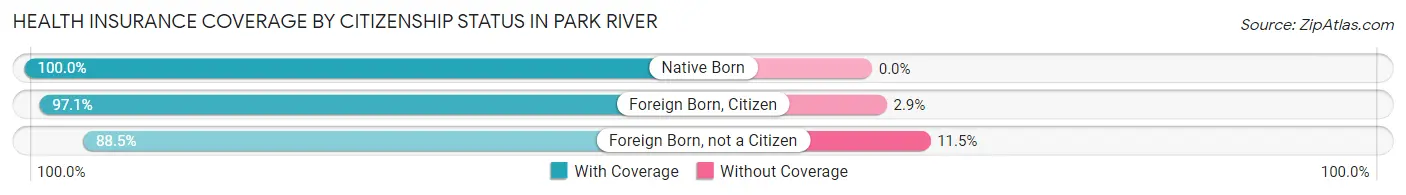
| Citizenship Status | With Coverage | Without Coverage |
| Native Born | 96 (100.0%) | 0 (0.0%) |
| Foreign Born, Citizen | 234 (97.1%) | 7 (2.9%) |
| Foreign Born, not a Citizen | 108 (88.5%) | 14 (11.5%) |
Health Insurance Coverage by Household Income in Park River
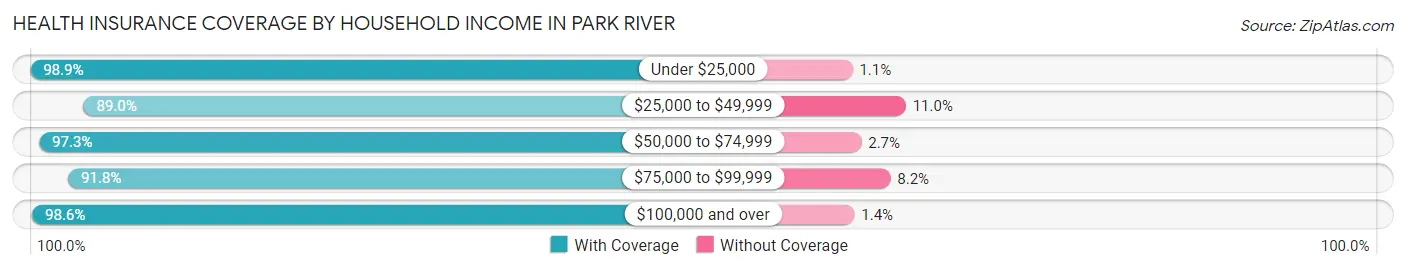
| Household Income | With Coverage | Without Coverage |
| Under $25,000 | 186 (98.9%) | 2 (1.1%) |
| $25,000 to $49,999 | 145 (89.0%) | 18 (11.0%) |
| $50,000 to $74,999 | 251 (97.3%) | 7 (2.7%) |
| $75,000 to $99,999 | 270 (91.8%) | 24 (8.2%) |
| $100,000 and over | 561 (98.6%) | 8 (1.4%) |
Public vs Private Health Insurance Coverage by Age in Park River
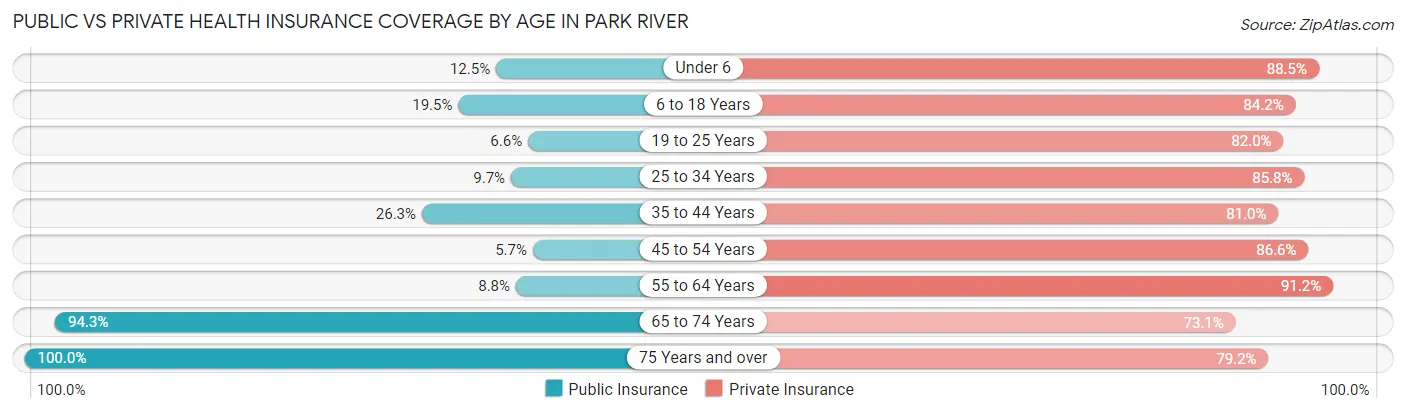
| Age Bracket | Public Insurance | Private Insurance |
| Under 6 | 12 (12.5%) | 85 (88.5%) |
| 6 to 18 Years | 47 (19.5%) | 203 (84.2%) |
| 19 to 25 Years | 8 (6.6%) | 100 (82.0%) |
| 25 to 34 Years | 11 (9.7%) | 97 (85.8%) |
| 35 to 44 Years | 47 (26.3%) | 145 (81.0%) |
| 45 to 54 Years | 11 (5.7%) | 168 (86.6%) |
| 55 to 64 Years | 14 (8.8%) | 145 (91.2%) |
| 65 to 74 Years | 200 (94.3%) | 155 (73.1%) |
| 75 Years and over | 173 (100.0%) | 137 (79.2%) |
| Total | 523 (35.1%) | 1,235 (82.9%) |
Disability Status by Sex by Age in Park River
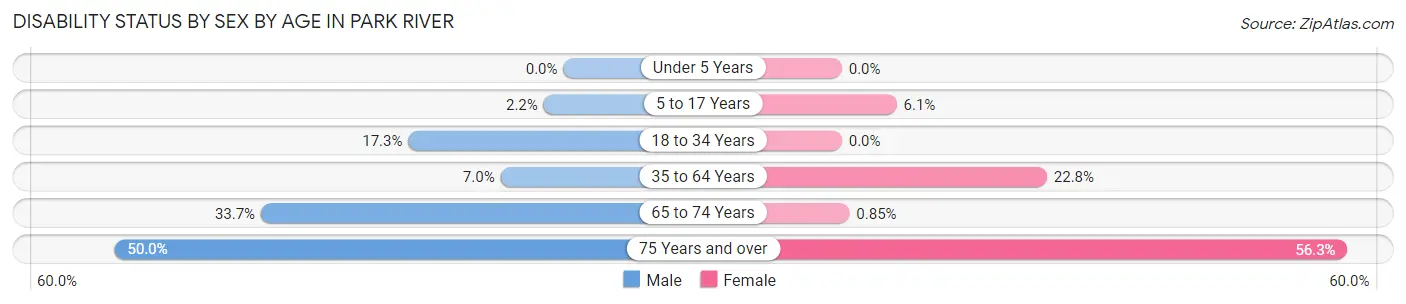
| Age Bracket | Male | Female |
| Under 5 Years | 0 (0.0%) | 0 (0.0%) |
| 5 to 17 Years | 4 (2.2%) | 5 (6.1%) |
| 18 to 34 Years | 19 (17.3%) | 0 (0.0%) |
| 35 to 64 Years | 17 (7.0%) | 66 (22.8%) |
| 65 to 74 Years | 32 (33.7%) | 1 (0.9%) |
| 75 Years and over | 35 (50.0%) | 58 (56.3%) |
Disability Class by Sex by Age in Park River
Disability Class: Hearing Difficulty
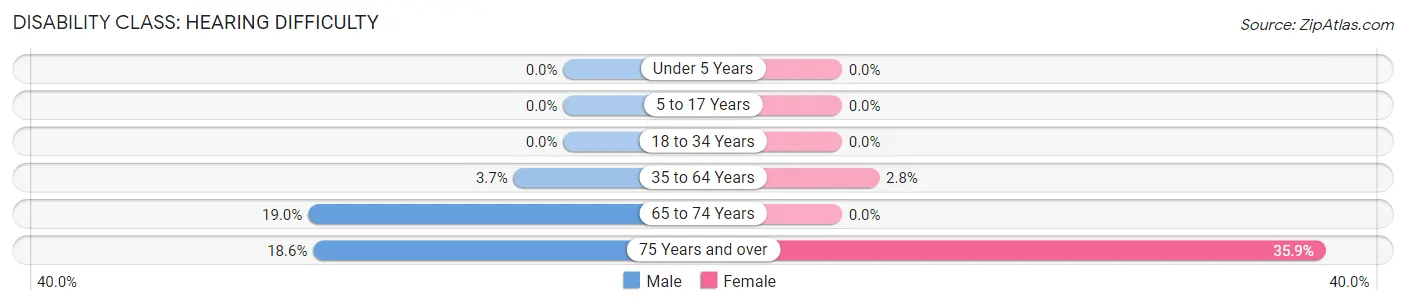
| Age Bracket | Male | Female |
| Under 5 Years | 0 (0.0%) | 0 (0.0%) |
| 5 to 17 Years | 0 (0.0%) | 0 (0.0%) |
| 18 to 34 Years | 0 (0.0%) | 0 (0.0%) |
| 35 to 64 Years | 9 (3.7%) | 8 (2.8%) |
| 65 to 74 Years | 18 (19.0%) | 0 (0.0%) |
| 75 Years and over | 13 (18.6%) | 37 (35.9%) |
Disability Class: Vision Difficulty
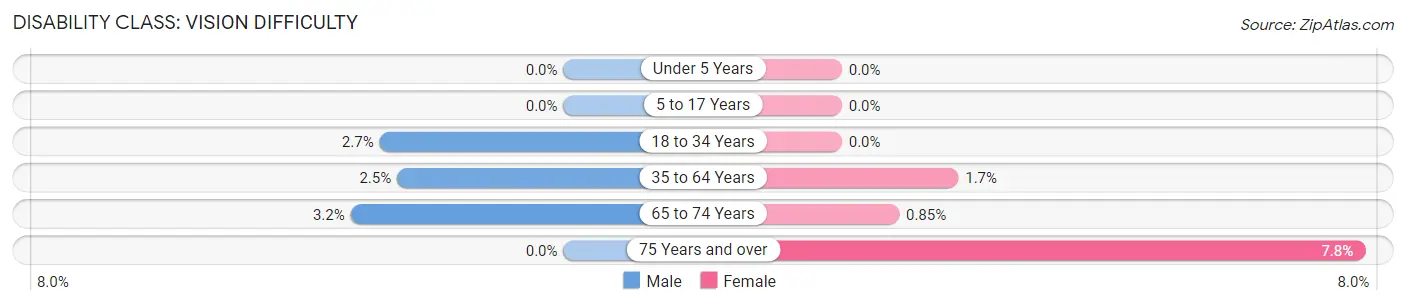
| Age Bracket | Male | Female |
| Under 5 Years | 0 (0.0%) | 0 (0.0%) |
| 5 to 17 Years | 0 (0.0%) | 0 (0.0%) |
| 18 to 34 Years | 3 (2.7%) | 0 (0.0%) |
| 35 to 64 Years | 6 (2.5%) | 5 (1.7%) |
| 65 to 74 Years | 3 (3.2%) | 1 (0.9%) |
| 75 Years and over | 0 (0.0%) | 8 (7.8%) |
Disability Class: Cognitive Difficulty
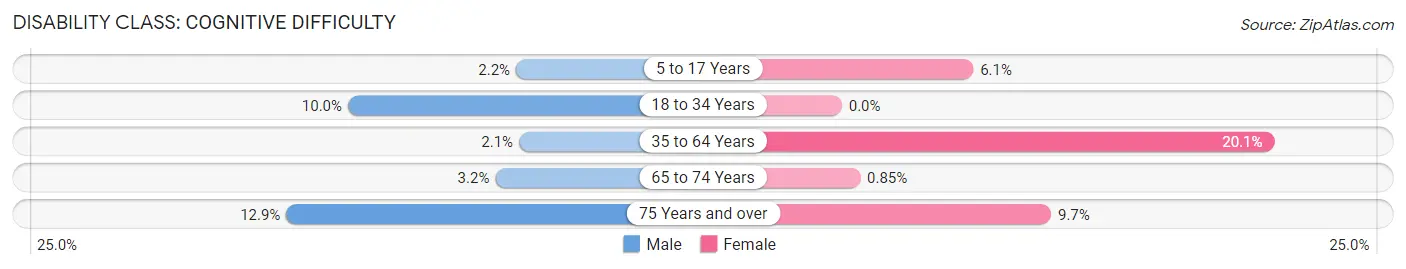
| Age Bracket | Male | Female |
| 5 to 17 Years | 4 (2.2%) | 5 (6.1%) |
| 18 to 34 Years | 11 (10.0%) | 0 (0.0%) |
| 35 to 64 Years | 5 (2.1%) | 58 (20.1%) |
| 65 to 74 Years | 3 (3.2%) | 1 (0.9%) |
| 75 Years and over | 9 (12.9%) | 10 (9.7%) |
Disability Class: Ambulatory Difficulty
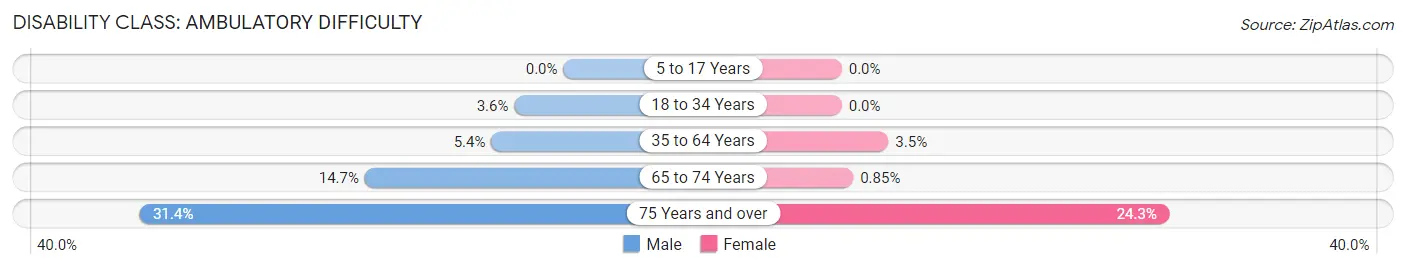
| Age Bracket | Male | Female |
| 5 to 17 Years | 0 (0.0%) | 0 (0.0%) |
| 18 to 34 Years | 4 (3.6%) | 0 (0.0%) |
| 35 to 64 Years | 13 (5.3%) | 10 (3.5%) |
| 65 to 74 Years | 14 (14.7%) | 1 (0.9%) |
| 75 Years and over | 22 (31.4%) | 25 (24.3%) |
Disability Class: Self-Care Difficulty
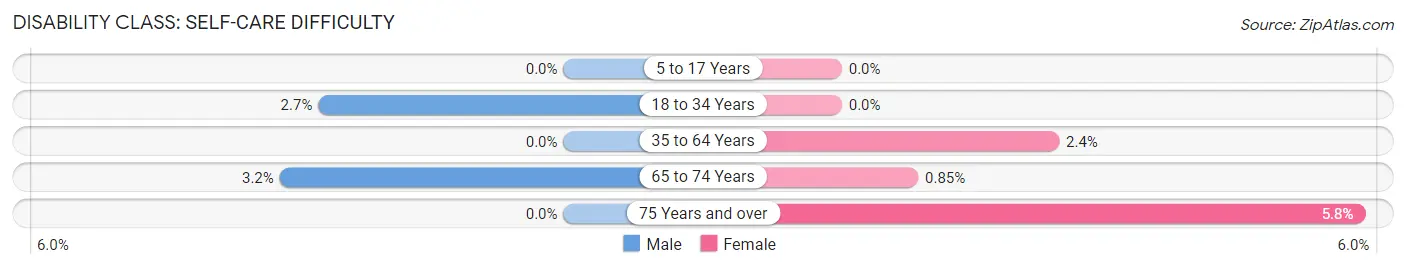
| Age Bracket | Male | Female |
| 5 to 17 Years | 0 (0.0%) | 0 (0.0%) |
| 18 to 34 Years | 3 (2.7%) | 0 (0.0%) |
| 35 to 64 Years | 0 (0.0%) | 7 (2.4%) |
| 65 to 74 Years | 3 (3.2%) | 1 (0.9%) |
| 75 Years and over | 0 (0.0%) | 6 (5.8%) |
Technology Access in Park River
Computing Device Access in Park River
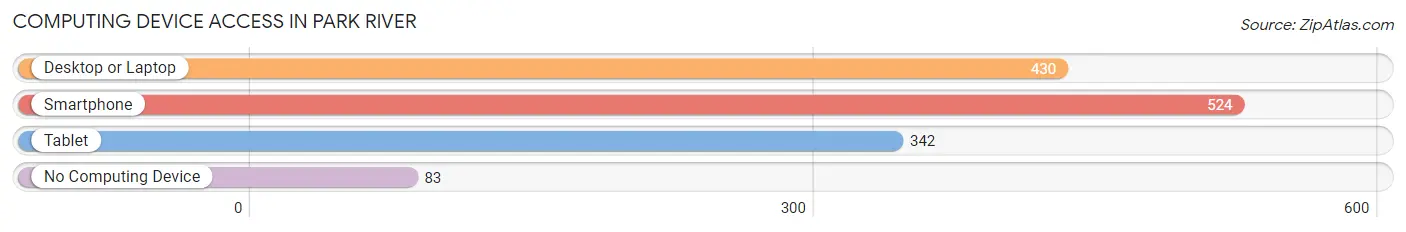
| Device Type | # Households | % Households |
| Desktop or Laptop | 430 | 67.3% |
| Smartphone | 524 | 82.0% |
| Tablet | 342 | 53.5% |
| No Computing Device | 83 | 13.0% |
| Total | 639 | 100.0% |
Internet Access in Park River
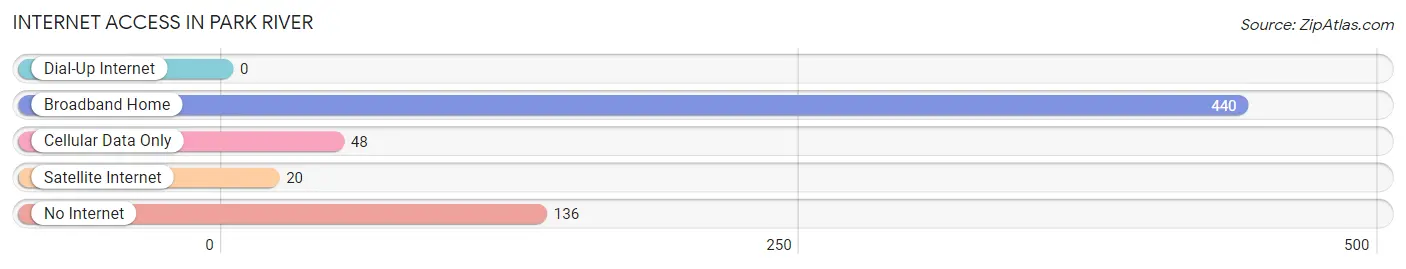
| Internet Type | # Households | % Households |
| Dial-Up Internet | 0 | 0.0% |
| Broadband Home | 440 | 68.9% |
| Cellular Data Only | 48 | 7.5% |
| Satellite Internet | 20 | 3.1% |
| No Internet | 136 | 21.3% |
| Total | 639 | 100.0% |
Park River Summary
River Park, North Dakota is a small city located in Walsh County, North Dakota. It is situated on the banks of the Park River, which is a tributary of the Red River of the North. The city was founded in 1881 and is the county seat of Walsh County. As of the 2010 census, the population of River Park was 1,845.
Geography
River Park is located at the intersection of U.S. Route 81 and North Dakota State Highway 17. The city is situated on the banks of the Park River, which is a tributary of the Red River of the North. The city is located in the Red River Valley, which is a flat, fertile plain that stretches from the Canadian border to the south. The city is surrounded by agricultural land, and the Park River flows through the city.
Climate
River Park has a humid continental climate, with cold winters and hot summers. The average annual temperature is 45°F (7°C), and the average annual precipitation is 22 inches (56 cm).
Demographics
As of the 2010 census, the population of River Park was 1,845. The racial makeup of the city was 97.3% White, 0.3% African American, 0.3% Native American, 0.3% Asian, 0.2% from other races, and 1.5% from two or more races. Hispanic or Latino of any race were 1.2% of the population.
Economy
River Park is a small city with a limited economy. The city is home to several small businesses, including a grocery store, a hardware store, a restaurant, and a bank. The city is also home to a number of manufacturing companies, including a furniture manufacturer, a plastics manufacturer, and a metal fabrication company. The city is also home to a number of agricultural businesses, including a dairy farm, a grain elevator, and a feed mill.
History
River Park was founded in 1881 and was named after the Park River, which flows through the city. The city was originally a trading post for the local Native American tribes, and it was later settled by European immigrants. The city was incorporated in 1883 and was designated as the county seat of Walsh County. The city grew rapidly in the late 19th and early 20th centuries, and it became a center for the local agricultural industry. The city was also home to a number of manufacturing companies, including a furniture manufacturer, a plastics manufacturer, and a metal fabrication company.
In the late 20th century, the city began to decline as the local economy shifted away from manufacturing and agriculture. The city has since become a bedroom community for the larger cities in the region, and it has seen a resurgence in recent years as a center for tourism and recreation. The city is home to a number of parks and recreational areas, including the Park River Recreation Area, which is a popular destination for fishing, boating, and camping.
Common Questions
What is Per Capita Income in Park River?
Per Capita income in Park River is $34,971.
What is the Median Family Income in Park River?
Median Family Income in Park River is $82,353.
What is the Median Household income in Park River?
Median Household Income in Park River is $70,764.
What is Income or Wage Gap in Park River?
Income or Wage Gap in Park River is 15.8%.
Women in Park River earn 84.2 cents for every dollar earned by a man.
What is Inequality or Gini Index in Park River?
Inequality or Gini Index in Park River is 0.38.
What is the Total Population of Park River?
Total Population of Park River is 1,556.
What is the Total Male Population of Park River?
Total Male Population of Park River is 753.
What is the Total Female Population of Park River?
Total Female Population of Park River is 803.
What is the Ratio of Males per 100 Females in Park River?
There are 93.77 Males per 100 Females in Park River.
What is the Ratio of Females per 100 Males in Park River?
There are 106.64 Females per 100 Males in Park River.
What is the Median Population Age in Park River?
Median Population Age in Park River is 47.2 Years.
What is the Average Family Size in Park River
Average Family Size in Park River is 3.0 People.
What is the Average Household Size in Park River
Average Household Size in Park River is 2.3 People.
How Large is the Labor Force in Park River?
There are 711 People in the Labor Forcein in Park River.
What is the Percentage of People in the Labor Force in Park River?
56.4% of People are in the Labor Force in Park River.
What is the Unemployment Rate in Park River?
Unemployment Rate in Park River is 1.0%.