China Grove, TX Map & Demographics
China Grove Map
China Grove Overview
$44,656
PER CAPITA INCOME
$129,091
AVG FAMILY INCOME
$99,671
AVG HOUSEHOLD INCOME
8.4%
WAGE / INCOME GAP [ % ]
91.6¢/ $1
WAGE / INCOME GAP [ $ ]
0.37
INEQUALITY / GINI INDEX
1,660
TOTAL POPULATION
761
MALE POPULATION
899
FEMALE POPULATION
84.65
MALES / 100 FEMALES
118.13
FEMALES / 100 MALES
42.4
MEDIAN AGE
3.3
AVG FAMILY SIZE
3.1
AVG HOUSEHOLD SIZE
728
LABOR FORCE [ PEOPLE ]
52.2%
PERCENT IN LABOR FORCE
2.1%
UNEMPLOYMENT RATE
China Grove Area Codes
Income in China Grove
Income Overview in China Grove
Per Capita Income in China Grove is $44,656, while median incomes of families and households are $129,091 and $99,671 respectively.
| Characteristic | Number | Measure |
| Per Capita Income | 1,660 | $44,656 |
| Median Family Income | 438 | $129,091 |
| Mean Family Income | 438 | $145,804 |
| Median Household Income | 537 | $99,671 |
| Mean Household Income | 537 | $131,088 |
| Income Deficit | 438 | $0 |
| Wage / Income Gap (%) | 1,660 | 8.45% |
| Wage / Income Gap ($) | 1,660 | 91.55¢ per $1 |
| Gini / Inequality Index | 1,660 | 0.37 |
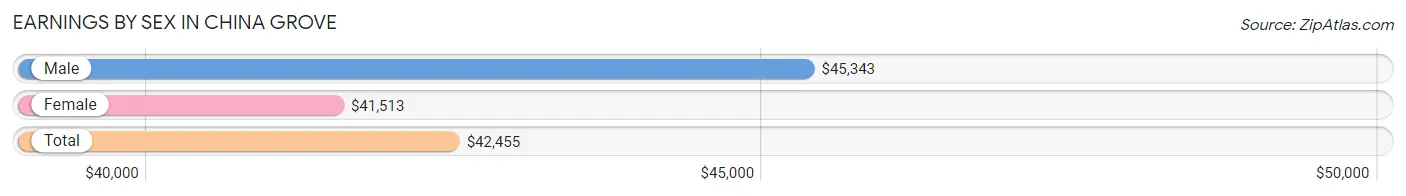
Earnings by Sex in China Grove
Average Earnings in China Grove are $42,455, $45,343 for men and $41,513 for women, a difference of 8.5%.
| Sex | Number | Average Earnings |
| Male | 394 (50.5%) | $45,343 |
| Female | 386 (49.5%) | $41,513 |
| Total | 780 (100.0%) | $42,455 |
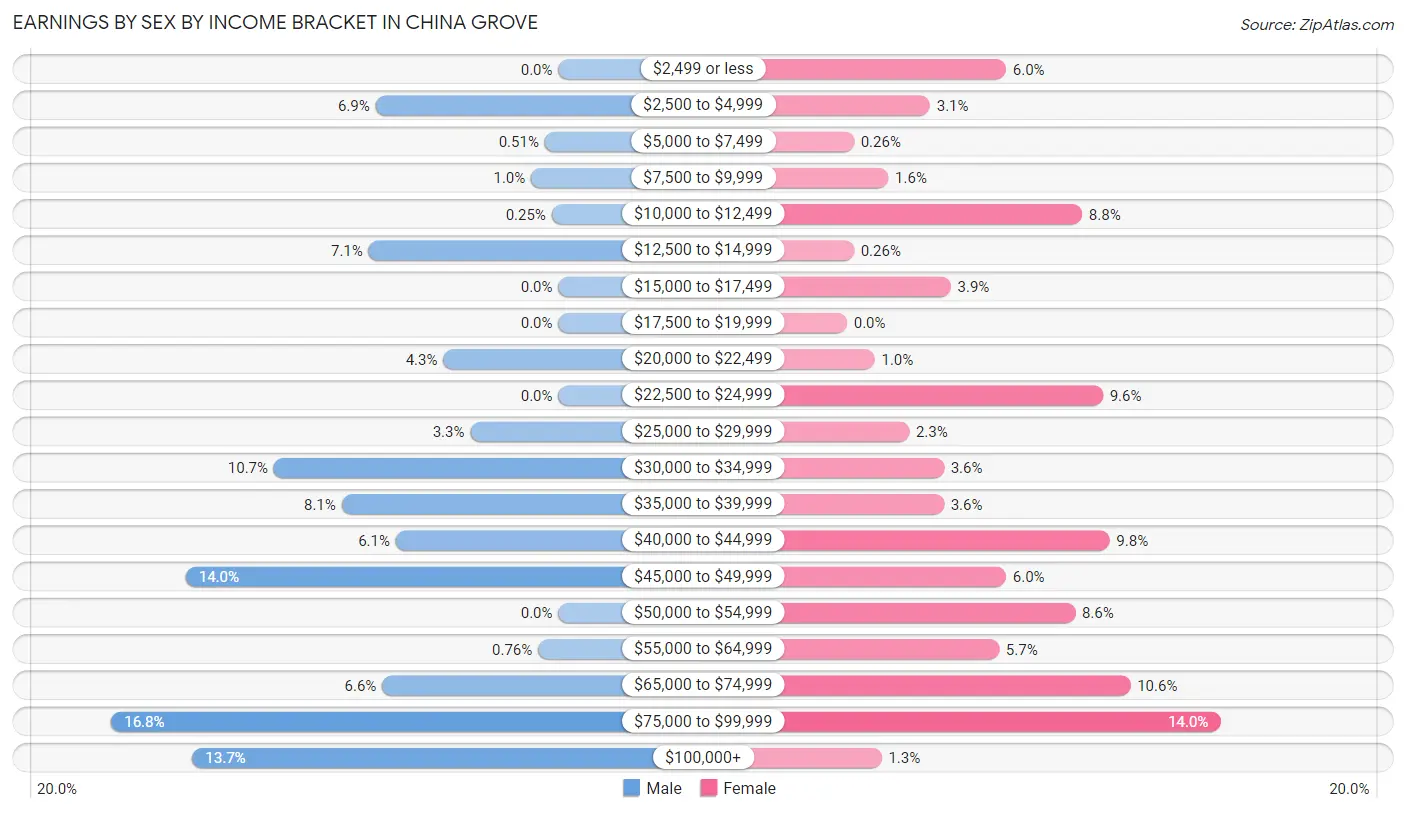
Earnings by Sex by Income Bracket in China Grove
The most common earnings brackets in China Grove are $75,000 to $99,999 for men (66 | 16.8%) and $75,000 to $99,999 for women (54 | 14.0%).
| Income | Male | Female |
| $2,499 or less | 0 (0.0%) | 23 (6.0%) |
| $2,500 to $4,999 | 27 (6.9%) | 12 (3.1%) |
| $5,000 to $7,499 | 2 (0.5%) | 1 (0.3%) |
| $7,500 to $9,999 | 4 (1.0%) | 6 (1.5%) |
| $10,000 to $12,499 | 1 (0.3%) | 34 (8.8%) |
| $12,500 to $14,999 | 28 (7.1%) | 1 (0.3%) |
| $15,000 to $17,499 | 0 (0.0%) | 15 (3.9%) |
| $17,500 to $19,999 | 0 (0.0%) | 0 (0.0%) |
| $20,000 to $22,499 | 17 (4.3%) | 4 (1.0%) |
| $22,500 to $24,999 | 0 (0.0%) | 37 (9.6%) |
| $25,000 to $29,999 | 13 (3.3%) | 9 (2.3%) |
| $30,000 to $34,999 | 42 (10.7%) | 14 (3.6%) |
| $35,000 to $39,999 | 32 (8.1%) | 14 (3.6%) |
| $40,000 to $44,999 | 24 (6.1%) | 38 (9.8%) |
| $45,000 to $49,999 | 55 (14.0%) | 23 (6.0%) |
| $50,000 to $54,999 | 0 (0.0%) | 33 (8.6%) |
| $55,000 to $64,999 | 3 (0.8%) | 22 (5.7%) |
| $65,000 to $74,999 | 26 (6.6%) | 41 (10.6%) |
| $75,000 to $99,999 | 66 (16.8%) | 54 (14.0%) |
| $100,000+ | 54 (13.7%) | 5 (1.3%) |
| Total | 394 (100.0%) | 386 (100.0%) |
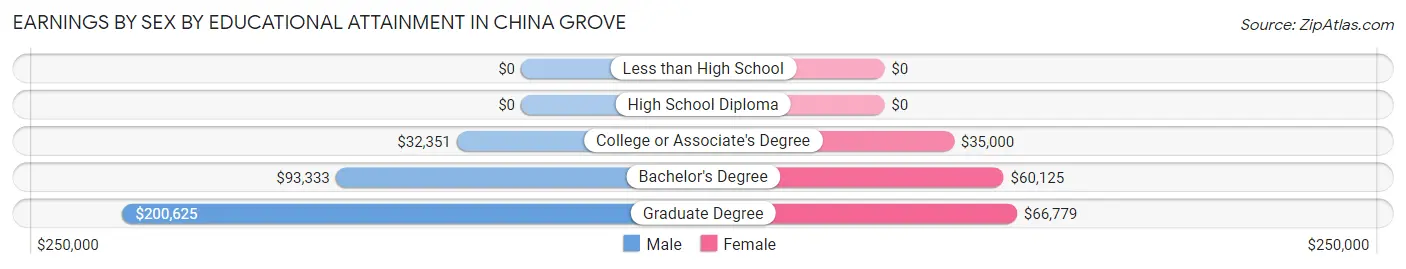
Earnings by Sex by Educational Attainment in China Grove
Average earnings in China Grove are $46,324 for men and $42,105 for women, a difference of 9.1%. Men with an educational attainment of graduate degree enjoy the highest average annual earnings of $200,625, while those with college or associate's degree education earn the least with $32,351. Women with an educational attainment of graduate degree earn the most with the average annual earnings of $66,779, while those with college or associate's degree education have the smallest earnings of $35,000.
| Educational Attainment | Male Income | Female Income |
| Less than High School | - | - |
| High School Diploma | - | - |
| College or Associate's Degree | $32,351 | $35,000 |
| Bachelor's Degree | $93,333 | $60,125 |
| Graduate Degree | $200,625 | $66,779 |
| Total | $46,324 | $42,105 |
Family Income in China Grove
Family Income Brackets in China Grove
According to the China Grove family income data, there are 97 families falling into the $200,000+ income range, which is the most common income bracket and makes up 22.2% of all families. Conversely, the $10,000 to $14,999 income bracket is the least frequent group with only 1 families (0.2%) belonging to this category.
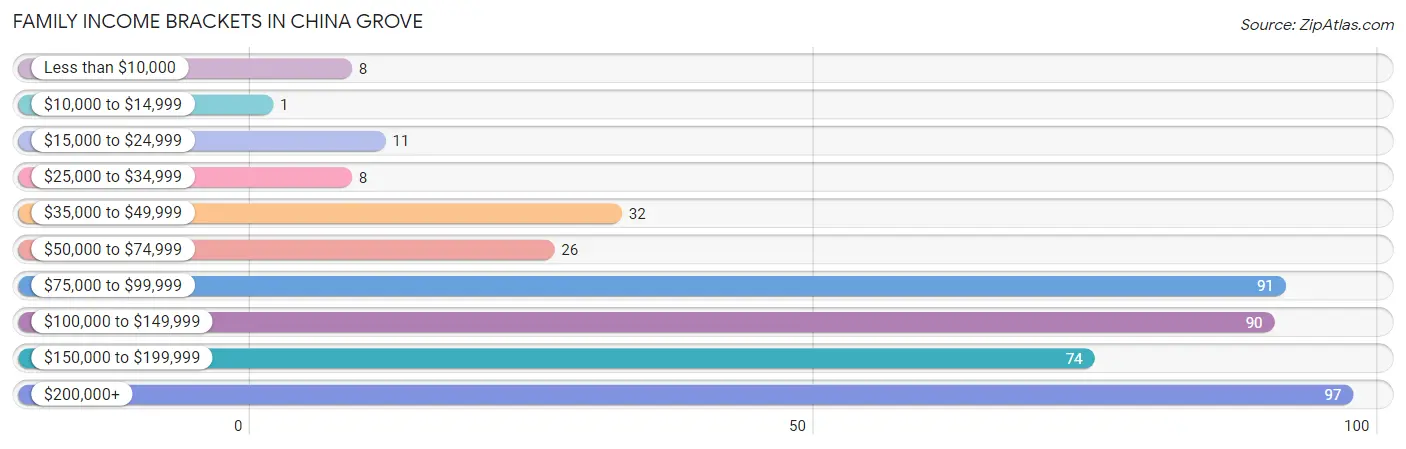
| Income Bracket | # Families | % Families |
| Less than $10,000 | 8 | 1.8% |
| $10,000 to $14,999 | 1 | 0.2% |
| $15,000 to $24,999 | 11 | 2.5% |
| $25,000 to $34,999 | 8 | 1.8% |
| $35,000 to $49,999 | 32 | 7.3% |
| $50,000 to $74,999 | 26 | 5.9% |
| $75,000 to $99,999 | 91 | 20.8% |
| $100,000 to $149,999 | 90 | 20.5% |
| $150,000 to $199,999 | 74 | 16.9% |
| $200,000+ | 97 | 22.1% |
Family Income by Famaliy Size in China Grove
4-person families (27 | 6.2%) account for the highest median family income in China Grove with $205,250 per family, while 3-person families (107 | 24.4%) have the highest median income of $60,125 per family member.
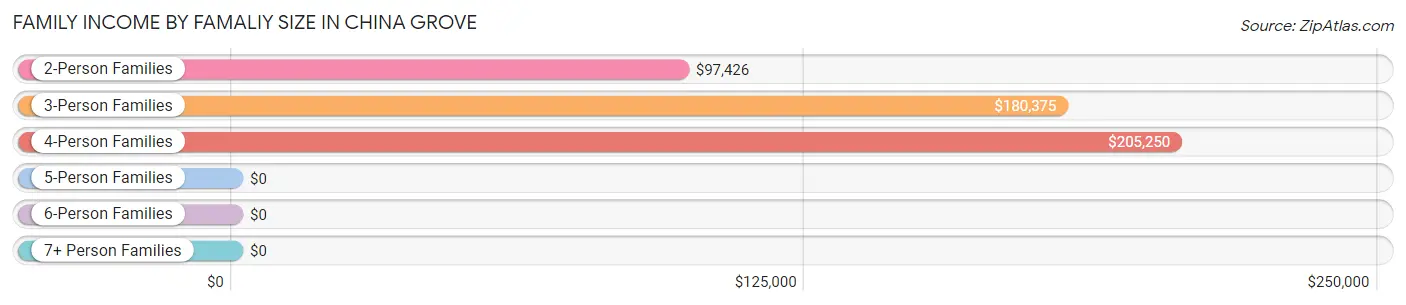
| Income Bracket | # Families | Median Income |
| 2-Person Families | 205 (46.8%) | $97,426 |
| 3-Person Families | 107 (24.4%) | $180,375 |
| 4-Person Families | 27 (6.2%) | $205,250 |
| 5-Person Families | 89 (20.3%) | $0 |
| 6-Person Families | 0 (0.0%) | $0 |
| 7+ Person Families | 10 (2.3%) | $0 |
| Total | 438 (100.0%) | $129,091 |
Family Income by Number of Earners in China Grove
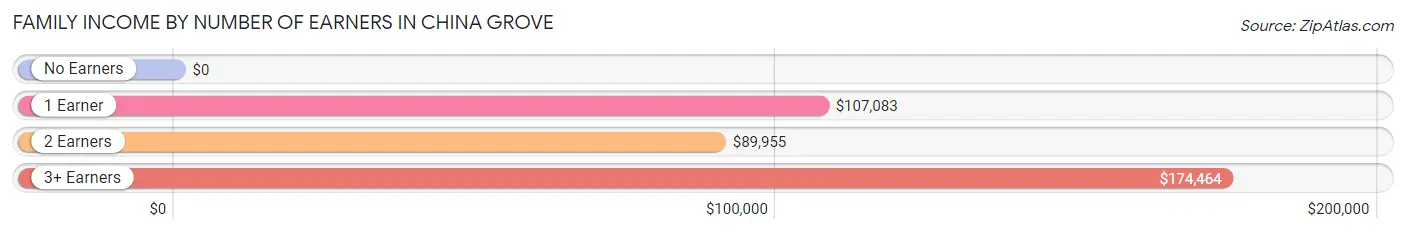
| Number of Earners | # Families | Median Income |
| No Earners | 115 (26.3%) | $0 |
| 1 Earner | 90 (20.5%) | $107,083 |
| 2 Earners | 166 (37.9%) | $89,955 |
| 3+ Earners | 67 (15.3%) | $174,464 |
| Total | 438 (100.0%) | $129,091 |
Household Income in China Grove
Household Income Brackets in China Grove
With 116 households falling in the category, the $75,000 to $99,999 income range is the most frequent in China Grove, accounting for 21.6% of all households. In contrast, only 1 households (0.2%) fall into the $10,000 to $14,999 income bracket, making it the least populous group.
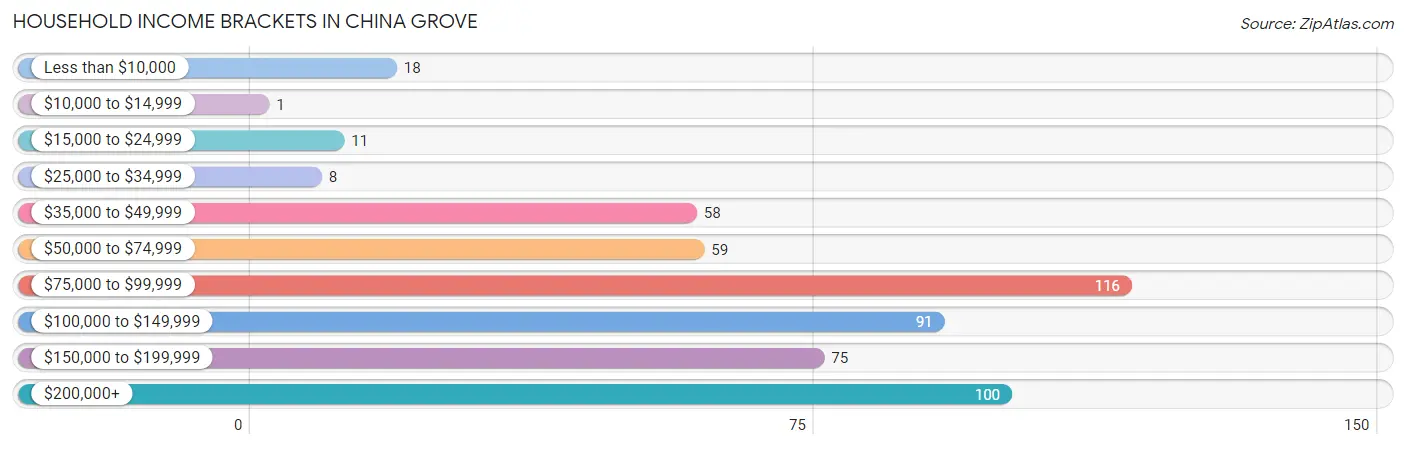
| Income Bracket | # Households | % Households |
| Less than $10,000 | 18 | 3.4% |
| $10,000 to $14,999 | 1 | 0.2% |
| $15,000 to $24,999 | 11 | 2.0% |
| $25,000 to $34,999 | 8 | 1.5% |
| $35,000 to $49,999 | 58 | 10.8% |
| $50,000 to $74,999 | 59 | 11.0% |
| $75,000 to $99,999 | 116 | 21.6% |
| $100,000 to $149,999 | 91 | 16.9% |
| $150,000 to $199,999 | 75 | 14.0% |
| $200,000+ | 100 | 18.6% |
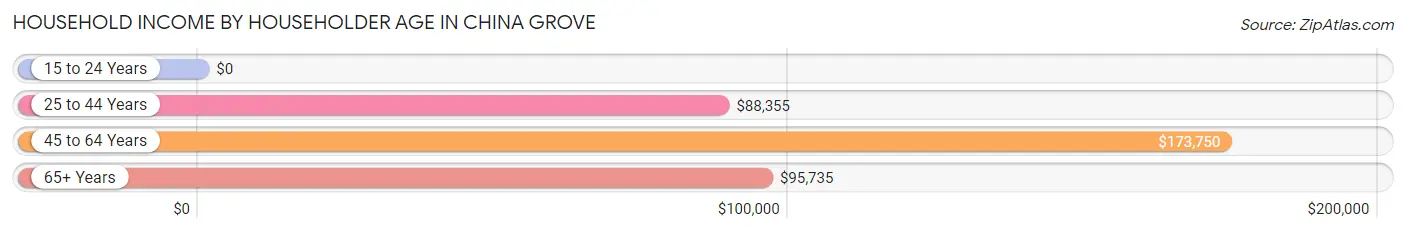
Household Income by Householder Age in China Grove
The median household income in China Grove is $99,671, with the highest median household income of $173,750 found in the 45 to 64 years age bracket for the primary householder. A total of 263 households (49.0%) fall into this category.
| Income Bracket | # Households | Median Income |
| 15 to 24 Years | 0 (0.0%) | $0 |
| 25 to 44 Years | 110 (20.5%) | $88,355 |
| 45 to 64 Years | 263 (49.0%) | $173,750 |
| 65+ Years | 164 (30.5%) | $95,735 |
| Total | 537 (100.0%) | $99,671 |
Poverty in China Grove
Income Below Poverty by Sex and Age in China Grove
With 2.2% poverty level for males and 7.4% for females among the residents of China Grove, 75 year old and over males and 16 and 17 year old females are the most vulnerable to poverty, with 4 males (7.1%) and 22 females (27.5%) in their respective age groups living below the poverty level.
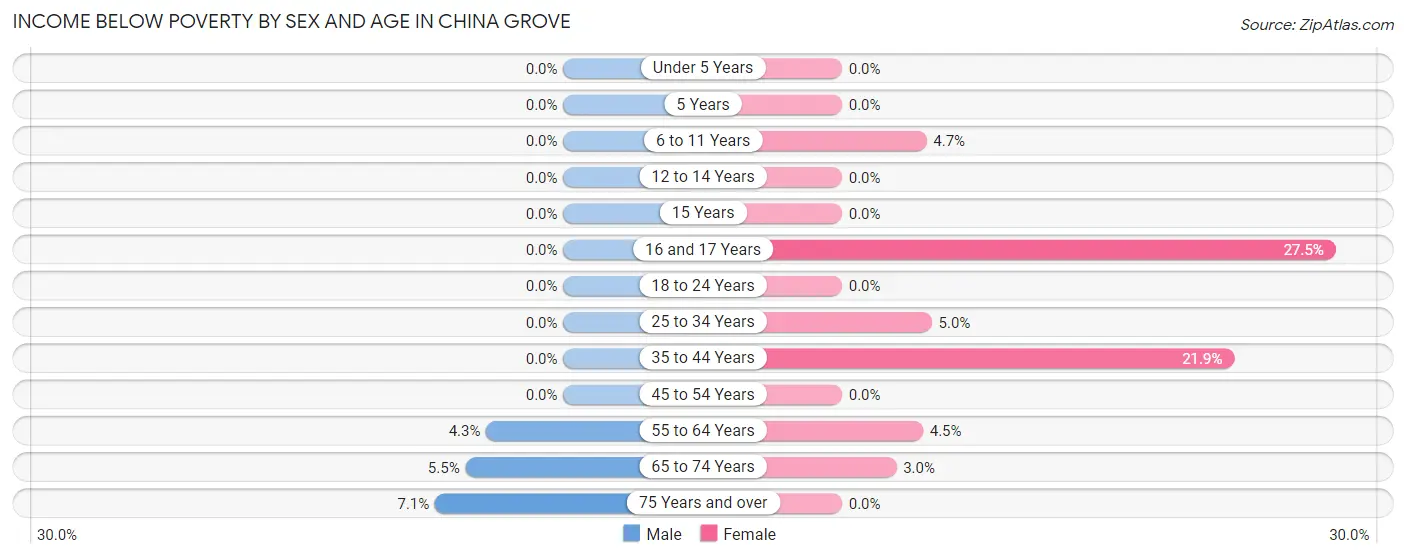
| Age Bracket | Male | Female |
| Under 5 Years | 0 (0.0%) | 0 (0.0%) |
| 5 Years | 0 (0.0%) | 0 (0.0%) |
| 6 to 11 Years | 0 (0.0%) | 4 (4.7%) |
| 12 to 14 Years | 0 (0.0%) | 0 (0.0%) |
| 15 Years | 0 (0.0%) | 0 (0.0%) |
| 16 and 17 Years | 0 (0.0%) | 22 (27.5%) |
| 18 to 24 Years | 0 (0.0%) | 0 (0.0%) |
| 25 to 34 Years | 0 (0.0%) | 6 (5.0%) |
| 35 to 44 Years | 0 (0.0%) | 26 (21.8%) |
| 45 to 54 Years | 0 (0.0%) | 0 (0.0%) |
| 55 to 64 Years | 6 (4.3%) | 6 (4.5%) |
| 65 to 74 Years | 6 (5.4%) | 3 (3.0%) |
| 75 Years and over | 4 (7.1%) | 0 (0.0%) |
| Total | 16 (2.2%) | 67 (7.4%) |
Income Above Poverty by Sex and Age in China Grove
According to the poverty statistics in China Grove, males aged under 5 years and females aged under 5 years are the age groups that are most secure financially, with 100.0% of males and 100.0% of females in these age groups living above the poverty line.
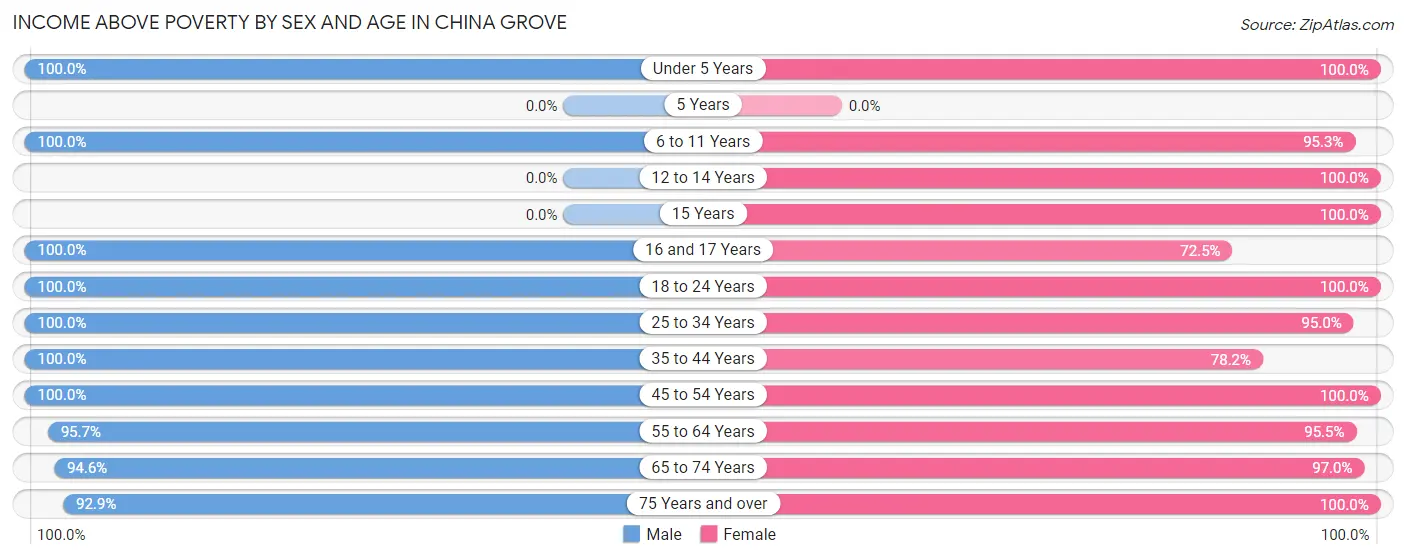
| Age Bracket | Male | Female |
| Under 5 Years | 46 (100.0%) | 45 (100.0%) |
| 5 Years | 0 (0.0%) | 0 (0.0%) |
| 6 to 11 Years | 7 (100.0%) | 81 (95.3%) |
| 12 to 14 Years | 0 (0.0%) | 13 (100.0%) |
| 15 Years | 0 (0.0%) | 45 (100.0%) |
| 16 and 17 Years | 113 (100.0%) | 58 (72.5%) |
| 18 to 24 Years | 45 (100.0%) | 14 (100.0%) |
| 25 to 34 Years | 26 (100.0%) | 114 (95.0%) |
| 35 to 44 Years | 82 (100.0%) | 93 (78.1%) |
| 45 to 54 Years | 112 (100.0%) | 91 (100.0%) |
| 55 to 64 Years | 134 (95.7%) | 127 (95.5%) |
| 65 to 74 Years | 104 (94.6%) | 96 (97.0%) |
| 75 Years and over | 52 (92.9%) | 55 (100.0%) |
| Total | 721 (97.8%) | 832 (92.5%) |
Income Below Poverty Among Married-Couple Families in China Grove
The poverty statistics for married-couple families in China Grove show that 0.3% or 1 of the total 345 families live below the poverty line. Families with no children have the highest poverty rate of 0.5%, comprising of 1 families. On the other hand, families with 1 or 2 children have the lowest poverty rate of 0.0%, which includes 0 families.
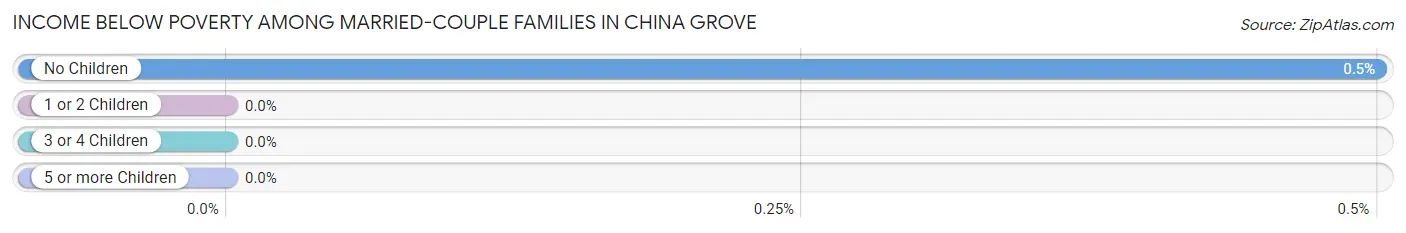
| Children | Above Poverty | Below Poverty |
| No Children | 201 (99.5%) | 1 (0.5%) |
| 1 or 2 Children | 81 (100.0%) | 0 (0.0%) |
| 3 or 4 Children | 62 (100.0%) | 0 (0.0%) |
| 5 or more Children | 0 (0.0%) | 0 (0.0%) |
| Total | 344 (99.7%) | 1 (0.3%) |
Income Below Poverty Among Single-Parent Households in China Grove
According to the poverty data in China Grove, 9.4% or 5 single-father households and 7.5% or 3 single-mother households are living below the poverty line. Among single-father households, those with no children have the highest poverty rate, with 5 households (100.0%) experiencing poverty. Likewise, among single-mother households, those with 1 or 2 children have the highest poverty rate, with 3 households (25.0%) falling below the poverty line.
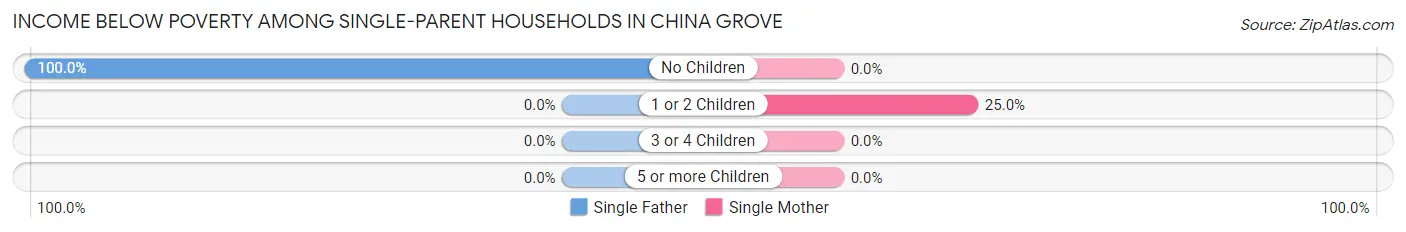
| Children | Single Father | Single Mother |
| No Children | 5 (100.0%) | 0 (0.0%) |
| 1 or 2 Children | 0 (0.0%) | 3 (25.0%) |
| 3 or 4 Children | 0 (0.0%) | 0 (0.0%) |
| 5 or more Children | 0 (0.0%) | 0 (0.0%) |
| Total | 5 (9.4%) | 3 (7.5%) |
Income Below Poverty Among Married-Couple vs Single-Parent Households in China Grove
The poverty data for China Grove shows that 1 of the married-couple family households (0.3%) and 8 of the single-parent households (8.6%) are living below the poverty level. Within the married-couple family households, those with no children have the highest poverty rate, with 1 households (0.5%) falling below the poverty line. Among the single-parent households, those with no children have the highest poverty rate, with 5 household (15.1%) living below poverty.
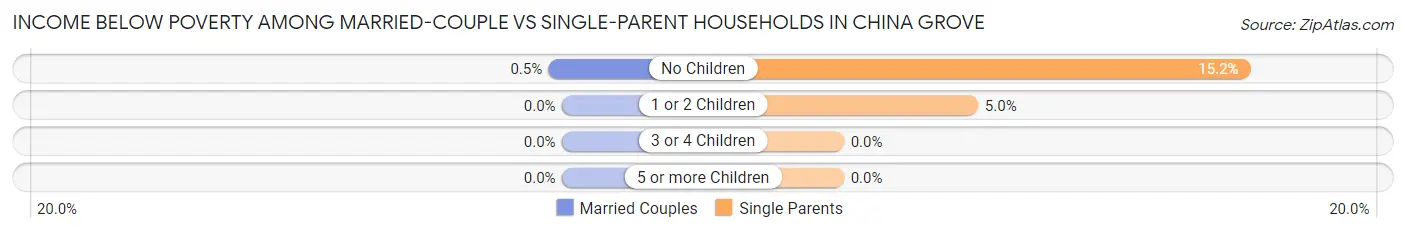
| Children | Married-Couple Families | Single-Parent Households |
| No Children | 1 (0.5%) | 5 (15.1%) |
| 1 or 2 Children | 0 (0.0%) | 3 (5.0%) |
| 3 or 4 Children | 0 (0.0%) | 0 (0.0%) |
| 5 or more Children | 0 (0.0%) | 0 (0.0%) |
| Total | 1 (0.3%) | 8 (8.6%) |
Race in China Grove
The most populous races in China Grove are Hispanic or Latino (822 | 49.5%), White / Caucasian (817 | 49.2%), and Two or more Races (425 | 25.6%).
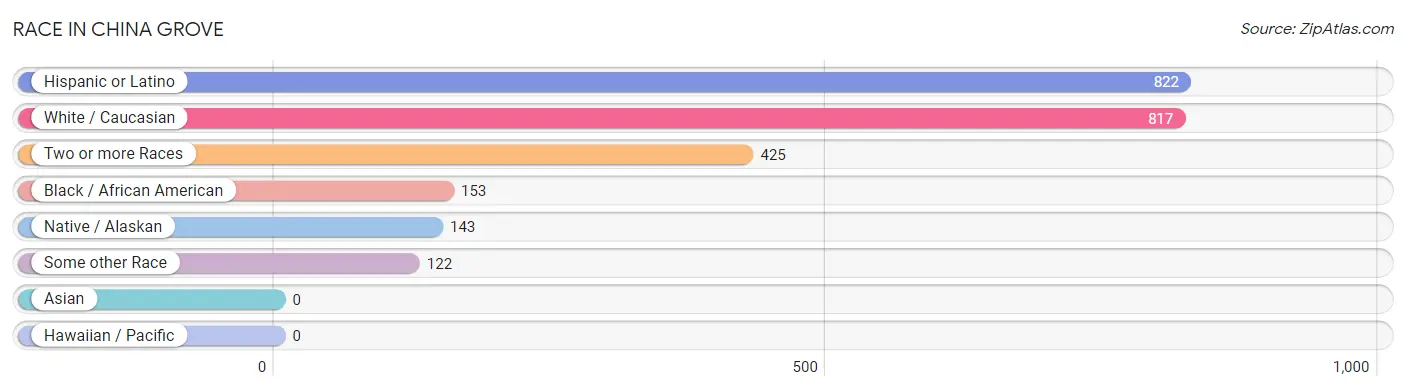
| Race | # Population | % Population |
| Asian | 0 | 0.0% |
| Black / African American | 153 | 9.2% |
| Hawaiian / Pacific | 0 | 0.0% |
| Hispanic or Latino | 822 | 49.5% |
| Native / Alaskan | 143 | 8.6% |
| White / Caucasian | 817 | 49.2% |
| Two or more Races | 425 | 25.6% |
| Some other Race | 122 | 7.3% |
| Total | 1,660 | 100.0% |
Ancestry in China Grove
The most populous ancestries reported in China Grove are Mexican (749 | 45.1%), German (283 | 17.1%), Polish (122 | 7.3%), Irish (85 | 5.1%), and American (70 | 4.2%), together accounting for 78.9% of all China Grove residents.
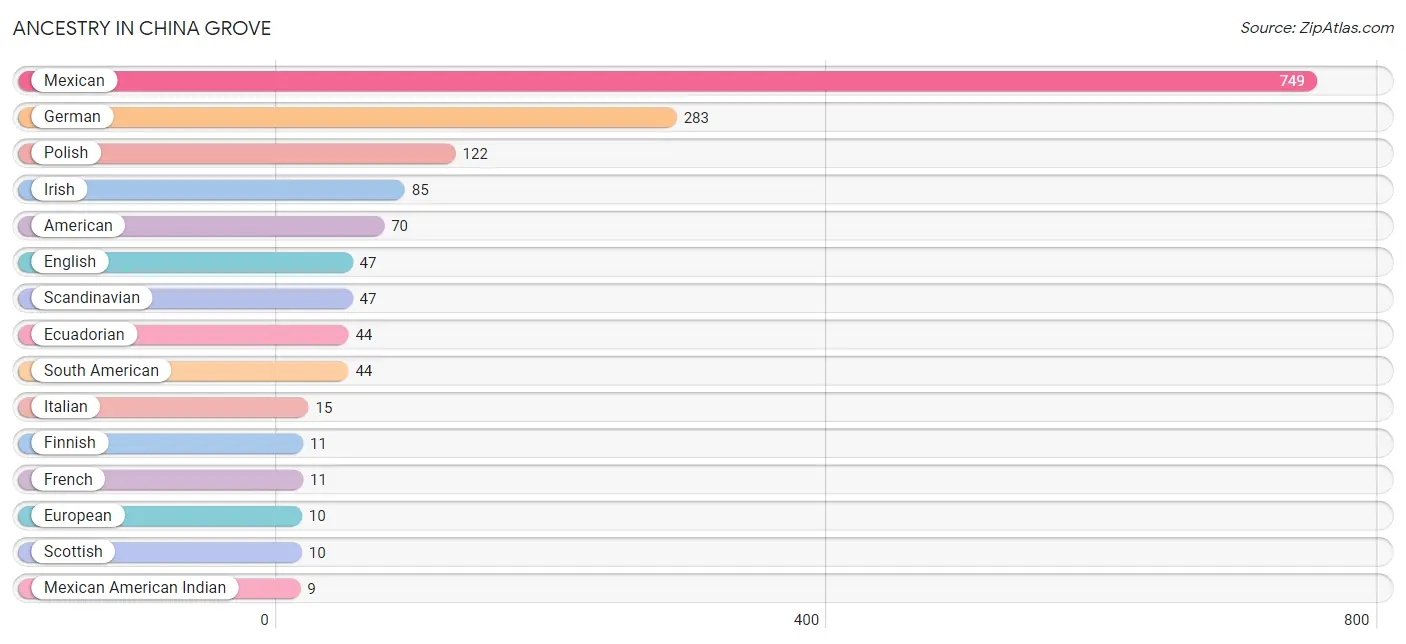
| Ancestry | # Population | % Population |
| Aleut | 3 | 0.2% |
| American | 70 | 4.2% |
| Belgian | 4 | 0.2% |
| Bhutanese | 2 | 0.1% |
| Cherokee | 4 | 0.2% |
| Choctaw | 3 | 0.2% |
| Czech | 8 | 0.5% |
| Dominican | 4 | 0.2% |
| Dutch | 4 | 0.2% |
| Ecuadorian | 44 | 2.6% |
| English | 47 | 2.8% |
| European | 10 | 0.6% |
| Finnish | 11 | 0.7% |
| French | 11 | 0.7% |
| French Canadian | 7 | 0.4% |
| German | 283 | 17.1% |
| Irish | 85 | 5.1% |
| Italian | 15 | 0.9% |
| Korean | 7 | 0.4% |
| Mexican | 749 | 45.1% |
| Mexican American Indian | 9 | 0.5% |
| Polish | 122 | 7.3% |
| Romanian | 2 | 0.1% |
| Scandinavian | 47 | 2.8% |
| Scotch-Irish | 3 | 0.2% |
| Scottish | 10 | 0.6% |
| South American | 44 | 2.6% |
| Spanish | 4 | 0.2% | View All 28 Rows |
Immigrants in China Grove
The most numerous immigrant groups reported in China Grove came from Latin America (133 | 8.0%), Central America (89 | 5.4%), Mexico (89 | 5.4%), Ecuador (44 | 2.6%), and South America (44 | 2.6%), together accounting for 24.0% of all China Grove residents.
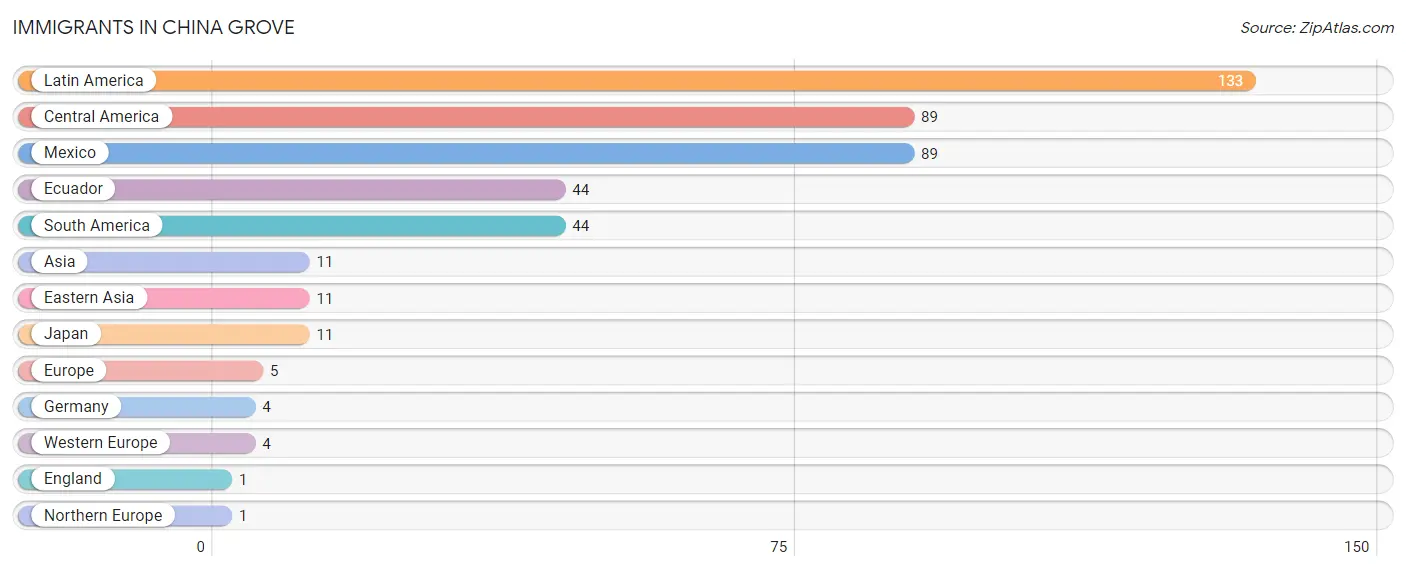
| Immigration Origin | # Population | % Population |
| Asia | 11 | 0.7% |
| Central America | 89 | 5.4% |
| Eastern Asia | 11 | 0.7% |
| Ecuador | 44 | 2.6% |
| England | 1 | 0.1% |
| Europe | 5 | 0.3% |
| Germany | 4 | 0.2% |
| Japan | 11 | 0.7% |
| Latin America | 133 | 8.0% |
| Mexico | 89 | 5.4% |
| Northern Europe | 1 | 0.1% |
| South America | 44 | 2.6% |
| Western Europe | 4 | 0.2% | View All 13 Rows |
Sex and Age in China Grove
Sex and Age in China Grove
The most populous age groups in China Grove are 15 to 19 Years (139 | 18.3%) for men and 15 to 19 Years (125 | 13.9%) for women.
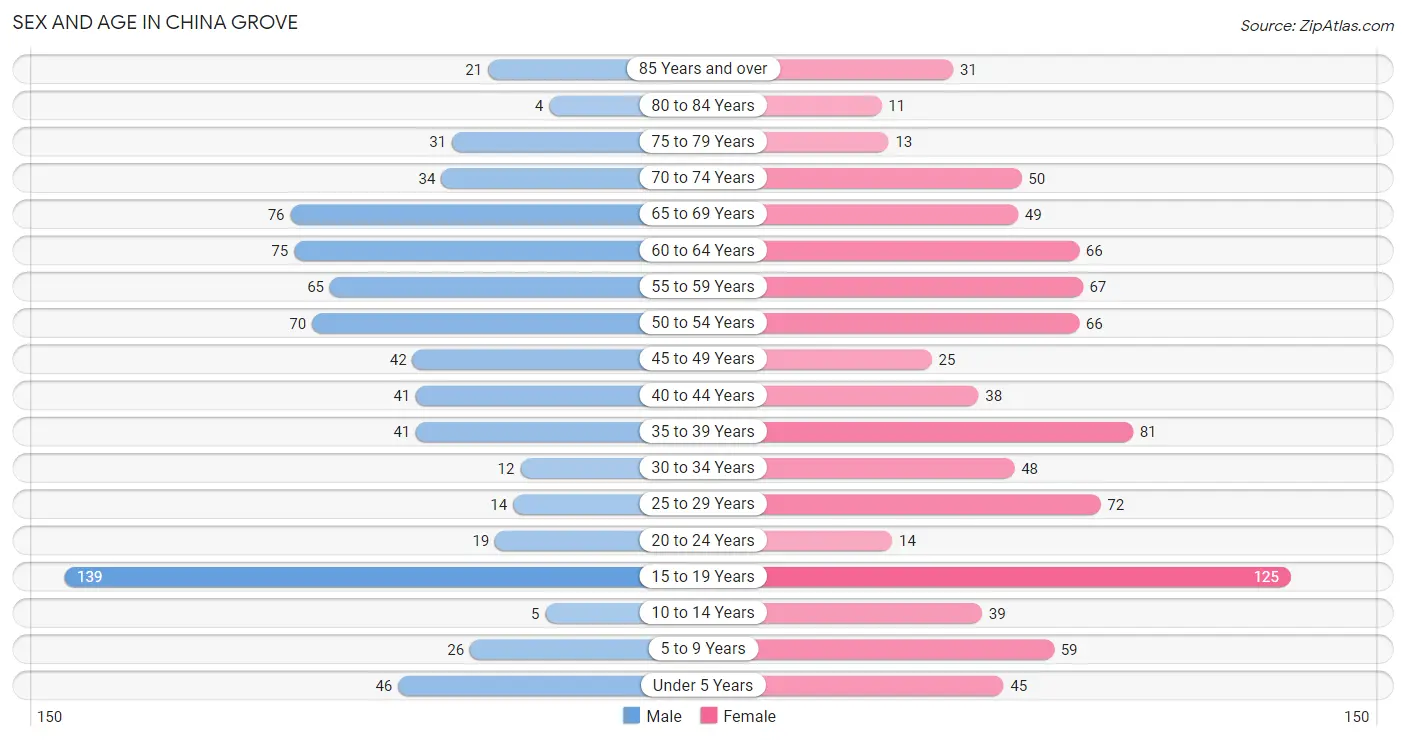
| Age Bracket | Male | Female |
| Under 5 Years | 46 (6.0%) | 45 (5.0%) |
| 5 to 9 Years | 26 (3.4%) | 59 (6.6%) |
| 10 to 14 Years | 5 (0.7%) | 39 (4.3%) |
| 15 to 19 Years | 139 (18.3%) | 125 (13.9%) |
| 20 to 24 Years | 19 (2.5%) | 14 (1.6%) |
| 25 to 29 Years | 14 (1.8%) | 72 (8.0%) |
| 30 to 34 Years | 12 (1.6%) | 48 (5.3%) |
| 35 to 39 Years | 41 (5.4%) | 81 (9.0%) |
| 40 to 44 Years | 41 (5.4%) | 38 (4.2%) |
| 45 to 49 Years | 42 (5.5%) | 25 (2.8%) |
| 50 to 54 Years | 70 (9.2%) | 66 (7.3%) |
| 55 to 59 Years | 65 (8.5%) | 67 (7.4%) |
| 60 to 64 Years | 75 (9.9%) | 66 (7.3%) |
| 65 to 69 Years | 76 (10.0%) | 49 (5.4%) |
| 70 to 74 Years | 34 (4.5%) | 50 (5.6%) |
| 75 to 79 Years | 31 (4.1%) | 13 (1.5%) |
| 80 to 84 Years | 4 (0.5%) | 11 (1.2%) |
| 85 Years and over | 21 (2.8%) | 31 (3.5%) |
| Total | 761 (100.0%) | 899 (100.0%) |
Families and Households in China Grove
Median Family Size in China Grove
The median family size in China Grove is 3.33 persons per family, with married-couple families (345 | 78.8%) accounting for the largest median family size of 3.57 persons per family. On the other hand, single male/father families (53 | 12.1%) represent the smallest median family size with 2.28 persons per family.
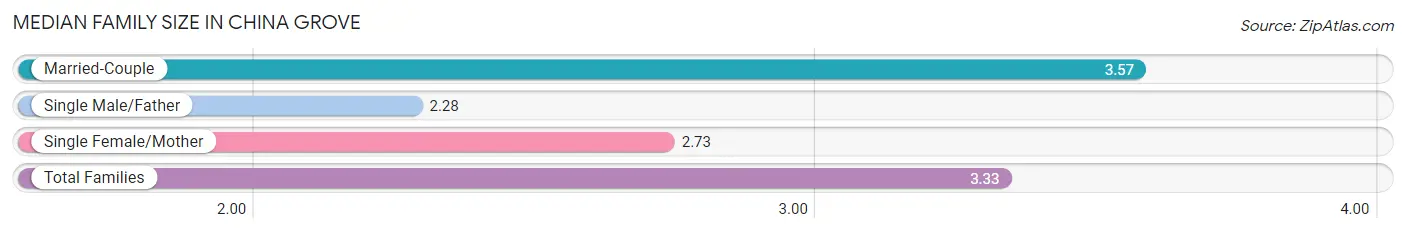
| Family Type | # Families | Family Size |
| Married-Couple | 345 (78.8%) | 3.57 |
| Single Male/Father | 53 (12.1%) | 2.28 |
| Single Female/Mother | 40 (9.1%) | 2.73 |
| Total Families | 438 (100.0%) | 3.33 |
Median Household Size in China Grove
The median household size in China Grove is 3.09 persons per household, with married-couple households (345 | 64.2%) accounting for the largest median household size of 3.6 persons per household. non-family households (99 | 18.4%) represent the smallest median household size with 1.87 persons per household.
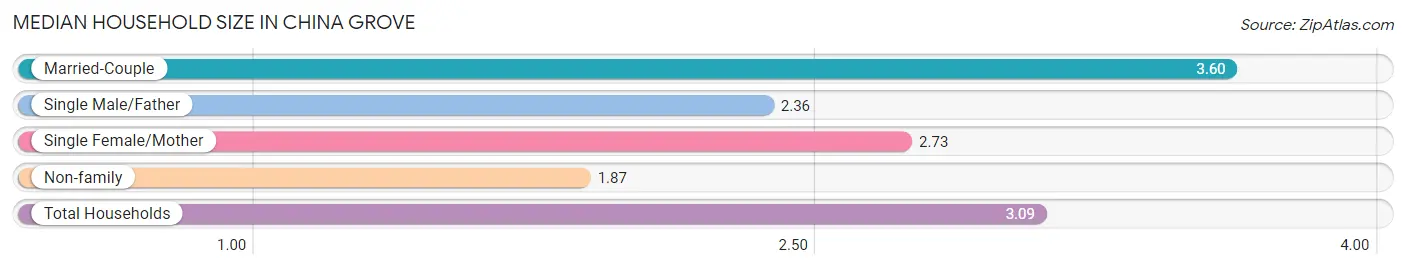
| Household Type | # Households | Household Size |
| Married-Couple | 345 (64.2%) | 3.60 |
| Single Male/Father | 53 (9.9%) | 2.36 |
| Single Female/Mother | 40 (7.4%) | 2.73 |
| Non-family | 99 (18.4%) | 1.87 |
| Total Households | 537 (100.0%) | 3.09 |
Household Size by Marriage Status in China Grove
Out of a total of 537 households in China Grove, 438 (81.6%) are family households, while 99 (18.4%) are nonfamily households. The most numerous type of family households are 2-person households, comprising 200, and the most common type of nonfamily households are 1-person households, comprising 62.
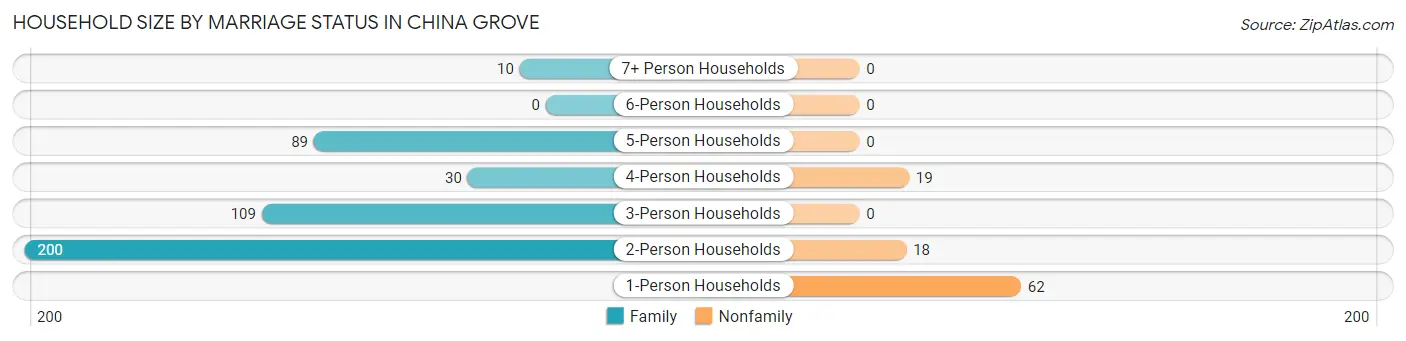
| Household Size | Family Households | Nonfamily Households |
| 1-Person Households | - | 62 (11.6%) |
| 2-Person Households | 200 (37.2%) | 18 (3.4%) |
| 3-Person Households | 109 (20.3%) | 0 (0.0%) |
| 4-Person Households | 30 (5.6%) | 19 (3.5%) |
| 5-Person Households | 89 (16.6%) | 0 (0.0%) |
| 6-Person Households | 0 (0.0%) | 0 (0.0%) |
| 7+ Person Households | 10 (1.9%) | 0 (0.0%) |
| Total | 438 (81.6%) | 99 (18.4%) |
Female Fertility in China Grove
Fertility by Age in China Grove
Average fertility rate in China Grove is 56.0 births per 1,000 women. Women in the age bracket of 35 to 50 years have the highest fertility rate with 140.0 births per 1,000 women. Women in the age bracket of 35 to 50 years acount for 100.0% of all women with births.
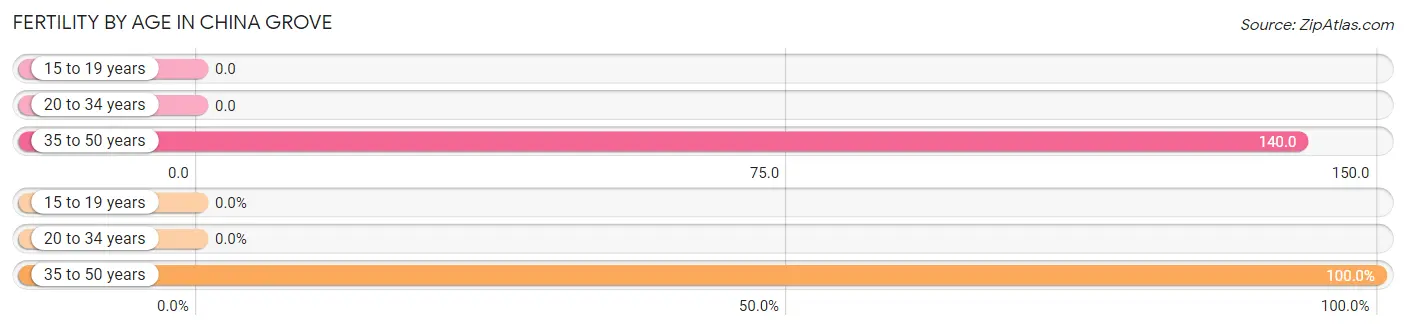
| Age Bracket | Women with Births | Births / 1,000 Women |
| 15 to 19 years | 0 (0.0%) | 0.0 |
| 20 to 34 years | 0 (0.0%) | 0.0 |
| 35 to 50 years | 24 (100.0%) | 140.0 |
| Total | 24 (100.0%) | 56.0 |
Fertility by Age by Marriage Status in China Grove
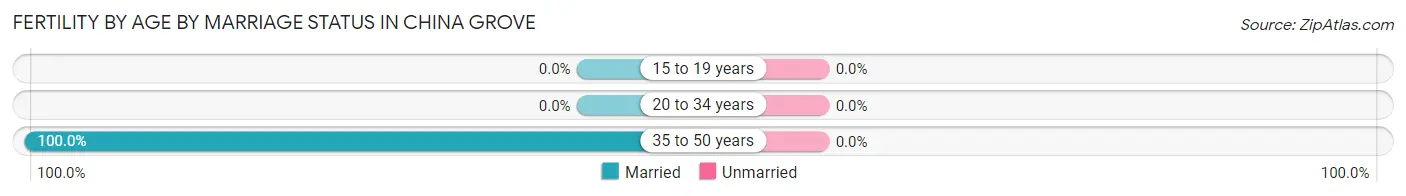
| Age Bracket | Married | Unmarried |
| 15 to 19 years | 0 (0.0%) | 0 (0.0%) |
| 20 to 34 years | 0 (0.0%) | 0 (0.0%) |
| 35 to 50 years | 24 (100.0%) | 0 (0.0%) |
| Total | 24 (100.0%) | 0 (0.0%) |
Fertility by Education in China Grove
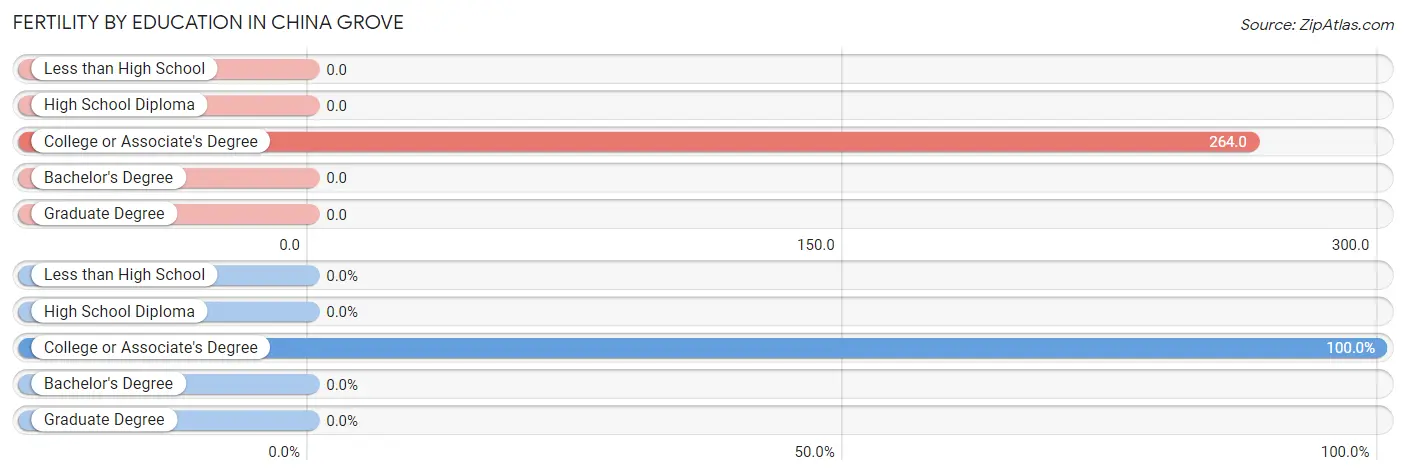
| Educational Attainment | Women with Births | Births / 1,000 Women |
| Less than High School | 0 (0.0%) | 0.0 |
| High School Diploma | 0 (0.0%) | 0.0 |
| College or Associate's Degree | 24 (100.0%) | 264.0 |
| Bachelor's Degree | 0 (0.0%) | 0.0 |
| Graduate Degree | 0 (0.0%) | 0.0 |
| Total | 24 (100.0%) | 56.0 |
Fertility by Education by Marriage Status in China Grove
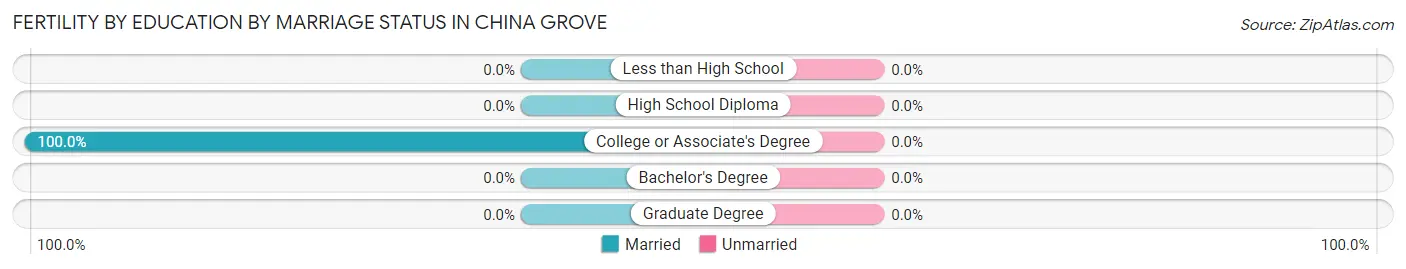
| Educational Attainment | Married | Unmarried |
| Less than High School | 0 (0.0%) | 0 (0.0%) |
| High School Diploma | 0 (0.0%) | 0 (0.0%) |
| College or Associate's Degree | 24 (100.0%) | 0 (0.0%) |
| Bachelor's Degree | 0 (0.0%) | 0 (0.0%) |
| Graduate Degree | 0 (0.0%) | 0 (0.0%) |
| Total | 24 (100.0%) | 0 (0.0%) |
Employment Characteristics in China Grove
Employment by Class of Employer in China Grove
Among the 693 employed individuals in China Grove, private company employees (399 | 57.6%), local government employees (114 | 16.5%), and not-for-profit organizations (61 | 8.8%) make up the most common classes of employment.
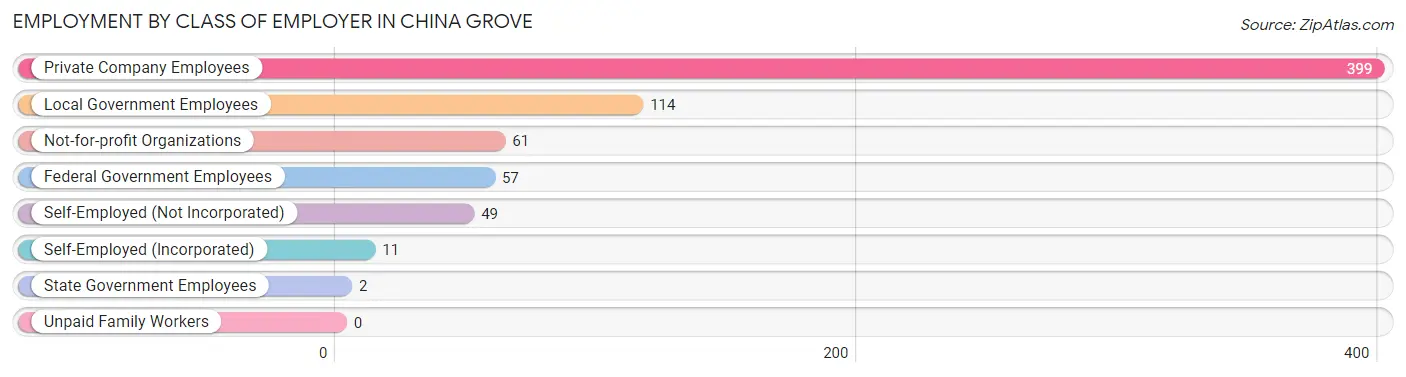
| Employer Class | # Employees | % Employees |
| Private Company Employees | 399 | 57.6% |
| Self-Employed (Incorporated) | 11 | 1.6% |
| Self-Employed (Not Incorporated) | 49 | 7.1% |
| Not-for-profit Organizations | 61 | 8.8% |
| Local Government Employees | 114 | 16.5% |
| State Government Employees | 2 | 0.3% |
| Federal Government Employees | 57 | 8.2% |
| Unpaid Family Workers | 0 | 0.0% |
| Total | 693 | 100.0% |
Employment Status by Age in China Grove
According to the labor force statistics for China Grove, out of the total population over 16 years of age (1,395), 52.2% or 728 individuals are in the labor force, with 2.1% or 15 of them unemployed. The age group with the highest labor force participation rate is 20 to 24 years, with 100.0% or 33 individuals in the labor force. Within the labor force, the 20 to 24 years age range has the highest percentage of unemployed individuals, with 27.3% or 9 of them being unemployed.
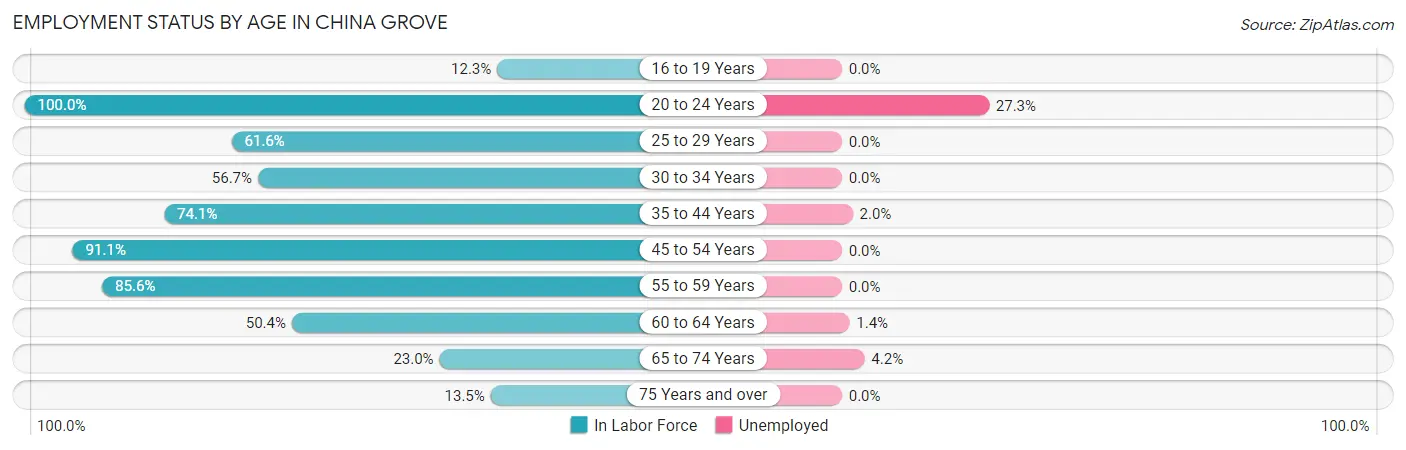
| Age Bracket | In Labor Force | Unemployed |
| 16 to 19 Years | 27 (12.3%) | 0 (0.0%) |
| 20 to 24 Years | 33 (100.0%) | 9 (27.3%) |
| 25 to 29 Years | 53 (61.6%) | 0 (0.0%) |
| 30 to 34 Years | 34 (56.7%) | 0 (0.0%) |
| 35 to 44 Years | 149 (74.1%) | 3 (2.0%) |
| 45 to 54 Years | 185 (91.1%) | 0 (0.0%) |
| 55 to 59 Years | 113 (85.6%) | 0 (0.0%) |
| 60 to 64 Years | 71 (50.4%) | 1 (1.4%) |
| 65 to 74 Years | 48 (23.0%) | 2 (4.2%) |
| 75 Years and over | 15 (13.5%) | 0 (0.0%) |
| Total | 728 (52.2%) | 15 (2.1%) |
Employment Status by Educational Attainment in China Grove
According to labor force statistics for China Grove, 73.5% of individuals (605) out of the total population between 25 and 64 years of age (823) are in the labor force, with 0.7% or 4 of them being unemployed. The group with the highest labor force participation rate are those with the educational attainment of less than high school, with 94.1% or 48 individuals in the labor force. Within the labor force, individuals with bachelor's degree or higher education have the highest percentage of unemployment, with 1.6% or 3 of them being unemployed.
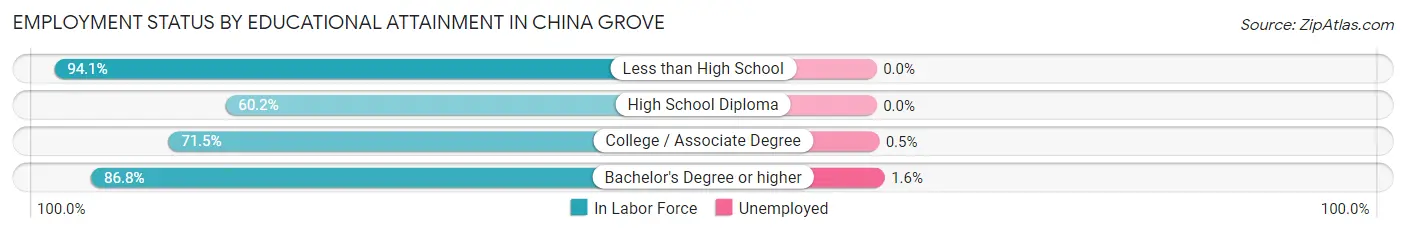
| Educational Attainment | In Labor Force | Unemployed |
| Less than High School | 48 (94.1%) | 0 (0.0%) |
| High School Diploma | 165 (60.2%) | 0 (0.0%) |
| College / Associate Degree | 188 (71.5%) | 1 (0.5%) |
| Bachelor's Degree or higher | 204 (86.8%) | 4 (1.6%) |
| Total | 605 (73.5%) | 6 (0.7%) |
Employment Occupations by Sex in China Grove
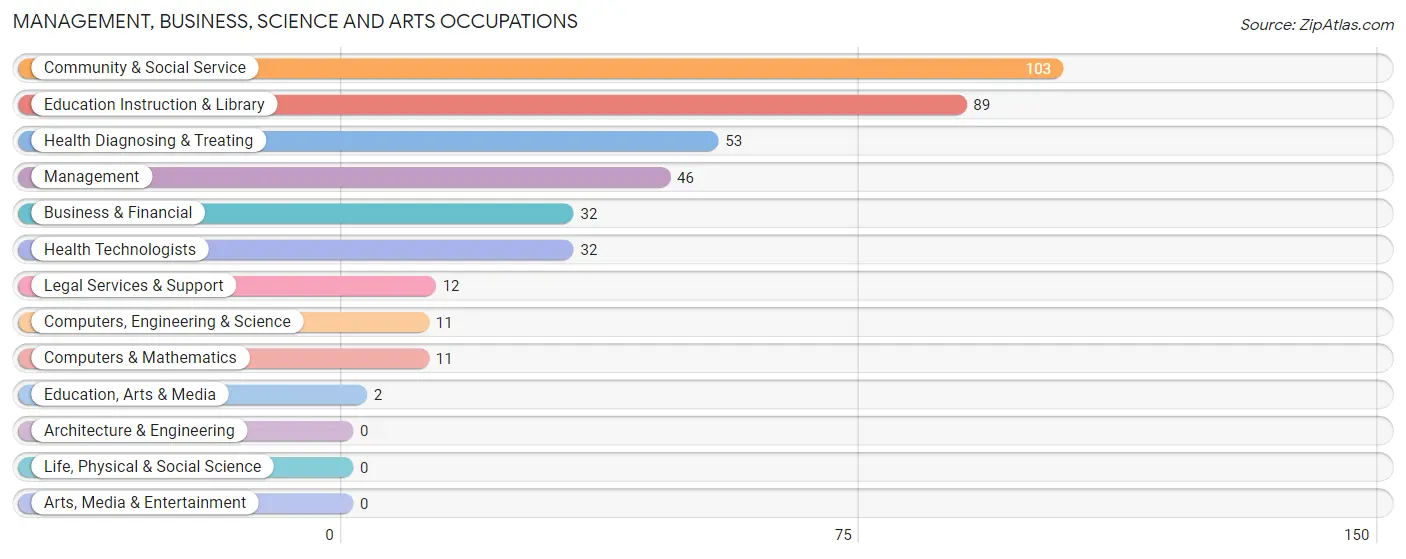
Management, Business, Science and Arts Occupations
The most common Management, Business, Science and Arts occupations in China Grove are Community & Social Service (103 | 14.7%), Education Instruction & Library (89 | 12.7%), Health Diagnosing & Treating (53 | 7.6%), Management (46 | 6.6%), and Business & Financial (32 | 4.6%).
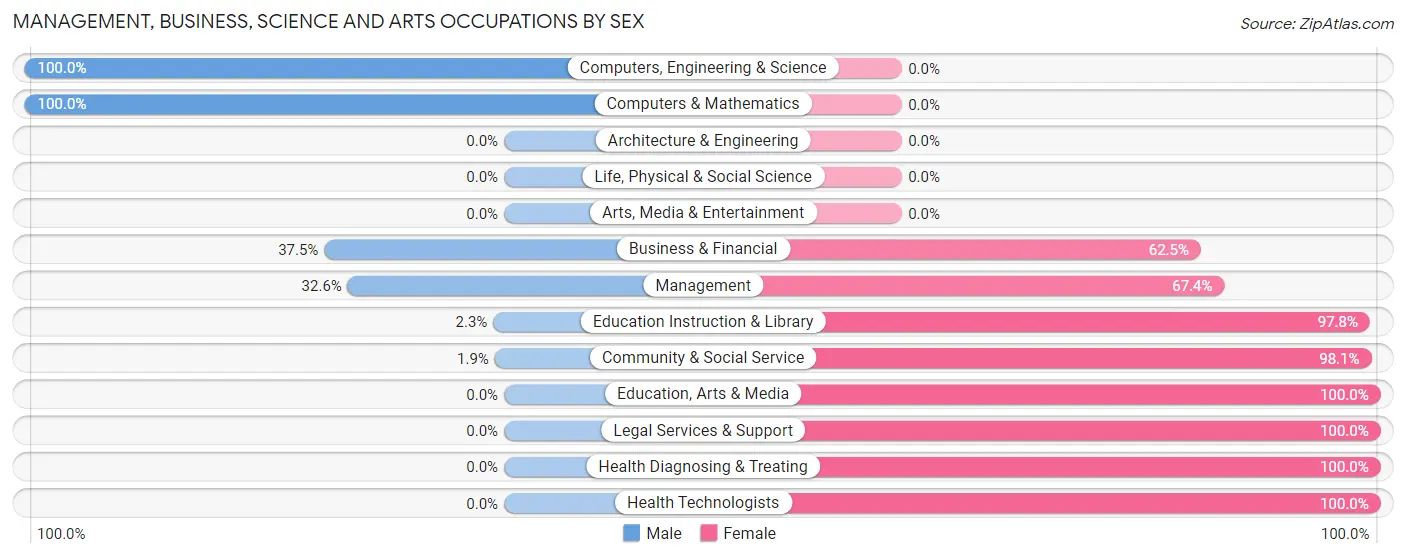
Management, Business, Science and Arts Occupations by Sex
Within the Management, Business, Science and Arts occupations in China Grove, the most male-oriented occupations are Computers, Engineering & Science (100.0%), Computers & Mathematics (100.0%), and Business & Financial (37.5%), while the most female-oriented occupations are Education, Arts & Media (100.0%), Legal Services & Support (100.0%), and Health Diagnosing & Treating (100.0%).
| Occupation | Male | Female |
| Management | 15 (32.6%) | 31 (67.4%) |
| Business & Financial | 12 (37.5%) | 20 (62.5%) |
| Computers, Engineering & Science | 11 (100.0%) | 0 (0.0%) |
| Computers & Mathematics | 11 (100.0%) | 0 (0.0%) |
| Architecture & Engineering | 0 (0.0%) | 0 (0.0%) |
| Life, Physical & Social Science | 0 (0.0%) | 0 (0.0%) |
| Community & Social Service | 2 (1.9%) | 101 (98.1%) |
| Education, Arts & Media | 0 (0.0%) | 2 (100.0%) |
| Legal Services & Support | 0 (0.0%) | 12 (100.0%) |
| Education Instruction & Library | 2 (2.2%) | 87 (97.8%) |
| Arts, Media & Entertainment | 0 (0.0%) | 0 (0.0%) |
| Health Diagnosing & Treating | 0 (0.0%) | 53 (100.0%) |
| Health Technologists | 0 (0.0%) | 32 (100.0%) |
| Total (Category) | 40 (16.3%) | 205 (83.7%) |
| Total (Overall) | 365 (52.2%) | 334 (47.8%) |
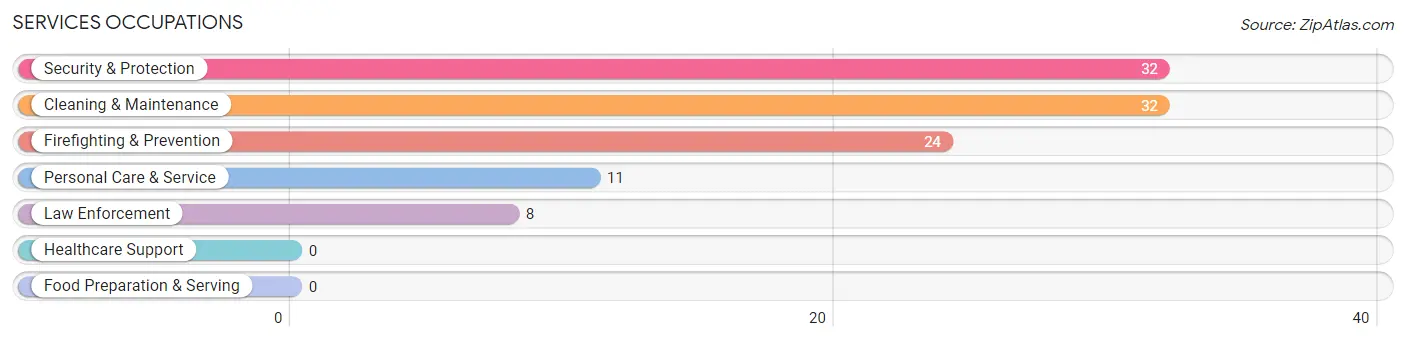
Services Occupations
The most common Services occupations in China Grove are Security & Protection (32 | 4.6%), Cleaning & Maintenance (32 | 4.6%), Firefighting & Prevention (24 | 3.4%), Personal Care & Service (11 | 1.6%), and Law Enforcement (8 | 1.1%).
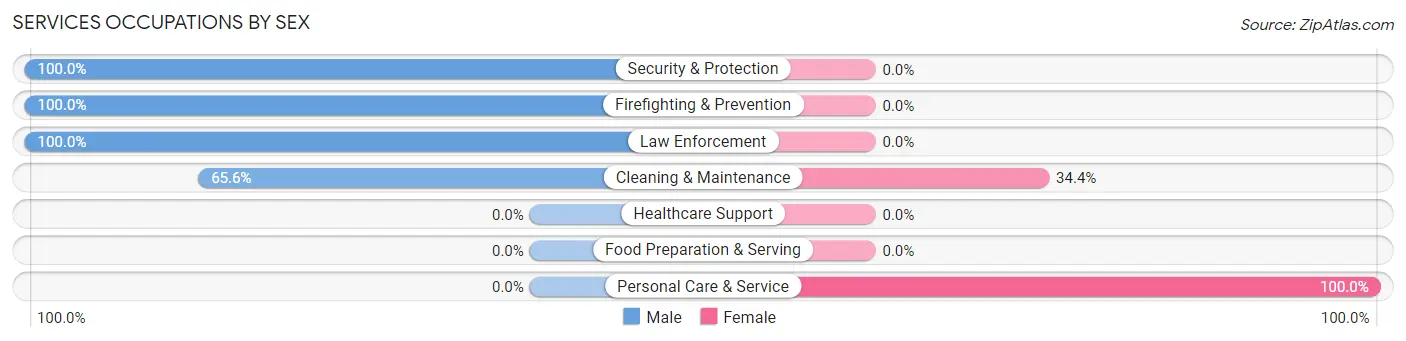
Services Occupations by Sex
Within the Services occupations in China Grove, the most male-oriented occupations are Security & Protection (100.0%), Firefighting & Prevention (100.0%), and Law Enforcement (100.0%), while the most female-oriented occupations are Personal Care & Service (100.0%), and Cleaning & Maintenance (34.4%).
| Occupation | Male | Female |
| Healthcare Support | 0 (0.0%) | 0 (0.0%) |
| Security & Protection | 32 (100.0%) | 0 (0.0%) |
| Firefighting & Prevention | 24 (100.0%) | 0 (0.0%) |
| Law Enforcement | 8 (100.0%) | 0 (0.0%) |
| Food Preparation & Serving | 0 (0.0%) | 0 (0.0%) |
| Cleaning & Maintenance | 21 (65.6%) | 11 (34.4%) |
| Personal Care & Service | 0 (0.0%) | 11 (100.0%) |
| Total (Category) | 53 (70.7%) | 22 (29.3%) |
| Total (Overall) | 365 (52.2%) | 334 (47.8%) |
Sales and Office Occupations
The most common Sales and Office occupations in China Grove are Office & Administration (185 | 26.5%), and Sales & Related (49 | 7.0%).
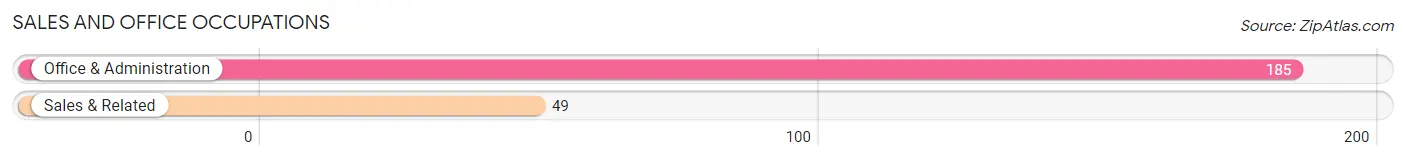
Sales and Office Occupations by Sex
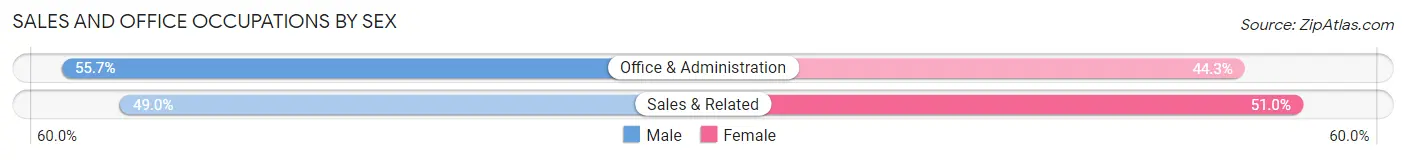
| Occupation | Male | Female |
| Sales & Related | 24 (49.0%) | 25 (51.0%) |
| Office & Administration | 103 (55.7%) | 82 (44.3%) |
| Total (Category) | 127 (54.3%) | 107 (45.7%) |
| Total (Overall) | 365 (52.2%) | 334 (47.8%) |
Natural Resources, Construction and Maintenance Occupations
The most common Natural Resources, Construction and Maintenance occupations in China Grove are Construction & Extraction (27 | 3.9%), and Installation, Maintenance & Repair (15 | 2.1%).
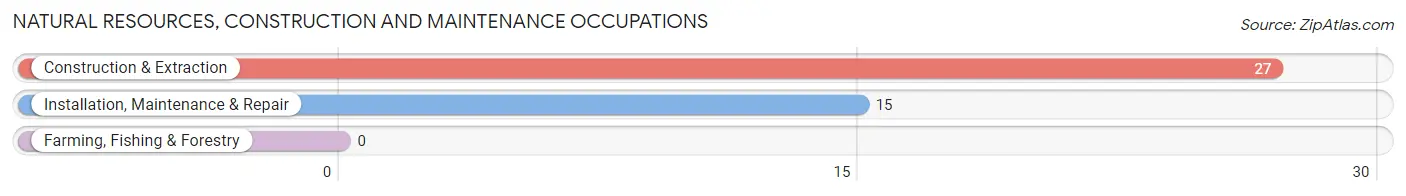
Natural Resources, Construction and Maintenance Occupations by Sex
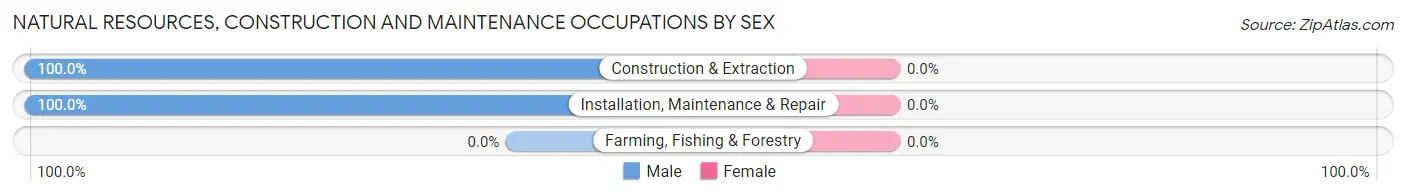
| Occupation | Male | Female |
| Farming, Fishing & Forestry | 0 (0.0%) | 0 (0.0%) |
| Construction & Extraction | 27 (100.0%) | 0 (0.0%) |
| Installation, Maintenance & Repair | 15 (100.0%) | 0 (0.0%) |
| Total (Category) | 42 (100.0%) | 0 (0.0%) |
| Total (Overall) | 365 (52.2%) | 334 (47.8%) |
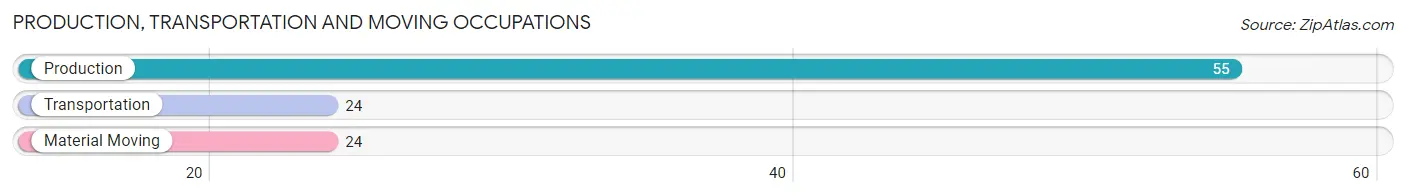
Production, Transportation and Moving Occupations
The most common Production, Transportation and Moving occupations in China Grove are Production (55 | 7.9%), Transportation (24 | 3.4%), and Material Moving (24 | 3.4%).
Production, Transportation and Moving Occupations by Sex
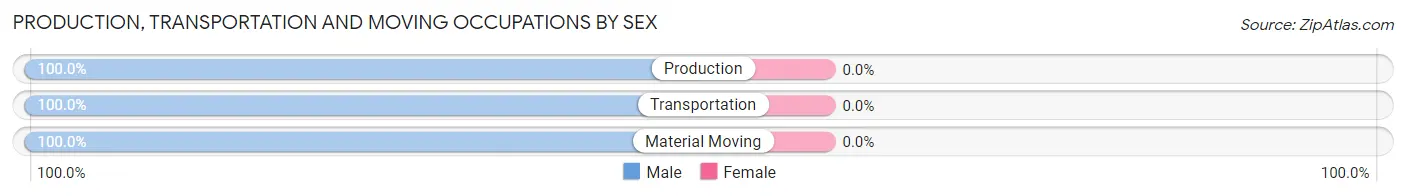
| Occupation | Male | Female |
| Production | 55 (100.0%) | 0 (0.0%) |
| Transportation | 24 (100.0%) | 0 (0.0%) |
| Material Moving | 24 (100.0%) | 0 (0.0%) |
| Total (Category) | 103 (100.0%) | 0 (0.0%) |
| Total (Overall) | 365 (52.2%) | 334 (47.8%) |
Employment Industries by Sex in China Grove
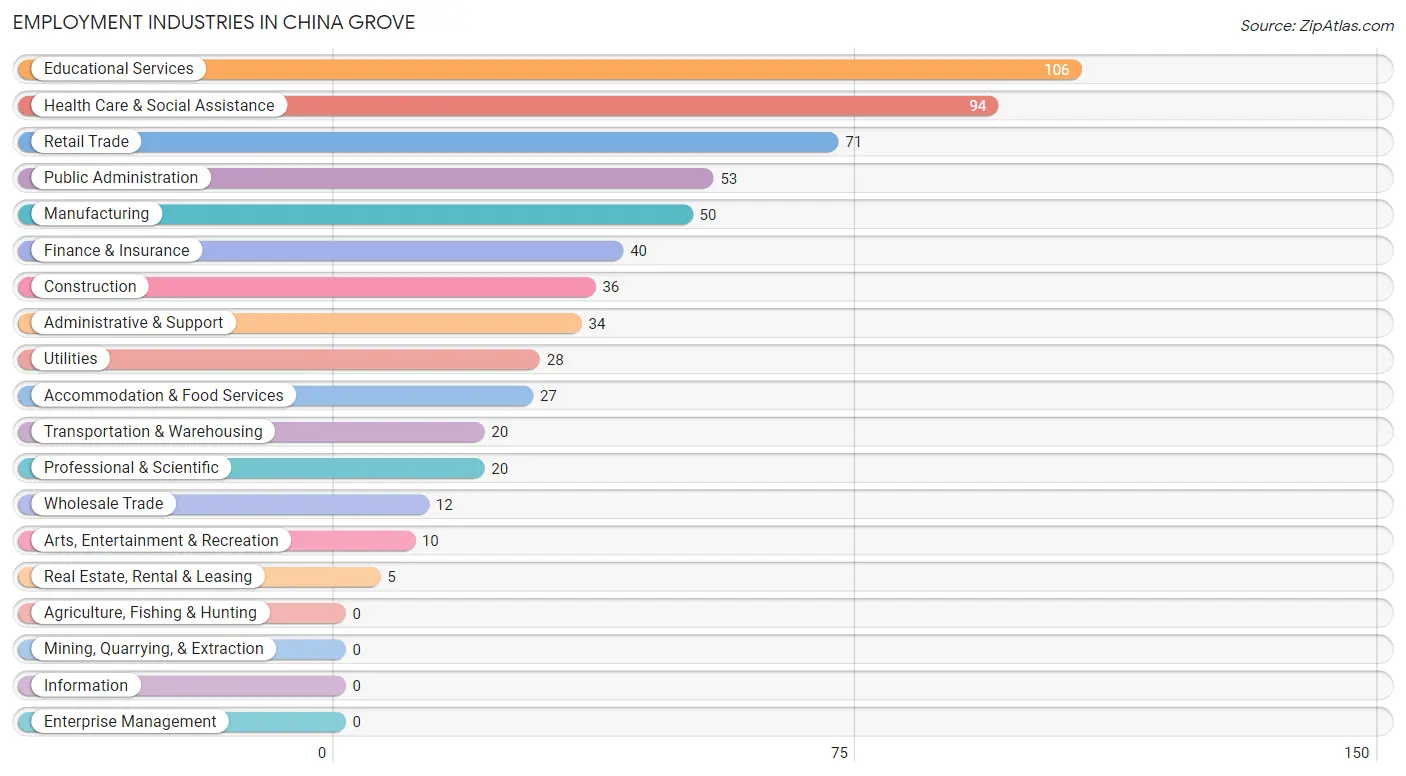
Employment Industries in China Grove
The major employment industries in China Grove include Educational Services (106 | 15.2%), Health Care & Social Assistance (94 | 13.5%), Retail Trade (71 | 10.2%), Public Administration (53 | 7.6%), and Manufacturing (50 | 7.1%).
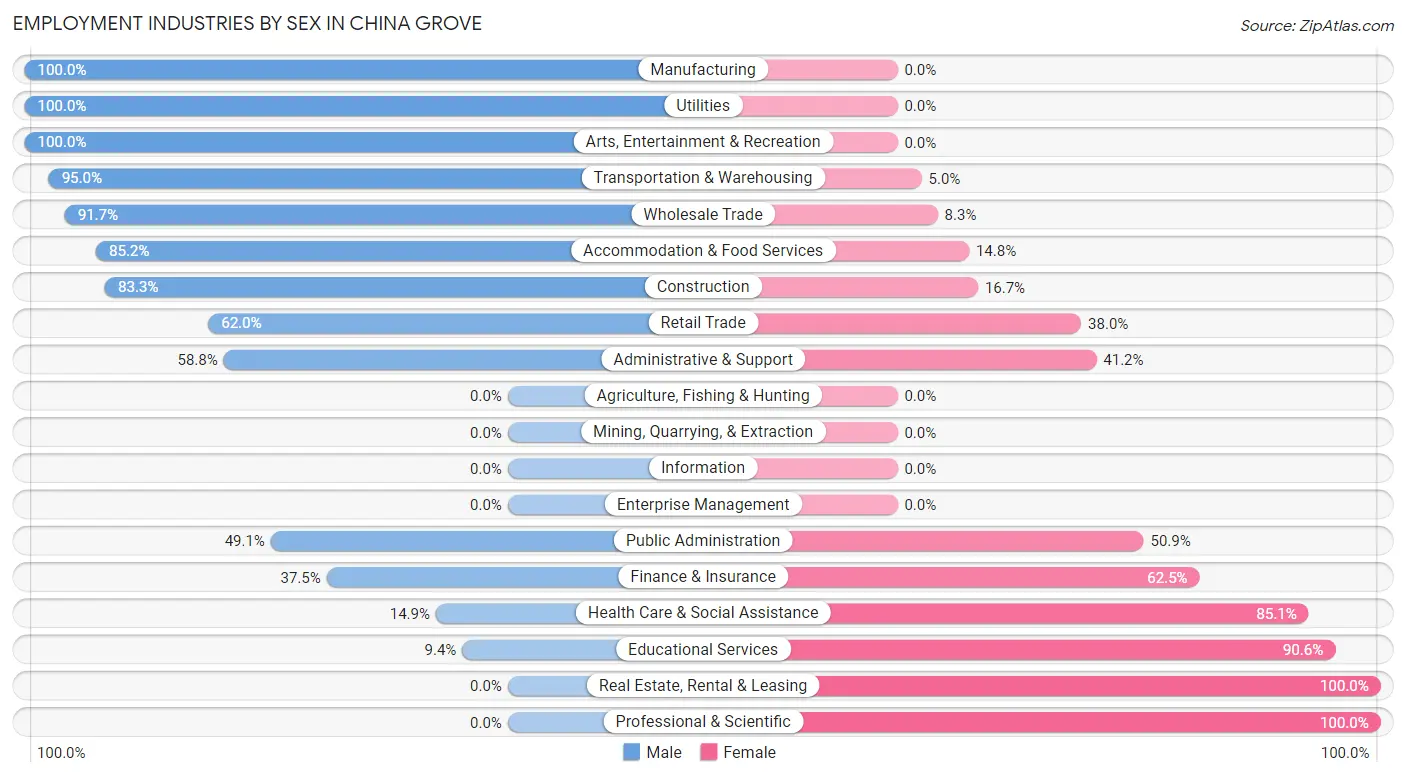
Employment Industries by Sex in China Grove
The China Grove industries that see more men than women are Manufacturing (100.0%), Utilities (100.0%), and Arts, Entertainment & Recreation (100.0%), whereas the industries that tend to have a higher number of women are Real Estate, Rental & Leasing (100.0%), Professional & Scientific (100.0%), and Educational Services (90.6%).
| Industry | Male | Female |
| Agriculture, Fishing & Hunting | 0 (0.0%) | 0 (0.0%) |
| Mining, Quarrying, & Extraction | 0 (0.0%) | 0 (0.0%) |
| Construction | 30 (83.3%) | 6 (16.7%) |
| Manufacturing | 50 (100.0%) | 0 (0.0%) |
| Wholesale Trade | 11 (91.7%) | 1 (8.3%) |
| Retail Trade | 44 (62.0%) | 27 (38.0%) |
| Transportation & Warehousing | 19 (95.0%) | 1 (5.0%) |
| Utilities | 28 (100.0%) | 0 (0.0%) |
| Information | 0 (0.0%) | 0 (0.0%) |
| Finance & Insurance | 15 (37.5%) | 25 (62.5%) |
| Real Estate, Rental & Leasing | 0 (0.0%) | 5 (100.0%) |
| Professional & Scientific | 0 (0.0%) | 20 (100.0%) |
| Enterprise Management | 0 (0.0%) | 0 (0.0%) |
| Administrative & Support | 20 (58.8%) | 14 (41.2%) |
| Educational Services | 10 (9.4%) | 96 (90.6%) |
| Health Care & Social Assistance | 14 (14.9%) | 80 (85.1%) |
| Arts, Entertainment & Recreation | 10 (100.0%) | 0 (0.0%) |
| Accommodation & Food Services | 23 (85.2%) | 4 (14.8%) |
| Public Administration | 26 (49.1%) | 27 (50.9%) |
| Total | 365 (52.2%) | 334 (47.8%) |
Education in China Grove
School Enrollment in China Grove
The most common levels of schooling among the 434 students in China Grove are high school (229 | 52.8%), elementary school (109 | 25.1%), and college / undergraduate (70 | 16.1%).
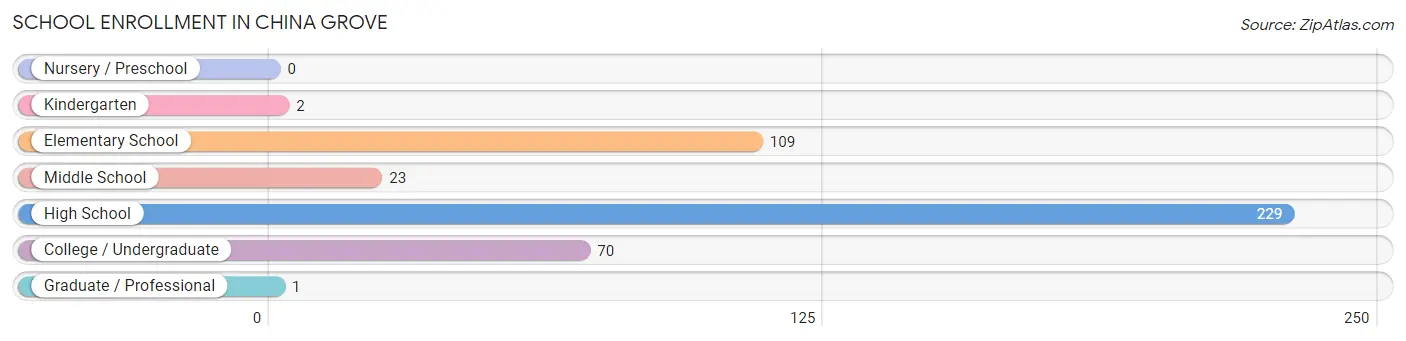
| School Level | # Students | % Students |
| Nursery / Preschool | 0 | 0.0% |
| Kindergarten | 2 | 0.5% |
| Elementary School | 109 | 25.1% |
| Middle School | 23 | 5.3% |
| High School | 229 | 52.8% |
| College / Undergraduate | 70 | 16.1% |
| Graduate / Professional | 1 | 0.2% |
| Total | 434 | 100.0% |
School Enrollment by Age by Funding Source in China Grove
Out of a total of 434 students who are enrolled in schools in China Grove, 41 (9.4%) attend a private institution, while the remaining 393 (90.6%) are enrolled in public schools. The age group of 35 years and over has the highest likelihood of being enrolled in private schools, with 15 (93.8% in the age bracket) enrolled. Conversely, the age group of 10 to 14 year olds has the lowest likelihood of being enrolled in a private school, with 44 (100.0% in the age bracket) attending a public institution.
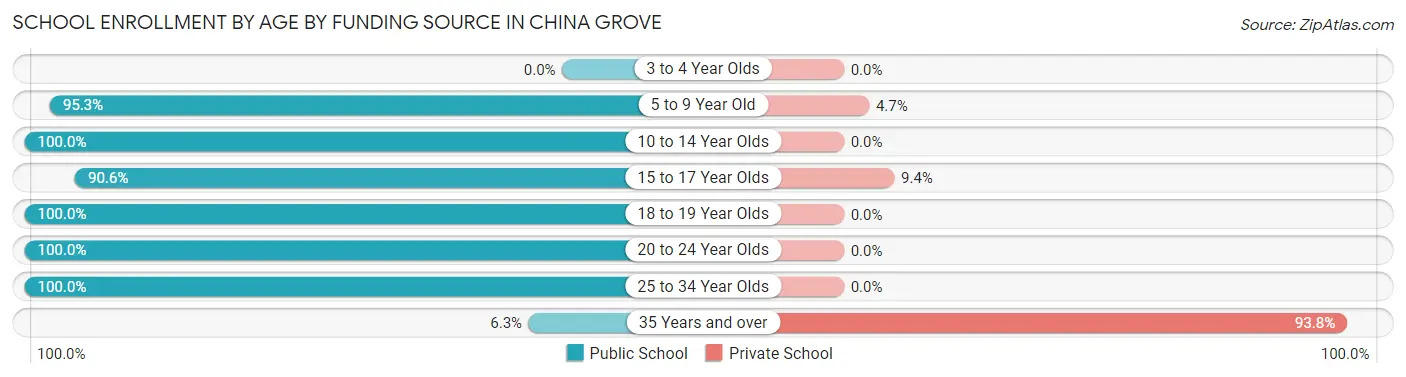
| Age Bracket | Public School | Private School |
| 3 to 4 Year Olds | 0 (0.0%) | 0 (0.0%) |
| 5 to 9 Year Old | 81 (95.3%) | 4 (4.7%) |
| 10 to 14 Year Olds | 44 (100.0%) | 0 (0.0%) |
| 15 to 17 Year Olds | 212 (90.6%) | 22 (9.4%) |
| 18 to 19 Year Olds | 23 (100.0%) | 0 (0.0%) |
| 20 to 24 Year Olds | 18 (100.0%) | 0 (0.0%) |
| 25 to 34 Year Olds | 14 (100.0%) | 0 (0.0%) |
| 35 Years and over | 1 (6.2%) | 15 (93.8%) |
| Total | 393 (90.6%) | 41 (9.4%) |
Educational Attainment by Field of Study in China Grove
Business (79 | 22.1%), science & technology (50 | 14.0%), multidisciplinary studies (37 | 10.4%), social sciences (33 | 9.2%), and communications (30 | 8.4%) are the most common fields of study among 357 individuals in China Grove who have obtained a bachelor's degree or higher.
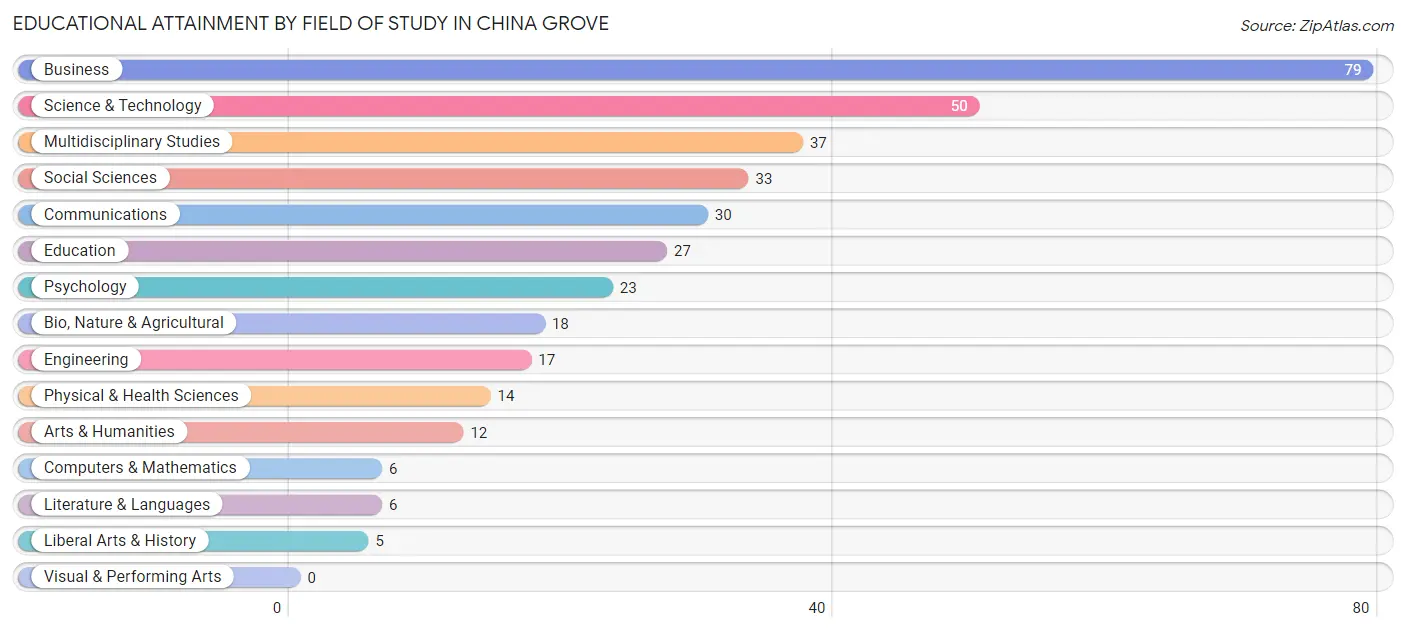
| Field of Study | # Graduates | % Graduates |
| Computers & Mathematics | 6 | 1.7% |
| Bio, Nature & Agricultural | 18 | 5.0% |
| Physical & Health Sciences | 14 | 3.9% |
| Psychology | 23 | 6.4% |
| Social Sciences | 33 | 9.2% |
| Engineering | 17 | 4.8% |
| Multidisciplinary Studies | 37 | 10.4% |
| Science & Technology | 50 | 14.0% |
| Business | 79 | 22.1% |
| Education | 27 | 7.6% |
| Literature & Languages | 6 | 1.7% |
| Liberal Arts & History | 5 | 1.4% |
| Visual & Performing Arts | 0 | 0.0% |
| Communications | 30 | 8.4% |
| Arts & Humanities | 12 | 3.4% |
| Total | 357 | 100.0% |
Transportation & Commute in China Grove
Vehicle Availability by Sex in China Grove
The most prevalent vehicle ownership categories in China Grove are males with 3 vehicles (119, accounting for 31.5%) and females with 3 vehicles (102, making up 37.8%).
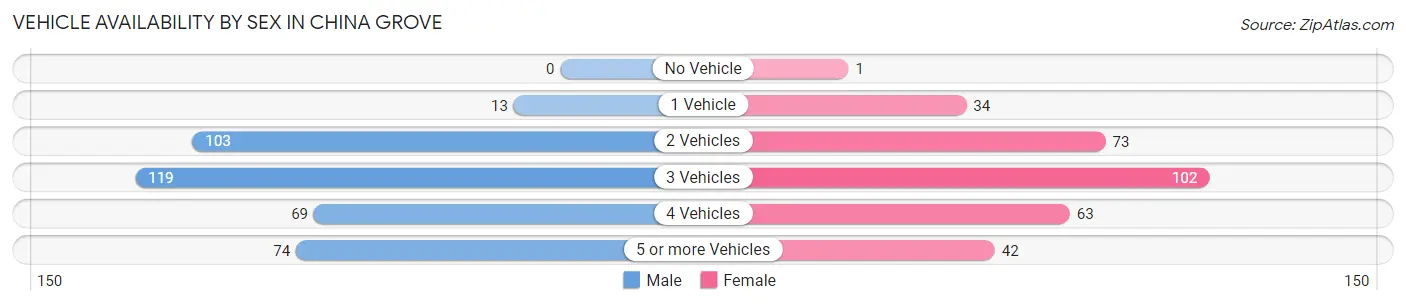
| Vehicles Available | Male | Female |
| No Vehicle | 0 (0.0%) | 1 (0.3%) |
| 1 Vehicle | 13 (3.4%) | 34 (10.8%) |
| 2 Vehicles | 103 (27.3%) | 73 (23.2%) |
| 3 Vehicles | 119 (31.5%) | 102 (32.4%) |
| 4 Vehicles | 69 (18.2%) | 63 (20.0%) |
| 5 or more Vehicles | 74 (19.6%) | 42 (13.3%) |
| Total | 378 (100.0%) | 315 (100.0%) |
Commute Time in China Grove
The most frequently occuring commute durations in China Grove are 20 to 24 minutes (169 commuters, 25.8%), 15 to 19 minutes (136 commuters, 20.8%), and 30 to 34 minutes (118 commuters, 18.0%).
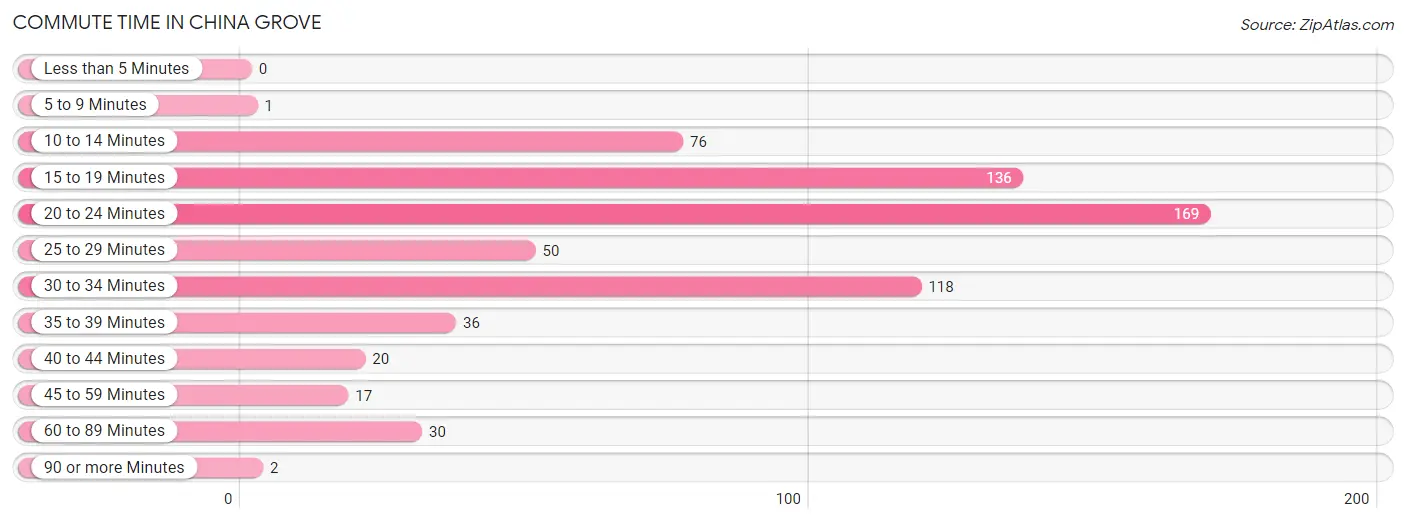
| Commute Time | # Commuters | % Commuters |
| Less than 5 Minutes | 0 | 0.0% |
| 5 to 9 Minutes | 1 | 0.2% |
| 10 to 14 Minutes | 76 | 11.6% |
| 15 to 19 Minutes | 136 | 20.8% |
| 20 to 24 Minutes | 169 | 25.8% |
| 25 to 29 Minutes | 50 | 7.6% |
| 30 to 34 Minutes | 118 | 18.0% |
| 35 to 39 Minutes | 36 | 5.5% |
| 40 to 44 Minutes | 20 | 3.0% |
| 45 to 59 Minutes | 17 | 2.6% |
| 60 to 89 Minutes | 30 | 4.6% |
| 90 or more Minutes | 2 | 0.3% |
Commute Time by Sex in China Grove
The most common commute times in China Grove are 15 to 19 minutes (90 commuters, 24.8%) for males and 20 to 24 minutes (87 commuters, 29.8%) for females.
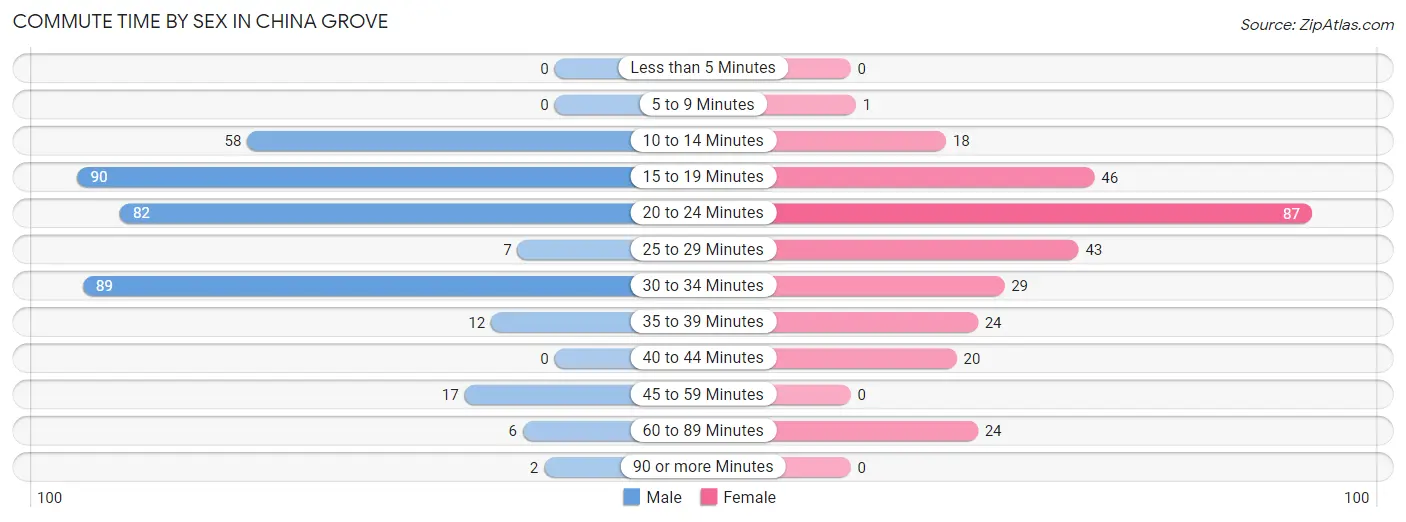
| Commute Time | Male | Female |
| Less than 5 Minutes | 0 (0.0%) | 0 (0.0%) |
| 5 to 9 Minutes | 0 (0.0%) | 1 (0.3%) |
| 10 to 14 Minutes | 58 (16.0%) | 18 (6.2%) |
| 15 to 19 Minutes | 90 (24.8%) | 46 (15.8%) |
| 20 to 24 Minutes | 82 (22.6%) | 87 (29.8%) |
| 25 to 29 Minutes | 7 (1.9%) | 43 (14.7%) |
| 30 to 34 Minutes | 89 (24.5%) | 29 (9.9%) |
| 35 to 39 Minutes | 12 (3.3%) | 24 (8.2%) |
| 40 to 44 Minutes | 0 (0.0%) | 20 (6.9%) |
| 45 to 59 Minutes | 17 (4.7%) | 0 (0.0%) |
| 60 to 89 Minutes | 6 (1.7%) | 24 (8.2%) |
| 90 or more Minutes | 2 (0.5%) | 0 (0.0%) |
Time of Departure to Work by Sex in China Grove
The most frequent times of departure to work in China Grove are 7:30 AM to 7:59 AM (101, 27.8%) for males and 7:00 AM to 7:29 AM (89, 30.5%) for females.
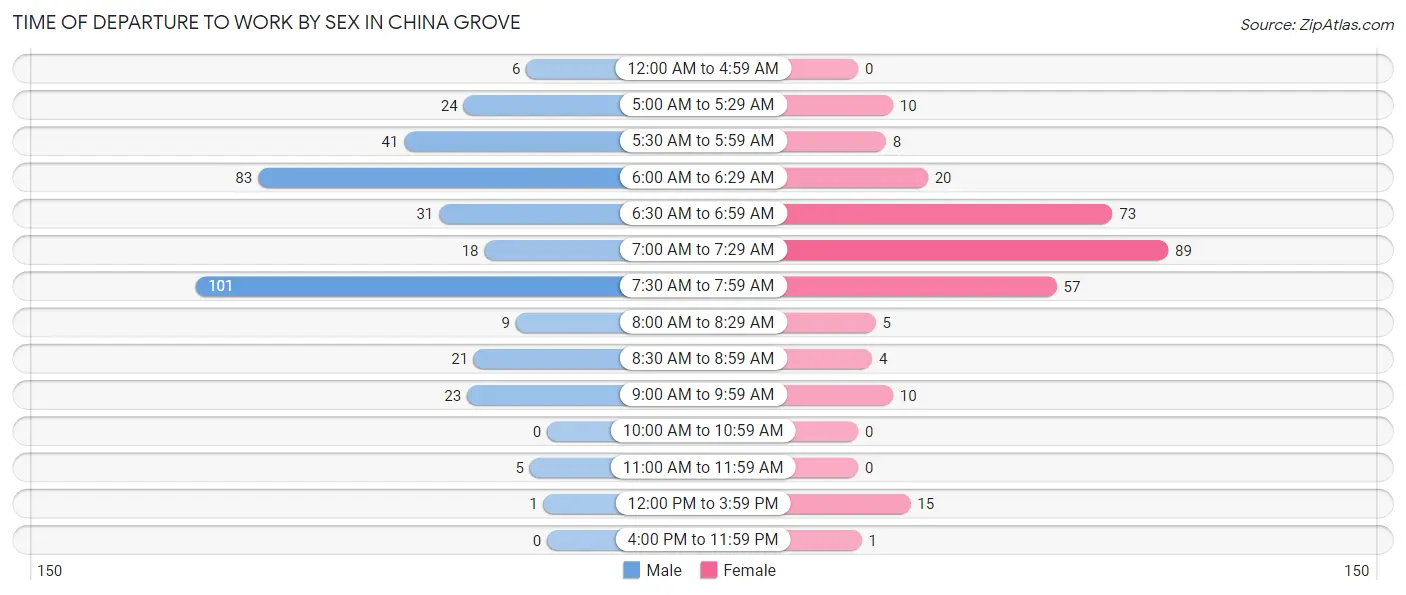
| Time of Departure | Male | Female |
| 12:00 AM to 4:59 AM | 6 (1.7%) | 0 (0.0%) |
| 5:00 AM to 5:29 AM | 24 (6.6%) | 10 (3.4%) |
| 5:30 AM to 5:59 AM | 41 (11.3%) | 8 (2.7%) |
| 6:00 AM to 6:29 AM | 83 (22.9%) | 20 (6.9%) |
| 6:30 AM to 6:59 AM | 31 (8.5%) | 73 (25.0%) |
| 7:00 AM to 7:29 AM | 18 (5.0%) | 89 (30.5%) |
| 7:30 AM to 7:59 AM | 101 (27.8%) | 57 (19.5%) |
| 8:00 AM to 8:29 AM | 9 (2.5%) | 5 (1.7%) |
| 8:30 AM to 8:59 AM | 21 (5.8%) | 4 (1.4%) |
| 9:00 AM to 9:59 AM | 23 (6.3%) | 10 (3.4%) |
| 10:00 AM to 10:59 AM | 0 (0.0%) | 0 (0.0%) |
| 11:00 AM to 11:59 AM | 5 (1.4%) | 0 (0.0%) |
| 12:00 PM to 3:59 PM | 1 (0.3%) | 15 (5.1%) |
| 4:00 PM to 11:59 PM | 0 (0.0%) | 1 (0.3%) |
| Total | 363 (100.0%) | 292 (100.0%) |
Housing Occupancy in China Grove
Occupancy by Ownership in China Grove
Of the total 537 dwellings in China Grove, owner-occupied units account for 490 (91.2%), while renter-occupied units make up 47 (8.7%).
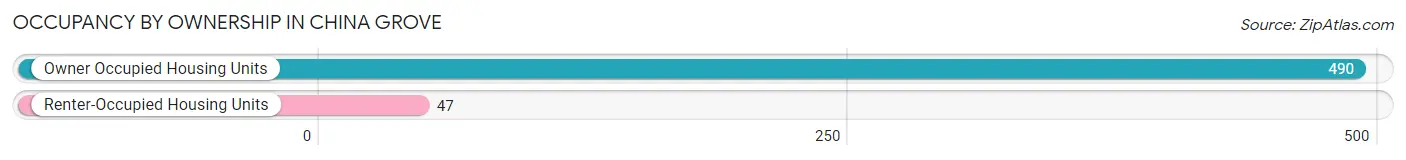
| Occupancy | # Housing Units | % Housing Units |
| Owner Occupied Housing Units | 490 | 91.2% |
| Renter-Occupied Housing Units | 47 | 8.7% |
| Total Occupied Housing Units | 537 | 100.0% |
Occupancy by Household Size in China Grove
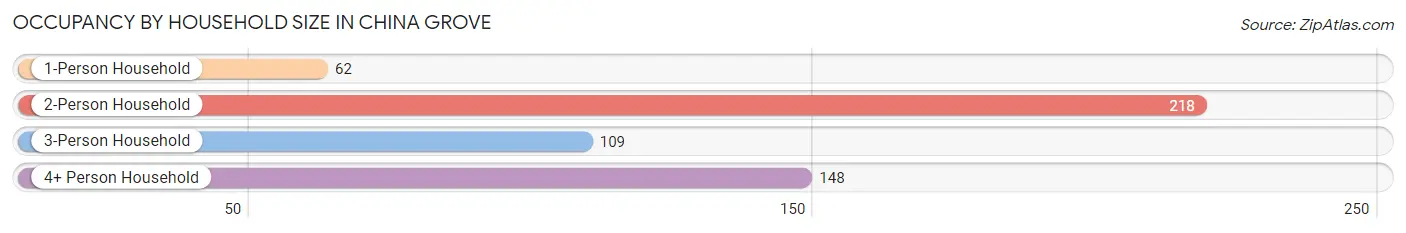
| Household Size | # Housing Units | % Housing Units |
| 1-Person Household | 62 | 11.6% |
| 2-Person Household | 218 | 40.6% |
| 3-Person Household | 109 | 20.3% |
| 4+ Person Household | 148 | 27.6% |
| Total Housing Units | 537 | 100.0% |
Occupancy by Ownership by Household Size in China Grove
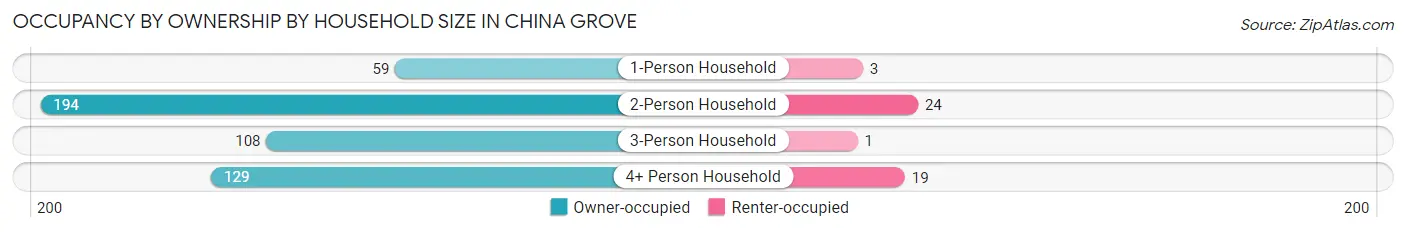
| Household Size | Owner-occupied | Renter-occupied |
| 1-Person Household | 59 (95.2%) | 3 (4.8%) |
| 2-Person Household | 194 (89.0%) | 24 (11.0%) |
| 3-Person Household | 108 (99.1%) | 1 (0.9%) |
| 4+ Person Household | 129 (87.2%) | 19 (12.8%) |
| Total Housing Units | 490 (91.2%) | 47 (8.7%) |
Occupancy by Educational Attainment in China Grove
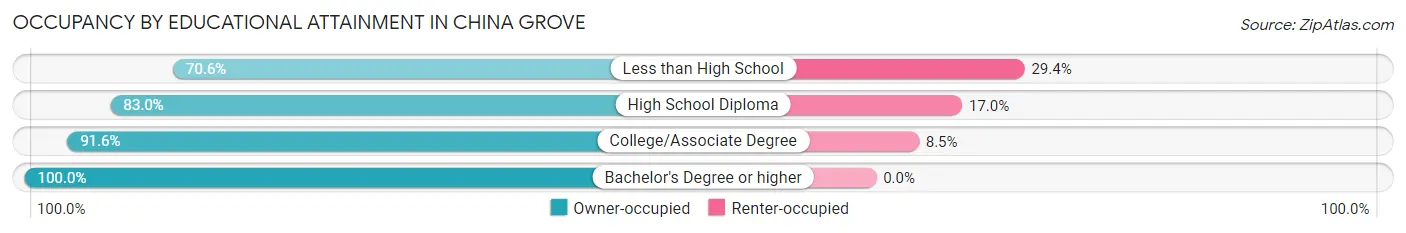
| Household Size | Owner-occupied | Renter-occupied |
| Less than High School | 12 (70.6%) | 5 (29.4%) |
| High School Diploma | 117 (83.0%) | 24 (17.0%) |
| College/Associate Degree | 195 (91.5%) | 18 (8.5%) |
| Bachelor's Degree or higher | 166 (100.0%) | 0 (0.0%) |
Occupancy by Age of Householder in China Grove
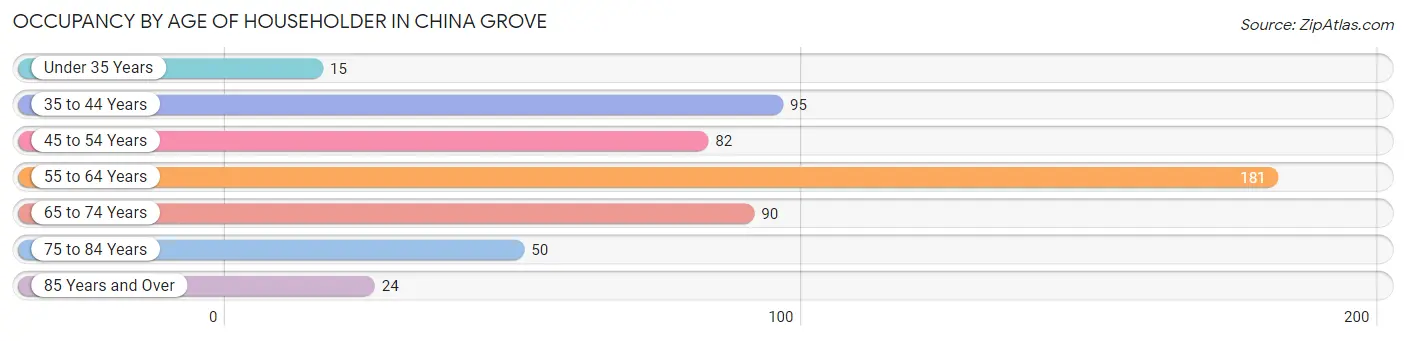
| Age Bracket | # Households | % Households |
| Under 35 Years | 15 | 2.8% |
| 35 to 44 Years | 95 | 17.7% |
| 45 to 54 Years | 82 | 15.3% |
| 55 to 64 Years | 181 | 33.7% |
| 65 to 74 Years | 90 | 16.8% |
| 75 to 84 Years | 50 | 9.3% |
| 85 Years and Over | 24 | 4.5% |
| Total | 537 | 100.0% |
Housing Finances in China Grove
Median Income by Occupancy in China Grove
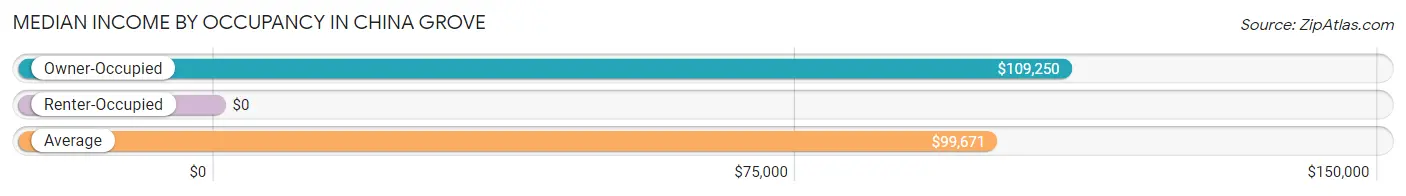
| Occupancy Type | # Households | Median Income |
| Owner-Occupied | 490 (91.2%) | $109,250 |
| Renter-Occupied | 47 (8.7%) | $0 |
| Average | 537 (100.0%) | $99,671 |
Occupancy by Householder Income Bracket in China Grove
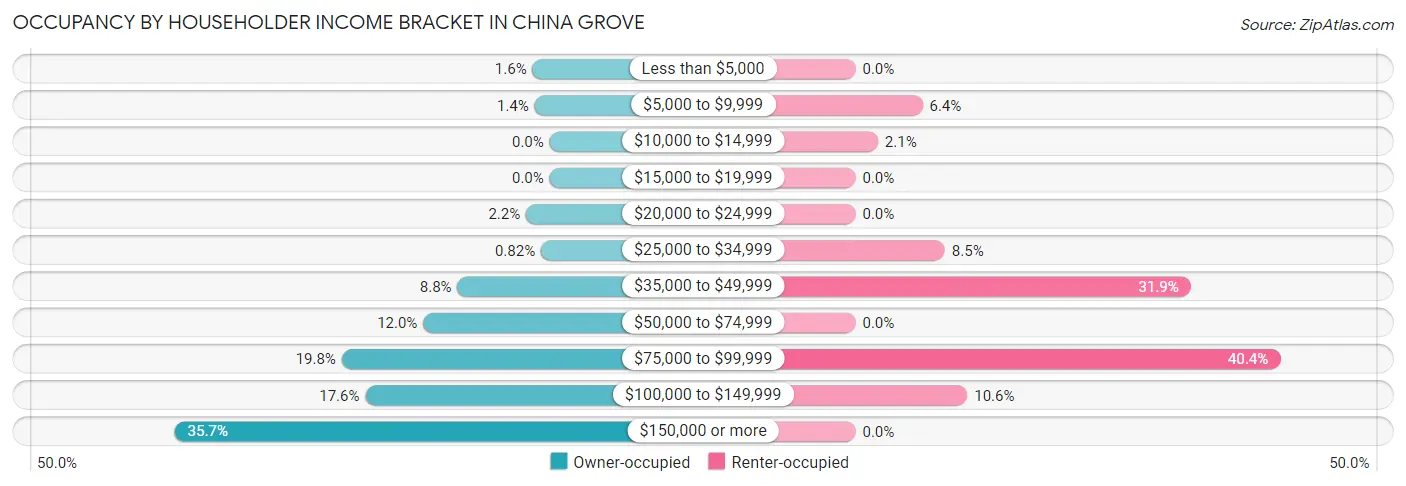
| Income Bracket | Owner-occupied | Renter-occupied |
| Less than $5,000 | 8 (1.6%) | 0 (0.0%) |
| $5,000 to $9,999 | 7 (1.4%) | 3 (6.4%) |
| $10,000 to $14,999 | 0 (0.0%) | 1 (2.1%) |
| $15,000 to $19,999 | 0 (0.0%) | 0 (0.0%) |
| $20,000 to $24,999 | 11 (2.2%) | 0 (0.0%) |
| $25,000 to $34,999 | 4 (0.8%) | 4 (8.5%) |
| $35,000 to $49,999 | 43 (8.8%) | 15 (31.9%) |
| $50,000 to $74,999 | 59 (12.0%) | 0 (0.0%) |
| $75,000 to $99,999 | 97 (19.8%) | 19 (40.4%) |
| $100,000 to $149,999 | 86 (17.5%) | 5 (10.6%) |
| $150,000 or more | 175 (35.7%) | 0 (0.0%) |
| Total | 490 (100.0%) | 47 (100.0%) |
Monthly Housing Cost Tiers in China Grove
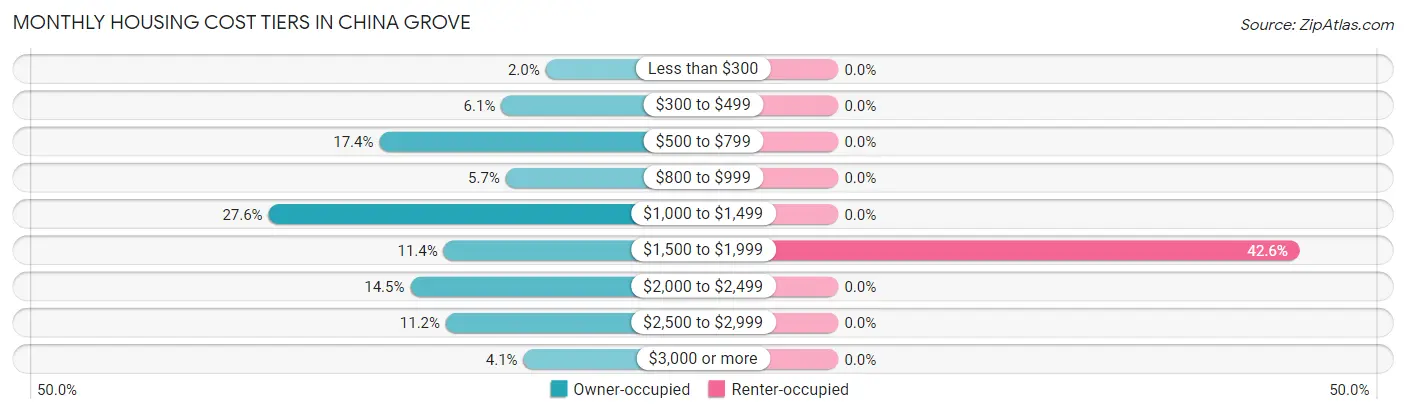
| Monthly Cost | Owner-occupied | Renter-occupied |
| Less than $300 | 10 (2.0%) | 0 (0.0%) |
| $300 to $499 | 30 (6.1%) | 0 (0.0%) |
| $500 to $799 | 85 (17.3%) | 0 (0.0%) |
| $800 to $999 | 28 (5.7%) | 0 (0.0%) |
| $1,000 to $1,499 | 135 (27.6%) | 0 (0.0%) |
| $1,500 to $1,999 | 56 (11.4%) | 20 (42.5%) |
| $2,000 to $2,499 | 71 (14.5%) | 0 (0.0%) |
| $2,500 to $2,999 | 55 (11.2%) | 0 (0.0%) |
| $3,000 or more | 20 (4.1%) | 0 (0.0%) |
| Total | 490 (100.0%) | 47 (100.0%) |
Physical Housing Characteristics in China Grove
Housing Structures in China Grove
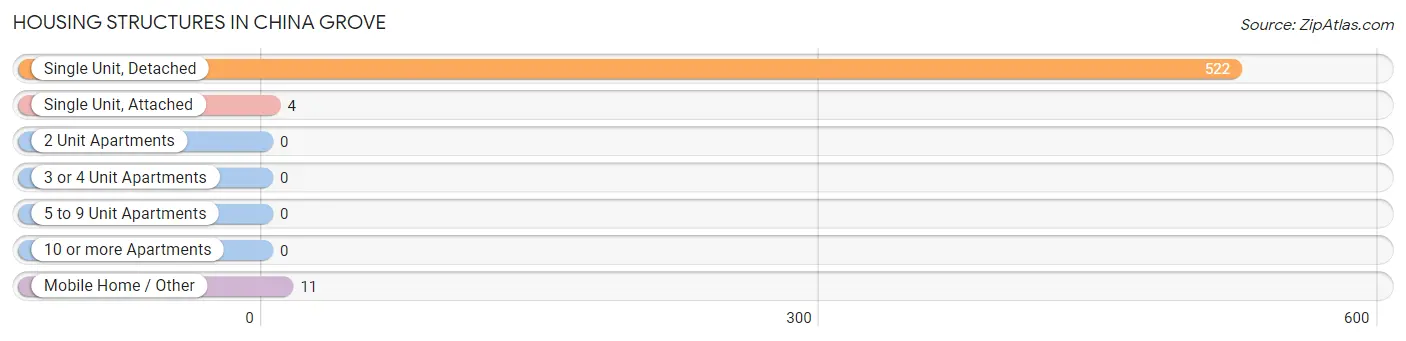
| Structure Type | # Housing Units | % Housing Units |
| Single Unit, Detached | 522 | 97.2% |
| Single Unit, Attached | 4 | 0.7% |
| 2 Unit Apartments | 0 | 0.0% |
| 3 or 4 Unit Apartments | 0 | 0.0% |
| 5 to 9 Unit Apartments | 0 | 0.0% |
| 10 or more Apartments | 0 | 0.0% |
| Mobile Home / Other | 11 | 2.1% |
| Total | 537 | 100.0% |
Housing Structures by Occupancy in China Grove
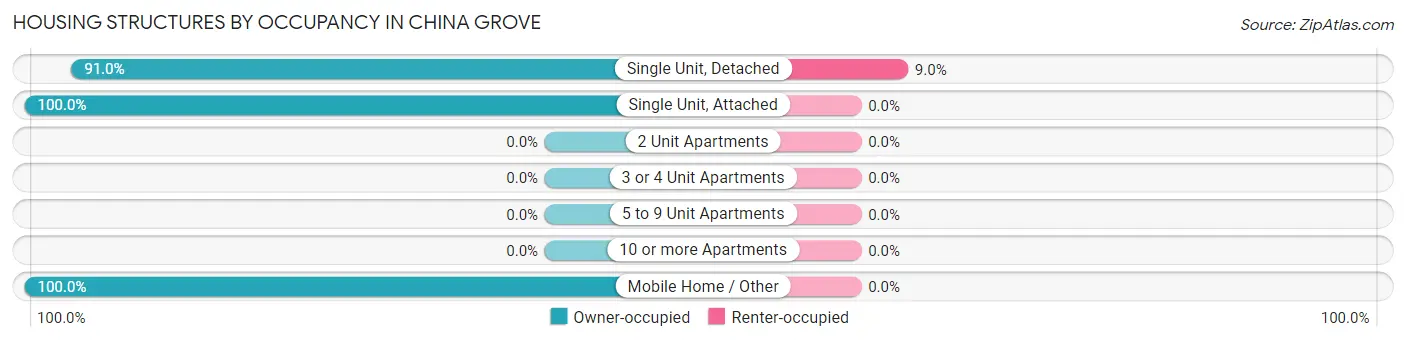
| Structure Type | Owner-occupied | Renter-occupied |
| Single Unit, Detached | 475 (91.0%) | 47 (9.0%) |
| Single Unit, Attached | 4 (100.0%) | 0 (0.0%) |
| 2 Unit Apartments | 0 (0.0%) | 0 (0.0%) |
| 3 or 4 Unit Apartments | 0 (0.0%) | 0 (0.0%) |
| 5 to 9 Unit Apartments | 0 (0.0%) | 0 (0.0%) |
| 10 or more Apartments | 0 (0.0%) | 0 (0.0%) |
| Mobile Home / Other | 11 (100.0%) | 0 (0.0%) |
| Total | 490 (91.2%) | 47 (8.7%) |
Housing Structures by Number of Rooms in China Grove
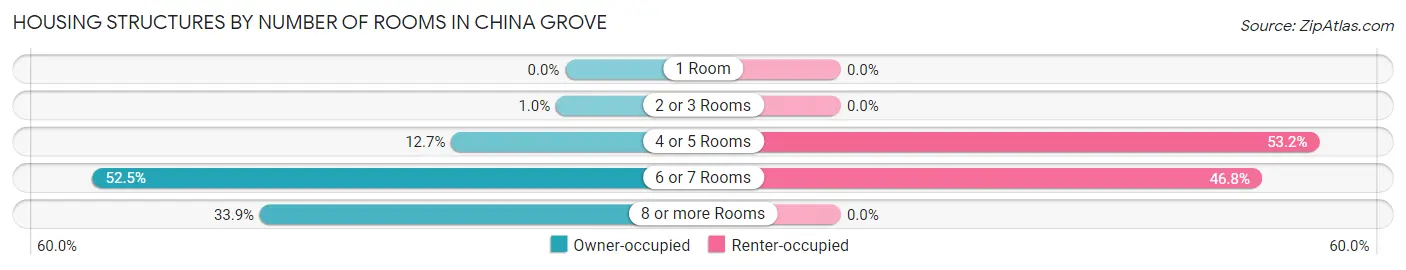
| Number of Rooms | Owner-occupied | Renter-occupied |
| 1 Room | 0 (0.0%) | 0 (0.0%) |
| 2 or 3 Rooms | 5 (1.0%) | 0 (0.0%) |
| 4 or 5 Rooms | 62 (12.7%) | 25 (53.2%) |
| 6 or 7 Rooms | 257 (52.4%) | 22 (46.8%) |
| 8 or more Rooms | 166 (33.9%) | 0 (0.0%) |
| Total | 490 (100.0%) | 47 (100.0%) |
Housing Structure by Heating Type in China Grove
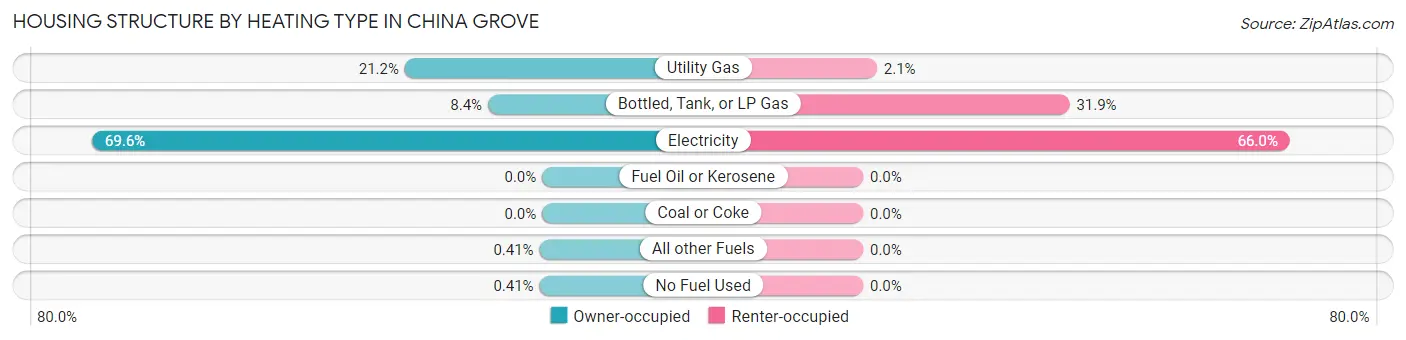
| Heating Type | Owner-occupied | Renter-occupied |
| Utility Gas | 104 (21.2%) | 1 (2.1%) |
| Bottled, Tank, or LP Gas | 41 (8.4%) | 15 (31.9%) |
| Electricity | 341 (69.6%) | 31 (66.0%) |
| Fuel Oil or Kerosene | 0 (0.0%) | 0 (0.0%) |
| Coal or Coke | 0 (0.0%) | 0 (0.0%) |
| All other Fuels | 2 (0.4%) | 0 (0.0%) |
| No Fuel Used | 2 (0.4%) | 0 (0.0%) |
| Total | 490 (100.0%) | 47 (100.0%) |
Household Vehicle Usage in China Grove
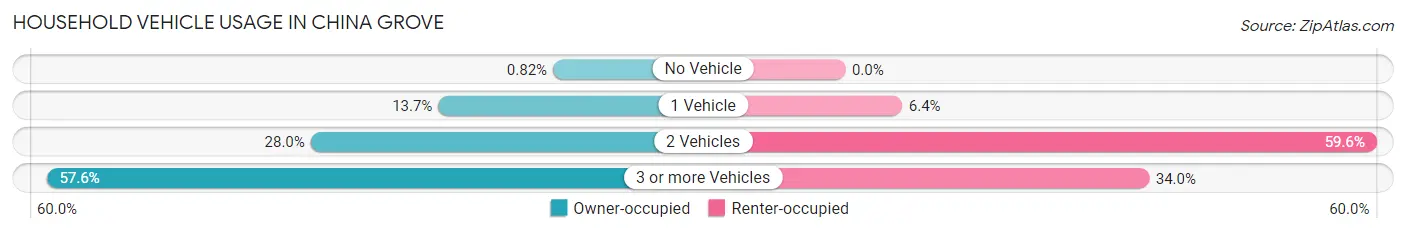
| Vehicles per Household | Owner-occupied | Renter-occupied |
| No Vehicle | 4 (0.8%) | 0 (0.0%) |
| 1 Vehicle | 67 (13.7%) | 3 (6.4%) |
| 2 Vehicles | 137 (28.0%) | 28 (59.6%) |
| 3 or more Vehicles | 282 (57.6%) | 16 (34.0%) |
| Total | 490 (100.0%) | 47 (100.0%) |
Real Estate & Mortgages in China Grove
Real Estate and Mortgage Overview in China Grove
| Characteristic | Without Mortgage | With Mortgage |
| Housing Units | 199 | 291 |
| Median Property Value | $286,100 | $353,500 |
| Median Household Income | $105,208 | $129 |
| Monthly Housing Costs | $731 | $16 |
| Real Estate Taxes | $3,941 | $0 |
Property Value by Mortgage Status in China Grove
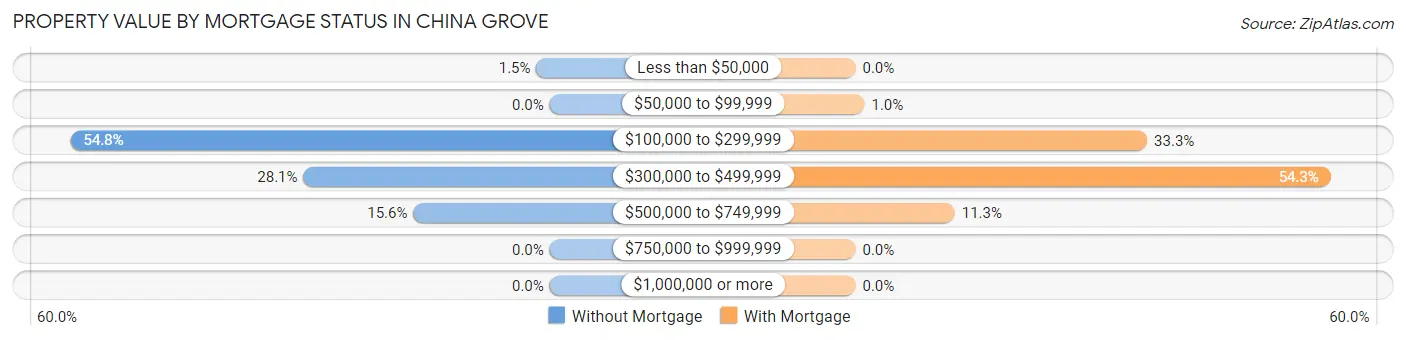
| Property Value | Without Mortgage | With Mortgage |
| Less than $50,000 | 3 (1.5%) | 0 (0.0%) |
| $50,000 to $99,999 | 0 (0.0%) | 3 (1.0%) |
| $100,000 to $299,999 | 109 (54.8%) | 97 (33.3%) |
| $300,000 to $499,999 | 56 (28.1%) | 158 (54.3%) |
| $500,000 to $749,999 | 31 (15.6%) | 33 (11.3%) |
| $750,000 to $999,999 | 0 (0.0%) | 0 (0.0%) |
| $1,000,000 or more | 0 (0.0%) | 0 (0.0%) |
| Total | 199 (100.0%) | 291 (100.0%) |
Household Income by Mortgage Status in China Grove
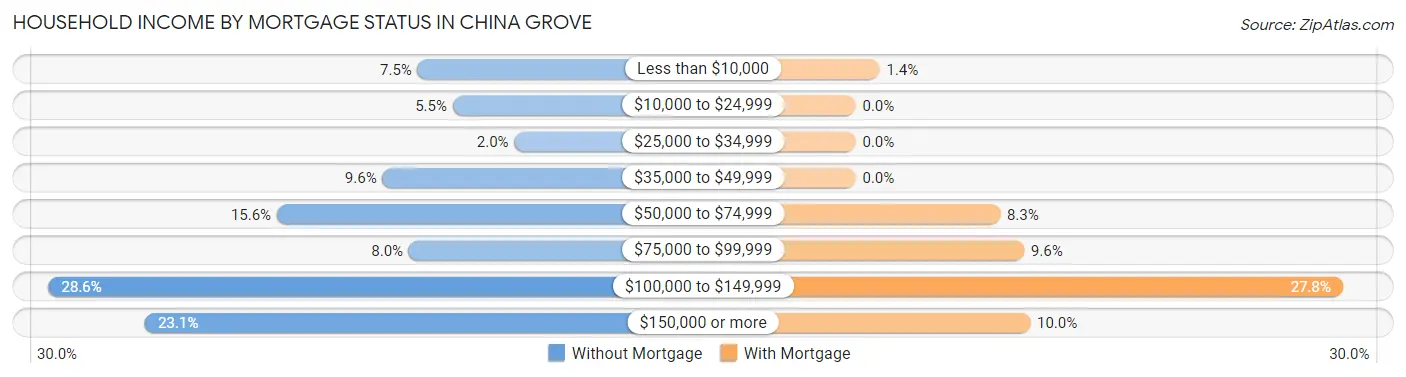
| Household Income | Without Mortgage | With Mortgage |
| Less than $10,000 | 15 (7.5%) | 4 (1.4%) |
| $10,000 to $24,999 | 11 (5.5%) | 0 (0.0%) |
| $25,000 to $34,999 | 4 (2.0%) | 0 (0.0%) |
| $35,000 to $49,999 | 19 (9.6%) | 0 (0.0%) |
| $50,000 to $74,999 | 31 (15.6%) | 24 (8.3%) |
| $75,000 to $99,999 | 16 (8.0%) | 28 (9.6%) |
| $100,000 to $149,999 | 57 (28.6%) | 81 (27.8%) |
| $150,000 or more | 46 (23.1%) | 29 (10.0%) |
| Total | 199 (100.0%) | 291 (100.0%) |
Property Value to Household Income Ratio in China Grove
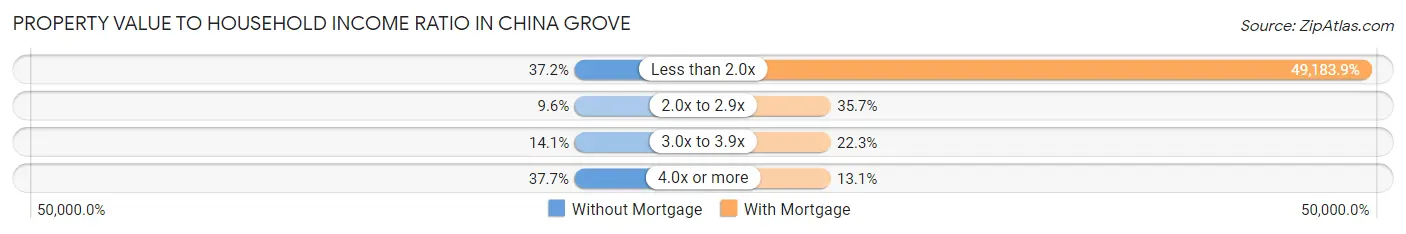
| Value-to-Income Ratio | Without Mortgage | With Mortgage |
| Less than 2.0x | 74 (37.2%) | 143,125 (49,183.9%) |
| 2.0x to 2.9x | 19 (9.6%) | 104 (35.7%) |
| 3.0x to 3.9x | 28 (14.1%) | 65 (22.3%) |
| 4.0x or more | 75 (37.7%) | 38 (13.1%) |
| Total | 199 (100.0%) | 291 (100.0%) |
Real Estate Taxes by Mortgage Status in China Grove
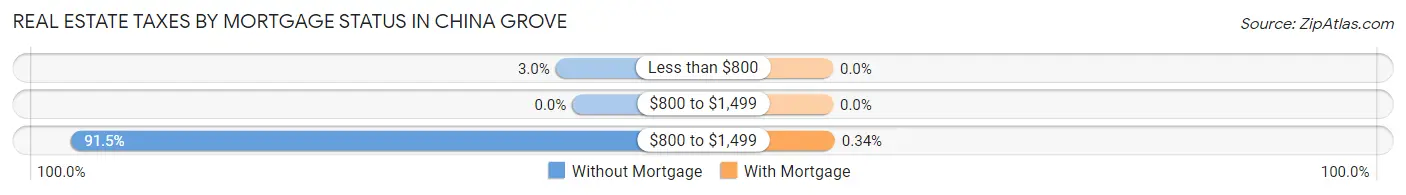
| Property Taxes | Without Mortgage | With Mortgage |
| Less than $800 | 6 (3.0%) | 0 (0.0%) |
| $800 to $1,499 | 0 (0.0%) | 0 (0.0%) |
| $800 to $1,499 | 182 (91.5%) | 1 (0.3%) |
| Total | 199 (100.0%) | 291 (100.0%) |
Health & Disability in China Grove
Health Insurance Coverage by Age in China Grove
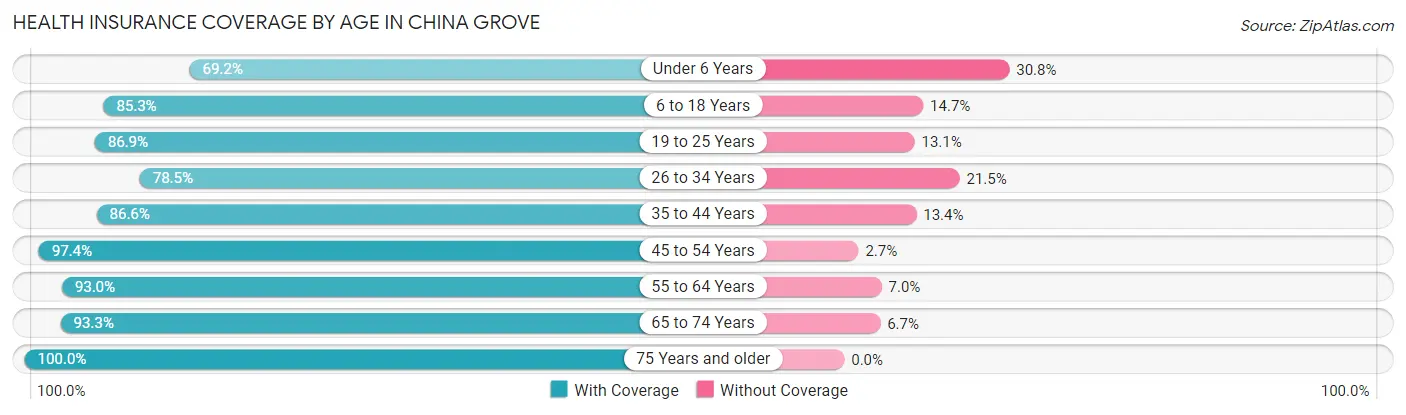
| Age Bracket | With Coverage | Without Coverage |
| Under 6 Years | 63 (69.2%) | 28 (30.8%) |
| 6 to 18 Years | 313 (85.3%) | 54 (14.7%) |
| 19 to 25 Years | 73 (86.9%) | 11 (13.1%) |
| 26 to 34 Years | 95 (78.5%) | 26 (21.5%) |
| 35 to 44 Years | 174 (86.6%) | 27 (13.4%) |
| 45 to 54 Years | 184 (97.4%) | 5 (2.6%) |
| 55 to 64 Years | 254 (93.0%) | 19 (7.0%) |
| 65 to 74 Years | 195 (93.3%) | 14 (6.7%) |
| 75 Years and older | 111 (100.0%) | 0 (0.0%) |
| Total | 1,462 (88.8%) | 184 (11.2%) |
Health Insurance Coverage by Citizenship Status in China Grove
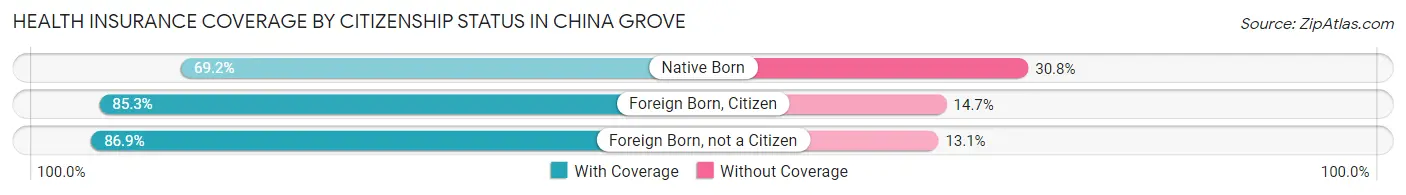
| Citizenship Status | With Coverage | Without Coverage |
| Native Born | 63 (69.2%) | 28 (30.8%) |
| Foreign Born, Citizen | 313 (85.3%) | 54 (14.7%) |
| Foreign Born, not a Citizen | 73 (86.9%) | 11 (13.1%) |
Health Insurance Coverage by Household Income in China Grove
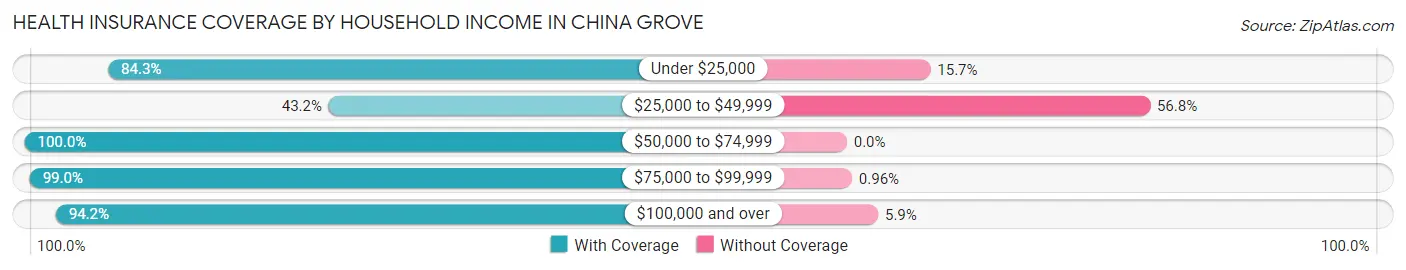
| Household Income | With Coverage | Without Coverage |
| Under $25,000 | 70 (84.3%) | 13 (15.7%) |
| $25,000 to $49,999 | 89 (43.2%) | 117 (56.8%) |
| $50,000 to $74,999 | 86 (100.0%) | 0 (0.0%) |
| $75,000 to $99,999 | 412 (99.0%) | 4 (1.0%) |
| $100,000 and over | 805 (94.2%) | 50 (5.9%) |
Public vs Private Health Insurance Coverage by Age in China Grove
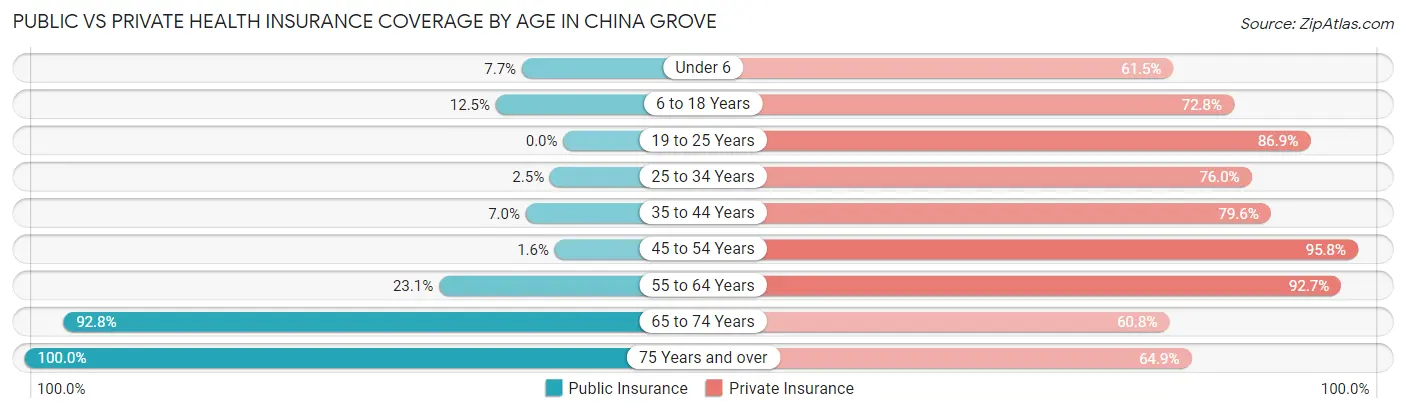
| Age Bracket | Public Insurance | Private Insurance |
| Under 6 | 7 (7.7%) | 56 (61.5%) |
| 6 to 18 Years | 46 (12.5%) | 267 (72.8%) |
| 19 to 25 Years | 0 (0.0%) | 73 (86.9%) |
| 25 to 34 Years | 3 (2.5%) | 92 (76.0%) |
| 35 to 44 Years | 14 (7.0%) | 160 (79.6%) |
| 45 to 54 Years | 3 (1.6%) | 181 (95.8%) |
| 55 to 64 Years | 63 (23.1%) | 253 (92.7%) |
| 65 to 74 Years | 194 (92.8%) | 127 (60.8%) |
| 75 Years and over | 111 (100.0%) | 72 (64.9%) |
| Total | 441 (26.8%) | 1,281 (77.8%) |
Disability Status by Sex by Age in China Grove
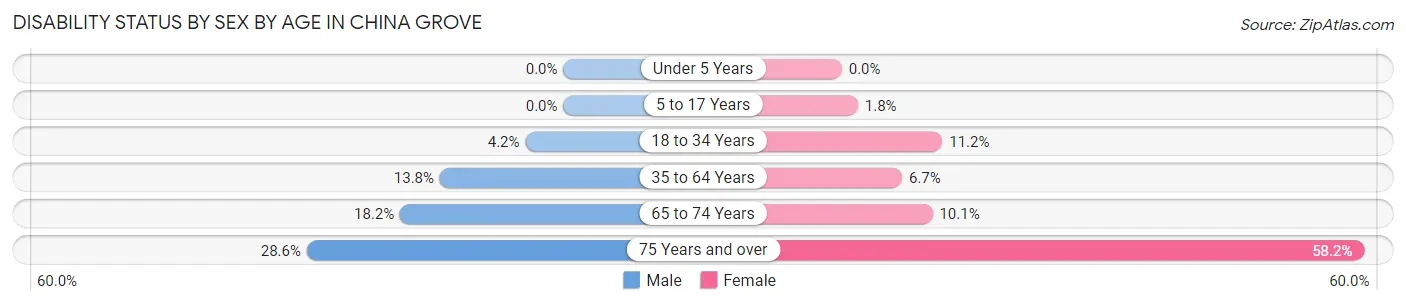
| Age Bracket | Male | Female |
| Under 5 Years | 0 (0.0%) | 0 (0.0%) |
| 5 to 17 Years | 0 (0.0%) | 4 (1.8%) |
| 18 to 34 Years | 3 (4.2%) | 15 (11.2%) |
| 35 to 64 Years | 44 (13.8%) | 23 (6.7%) |
| 65 to 74 Years | 20 (18.2%) | 10 (10.1%) |
| 75 Years and over | 16 (28.6%) | 32 (58.2%) |
Disability Class by Sex by Age in China Grove
Disability Class: Hearing Difficulty
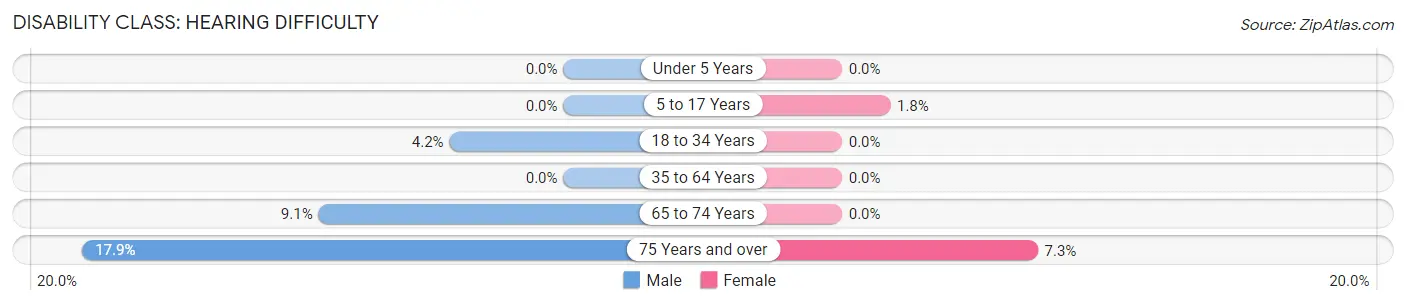
| Age Bracket | Male | Female |
| Under 5 Years | 0 (0.0%) | 0 (0.0%) |
| 5 to 17 Years | 0 (0.0%) | 4 (1.8%) |
| 18 to 34 Years | 3 (4.2%) | 0 (0.0%) |
| 35 to 64 Years | 0 (0.0%) | 0 (0.0%) |
| 65 to 74 Years | 10 (9.1%) | 0 (0.0%) |
| 75 Years and over | 10 (17.9%) | 4 (7.3%) |
Disability Class: Vision Difficulty
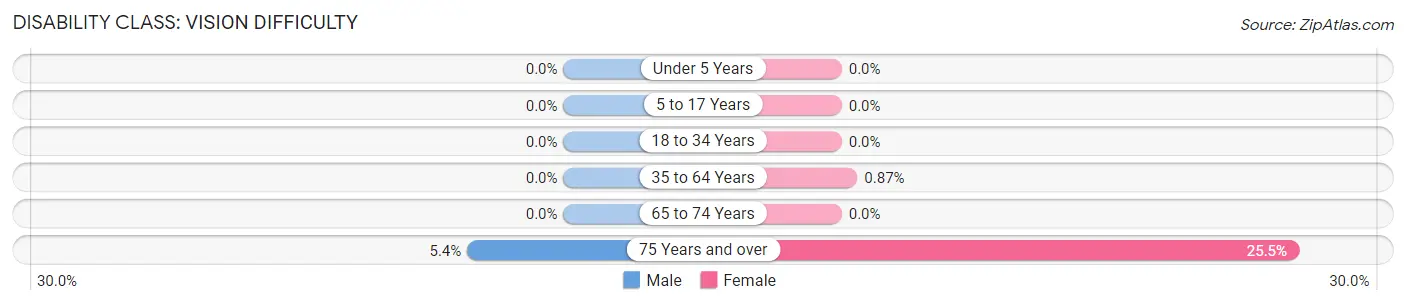
| Age Bracket | Male | Female |
| Under 5 Years | 0 (0.0%) | 0 (0.0%) |
| 5 to 17 Years | 0 (0.0%) | 0 (0.0%) |
| 18 to 34 Years | 0 (0.0%) | 0 (0.0%) |
| 35 to 64 Years | 0 (0.0%) | 3 (0.9%) |
| 65 to 74 Years | 0 (0.0%) | 0 (0.0%) |
| 75 Years and over | 3 (5.4%) | 14 (25.5%) |
Disability Class: Cognitive Difficulty
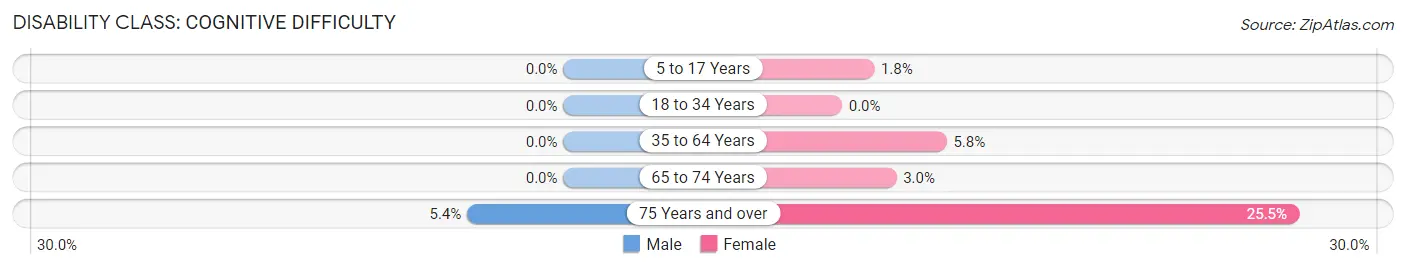
| Age Bracket | Male | Female |
| 5 to 17 Years | 0 (0.0%) | 4 (1.8%) |
| 18 to 34 Years | 0 (0.0%) | 0 (0.0%) |
| 35 to 64 Years | 0 (0.0%) | 20 (5.8%) |
| 65 to 74 Years | 0 (0.0%) | 3 (3.0%) |
| 75 Years and over | 3 (5.4%) | 14 (25.5%) |
Disability Class: Ambulatory Difficulty
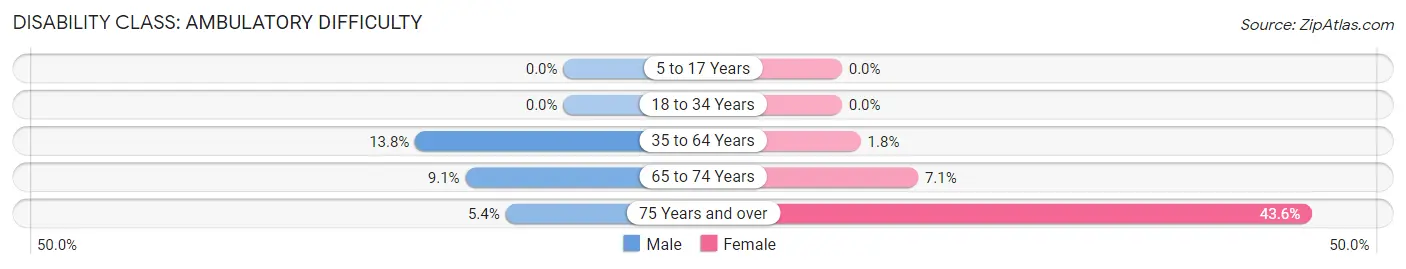
| Age Bracket | Male | Female |
| 5 to 17 Years | 0 (0.0%) | 0 (0.0%) |
| 18 to 34 Years | 0 (0.0%) | 0 (0.0%) |
| 35 to 64 Years | 44 (13.8%) | 6 (1.8%) |
| 65 to 74 Years | 10 (9.1%) | 7 (7.1%) |
| 75 Years and over | 3 (5.4%) | 24 (43.6%) |
Disability Class: Self-Care Difficulty
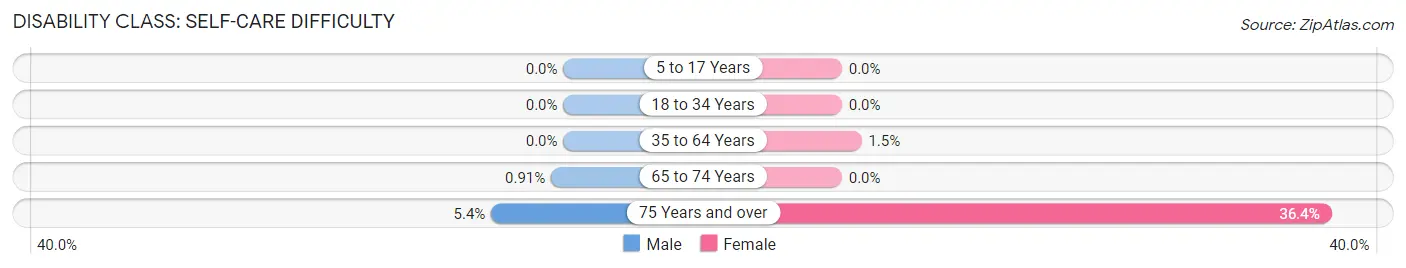
| Age Bracket | Male | Female |
| 5 to 17 Years | 0 (0.0%) | 0 (0.0%) |
| 18 to 34 Years | 0 (0.0%) | 0 (0.0%) |
| 35 to 64 Years | 0 (0.0%) | 5 (1.5%) |
| 65 to 74 Years | 1 (0.9%) | 0 (0.0%) |
| 75 Years and over | 3 (5.4%) | 20 (36.4%) |
Technology Access in China Grove
Computing Device Access in China Grove
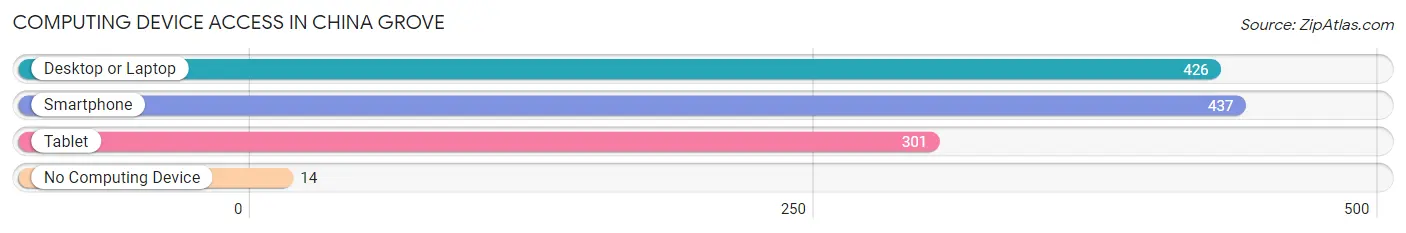
| Device Type | # Households | % Households |
| Desktop or Laptop | 426 | 79.3% |
| Smartphone | 437 | 81.4% |
| Tablet | 301 | 56.0% |
| No Computing Device | 14 | 2.6% |
| Total | 537 | 100.0% |
Internet Access in China Grove
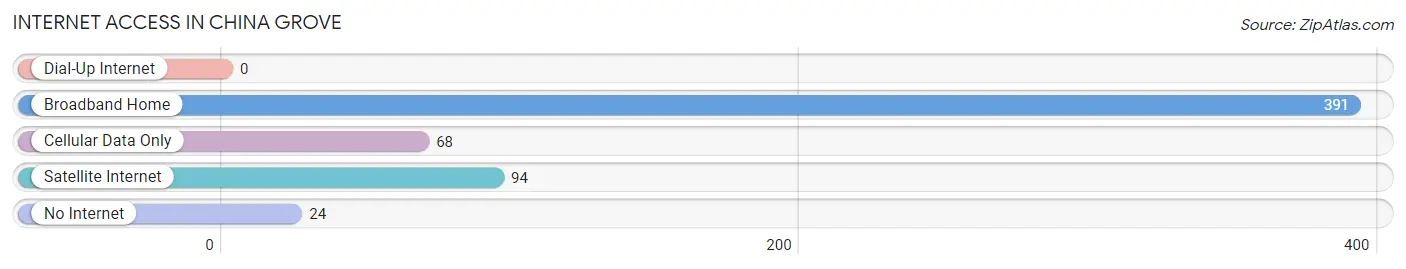
| Internet Type | # Households | % Households |
| Dial-Up Internet | 0 | 0.0% |
| Broadband Home | 391 | 72.8% |
| Cellular Data Only | 68 | 12.7% |
| Satellite Internet | 94 | 17.5% |
| No Internet | 24 | 4.5% |
| Total | 537 | 100.0% |
China Grove Summary
Geography
China Grove is a small unincorporated community located in Bexar County, Texas. It is situated about 20 miles northeast of downtown San Antonio and is part of the San Antonio–New Braunfels metropolitan area. The community is located along the banks of Cibolo Creek, which flows through the area. The terrain is mostly flat with some rolling hills. The area is mostly rural, with some residential and commercial development.
History
China Grove was first settled in the late 1800s by German immigrants. The community was named after a grove of Chinese tallow trees that were planted in the area. The trees were planted by a local farmer who had traveled to China and brought back the seeds. The trees were used for timber and fuel.
The community grew slowly over the years, and by the early 1900s, it had become a small farming community. The area was home to several small businesses, including a general store, a blacksmith shop, and a cotton gin.
In the 1950s, the population of China Grove began to decline as many of the residents moved away to larger cities. The decline continued until the late 1980s, when the population began to stabilize.
Economy
The economy of China Grove is largely based on agriculture. The area is home to several farms, which produce a variety of crops, including cotton, corn, and hay. The area is also home to several small businesses, including a general store, a feed store, and a gas station.
Demographics
As of the 2010 census, the population of China Grove was 1,845. The racial makeup of the community was 79.3% White, 0.7% African American, 0.2% Native American, 0.2% Asian, 0.1% Pacific Islander, 17.3% from other races, and 2.3% from two or more races. Hispanic or Latino of any race were 33.2% of the population.
The median household income in China Grove was $41,250, and the median family income was $45,625. The per capita income was $17,945. About 15.3% of families and 18.2% of the population were below the poverty line, including 25.2% of those under age 18 and 10.2% of those age 65 or over.
Conclusion
China Grove is a small unincorporated community located in Bexar County, Texas. It is situated about 20 miles northeast of downtown San Antonio and is part of the San Antonio–New Braunfels metropolitan area. The community was first settled in the late 1800s by German immigrants and was named after a grove of Chinese tallow trees that were planted in the area. The economy of China Grove is largely based on agriculture, and the area is home to several small businesses. As of the 2010 census, the population of China Grove was 1,845. The median household income in China Grove was $41,250, and the median family income was $45,625.
Common Questions
What is Per Capita Income in China Grove?
Per Capita income in China Grove is $44,656.
What is the Median Family Income in China Grove?
Median Family Income in China Grove is $129,091.
What is the Median Household income in China Grove?
Median Household Income in China Grove is $99,671.
What is Income or Wage Gap in China Grove?
Income or Wage Gap in China Grove is 8.4%.
Women in China Grove earn 91.6 cents for every dollar earned by a man.
What is Inequality or Gini Index in China Grove?
Inequality or Gini Index in China Grove is 0.37.
What is the Total Population of China Grove?
Total Population of China Grove is 1,660.
What is the Total Male Population of China Grove?
Total Male Population of China Grove is 761.
What is the Total Female Population of China Grove?
Total Female Population of China Grove is 899.
What is the Ratio of Males per 100 Females in China Grove?
There are 84.65 Males per 100 Females in China Grove.
What is the Ratio of Females per 100 Males in China Grove?
There are 118.13 Females per 100 Males in China Grove.
What is the Median Population Age in China Grove?
Median Population Age in China Grove is 42.4 Years.
What is the Average Family Size in China Grove
Average Family Size in China Grove is 3.3 People.
What is the Average Household Size in China Grove
Average Household Size in China Grove is 3.1 People.
How Large is the Labor Force in China Grove?
There are 728 People in the Labor Forcein in China Grove.
What is the Percentage of People in the Labor Force in China Grove?
52.2% of People are in the Labor Force in China Grove.
What is the Unemployment Rate in China Grove?
Unemployment Rate in China Grove is 2.1%.