Kill Devil Hills, NC Map & Demographics
Kill Devil Hills Map
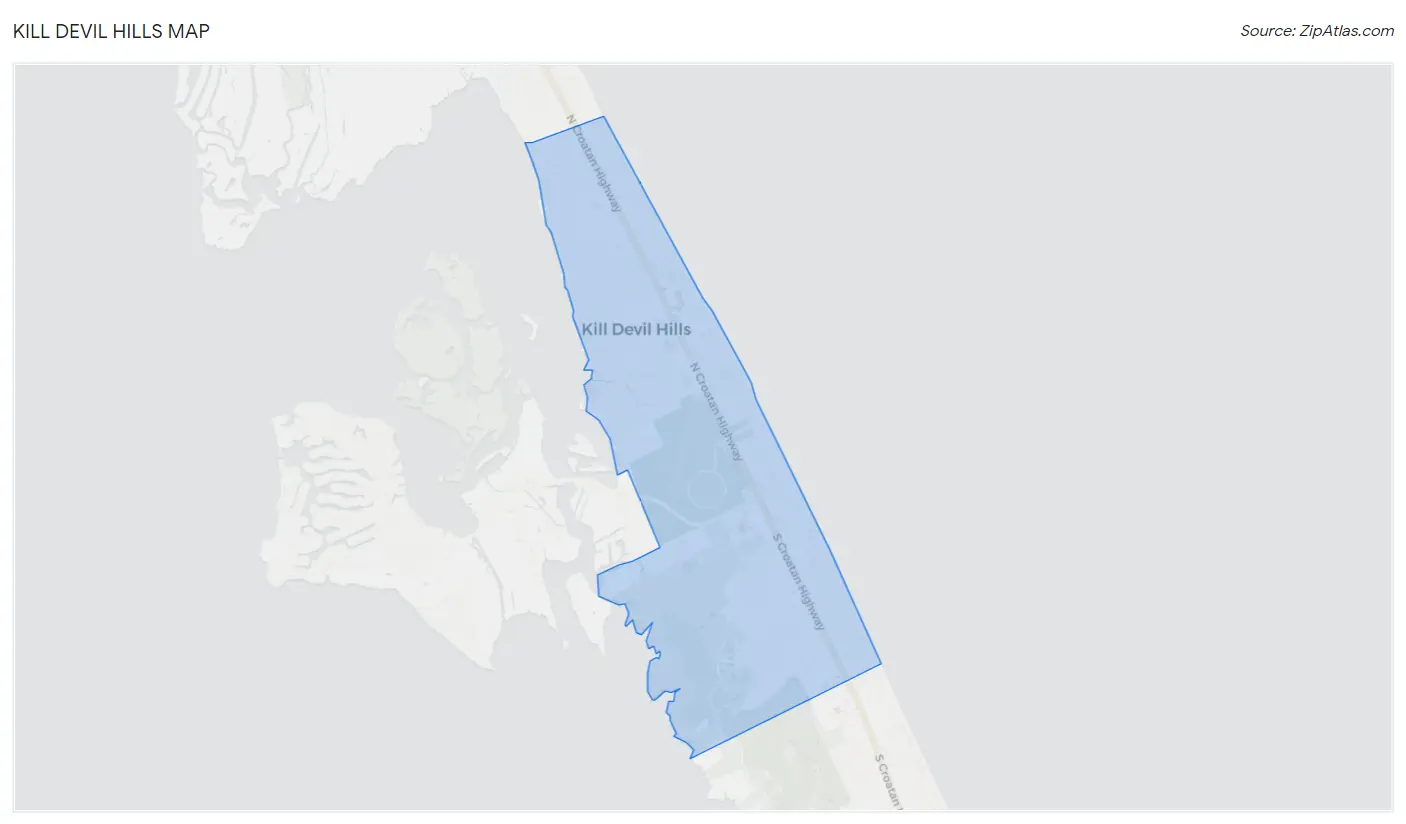
Kill Devil Hills Overview
$41,679
PER CAPITA INCOME
$108,344
AVG FAMILY INCOME
$73,036
AVG HOUSEHOLD INCOME
15.0%
WAGE / INCOME GAP [ % ]
85.0¢/ $1
WAGE / INCOME GAP [ $ ]
0.39
INEQUALITY / GINI INDEX
7,658
TOTAL POPULATION
3,787
MALE POPULATION
3,871
FEMALE POPULATION
97.83
MALES / 100 FEMALES
102.22
FEMALES / 100 MALES
48.1
MEDIAN AGE
3.0
AVG FAMILY SIZE
2.4
AVG HOUSEHOLD SIZE
4,701
LABOR FORCE [ PEOPLE ]
70.5%
PERCENT IN LABOR FORCE
6.1%
UNEMPLOYMENT RATE
Kill Devil Hills Zip Codes
Kill Devil Hills Area Codes
Income in Kill Devil Hills
Income Overview in Kill Devil Hills
Per Capita Income in Kill Devil Hills is $41,679, while median incomes of families and households are $108,344 and $73,036 respectively.
| Characteristic | Number | Measure |
| Per Capita Income | 7,658 | $41,679 |
| Median Family Income | 1,815 | $108,344 |
| Mean Family Income | 1,815 | $114,292 |
| Median Household Income | 3,258 | $73,036 |
| Mean Household Income | 3,258 | $97,851 |
| Income Deficit | 1,815 | $0 |
| Wage / Income Gap (%) | 7,658 | 15.00% |
| Wage / Income Gap ($) | 7,658 | 85.00¢ per $1 |
| Gini / Inequality Index | 7,658 | 0.39 |
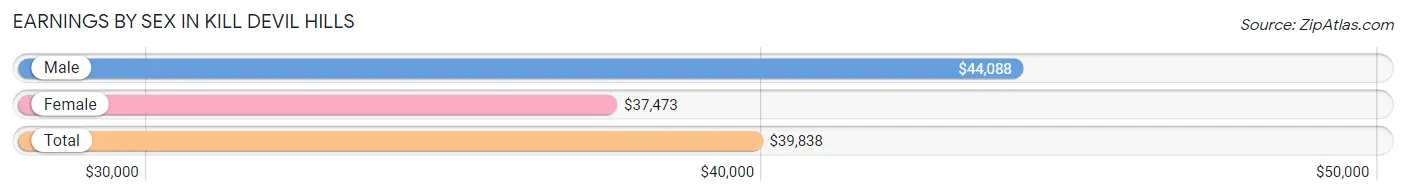
Earnings by Sex in Kill Devil Hills
Average Earnings in Kill Devil Hills are $39,838, $44,088 for men and $37,473 for women, a difference of 15.0%.
| Sex | Number | Average Earnings |
| Male | 2,547 (50.9%) | $44,088 |
| Female | 2,455 (49.1%) | $37,473 |
| Total | 5,002 (100.0%) | $39,838 |
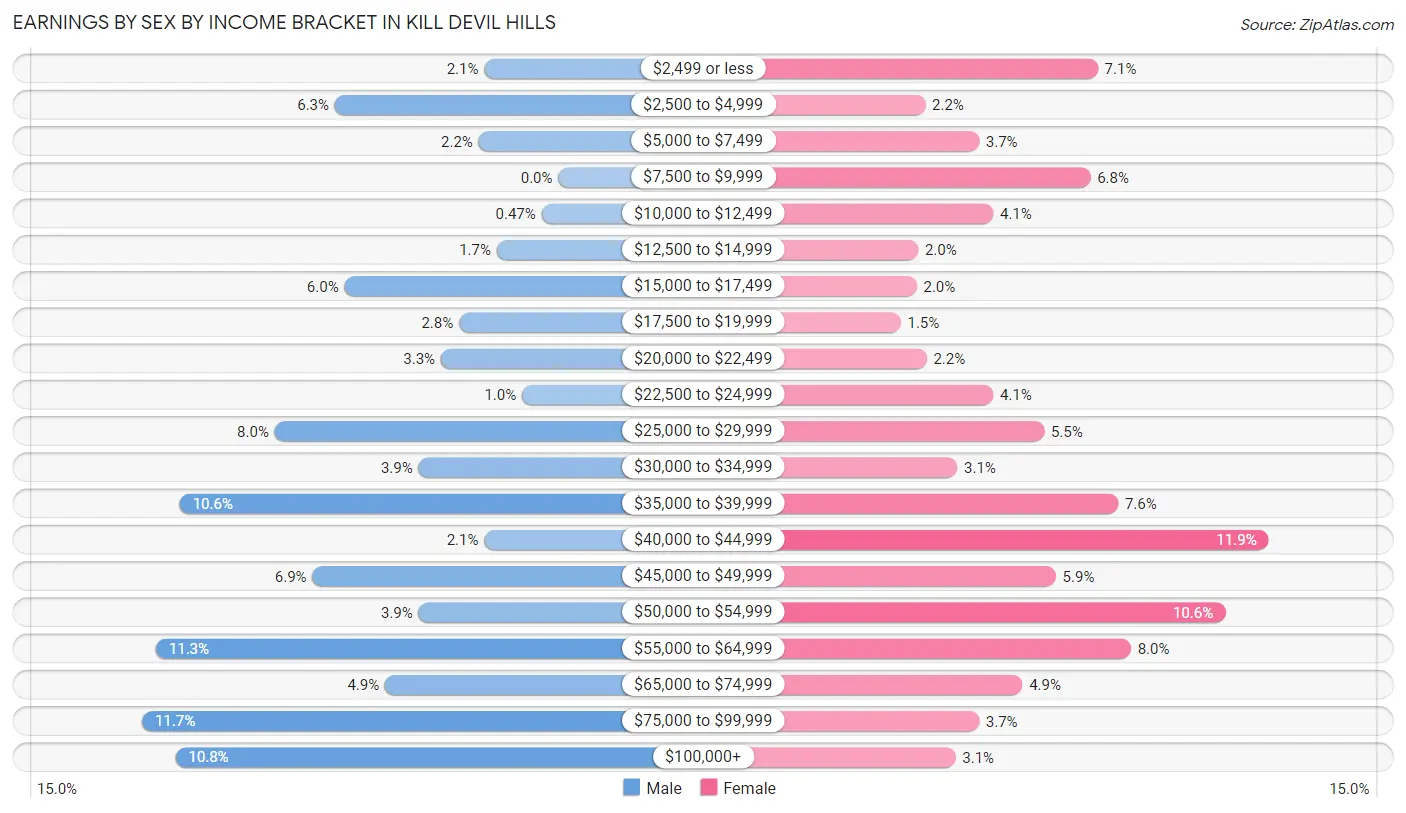
Earnings by Sex by Income Bracket in Kill Devil Hills
The most common earnings brackets in Kill Devil Hills are $75,000 to $99,999 for men (298 | 11.7%) and $40,000 to $44,999 for women (291 | 11.8%).
| Income | Male | Female |
| $2,499 or less | 53 (2.1%) | 173 (7.0%) |
| $2,500 to $4,999 | 160 (6.3%) | 54 (2.2%) |
| $5,000 to $7,499 | 57 (2.2%) | 91 (3.7%) |
| $7,500 to $9,999 | 0 (0.0%) | 168 (6.8%) |
| $10,000 to $12,499 | 12 (0.5%) | 101 (4.1%) |
| $12,500 to $14,999 | 44 (1.7%) | 49 (2.0%) |
| $15,000 to $17,499 | 153 (6.0%) | 48 (2.0%) |
| $17,500 to $19,999 | 71 (2.8%) | 37 (1.5%) |
| $20,000 to $22,499 | 84 (3.3%) | 55 (2.2%) |
| $22,500 to $24,999 | 26 (1.0%) | 101 (4.1%) |
| $25,000 to $29,999 | 203 (8.0%) | 136 (5.5%) |
| $30,000 to $34,999 | 100 (3.9%) | 76 (3.1%) |
| $35,000 to $39,999 | 271 (10.6%) | 187 (7.6%) |
| $40,000 to $44,999 | 53 (2.1%) | 291 (11.8%) |
| $45,000 to $49,999 | 176 (6.9%) | 144 (5.9%) |
| $50,000 to $54,999 | 100 (3.9%) | 261 (10.6%) |
| $55,000 to $64,999 | 288 (11.3%) | 196 (8.0%) |
| $65,000 to $74,999 | 124 (4.9%) | 121 (4.9%) |
| $75,000 to $99,999 | 298 (11.7%) | 91 (3.7%) |
| $100,000+ | 274 (10.8%) | 75 (3.0%) |
| Total | 2,547 (100.0%) | 2,455 (100.0%) |
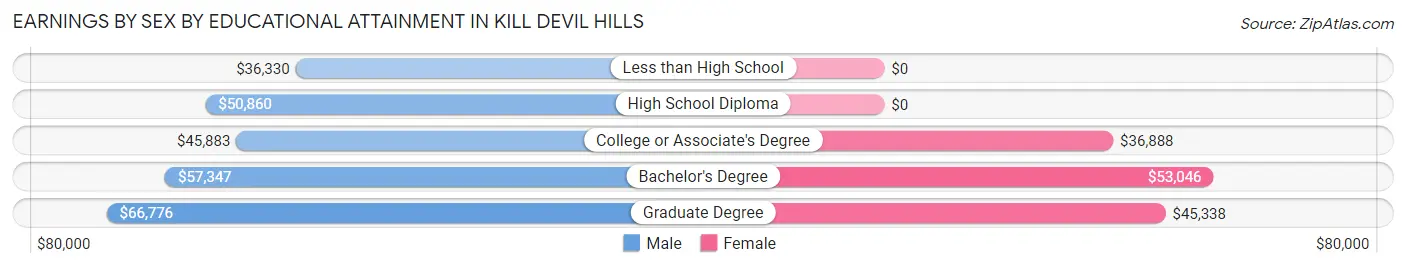
Earnings by Sex by Educational Attainment in Kill Devil Hills
Average earnings in Kill Devil Hills are $51,684 for men and $41,328 for women, a difference of 20.0%. Men with an educational attainment of graduate degree enjoy the highest average annual earnings of $66,776, while those with less than high school education earn the least with $36,330. Women with an educational attainment of bachelor's degree earn the most with the average annual earnings of $53,046, while those with college or associate's degree education have the smallest earnings of $36,888.
| Educational Attainment | Male Income | Female Income |
| Less than High School | $36,330 | $0 |
| High School Diploma | $50,860 | $0 |
| College or Associate's Degree | $45,883 | $36,888 |
| Bachelor's Degree | $57,347 | $53,046 |
| Graduate Degree | $66,776 | $45,338 |
| Total | $51,684 | $41,328 |
Family Income in Kill Devil Hills
Family Income Brackets in Kill Devil Hills
According to the Kill Devil Hills family income data, there are 554 families falling into the $100,000 to $149,999 income range, which is the most common income bracket and makes up 30.5% of all families. Conversely, the less than $10,000 income bracket is the least frequent group with only 4 families (0.2%) belonging to this category.
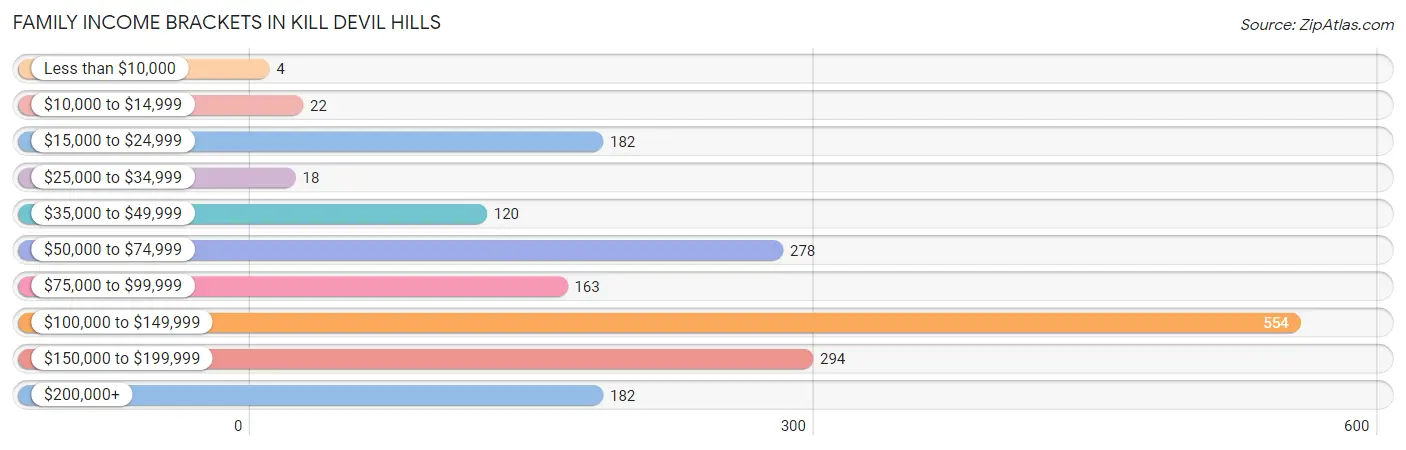
| Income Bracket | # Families | % Families |
| Less than $10,000 | 4 | 0.2% |
| $10,000 to $14,999 | 22 | 1.2% |
| $15,000 to $24,999 | 182 | 10.0% |
| $25,000 to $34,999 | 18 | 1.0% |
| $35,000 to $49,999 | 120 | 6.6% |
| $50,000 to $74,999 | 278 | 15.3% |
| $75,000 to $99,999 | 163 | 9.0% |
| $100,000 to $149,999 | 554 | 30.5% |
| $150,000 to $199,999 | 294 | 16.2% |
| $200,000+ | 182 | 10.0% |
Family Income by Famaliy Size in Kill Devil Hills
4-person families (364 | 20.1%) account for the highest median family income in Kill Devil Hills with $160,134 per family, while 2-person families (1,023 | 56.4%) have the highest median income of $52,533 per family member.
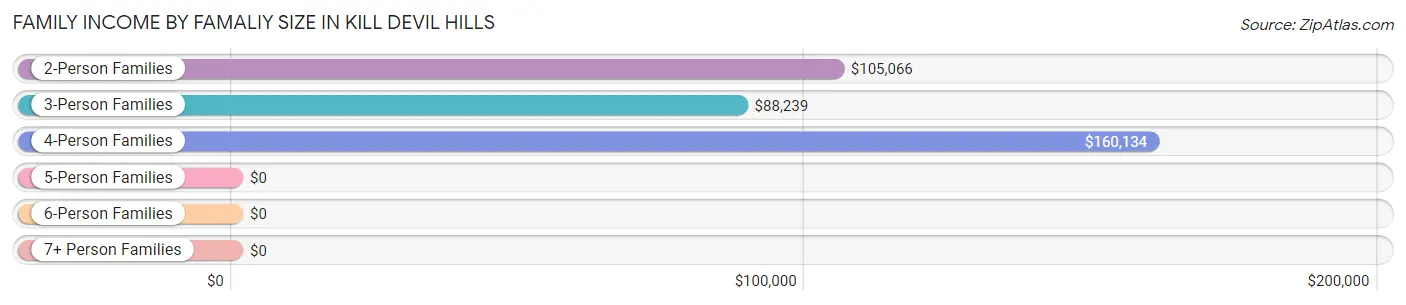
| Income Bracket | # Families | Median Income |
| 2-Person Families | 1,023 (56.4%) | $105,066 |
| 3-Person Families | 291 (16.0%) | $88,239 |
| 4-Person Families | 364 (20.1%) | $160,134 |
| 5-Person Families | 98 (5.4%) | $0 |
| 6-Person Families | 39 (2.1%) | $0 |
| 7+ Person Families | 0 (0.0%) | $0 |
| Total | 1,815 (100.0%) | $108,344 |
Family Income by Number of Earners in Kill Devil Hills
The median family income in Kill Devil Hills is $108,344, with families comprising 3+ earners (283) having the highest median family income of $160,530, while families with 1 earner (426) have the lowest median family income of $47,763, accounting for 15.6% and 23.5% of families, respectively.
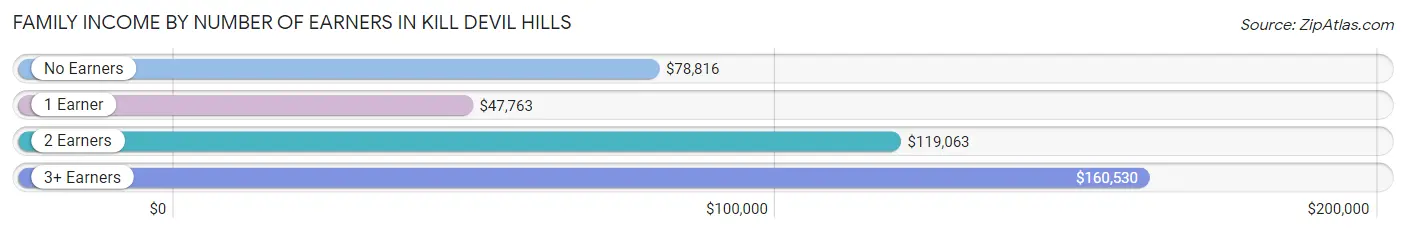
| Number of Earners | # Families | Median Income |
| No Earners | 218 (12.0%) | $78,816 |
| 1 Earner | 426 (23.5%) | $47,763 |
| 2 Earners | 888 (48.9%) | $119,063 |
| 3+ Earners | 283 (15.6%) | $160,530 |
| Total | 1,815 (100.0%) | $108,344 |
Household Income in Kill Devil Hills
Household Income Brackets in Kill Devil Hills
With 775 households falling in the category, the $50,000 to $74,999 income range is the most frequent in Kill Devil Hills, accounting for 23.8% of all households. In contrast, only 16 households (0.5%) fall into the less than $10,000 income bracket, making it the least populous group.
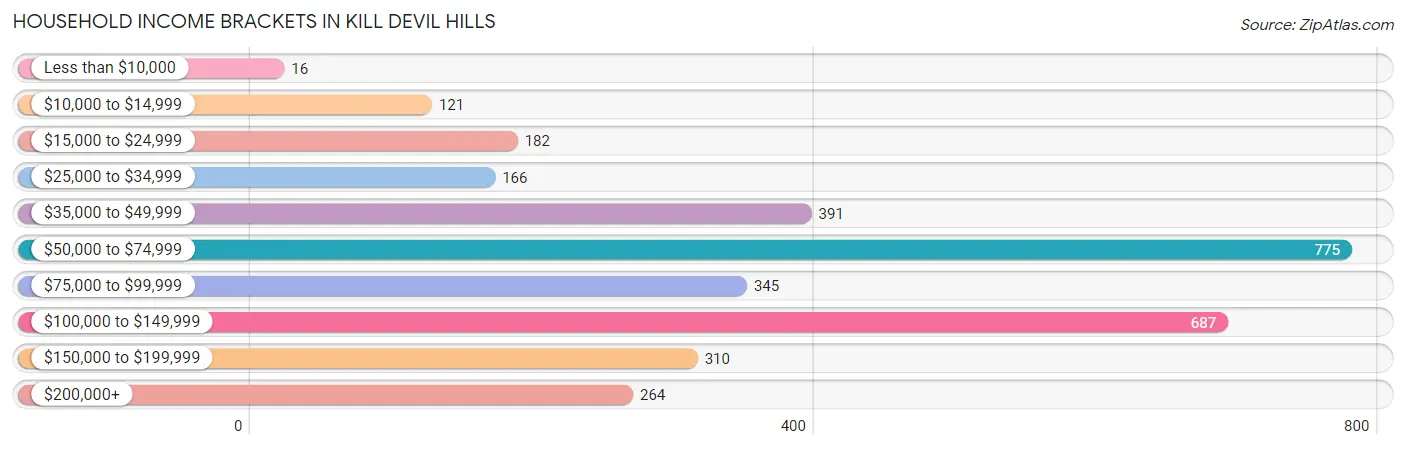
| Income Bracket | # Households | % Households |
| Less than $10,000 | 16 | 0.5% |
| $10,000 to $14,999 | 121 | 3.7% |
| $15,000 to $24,999 | 182 | 5.6% |
| $25,000 to $34,999 | 166 | 5.1% |
| $35,000 to $49,999 | 391 | 12.0% |
| $50,000 to $74,999 | 775 | 23.8% |
| $75,000 to $99,999 | 345 | 10.6% |
| $100,000 to $149,999 | 687 | 21.1% |
| $150,000 to $199,999 | 310 | 9.5% |
| $200,000+ | 264 | 8.1% |
Household Income by Householder Age in Kill Devil Hills
The median household income in Kill Devil Hills is $73,036, with the highest median household income of $97,481 found in the 45 to 64 years age bracket for the primary householder. A total of 1,555 households (47.7%) fall into this category. Meanwhile, the 65+ years age bracket for the primary householder has the lowest median household income of $55,855, with 884 households (27.1%) in this group.
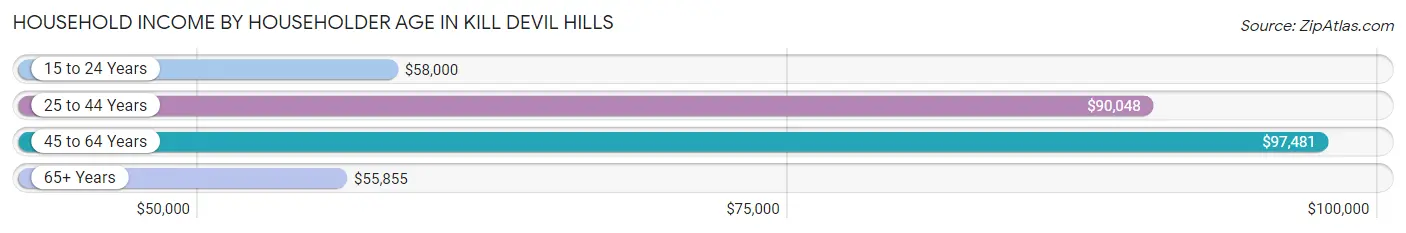
| Income Bracket | # Households | Median Income |
| 15 to 24 Years | 136 (4.2%) | $58,000 |
| 25 to 44 Years | 683 (21.0%) | $90,048 |
| 45 to 64 Years | 1,555 (47.7%) | $97,481 |
| 65+ Years | 884 (27.1%) | $55,855 |
| Total | 3,258 (100.0%) | $73,036 |
Poverty in Kill Devil Hills
Income Below Poverty by Sex and Age in Kill Devil Hills
With 9.1% poverty level for males and 4.2% for females among the residents of Kill Devil Hills, 12 to 14 year old males and 45 to 54 year old females are the most vulnerable to poverty, with 50 males (45.1%) and 79 females (12.1%) in their respective age groups living below the poverty level.
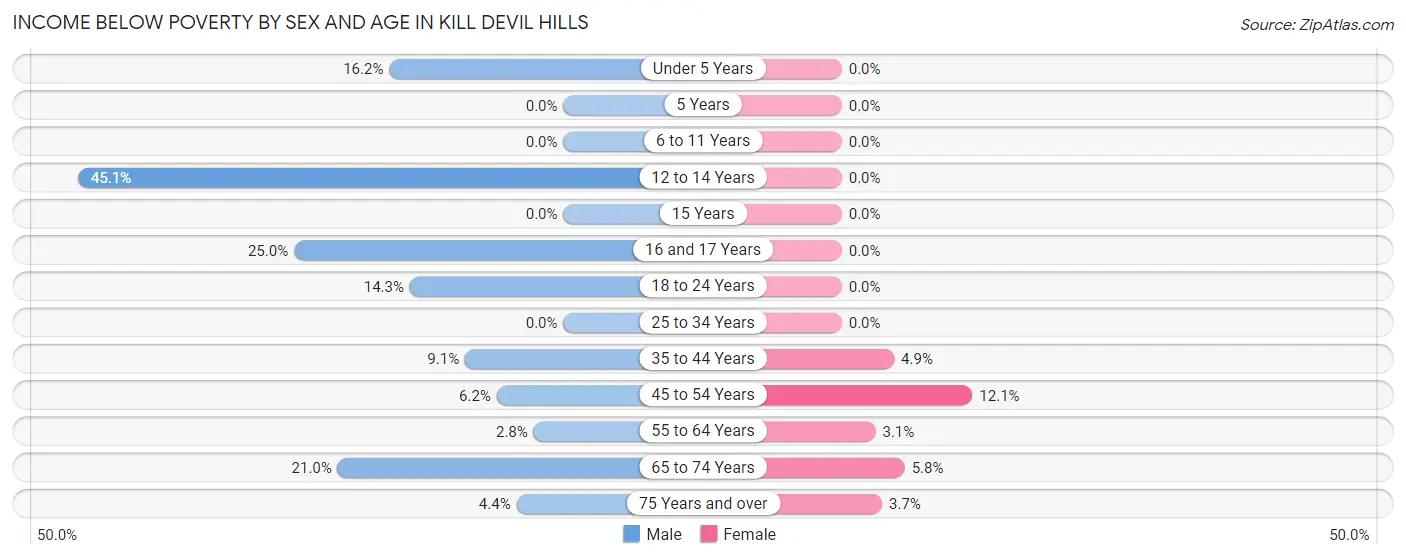
| Age Bracket | Male | Female |
| Under 5 Years | 16 (16.2%) | 0 (0.0%) |
| 5 Years | 0 (0.0%) | 0 (0.0%) |
| 6 to 11 Years | 0 (0.0%) | 0 (0.0%) |
| 12 to 14 Years | 50 (45.1%) | 0 (0.0%) |
| 15 Years | 0 (0.0%) | 0 (0.0%) |
| 16 and 17 Years | 25 (25.0%) | 0 (0.0%) |
| 18 to 24 Years | 62 (14.2%) | 0 (0.0%) |
| 25 to 34 Years | 0 (0.0%) | 0 (0.0%) |
| 35 to 44 Years | 24 (9.1%) | 22 (4.9%) |
| 45 to 54 Years | 56 (6.2%) | 79 (12.1%) |
| 55 to 64 Years | 21 (2.8%) | 21 (3.1%) |
| 65 to 74 Years | 84 (20.9%) | 25 (5.8%) |
| 75 Years and over | 8 (4.3%) | 14 (3.7%) |
| Total | 346 (9.1%) | 161 (4.2%) |
Income Above Poverty by Sex and Age in Kill Devil Hills
According to the poverty statistics in Kill Devil Hills, males aged 5 years and females aged under 5 years are the age groups that are most secure financially, with 100.0% of males and 100.0% of females in these age groups living above the poverty line.
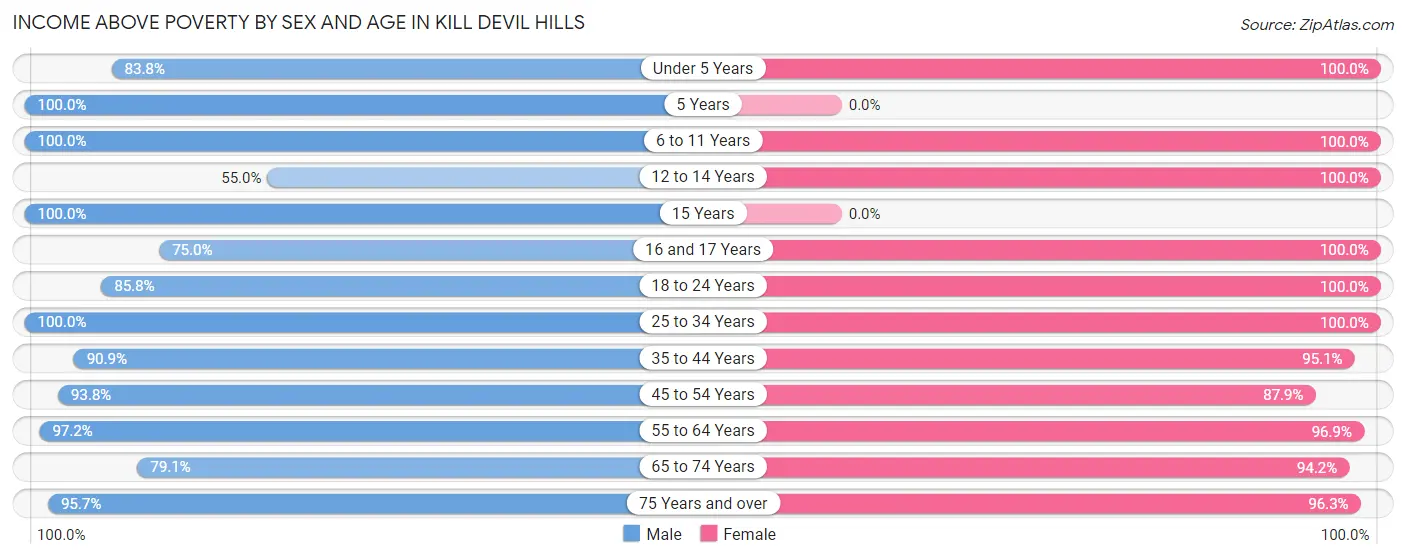
| Age Bracket | Male | Female |
| Under 5 Years | 83 (83.8%) | 284 (100.0%) |
| 5 Years | 20 (100.0%) | 0 (0.0%) |
| 6 to 11 Years | 258 (100.0%) | 31 (100.0%) |
| 12 to 14 Years | 61 (54.9%) | 152 (100.0%) |
| 15 Years | 35 (100.0%) | 0 (0.0%) |
| 16 and 17 Years | 75 (75.0%) | 128 (100.0%) |
| 18 to 24 Years | 373 (85.8%) | 348 (100.0%) |
| 25 to 34 Years | 214 (100.0%) | 351 (100.0%) |
| 35 to 44 Years | 239 (90.9%) | 431 (95.1%) |
| 45 to 54 Years | 849 (93.8%) | 573 (87.9%) |
| 55 to 64 Years | 741 (97.2%) | 649 (96.9%) |
| 65 to 74 Years | 317 (79.0%) | 403 (94.2%) |
| 75 Years and over | 176 (95.7%) | 360 (96.3%) |
| Total | 3,441 (90.9%) | 3,710 (95.8%) |
Income Below Poverty Among Married-Couple Families in Kill Devil Hills
The poverty statistics for married-couple families in Kill Devil Hills show that 0.2% or 3 of the total 1,419 families live below the poverty line. Families with no children have the highest poverty rate of 0.3%, comprising of 3 families. On the other hand, families with 1 or 2 children have the lowest poverty rate of 0.0%, which includes 0 families.
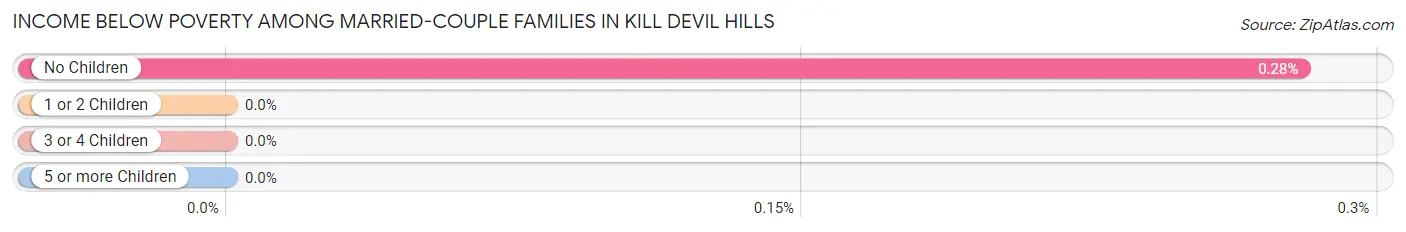
| Children | Above Poverty | Below Poverty |
| No Children | 1,081 (99.7%) | 3 (0.3%) |
| 1 or 2 Children | 270 (100.0%) | 0 (0.0%) |
| 3 or 4 Children | 65 (100.0%) | 0 (0.0%) |
| 5 or more Children | 0 (0.0%) | 0 (0.0%) |
| Total | 1,416 (99.8%) | 3 (0.2%) |
Income Below Poverty Among Single-Parent Households in Kill Devil Hills
According to the poverty data in Kill Devil Hills, 70.5% or 43 single-father households and 10.7% or 36 single-mother households are living below the poverty line. Among single-father households, those with 1 or 2 children have the highest poverty rate, with 43 households (70.5%) experiencing poverty. Likewise, among single-mother households, those with 1 or 2 children have the highest poverty rate, with 36 households (23.2%) falling below the poverty line.
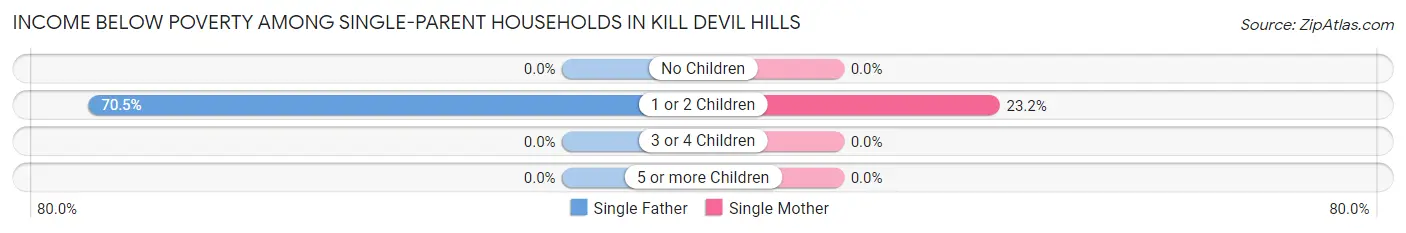
| Children | Single Father | Single Mother |
| No Children | 0 (0.0%) | 0 (0.0%) |
| 1 or 2 Children | 43 (70.5%) | 36 (23.2%) |
| 3 or 4 Children | 0 (0.0%) | 0 (0.0%) |
| 5 or more Children | 0 (0.0%) | 0 (0.0%) |
| Total | 43 (70.5%) | 36 (10.7%) |
Income Below Poverty Among Married-Couple vs Single-Parent Households in Kill Devil Hills
The poverty data for Kill Devil Hills shows that 3 of the married-couple family households (0.2%) and 79 of the single-parent households (20.0%) are living below the poverty level. Within the married-couple family households, those with no children have the highest poverty rate, with 3 households (0.3%) falling below the poverty line. Among the single-parent households, those with 1 or 2 children have the highest poverty rate, with 79 household (36.6%) living below poverty.
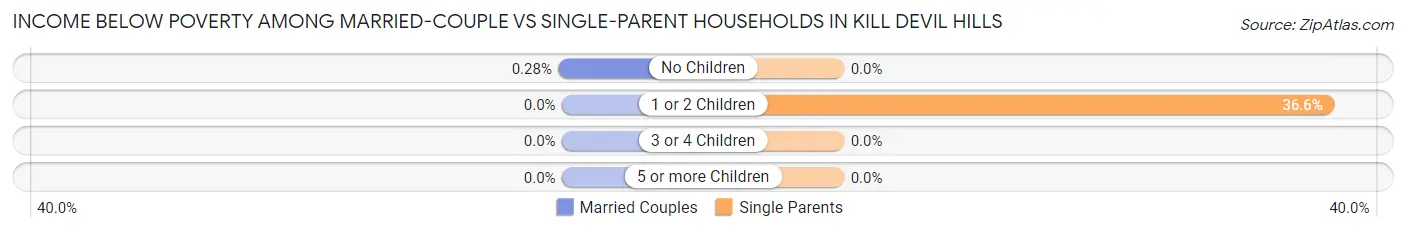
| Children | Married-Couple Families | Single-Parent Households |
| No Children | 3 (0.3%) | 0 (0.0%) |
| 1 or 2 Children | 0 (0.0%) | 79 (36.6%) |
| 3 or 4 Children | 0 (0.0%) | 0 (0.0%) |
| 5 or more Children | 0 (0.0%) | 0 (0.0%) |
| Total | 3 (0.2%) | 79 (20.0%) |
Race in Kill Devil Hills
The most populous races in Kill Devil Hills are White / Caucasian (6,254 | 81.7%), Hispanic or Latino (971 | 12.7%), and Two or more Races (730 | 9.5%).
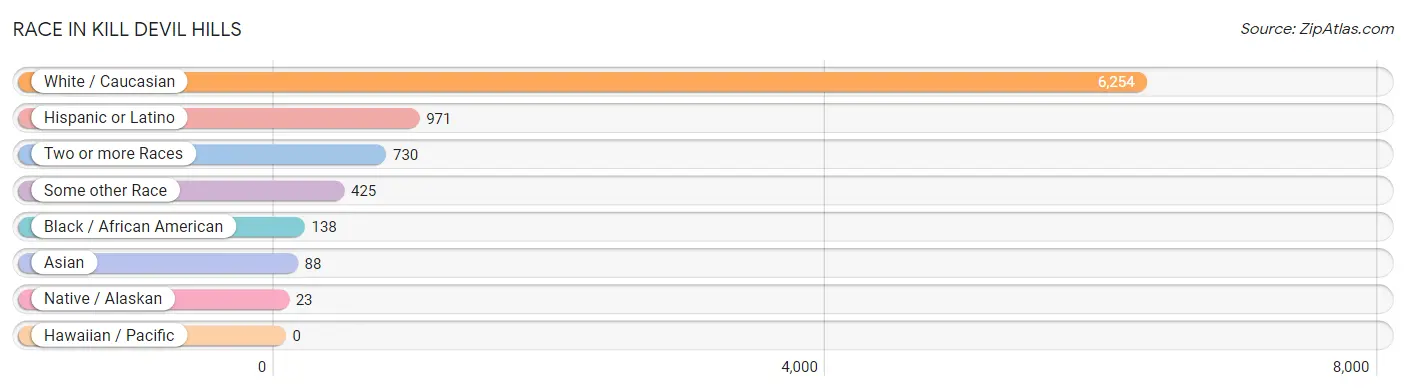
| Race | # Population | % Population |
| Asian | 88 | 1.1% |
| Black / African American | 138 | 1.8% |
| Hawaiian / Pacific | 0 | 0.0% |
| Hispanic or Latino | 971 | 12.7% |
| Native / Alaskan | 23 | 0.3% |
| White / Caucasian | 6,254 | 81.7% |
| Two or more Races | 730 | 9.5% |
| Some other Race | 425 | 5.6% |
| Total | 7,658 | 100.0% |
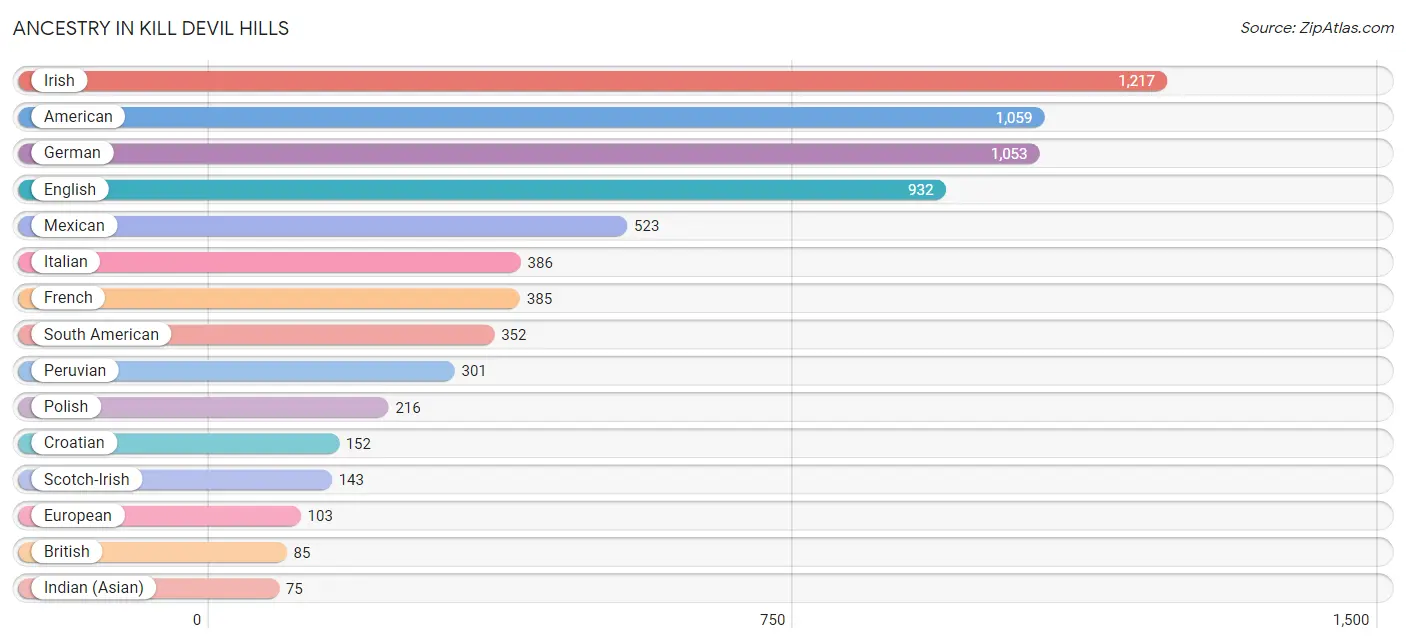
Ancestry in Kill Devil Hills
The most populous ancestries reported in Kill Devil Hills are Irish (1,217 | 15.9%), American (1,059 | 13.8%), German (1,053 | 13.8%), English (932 | 12.2%), and Mexican (523 | 6.8%), together accounting for 62.5% of all Kill Devil Hills residents.
| Ancestry | # Population | % Population |
| American | 1,059 | 13.8% |
| Arab | 40 | 0.5% |
| British | 85 | 1.1% |
| Canadian | 20 | 0.3% |
| Central American | 64 | 0.8% |
| Central American Indian | 64 | 0.8% |
| Cherokee | 16 | 0.2% |
| Colombian | 31 | 0.4% |
| Croatian | 152 | 2.0% |
| Czech | 40 | 0.5% |
| Czechoslovakian | 19 | 0.3% |
| Danish | 11 | 0.1% |
| Dutch | 21 | 0.3% |
| English | 932 | 12.2% |
| European | 103 | 1.3% |
| French | 385 | 5.0% |
| French Canadian | 34 | 0.4% |
| German | 1,053 | 13.8% |
| Greek | 19 | 0.3% |
| Hungarian | 28 | 0.4% |
| Indian (Asian) | 75 | 1.0% |
| Irish | 1,217 | 15.9% |
| Italian | 386 | 5.0% |
| Korean | 16 | 0.2% |
| Lebanese | 40 | 0.5% |
| Lithuanian | 17 | 0.2% |
| Mexican | 523 | 6.8% |
| Mongolian | 23 | 0.3% |
| Nicaraguan | 64 | 0.8% |
| Peruvian | 301 | 3.9% |
| Polish | 216 | 2.8% |
| Puerto Rican | 32 | 0.4% |
| Russian | 24 | 0.3% |
| Scotch-Irish | 143 | 1.9% |
| Scottish | 61 | 0.8% |
| Slovene | 29 | 0.4% |
| South American | 352 | 4.6% |
| Sri Lankan | 12 | 0.2% |
| Swedish | 47 | 0.6% |
| Swiss | 14 | 0.2% |
| Ukrainian | 69 | 0.9% |
| Welsh | 42 | 0.5% | View All 42 Rows |
Immigrants in Kill Devil Hills
The most numerous immigrant groups reported in Kill Devil Hills came from Latin America (416 | 5.4%), Central America (299 | 3.9%), Mexico (276 | 3.6%), South America (117 | 1.5%), and Peru (102 | 1.3%), together accounting for 15.8% of all Kill Devil Hills residents.
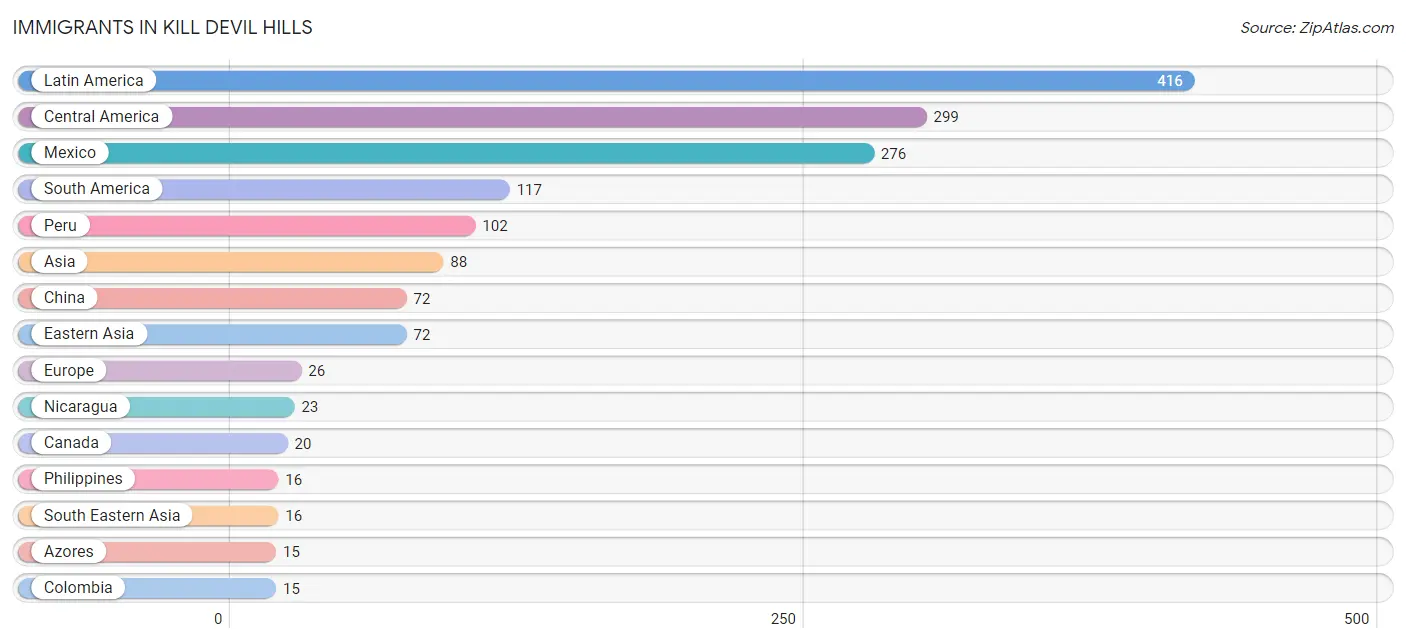
| Immigration Origin | # Population | % Population |
| Asia | 88 | 1.1% |
| Azores | 15 | 0.2% |
| Canada | 20 | 0.3% |
| Central America | 299 | 3.9% |
| China | 72 | 0.9% |
| Colombia | 15 | 0.2% |
| Eastern Asia | 72 | 0.9% |
| Europe | 26 | 0.3% |
| Germany | 11 | 0.1% |
| Latin America | 416 | 5.4% |
| Mexico | 276 | 3.6% |
| Nicaragua | 23 | 0.3% |
| Peru | 102 | 1.3% |
| Philippines | 16 | 0.2% |
| Portugal | 15 | 0.2% |
| South America | 117 | 1.5% |
| South Eastern Asia | 16 | 0.2% |
| Southern Europe | 15 | 0.2% |
| Western Europe | 11 | 0.1% | View All 19 Rows |
Sex and Age in Kill Devil Hills
Sex and Age in Kill Devil Hills
The most populous age groups in Kill Devil Hills are 45 to 49 Years (511 | 13.5%) for men and 55 to 59 Years (485 | 12.5%) for women.
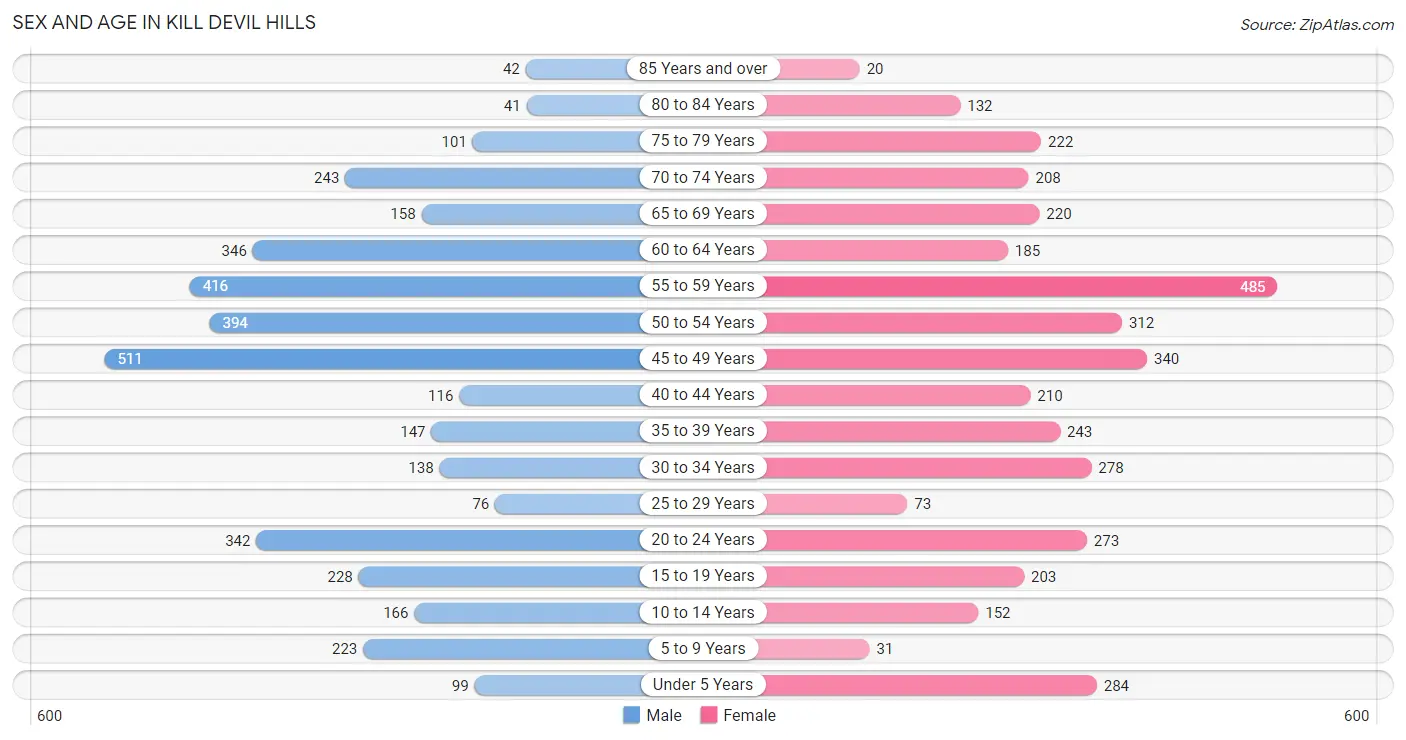
| Age Bracket | Male | Female |
| Under 5 Years | 99 (2.6%) | 284 (7.3%) |
| 5 to 9 Years | 223 (5.9%) | 31 (0.8%) |
| 10 to 14 Years | 166 (4.4%) | 152 (3.9%) |
| 15 to 19 Years | 228 (6.0%) | 203 (5.2%) |
| 20 to 24 Years | 342 (9.0%) | 273 (7.0%) |
| 25 to 29 Years | 76 (2.0%) | 73 (1.9%) |
| 30 to 34 Years | 138 (3.6%) | 278 (7.2%) |
| 35 to 39 Years | 147 (3.9%) | 243 (6.3%) |
| 40 to 44 Years | 116 (3.1%) | 210 (5.4%) |
| 45 to 49 Years | 511 (13.5%) | 340 (8.8%) |
| 50 to 54 Years | 394 (10.4%) | 312 (8.1%) |
| 55 to 59 Years | 416 (11.0%) | 485 (12.5%) |
| 60 to 64 Years | 346 (9.1%) | 185 (4.8%) |
| 65 to 69 Years | 158 (4.2%) | 220 (5.7%) |
| 70 to 74 Years | 243 (6.4%) | 208 (5.4%) |
| 75 to 79 Years | 101 (2.7%) | 222 (5.7%) |
| 80 to 84 Years | 41 (1.1%) | 132 (3.4%) |
| 85 Years and over | 42 (1.1%) | 20 (0.5%) |
| Total | 3,787 (100.0%) | 3,871 (100.0%) |
Families and Households in Kill Devil Hills
Median Family Size in Kill Devil Hills
The median family size in Kill Devil Hills is 3.02 persons per family, with single male/father families (61 | 3.4%) accounting for the largest median family size of 3.34 persons per family. On the other hand, single female/mother families (335 | 18.5%) represent the smallest median family size with 2.99 persons per family.
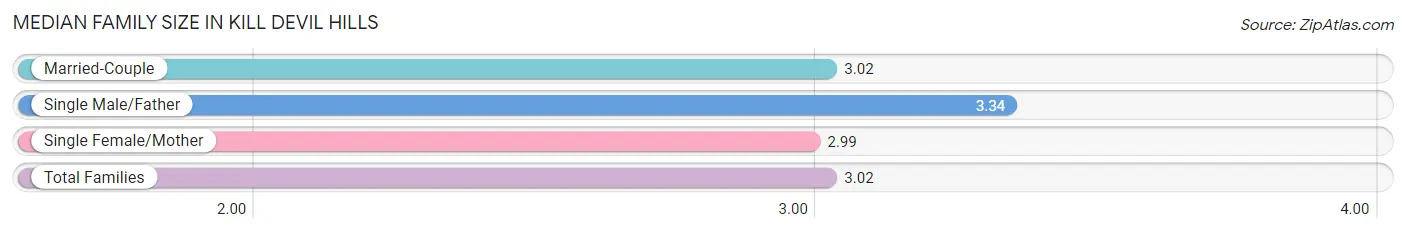
| Family Type | # Families | Family Size |
| Married-Couple | 1,419 (78.2%) | 3.02 |
| Single Male/Father | 61 (3.4%) | 3.34 |
| Single Female/Mother | 335 (18.5%) | 2.99 |
| Total Families | 1,815 (100.0%) | 3.02 |
Median Household Size in Kill Devil Hills
The median household size in Kill Devil Hills is 2.35 persons per household, with single female/mother households (335 | 10.3%) accounting for the largest median household size of 3.57 persons per household. non-family households (1,443 | 44.3%) represent the smallest median household size with 1.31 persons per household.
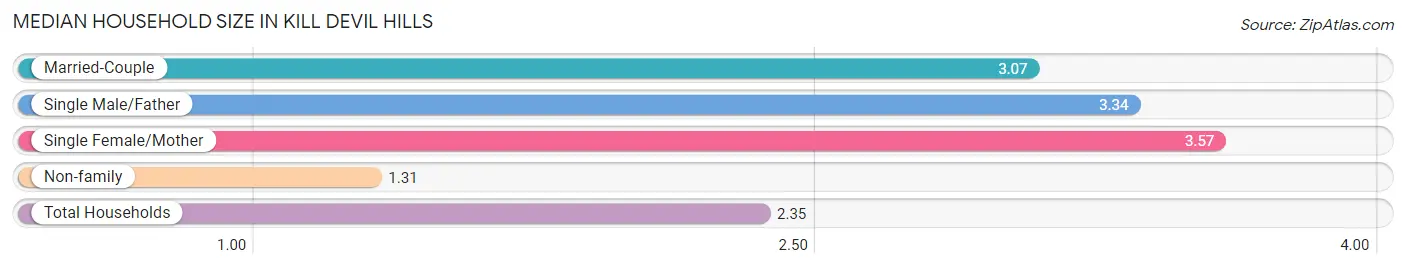
| Household Type | # Households | Household Size |
| Married-Couple | 1,419 (43.5%) | 3.07 |
| Single Male/Father | 61 (1.9%) | 3.34 |
| Single Female/Mother | 335 (10.3%) | 3.57 |
| Non-family | 1,443 (44.3%) | 1.31 |
| Total Households | 3,258 (100.0%) | 2.35 |
Household Size by Marriage Status in Kill Devil Hills
Out of a total of 3,258 households in Kill Devil Hills, 1,815 (55.7%) are family households, while 1,443 (44.3%) are nonfamily households. The most numerous type of family households are 2-person households, comprising 860, and the most common type of nonfamily households are 1-person households, comprising 1,106.
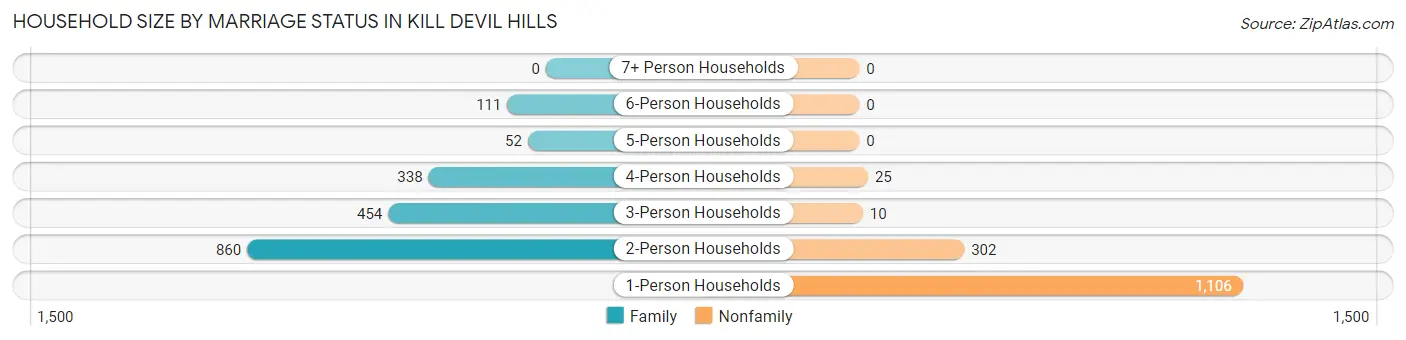
| Household Size | Family Households | Nonfamily Households |
| 1-Person Households | - | 1,106 (34.0%) |
| 2-Person Households | 860 (26.4%) | 302 (9.3%) |
| 3-Person Households | 454 (13.9%) | 10 (0.3%) |
| 4-Person Households | 338 (10.4%) | 25 (0.8%) |
| 5-Person Households | 52 (1.6%) | 0 (0.0%) |
| 6-Person Households | 111 (3.4%) | 0 (0.0%) |
| 7+ Person Households | 0 (0.0%) | 0 (0.0%) |
| Total | 1,815 (55.7%) | 1,443 (44.3%) |
Female Fertility in Kill Devil Hills
Fertility by Age in Kill Devil Hills
Average fertility rate in Kill Devil Hills is 39.0 births per 1,000 women. Women in the age bracket of 20 to 34 years have the highest fertility rate with 72.0 births per 1,000 women. Women in the age bracket of 20 to 34 years acount for 67.2% of all women with births.
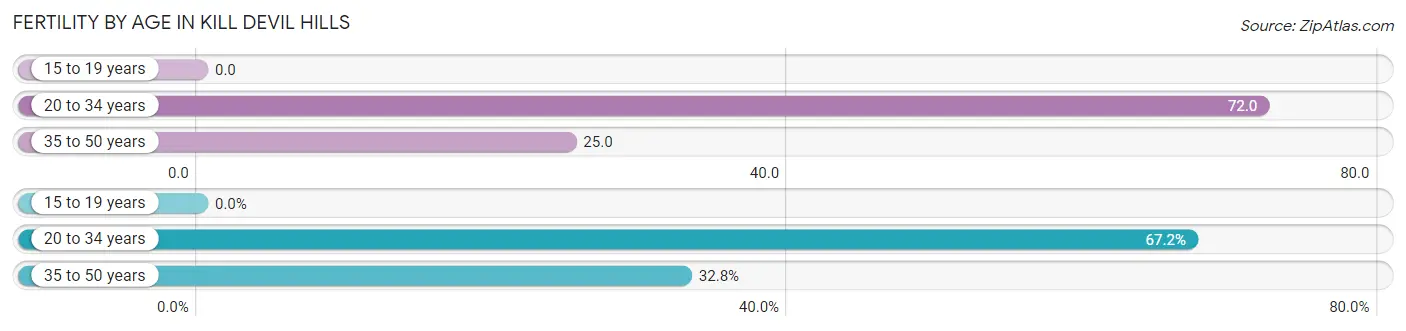
| Age Bracket | Women with Births | Births / 1,000 Women |
| 15 to 19 years | 0 (0.0%) | 0.0 |
| 20 to 34 years | 45 (67.2%) | 72.0 |
| 35 to 50 years | 22 (32.8%) | 25.0 |
| Total | 67 (100.0%) | 39.0 |
Fertility by Age by Marriage Status in Kill Devil Hills
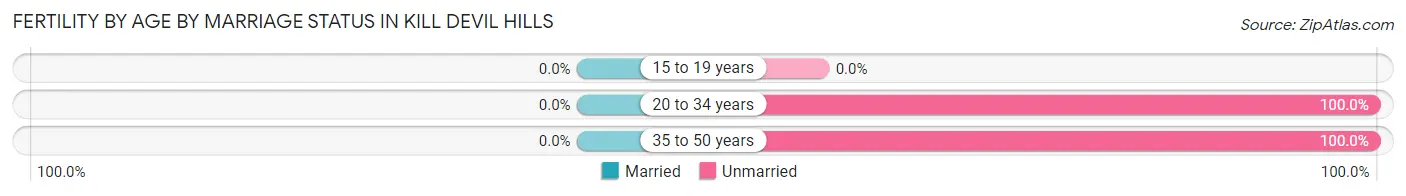
| Age Bracket | Married | Unmarried |
| 15 to 19 years | 0 (0.0%) | 0 (0.0%) |
| 20 to 34 years | 0 (0.0%) | 45 (100.0%) |
| 35 to 50 years | 0 (0.0%) | 22 (100.0%) |
| Total | 0 (0.0%) | 67 (100.0%) |
Fertility by Education in Kill Devil Hills
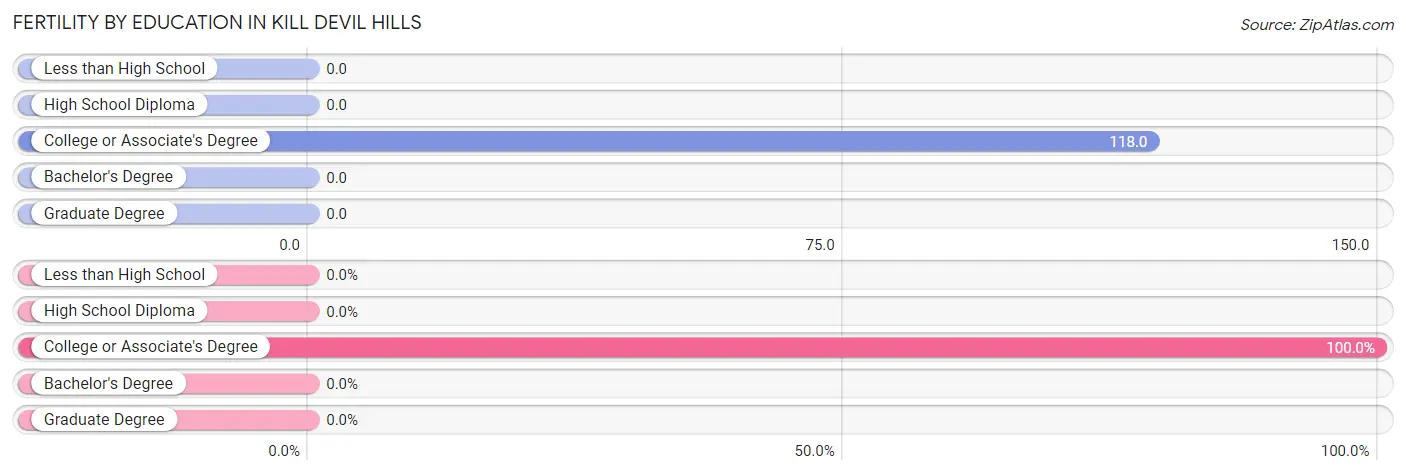
| Educational Attainment | Women with Births | Births / 1,000 Women |
| Less than High School | 0 (0.0%) | 0.0 |
| High School Diploma | 0 (0.0%) | 0.0 |
| College or Associate's Degree | 67 (100.0%) | 118.0 |
| Bachelor's Degree | 0 (0.0%) | 0.0 |
| Graduate Degree | 0 (0.0%) | 0.0 |
| Total | 67 (100.0%) | 39.0 |
Fertility by Education by Marriage Status in Kill Devil Hills
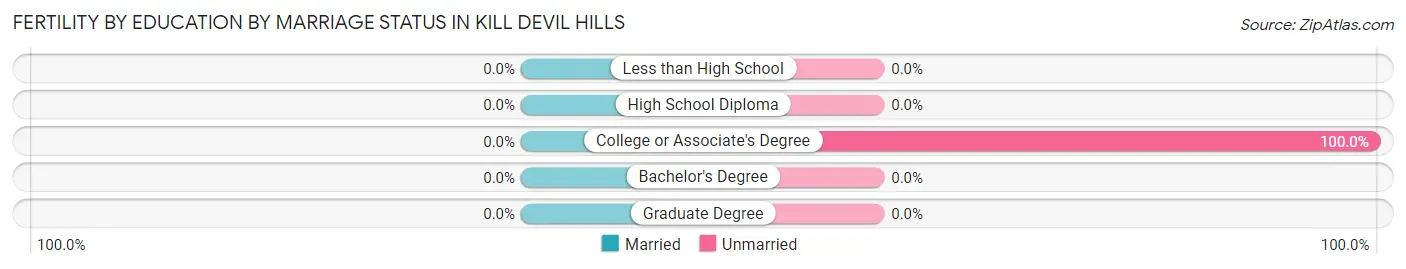
| Educational Attainment | Married | Unmarried |
| Less than High School | 0 (0.0%) | 0 (0.0%) |
| High School Diploma | 0 (0.0%) | 0 (0.0%) |
| College or Associate's Degree | 0 (0.0%) | 67 (100.0%) |
| Bachelor's Degree | 0 (0.0%) | 0 (0.0%) |
| Graduate Degree | 0 (0.0%) | 0 (0.0%) |
| Total | 0 (0.0%) | 67 (100.0%) |
Employment Characteristics in Kill Devil Hills
Employment by Class of Employer in Kill Devil Hills
Among the 4,223 employed individuals in Kill Devil Hills, private company employees (2,563 | 60.7%), self-employed (not incorporated) (532 | 12.6%), and local government employees (360 | 8.5%) make up the most common classes of employment.
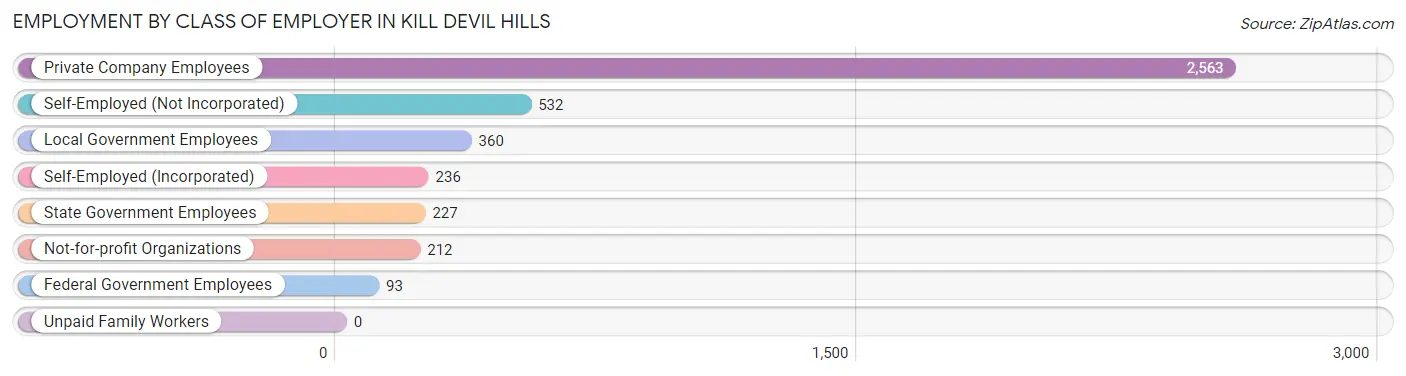
| Employer Class | # Employees | % Employees |
| Private Company Employees | 2,563 | 60.7% |
| Self-Employed (Incorporated) | 236 | 5.6% |
| Self-Employed (Not Incorporated) | 532 | 12.6% |
| Not-for-profit Organizations | 212 | 5.0% |
| Local Government Employees | 360 | 8.5% |
| State Government Employees | 227 | 5.4% |
| Federal Government Employees | 93 | 2.2% |
| Unpaid Family Workers | 0 | 0.0% |
| Total | 4,223 | 100.0% |
Employment Status by Age in Kill Devil Hills
According to the labor force statistics for Kill Devil Hills, out of the total population over 16 years of age (6,668), 70.5% or 4,701 individuals are in the labor force, with 6.1% or 287 of them unemployed. The age group with the highest labor force participation rate is 20 to 24 years, with 100.0% or 615 individuals in the labor force. Within the labor force, the 16 to 19 years age range has the highest percentage of unemployed individuals, with 28.0% or 72 of them being unemployed.
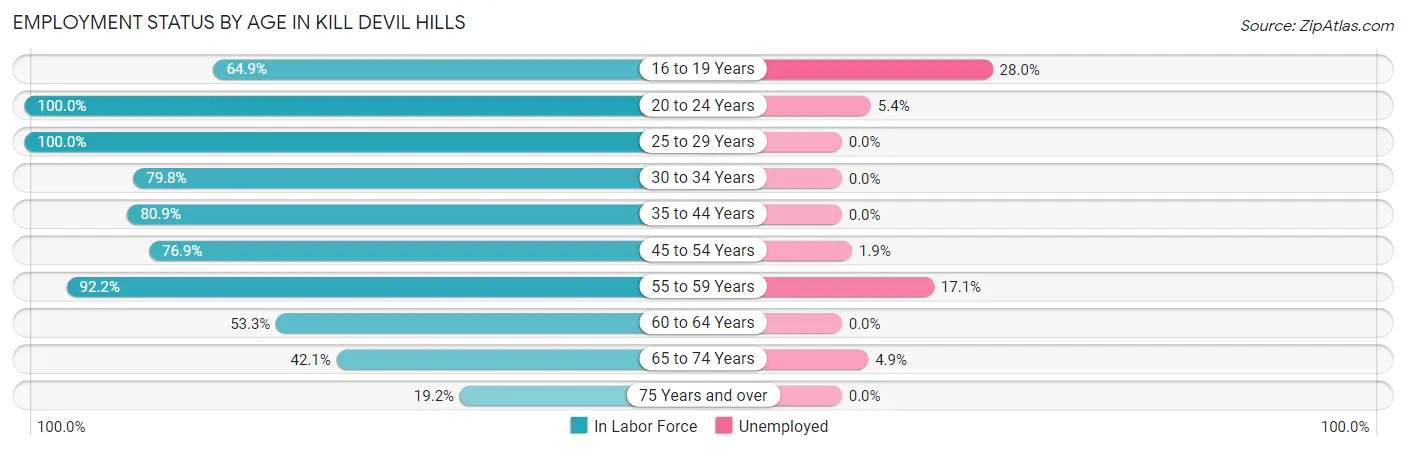
| Age Bracket | In Labor Force | Unemployed |
| 16 to 19 Years | 257 (64.9%) | 72 (28.0%) |
| 20 to 24 Years | 615 (100.0%) | 33 (5.4%) |
| 25 to 29 Years | 149 (100.0%) | 0 (0.0%) |
| 30 to 34 Years | 332 (79.8%) | 0 (0.0%) |
| 35 to 44 Years | 579 (80.9%) | 0 (0.0%) |
| 45 to 54 Years | 1,197 (76.9%) | 23 (1.9%) |
| 55 to 59 Years | 831 (92.2%) | 142 (17.1%) |
| 60 to 64 Years | 283 (53.3%) | 0 (0.0%) |
| 65 to 74 Years | 349 (42.1%) | 17 (4.9%) |
| 75 Years and over | 107 (19.2%) | 0 (0.0%) |
| Total | 4,701 (70.5%) | 287 (6.1%) |
Employment Status by Educational Attainment in Kill Devil Hills
According to labor force statistics for Kill Devil Hills, 79.0% of individuals (3,373) out of the total population between 25 and 64 years of age (4,270) are in the labor force, with 4.9% or 165 of them being unemployed. The group with the highest labor force participation rate are those with the educational attainment of high school diploma, with 82.9% or 675 individuals in the labor force. Within the labor force, individuals with bachelor's degree or higher education have the highest percentage of unemployment, with 9.0% or 131 of them being unemployed.
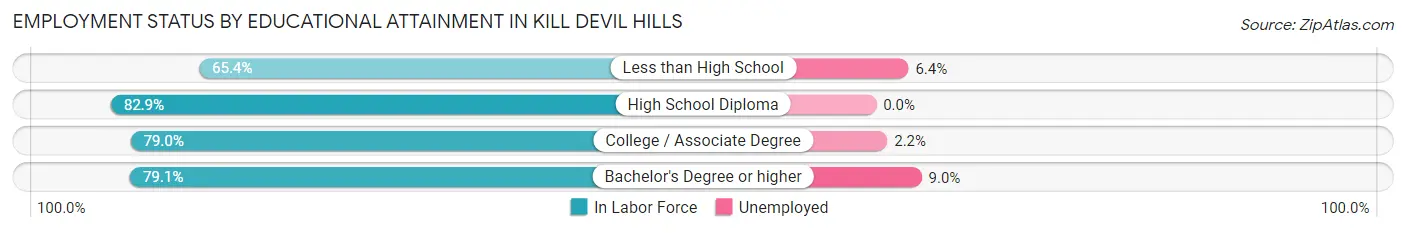
| Educational Attainment | In Labor Force | Unemployed |
| Less than High School | 172 (65.4%) | 17 (6.4%) |
| High School Diploma | 675 (82.9%) | 0 (0.0%) |
| College / Associate Degree | 1,074 (79.0%) | 30 (2.2%) |
| Bachelor's Degree or higher | 1,451 (79.1%) | 165 (9.0%) |
| Total | 3,373 (79.0%) | 209 (4.9%) |
Employment Occupations by Sex in Kill Devil Hills
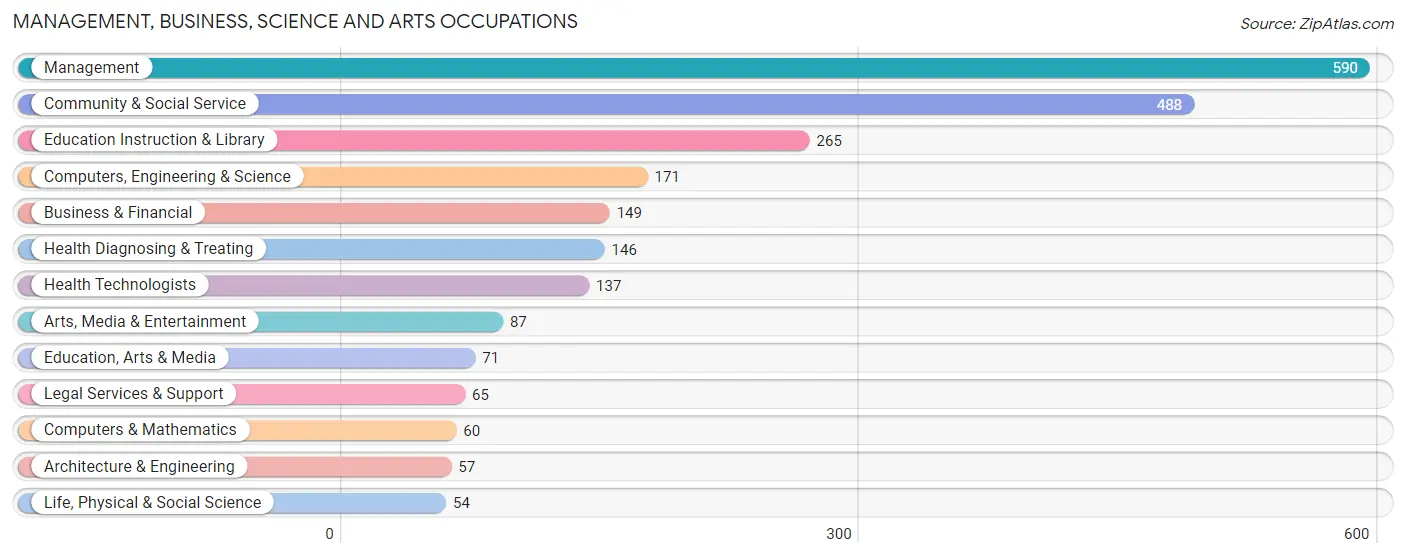
Management, Business, Science and Arts Occupations
The most common Management, Business, Science and Arts occupations in Kill Devil Hills are Management (590 | 13.5%), Community & Social Service (488 | 11.1%), Education Instruction & Library (265 | 6.0%), Computers, Engineering & Science (171 | 3.9%), and Business & Financial (149 | 3.4%).
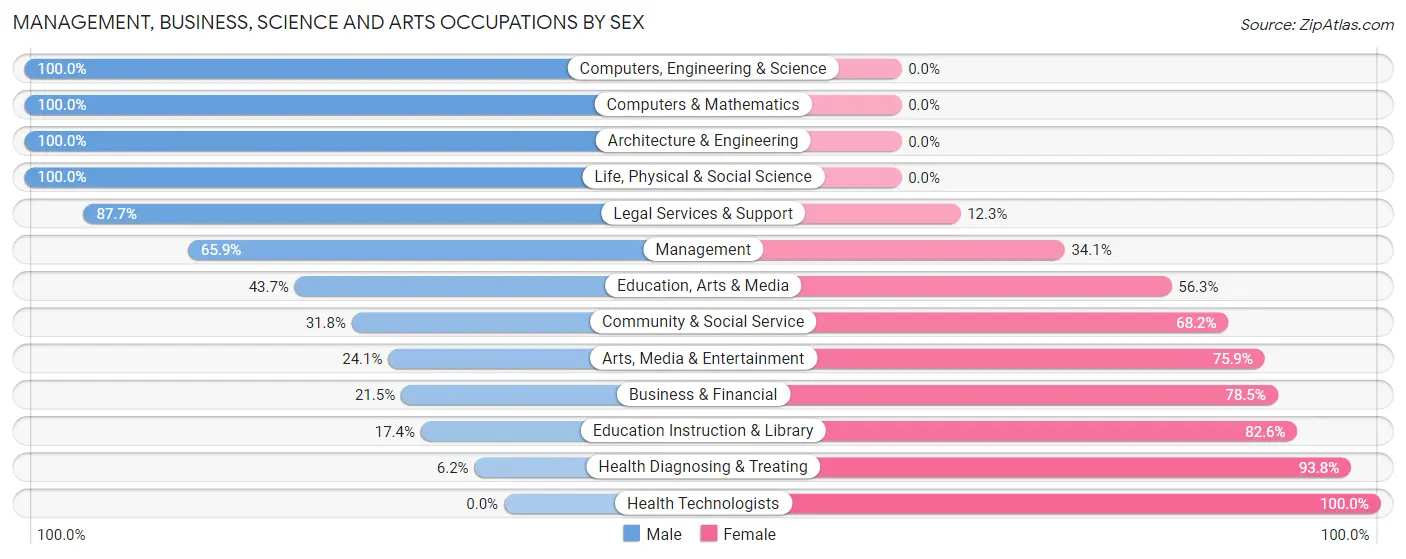
Management, Business, Science and Arts Occupations by Sex
Within the Management, Business, Science and Arts occupations in Kill Devil Hills, the most male-oriented occupations are Computers, Engineering & Science (100.0%), Computers & Mathematics (100.0%), and Architecture & Engineering (100.0%), while the most female-oriented occupations are Health Technologists (100.0%), Health Diagnosing & Treating (93.8%), and Education Instruction & Library (82.6%).
| Occupation | Male | Female |
| Management | 389 (65.9%) | 201 (34.1%) |
| Business & Financial | 32 (21.5%) | 117 (78.5%) |
| Computers, Engineering & Science | 171 (100.0%) | 0 (0.0%) |
| Computers & Mathematics | 60 (100.0%) | 0 (0.0%) |
| Architecture & Engineering | 57 (100.0%) | 0 (0.0%) |
| Life, Physical & Social Science | 54 (100.0%) | 0 (0.0%) |
| Community & Social Service | 155 (31.8%) | 333 (68.2%) |
| Education, Arts & Media | 31 (43.7%) | 40 (56.3%) |
| Legal Services & Support | 57 (87.7%) | 8 (12.3%) |
| Education Instruction & Library | 46 (17.4%) | 219 (82.6%) |
| Arts, Media & Entertainment | 21 (24.1%) | 66 (75.9%) |
| Health Diagnosing & Treating | 9 (6.2%) | 137 (93.8%) |
| Health Technologists | 0 (0.0%) | 137 (100.0%) |
| Total (Category) | 756 (49.0%) | 788 (51.0%) |
| Total (Overall) | 2,198 (50.1%) | 2,187 (49.9%) |
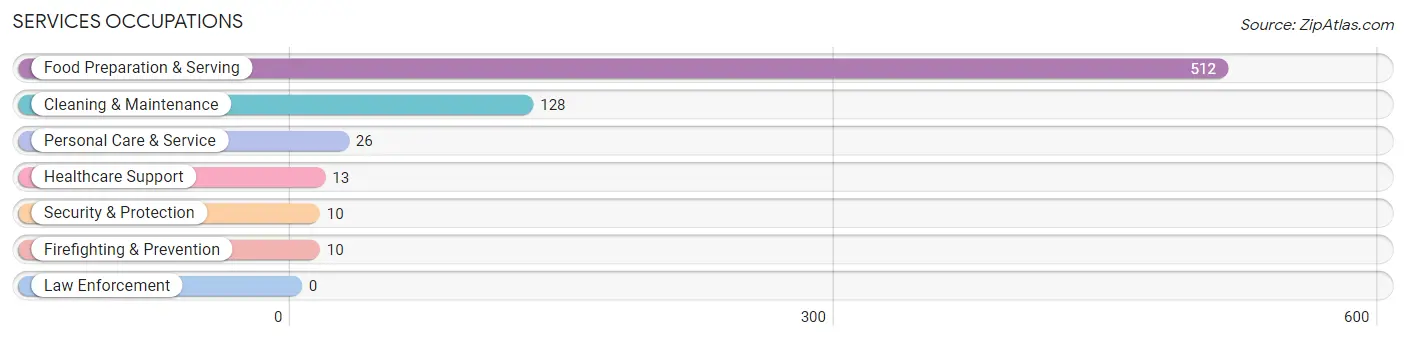
Services Occupations
The most common Services occupations in Kill Devil Hills are Food Preparation & Serving (512 | 11.7%), Cleaning & Maintenance (128 | 2.9%), Personal Care & Service (26 | 0.6%), Healthcare Support (13 | 0.3%), and Security & Protection (10 | 0.2%).
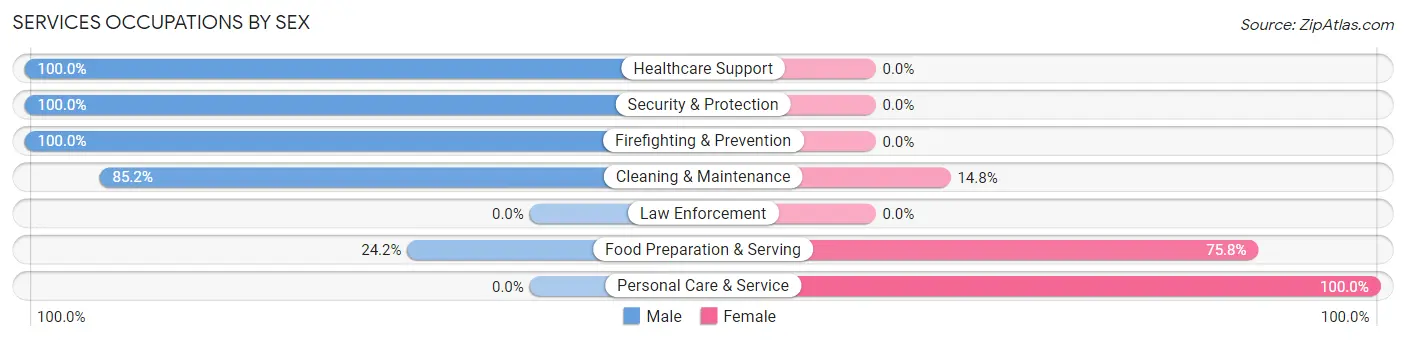
Services Occupations by Sex
Within the Services occupations in Kill Devil Hills, the most male-oriented occupations are Healthcare Support (100.0%), Security & Protection (100.0%), and Firefighting & Prevention (100.0%), while the most female-oriented occupations are Personal Care & Service (100.0%), Food Preparation & Serving (75.8%), and Cleaning & Maintenance (14.8%).
| Occupation | Male | Female |
| Healthcare Support | 13 (100.0%) | 0 (0.0%) |
| Security & Protection | 10 (100.0%) | 0 (0.0%) |
| Firefighting & Prevention | 10 (100.0%) | 0 (0.0%) |
| Law Enforcement | 0 (0.0%) | 0 (0.0%) |
| Food Preparation & Serving | 124 (24.2%) | 388 (75.8%) |
| Cleaning & Maintenance | 109 (85.2%) | 19 (14.8%) |
| Personal Care & Service | 0 (0.0%) | 26 (100.0%) |
| Total (Category) | 256 (37.2%) | 433 (62.8%) |
| Total (Overall) | 2,198 (50.1%) | 2,187 (49.9%) |
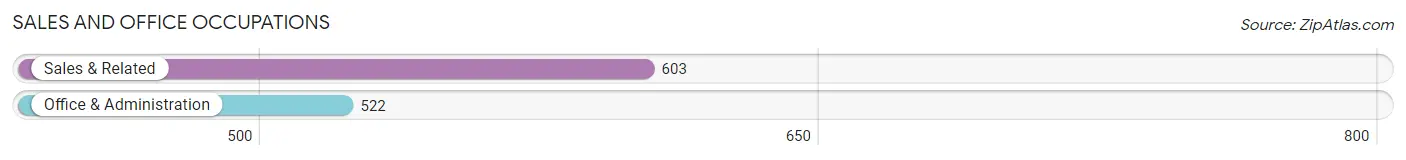
Sales and Office Occupations
The most common Sales and Office occupations in Kill Devil Hills are Sales & Related (603 | 13.8%), and Office & Administration (522 | 11.9%).
Sales and Office Occupations by Sex
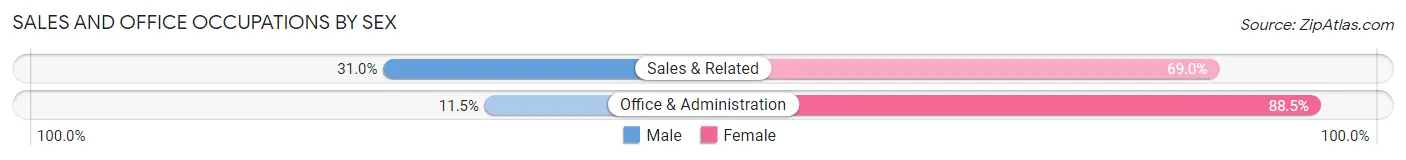
| Occupation | Male | Female |
| Sales & Related | 187 (31.0%) | 416 (69.0%) |
| Office & Administration | 60 (11.5%) | 462 (88.5%) |
| Total (Category) | 247 (22.0%) | 878 (78.0%) |
| Total (Overall) | 2,198 (50.1%) | 2,187 (49.9%) |
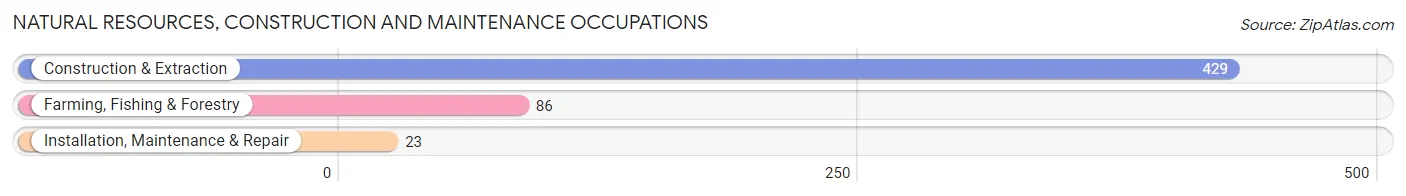
Natural Resources, Construction and Maintenance Occupations
The most common Natural Resources, Construction and Maintenance occupations in Kill Devil Hills are Construction & Extraction (429 | 9.8%), Farming, Fishing & Forestry (86 | 2.0%), and Installation, Maintenance & Repair (23 | 0.5%).
Natural Resources, Construction and Maintenance Occupations by Sex
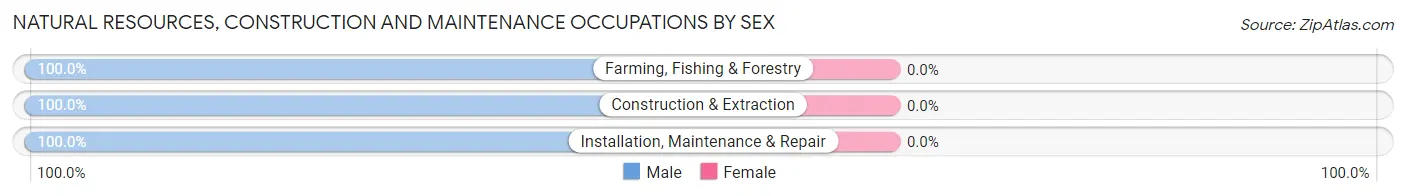
| Occupation | Male | Female |
| Farming, Fishing & Forestry | 86 (100.0%) | 0 (0.0%) |
| Construction & Extraction | 429 (100.0%) | 0 (0.0%) |
| Installation, Maintenance & Repair | 23 (100.0%) | 0 (0.0%) |
| Total (Category) | 538 (100.0%) | 0 (0.0%) |
| Total (Overall) | 2,198 (50.1%) | 2,187 (49.9%) |
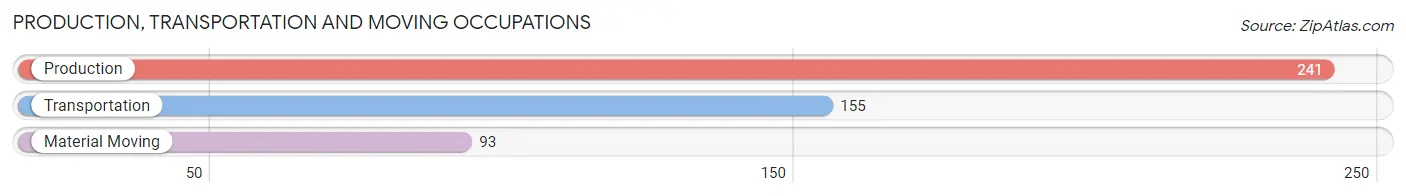
Production, Transportation and Moving Occupations
The most common Production, Transportation and Moving occupations in Kill Devil Hills are Production (241 | 5.5%), Transportation (155 | 3.5%), and Material Moving (93 | 2.1%).
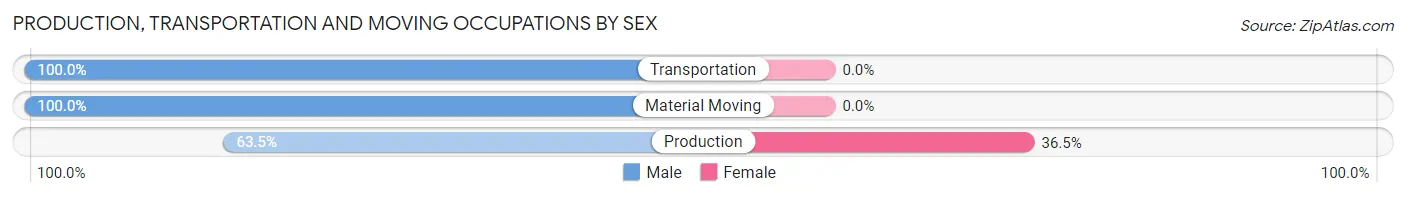
Production, Transportation and Moving Occupations by Sex
| Occupation | Male | Female |
| Production | 153 (63.5%) | 88 (36.5%) |
| Transportation | 155 (100.0%) | 0 (0.0%) |
| Material Moving | 93 (100.0%) | 0 (0.0%) |
| Total (Category) | 401 (82.0%) | 88 (18.0%) |
| Total (Overall) | 2,198 (50.1%) | 2,187 (49.9%) |
Employment Industries by Sex in Kill Devil Hills
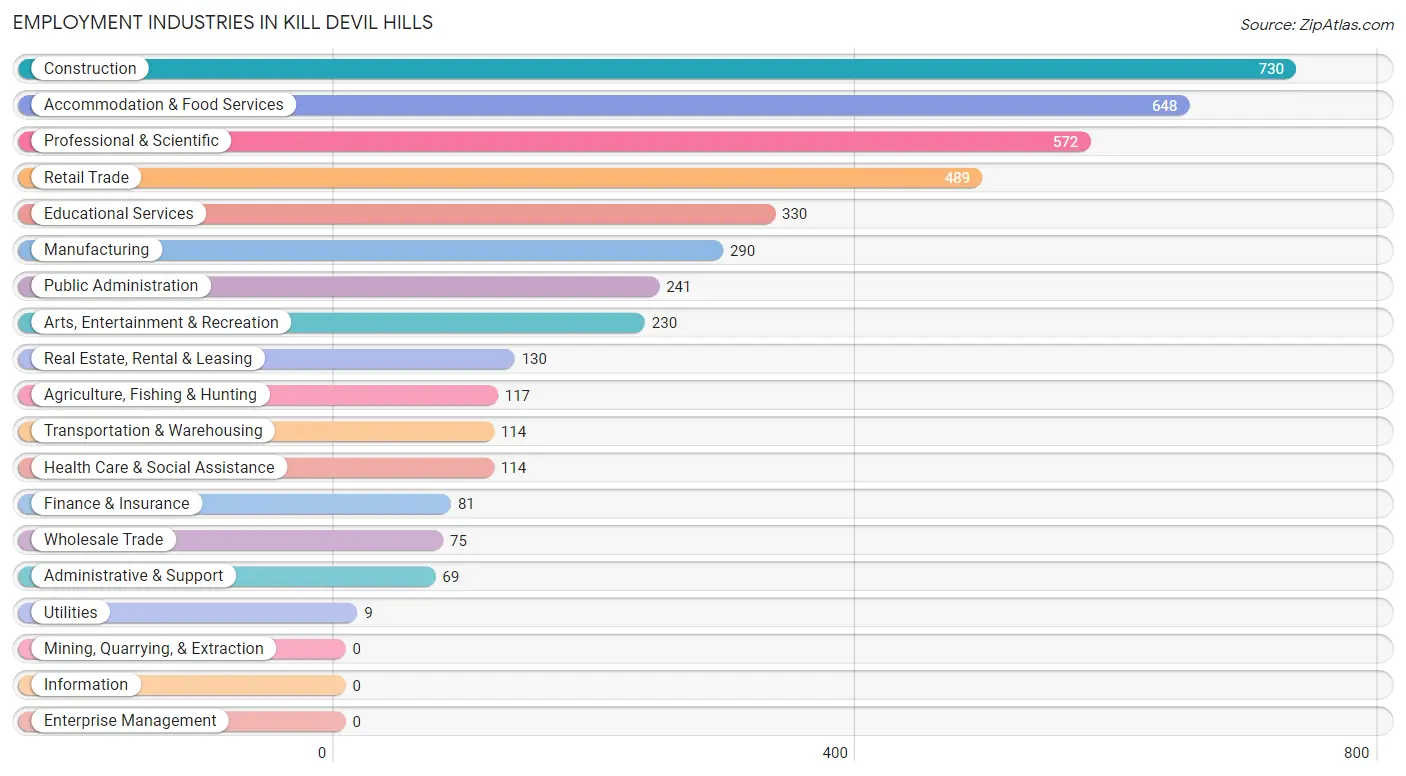
Employment Industries in Kill Devil Hills
The major employment industries in Kill Devil Hills include Construction (730 | 16.7%), Accommodation & Food Services (648 | 14.8%), Professional & Scientific (572 | 13.0%), Retail Trade (489 | 11.2%), and Educational Services (330 | 7.5%).
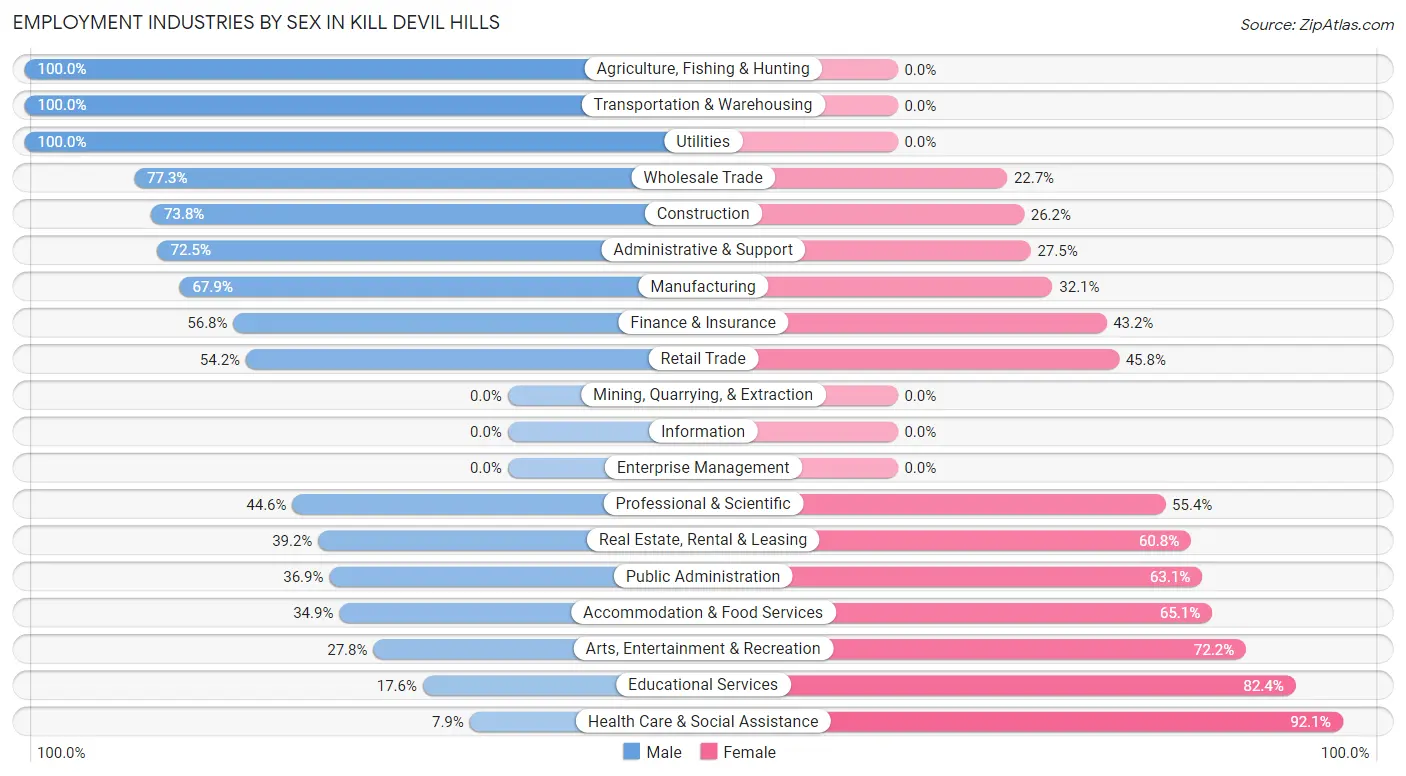
Employment Industries by Sex in Kill Devil Hills
The Kill Devil Hills industries that see more men than women are Agriculture, Fishing & Hunting (100.0%), Transportation & Warehousing (100.0%), and Utilities (100.0%), whereas the industries that tend to have a higher number of women are Health Care & Social Assistance (92.1%), Educational Services (82.4%), and Arts, Entertainment & Recreation (72.2%).
| Industry | Male | Female |
| Agriculture, Fishing & Hunting | 117 (100.0%) | 0 (0.0%) |
| Mining, Quarrying, & Extraction | 0 (0.0%) | 0 (0.0%) |
| Construction | 539 (73.8%) | 191 (26.2%) |
| Manufacturing | 197 (67.9%) | 93 (32.1%) |
| Wholesale Trade | 58 (77.3%) | 17 (22.7%) |
| Retail Trade | 265 (54.2%) | 224 (45.8%) |
| Transportation & Warehousing | 114 (100.0%) | 0 (0.0%) |
| Utilities | 9 (100.0%) | 0 (0.0%) |
| Information | 0 (0.0%) | 0 (0.0%) |
| Finance & Insurance | 46 (56.8%) | 35 (43.2%) |
| Real Estate, Rental & Leasing | 51 (39.2%) | 79 (60.8%) |
| Professional & Scientific | 255 (44.6%) | 317 (55.4%) |
| Enterprise Management | 0 (0.0%) | 0 (0.0%) |
| Administrative & Support | 50 (72.5%) | 19 (27.5%) |
| Educational Services | 58 (17.6%) | 272 (82.4%) |
| Health Care & Social Assistance | 9 (7.9%) | 105 (92.1%) |
| Arts, Entertainment & Recreation | 64 (27.8%) | 166 (72.2%) |
| Accommodation & Food Services | 226 (34.9%) | 422 (65.1%) |
| Public Administration | 89 (36.9%) | 152 (63.1%) |
| Total | 2,198 (50.1%) | 2,187 (49.9%) |
Education in Kill Devil Hills
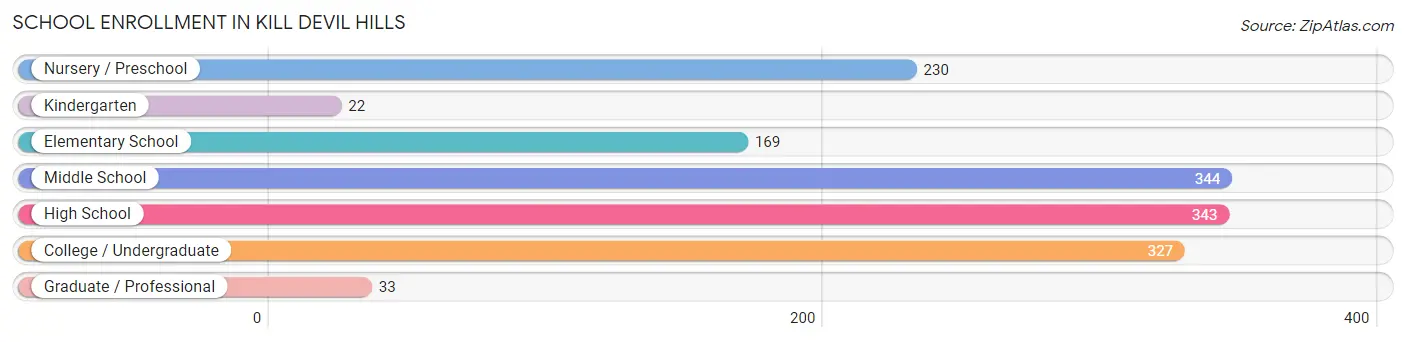
School Enrollment in Kill Devil Hills
The most common levels of schooling among the 1,468 students in Kill Devil Hills are middle school (344 | 23.4%), high school (343 | 23.4%), and college / undergraduate (327 | 22.3%).
| School Level | # Students | % Students |
| Nursery / Preschool | 230 | 15.7% |
| Kindergarten | 22 | 1.5% |
| Elementary School | 169 | 11.5% |
| Middle School | 344 | 23.4% |
| High School | 343 | 23.4% |
| College / Undergraduate | 327 | 22.3% |
| Graduate / Professional | 33 | 2.2% |
| Total | 1,468 | 100.0% |
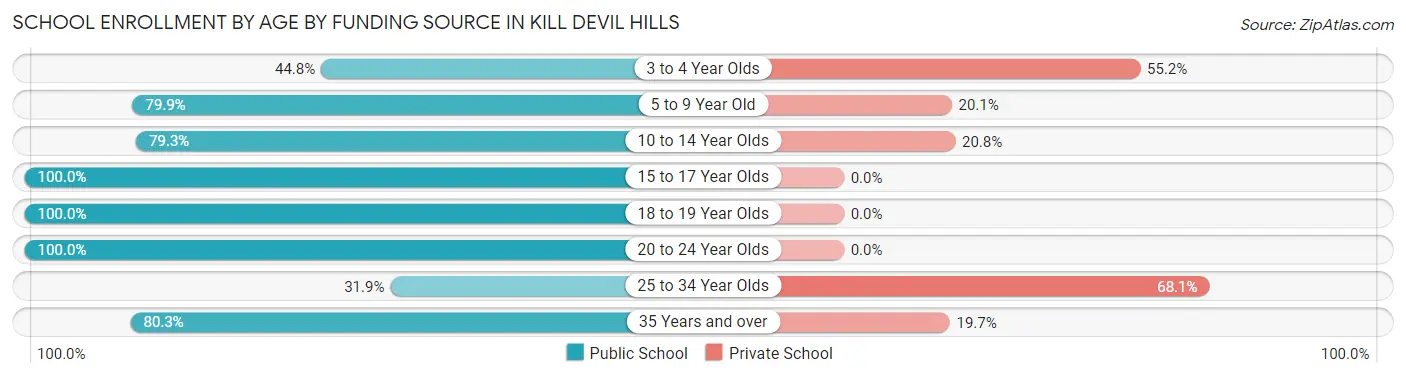
School Enrollment by Age by Funding Source in Kill Devil Hills
Out of a total of 1,468 students who are enrolled in schools in Kill Devil Hills, 333 (22.7%) attend a private institution, while the remaining 1,135 (77.3%) are enrolled in public schools. The age group of 25 to 34 year olds has the highest likelihood of being enrolled in private schools, with 79 (68.1% in the age bracket) enrolled. Conversely, the age group of 15 to 17 year olds has the lowest likelihood of being enrolled in a private school, with 258 (100.0% in the age bracket) attending a public institution.
| Age Bracket | Public School | Private School |
| 3 to 4 Year Olds | 103 (44.8%) | 127 (55.2%) |
| 5 to 9 Year Old | 187 (79.9%) | 47 (20.1%) |
| 10 to 14 Year Olds | 252 (79.2%) | 66 (20.7%) |
| 15 to 17 Year Olds | 258 (100.0%) | 0 (0.0%) |
| 18 to 19 Year Olds | 168 (100.0%) | 0 (0.0%) |
| 20 to 24 Year Olds | 73 (100.0%) | 0 (0.0%) |
| 25 to 34 Year Olds | 37 (31.9%) | 79 (68.1%) |
| 35 Years and over | 57 (80.3%) | 14 (19.7%) |
| Total | 1,135 (77.3%) | 333 (22.7%) |
Educational Attainment by Field of Study in Kill Devil Hills
Business (589 | 22.3%), education (559 | 21.1%), arts & humanities (352 | 13.3%), social sciences (271 | 10.2%), and psychology (147 | 5.6%) are the most common fields of study among 2,645 individuals in Kill Devil Hills who have obtained a bachelor's degree or higher.
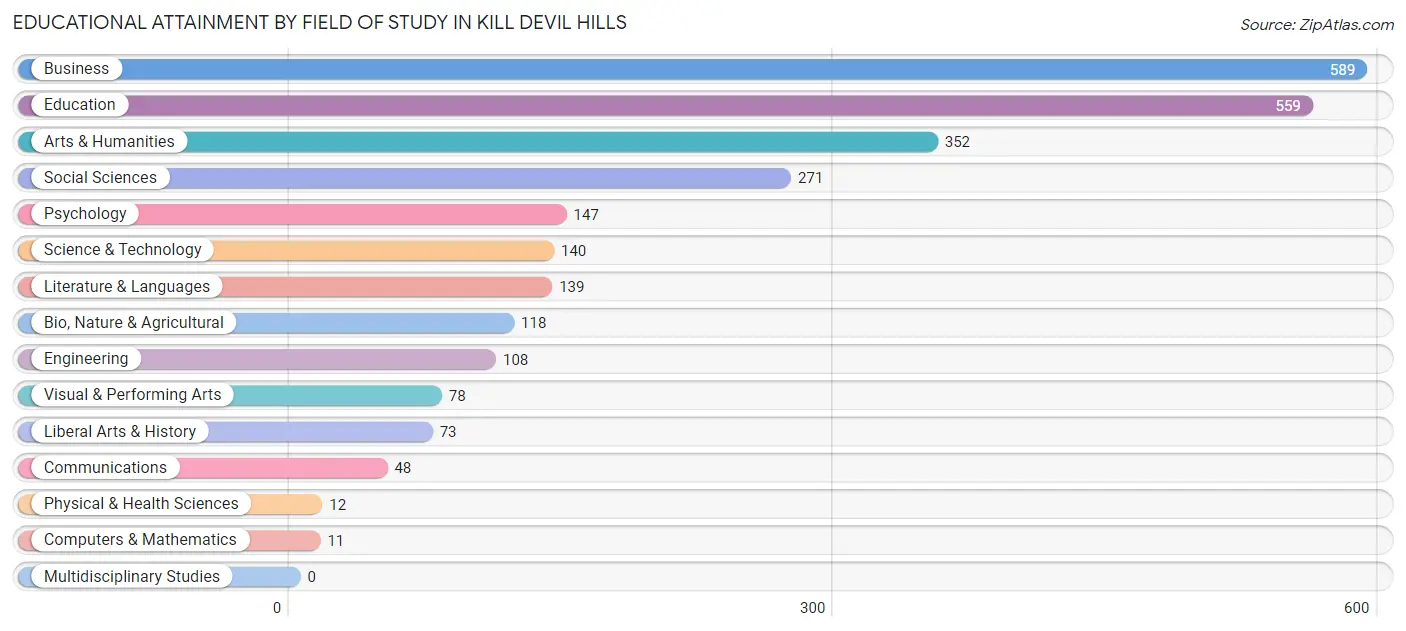
| Field of Study | # Graduates | % Graduates |
| Computers & Mathematics | 11 | 0.4% |
| Bio, Nature & Agricultural | 118 | 4.5% |
| Physical & Health Sciences | 12 | 0.4% |
| Psychology | 147 | 5.6% |
| Social Sciences | 271 | 10.2% |
| Engineering | 108 | 4.1% |
| Multidisciplinary Studies | 0 | 0.0% |
| Science & Technology | 140 | 5.3% |
| Business | 589 | 22.3% |
| Education | 559 | 21.1% |
| Literature & Languages | 139 | 5.3% |
| Liberal Arts & History | 73 | 2.8% |
| Visual & Performing Arts | 78 | 2.9% |
| Communications | 48 | 1.8% |
| Arts & Humanities | 352 | 13.3% |
| Total | 2,645 | 100.0% |
Transportation & Commute in Kill Devil Hills
Vehicle Availability by Sex in Kill Devil Hills
The most prevalent vehicle ownership categories in Kill Devil Hills are males with 3 vehicles (775, accounting for 38.2%) and females with 3 vehicles (853, making up 35.4%).
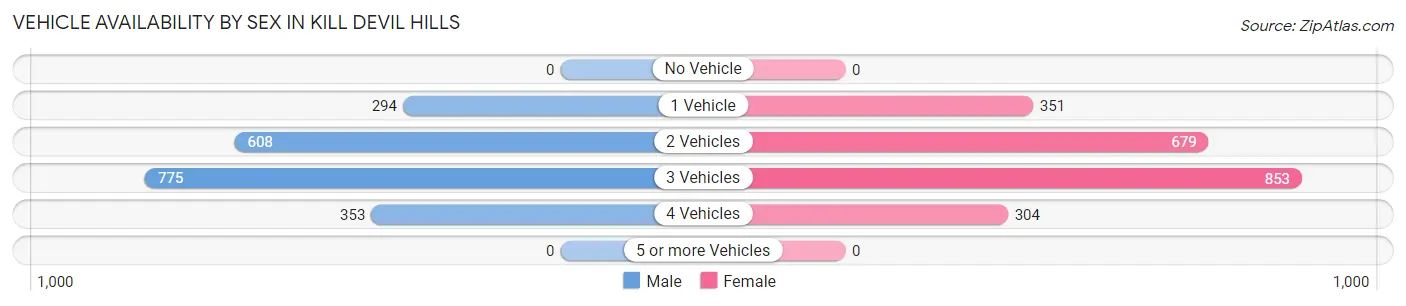
| Vehicles Available | Male | Female |
| No Vehicle | 0 (0.0%) | 0 (0.0%) |
| 1 Vehicle | 294 (14.5%) | 351 (16.1%) |
| 2 Vehicles | 608 (29.9%) | 679 (31.0%) |
| 3 Vehicles | 775 (38.2%) | 853 (39.0%) |
| 4 Vehicles | 353 (17.4%) | 304 (13.9%) |
| 5 or more Vehicles | 0 (0.0%) | 0 (0.0%) |
| Total | 2,030 (100.0%) | 2,187 (100.0%) |
Commute Time in Kill Devil Hills
The most frequently occuring commute durations in Kill Devil Hills are 10 to 14 minutes (856 commuters, 22.8%), 5 to 9 minutes (753 commuters, 20.1%), and 15 to 19 minutes (406 commuters, 10.8%).
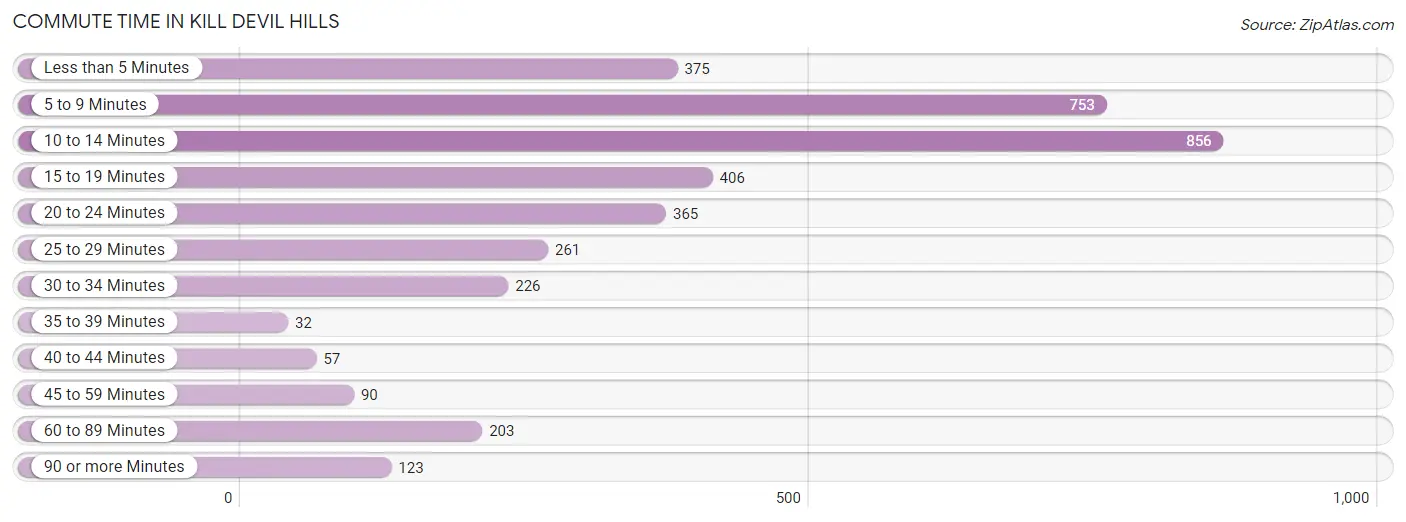
| Commute Time | # Commuters | % Commuters |
| Less than 5 Minutes | 375 | 10.0% |
| 5 to 9 Minutes | 753 | 20.1% |
| 10 to 14 Minutes | 856 | 22.8% |
| 15 to 19 Minutes | 406 | 10.8% |
| 20 to 24 Minutes | 365 | 9.7% |
| 25 to 29 Minutes | 261 | 7.0% |
| 30 to 34 Minutes | 226 | 6.0% |
| 35 to 39 Minutes | 32 | 0.9% |
| 40 to 44 Minutes | 57 | 1.5% |
| 45 to 59 Minutes | 90 | 2.4% |
| 60 to 89 Minutes | 203 | 5.4% |
| 90 or more Minutes | 123 | 3.3% |
Commute Time by Sex in Kill Devil Hills
The most common commute times in Kill Devil Hills are 5 to 9 minutes (392 commuters, 21.2%) for males and 10 to 14 minutes (544 commuters, 28.7%) for females.
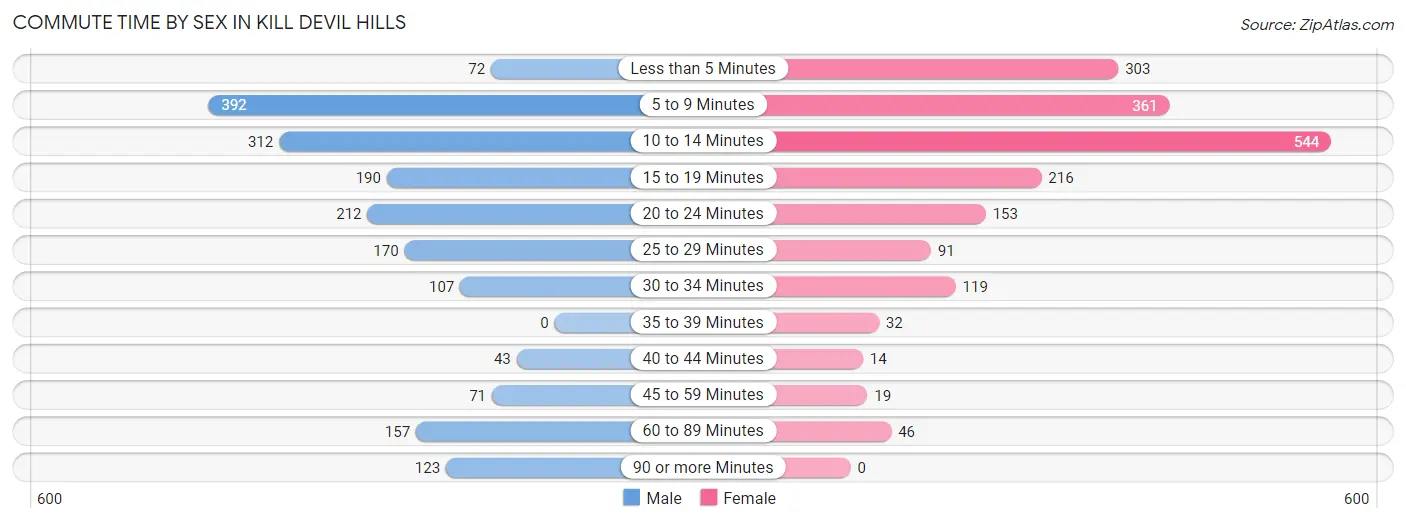
| Commute Time | Male | Female |
| Less than 5 Minutes | 72 (3.9%) | 303 (16.0%) |
| 5 to 9 Minutes | 392 (21.2%) | 361 (19.0%) |
| 10 to 14 Minutes | 312 (16.9%) | 544 (28.7%) |
| 15 to 19 Minutes | 190 (10.3%) | 216 (11.4%) |
| 20 to 24 Minutes | 212 (11.5%) | 153 (8.1%) |
| 25 to 29 Minutes | 170 (9.2%) | 91 (4.8%) |
| 30 to 34 Minutes | 107 (5.8%) | 119 (6.3%) |
| 35 to 39 Minutes | 0 (0.0%) | 32 (1.7%) |
| 40 to 44 Minutes | 43 (2.3%) | 14 (0.7%) |
| 45 to 59 Minutes | 71 (3.8%) | 19 (1.0%) |
| 60 to 89 Minutes | 157 (8.5%) | 46 (2.4%) |
| 90 or more Minutes | 123 (6.7%) | 0 (0.0%) |
Time of Departure to Work by Sex in Kill Devil Hills
The most frequent times of departure to work in Kill Devil Hills are 8:00 AM to 8:29 AM (406, 22.0%) for males and 8:00 AM to 8:29 AM (379, 20.0%) for females.
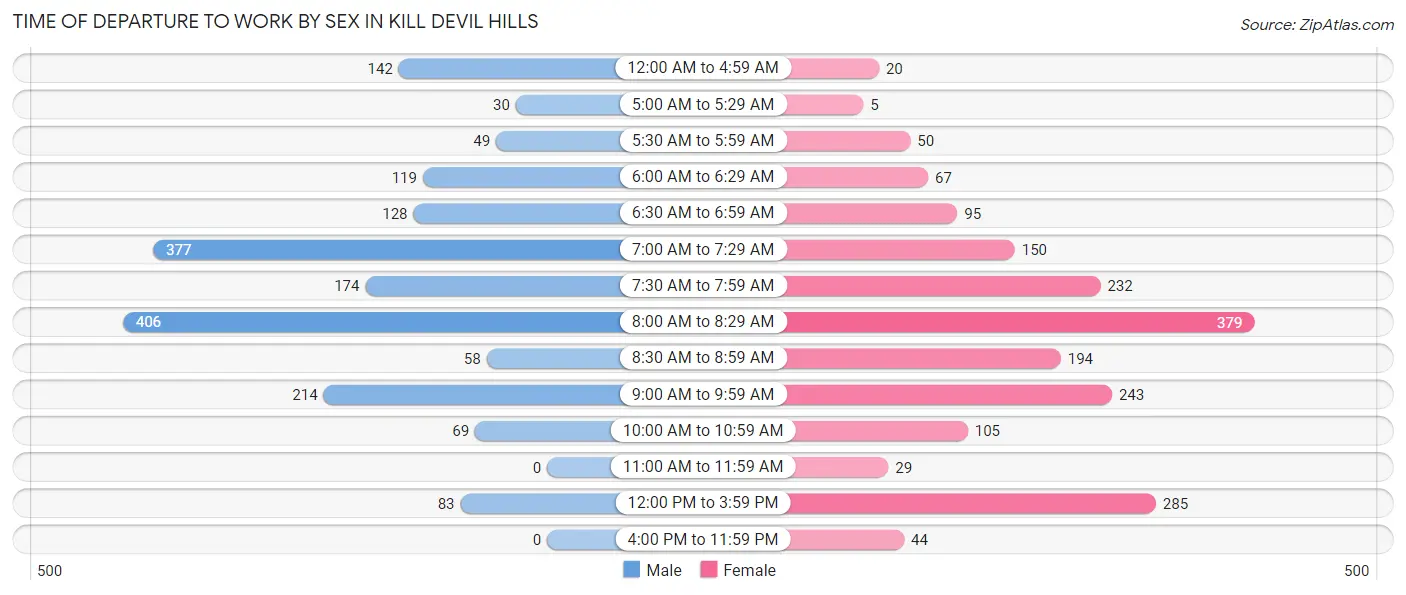
| Time of Departure | Male | Female |
| 12:00 AM to 4:59 AM | 142 (7.7%) | 20 (1.1%) |
| 5:00 AM to 5:29 AM | 30 (1.6%) | 5 (0.3%) |
| 5:30 AM to 5:59 AM | 49 (2.6%) | 50 (2.6%) |
| 6:00 AM to 6:29 AM | 119 (6.4%) | 67 (3.5%) |
| 6:30 AM to 6:59 AM | 128 (6.9%) | 95 (5.0%) |
| 7:00 AM to 7:29 AM | 377 (20.4%) | 150 (7.9%) |
| 7:30 AM to 7:59 AM | 174 (9.4%) | 232 (12.2%) |
| 8:00 AM to 8:29 AM | 406 (22.0%) | 379 (20.0%) |
| 8:30 AM to 8:59 AM | 58 (3.1%) | 194 (10.2%) |
| 9:00 AM to 9:59 AM | 214 (11.6%) | 243 (12.8%) |
| 10:00 AM to 10:59 AM | 69 (3.7%) | 105 (5.5%) |
| 11:00 AM to 11:59 AM | 0 (0.0%) | 29 (1.5%) |
| 12:00 PM to 3:59 PM | 83 (4.5%) | 285 (15.0%) |
| 4:00 PM to 11:59 PM | 0 (0.0%) | 44 (2.3%) |
| Total | 1,849 (100.0%) | 1,898 (100.0%) |
Housing Occupancy in Kill Devil Hills
Occupancy by Ownership in Kill Devil Hills
Of the total 3,258 dwellings in Kill Devil Hills, owner-occupied units account for 2,432 (74.7%), while renter-occupied units make up 826 (25.4%).
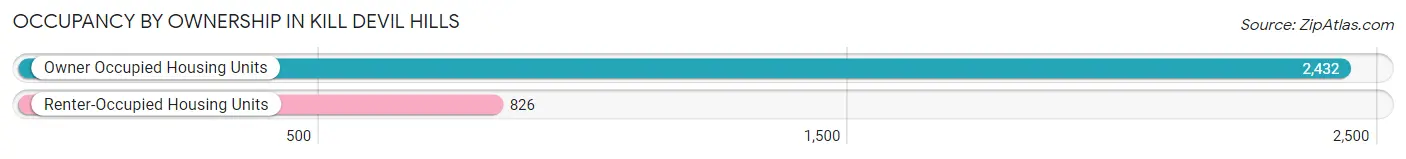
| Occupancy | # Housing Units | % Housing Units |
| Owner Occupied Housing Units | 2,432 | 74.7% |
| Renter-Occupied Housing Units | 826 | 25.4% |
| Total Occupied Housing Units | 3,258 | 100.0% |
Occupancy by Household Size in Kill Devil Hills
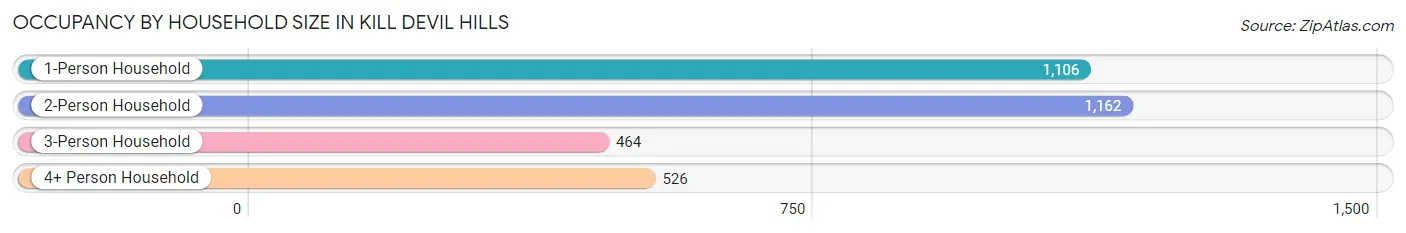
| Household Size | # Housing Units | % Housing Units |
| 1-Person Household | 1,106 | 34.0% |
| 2-Person Household | 1,162 | 35.7% |
| 3-Person Household | 464 | 14.2% |
| 4+ Person Household | 526 | 16.1% |
| Total Housing Units | 3,258 | 100.0% |
Occupancy by Ownership by Household Size in Kill Devil Hills
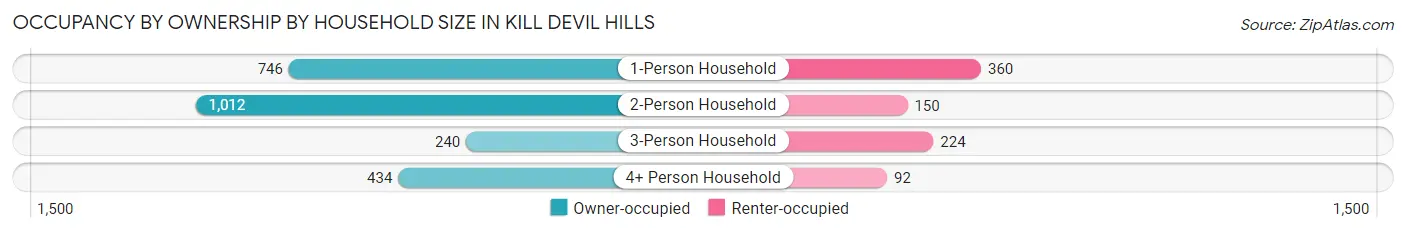
| Household Size | Owner-occupied | Renter-occupied |
| 1-Person Household | 746 (67.4%) | 360 (32.6%) |
| 2-Person Household | 1,012 (87.1%) | 150 (12.9%) |
| 3-Person Household | 240 (51.7%) | 224 (48.3%) |
| 4+ Person Household | 434 (82.5%) | 92 (17.5%) |
| Total Housing Units | 2,432 (74.7%) | 826 (25.4%) |
Occupancy by Educational Attainment in Kill Devil Hills
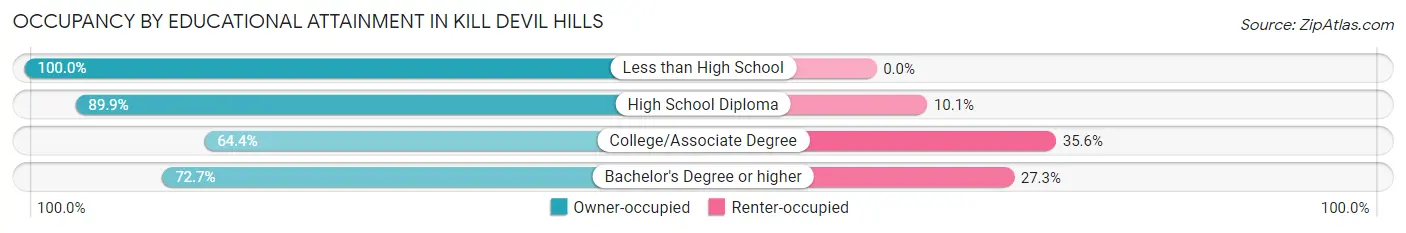
| Household Size | Owner-occupied | Renter-occupied |
| Less than High School | 171 (100.0%) | 0 (0.0%) |
| High School Diploma | 536 (89.9%) | 60 (10.1%) |
| College/Associate Degree | 667 (64.4%) | 369 (35.6%) |
| Bachelor's Degree or higher | 1,058 (72.7%) | 397 (27.3%) |
Occupancy by Age of Householder in Kill Devil Hills
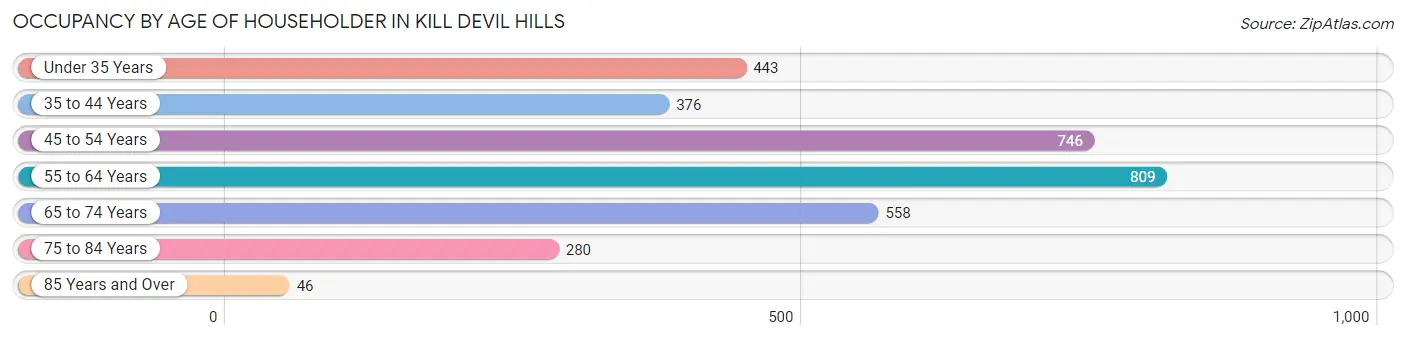
| Age Bracket | # Households | % Households |
| Under 35 Years | 443 | 13.6% |
| 35 to 44 Years | 376 | 11.5% |
| 45 to 54 Years | 746 | 22.9% |
| 55 to 64 Years | 809 | 24.8% |
| 65 to 74 Years | 558 | 17.1% |
| 75 to 84 Years | 280 | 8.6% |
| 85 Years and Over | 46 | 1.4% |
| Total | 3,258 | 100.0% |
Housing Finances in Kill Devil Hills
Median Income by Occupancy in Kill Devil Hills
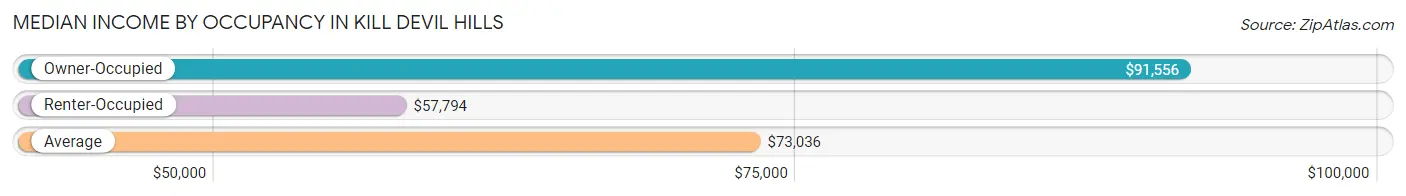
| Occupancy Type | # Households | Median Income |
| Owner-Occupied | 2,432 (74.7%) | $91,556 |
| Renter-Occupied | 826 (25.4%) | $57,794 |
| Average | 3,258 (100.0%) | $73,036 |
Occupancy by Householder Income Bracket in Kill Devil Hills
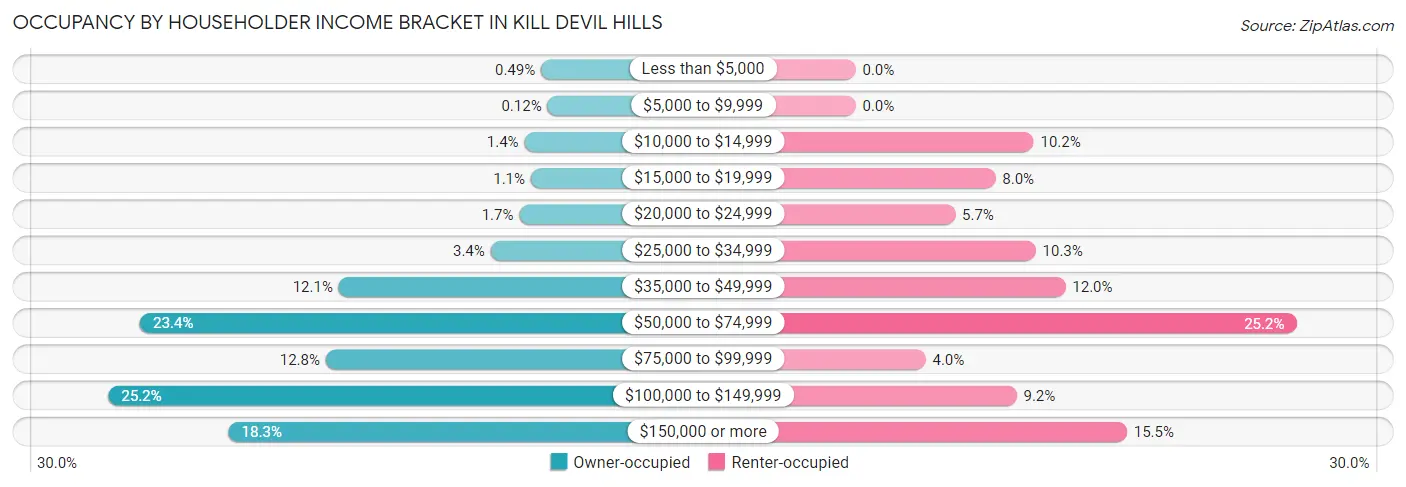
| Income Bracket | Owner-occupied | Renter-occupied |
| Less than $5,000 | 12 (0.5%) | 0 (0.0%) |
| $5,000 to $9,999 | 3 (0.1%) | 0 (0.0%) |
| $10,000 to $14,999 | 35 (1.4%) | 84 (10.2%) |
| $15,000 to $19,999 | 26 (1.1%) | 66 (8.0%) |
| $20,000 to $24,999 | 42 (1.7%) | 47 (5.7%) |
| $25,000 to $34,999 | 82 (3.4%) | 85 (10.3%) |
| $35,000 to $49,999 | 293 (12.0%) | 99 (12.0%) |
| $50,000 to $74,999 | 569 (23.4%) | 208 (25.2%) |
| $75,000 to $99,999 | 311 (12.8%) | 33 (4.0%) |
| $100,000 to $149,999 | 613 (25.2%) | 76 (9.2%) |
| $150,000 or more | 446 (18.3%) | 128 (15.5%) |
| Total | 2,432 (100.0%) | 826 (100.0%) |
Monthly Housing Cost Tiers in Kill Devil Hills
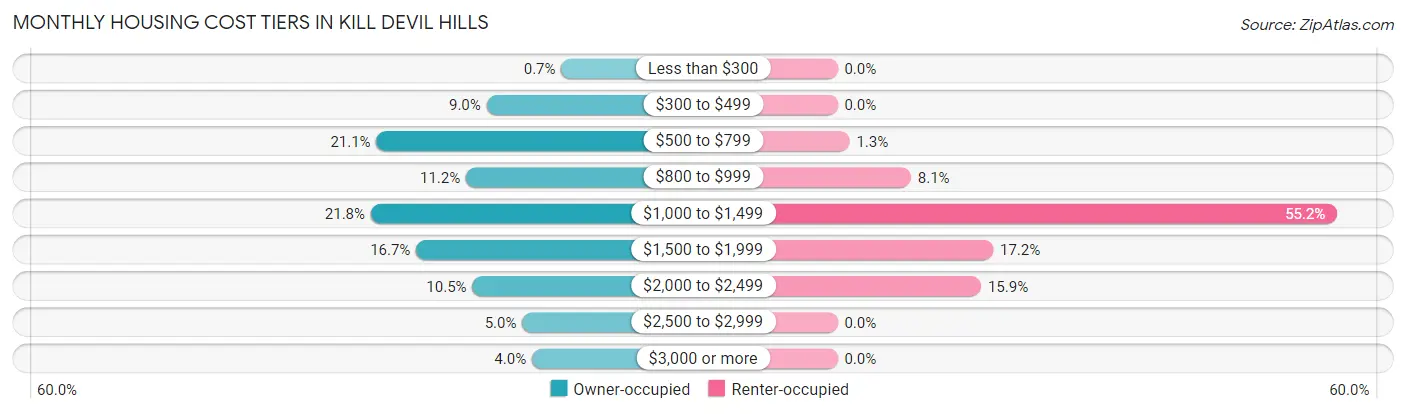
| Monthly Cost | Owner-occupied | Renter-occupied |
| Less than $300 | 17 (0.7%) | 0 (0.0%) |
| $300 to $499 | 218 (9.0%) | 0 (0.0%) |
| $500 to $799 | 514 (21.1%) | 11 (1.3%) |
| $800 to $999 | 273 (11.2%) | 67 (8.1%) |
| $1,000 to $1,499 | 529 (21.7%) | 456 (55.2%) |
| $1,500 to $1,999 | 407 (16.7%) | 142 (17.2%) |
| $2,000 to $2,499 | 256 (10.5%) | 131 (15.9%) |
| $2,500 to $2,999 | 122 (5.0%) | 0 (0.0%) |
| $3,000 or more | 96 (4.0%) | 0 (0.0%) |
| Total | 2,432 (100.0%) | 826 (100.0%) |
Physical Housing Characteristics in Kill Devil Hills
Housing Structures in Kill Devil Hills
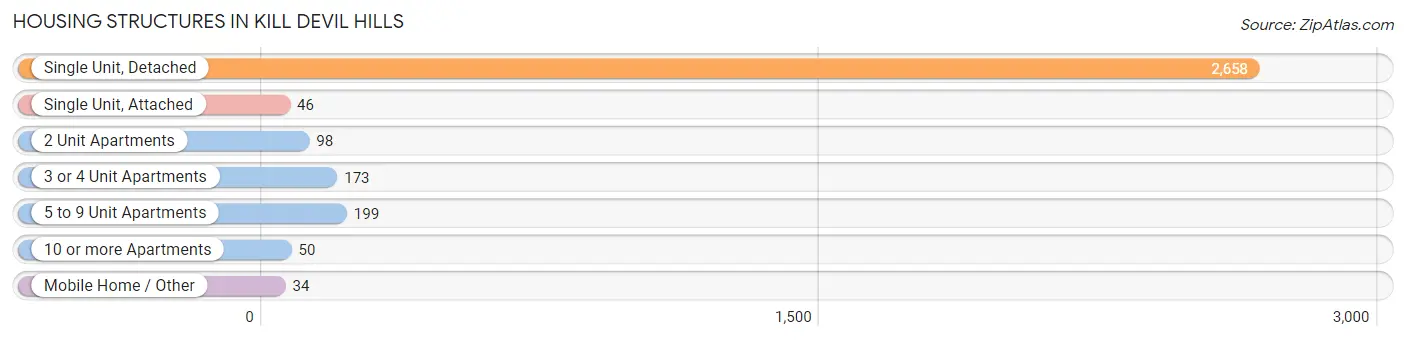
| Structure Type | # Housing Units | % Housing Units |
| Single Unit, Detached | 2,658 | 81.6% |
| Single Unit, Attached | 46 | 1.4% |
| 2 Unit Apartments | 98 | 3.0% |
| 3 or 4 Unit Apartments | 173 | 5.3% |
| 5 to 9 Unit Apartments | 199 | 6.1% |
| 10 or more Apartments | 50 | 1.5% |
| Mobile Home / Other | 34 | 1.0% |
| Total | 3,258 | 100.0% |
Housing Structures by Occupancy in Kill Devil Hills
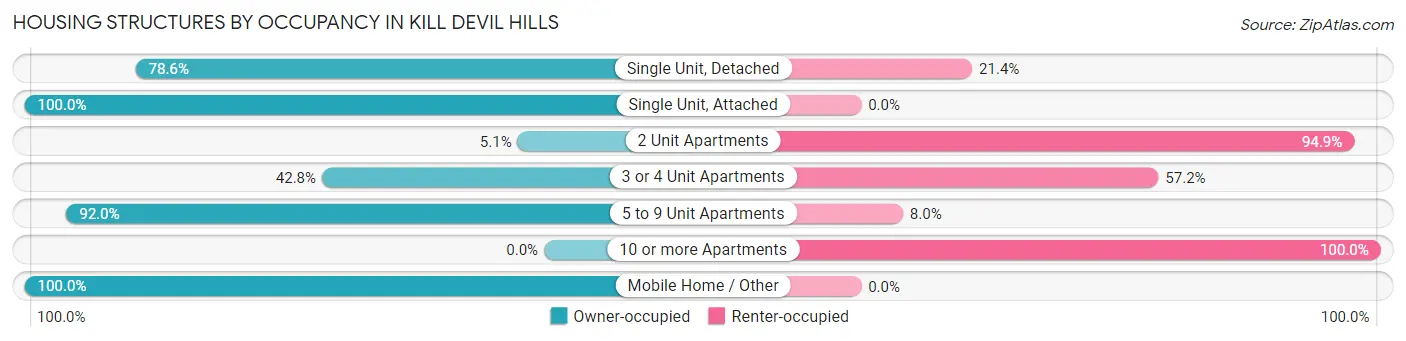
| Structure Type | Owner-occupied | Renter-occupied |
| Single Unit, Detached | 2,090 (78.6%) | 568 (21.4%) |
| Single Unit, Attached | 46 (100.0%) | 0 (0.0%) |
| 2 Unit Apartments | 5 (5.1%) | 93 (94.9%) |
| 3 or 4 Unit Apartments | 74 (42.8%) | 99 (57.2%) |
| 5 to 9 Unit Apartments | 183 (92.0%) | 16 (8.0%) |
| 10 or more Apartments | 0 (0.0%) | 50 (100.0%) |
| Mobile Home / Other | 34 (100.0%) | 0 (0.0%) |
| Total | 2,432 (74.7%) | 826 (25.4%) |
Housing Structures by Number of Rooms in Kill Devil Hills
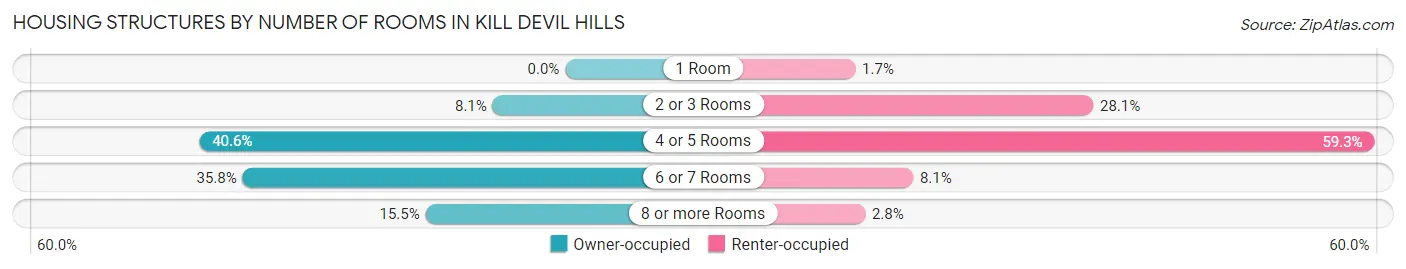
| Number of Rooms | Owner-occupied | Renter-occupied |
| 1 Room | 0 (0.0%) | 14 (1.7%) |
| 2 or 3 Rooms | 196 (8.1%) | 232 (28.1%) |
| 4 or 5 Rooms | 988 (40.6%) | 490 (59.3%) |
| 6 or 7 Rooms | 871 (35.8%) | 67 (8.1%) |
| 8 or more Rooms | 377 (15.5%) | 23 (2.8%) |
| Total | 2,432 (100.0%) | 826 (100.0%) |
Housing Structure by Heating Type in Kill Devil Hills
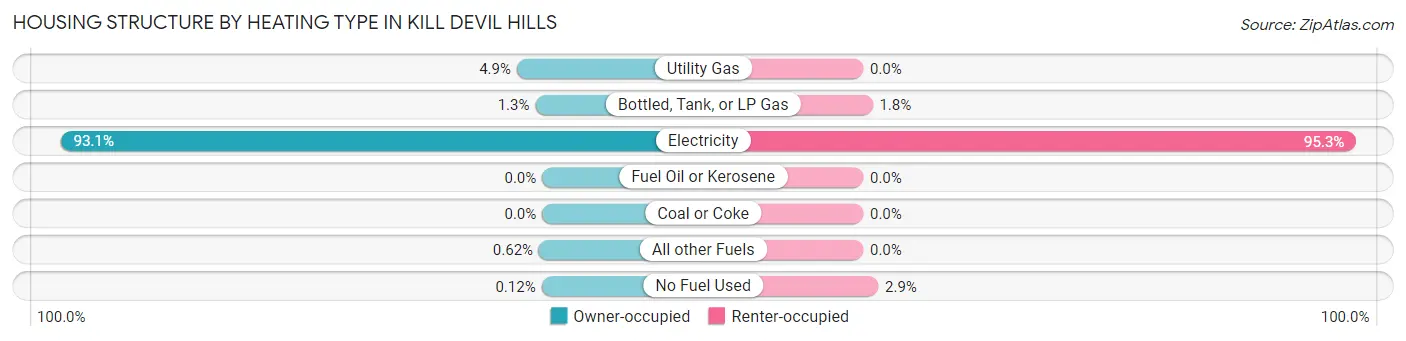
| Heating Type | Owner-occupied | Renter-occupied |
| Utility Gas | 119 (4.9%) | 0 (0.0%) |
| Bottled, Tank, or LP Gas | 32 (1.3%) | 15 (1.8%) |
| Electricity | 2,263 (93.0%) | 787 (95.3%) |
| Fuel Oil or Kerosene | 0 (0.0%) | 0 (0.0%) |
| Coal or Coke | 0 (0.0%) | 0 (0.0%) |
| All other Fuels | 15 (0.6%) | 0 (0.0%) |
| No Fuel Used | 3 (0.1%) | 24 (2.9%) |
| Total | 2,432 (100.0%) | 826 (100.0%) |
Household Vehicle Usage in Kill Devil Hills
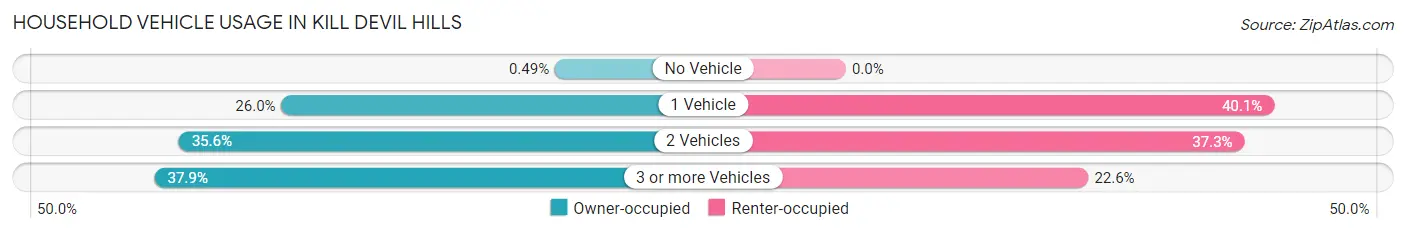
| Vehicles per Household | Owner-occupied | Renter-occupied |
| No Vehicle | 12 (0.5%) | 0 (0.0%) |
| 1 Vehicle | 633 (26.0%) | 331 (40.1%) |
| 2 Vehicles | 866 (35.6%) | 308 (37.3%) |
| 3 or more Vehicles | 921 (37.9%) | 187 (22.6%) |
| Total | 2,432 (100.0%) | 826 (100.0%) |
Real Estate & Mortgages in Kill Devil Hills
Real Estate and Mortgage Overview in Kill Devil Hills
| Characteristic | Without Mortgage | With Mortgage |
| Housing Units | 897 | 1,535 |
| Median Property Value | $377,700 | $310,300 |
| Median Household Income | $76,107 | $244 |
| Monthly Housing Costs | $631 | $96 |
| Real Estate Taxes | $2,426 | $21 |
Property Value by Mortgage Status in Kill Devil Hills
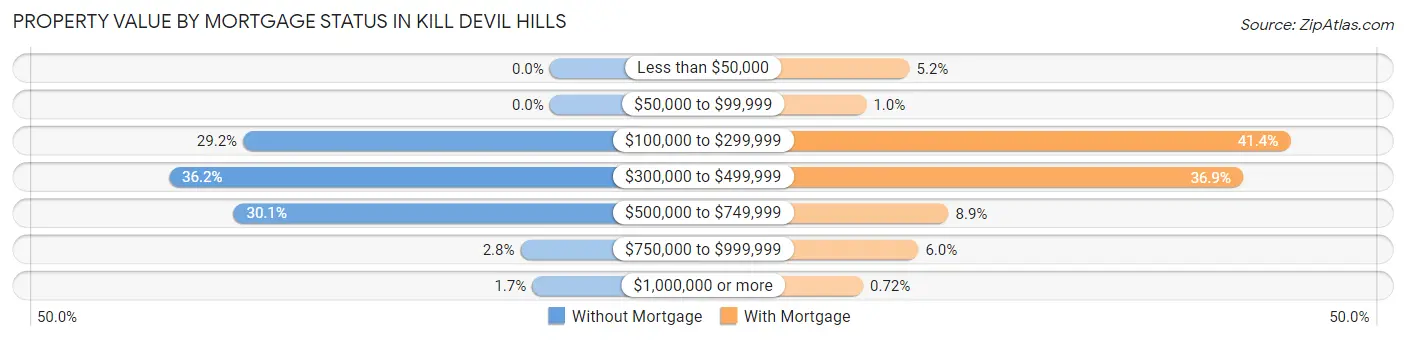
| Property Value | Without Mortgage | With Mortgage |
| Less than $50,000 | 0 (0.0%) | 79 (5.1%) |
| $50,000 to $99,999 | 0 (0.0%) | 16 (1.0%) |
| $100,000 to $299,999 | 262 (29.2%) | 635 (41.4%) |
| $300,000 to $499,999 | 325 (36.2%) | 566 (36.9%) |
| $500,000 to $749,999 | 270 (30.1%) | 136 (8.9%) |
| $750,000 to $999,999 | 25 (2.8%) | 92 (6.0%) |
| $1,000,000 or more | 15 (1.7%) | 11 (0.7%) |
| Total | 897 (100.0%) | 1,535 (100.0%) |
Household Income by Mortgage Status in Kill Devil Hills
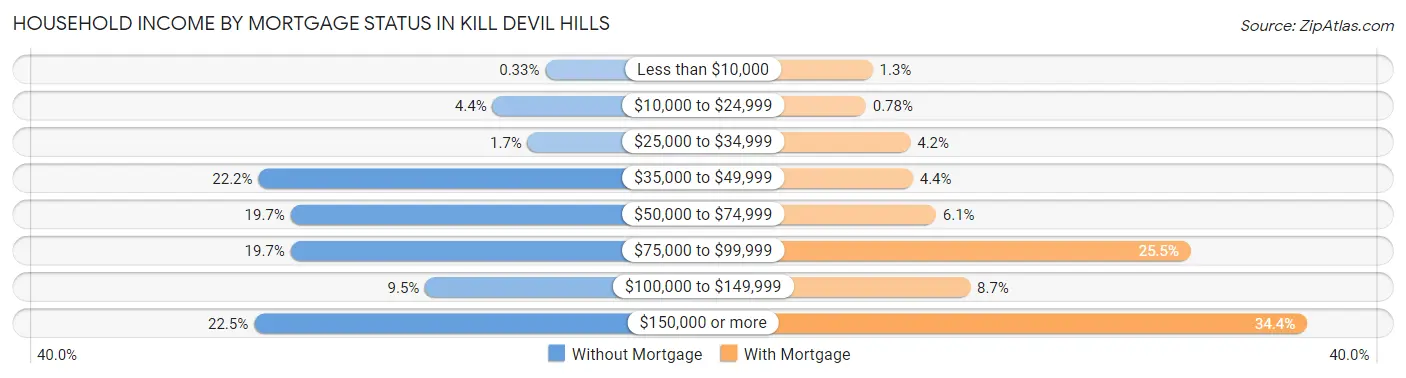
| Household Income | Without Mortgage | With Mortgage |
| Less than $10,000 | 3 (0.3%) | 20 (1.3%) |
| $10,000 to $24,999 | 39 (4.3%) | 12 (0.8%) |
| $25,000 to $34,999 | 15 (1.7%) | 64 (4.2%) |
| $35,000 to $49,999 | 199 (22.2%) | 67 (4.4%) |
| $50,000 to $74,999 | 177 (19.7%) | 94 (6.1%) |
| $75,000 to $99,999 | 177 (19.7%) | 392 (25.5%) |
| $100,000 to $149,999 | 85 (9.5%) | 134 (8.7%) |
| $150,000 or more | 202 (22.5%) | 528 (34.4%) |
| Total | 897 (100.0%) | 1,535 (100.0%) |
Property Value to Household Income Ratio in Kill Devil Hills
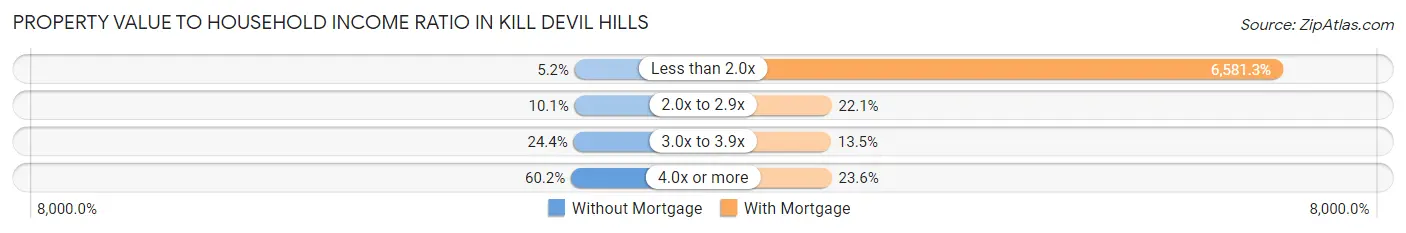
| Value-to-Income Ratio | Without Mortgage | With Mortgage |
| Less than 2.0x | 47 (5.2%) | 101,023 (6,581.3%) |
| 2.0x to 2.9x | 91 (10.1%) | 339 (22.1%) |
| 3.0x to 3.9x | 219 (24.4%) | 207 (13.5%) |
| 4.0x or more | 540 (60.2%) | 362 (23.6%) |
| Total | 897 (100.0%) | 1,535 (100.0%) |
Real Estate Taxes by Mortgage Status in Kill Devil Hills
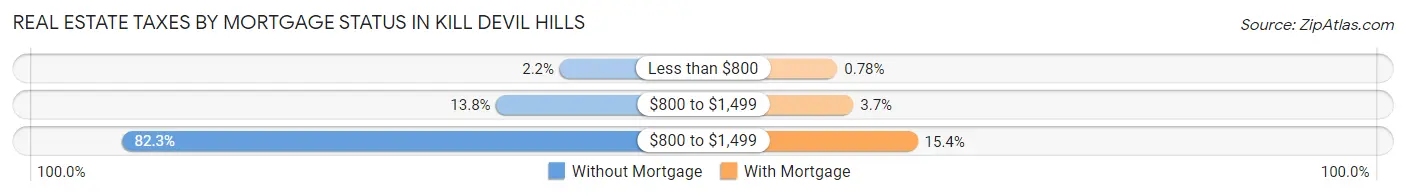
| Property Taxes | Without Mortgage | With Mortgage |
| Less than $800 | 20 (2.2%) | 12 (0.8%) |
| $800 to $1,499 | 124 (13.8%) | 57 (3.7%) |
| $800 to $1,499 | 738 (82.3%) | 237 (15.4%) |
| Total | 897 (100.0%) | 1,535 (100.0%) |
Health & Disability in Kill Devil Hills
Health Insurance Coverage by Age in Kill Devil Hills
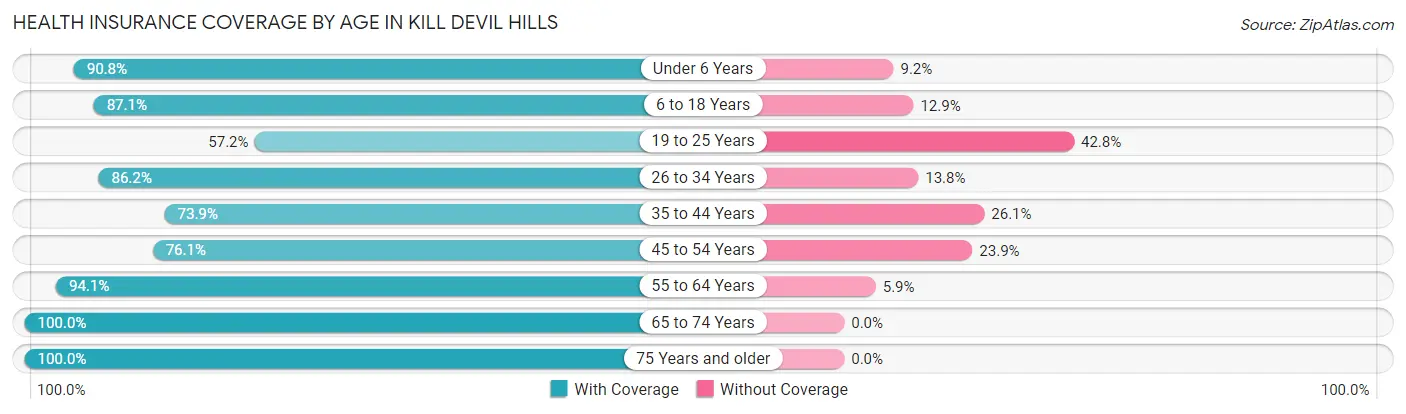
| Age Bracket | With Coverage | Without Coverage |
| Under 6 Years | 366 (90.8%) | 37 (9.2%) |
| 6 to 18 Years | 756 (87.1%) | 112 (12.9%) |
| 19 to 25 Years | 435 (57.2%) | 326 (42.8%) |
| 26 to 34 Years | 456 (86.2%) | 73 (13.8%) |
| 35 to 44 Years | 512 (73.9%) | 181 (26.1%) |
| 45 to 54 Years | 1,185 (76.1%) | 372 (23.9%) |
| 55 to 64 Years | 1,348 (94.1%) | 84 (5.9%) |
| 65 to 74 Years | 829 (100.0%) | 0 (0.0%) |
| 75 Years and older | 558 (100.0%) | 0 (0.0%) |
| Total | 6,445 (84.5%) | 1,185 (15.5%) |
Health Insurance Coverage by Citizenship Status in Kill Devil Hills
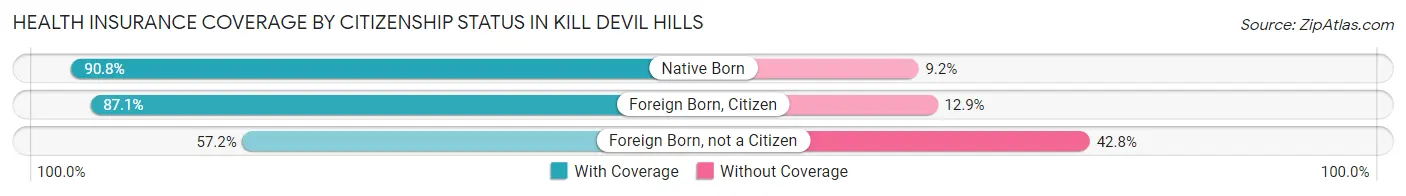
| Citizenship Status | With Coverage | Without Coverage |
| Native Born | 366 (90.8%) | 37 (9.2%) |
| Foreign Born, Citizen | 756 (87.1%) | 112 (12.9%) |
| Foreign Born, not a Citizen | 435 (57.2%) | 326 (42.8%) |
Health Insurance Coverage by Household Income in Kill Devil Hills
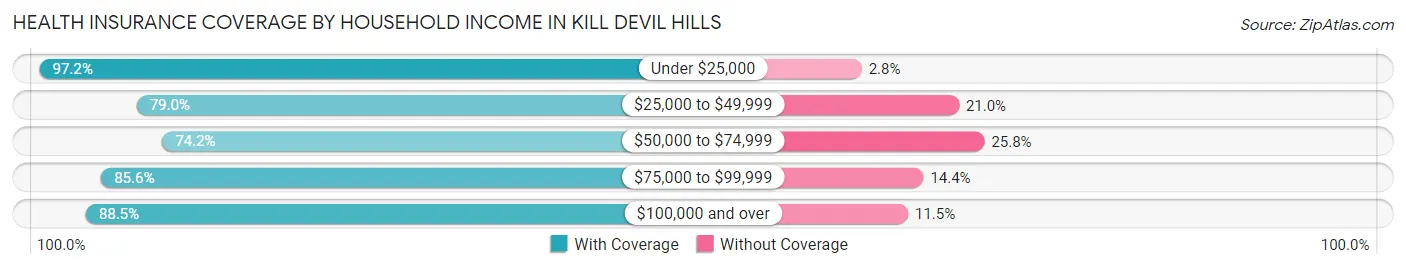
| Household Income | With Coverage | Without Coverage |
| Under $25,000 | 416 (97.2%) | 12 (2.8%) |
| $25,000 to $49,999 | 673 (79.0%) | 179 (21.0%) |
| $50,000 to $74,999 | 1,214 (74.2%) | 422 (25.8%) |
| $75,000 to $99,999 | 626 (85.6%) | 105 (14.4%) |
| $100,000 and over | 3,516 (88.5%) | 456 (11.5%) |
Public vs Private Health Insurance Coverage by Age in Kill Devil Hills
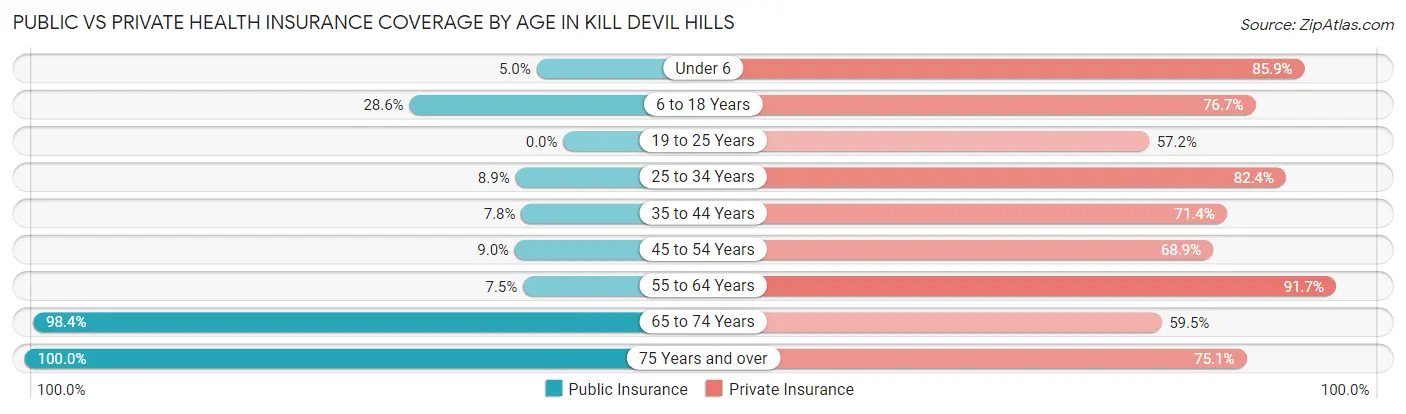
| Age Bracket | Public Insurance | Private Insurance |
| Under 6 | 20 (5.0%) | 346 (85.9%) |
| 6 to 18 Years | 248 (28.6%) | 666 (76.7%) |
| 19 to 25 Years | 0 (0.0%) | 435 (57.2%) |
| 25 to 34 Years | 47 (8.9%) | 436 (82.4%) |
| 35 to 44 Years | 54 (7.8%) | 495 (71.4%) |
| 45 to 54 Years | 140 (9.0%) | 1,073 (68.9%) |
| 55 to 64 Years | 107 (7.5%) | 1,313 (91.7%) |
| 65 to 74 Years | 816 (98.4%) | 493 (59.5%) |
| 75 Years and over | 558 (100.0%) | 419 (75.1%) |
| Total | 1,990 (26.1%) | 5,676 (74.4%) |
Disability Status by Sex by Age in Kill Devil Hills
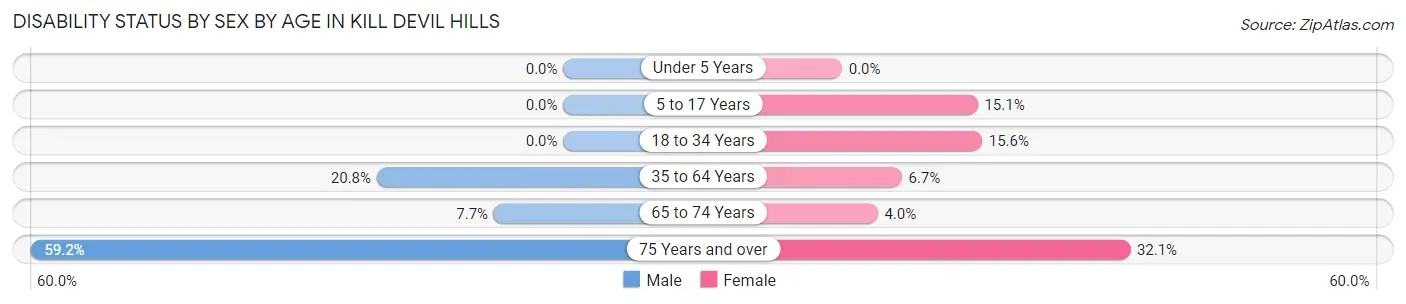
| Age Bracket | Male | Female |
| Under 5 Years | 0 (0.0%) | 0 (0.0%) |
| 5 to 17 Years | 0 (0.0%) | 47 (15.1%) |
| 18 to 34 Years | 0 (0.0%) | 109 (15.6%) |
| 35 to 64 Years | 396 (20.8%) | 118 (6.7%) |
| 65 to 74 Years | 31 (7.7%) | 17 (4.0%) |
| 75 Years and over | 109 (59.2%) | 120 (32.1%) |
Disability Class by Sex by Age in Kill Devil Hills
Disability Class: Hearing Difficulty
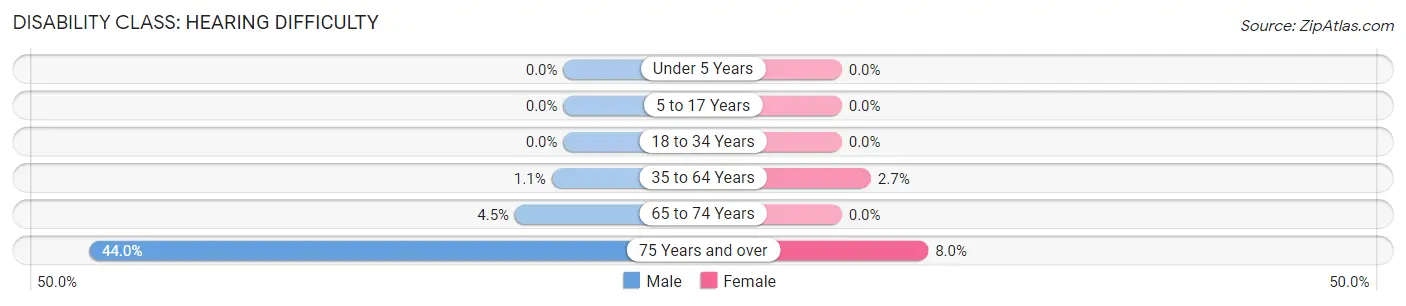
| Age Bracket | Male | Female |
| Under 5 Years | 0 (0.0%) | 0 (0.0%) |
| 5 to 17 Years | 0 (0.0%) | 0 (0.0%) |
| 18 to 34 Years | 0 (0.0%) | 0 (0.0%) |
| 35 to 64 Years | 21 (1.1%) | 48 (2.7%) |
| 65 to 74 Years | 18 (4.5%) | 0 (0.0%) |
| 75 Years and over | 81 (44.0%) | 30 (8.0%) |
Disability Class: Vision Difficulty
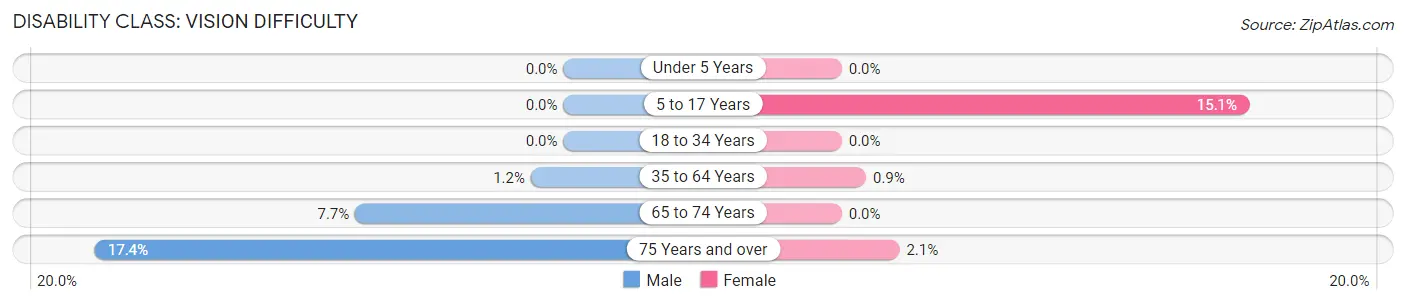
| Age Bracket | Male | Female |
| Under 5 Years | 0 (0.0%) | 0 (0.0%) |
| 5 to 17 Years | 0 (0.0%) | 47 (15.1%) |
| 18 to 34 Years | 0 (0.0%) | 0 (0.0%) |
| 35 to 64 Years | 23 (1.2%) | 16 (0.9%) |
| 65 to 74 Years | 31 (7.7%) | 0 (0.0%) |
| 75 Years and over | 32 (17.4%) | 8 (2.1%) |
Disability Class: Cognitive Difficulty
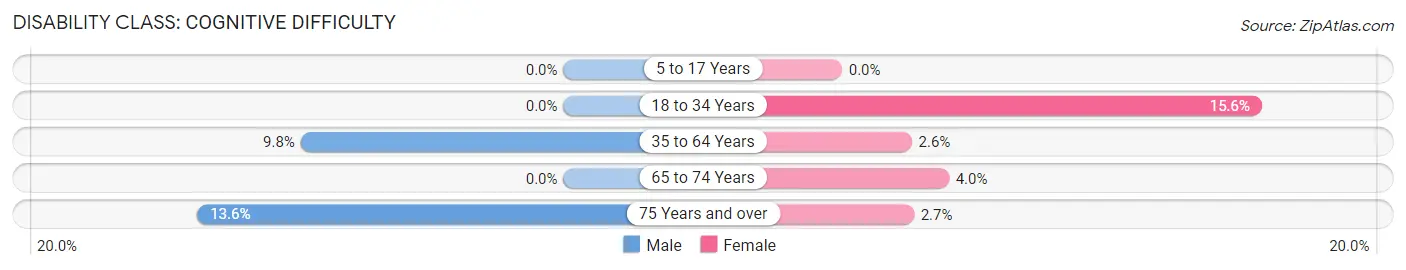
| Age Bracket | Male | Female |
| 5 to 17 Years | 0 (0.0%) | 0 (0.0%) |
| 18 to 34 Years | 0 (0.0%) | 109 (15.6%) |
| 35 to 64 Years | 186 (9.8%) | 46 (2.6%) |
| 65 to 74 Years | 0 (0.0%) | 17 (4.0%) |
| 75 Years and over | 25 (13.6%) | 10 (2.7%) |
Disability Class: Ambulatory Difficulty
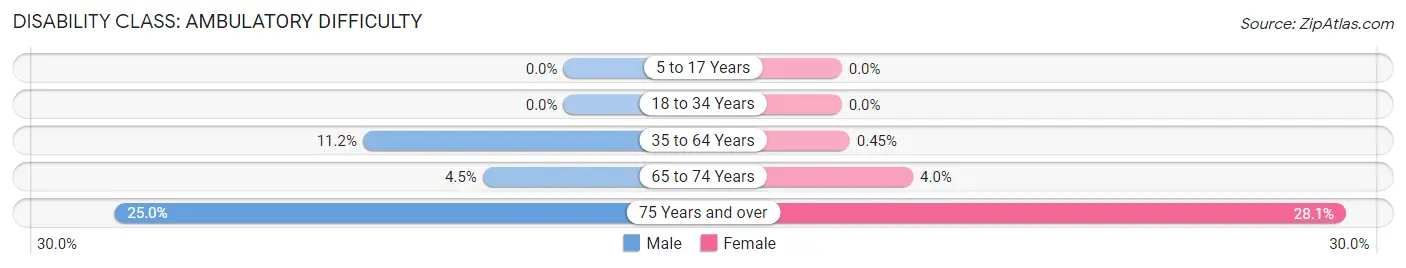
| Age Bracket | Male | Female |
| 5 to 17 Years | 0 (0.0%) | 0 (0.0%) |
| 18 to 34 Years | 0 (0.0%) | 0 (0.0%) |
| 35 to 64 Years | 213 (11.2%) | 8 (0.4%) |
| 65 to 74 Years | 18 (4.5%) | 17 (4.0%) |
| 75 Years and over | 46 (25.0%) | 105 (28.1%) |
Disability Class: Self-Care Difficulty
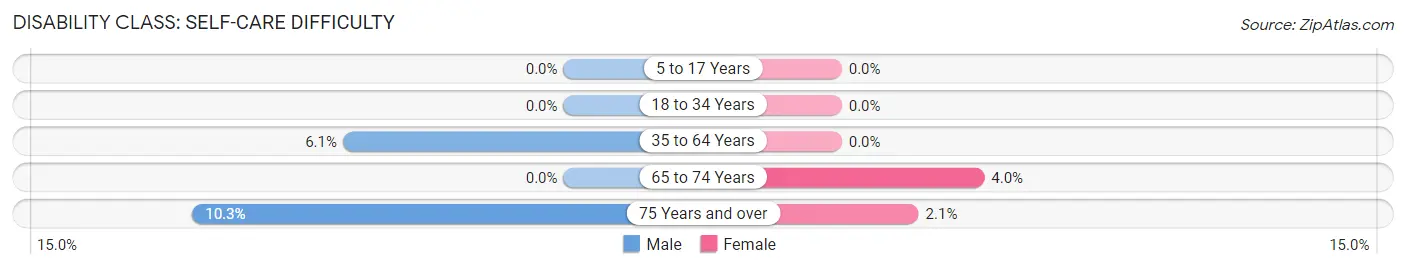
| Age Bracket | Male | Female |
| 5 to 17 Years | 0 (0.0%) | 0 (0.0%) |
| 18 to 34 Years | 0 (0.0%) | 0 (0.0%) |
| 35 to 64 Years | 117 (6.1%) | 0 (0.0%) |
| 65 to 74 Years | 0 (0.0%) | 17 (4.0%) |
| 75 Years and over | 19 (10.3%) | 8 (2.1%) |
Technology Access in Kill Devil Hills
Computing Device Access in Kill Devil Hills
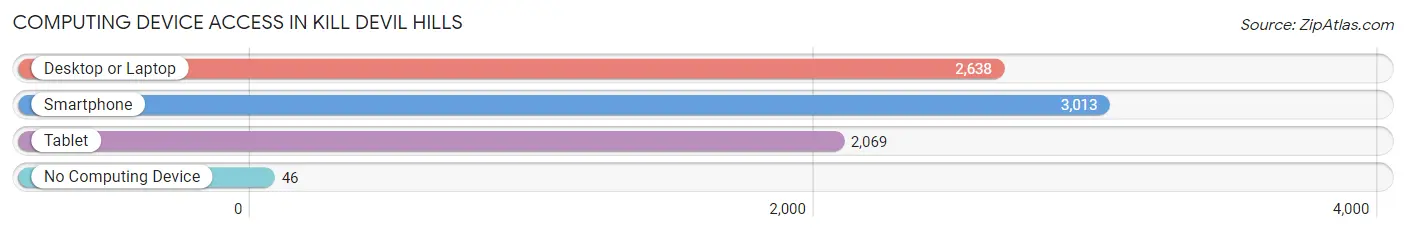
| Device Type | # Households | % Households |
| Desktop or Laptop | 2,638 | 81.0% |
| Smartphone | 3,013 | 92.5% |
| Tablet | 2,069 | 63.5% |
| No Computing Device | 46 | 1.4% |
| Total | 3,258 | 100.0% |
Internet Access in Kill Devil Hills
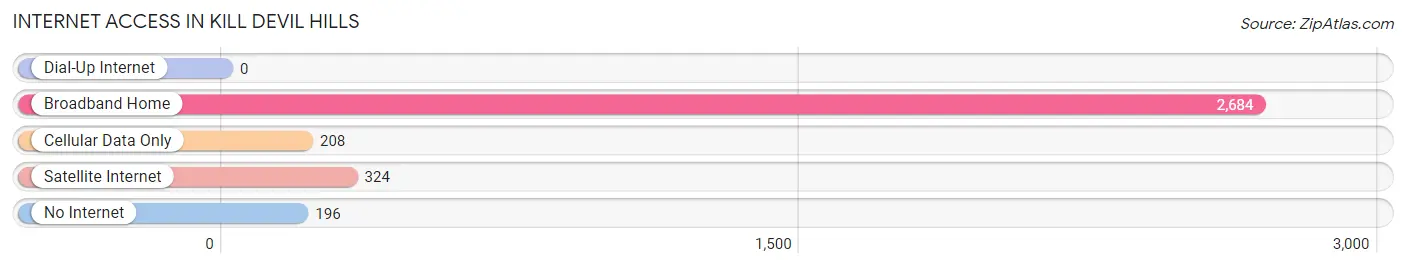
| Internet Type | # Households | % Households |
| Dial-Up Internet | 0 | 0.0% |
| Broadband Home | 2,684 | 82.4% |
| Cellular Data Only | 208 | 6.4% |
| Satellite Internet | 324 | 9.9% |
| No Internet | 196 | 6.0% |
| Total | 3,258 | 100.0% |
Kill Devil Hills Summary
History
The history of Kill Devil Hills, North Carolina dates back to the early 1700s when the area was inhabited by the Algonquian-speaking Croatan Indians. The Croatan Indians were a peaceful tribe that lived off the land and were known for their fishing and hunting skills. The first European settlers arrived in the area in the late 1700s and the town was officially established in 1790. The town was named after a local legend about a group of pirates who buried their treasure in the area.
The town grew slowly over the next few decades and by the mid-1800s, it had become a popular destination for vacationers. The town was known for its beautiful beaches and its proximity to the Outer Banks. In the late 1800s, the Wright Brothers chose Kill Devil Hills as the site of their first successful powered flight. This event put the town on the map and it has since become a popular tourist destination.
Geography
Kill Devil Hills is located in Dare County, North Carolina, on the Outer Banks. It is situated on the Atlantic Ocean and is bordered by the towns of Kitty Hawk, Nags Head, and Manteo. The town covers an area of approximately 10 square miles and has a population of around 6,000 people.
The town is known for its beautiful beaches and its proximity to the Outer Banks. The beaches are popular for swimming, surfing, and fishing. The town is also home to a number of parks and nature preserves, including the Wright Brothers National Memorial, Jockey's Ridge State Park, and the Nags Head Woods Nature Preserve.
Economy
The economy of Kill Devil Hills is largely based on tourism. The town is a popular destination for vacationers and is known for its beautiful beaches and its proximity to the Outer Banks. The town is also home to a number of restaurants, shops, and other businesses that cater to tourists.
The town is also home to a number of industries, including fishing, boatbuilding, and seafood processing. The town is also home to a number of government agencies, including the National Park Service, the U.S. Coast Guard, and the U.S. Fish and Wildlife Service.
Demographics
As of the 2010 census, the population of Kill Devil Hills was 6,683. The racial makeup of the town was 94.3% White, 2.2% African American, 0.7% Native American, 0.7% Asian, 0.2% Pacific Islander, and 1.9% from other races. The median household income was $45,813 and the median family income was $50,945. The per capita income was $25,945.
Conclusion
Kill Devil Hills, North Carolina is a small town located on the Outer Banks of North Carolina. The town has a rich history dating back to the 1700s and is known for its beautiful beaches and its proximity to the Outer Banks. The town is a popular tourist destination and its economy is largely based on tourism. The town is also home to a number of industries, including fishing, boatbuilding, and seafood processing. The population of Kill Devil Hills is 6,683 and the median household income is $45,813.
Common Questions
What is Per Capita Income in Kill Devil Hills?
Per Capita income in Kill Devil Hills is $41,679.
What is the Median Family Income in Kill Devil Hills?
Median Family Income in Kill Devil Hills is $108,344.
What is the Median Household income in Kill Devil Hills?
Median Household Income in Kill Devil Hills is $73,036.
What is Income or Wage Gap in Kill Devil Hills?
Income or Wage Gap in Kill Devil Hills is 15.0%.
Women in Kill Devil Hills earn 85.0 cents for every dollar earned by a man.
What is Inequality or Gini Index in Kill Devil Hills?
Inequality or Gini Index in Kill Devil Hills is 0.39.
What is the Total Population of Kill Devil Hills?
Total Population of Kill Devil Hills is 7,658.
What is the Total Male Population of Kill Devil Hills?
Total Male Population of Kill Devil Hills is 3,787.
What is the Total Female Population of Kill Devil Hills?
Total Female Population of Kill Devil Hills is 3,871.
What is the Ratio of Males per 100 Females in Kill Devil Hills?
There are 97.83 Males per 100 Females in Kill Devil Hills.
What is the Ratio of Females per 100 Males in Kill Devil Hills?
There are 102.22 Females per 100 Males in Kill Devil Hills.
What is the Median Population Age in Kill Devil Hills?
Median Population Age in Kill Devil Hills is 48.1 Years.
What is the Average Family Size in Kill Devil Hills
Average Family Size in Kill Devil Hills is 3.0 People.
What is the Average Household Size in Kill Devil Hills
Average Household Size in Kill Devil Hills is 2.4 People.
How Large is the Labor Force in Kill Devil Hills?
There are 4,701 People in the Labor Forcein in Kill Devil Hills.
What is the Percentage of People in the Labor Force in Kill Devil Hills?
70.5% of People are in the Labor Force in Kill Devil Hills.
What is the Unemployment Rate in Kill Devil Hills?
Unemployment Rate in Kill Devil Hills is 6.1%.