Linganore, MD Map & Demographics
Linganore Map
Linganore Overview
$58,449
PER CAPITA INCOME
$177,703
AVG FAMILY INCOME
$165,551
AVG HOUSEHOLD INCOME
23.9%
WAGE / INCOME GAP [ % ]
76.1¢/ $1
WAGE / INCOME GAP [ $ ]
0.33
INEQUALITY / GINI INDEX
11,870
TOTAL POPULATION
6,173
MALE POPULATION
5,697
FEMALE POPULATION
108.36
MALES / 100 FEMALES
92.29
FEMALES / 100 MALES
36.7
MEDIAN AGE
3.4
AVG FAMILY SIZE
3.0
AVG HOUSEHOLD SIZE
6,637
LABOR FORCE [ PEOPLE ]
75.9%
PERCENT IN LABOR FORCE
2.6%
UNEMPLOYMENT RATE
Income in Linganore
Income Overview in Linganore
Per Capita Income in Linganore is $58,449, while median incomes of families and households are $177,703 and $165,551 respectively.
| Characteristic | Number | Measure |
| Per Capita Income | 11,870 | $58,449 |
| Median Family Income | 3,198 | $177,703 |
| Mean Family Income | 3,198 | $185,517 |
| Median Household Income | 4,013 | $165,551 |
| Mean Household Income | 4,013 | $170,793 |
| Income Deficit | 3,198 | $0 |
| Wage / Income Gap (%) | 11,870 | 23.94% |
| Wage / Income Gap ($) | 11,870 | 76.06¢ per $1 |
| Gini / Inequality Index | 11,870 | 0.33 |
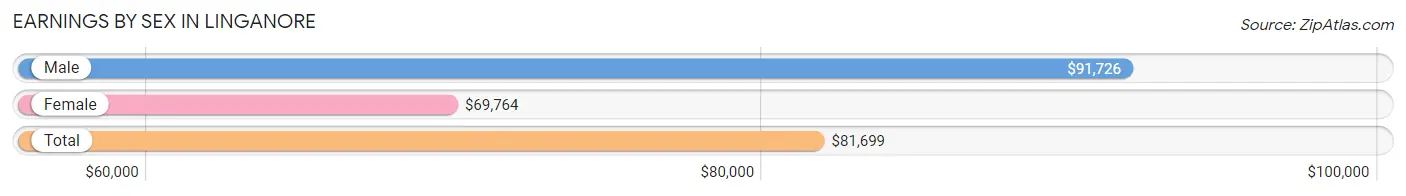
Earnings by Sex in Linganore
Average Earnings in Linganore are $81,699, $91,726 for men and $69,764 for women, a difference of 23.9%.
| Sex | Number | Average Earnings |
| Male | 3,867 (55.6%) | $91,726 |
| Female | 3,089 (44.4%) | $69,764 |
| Total | 6,956 (100.0%) | $81,699 |
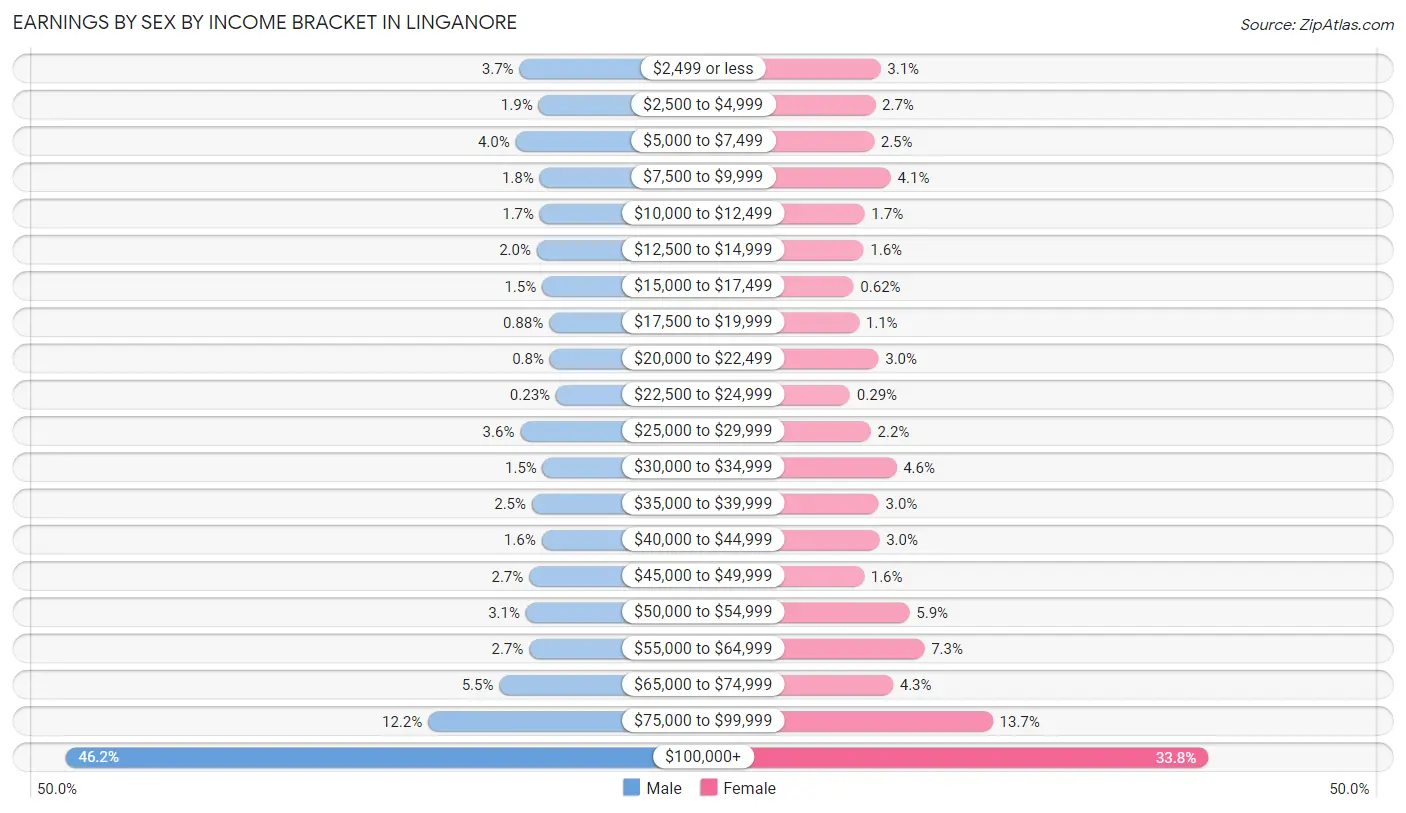
Earnings by Sex by Income Bracket in Linganore
The most common earnings brackets in Linganore are $100,000+ for men (1,785 | 46.2%) and $100,000+ for women (1,045 | 33.8%).
| Income | Male | Female |
| $2,499 or less | 141 (3.6%) | 97 (3.1%) |
| $2,500 to $4,999 | 72 (1.9%) | 82 (2.6%) |
| $5,000 to $7,499 | 155 (4.0%) | 78 (2.5%) |
| $7,500 to $9,999 | 68 (1.8%) | 127 (4.1%) |
| $10,000 to $12,499 | 67 (1.7%) | 51 (1.7%) |
| $12,500 to $14,999 | 78 (2.0%) | 48 (1.5%) |
| $15,000 to $17,499 | 59 (1.5%) | 19 (0.6%) |
| $17,500 to $19,999 | 34 (0.9%) | 35 (1.1%) |
| $20,000 to $22,499 | 31 (0.8%) | 91 (2.9%) |
| $22,500 to $24,999 | 9 (0.2%) | 9 (0.3%) |
| $25,000 to $29,999 | 138 (3.6%) | 69 (2.2%) |
| $30,000 to $34,999 | 57 (1.5%) | 143 (4.6%) |
| $35,000 to $39,999 | 96 (2.5%) | 92 (3.0%) |
| $40,000 to $44,999 | 61 (1.6%) | 94 (3.0%) |
| $45,000 to $49,999 | 106 (2.7%) | 49 (1.6%) |
| $50,000 to $54,999 | 118 (3.0%) | 181 (5.9%) |
| $55,000 to $64,999 | 106 (2.7%) | 224 (7.2%) |
| $65,000 to $74,999 | 214 (5.5%) | 133 (4.3%) |
| $75,000 to $99,999 | 472 (12.2%) | 422 (13.7%) |
| $100,000+ | 1,785 (46.2%) | 1,045 (33.8%) |
| Total | 3,867 (100.0%) | 3,089 (100.0%) |
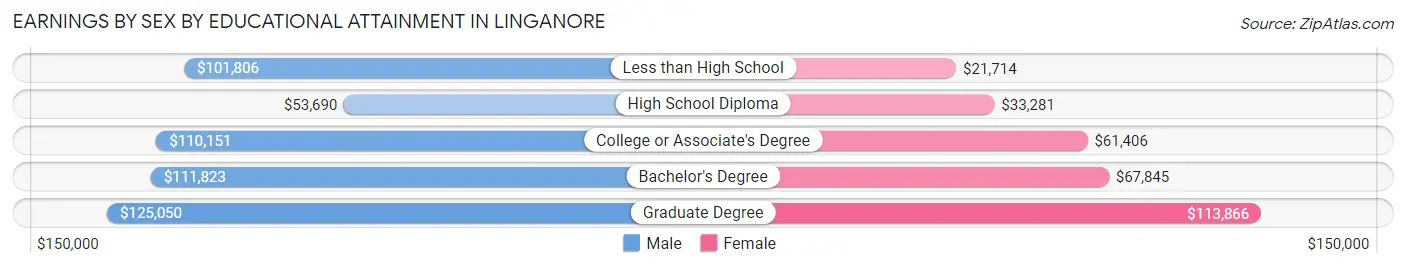
Earnings by Sex by Educational Attainment in Linganore
Average earnings in Linganore are $109,900 for men and $78,860 for women, a difference of 28.2%. Men with an educational attainment of graduate degree enjoy the highest average annual earnings of $125,050, while those with high school diploma education earn the least with $53,690. Women with an educational attainment of graduate degree earn the most with the average annual earnings of $113,866, while those with less than high school education have the smallest earnings of $21,714.
| Educational Attainment | Male Income | Female Income |
| Less than High School | $101,806 | $21,714 |
| High School Diploma | $53,690 | $33,281 |
| College or Associate's Degree | $110,151 | $61,406 |
| Bachelor's Degree | $111,823 | $67,845 |
| Graduate Degree | $125,050 | $113,866 |
| Total | $109,900 | $78,860 |
Family Income in Linganore
Family Income Brackets in Linganore
According to the Linganore family income data, there are 1,266 families falling into the $200,000+ income range, which is the most common income bracket and makes up 39.6% of all families.
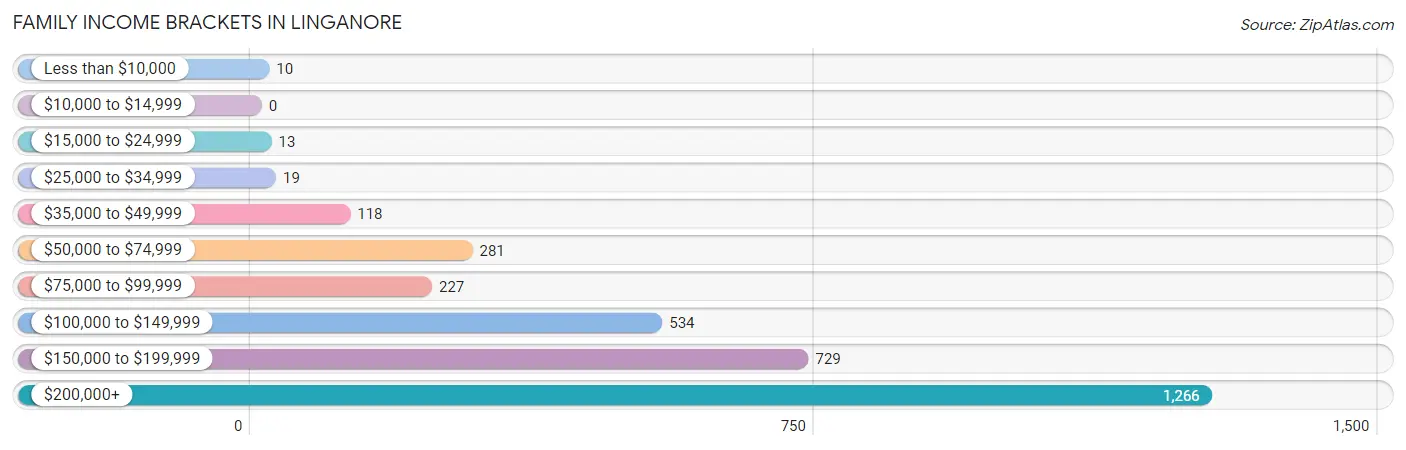
| Income Bracket | # Families | % Families |
| Less than $10,000 | 10 | 0.3% |
| $10,000 to $14,999 | 0 | 0.0% |
| $15,000 to $24,999 | 13 | 0.4% |
| $25,000 to $34,999 | 19 | 0.6% |
| $35,000 to $49,999 | 118 | 3.7% |
| $50,000 to $74,999 | 281 | 8.8% |
| $75,000 to $99,999 | 227 | 7.1% |
| $100,000 to $149,999 | 534 | 16.7% |
| $150,000 to $199,999 | 729 | 22.8% |
| $200,000+ | 1,266 | 39.6% |
Family Income by Famaliy Size in Linganore
3-person families (867 | 27.1%) account for the highest median family income in Linganore with $197,917 per family, while 2-person families (955 | 29.9%) have the highest median income of $75,352 per family member.
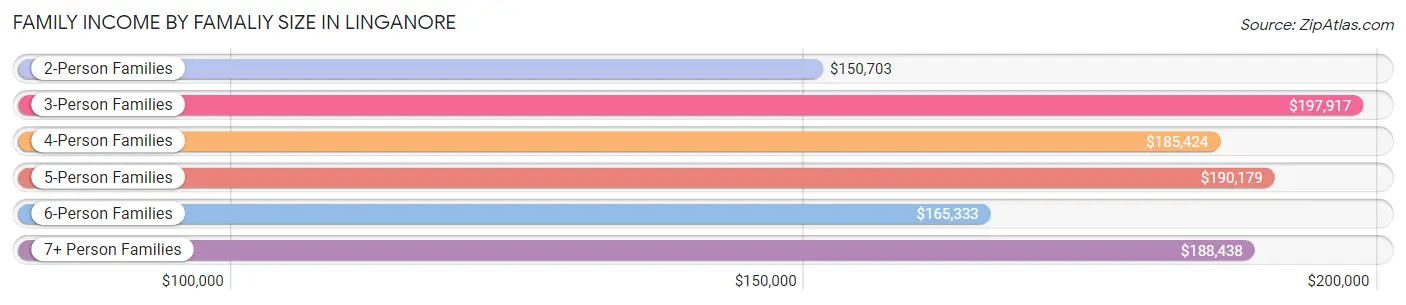
| Income Bracket | # Families | Median Income |
| 2-Person Families | 955 (29.9%) | $150,703 |
| 3-Person Families | 867 (27.1%) | $197,917 |
| 4-Person Families | 803 (25.1%) | $185,424 |
| 5-Person Families | 447 (14.0%) | $190,179 |
| 6-Person Families | 80 (2.5%) | $165,333 |
| 7+ Person Families | 46 (1.4%) | $188,438 |
| Total | 3,198 (100.0%) | $177,703 |
Family Income by Number of Earners in Linganore
The median family income in Linganore is $177,703, with families comprising 3+ earners (495) having the highest median family income of $203,988, while families with no earners (147) have the lowest median family income of $85,417, accounting for 15.5% and 4.6% of families, respectively.
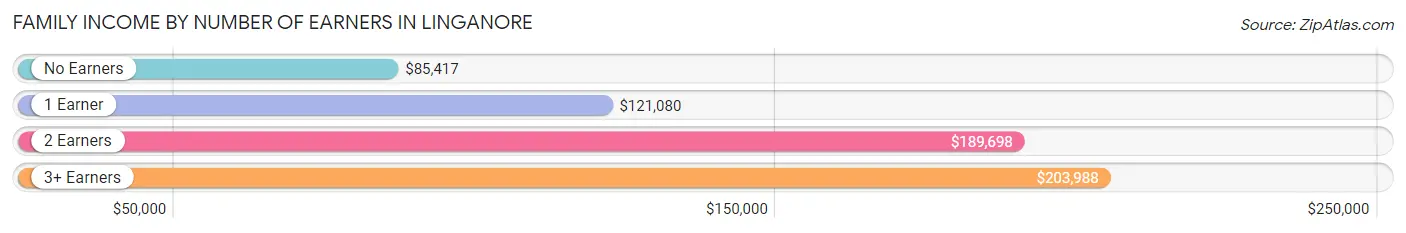
| Number of Earners | # Families | Median Income |
| No Earners | 147 (4.6%) | $85,417 |
| 1 Earner | 715 (22.4%) | $121,080 |
| 2 Earners | 1,841 (57.6%) | $189,698 |
| 3+ Earners | 495 (15.5%) | $203,988 |
| Total | 3,198 (100.0%) | $177,703 |
Household Income in Linganore
Household Income Brackets in Linganore
With 1,364 households falling in the category, the $200,000+ income range is the most frequent in Linganore, accounting for 34.0% of all households. In contrast, only 8 households (0.2%) fall into the $10,000 to $14,999 income bracket, making it the least populous group.
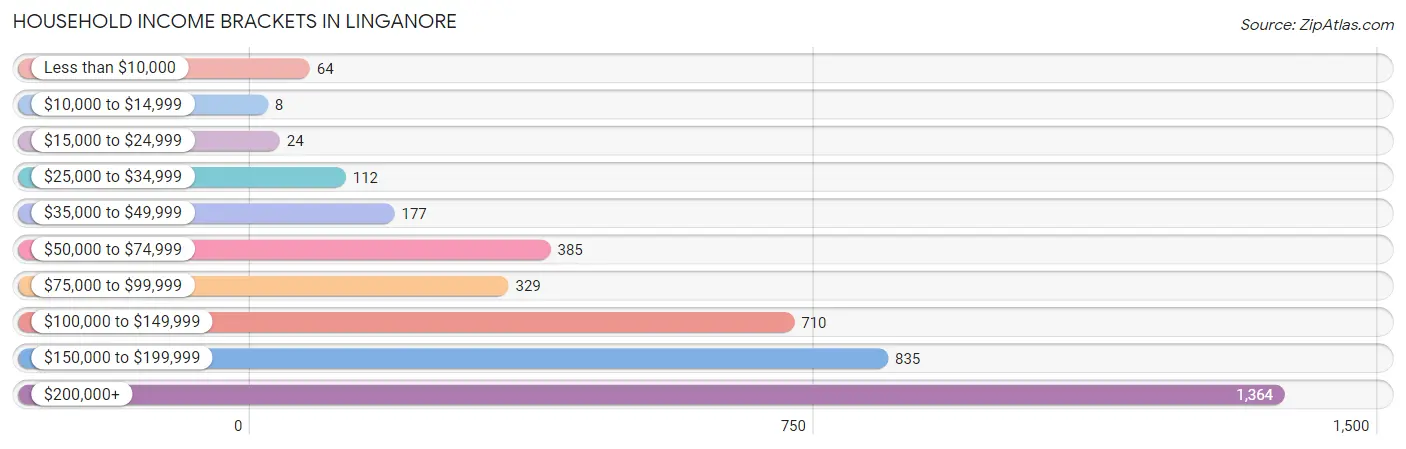
| Income Bracket | # Households | % Households |
| Less than $10,000 | 64 | 1.6% |
| $10,000 to $14,999 | 8 | 0.2% |
| $15,000 to $24,999 | 24 | 0.6% |
| $25,000 to $34,999 | 112 | 2.8% |
| $35,000 to $49,999 | 177 | 4.4% |
| $50,000 to $74,999 | 385 | 9.6% |
| $75,000 to $99,999 | 329 | 8.2% |
| $100,000 to $149,999 | 710 | 17.7% |
| $150,000 to $199,999 | 835 | 20.8% |
| $200,000+ | 1,364 | 34.0% |
Household Income by Householder Age in Linganore
The median household income in Linganore is $165,551, with the highest median household income of $183,533 found in the 45 to 64 years age bracket for the primary householder. A total of 1,723 households (42.9%) fall into this category. Meanwhile, the 15 to 24 years age bracket for the primary householder has the lowest median household income of $0, with 155 households (3.9%) in this group.
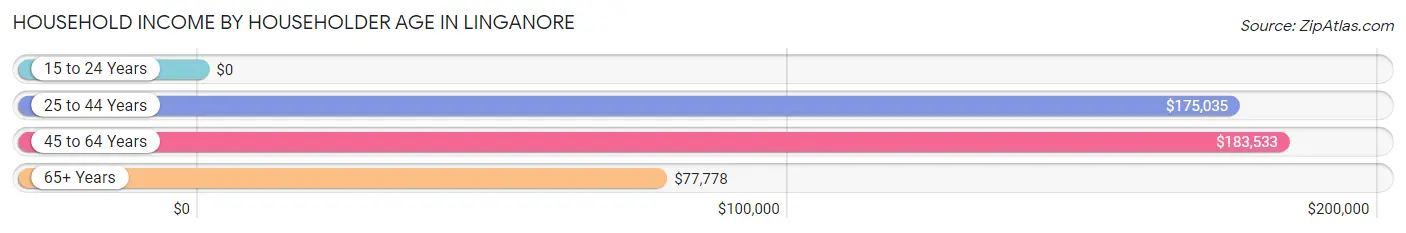
| Income Bracket | # Households | Median Income |
| 15 to 24 Years | 155 (3.9%) | $0 |
| 25 to 44 Years | 1,509 (37.6%) | $175,035 |
| 45 to 64 Years | 1,723 (42.9%) | $183,533 |
| 65+ Years | 626 (15.6%) | $77,778 |
| Total | 4,013 (100.0%) | $165,551 |
Poverty in Linganore
Income Below Poverty by Sex and Age in Linganore
With 1.4% poverty level for males and 2.0% for females among the residents of Linganore, 16 and 17 year old males and 15 year old females are the most vulnerable to poverty, with 12 males (5.5%) and 11 females (19.6%) in their respective age groups living below the poverty level.
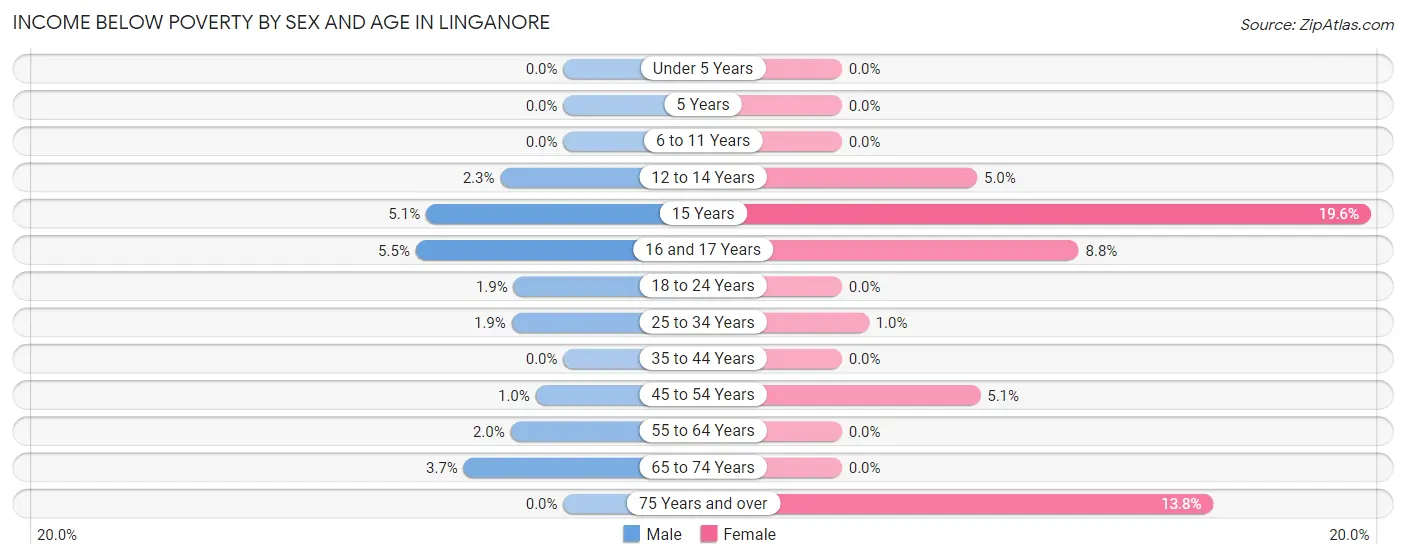
| Age Bracket | Male | Female |
| Under 5 Years | 0 (0.0%) | 0 (0.0%) |
| 5 Years | 0 (0.0%) | 0 (0.0%) |
| 6 to 11 Years | 0 (0.0%) | 0 (0.0%) |
| 12 to 14 Years | 10 (2.3%) | 13 (5.0%) |
| 15 Years | 8 (5.1%) | 11 (19.6%) |
| 16 and 17 Years | 12 (5.5%) | 8 (8.8%) |
| 18 to 24 Years | 8 (1.8%) | 0 (0.0%) |
| 25 to 34 Years | 14 (1.9%) | 7 (1.0%) |
| 35 to 44 Years | 0 (0.0%) | 0 (0.0%) |
| 45 to 54 Years | 10 (1.0%) | 47 (5.1%) |
| 55 to 64 Years | 14 (2.0%) | 0 (0.0%) |
| 65 to 74 Years | 12 (3.7%) | 0 (0.0%) |
| 75 Years and over | 0 (0.0%) | 28 (13.8%) |
| Total | 88 (1.4%) | 114 (2.0%) |
Income Above Poverty by Sex and Age in Linganore
According to the poverty statistics in Linganore, males aged under 5 years and females aged under 5 years are the age groups that are most secure financially, with 100.0% of males and 100.0% of females in these age groups living above the poverty line.
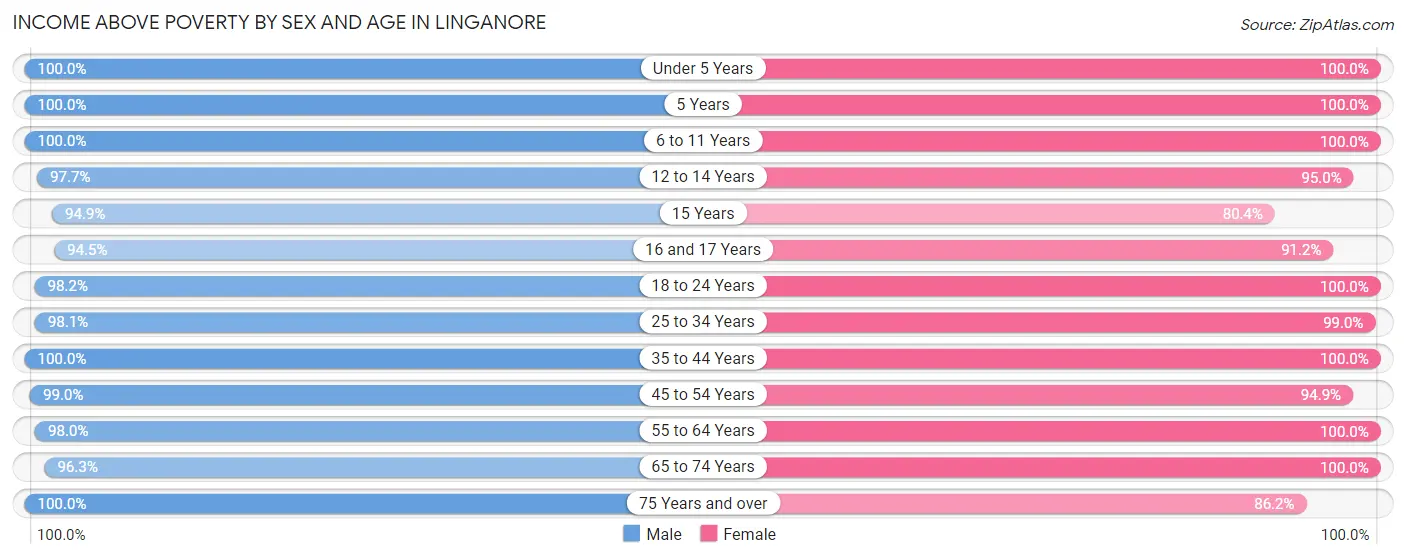
| Age Bracket | Male | Female |
| Under 5 Years | 496 (100.0%) | 351 (100.0%) |
| 5 Years | 115 (100.0%) | 181 (100.0%) |
| 6 to 11 Years | 592 (100.0%) | 484 (100.0%) |
| 12 to 14 Years | 417 (97.7%) | 246 (95.0%) |
| 15 Years | 149 (94.9%) | 45 (80.4%) |
| 16 and 17 Years | 207 (94.5%) | 83 (91.2%) |
| 18 to 24 Years | 425 (98.2%) | 404 (100.0%) |
| 25 to 34 Years | 714 (98.1%) | 695 (99.0%) |
| 35 to 44 Years | 863 (100.0%) | 975 (100.0%) |
| 45 to 54 Years | 960 (99.0%) | 867 (94.9%) |
| 55 to 64 Years | 701 (98.0%) | 730 (100.0%) |
| 65 to 74 Years | 312 (96.3%) | 347 (100.0%) |
| 75 Years and over | 126 (100.0%) | 175 (86.2%) |
| Total | 6,077 (98.6%) | 5,583 (98.0%) |
Income Below Poverty Among Married-Couple Families in Linganore
The poverty statistics for married-couple families in Linganore show that 0.3% or 10 of the total 2,943 families live below the poverty line. Families with 1 or 2 children have the highest poverty rate of 0.7%, comprising of 10 families. On the other hand, families with no children have the lowest poverty rate of 0.0%, which includes 0 families.
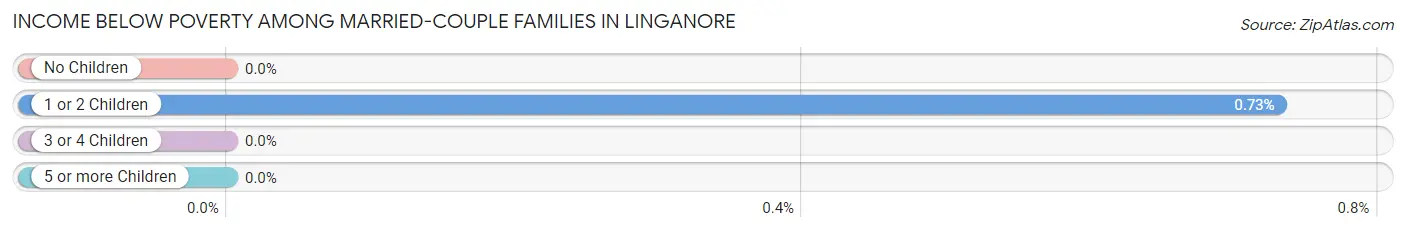
| Children | Above Poverty | Below Poverty |
| No Children | 1,220 (100.0%) | 0 (0.0%) |
| 1 or 2 Children | 1,361 (99.3%) | 10 (0.7%) |
| 3 or 4 Children | 325 (100.0%) | 0 (0.0%) |
| 5 or more Children | 27 (100.0%) | 0 (0.0%) |
| Total | 2,933 (99.7%) | 10 (0.3%) |
Income Below Poverty Among Single-Parent Households in Linganore
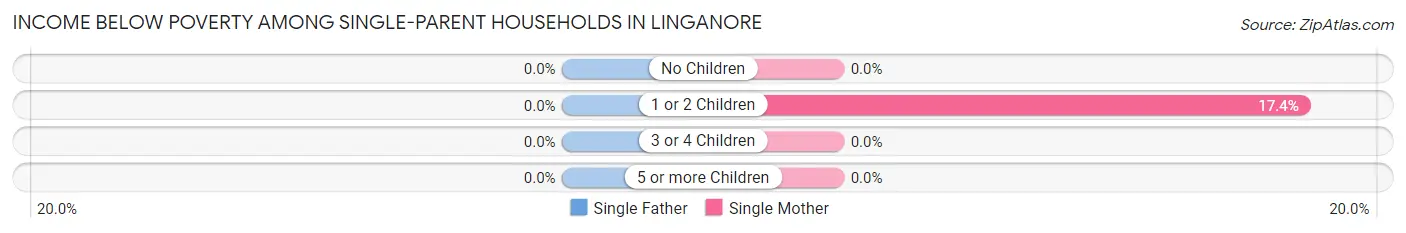
| Children | Single Father | Single Mother |
| No Children | 0 (0.0%) | 0 (0.0%) |
| 1 or 2 Children | 0 (0.0%) | 12 (17.4%) |
| 3 or 4 Children | 0 (0.0%) | 0 (0.0%) |
| 5 or more Children | 0 (0.0%) | 0 (0.0%) |
| Total | 0 (0.0%) | 12 (7.5%) |
Income Below Poverty Among Married-Couple vs Single-Parent Households in Linganore
The poverty data for Linganore shows that 10 of the married-couple family households (0.3%) and 12 of the single-parent households (4.7%) are living below the poverty level. Within the married-couple family households, those with 1 or 2 children have the highest poverty rate, with 10 households (0.7%) falling below the poverty line. Among the single-parent households, those with 1 or 2 children have the highest poverty rate, with 12 household (11.1%) living below poverty.
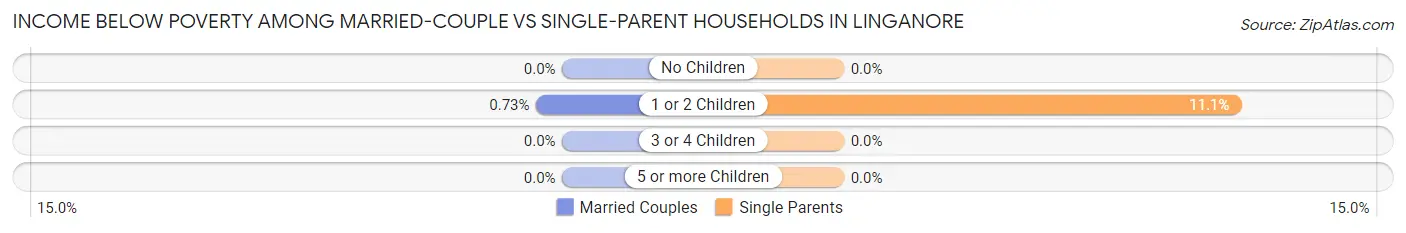
| Children | Married-Couple Families | Single-Parent Households |
| No Children | 0 (0.0%) | 0 (0.0%) |
| 1 or 2 Children | 10 (0.7%) | 12 (11.1%) |
| 3 or 4 Children | 0 (0.0%) | 0 (0.0%) |
| 5 or more Children | 0 (0.0%) | 0 (0.0%) |
| Total | 10 (0.3%) | 12 (4.7%) |
Race in Linganore
The most populous races in Linganore are White / Caucasian (9,526 | 80.2%), Two or more Races (1,222 | 10.3%), and Hispanic or Latino (712 | 6.0%).
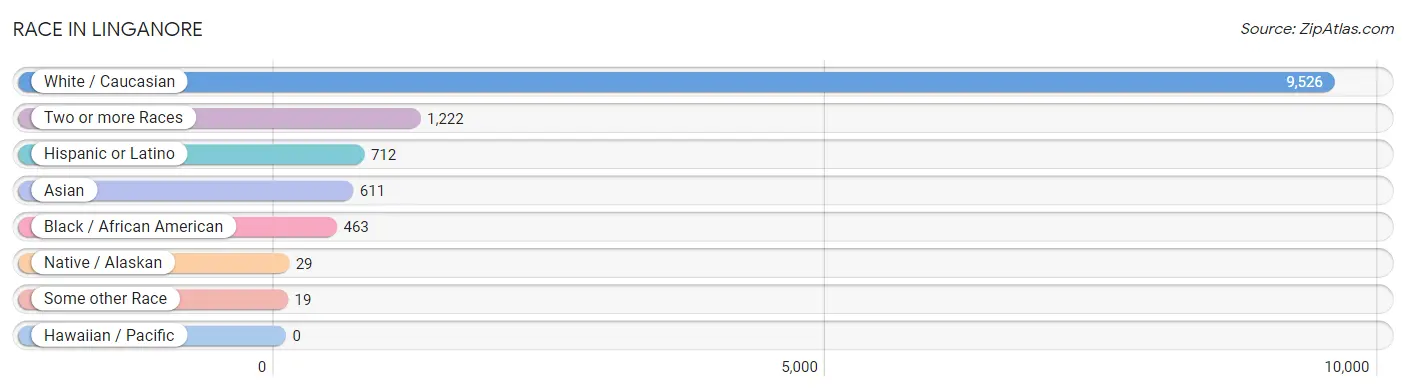
| Race | # Population | % Population |
| Asian | 611 | 5.1% |
| Black / African American | 463 | 3.9% |
| Hawaiian / Pacific | 0 | 0.0% |
| Hispanic or Latino | 712 | 6.0% |
| Native / Alaskan | 29 | 0.2% |
| White / Caucasian | 9,526 | 80.2% |
| Two or more Races | 1,222 | 10.3% |
| Some other Race | 19 | 0.2% |
| Total | 11,870 | 100.0% |
Ancestry in Linganore
The most populous ancestries reported in Linganore are Irish (2,240 | 18.9%), English (2,126 | 17.9%), German (1,844 | 15.5%), Italian (1,326 | 11.2%), and Polish (494 | 4.2%), together accounting for 67.6% of all Linganore residents.
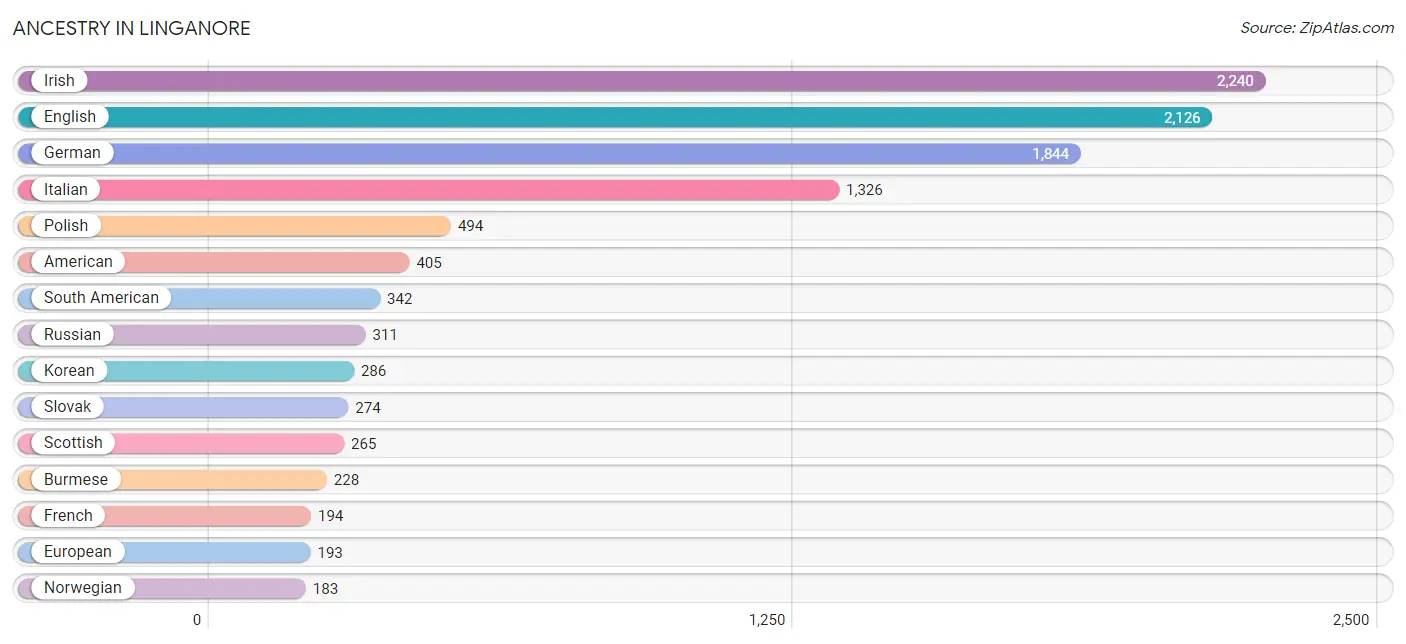
| Ancestry | # Population | % Population |
| African | 12 | 0.1% |
| American | 405 | 3.4% |
| Arab | 65 | 0.5% |
| Argentinean | 7 | 0.1% |
| Armenian | 8 | 0.1% |
| Austrian | 4 | 0.0% |
| Belgian | 6 | 0.1% |
| Bhutanese | 28 | 0.2% |
| Blackfeet | 6 | 0.1% |
| Bolivian | 52 | 0.4% |
| Brazilian | 14 | 0.1% |
| British | 99 | 0.8% |
| Burmese | 228 | 1.9% |
| Canadian | 36 | 0.3% |
| Central American | 66 | 0.6% |
| Central American Indian | 15 | 0.1% |
| Cherokee | 48 | 0.4% |
| Chilean | 117 | 1.0% |
| Choctaw | 3 | 0.0% |
| Colombian | 55 | 0.5% |
| Croatian | 88 | 0.7% |
| Cuban | 18 | 0.2% |
| Czech | 25 | 0.2% |
| Czechoslovakian | 10 | 0.1% |
| Danish | 24 | 0.2% |
| Dutch | 92 | 0.8% |
| Eastern European | 40 | 0.3% |
| Ecuadorian | 92 | 0.8% |
| Egyptian | 14 | 0.1% |
| English | 2,126 | 17.9% |
| European | 193 | 1.6% |
| Filipino | 7 | 0.1% |
| Finnish | 14 | 0.1% |
| French | 194 | 1.6% |
| French Canadian | 114 | 1.0% |
| German | 1,844 | 15.5% |
| Greek | 54 | 0.4% |
| Hungarian | 80 | 0.7% |
| Indian (Asian) | 60 | 0.5% |
| Iranian | 42 | 0.4% |
| Irish | 2,240 | 18.9% |
| Israeli | 7 | 0.1% |
| Italian | 1,326 | 11.2% |
| Korean | 286 | 2.4% |
| Lebanese | 28 | 0.2% |
| Lithuanian | 64 | 0.5% |
| Lumbee | 11 | 0.1% |
| Mexican | 63 | 0.5% |
| Native Hawaiian | 16 | 0.1% |
| Nicaraguan | 7 | 0.1% |
| Norwegian | 183 | 1.5% |
| Pakistani | 20 | 0.2% |
| Paraguayan | 19 | 0.2% |
| Polish | 494 | 4.2% |
| Portuguese | 60 | 0.5% |
| Puerto Rican | 148 | 1.3% |
| Romanian | 106 | 0.9% |
| Russian | 311 | 2.6% |
| Salvadoran | 59 | 0.5% |
| Scotch-Irish | 59 | 0.5% |
| Scottish | 265 | 2.2% |
| Slovak | 274 | 2.3% |
| Slovene | 14 | 0.1% |
| South African | 112 | 0.9% |
| South American | 342 | 2.9% |
| Spaniard | 29 | 0.2% |
| Sri Lankan | 9 | 0.1% |
| Subsaharan African | 152 | 1.3% |
| Swedish | 126 | 1.1% |
| Swiss | 79 | 0.7% |
| Thai | 123 | 1.0% |
| Turkish | 8 | 0.1% |
| Ukrainian | 55 | 0.5% |
| Welsh | 95 | 0.8% | View All 74 Rows |
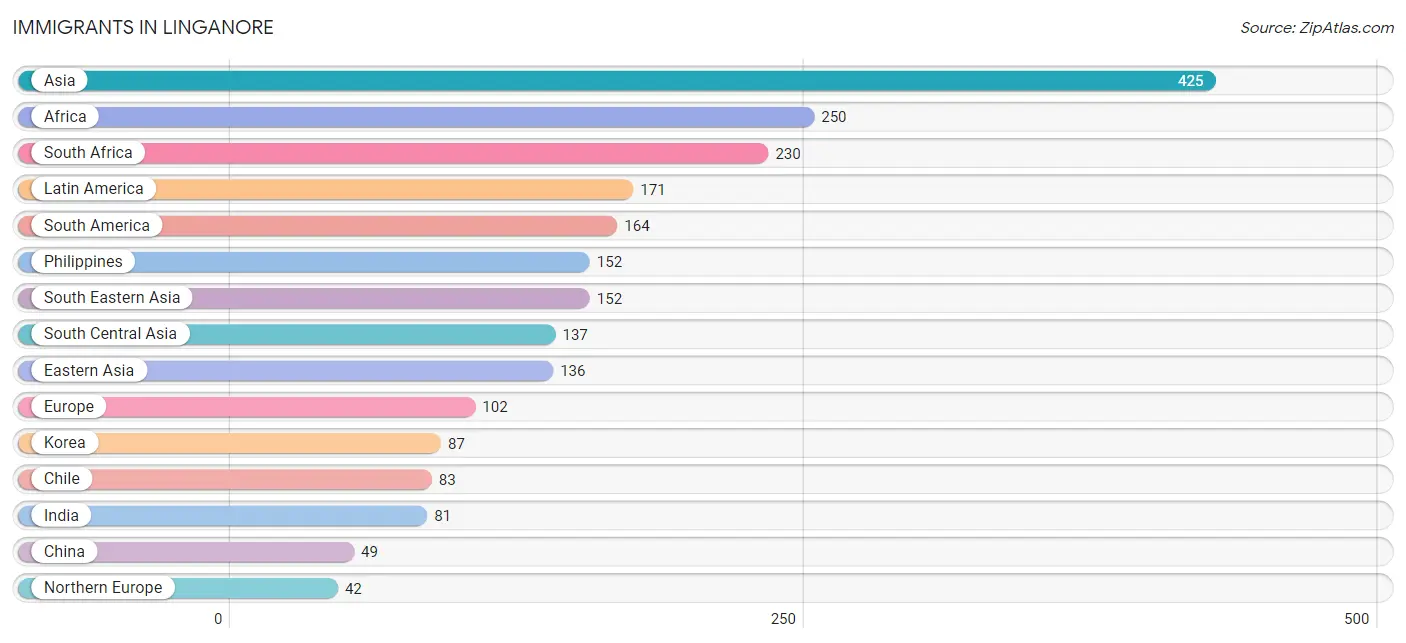
Immigrants in Linganore
The most numerous immigrant groups reported in Linganore came from Asia (425 | 3.6%), Africa (250 | 2.1%), South Africa (230 | 1.9%), Latin America (171 | 1.4%), and South America (164 | 1.4%), together accounting for 10.5% of all Linganore residents.
| Immigration Origin | # Population | % Population |
| Africa | 250 | 2.1% |
| Argentina | 7 | 0.1% |
| Asia | 425 | 3.6% |
| Brazil | 14 | 0.1% |
| Cameroon | 8 | 0.1% |
| Canada | 37 | 0.3% |
| Central America | 7 | 0.1% |
| Chile | 83 | 0.7% |
| China | 49 | 0.4% |
| Colombia | 41 | 0.4% |
| Eastern Asia | 136 | 1.1% |
| Eastern Europe | 35 | 0.3% |
| Europe | 102 | 0.9% |
| Germany | 14 | 0.1% |
| India | 81 | 0.7% |
| Iran | 9 | 0.1% |
| Italy | 11 | 0.1% |
| Korea | 87 | 0.7% |
| Latin America | 171 | 1.4% |
| Middle Africa | 20 | 0.2% |
| Nepal | 36 | 0.3% |
| Nicaragua | 7 | 0.1% |
| Northern Europe | 42 | 0.4% |
| Norway | 11 | 0.1% |
| Philippines | 152 | 1.3% |
| Poland | 25 | 0.2% |
| Russia | 3 | 0.0% |
| South Africa | 230 | 1.9% |
| South America | 164 | 1.4% |
| South Central Asia | 137 | 1.1% |
| South Eastern Asia | 152 | 1.3% |
| Southern Europe | 11 | 0.1% |
| Sri Lanka | 11 | 0.1% |
| Western Europe | 14 | 0.1% | View All 34 Rows |
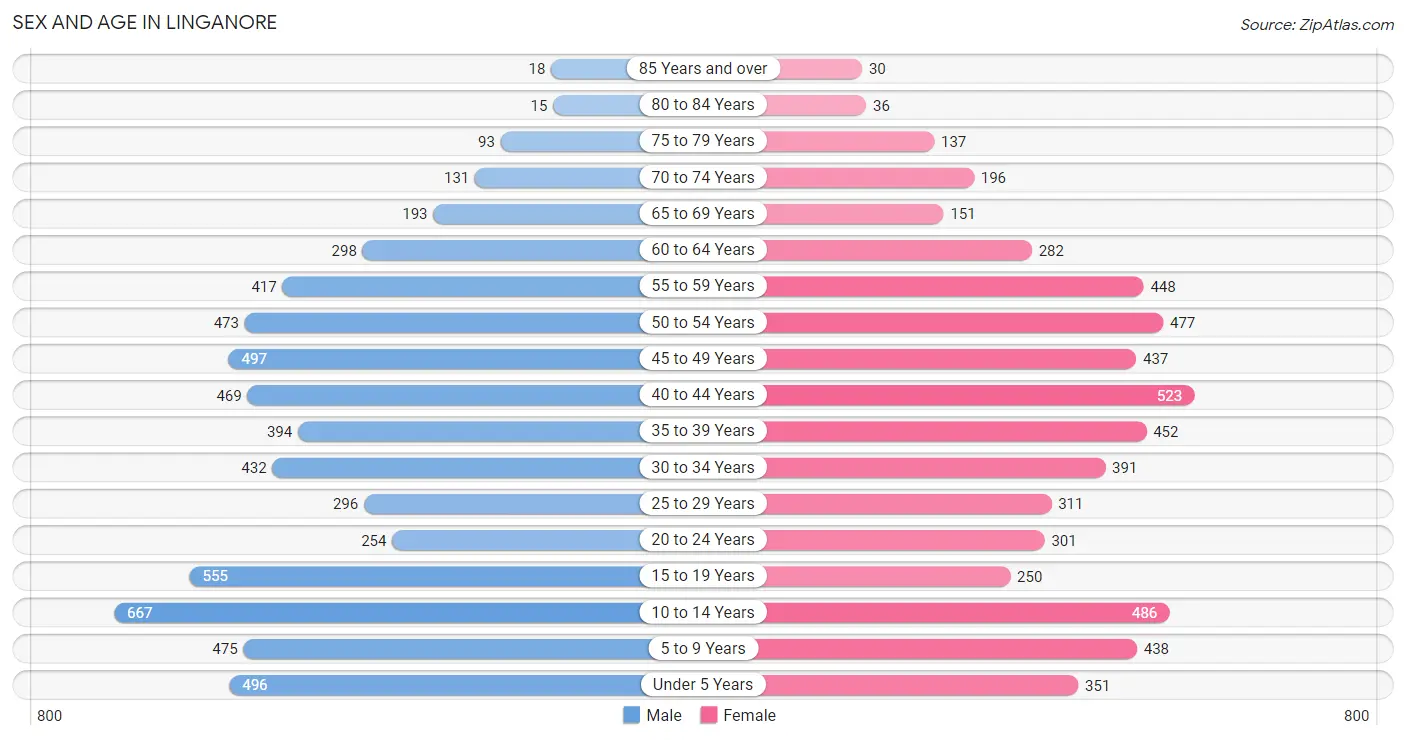
Sex and Age in Linganore
Sex and Age in Linganore
The most populous age groups in Linganore are 10 to 14 Years (667 | 10.8%) for men and 40 to 44 Years (523 | 9.2%) for women.
| Age Bracket | Male | Female |
| Under 5 Years | 496 (8.0%) | 351 (6.2%) |
| 5 to 9 Years | 475 (7.7%) | 438 (7.7%) |
| 10 to 14 Years | 667 (10.8%) | 486 (8.5%) |
| 15 to 19 Years | 555 (9.0%) | 250 (4.4%) |
| 20 to 24 Years | 254 (4.1%) | 301 (5.3%) |
| 25 to 29 Years | 296 (4.8%) | 311 (5.5%) |
| 30 to 34 Years | 432 (7.0%) | 391 (6.9%) |
| 35 to 39 Years | 394 (6.4%) | 452 (7.9%) |
| 40 to 44 Years | 469 (7.6%) | 523 (9.2%) |
| 45 to 49 Years | 497 (8.1%) | 437 (7.7%) |
| 50 to 54 Years | 473 (7.7%) | 477 (8.4%) |
| 55 to 59 Years | 417 (6.8%) | 448 (7.9%) |
| 60 to 64 Years | 298 (4.8%) | 282 (5.0%) |
| 65 to 69 Years | 193 (3.1%) | 151 (2.6%) |
| 70 to 74 Years | 131 (2.1%) | 196 (3.4%) |
| 75 to 79 Years | 93 (1.5%) | 137 (2.4%) |
| 80 to 84 Years | 15 (0.2%) | 36 (0.6%) |
| 85 Years and over | 18 (0.3%) | 30 (0.5%) |
| Total | 6,173 (100.0%) | 5,697 (100.0%) |
Families and Households in Linganore
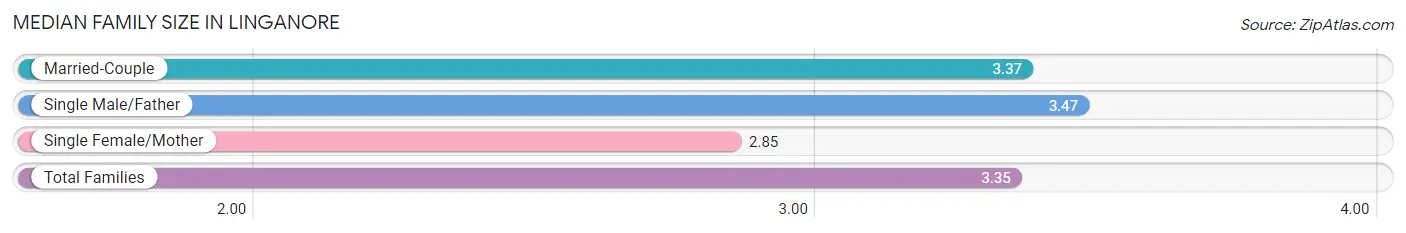
Median Family Size in Linganore
The median family size in Linganore is 3.35 persons per family, with single male/father families (96 | 3.0%) accounting for the largest median family size of 3.47 persons per family. On the other hand, single female/mother families (159 | 5.0%) represent the smallest median family size with 2.85 persons per family.
| Family Type | # Families | Family Size |
| Married-Couple | 2,943 (92.0%) | 3.37 |
| Single Male/Father | 96 (3.0%) | 3.47 |
| Single Female/Mother | 159 (5.0%) | 2.85 |
| Total Families | 3,198 (100.0%) | 3.35 |
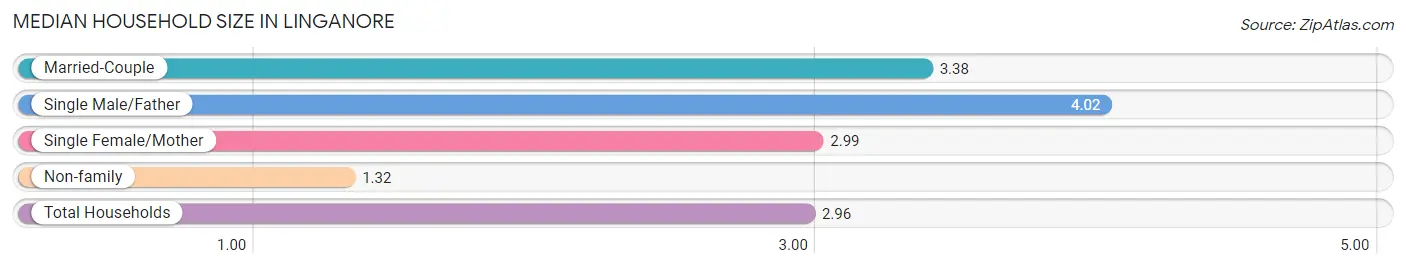
Median Household Size in Linganore
The median household size in Linganore is 2.96 persons per household, with single male/father households (96 | 2.4%) accounting for the largest median household size of 4.02 persons per household. non-family households (815 | 20.3%) represent the smallest median household size with 1.32 persons per household.
| Household Type | # Households | Household Size |
| Married-Couple | 2,943 (73.3%) | 3.38 |
| Single Male/Father | 96 (2.4%) | 4.02 |
| Single Female/Mother | 159 (4.0%) | 2.99 |
| Non-family | 815 (20.3%) | 1.32 |
| Total Households | 4,013 (100.0%) | 2.96 |
Household Size by Marriage Status in Linganore
Out of a total of 4,013 households in Linganore, 3,198 (79.7%) are family households, while 815 (20.3%) are nonfamily households. The most numerous type of family households are 2-person households, comprising 949, and the most common type of nonfamily households are 1-person households, comprising 608.
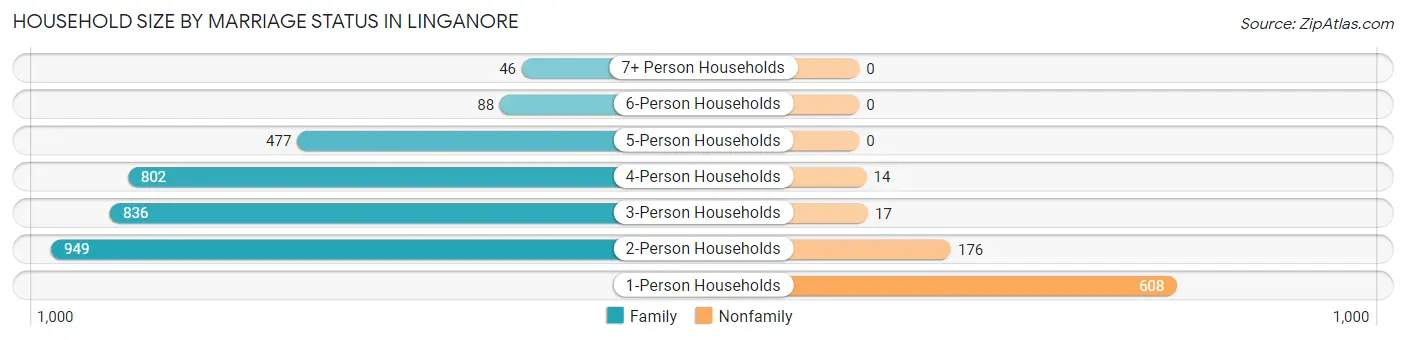
| Household Size | Family Households | Nonfamily Households |
| 1-Person Households | - | 608 (15.1%) |
| 2-Person Households | 949 (23.6%) | 176 (4.4%) |
| 3-Person Households | 836 (20.8%) | 17 (0.4%) |
| 4-Person Households | 802 (20.0%) | 14 (0.4%) |
| 5-Person Households | 477 (11.9%) | 0 (0.0%) |
| 6-Person Households | 88 (2.2%) | 0 (0.0%) |
| 7+ Person Households | 46 (1.1%) | 0 (0.0%) |
| Total | 3,198 (79.7%) | 815 (20.3%) |
Female Fertility in Linganore
Fertility by Age in Linganore
Average fertility rate in Linganore is 90.0 births per 1,000 women. Women in the age bracket of 20 to 34 years have the highest fertility rate with 170.0 births per 1,000 women. Women in the age bracket of 20 to 34 years acount for 69.2% of all women with births.
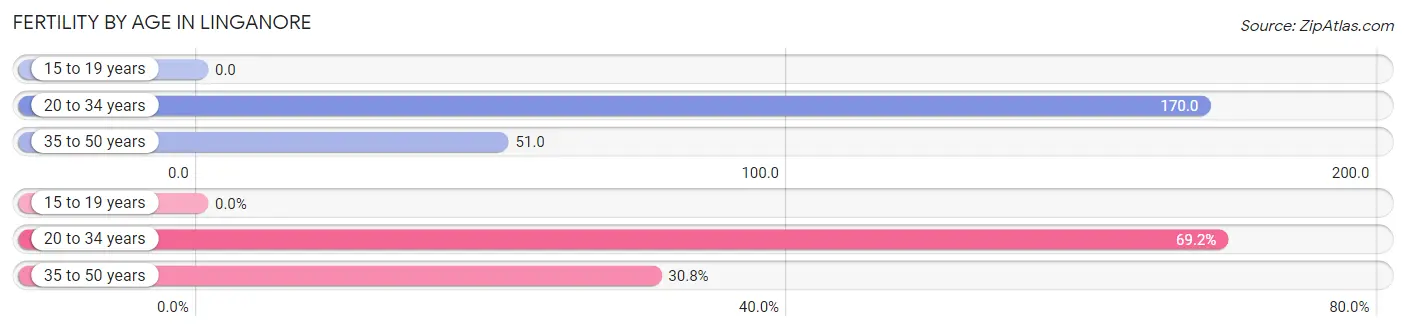
| Age Bracket | Women with Births | Births / 1,000 Women |
| 15 to 19 years | 0 (0.0%) | 0.0 |
| 20 to 34 years | 171 (69.2%) | 170.0 |
| 35 to 50 years | 76 (30.8%) | 51.0 |
| Total | 247 (100.0%) | 90.0 |
Fertility by Age by Marriage Status in Linganore
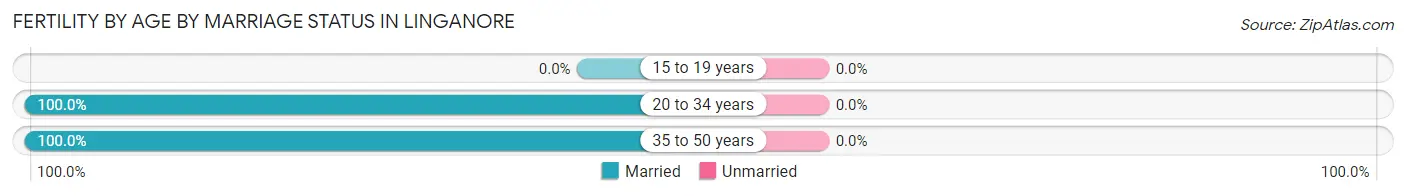
| Age Bracket | Married | Unmarried |
| 15 to 19 years | 0 (0.0%) | 0 (0.0%) |
| 20 to 34 years | 171 (100.0%) | 0 (0.0%) |
| 35 to 50 years | 76 (100.0%) | 0 (0.0%) |
| Total | 247 (100.0%) | 0 (0.0%) |
Fertility by Education in Linganore
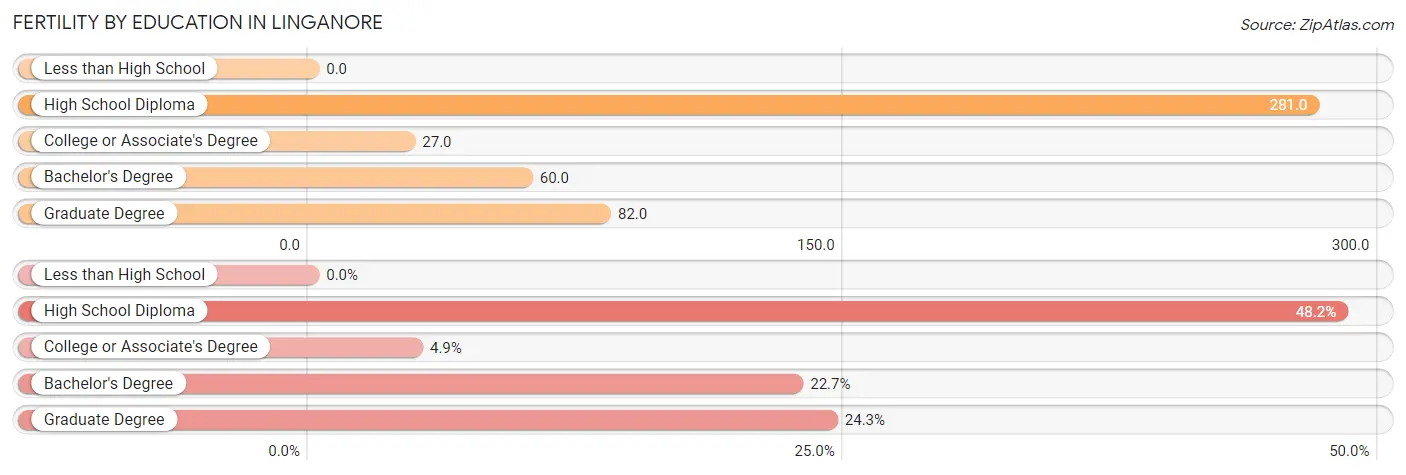
| Educational Attainment | Women with Births | Births / 1,000 Women |
| Less than High School | 0 (0.0%) | 0.0 |
| High School Diploma | 119 (48.2%) | 281.0 |
| College or Associate's Degree | 12 (4.9%) | 27.0 |
| Bachelor's Degree | 56 (22.7%) | 60.0 |
| Graduate Degree | 60 (24.3%) | 82.0 |
| Total | 247 (100.0%) | 90.0 |
Fertility by Education by Marriage Status in Linganore
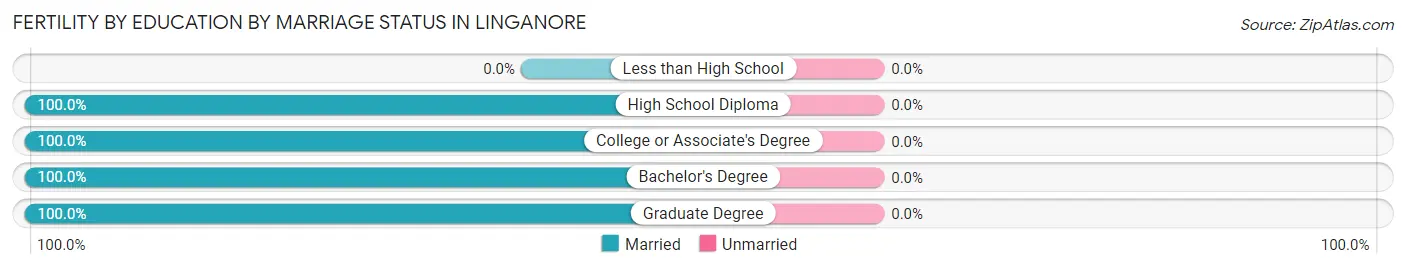
| Educational Attainment | Married | Unmarried |
| Less than High School | 0 (0.0%) | 0 (0.0%) |
| High School Diploma | 119 (100.0%) | 0 (0.0%) |
| College or Associate's Degree | 12 (100.0%) | 0 (0.0%) |
| Bachelor's Degree | 56 (100.0%) | 0 (0.0%) |
| Graduate Degree | 60 (100.0%) | 0 (0.0%) |
| Total | 247 (100.0%) | 0 (0.0%) |
Employment Characteristics in Linganore
Employment by Class of Employer in Linganore
Among the 6,433 employed individuals in Linganore, private company employees (3,916 | 60.9%), local government employees (791 | 12.3%), and federal government employees (630 | 9.8%) make up the most common classes of employment.
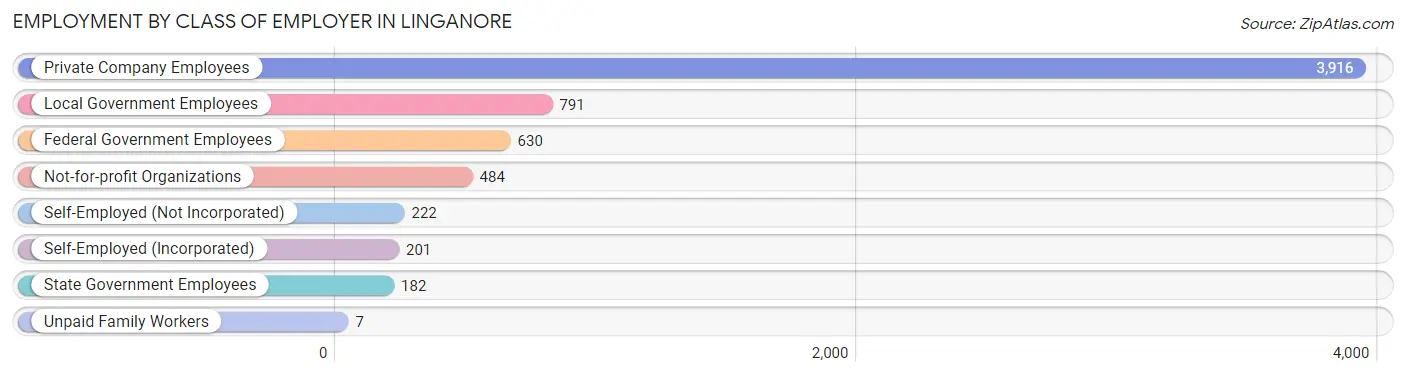
| Employer Class | # Employees | % Employees |
| Private Company Employees | 3,916 | 60.9% |
| Self-Employed (Incorporated) | 201 | 3.1% |
| Self-Employed (Not Incorporated) | 222 | 3.5% |
| Not-for-profit Organizations | 484 | 7.5% |
| Local Government Employees | 791 | 12.3% |
| State Government Employees | 182 | 2.8% |
| Federal Government Employees | 630 | 9.8% |
| Unpaid Family Workers | 7 | 0.1% |
| Total | 6,433 | 100.0% |
Employment Status by Age in Linganore
According to the labor force statistics for Linganore, out of the total population over 16 years of age (8,744), 75.9% or 6,637 individuals are in the labor force, with 2.6% or 173 of them unemployed. The age group with the highest labor force participation rate is 30 to 34 years, with 92.3% or 760 individuals in the labor force. Within the labor force, the 65 to 74 years age range has the highest percentage of unemployed individuals, with 11.0% or 21 of them being unemployed.
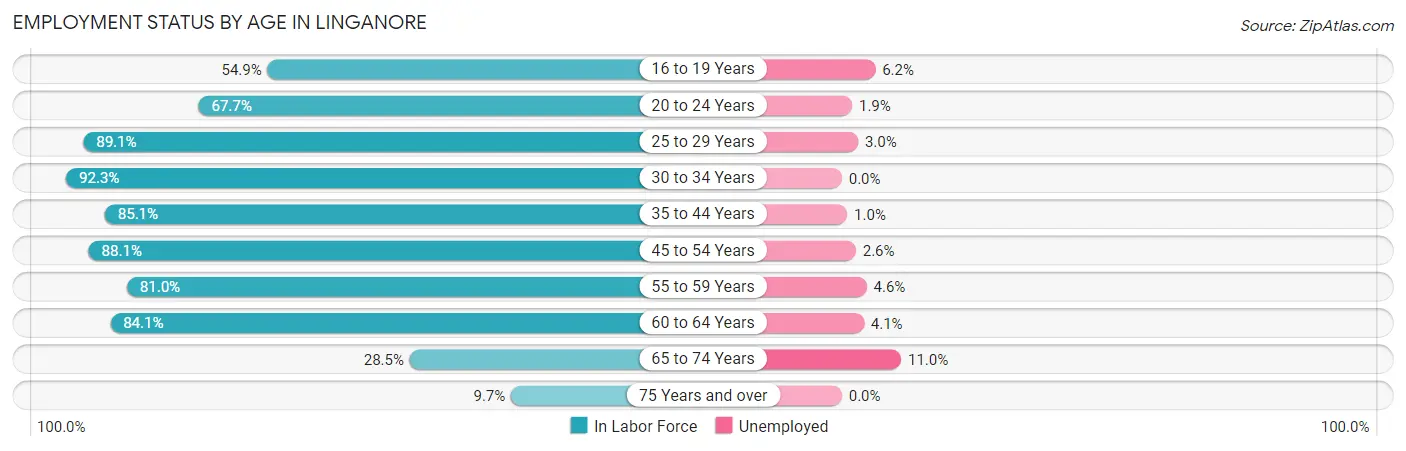
| Age Bracket | In Labor Force | Unemployed |
| 16 to 19 Years | 325 (54.9%) | 20 (6.2%) |
| 20 to 24 Years | 376 (67.7%) | 7 (1.9%) |
| 25 to 29 Years | 541 (89.1%) | 16 (3.0%) |
| 30 to 34 Years | 760 (92.3%) | 0 (0.0%) |
| 35 to 44 Years | 1,564 (85.1%) | 16 (1.0%) |
| 45 to 54 Years | 1,660 (88.1%) | 43 (2.6%) |
| 55 to 59 Years | 701 (81.0%) | 32 (4.6%) |
| 60 to 64 Years | 488 (84.1%) | 20 (4.1%) |
| 65 to 74 Years | 191 (28.5%) | 21 (11.0%) |
| 75 Years and over | 32 (9.7%) | 0 (0.0%) |
| Total | 6,637 (75.9%) | 173 (2.6%) |
Employment Status by Educational Attainment in Linganore
According to labor force statistics for Linganore, 86.6% of individuals (5,713) out of the total population between 25 and 64 years of age (6,597) are in the labor force, with 2.2% or 126 of them being unemployed. The group with the highest labor force participation rate are those with the educational attainment of bachelor's degree or higher, with 89.0% or 3,560 individuals in the labor force. Within the labor force, individuals with bachelor's degree or higher education have the highest percentage of unemployment, with 2.3% or 82 of them being unemployed.
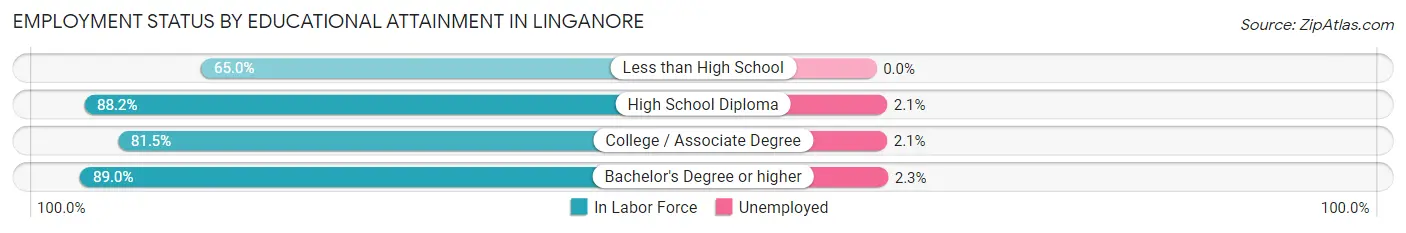
| Educational Attainment | In Labor Force | Unemployed |
| Less than High School | 80 (65.0%) | 0 (0.0%) |
| High School Diploma | 760 (88.2%) | 18 (2.1%) |
| College / Associate Degree | 1,314 (81.5%) | 34 (2.1%) |
| Bachelor's Degree or higher | 3,560 (89.0%) | 92 (2.3%) |
| Total | 5,713 (86.6%) | 145 (2.2%) |
Employment Occupations by Sex in Linganore
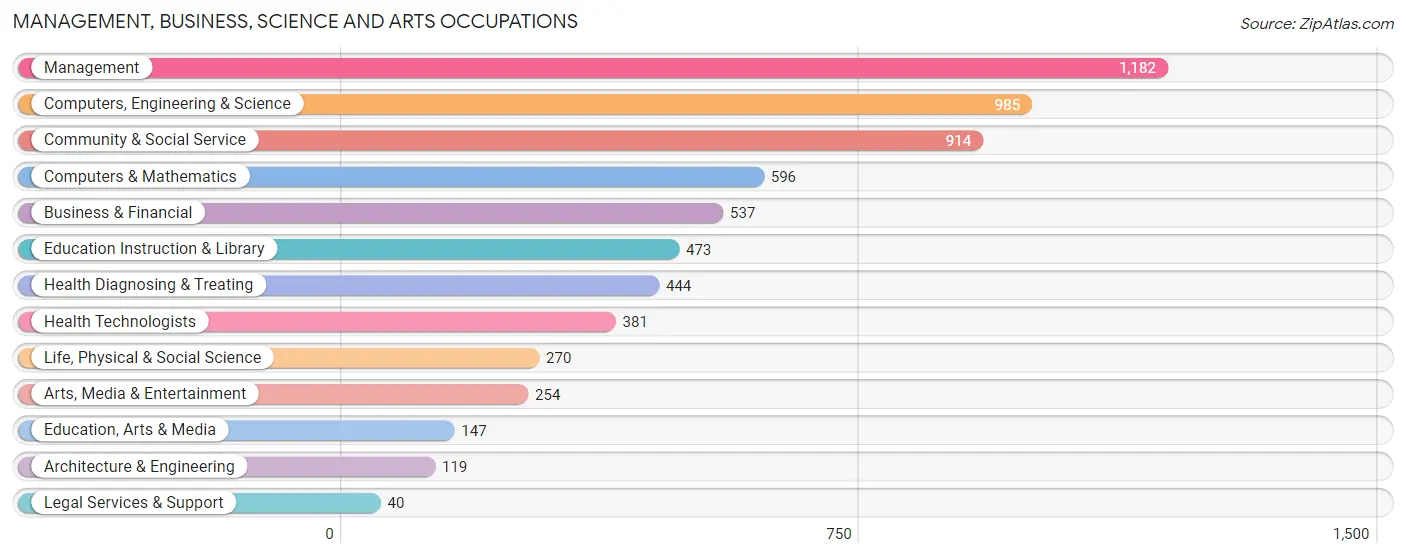
Management, Business, Science and Arts Occupations
The most common Management, Business, Science and Arts occupations in Linganore are Management (1,182 | 18.4%), Computers, Engineering & Science (985 | 15.4%), Community & Social Service (914 | 14.3%), Computers & Mathematics (596 | 9.3%), and Business & Financial (537 | 8.4%).
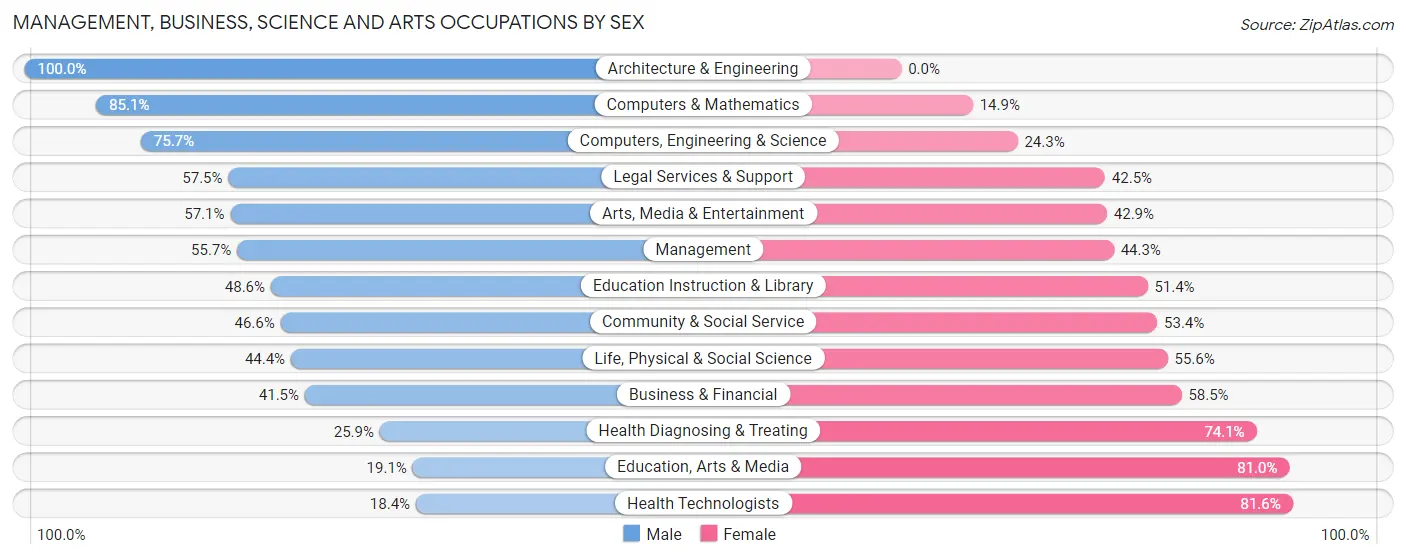
Management, Business, Science and Arts Occupations by Sex
Within the Management, Business, Science and Arts occupations in Linganore, the most male-oriented occupations are Architecture & Engineering (100.0%), Computers & Mathematics (85.1%), and Computers, Engineering & Science (75.7%), while the most female-oriented occupations are Health Technologists (81.6%), Education, Arts & Media (80.9%), and Health Diagnosing & Treating (74.1%).
| Occupation | Male | Female |
| Management | 658 (55.7%) | 524 (44.3%) |
| Business & Financial | 223 (41.5%) | 314 (58.5%) |
| Computers, Engineering & Science | 746 (75.7%) | 239 (24.3%) |
| Computers & Mathematics | 507 (85.1%) | 89 (14.9%) |
| Architecture & Engineering | 119 (100.0%) | 0 (0.0%) |
| Life, Physical & Social Science | 120 (44.4%) | 150 (55.6%) |
| Community & Social Service | 426 (46.6%) | 488 (53.4%) |
| Education, Arts & Media | 28 (19.1%) | 119 (80.9%) |
| Legal Services & Support | 23 (57.5%) | 17 (42.5%) |
| Education Instruction & Library | 230 (48.6%) | 243 (51.4%) |
| Arts, Media & Entertainment | 145 (57.1%) | 109 (42.9%) |
| Health Diagnosing & Treating | 115 (25.9%) | 329 (74.1%) |
| Health Technologists | 70 (18.4%) | 311 (81.6%) |
| Total (Category) | 2,168 (53.4%) | 1,894 (46.6%) |
| Total (Overall) | 3,572 (55.7%) | 2,838 (44.3%) |
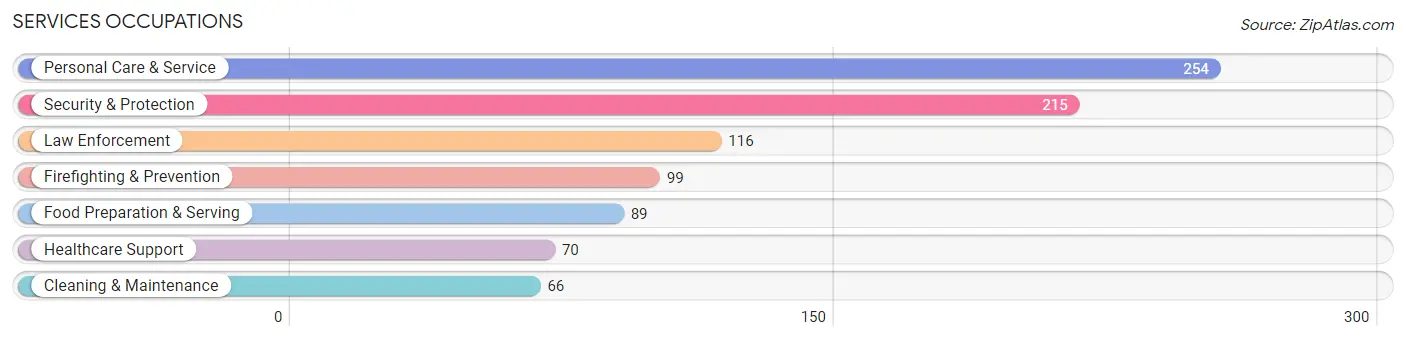
Services Occupations
The most common Services occupations in Linganore are Personal Care & Service (254 | 4.0%), Security & Protection (215 | 3.4%), Law Enforcement (116 | 1.8%), Firefighting & Prevention (99 | 1.5%), and Food Preparation & Serving (89 | 1.4%).
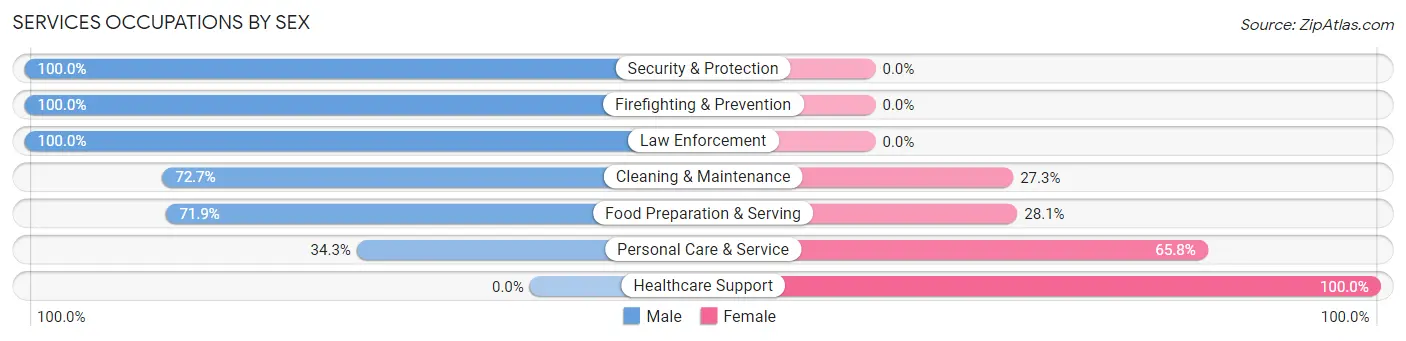
Services Occupations by Sex
Within the Services occupations in Linganore, the most male-oriented occupations are Security & Protection (100.0%), Firefighting & Prevention (100.0%), and Law Enforcement (100.0%), while the most female-oriented occupations are Healthcare Support (100.0%), Personal Care & Service (65.7%), and Food Preparation & Serving (28.1%).
| Occupation | Male | Female |
| Healthcare Support | 0 (0.0%) | 70 (100.0%) |
| Security & Protection | 215 (100.0%) | 0 (0.0%) |
| Firefighting & Prevention | 99 (100.0%) | 0 (0.0%) |
| Law Enforcement | 116 (100.0%) | 0 (0.0%) |
| Food Preparation & Serving | 64 (71.9%) | 25 (28.1%) |
| Cleaning & Maintenance | 48 (72.7%) | 18 (27.3%) |
| Personal Care & Service | 87 (34.3%) | 167 (65.7%) |
| Total (Category) | 414 (59.7%) | 280 (40.4%) |
| Total (Overall) | 3,572 (55.7%) | 2,838 (44.3%) |
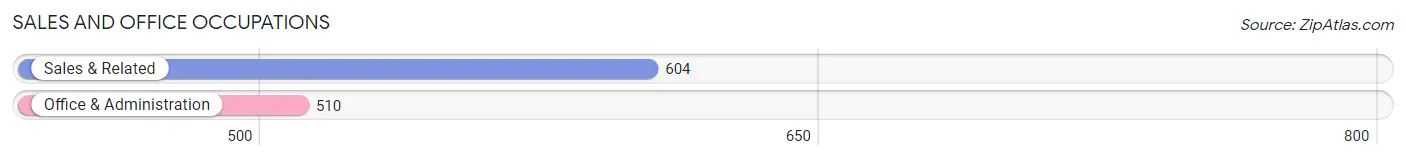
Sales and Office Occupations
The most common Sales and Office occupations in Linganore are Sales & Related (604 | 9.4%), and Office & Administration (510 | 8.0%).
Sales and Office Occupations by Sex
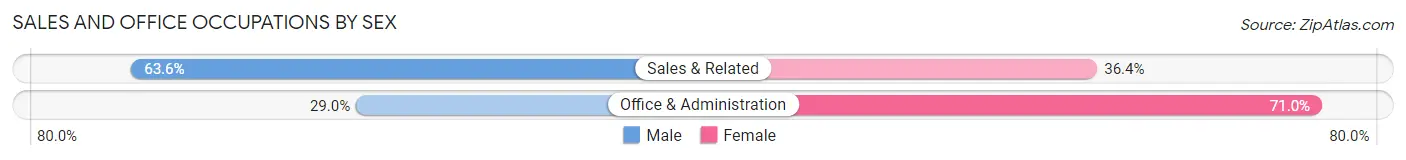
| Occupation | Male | Female |
| Sales & Related | 384 (63.6%) | 220 (36.4%) |
| Office & Administration | 148 (29.0%) | 362 (71.0%) |
| Total (Category) | 532 (47.8%) | 582 (52.2%) |
| Total (Overall) | 3,572 (55.7%) | 2,838 (44.3%) |
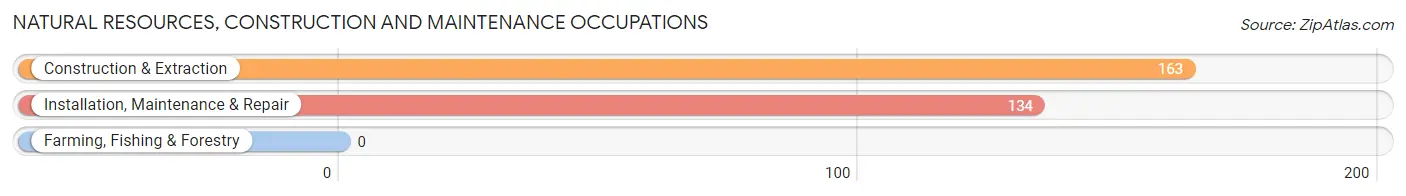
Natural Resources, Construction and Maintenance Occupations
The most common Natural Resources, Construction and Maintenance occupations in Linganore are Construction & Extraction (163 | 2.5%), and Installation, Maintenance & Repair (134 | 2.1%).
Natural Resources, Construction and Maintenance Occupations by Sex
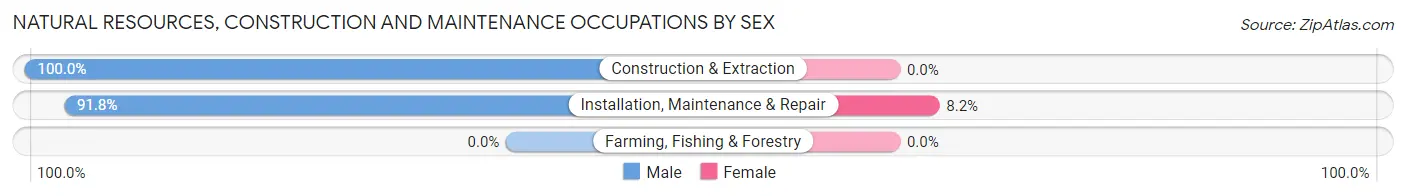
| Occupation | Male | Female |
| Farming, Fishing & Forestry | 0 (0.0%) | 0 (0.0%) |
| Construction & Extraction | 163 (100.0%) | 0 (0.0%) |
| Installation, Maintenance & Repair | 123 (91.8%) | 11 (8.2%) |
| Total (Category) | 286 (96.3%) | 11 (3.7%) |
| Total (Overall) | 3,572 (55.7%) | 2,838 (44.3%) |
Production, Transportation and Moving Occupations
The most common Production, Transportation and Moving occupations in Linganore are Transportation (99 | 1.5%), Production (82 | 1.3%), and Material Moving (62 | 1.0%).
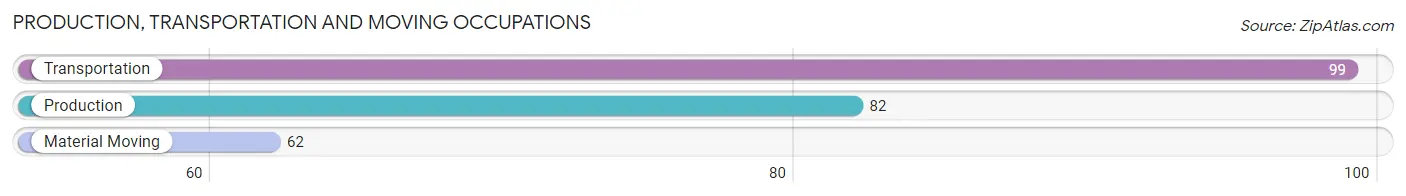
Production, Transportation and Moving Occupations by Sex
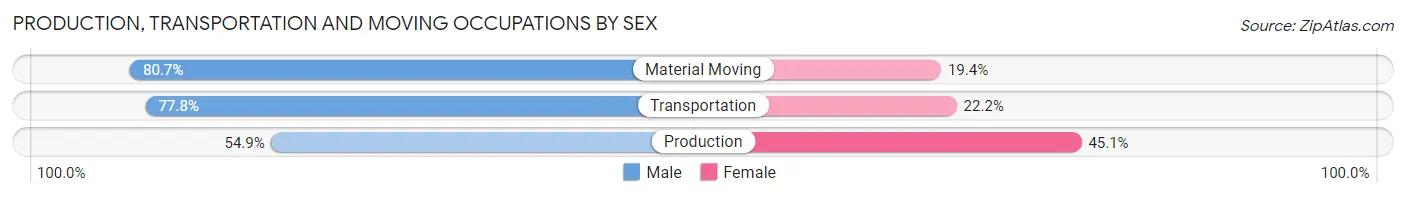
| Occupation | Male | Female |
| Production | 45 (54.9%) | 37 (45.1%) |
| Transportation | 77 (77.8%) | 22 (22.2%) |
| Material Moving | 50 (80.6%) | 12 (19.4%) |
| Total (Category) | 172 (70.8%) | 71 (29.2%) |
| Total (Overall) | 3,572 (55.7%) | 2,838 (44.3%) |
Employment Industries by Sex in Linganore
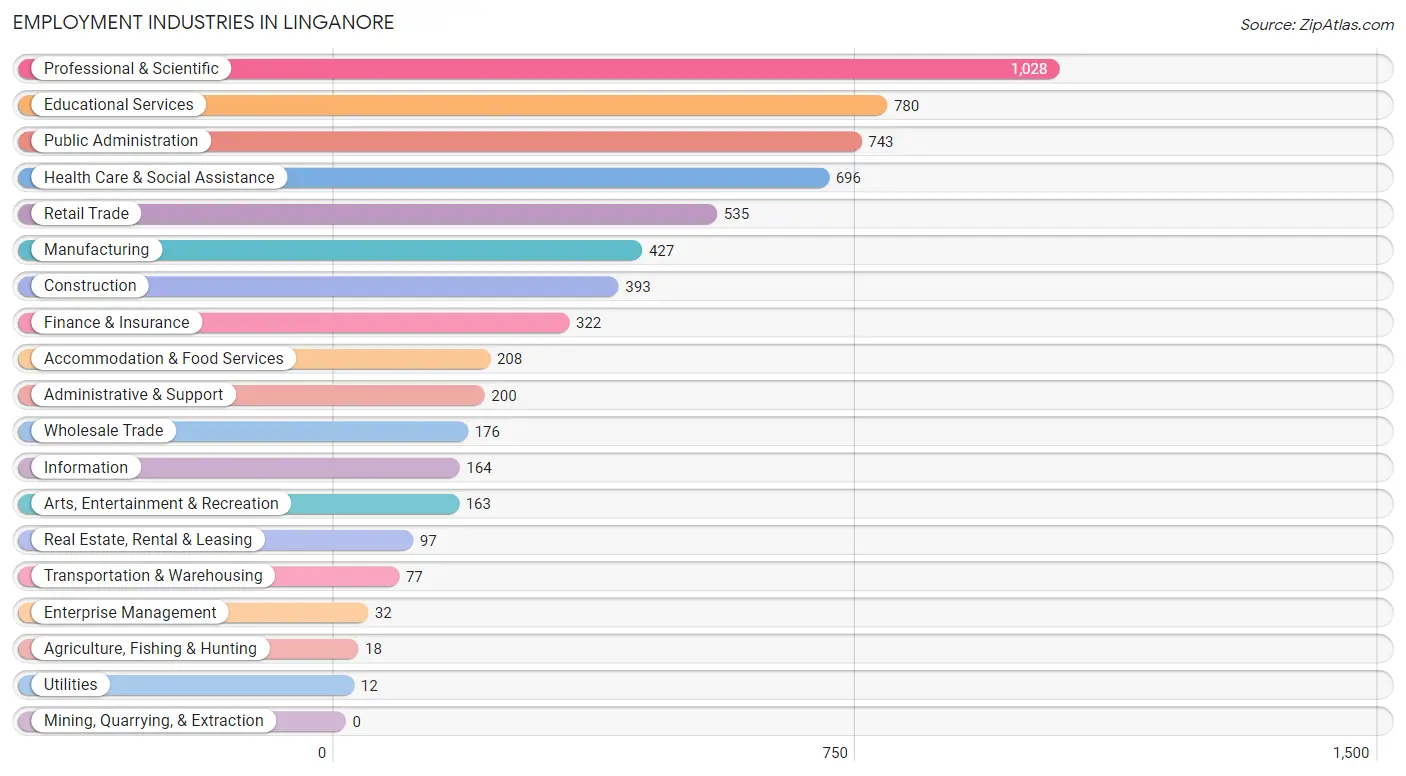
Employment Industries in Linganore
The major employment industries in Linganore include Professional & Scientific (1,028 | 16.0%), Educational Services (780 | 12.2%), Public Administration (743 | 11.6%), Health Care & Social Assistance (696 | 10.9%), and Retail Trade (535 | 8.4%).
Employment Industries by Sex in Linganore
The Linganore industries that see more men than women are Wholesale Trade (94.9%), Transportation & Warehousing (88.3%), and Information (87.2%), whereas the industries that tend to have a higher number of women are Agriculture, Fishing & Hunting (100.0%), Enterprise Management (100.0%), and Health Care & Social Assistance (80.6%).
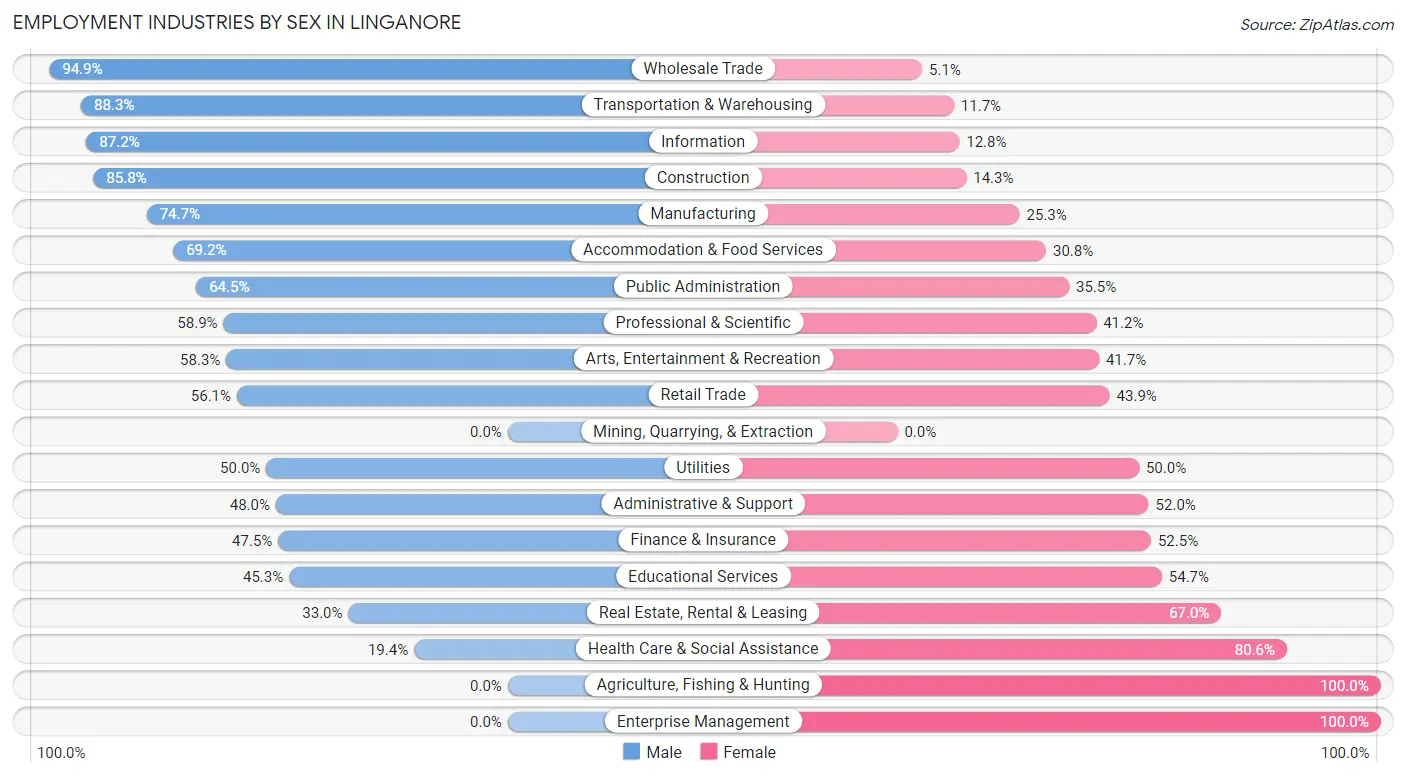
| Industry | Male | Female |
| Agriculture, Fishing & Hunting | 0 (0.0%) | 18 (100.0%) |
| Mining, Quarrying, & Extraction | 0 (0.0%) | 0 (0.0%) |
| Construction | 337 (85.8%) | 56 (14.2%) |
| Manufacturing | 319 (74.7%) | 108 (25.3%) |
| Wholesale Trade | 167 (94.9%) | 9 (5.1%) |
| Retail Trade | 300 (56.1%) | 235 (43.9%) |
| Transportation & Warehousing | 68 (88.3%) | 9 (11.7%) |
| Utilities | 6 (50.0%) | 6 (50.0%) |
| Information | 143 (87.2%) | 21 (12.8%) |
| Finance & Insurance | 153 (47.5%) | 169 (52.5%) |
| Real Estate, Rental & Leasing | 32 (33.0%) | 65 (67.0%) |
| Professional & Scientific | 605 (58.9%) | 423 (41.1%) |
| Enterprise Management | 0 (0.0%) | 32 (100.0%) |
| Administrative & Support | 96 (48.0%) | 104 (52.0%) |
| Educational Services | 353 (45.3%) | 427 (54.7%) |
| Health Care & Social Assistance | 135 (19.4%) | 561 (80.6%) |
| Arts, Entertainment & Recreation | 95 (58.3%) | 68 (41.7%) |
| Accommodation & Food Services | 144 (69.2%) | 64 (30.8%) |
| Public Administration | 479 (64.5%) | 264 (35.5%) |
| Total | 3,572 (55.7%) | 2,838 (44.3%) |
Education in Linganore
School Enrollment in Linganore
The most common levels of schooling among the 3,303 students in Linganore are middle school (962 | 29.1%), high school (780 | 23.6%), and elementary school (573 | 17.3%).
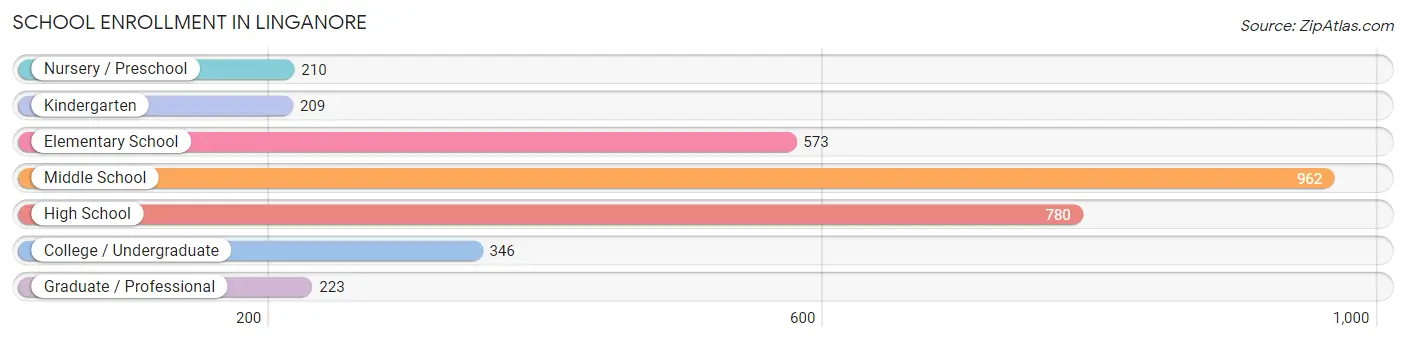
| School Level | # Students | % Students |
| Nursery / Preschool | 210 | 6.4% |
| Kindergarten | 209 | 6.3% |
| Elementary School | 573 | 17.3% |
| Middle School | 962 | 29.1% |
| High School | 780 | 23.6% |
| College / Undergraduate | 346 | 10.5% |
| Graduate / Professional | 223 | 6.8% |
| Total | 3,303 | 100.0% |
School Enrollment by Age by Funding Source in Linganore
Out of a total of 3,303 students who are enrolled in schools in Linganore, 575 (17.4%) attend a private institution, while the remaining 2,728 (82.6%) are enrolled in public schools. The age group of 20 to 24 year olds has the highest likelihood of being enrolled in private schools, with 140 (75.3% in the age bracket) enrolled. Conversely, the age group of 15 to 17 year olds has the lowest likelihood of being enrolled in a private school, with 482 (92.2% in the age bracket) attending a public institution.
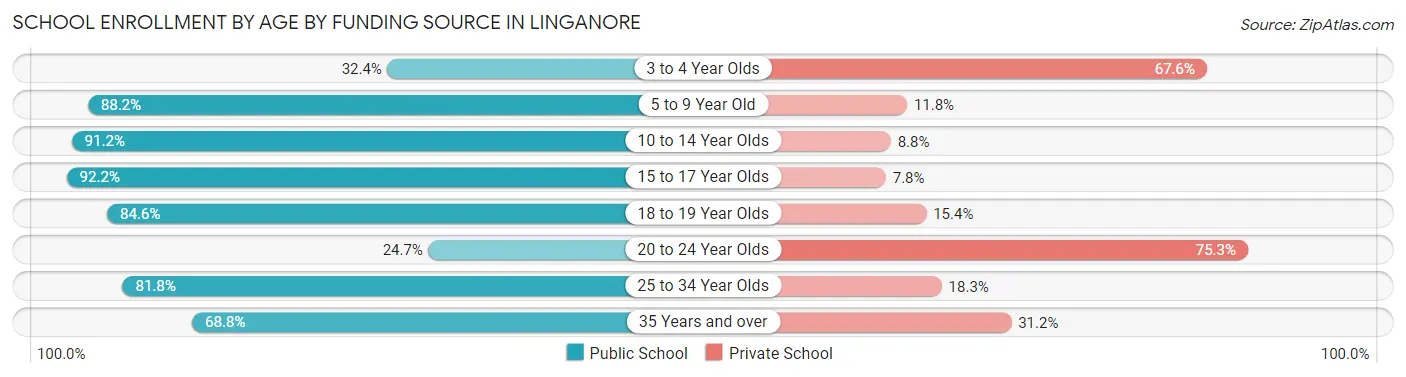
| Age Bracket | Public School | Private School |
| 3 to 4 Year Olds | 45 (32.4%) | 94 (67.6%) |
| 5 to 9 Year Old | 718 (88.2%) | 96 (11.8%) |
| 10 to 14 Year Olds | 1,040 (91.2%) | 100 (8.8%) |
| 15 to 17 Year Olds | 482 (92.2%) | 41 (7.8%) |
| 18 to 19 Year Olds | 198 (84.6%) | 36 (15.4%) |
| 20 to 24 Year Olds | 46 (24.7%) | 140 (75.3%) |
| 25 to 34 Year Olds | 103 (81.8%) | 23 (18.2%) |
| 35 Years and over | 97 (68.8%) | 44 (31.2%) |
| Total | 2,728 (82.6%) | 575 (17.4%) |
Educational Attainment by Field of Study in Linganore
Business (961 | 20.2%), computers & mathematics (398 | 8.4%), bio, nature & agricultural (390 | 8.2%), education (358 | 7.5%), and arts & humanities (348 | 7.3%) are the most common fields of study among 4,749 individuals in Linganore who have obtained a bachelor's degree or higher.
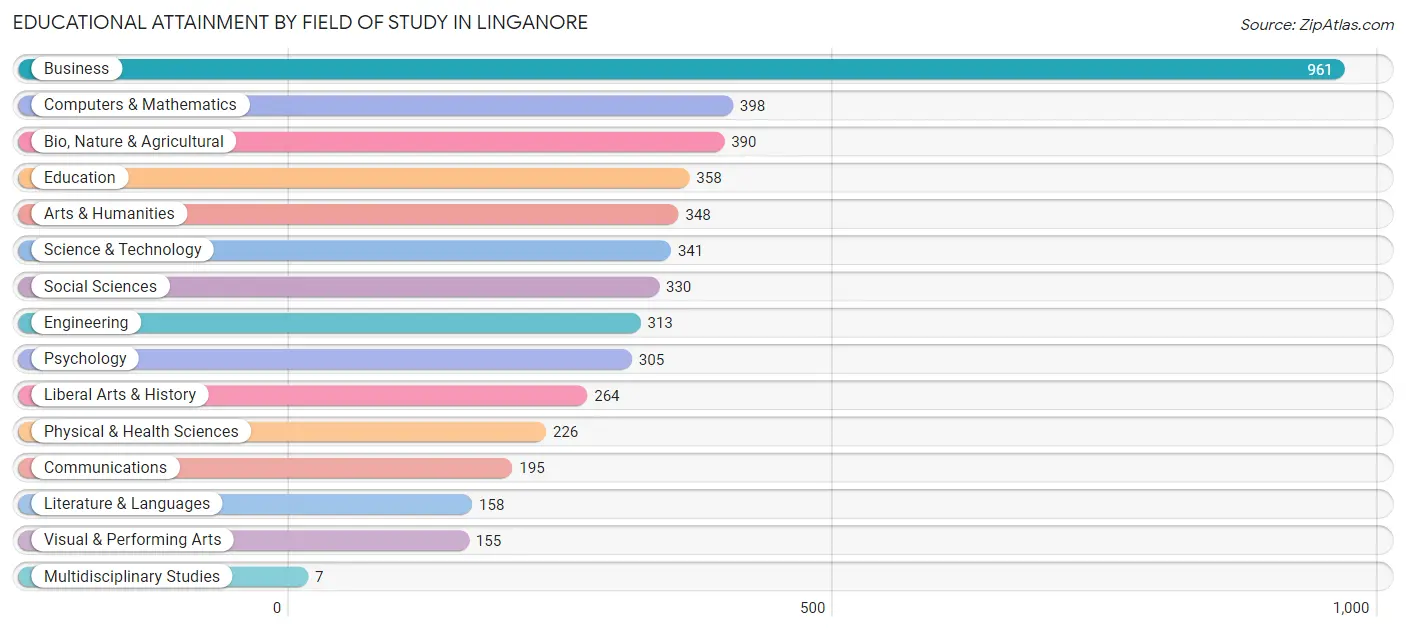
| Field of Study | # Graduates | % Graduates |
| Computers & Mathematics | 398 | 8.4% |
| Bio, Nature & Agricultural | 390 | 8.2% |
| Physical & Health Sciences | 226 | 4.8% |
| Psychology | 305 | 6.4% |
| Social Sciences | 330 | 7.0% |
| Engineering | 313 | 6.6% |
| Multidisciplinary Studies | 7 | 0.2% |
| Science & Technology | 341 | 7.2% |
| Business | 961 | 20.2% |
| Education | 358 | 7.5% |
| Literature & Languages | 158 | 3.3% |
| Liberal Arts & History | 264 | 5.6% |
| Visual & Performing Arts | 155 | 3.3% |
| Communications | 195 | 4.1% |
| Arts & Humanities | 348 | 7.3% |
| Total | 4,749 | 100.0% |
Transportation & Commute in Linganore
Vehicle Availability by Sex in Linganore
The most prevalent vehicle ownership categories in Linganore are males with 2 vehicles (1,859, accounting for 51.4%) and females with 2 vehicles (1,439, making up 66.0%).
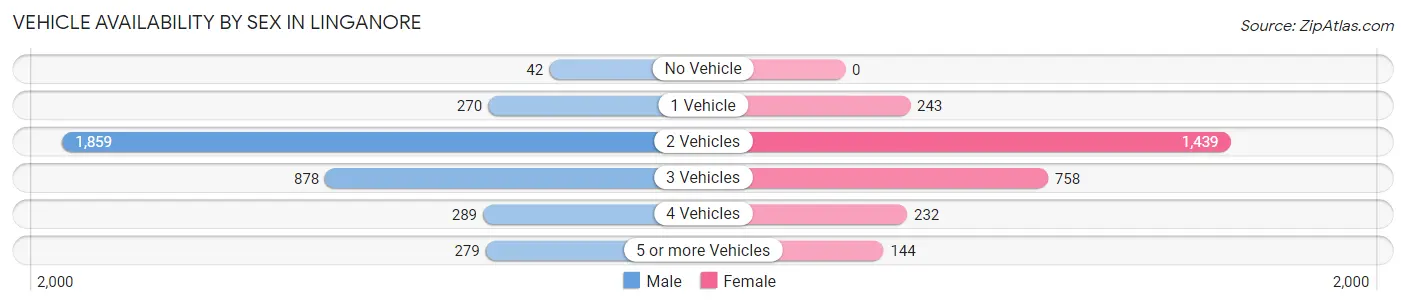
| Vehicles Available | Male | Female |
| No Vehicle | 42 (1.2%) | 0 (0.0%) |
| 1 Vehicle | 270 (7.5%) | 243 (8.6%) |
| 2 Vehicles | 1,859 (51.4%) | 1,439 (51.1%) |
| 3 Vehicles | 878 (24.3%) | 758 (26.9%) |
| 4 Vehicles | 289 (8.0%) | 232 (8.2%) |
| 5 or more Vehicles | 279 (7.7%) | 144 (5.1%) |
| Total | 3,617 (100.0%) | 2,816 (100.0%) |
Commute Time in Linganore
The most frequently occuring commute durations in Linganore are 45 to 59 minutes (1,019 commuters, 20.5%), 60 to 89 minutes (934 commuters, 18.8%), and 20 to 24 minutes (639 commuters, 12.9%).
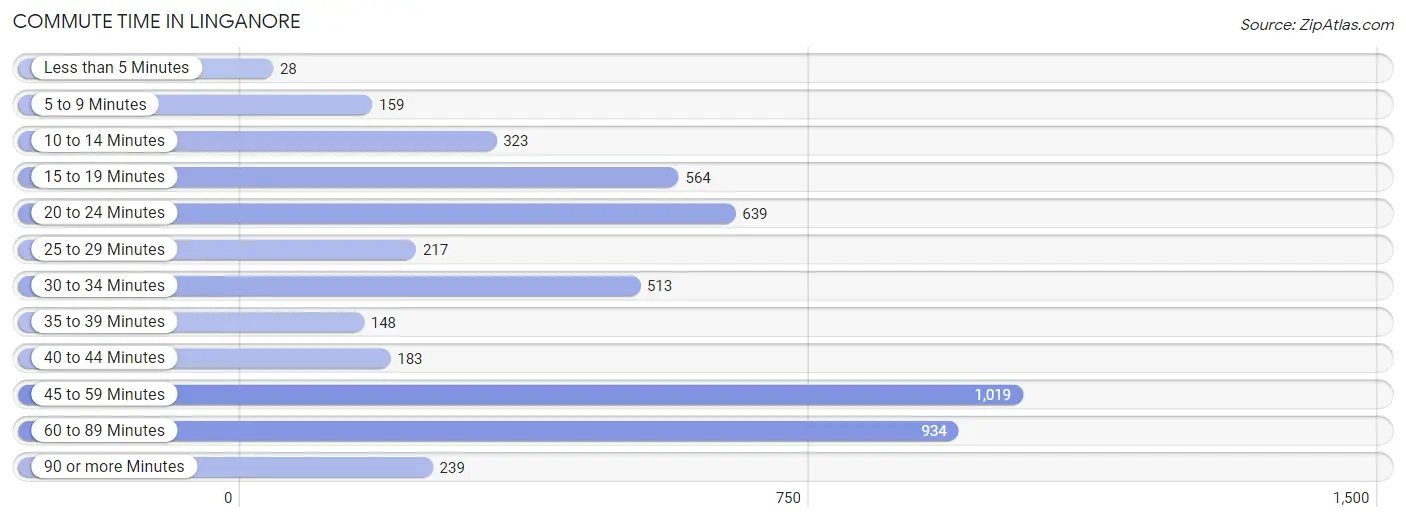
| Commute Time | # Commuters | % Commuters |
| Less than 5 Minutes | 28 | 0.6% |
| 5 to 9 Minutes | 159 | 3.2% |
| 10 to 14 Minutes | 323 | 6.5% |
| 15 to 19 Minutes | 564 | 11.4% |
| 20 to 24 Minutes | 639 | 12.9% |
| 25 to 29 Minutes | 217 | 4.4% |
| 30 to 34 Minutes | 513 | 10.3% |
| 35 to 39 Minutes | 148 | 3.0% |
| 40 to 44 Minutes | 183 | 3.7% |
| 45 to 59 Minutes | 1,019 | 20.5% |
| 60 to 89 Minutes | 934 | 18.8% |
| 90 or more Minutes | 239 | 4.8% |
Commute Time by Sex in Linganore
The most common commute times in Linganore are 60 to 89 minutes (746 commuters, 25.3%) for males and 45 to 59 minutes (383 commuters, 19.0%) for females.
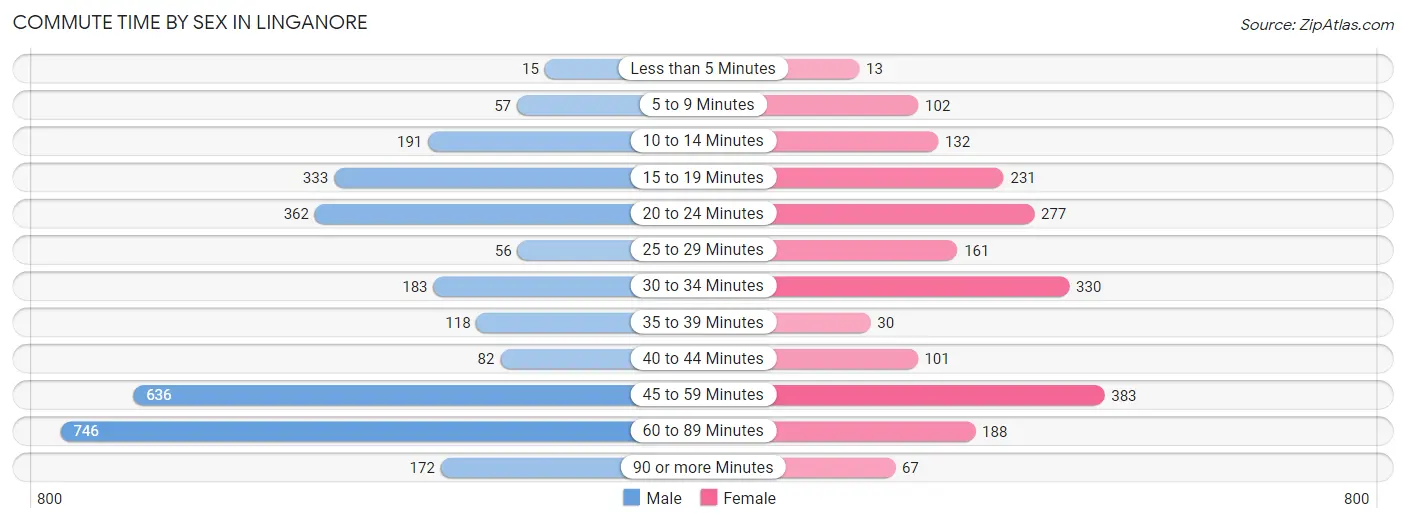
| Commute Time | Male | Female |
| Less than 5 Minutes | 15 (0.5%) | 13 (0.6%) |
| 5 to 9 Minutes | 57 (1.9%) | 102 (5.1%) |
| 10 to 14 Minutes | 191 (6.5%) | 132 (6.6%) |
| 15 to 19 Minutes | 333 (11.3%) | 231 (11.5%) |
| 20 to 24 Minutes | 362 (12.3%) | 277 (13.8%) |
| 25 to 29 Minutes | 56 (1.9%) | 161 (8.0%) |
| 30 to 34 Minutes | 183 (6.2%) | 330 (16.4%) |
| 35 to 39 Minutes | 118 (4.0%) | 30 (1.5%) |
| 40 to 44 Minutes | 82 (2.8%) | 101 (5.0%) |
| 45 to 59 Minutes | 636 (21.5%) | 383 (19.0%) |
| 60 to 89 Minutes | 746 (25.3%) | 188 (9.3%) |
| 90 or more Minutes | 172 (5.8%) | 67 (3.3%) |
Time of Departure to Work by Sex in Linganore
The most frequent times of departure to work in Linganore are 7:00 AM to 7:29 AM (412, 14.0%) for males and 7:30 AM to 7:59 AM (327, 16.2%) for females.
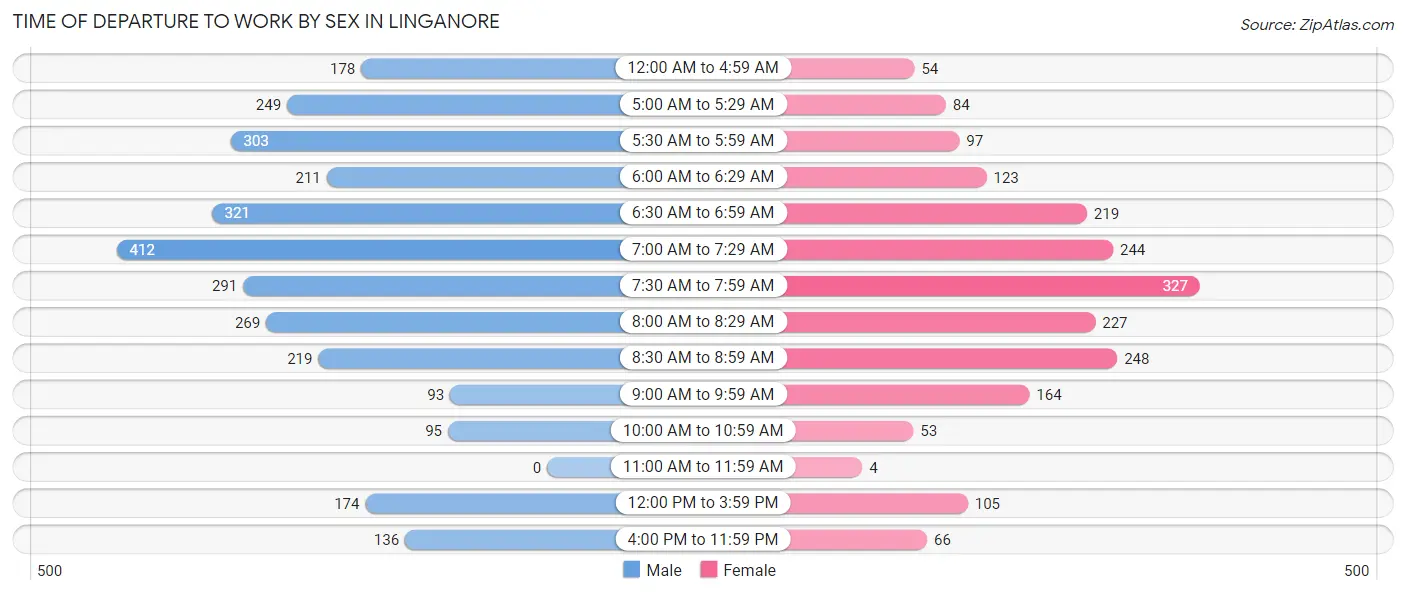
| Time of Departure | Male | Female |
| 12:00 AM to 4:59 AM | 178 (6.0%) | 54 (2.7%) |
| 5:00 AM to 5:29 AM | 249 (8.4%) | 84 (4.2%) |
| 5:30 AM to 5:59 AM | 303 (10.3%) | 97 (4.8%) |
| 6:00 AM to 6:29 AM | 211 (7.1%) | 123 (6.1%) |
| 6:30 AM to 6:59 AM | 321 (10.9%) | 219 (10.9%) |
| 7:00 AM to 7:29 AM | 412 (14.0%) | 244 (12.1%) |
| 7:30 AM to 7:59 AM | 291 (9.9%) | 327 (16.2%) |
| 8:00 AM to 8:29 AM | 269 (9.1%) | 227 (11.3%) |
| 8:30 AM to 8:59 AM | 219 (7.4%) | 248 (12.3%) |
| 9:00 AM to 9:59 AM | 93 (3.2%) | 164 (8.1%) |
| 10:00 AM to 10:59 AM | 95 (3.2%) | 53 (2.6%) |
| 11:00 AM to 11:59 AM | 0 (0.0%) | 4 (0.2%) |
| 12:00 PM to 3:59 PM | 174 (5.9%) | 105 (5.2%) |
| 4:00 PM to 11:59 PM | 136 (4.6%) | 66 (3.3%) |
| Total | 2,951 (100.0%) | 2,015 (100.0%) |
Housing Occupancy in Linganore
Occupancy by Ownership in Linganore
Of the total 4,013 dwellings in Linganore, owner-occupied units account for 3,794 (94.5%), while renter-occupied units make up 219 (5.5%).
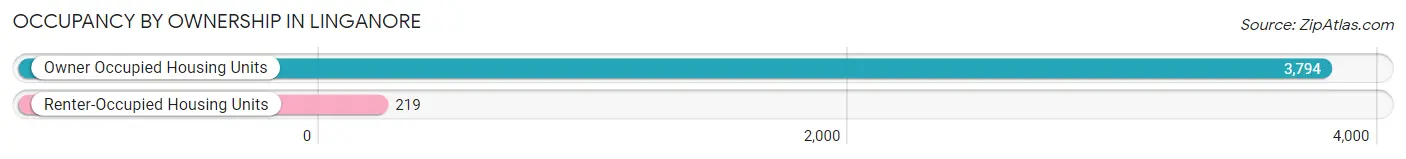
| Occupancy | # Housing Units | % Housing Units |
| Owner Occupied Housing Units | 3,794 | 94.5% |
| Renter-Occupied Housing Units | 219 | 5.5% |
| Total Occupied Housing Units | 4,013 | 100.0% |
Occupancy by Household Size in Linganore
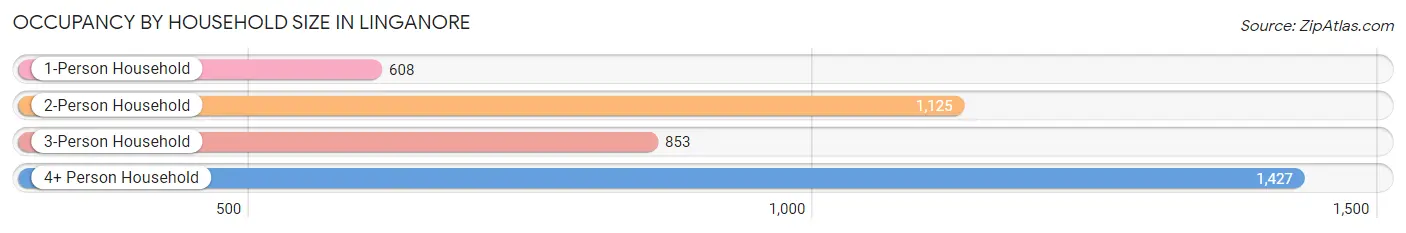
| Household Size | # Housing Units | % Housing Units |
| 1-Person Household | 608 | 15.1% |
| 2-Person Household | 1,125 | 28.0% |
| 3-Person Household | 853 | 21.3% |
| 4+ Person Household | 1,427 | 35.6% |
| Total Housing Units | 4,013 | 100.0% |
Occupancy by Ownership by Household Size in Linganore
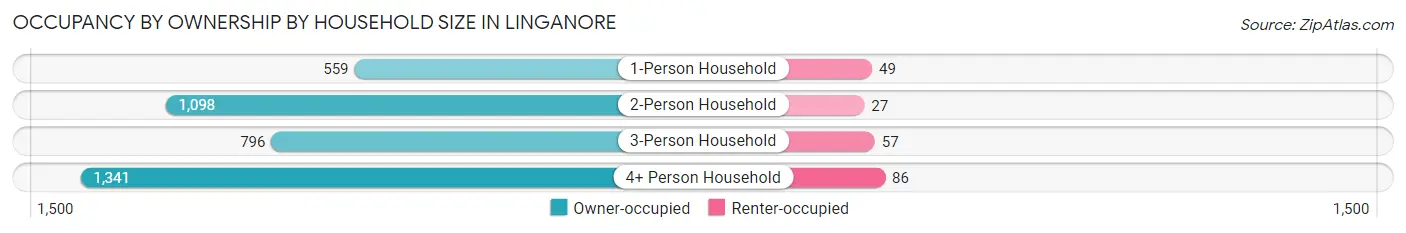
| Household Size | Owner-occupied | Renter-occupied |
| 1-Person Household | 559 (91.9%) | 49 (8.1%) |
| 2-Person Household | 1,098 (97.6%) | 27 (2.4%) |
| 3-Person Household | 796 (93.3%) | 57 (6.7%) |
| 4+ Person Household | 1,341 (94.0%) | 86 (6.0%) |
| Total Housing Units | 3,794 (94.5%) | 219 (5.5%) |
Occupancy by Educational Attainment in Linganore
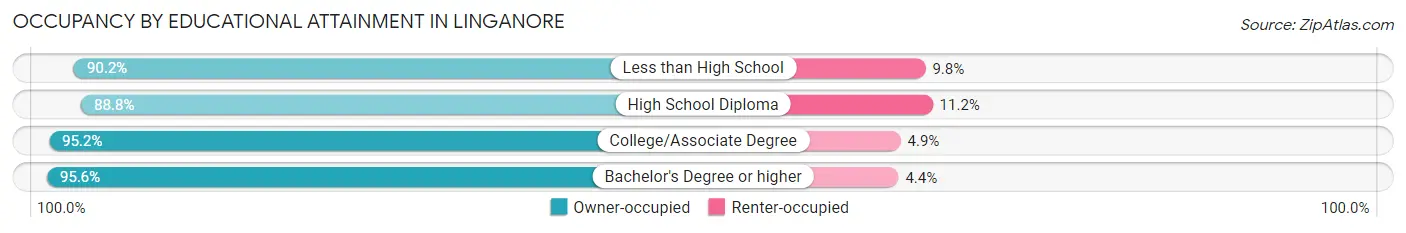
| Household Size | Owner-occupied | Renter-occupied |
| Less than High School | 83 (90.2%) | 9 (9.8%) |
| High School Diploma | 428 (88.8%) | 54 (11.2%) |
| College/Associate Degree | 882 (95.2%) | 45 (4.9%) |
| Bachelor's Degree or higher | 2,401 (95.6%) | 111 (4.4%) |
Occupancy by Age of Householder in Linganore
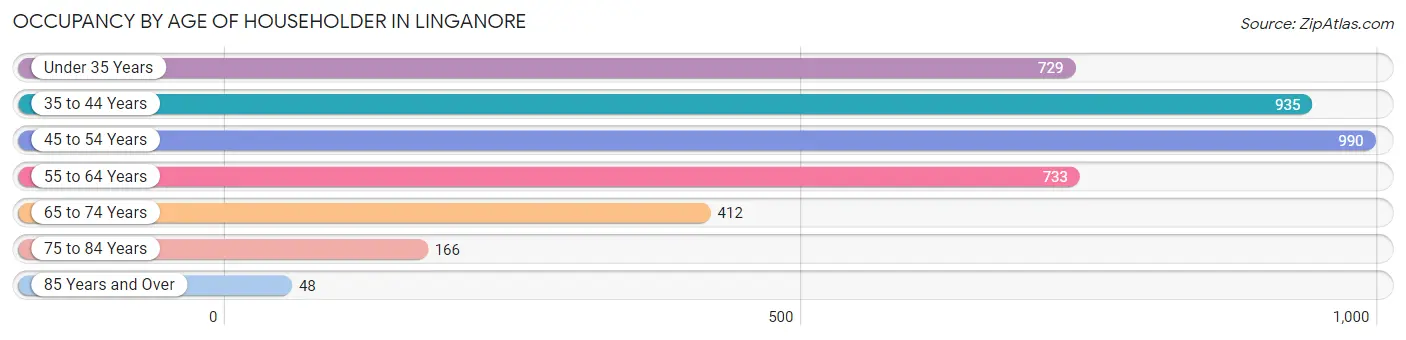
| Age Bracket | # Households | % Households |
| Under 35 Years | 729 | 18.2% |
| 35 to 44 Years | 935 | 23.3% |
| 45 to 54 Years | 990 | 24.7% |
| 55 to 64 Years | 733 | 18.3% |
| 65 to 74 Years | 412 | 10.3% |
| 75 to 84 Years | 166 | 4.1% |
| 85 Years and Over | 48 | 1.2% |
| Total | 4,013 | 100.0% |
Housing Finances in Linganore
Median Income by Occupancy in Linganore
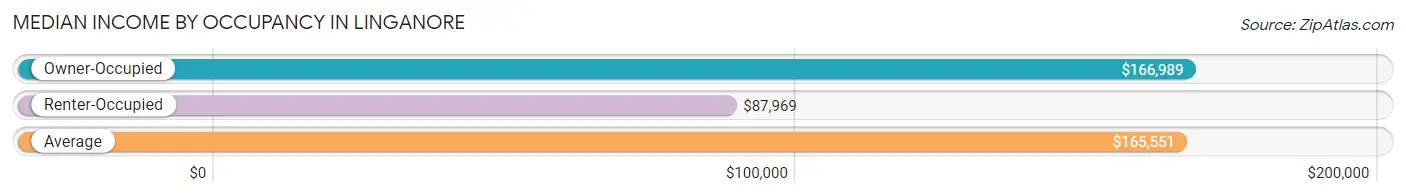
| Occupancy Type | # Households | Median Income |
| Owner-Occupied | 3,794 (94.5%) | $166,989 |
| Renter-Occupied | 219 (5.5%) | $87,969 |
| Average | 4,013 (100.0%) | $165,551 |
Occupancy by Householder Income Bracket in Linganore
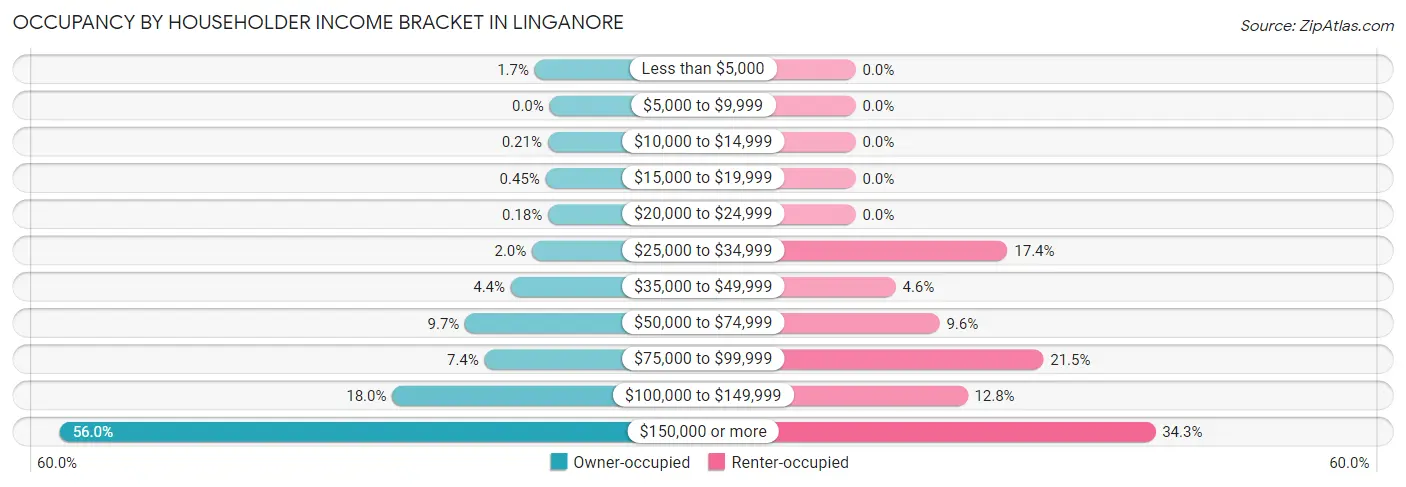
| Income Bracket | Owner-occupied | Renter-occupied |
| Less than $5,000 | 64 (1.7%) | 0 (0.0%) |
| $5,000 to $9,999 | 0 (0.0%) | 0 (0.0%) |
| $10,000 to $14,999 | 8 (0.2%) | 0 (0.0%) |
| $15,000 to $19,999 | 17 (0.4%) | 0 (0.0%) |
| $20,000 to $24,999 | 7 (0.2%) | 0 (0.0%) |
| $25,000 to $34,999 | 76 (2.0%) | 38 (17.3%) |
| $35,000 to $49,999 | 168 (4.4%) | 10 (4.6%) |
| $50,000 to $74,999 | 366 (9.7%) | 21 (9.6%) |
| $75,000 to $99,999 | 282 (7.4%) | 47 (21.5%) |
| $100,000 to $149,999 | 682 (18.0%) | 28 (12.8%) |
| $150,000 or more | 2,124 (56.0%) | 75 (34.3%) |
| Total | 3,794 (100.0%) | 219 (100.0%) |
Monthly Housing Cost Tiers in Linganore
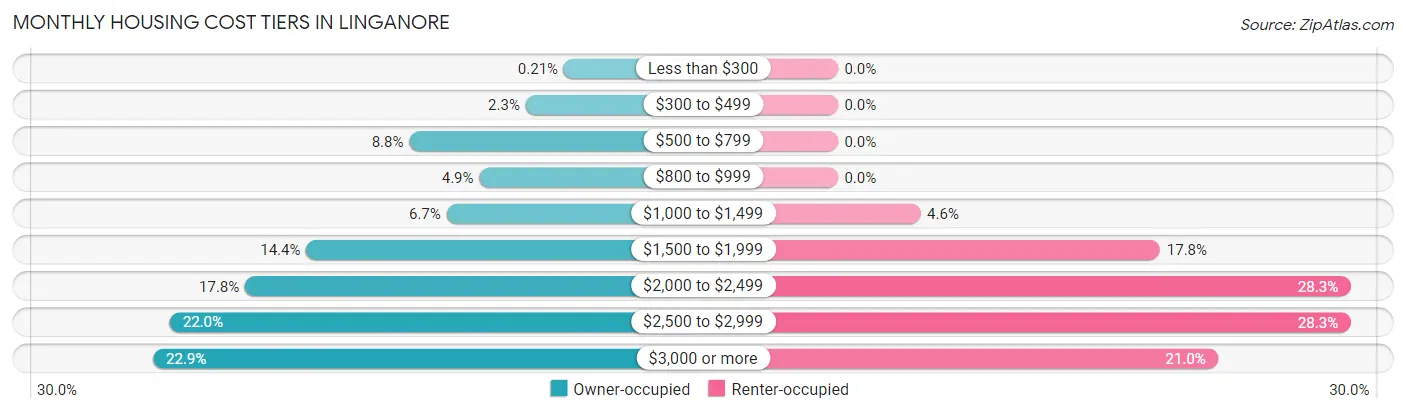
| Monthly Cost | Owner-occupied | Renter-occupied |
| Less than $300 | 8 (0.2%) | 0 (0.0%) |
| $300 to $499 | 88 (2.3%) | 0 (0.0%) |
| $500 to $799 | 332 (8.7%) | 0 (0.0%) |
| $800 to $999 | 185 (4.9%) | 0 (0.0%) |
| $1,000 to $1,499 | 254 (6.7%) | 10 (4.6%) |
| $1,500 to $1,999 | 548 (14.4%) | 39 (17.8%) |
| $2,000 to $2,499 | 676 (17.8%) | 62 (28.3%) |
| $2,500 to $2,999 | 834 (22.0%) | 62 (28.3%) |
| $3,000 or more | 869 (22.9%) | 46 (21.0%) |
| Total | 3,794 (100.0%) | 219 (100.0%) |
Physical Housing Characteristics in Linganore
Housing Structures in Linganore
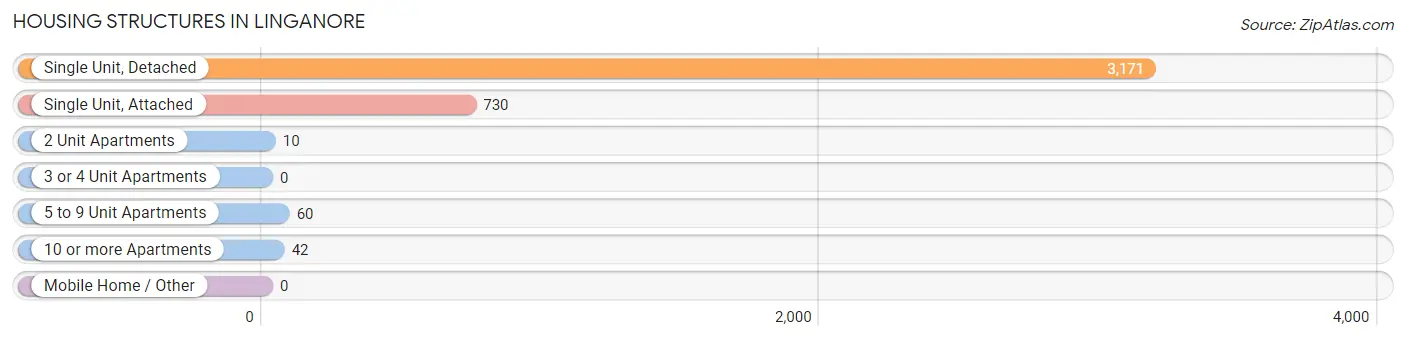
| Structure Type | # Housing Units | % Housing Units |
| Single Unit, Detached | 3,171 | 79.0% |
| Single Unit, Attached | 730 | 18.2% |
| 2 Unit Apartments | 10 | 0.3% |
| 3 or 4 Unit Apartments | 0 | 0.0% |
| 5 to 9 Unit Apartments | 60 | 1.5% |
| 10 or more Apartments | 42 | 1.1% |
| Mobile Home / Other | 0 | 0.0% |
| Total | 4,013 | 100.0% |
Housing Structures by Occupancy in Linganore
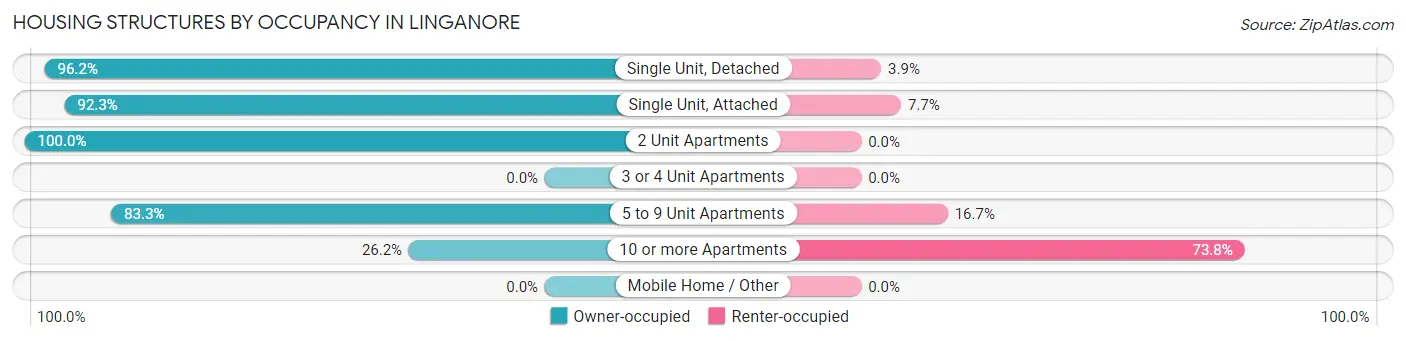
| Structure Type | Owner-occupied | Renter-occupied |
| Single Unit, Detached | 3,049 (96.2%) | 122 (3.8%) |
| Single Unit, Attached | 674 (92.3%) | 56 (7.7%) |
| 2 Unit Apartments | 10 (100.0%) | 0 (0.0%) |
| 3 or 4 Unit Apartments | 0 (0.0%) | 0 (0.0%) |
| 5 to 9 Unit Apartments | 50 (83.3%) | 10 (16.7%) |
| 10 or more Apartments | 11 (26.2%) | 31 (73.8%) |
| Mobile Home / Other | 0 (0.0%) | 0 (0.0%) |
| Total | 3,794 (94.5%) | 219 (5.5%) |
Housing Structures by Number of Rooms in Linganore
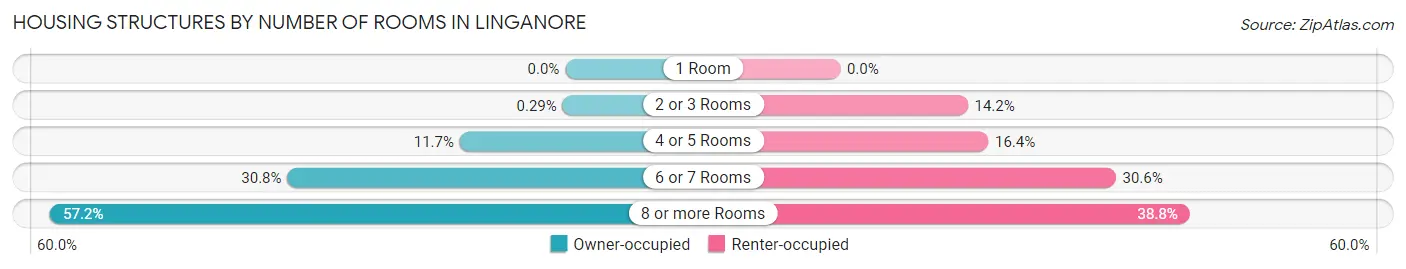
| Number of Rooms | Owner-occupied | Renter-occupied |
| 1 Room | 0 (0.0%) | 0 (0.0%) |
| 2 or 3 Rooms | 11 (0.3%) | 31 (14.2%) |
| 4 or 5 Rooms | 444 (11.7%) | 36 (16.4%) |
| 6 or 7 Rooms | 1,170 (30.8%) | 67 (30.6%) |
| 8 or more Rooms | 2,169 (57.2%) | 85 (38.8%) |
| Total | 3,794 (100.0%) | 219 (100.0%) |
Housing Structure by Heating Type in Linganore
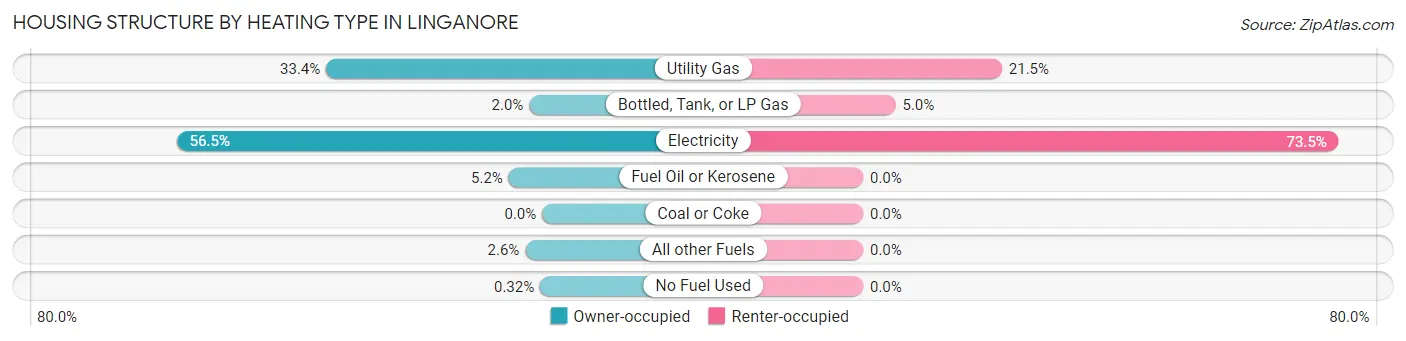
| Heating Type | Owner-occupied | Renter-occupied |
| Utility Gas | 1,267 (33.4%) | 47 (21.5%) |
| Bottled, Tank, or LP Gas | 76 (2.0%) | 11 (5.0%) |
| Electricity | 2,144 (56.5%) | 161 (73.5%) |
| Fuel Oil or Kerosene | 196 (5.2%) | 0 (0.0%) |
| Coal or Coke | 0 (0.0%) | 0 (0.0%) |
| All other Fuels | 99 (2.6%) | 0 (0.0%) |
| No Fuel Used | 12 (0.3%) | 0 (0.0%) |
| Total | 3,794 (100.0%) | 219 (100.0%) |
Household Vehicle Usage in Linganore
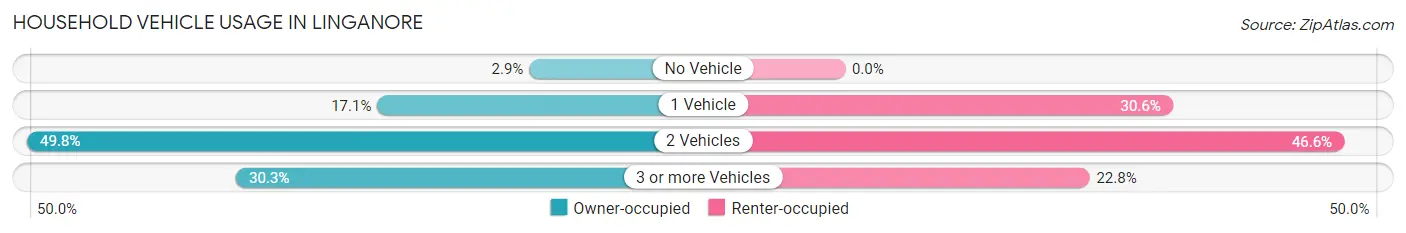
| Vehicles per Household | Owner-occupied | Renter-occupied |
| No Vehicle | 110 (2.9%) | 0 (0.0%) |
| 1 Vehicle | 648 (17.1%) | 67 (30.6%) |
| 2 Vehicles | 1,888 (49.8%) | 102 (46.6%) |
| 3 or more Vehicles | 1,148 (30.3%) | 50 (22.8%) |
| Total | 3,794 (100.0%) | 219 (100.0%) |
Real Estate & Mortgages in Linganore
Real Estate and Mortgage Overview in Linganore
| Characteristic | Without Mortgage | With Mortgage |
| Housing Units | 618 | 3,176 |
| Median Property Value | $474,300 | $472,200 |
| Median Household Income | $116,667 | $1,870 |
| Monthly Housing Costs | $711 | $869 |
| Real Estate Taxes | $4,484 | $42 |
Property Value by Mortgage Status in Linganore
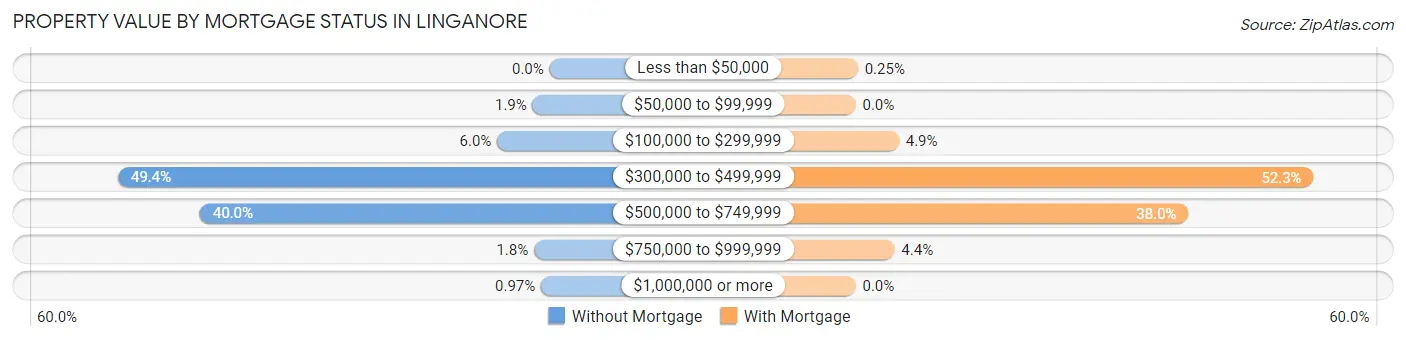
| Property Value | Without Mortgage | With Mortgage |
| Less than $50,000 | 0 (0.0%) | 8 (0.3%) |
| $50,000 to $99,999 | 12 (1.9%) | 0 (0.0%) |
| $100,000 to $299,999 | 37 (6.0%) | 157 (4.9%) |
| $300,000 to $499,999 | 305 (49.3%) | 1,662 (52.3%) |
| $500,000 to $749,999 | 247 (40.0%) | 1,208 (38.0%) |
| $750,000 to $999,999 | 11 (1.8%) | 141 (4.4%) |
| $1,000,000 or more | 6 (1.0%) | 0 (0.0%) |
| Total | 618 (100.0%) | 3,176 (100.0%) |
Household Income by Mortgage Status in Linganore
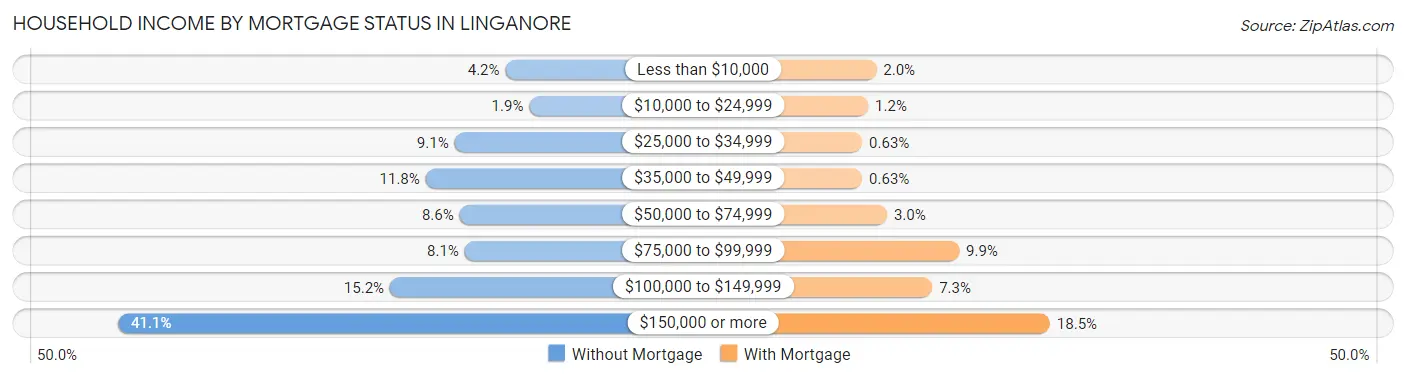
| Household Income | Without Mortgage | With Mortgage |
| Less than $10,000 | 26 (4.2%) | 63 (2.0%) |
| $10,000 to $24,999 | 12 (1.9%) | 38 (1.2%) |
| $25,000 to $34,999 | 56 (9.1%) | 20 (0.6%) |
| $35,000 to $49,999 | 73 (11.8%) | 20 (0.6%) |
| $50,000 to $74,999 | 53 (8.6%) | 95 (3.0%) |
| $75,000 to $99,999 | 50 (8.1%) | 313 (9.9%) |
| $100,000 to $149,999 | 94 (15.2%) | 232 (7.3%) |
| $150,000 or more | 254 (41.1%) | 588 (18.5%) |
| Total | 618 (100.0%) | 3,176 (100.0%) |
Property Value to Household Income Ratio in Linganore
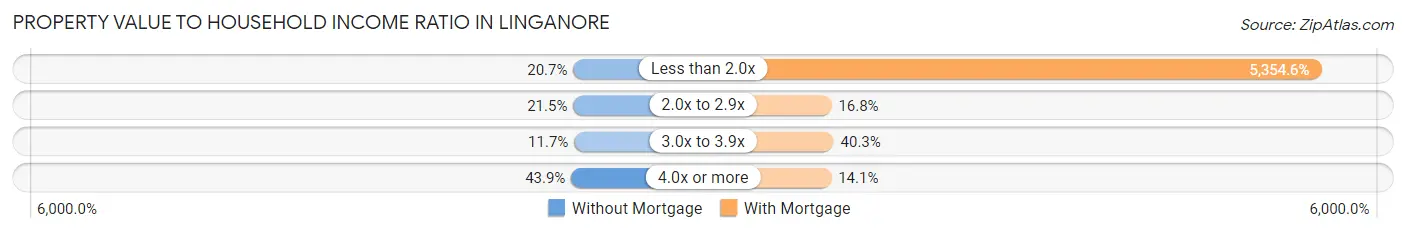
| Value-to-Income Ratio | Without Mortgage | With Mortgage |
| Less than 2.0x | 128 (20.7%) | 170,061 (5,354.6%) |
| 2.0x to 2.9x | 133 (21.5%) | 532 (16.8%) |
| 3.0x to 3.9x | 72 (11.7%) | 1,280 (40.3%) |
| 4.0x or more | 271 (43.9%) | 449 (14.1%) |
| Total | 618 (100.0%) | 3,176 (100.0%) |
Real Estate Taxes by Mortgage Status in Linganore
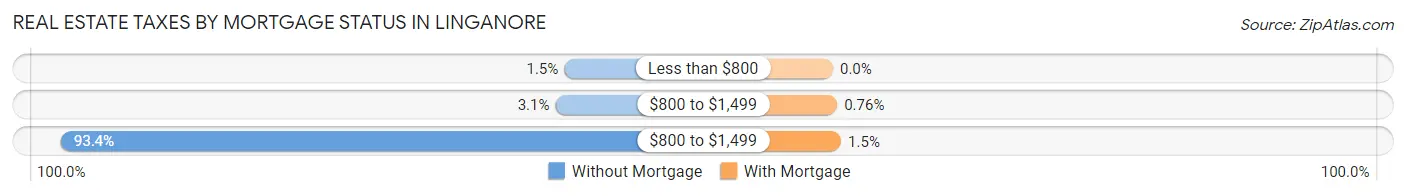
| Property Taxes | Without Mortgage | With Mortgage |
| Less than $800 | 9 (1.5%) | 0 (0.0%) |
| $800 to $1,499 | 19 (3.1%) | 24 (0.8%) |
| $800 to $1,499 | 577 (93.4%) | 47 (1.5%) |
| Total | 618 (100.0%) | 3,176 (100.0%) |
Health & Disability in Linganore
Health Insurance Coverage by Age in Linganore
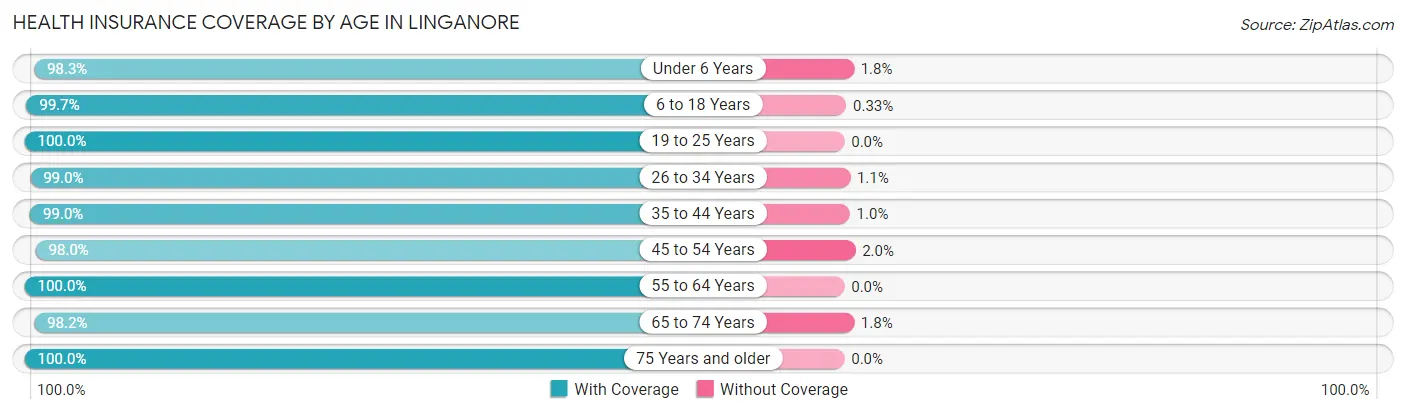
| Age Bracket | With Coverage | Without Coverage |
| Under 6 Years | 1,123 (98.3%) | 20 (1.8%) |
| 6 to 18 Years | 2,448 (99.7%) | 8 (0.3%) |
| 19 to 25 Years | 770 (100.0%) | 0 (0.0%) |
| 26 to 34 Years | 1,317 (99.0%) | 14 (1.1%) |
| 35 to 44 Years | 1,785 (99.0%) | 18 (1.0%) |
| 45 to 54 Years | 1,830 (98.0%) | 38 (2.0%) |
| 55 to 64 Years | 1,445 (100.0%) | 0 (0.0%) |
| 65 to 74 Years | 659 (98.2%) | 12 (1.8%) |
| 75 Years and older | 329 (100.0%) | 0 (0.0%) |
| Total | 11,706 (99.1%) | 110 (0.9%) |
Health Insurance Coverage by Citizenship Status in Linganore
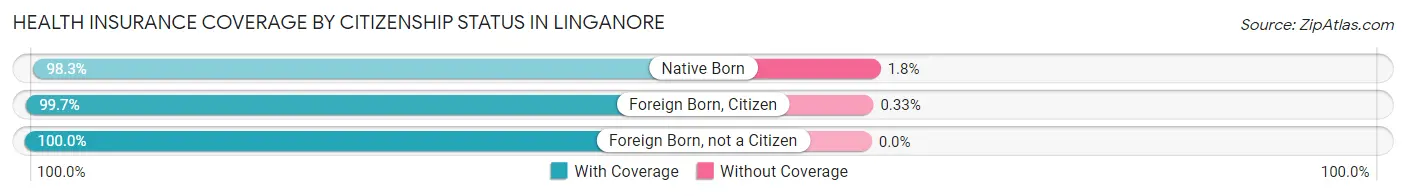
| Citizenship Status | With Coverage | Without Coverage |
| Native Born | 1,123 (98.3%) | 20 (1.8%) |
| Foreign Born, Citizen | 2,448 (99.7%) | 8 (0.3%) |
| Foreign Born, not a Citizen | 770 (100.0%) | 0 (0.0%) |
Health Insurance Coverage by Household Income in Linganore
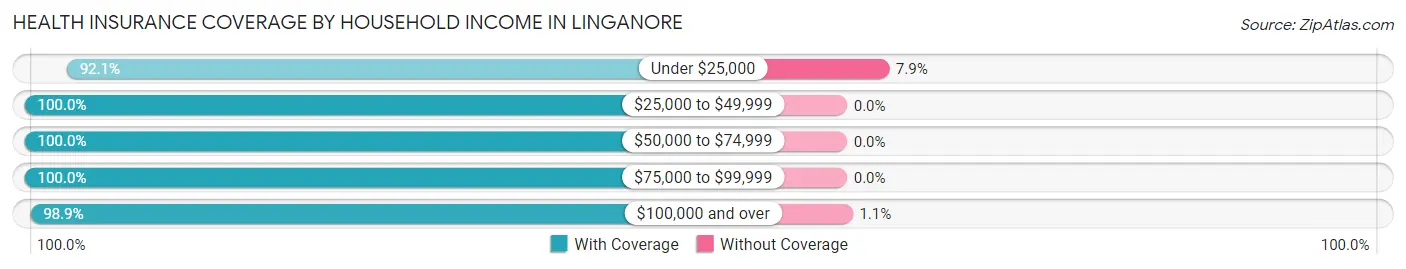
| Household Income | With Coverage | Without Coverage |
| Under $25,000 | 140 (92.1%) | 12 (7.9%) |
| $25,000 to $49,999 | 459 (100.0%) | 0 (0.0%) |
| $50,000 to $74,999 | 1,109 (100.0%) | 0 (0.0%) |
| $75,000 to $99,999 | 821 (100.0%) | 0 (0.0%) |
| $100,000 and over | 9,177 (98.9%) | 98 (1.1%) |
Public vs Private Health Insurance Coverage by Age in Linganore
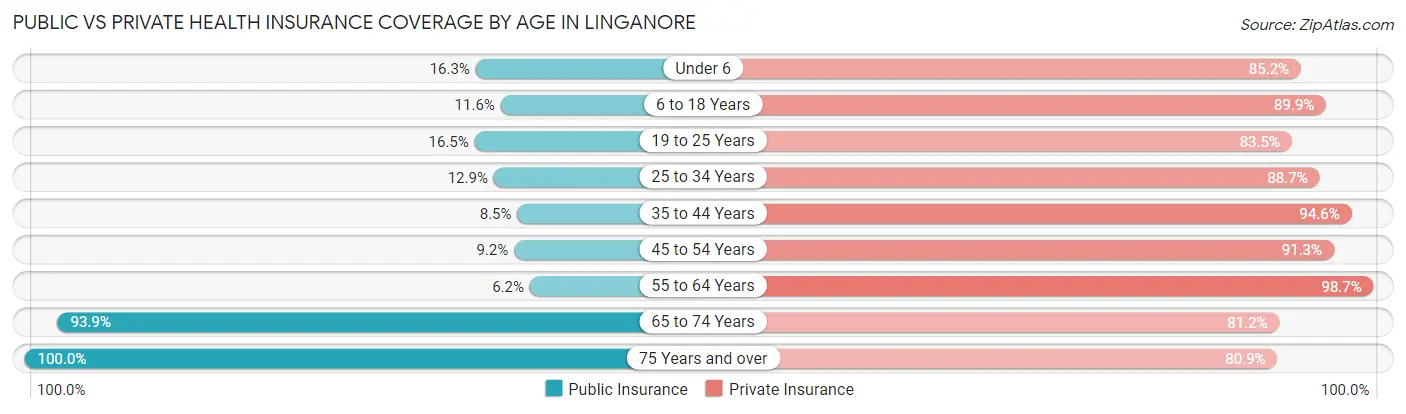
| Age Bracket | Public Insurance | Private Insurance |
| Under 6 | 186 (16.3%) | 974 (85.2%) |
| 6 to 18 Years | 286 (11.6%) | 2,208 (89.9%) |
| 19 to 25 Years | 127 (16.5%) | 643 (83.5%) |
| 25 to 34 Years | 172 (12.9%) | 1,180 (88.7%) |
| 35 to 44 Years | 154 (8.5%) | 1,706 (94.6%) |
| 45 to 54 Years | 171 (9.1%) | 1,706 (91.3%) |
| 55 to 64 Years | 90 (6.2%) | 1,426 (98.7%) |
| 65 to 74 Years | 630 (93.9%) | 545 (81.2%) |
| 75 Years and over | 329 (100.0%) | 266 (80.8%) |
| Total | 2,145 (18.1%) | 10,654 (90.2%) |
Disability Status by Sex by Age in Linganore
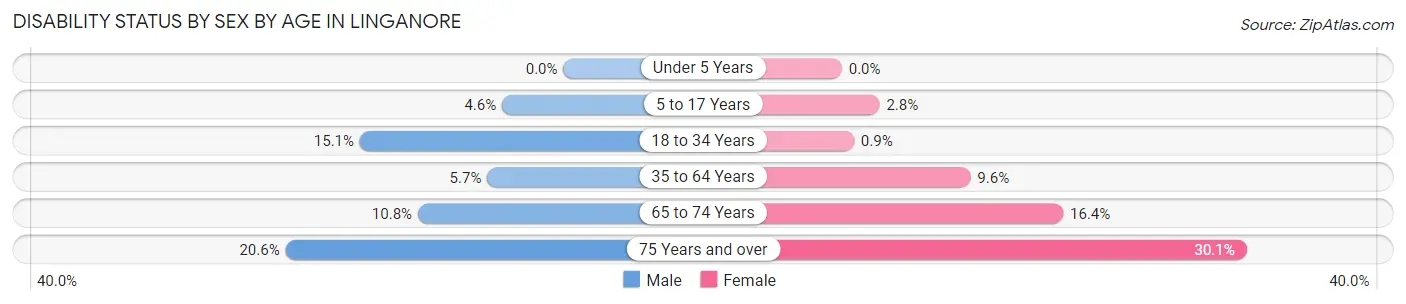
| Age Bracket | Male | Female |
| Under 5 Years | 0 (0.0%) | 0 (0.0%) |
| 5 to 17 Years | 69 (4.5%) | 30 (2.8%) |
| 18 to 34 Years | 175 (15.1%) | 10 (0.9%) |
| 35 to 64 Years | 141 (5.7%) | 250 (9.6%) |
| 65 to 74 Years | 35 (10.8%) | 57 (16.4%) |
| 75 Years and over | 26 (20.6%) | 61 (30.0%) |
Disability Class by Sex by Age in Linganore
Disability Class: Hearing Difficulty
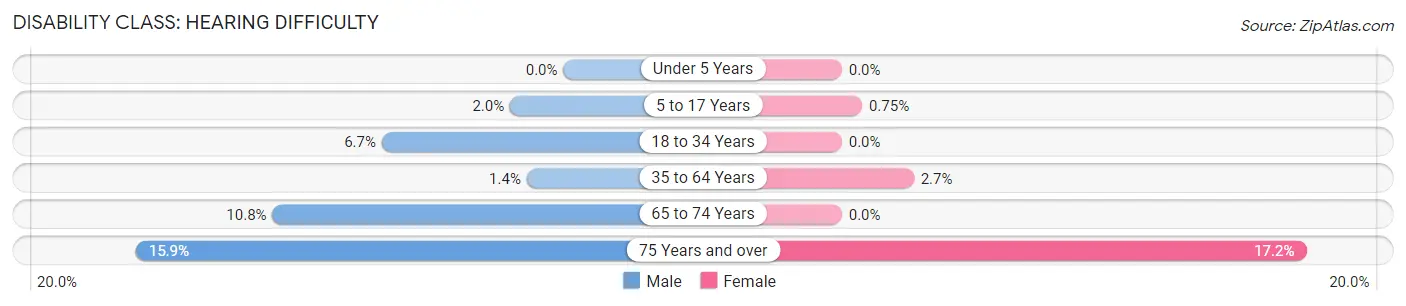
| Age Bracket | Male | Female |
| Under 5 Years | 0 (0.0%) | 0 (0.0%) |
| 5 to 17 Years | 30 (2.0%) | 8 (0.7%) |
| 18 to 34 Years | 78 (6.7%) | 0 (0.0%) |
| 35 to 64 Years | 34 (1.4%) | 70 (2.7%) |
| 65 to 74 Years | 35 (10.8%) | 0 (0.0%) |
| 75 Years and over | 20 (15.9%) | 35 (17.2%) |
Disability Class: Vision Difficulty
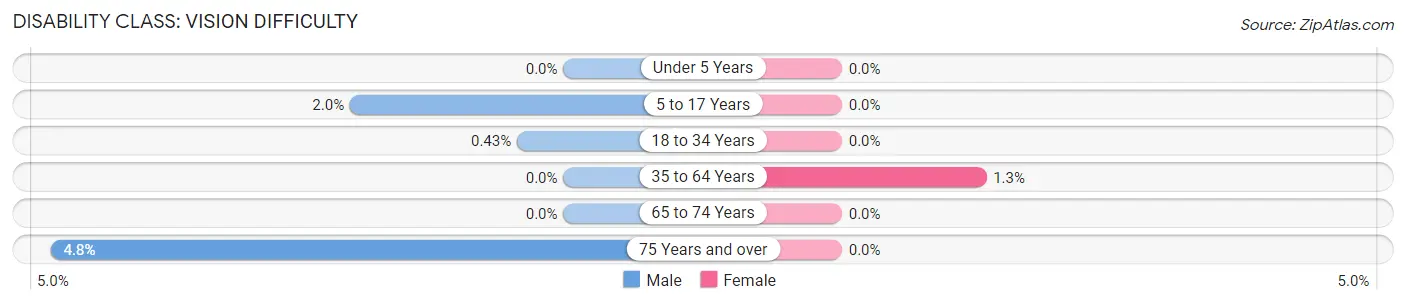
| Age Bracket | Male | Female |
| Under 5 Years | 0 (0.0%) | 0 (0.0%) |
| 5 to 17 Years | 30 (2.0%) | 0 (0.0%) |
| 18 to 34 Years | 5 (0.4%) | 0 (0.0%) |
| 35 to 64 Years | 0 (0.0%) | 35 (1.3%) |
| 65 to 74 Years | 0 (0.0%) | 0 (0.0%) |
| 75 Years and over | 6 (4.8%) | 0 (0.0%) |
Disability Class: Cognitive Difficulty
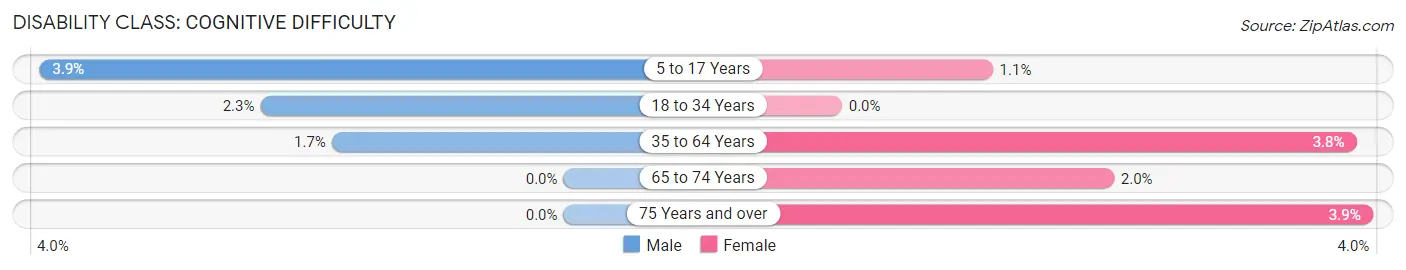
| Age Bracket | Male | Female |
| 5 to 17 Years | 59 (3.9%) | 12 (1.1%) |
| 18 to 34 Years | 26 (2.2%) | 0 (0.0%) |
| 35 to 64 Years | 43 (1.7%) | 100 (3.8%) |
| 65 to 74 Years | 0 (0.0%) | 7 (2.0%) |
| 75 Years and over | 0 (0.0%) | 8 (3.9%) |
Disability Class: Ambulatory Difficulty
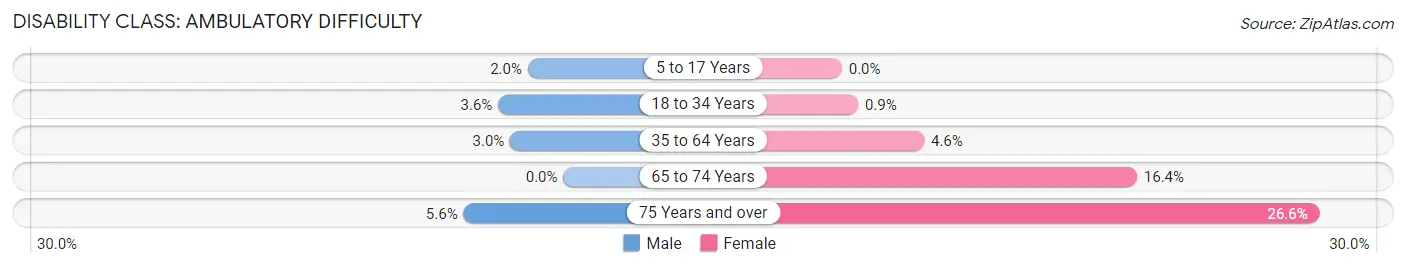
| Age Bracket | Male | Female |
| 5 to 17 Years | 30 (2.0%) | 0 (0.0%) |
| 18 to 34 Years | 42 (3.6%) | 10 (0.9%) |
| 35 to 64 Years | 74 (3.0%) | 120 (4.6%) |
| 65 to 74 Years | 0 (0.0%) | 57 (16.4%) |
| 75 Years and over | 7 (5.6%) | 54 (26.6%) |
Disability Class: Self-Care Difficulty
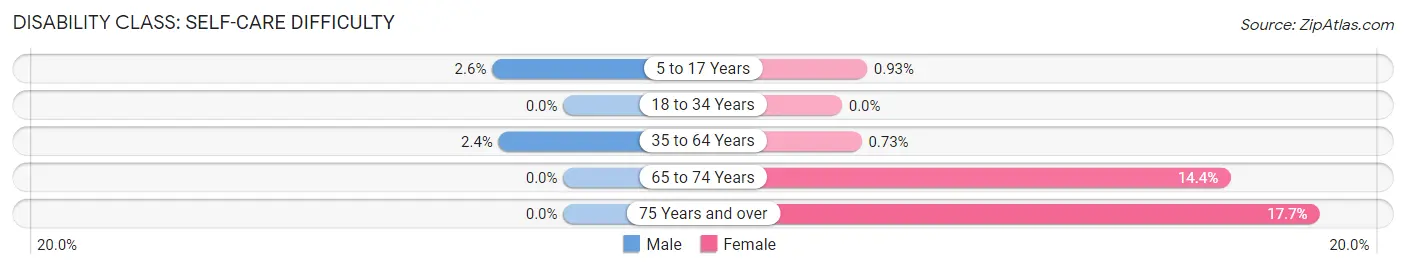
| Age Bracket | Male | Female |
| 5 to 17 Years | 40 (2.6%) | 10 (0.9%) |
| 18 to 34 Years | 0 (0.0%) | 0 (0.0%) |
| 35 to 64 Years | 60 (2.4%) | 19 (0.7%) |
| 65 to 74 Years | 0 (0.0%) | 50 (14.4%) |
| 75 Years and over | 0 (0.0%) | 36 (17.7%) |
Technology Access in Linganore
Computing Device Access in Linganore
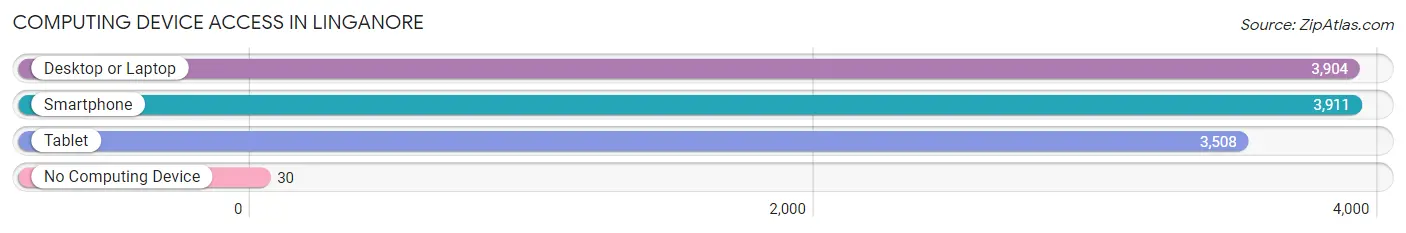
| Device Type | # Households | % Households |
| Desktop or Laptop | 3,904 | 97.3% |
| Smartphone | 3,911 | 97.5% |
| Tablet | 3,508 | 87.4% |
| No Computing Device | 30 | 0.7% |
| Total | 4,013 | 100.0% |
Internet Access in Linganore
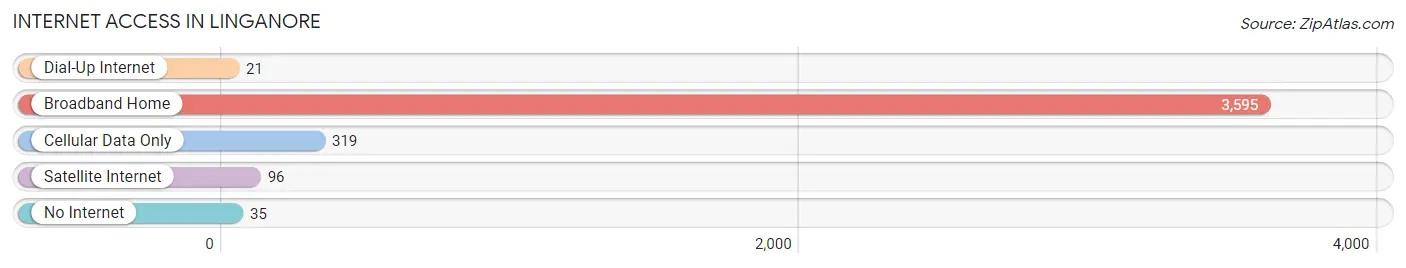
| Internet Type | # Households | % Households |
| Dial-Up Internet | 21 | 0.5% |
| Broadband Home | 3,595 | 89.6% |
| Cellular Data Only | 319 | 8.0% |
| Satellite Internet | 96 | 2.4% |
| No Internet | 35 | 0.9% |
| Total | 4,013 | 100.0% |
Linganore Summary
Linganore is an unincorporated community located in Frederick County, Maryland. It is situated in the northern part of the county, approximately 10 miles north of the city of Frederick. The community is named after the nearby Linganore Creek, which was named after the Native American tribe that once lived in the area.
History
The area that is now Linganore was originally inhabited by the Susquehannock Indians. The Susquehannock were a powerful tribe that lived in the area for centuries before the arrival of European settlers. The first European settlers arrived in the area in the late 17th century. The area was first known as “Linganore” in 1730, when the first land grant was issued to a settler named John Lingan.
The area was primarily agricultural for many years, with the main crops being wheat, corn, and tobacco. In the late 19th century, the area began to develop into a small town, with the construction of a post office, a general store, and a school. The town was officially incorporated in 1891.
Geography
Linganore is located in northern Frederick County, approximately 10 miles north of the city of Frederick. The community is situated in the foothills of the Catoctin Mountains, and is surrounded by rolling hills and farmland. The Linganore Creek runs through the town, and is a popular spot for fishing and swimming.
The climate in Linganore is typical of the mid-Atlantic region, with hot, humid summers and cold, wet winters. The average annual temperature is around 55 degrees Fahrenheit, and the average annual precipitation is around 40 inches.
Economy
The economy of Linganore is primarily based on agriculture and tourism. The area is home to several wineries, and is a popular destination for wine-tasting and other activities. The town is also home to several small businesses, including restaurants, shops, and other services.
Demographics
As of the 2010 census, the population of Linganore was 4,845. The racial makeup of the town was 94.3% White, 2.2% African American, 0.7% Asian, 0.3% Native American, and 2.5% from other races. The median household income was $76,944, and the median family income was $86,944. The per capita income was $30,944.
Common Questions
What is Per Capita Income in Linganore?
Per Capita income in Linganore is $58,449.
What is the Median Family Income in Linganore?
Median Family Income in Linganore is $177,703.
What is the Median Household income in Linganore?
Median Household Income in Linganore is $165,551.
What is Income or Wage Gap in Linganore?
Income or Wage Gap in Linganore is 23.9%.
Women in Linganore earn 76.1 cents for every dollar earned by a man.
What is Inequality or Gini Index in Linganore?
Inequality or Gini Index in Linganore is 0.33.
What is the Total Population of Linganore?
Total Population of Linganore is 11,870.
What is the Total Male Population of Linganore?
Total Male Population of Linganore is 6,173.
What is the Total Female Population of Linganore?
Total Female Population of Linganore is 5,697.
What is the Ratio of Males per 100 Females in Linganore?
There are 108.36 Males per 100 Females in Linganore.
What is the Ratio of Females per 100 Males in Linganore?
There are 92.29 Females per 100 Males in Linganore.
What is the Median Population Age in Linganore?
Median Population Age in Linganore is 36.7 Years.
What is the Average Family Size in Linganore
Average Family Size in Linganore is 3.4 People.
What is the Average Household Size in Linganore
Average Household Size in Linganore is 3.0 People.
How Large is the Labor Force in Linganore?
There are 6,637 People in the Labor Forcein in Linganore.
What is the Percentage of People in the Labor Force in Linganore?
75.9% of People are in the Labor Force in Linganore.
What is the Unemployment Rate in Linganore?
Unemployment Rate in Linganore is 2.6%.