Belle Meade, TN Map & Demographics
Belle Meade Map
Belle Meade Overview
$154,324
PER CAPITA INCOME
$250,001
AVG FAMILY INCOME
$250,001
AVG HOUSEHOLD INCOME
0.45
INEQUALITY / GINI INDEX
2,933
TOTAL POPULATION
1,435
MALE POPULATION
1,498
FEMALE POPULATION
95.79
MALES / 100 FEMALES
104.39
FEMALES / 100 MALES
43.6
MEDIAN AGE
3.4
AVG FAMILY SIZE
3.2
AVG HOUSEHOLD SIZE
1,354
LABOR FORCE [ PEOPLE ]
59.5%
PERCENT IN LABOR FORCE
1.0%
UNEMPLOYMENT RATE
Belle Meade Area Codes
Income in Belle Meade
Income Overview in Belle Meade
Per Capita Income in Belle Meade is $154,324, while median incomes of families and households are $250,001 and $250,001 respectively.
| Characteristic | Number | Measure |
| Per Capita Income | 2,933 | $154,324 |
| Median Family Income | 825 | $250,001 |
| Mean Family Income | 825 | $509,300 |
| Median Household Income | 915 | $250,001 |
| Mean Household Income | 915 | $487,916 |
| Income Deficit | 825 | $0 |
| Wage / Income Gap (%) | 2,933 | 0.00% |
| Wage / Income Gap ($) | 2,933 | 100.00¢ per $1 |
| Gini / Inequality Index | 2,933 | 0.45 |
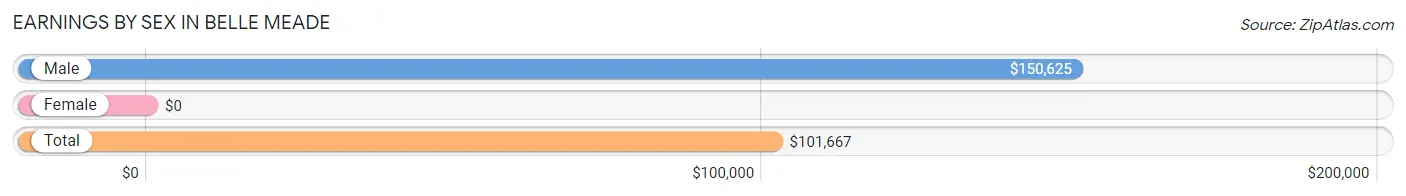
Earnings by Sex in Belle Meade
| Sex | Number | Average Earnings |
| Male | 877 (58.9%) | $150,625 |
| Female | 613 (41.1%) | $0 |
| Total | 1,490 (100.0%) | $101,667 |
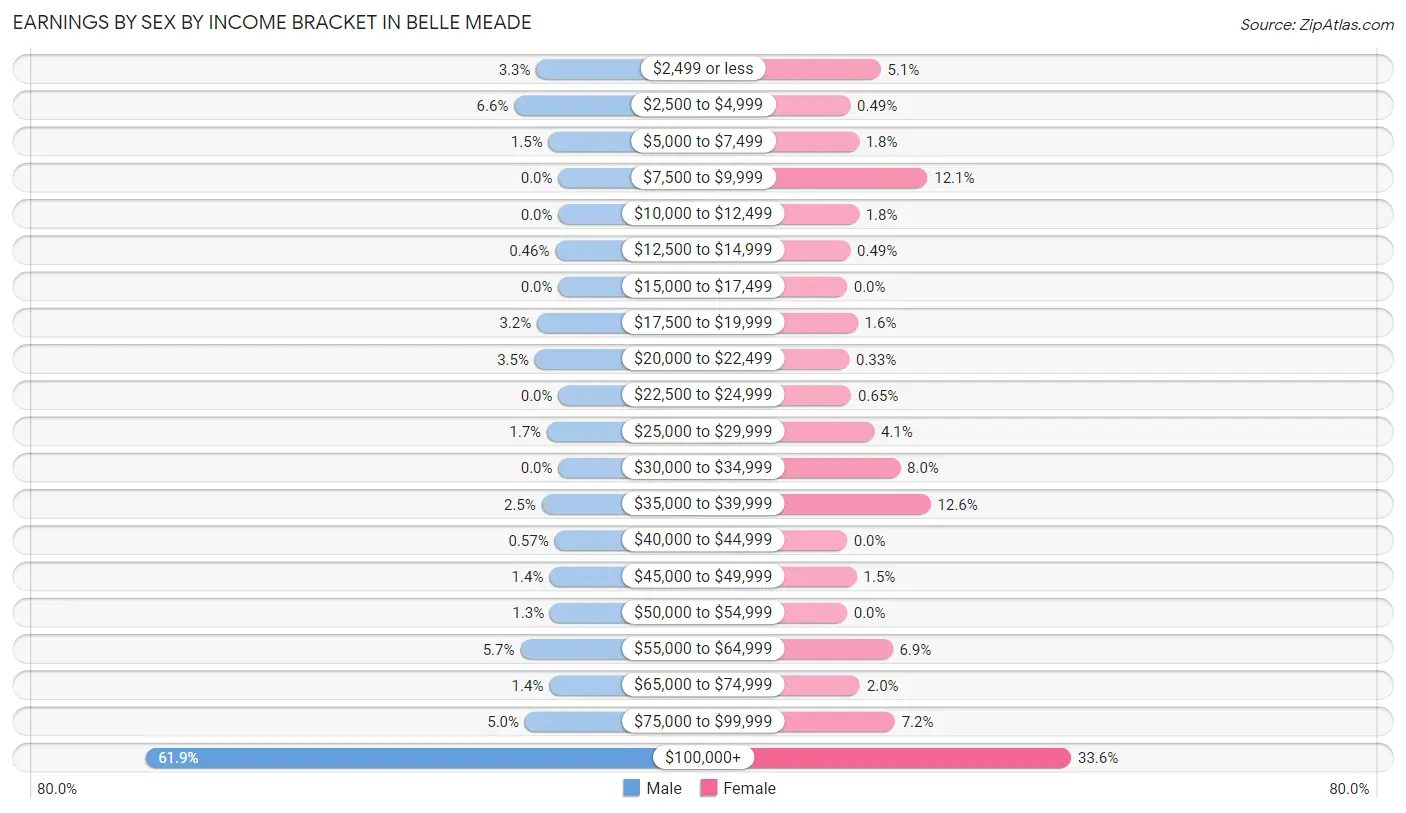
Earnings by Sex by Income Bracket in Belle Meade
The most common earnings brackets in Belle Meade are $100,000+ for men (543 | 61.9%) and $100,000+ for women (206 | 33.6%).
| Income | Male | Female |
| $2,499 or less | 29 (3.3%) | 31 (5.1%) |
| $2,500 to $4,999 | 58 (6.6%) | 3 (0.5%) |
| $5,000 to $7,499 | 13 (1.5%) | 11 (1.8%) |
| $7,500 to $9,999 | 0 (0.0%) | 74 (12.1%) |
| $10,000 to $12,499 | 0 (0.0%) | 11 (1.8%) |
| $12,500 to $14,999 | 4 (0.5%) | 3 (0.5%) |
| $15,000 to $17,499 | 0 (0.0%) | 0 (0.0%) |
| $17,500 to $19,999 | 28 (3.2%) | 10 (1.6%) |
| $20,000 to $22,499 | 31 (3.5%) | 2 (0.3%) |
| $22,500 to $24,999 | 0 (0.0%) | 4 (0.6%) |
| $25,000 to $29,999 | 15 (1.7%) | 25 (4.1%) |
| $30,000 to $34,999 | 0 (0.0%) | 49 (8.0%) |
| $35,000 to $39,999 | 22 (2.5%) | 77 (12.6%) |
| $40,000 to $44,999 | 5 (0.6%) | 0 (0.0%) |
| $45,000 to $49,999 | 12 (1.4%) | 9 (1.5%) |
| $50,000 to $54,999 | 11 (1.3%) | 0 (0.0%) |
| $55,000 to $64,999 | 50 (5.7%) | 42 (6.9%) |
| $65,000 to $74,999 | 12 (1.4%) | 12 (2.0%) |
| $75,000 to $99,999 | 44 (5.0%) | 44 (7.2%) |
| $100,000+ | 543 (61.9%) | 206 (33.6%) |
| Total | 877 (100.0%) | 613 (100.0%) |
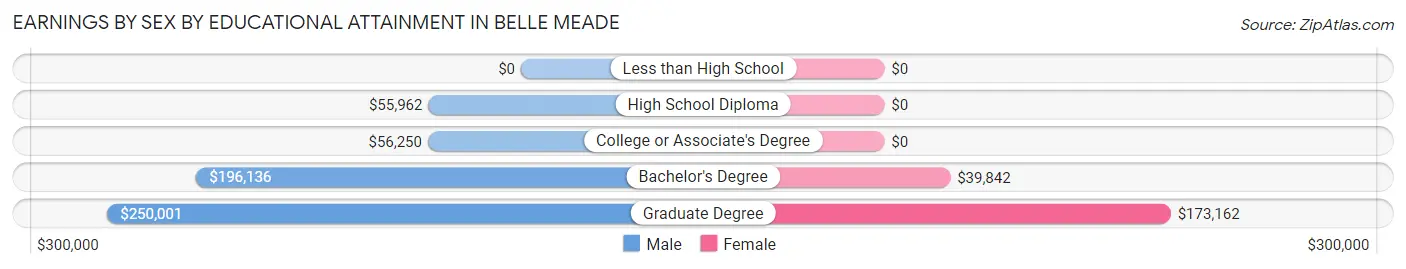
Earnings by Sex by Educational Attainment in Belle Meade
Average earnings in Belle Meade are $213,750 for men and $75,500 for women, a difference of 64.7%. Men with an educational attainment of graduate degree enjoy the highest average annual earnings of $250,001, while those with high school diploma education earn the least with $55,962. Women with an educational attainment of graduate degree earn the most with the average annual earnings of $173,162, while those with bachelor's degree education have the smallest earnings of $39,842.
| Educational Attainment | Male Income | Female Income |
| Less than High School | - | - |
| High School Diploma | $55,962 | $0 |
| College or Associate's Degree | $56,250 | $0 |
| Bachelor's Degree | $196,136 | $39,842 |
| Graduate Degree | $250,001 | $173,162 |
| Total | $213,750 | $75,500 |
Family Income in Belle Meade
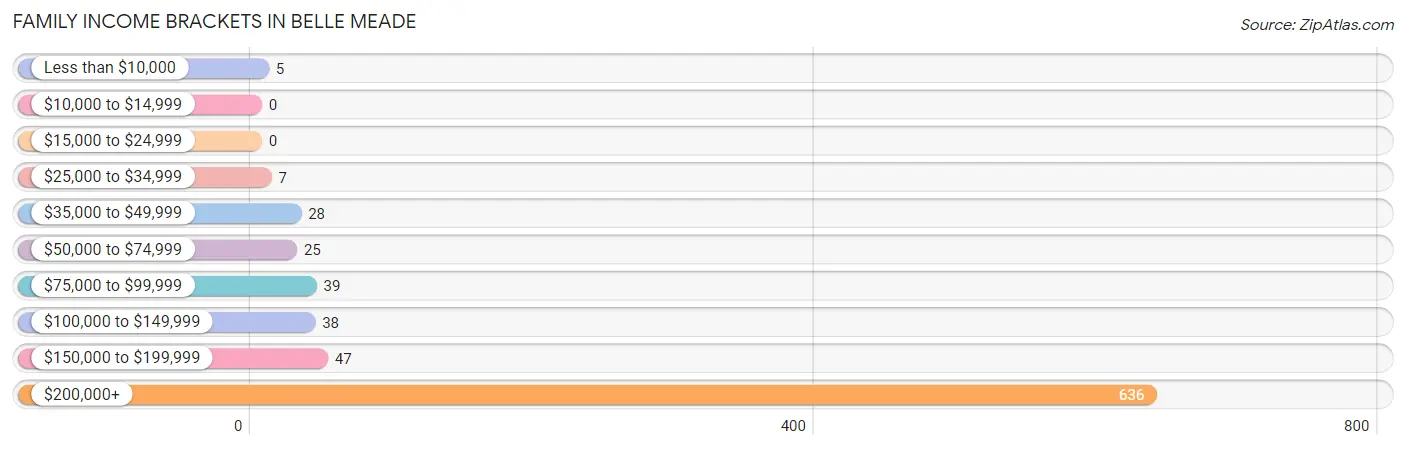
Family Income Brackets in Belle Meade
According to the Belle Meade family income data, there are 636 families falling into the $200,000+ income range, which is the most common income bracket and makes up 77.1% of all families.
| Income Bracket | # Families | % Families |
| Less than $10,000 | 5 | 0.6% |
| $10,000 to $14,999 | 0 | 0.0% |
| $15,000 to $24,999 | 0 | 0.0% |
| $25,000 to $34,999 | 7 | 0.8% |
| $35,000 to $49,999 | 28 | 3.4% |
| $50,000 to $74,999 | 25 | 3.0% |
| $75,000 to $99,999 | 39 | 4.7% |
| $100,000 to $149,999 | 38 | 4.6% |
| $150,000 to $199,999 | 47 | 5.7% |
| $200,000+ | 636 | 77.1% |
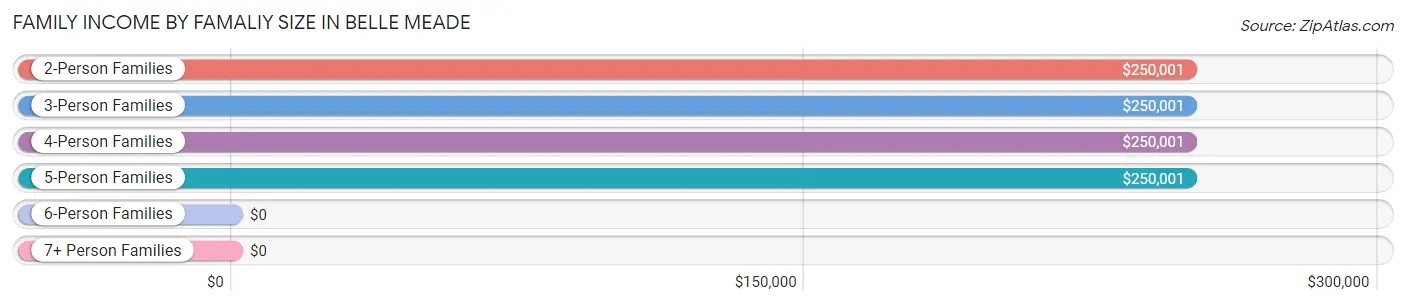
Family Income by Famaliy Size in Belle Meade
2-person families (372 | 45.1%) account for the highest median family income in Belle Meade with $250,001 per family, while 2-person families (372 | 45.1%) have the highest median income of $125,000 per family member.
| Income Bracket | # Families | Median Income |
| 2-Person Families | 372 (45.1%) | $250,001 |
| 3-Person Families | 133 (16.1%) | $250,001 |
| 4-Person Families | 152 (18.4%) | $250,001 |
| 5-Person Families | 126 (15.3%) | $250,001 |
| 6-Person Families | 38 (4.6%) | $0 |
| 7+ Person Families | 4 (0.5%) | $0 |
| Total | 825 (100.0%) | $250,001 |
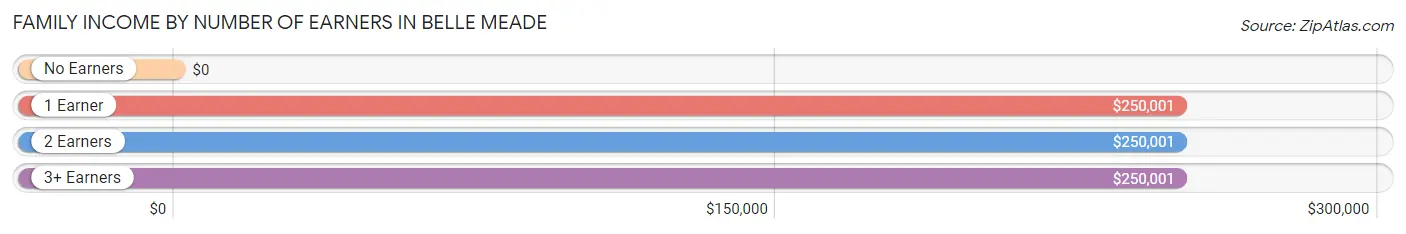
Family Income by Number of Earners in Belle Meade
| Number of Earners | # Families | Median Income |
| No Earners | 73 (8.8%) | $0 |
| 1 Earner | 338 (41.0%) | $250,001 |
| 2 Earners | 324 (39.3%) | $250,001 |
| 3+ Earners | 90 (10.9%) | $250,001 |
| Total | 825 (100.0%) | $250,001 |
Household Income in Belle Meade
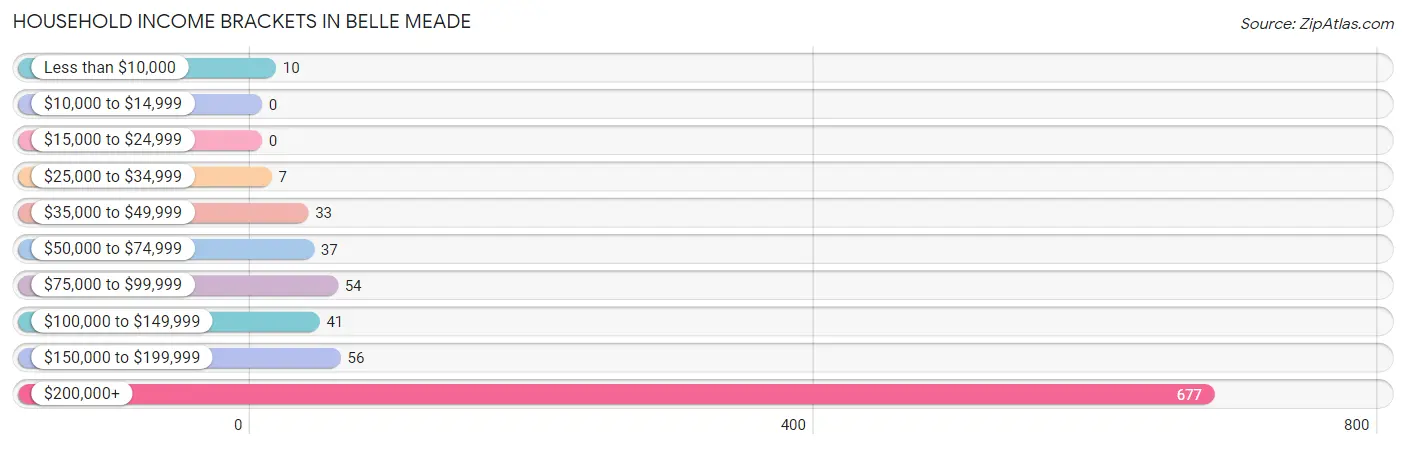
Household Income Brackets in Belle Meade
With 677 households falling in the category, the $200,000+ income range is the most frequent in Belle Meade, accounting for 74.0% of all households.
| Income Bracket | # Households | % Households |
| Less than $10,000 | 10 | 1.1% |
| $10,000 to $14,999 | 0 | 0.0% |
| $15,000 to $24,999 | 0 | 0.0% |
| $25,000 to $34,999 | 7 | 0.8% |
| $35,000 to $49,999 | 33 | 3.6% |
| $50,000 to $74,999 | 37 | 4.0% |
| $75,000 to $99,999 | 54 | 5.9% |
| $100,000 to $149,999 | 41 | 4.5% |
| $150,000 to $199,999 | 56 | 6.1% |
| $200,000+ | 677 | 74.0% |
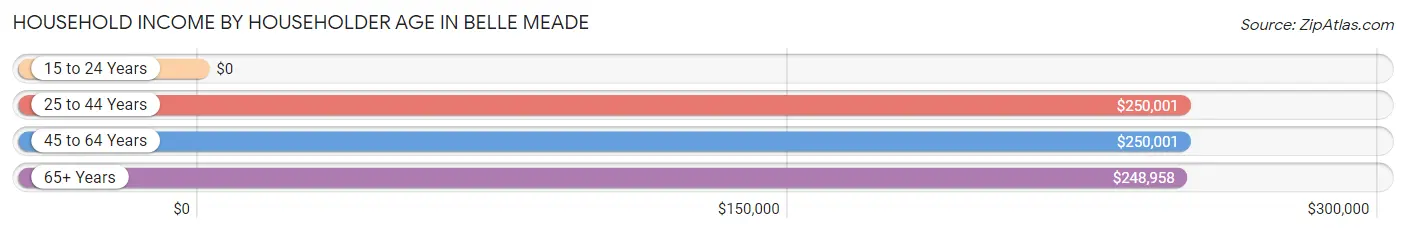
Household Income by Householder Age in Belle Meade
The median household income in Belle Meade is $250,001, with the highest median household income of $250,001 found in the 25 to 44 years age bracket for the primary householder. A total of 194 households (21.2%) fall into this category.
| Income Bracket | # Households | Median Income |
| 15 to 24 Years | 0 (0.0%) | $0 |
| 25 to 44 Years | 194 (21.2%) | $250,001 |
| 45 to 64 Years | 418 (45.7%) | $250,001 |
| 65+ Years | 303 (33.1%) | $248,958 |
| Total | 915 (100.0%) | $250,001 |
Poverty in Belle Meade
Income Below Poverty by Sex and Age in Belle Meade
With 0.4% poverty level for males and 2.4% for females among the residents of Belle Meade, 35 to 44 year old males and 75 year old and over females are the most vulnerable to poverty, with 3 males (1.8%) and 9 females (8.6%) in their respective age groups living below the poverty level.
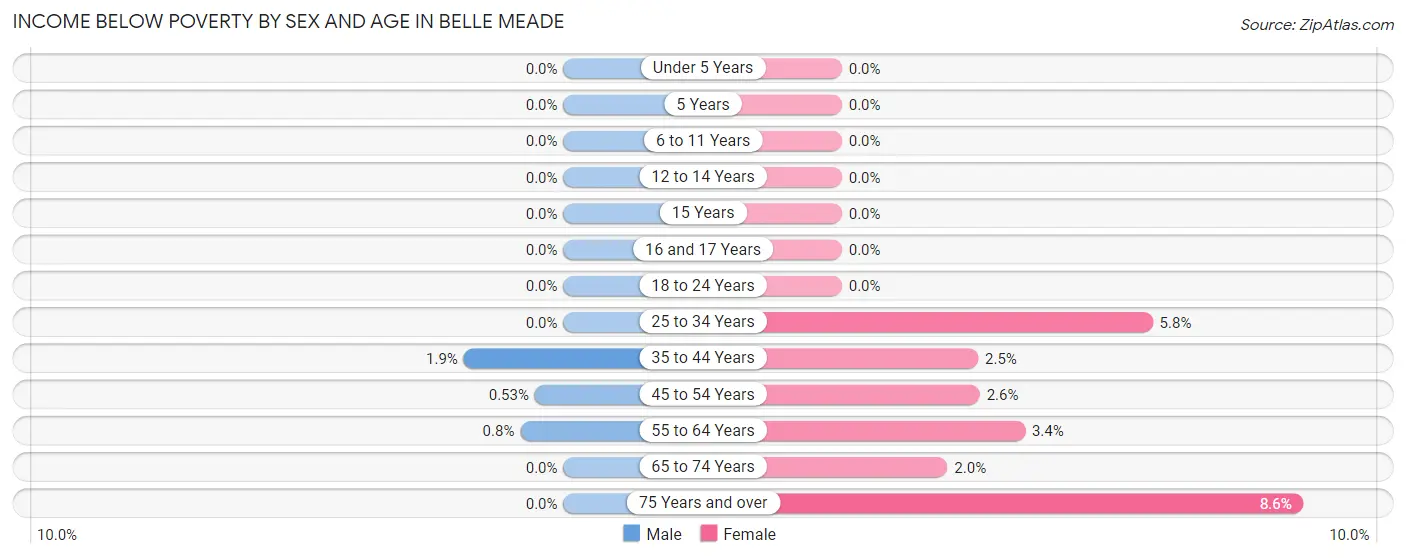
| Age Bracket | Male | Female |
| Under 5 Years | 0 (0.0%) | 0 (0.0%) |
| 5 Years | 0 (0.0%) | 0 (0.0%) |
| 6 to 11 Years | 0 (0.0%) | 0 (0.0%) |
| 12 to 14 Years | 0 (0.0%) | 0 (0.0%) |
| 15 Years | 0 (0.0%) | 0 (0.0%) |
| 16 and 17 Years | 0 (0.0%) | 0 (0.0%) |
| 18 to 24 Years | 0 (0.0%) | 0 (0.0%) |
| 25 to 34 Years | 0 (0.0%) | 6 (5.8%) |
| 35 to 44 Years | 3 (1.8%) | 4 (2.5%) |
| 45 to 54 Years | 1 (0.5%) | 6 (2.6%) |
| 55 to 64 Years | 2 (0.8%) | 8 (3.4%) |
| 65 to 74 Years | 0 (0.0%) | 3 (2.0%) |
| 75 Years and over | 0 (0.0%) | 9 (8.6%) |
| Total | 6 (0.4%) | 36 (2.4%) |
Income Above Poverty by Sex and Age in Belle Meade
According to the poverty statistics in Belle Meade, males aged under 5 years and females aged under 5 years are the age groups that are most secure financially, with 100.0% of males and 100.0% of females in these age groups living above the poverty line.
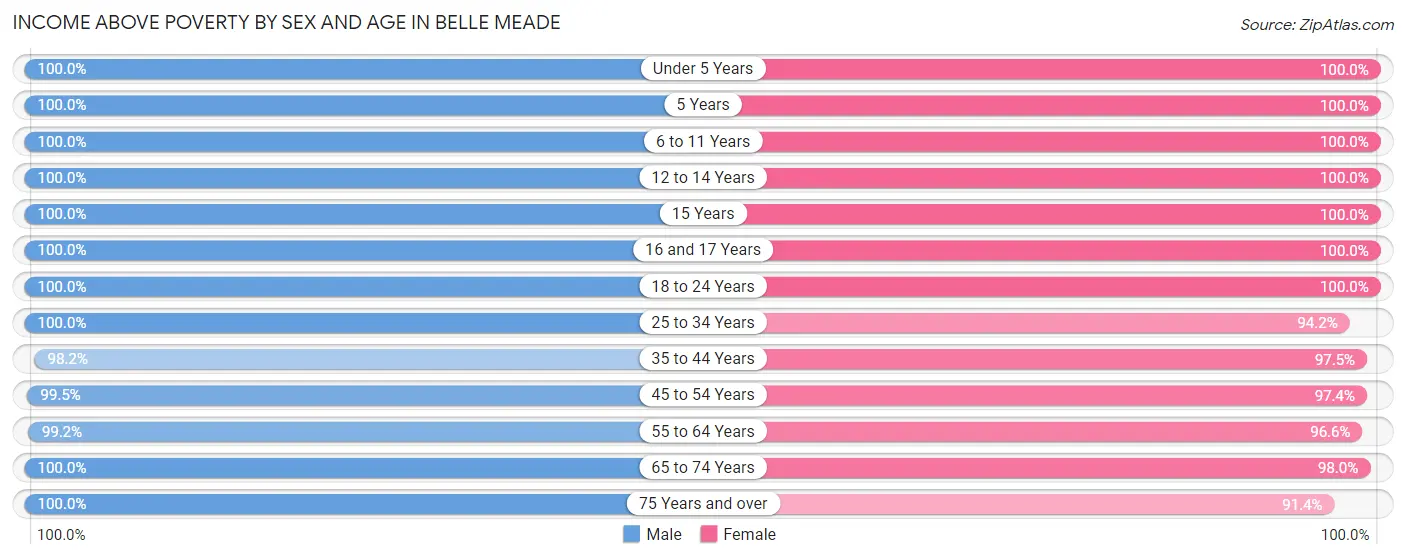
| Age Bracket | Male | Female |
| Under 5 Years | 78 (100.0%) | 54 (100.0%) |
| 5 Years | 10 (100.0%) | 19 (100.0%) |
| 6 to 11 Years | 122 (100.0%) | 187 (100.0%) |
| 12 to 14 Years | 90 (100.0%) | 74 (100.0%) |
| 15 Years | 9 (100.0%) | 10 (100.0%) |
| 16 and 17 Years | 88 (100.0%) | 39 (100.0%) |
| 18 to 24 Years | 133 (100.0%) | 121 (100.0%) |
| 25 to 34 Years | 58 (100.0%) | 98 (94.2%) |
| 35 to 44 Years | 159 (98.2%) | 154 (97.5%) |
| 45 to 54 Years | 186 (99.5%) | 228 (97.4%) |
| 55 to 64 Years | 248 (99.2%) | 227 (96.6%) |
| 65 to 74 Years | 131 (100.0%) | 150 (98.0%) |
| 75 Years and over | 117 (100.0%) | 96 (91.4%) |
| Total | 1,429 (99.6%) | 1,457 (97.6%) |
Income Below Poverty Among Married-Couple Families in Belle Meade
The poverty statistics for married-couple families in Belle Meade show that 0.1% or 1 of the total 789 families live below the poverty line. Families with no children have the highest poverty rate of 0.2%, comprising of 1 families. On the other hand, families with 1 or 2 children have the lowest poverty rate of 0.0%, which includes 0 families.
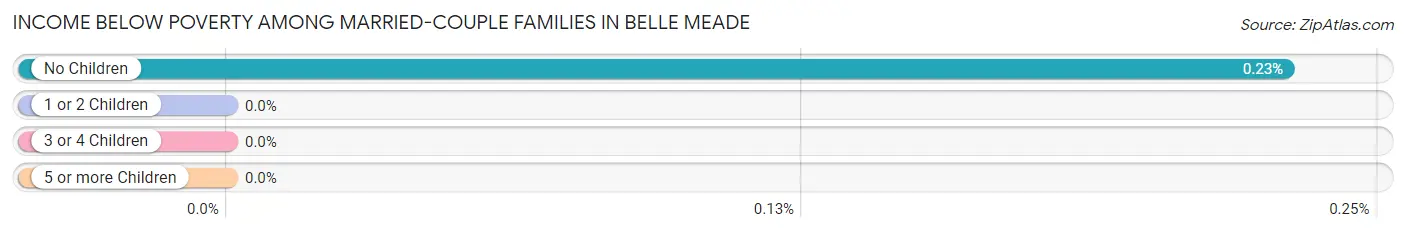
| Children | Above Poverty | Below Poverty |
| No Children | 437 (99.8%) | 1 (0.2%) |
| 1 or 2 Children | 245 (100.0%) | 0 (0.0%) |
| 3 or 4 Children | 102 (100.0%) | 0 (0.0%) |
| 5 or more Children | 4 (100.0%) | 0 (0.0%) |
| Total | 788 (99.9%) | 1 (0.1%) |
Income Below Poverty Among Single-Parent Households in Belle Meade
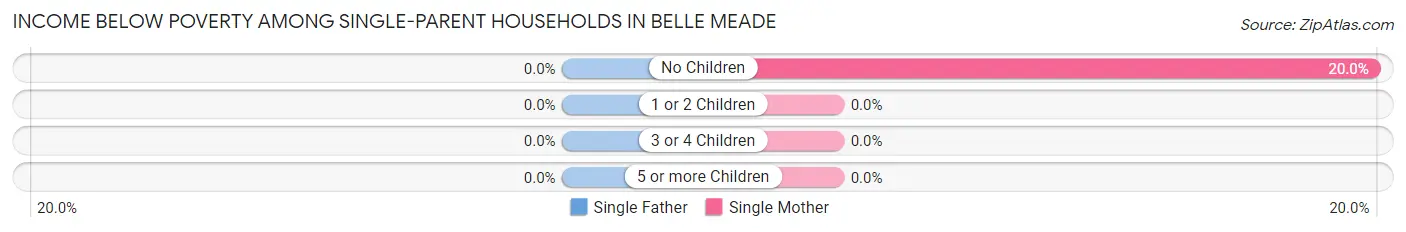
| Children | Single Father | Single Mother |
| No Children | 0 (0.0%) | 4 (20.0%) |
| 1 or 2 Children | 0 (0.0%) | 0 (0.0%) |
| 3 or 4 Children | 0 (0.0%) | 0 (0.0%) |
| 5 or more Children | 0 (0.0%) | 0 (0.0%) |
| Total | 0 (0.0%) | 4 (14.8%) |
Income Below Poverty Among Married-Couple vs Single-Parent Households in Belle Meade
The poverty data for Belle Meade shows that 1 of the married-couple family households (0.1%) and 4 of the single-parent households (11.1%) are living below the poverty level. Within the married-couple family households, those with no children have the highest poverty rate, with 1 households (0.2%) falling below the poverty line. Among the single-parent households, those with no children have the highest poverty rate, with 4 household (20.0%) living below poverty.
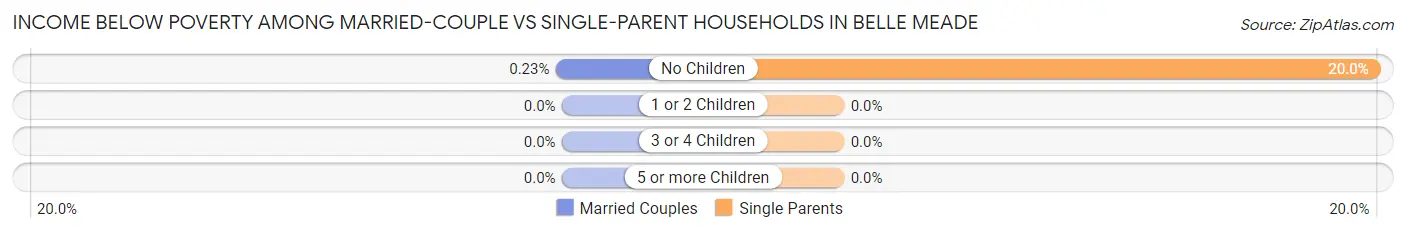
| Children | Married-Couple Families | Single-Parent Households |
| No Children | 1 (0.2%) | 4 (20.0%) |
| 1 or 2 Children | 0 (0.0%) | 0 (0.0%) |
| 3 or 4 Children | 0 (0.0%) | 0 (0.0%) |
| 5 or more Children | 0 (0.0%) | 0 (0.0%) |
| Total | 1 (0.1%) | 4 (11.1%) |
Race in Belle Meade
The most populous races in Belle Meade are White / Caucasian (2,801 | 95.5%), Two or more Races (104 | 3.5%), and Hispanic or Latino (18 | 0.6%).
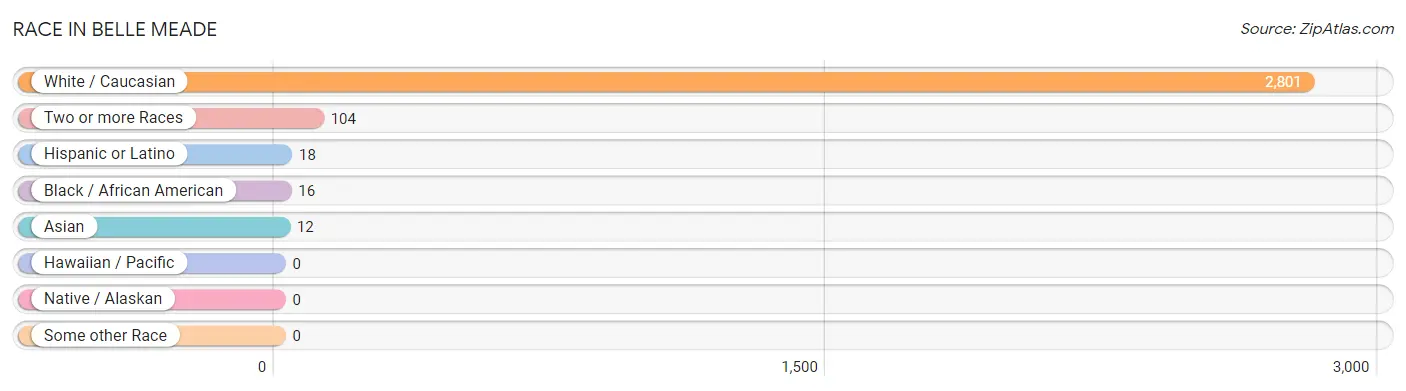
| Race | # Population | % Population |
| Asian | 12 | 0.4% |
| Black / African American | 16 | 0.5% |
| Hawaiian / Pacific | 0 | 0.0% |
| Hispanic or Latino | 18 | 0.6% |
| Native / Alaskan | 0 | 0.0% |
| White / Caucasian | 2,801 | 95.5% |
| Two or more Races | 104 | 3.5% |
| Some other Race | 0 | 0.0% |
| Total | 2,933 | 100.0% |
Ancestry in Belle Meade
The most populous ancestries reported in Belle Meade are English (828 | 28.2%), Irish (273 | 9.3%), French (267 | 9.1%), German (185 | 6.3%), and American (170 | 5.8%), together accounting for 58.8% of all Belle Meade residents.
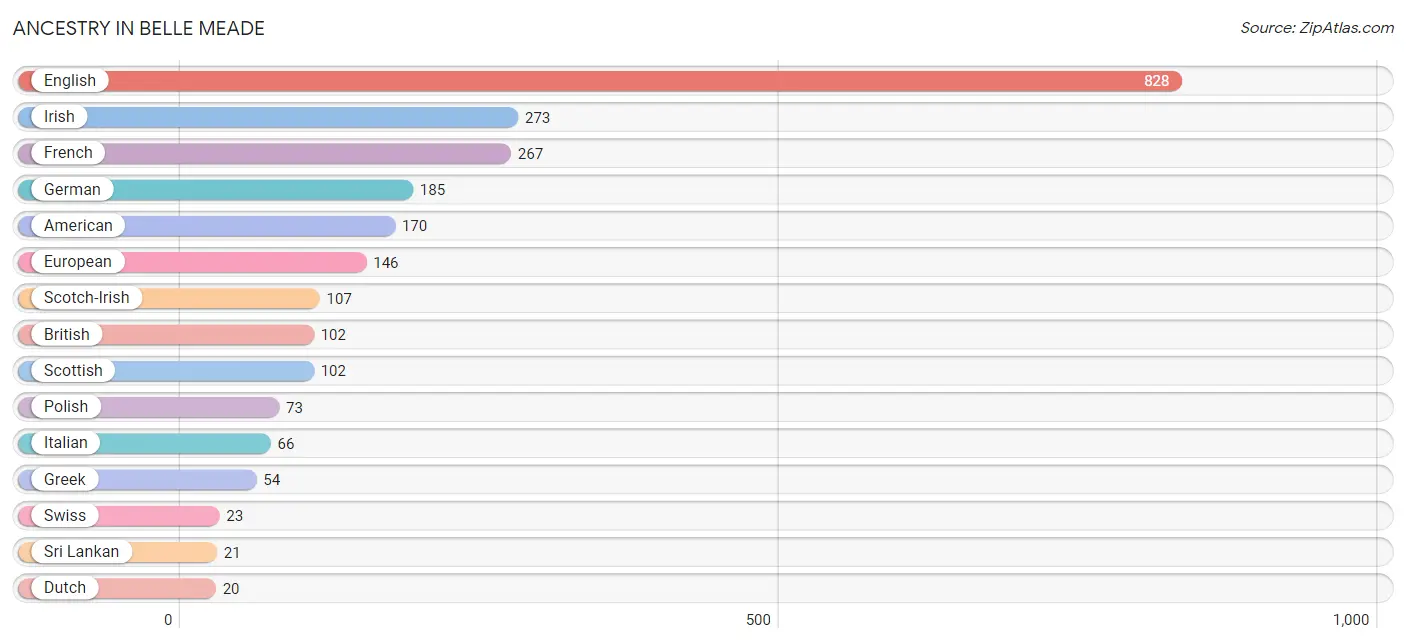
| Ancestry | # Population | % Population |
| American | 170 | 5.8% |
| Arab | 7 | 0.2% |
| Armenian | 6 | 0.2% |
| Bhutanese | 4 | 0.1% |
| British | 102 | 3.5% |
| Burmese | 3 | 0.1% |
| Central American | 18 | 0.6% |
| Cherokee | 4 | 0.1% |
| Czech | 5 | 0.2% |
| Dutch | 20 | 0.7% |
| Eastern European | 5 | 0.2% |
| English | 828 | 28.2% |
| European | 146 | 5.0% |
| French | 267 | 9.1% |
| French Canadian | 3 | 0.1% |
| German | 185 | 6.3% |
| Greek | 54 | 1.8% |
| Hungarian | 5 | 0.2% |
| Irish | 273 | 9.3% |
| Italian | 66 | 2.2% |
| Latvian | 4 | 0.1% |
| Lebanese | 3 | 0.1% |
| Lithuanian | 2 | 0.1% |
| Northern European | 5 | 0.2% |
| Polish | 73 | 2.5% |
| Salvadoran | 18 | 0.6% |
| Scandinavian | 17 | 0.6% |
| Scotch-Irish | 107 | 3.6% |
| Scottish | 102 | 3.5% |
| Slovak | 7 | 0.2% |
| Sri Lankan | 21 | 0.7% |
| Swedish | 11 | 0.4% |
| Swiss | 23 | 0.8% |
| Syrian | 4 | 0.1% |
| Welsh | 5 | 0.2% | View All 35 Rows |
Immigrants in Belle Meade
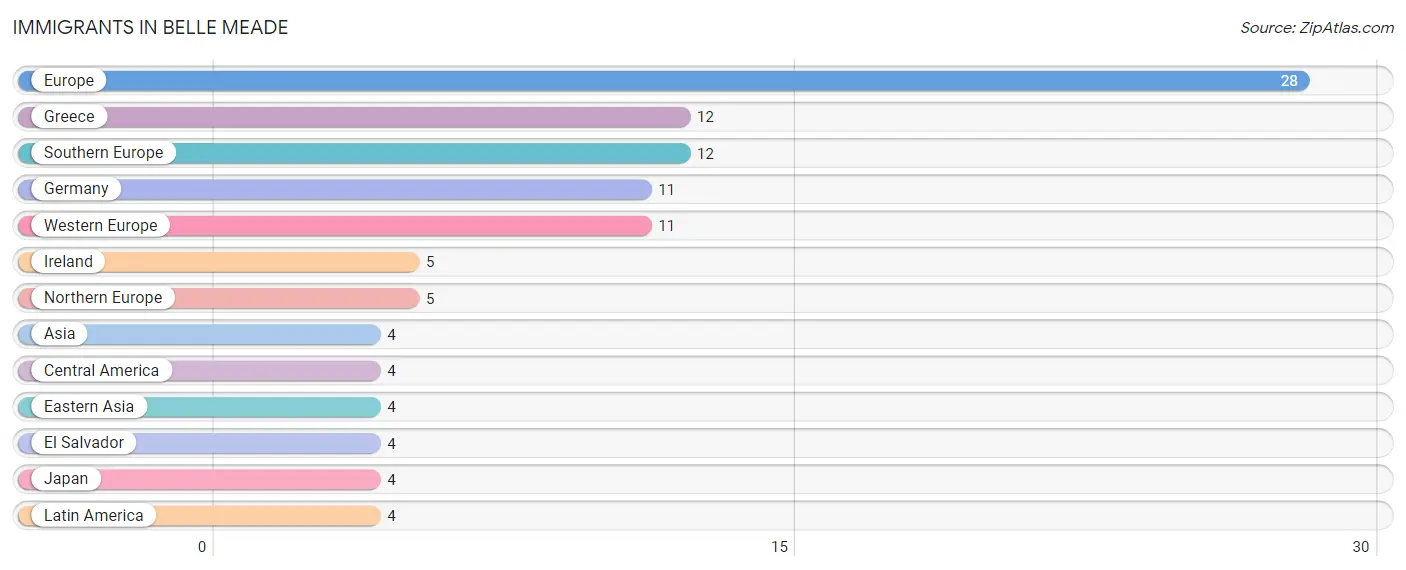
The most numerous immigrant groups reported in Belle Meade came from Europe (28 | 0.9%), Greece (12 | 0.4%), Southern Europe (12 | 0.4%), Germany (11 | 0.4%), and Western Europe (11 | 0.4%), together accounting for 2.5% of all Belle Meade residents.
| Immigration Origin | # Population | % Population |
| Asia | 4 | 0.1% |
| Central America | 4 | 0.1% |
| Eastern Asia | 4 | 0.1% |
| El Salvador | 4 | 0.1% |
| Europe | 28 | 0.9% |
| Germany | 11 | 0.4% |
| Greece | 12 | 0.4% |
| Ireland | 5 | 0.2% |
| Japan | 4 | 0.1% |
| Latin America | 4 | 0.1% |
| Northern Europe | 5 | 0.2% |
| Southern Europe | 12 | 0.4% |
| Western Europe | 11 | 0.4% | View All 13 Rows |
Sex and Age in Belle Meade
Sex and Age in Belle Meade
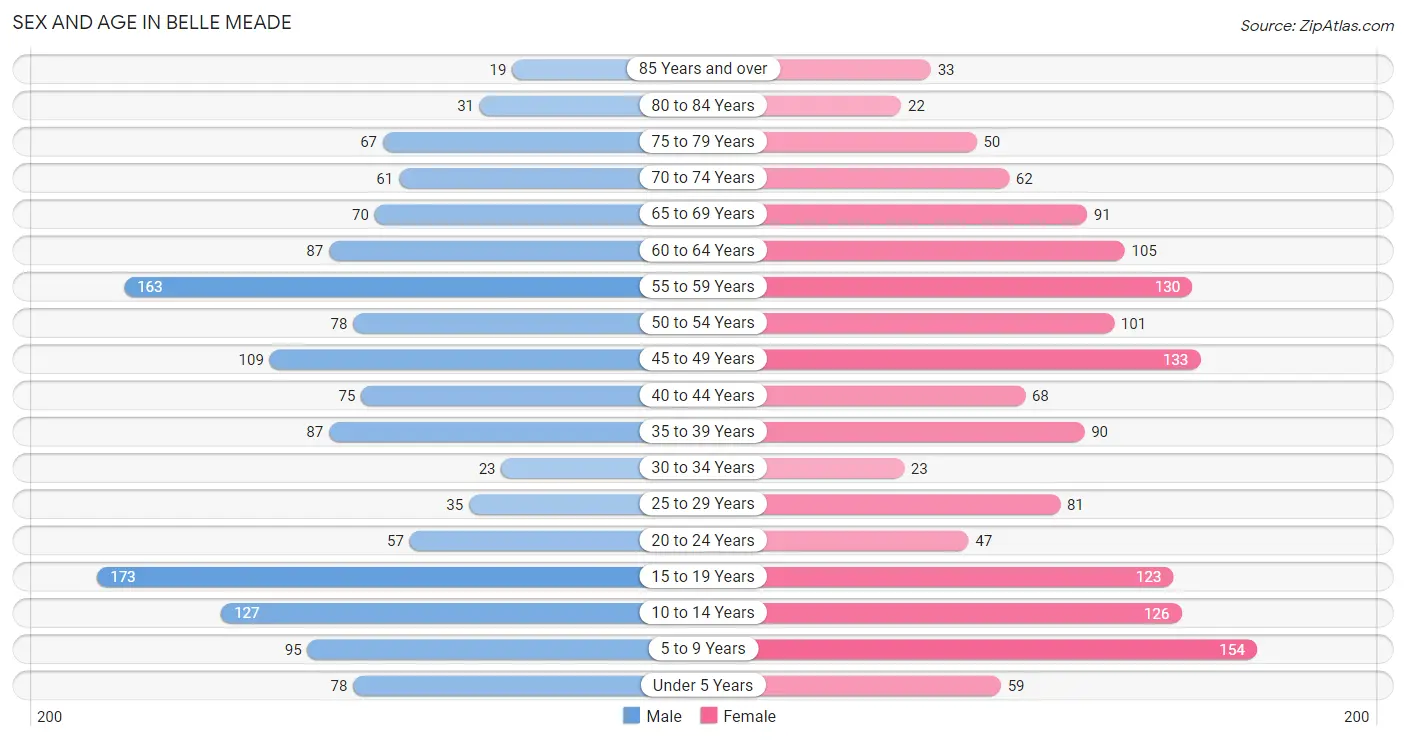
The most populous age groups in Belle Meade are 15 to 19 Years (173 | 12.1%) for men and 5 to 9 Years (154 | 10.3%) for women.
| Age Bracket | Male | Female |
| Under 5 Years | 78 (5.4%) | 59 (3.9%) |
| 5 to 9 Years | 95 (6.6%) | 154 (10.3%) |
| 10 to 14 Years | 127 (8.8%) | 126 (8.4%) |
| 15 to 19 Years | 173 (12.1%) | 123 (8.2%) |
| 20 to 24 Years | 57 (4.0%) | 47 (3.1%) |
| 25 to 29 Years | 35 (2.4%) | 81 (5.4%) |
| 30 to 34 Years | 23 (1.6%) | 23 (1.5%) |
| 35 to 39 Years | 87 (6.1%) | 90 (6.0%) |
| 40 to 44 Years | 75 (5.2%) | 68 (4.5%) |
| 45 to 49 Years | 109 (7.6%) | 133 (8.9%) |
| 50 to 54 Years | 78 (5.4%) | 101 (6.7%) |
| 55 to 59 Years | 163 (11.4%) | 130 (8.7%) |
| 60 to 64 Years | 87 (6.1%) | 105 (7.0%) |
| 65 to 69 Years | 70 (4.9%) | 91 (6.1%) |
| 70 to 74 Years | 61 (4.3%) | 62 (4.1%) |
| 75 to 79 Years | 67 (4.7%) | 50 (3.3%) |
| 80 to 84 Years | 31 (2.2%) | 22 (1.5%) |
| 85 Years and over | 19 (1.3%) | 33 (2.2%) |
| Total | 1,435 (100.0%) | 1,498 (100.0%) |
Families and Households in Belle Meade
Median Family Size in Belle Meade
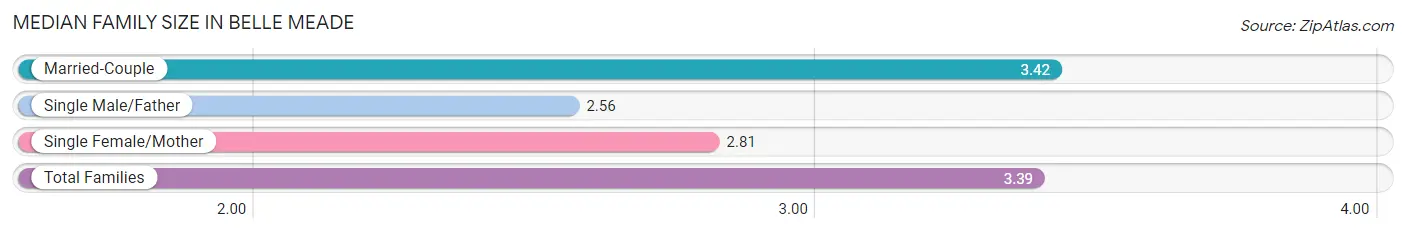
The median family size in Belle Meade is 3.39 persons per family, with married-couple families (789 | 95.6%) accounting for the largest median family size of 3.42 persons per family. On the other hand, single male/father families (9 | 1.1%) represent the smallest median family size with 2.56 persons per family.
| Family Type | # Families | Family Size |
| Married-Couple | 789 (95.6%) | 3.42 |
| Single Male/Father | 9 (1.1%) | 2.56 |
| Single Female/Mother | 27 (3.3%) | 2.81 |
| Total Families | 825 (100.0%) | 3.39 |
Median Household Size in Belle Meade
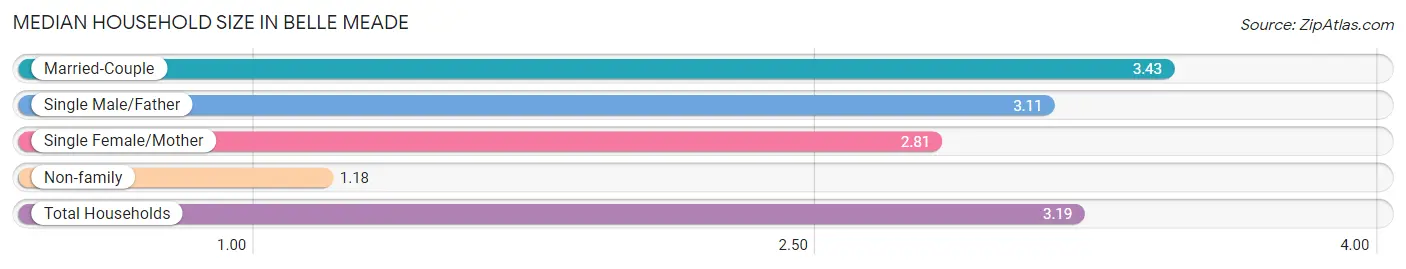
The median household size in Belle Meade is 3.19 persons per household, with married-couple households (789 | 86.2%) accounting for the largest median household size of 3.43 persons per household. non-family households (90 | 9.8%) represent the smallest median household size with 1.18 persons per household.
| Household Type | # Households | Household Size |
| Married-Couple | 789 (86.2%) | 3.43 |
| Single Male/Father | 9 (1.0%) | 3.11 |
| Single Female/Mother | 27 (2.9%) | 2.81 |
| Non-family | 90 (9.8%) | 1.18 |
| Total Households | 915 (100.0%) | 3.19 |
Household Size by Marriage Status in Belle Meade
Out of a total of 915 households in Belle Meade, 825 (90.2%) are family households, while 90 (9.8%) are nonfamily households. The most numerous type of family households are 2-person households, comprising 372, and the most common type of nonfamily households are 1-person households, comprising 74.
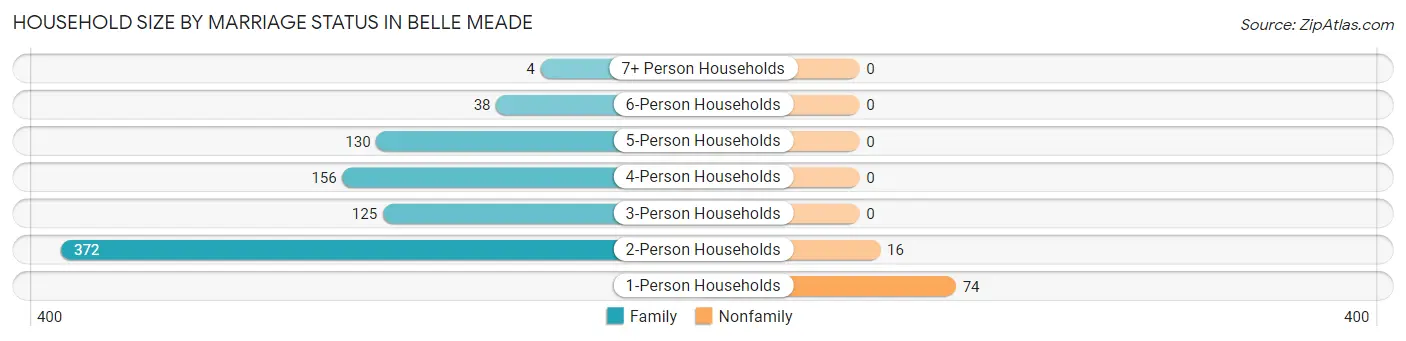
| Household Size | Family Households | Nonfamily Households |
| 1-Person Households | - | 74 (8.1%) |
| 2-Person Households | 372 (40.7%) | 16 (1.8%) |
| 3-Person Households | 125 (13.7%) | 0 (0.0%) |
| 4-Person Households | 156 (17.1%) | 0 (0.0%) |
| 5-Person Households | 130 (14.2%) | 0 (0.0%) |
| 6-Person Households | 38 (4.2%) | 0 (0.0%) |
| 7+ Person Households | 4 (0.4%) | 0 (0.0%) |
| Total | 825 (90.2%) | 90 (9.8%) |
Female Fertility in Belle Meade
Fertility by Age in Belle Meade
Average fertility rate in Belle Meade is 61.0 births per 1,000 women. Women in the age bracket of 35 to 50 years have the highest fertility rate with 88.0 births per 1,000 women. Women in the age bracket of 35 to 50 years acount for 74.3% of all women with births.
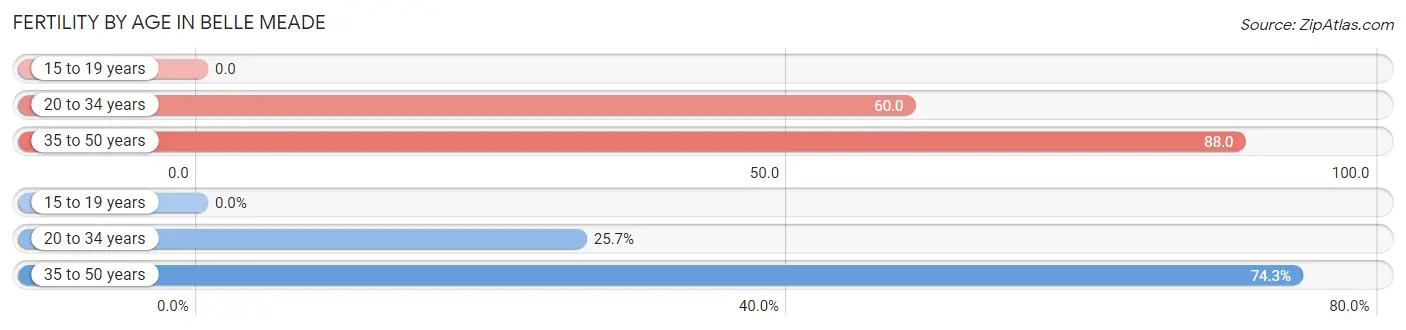
| Age Bracket | Women with Births | Births / 1,000 Women |
| 15 to 19 years | 0 (0.0%) | 0.0 |
| 20 to 34 years | 9 (25.7%) | 60.0 |
| 35 to 50 years | 26 (74.3%) | 88.0 |
| Total | 35 (100.0%) | 61.0 |
Fertility by Age by Marriage Status in Belle Meade
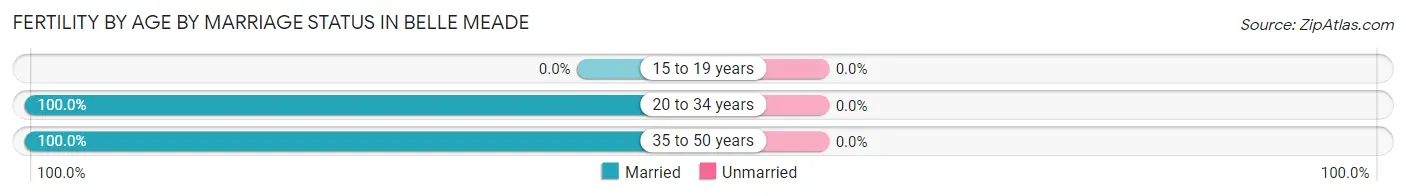
| Age Bracket | Married | Unmarried |
| 15 to 19 years | 0 (0.0%) | 0 (0.0%) |
| 20 to 34 years | 9 (100.0%) | 0 (0.0%) |
| 35 to 50 years | 26 (100.0%) | 0 (0.0%) |
| Total | 35 (100.0%) | 0 (0.0%) |
Fertility by Education in Belle Meade
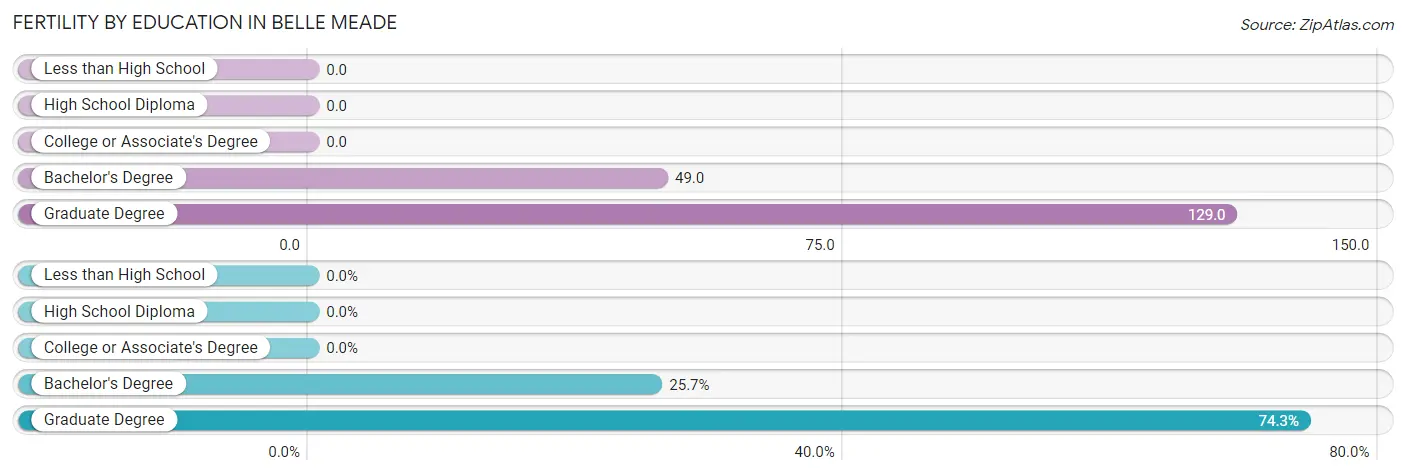
| Educational Attainment | Women with Births | Births / 1,000 Women |
| Less than High School | 0 (0.0%) | 0.0 |
| High School Diploma | 0 (0.0%) | 0.0 |
| College or Associate's Degree | 0 (0.0%) | 0.0 |
| Bachelor's Degree | 9 (25.7%) | 49.0 |
| Graduate Degree | 26 (74.3%) | 129.0 |
| Total | 35 (100.0%) | 61.0 |
Fertility by Education by Marriage Status in Belle Meade
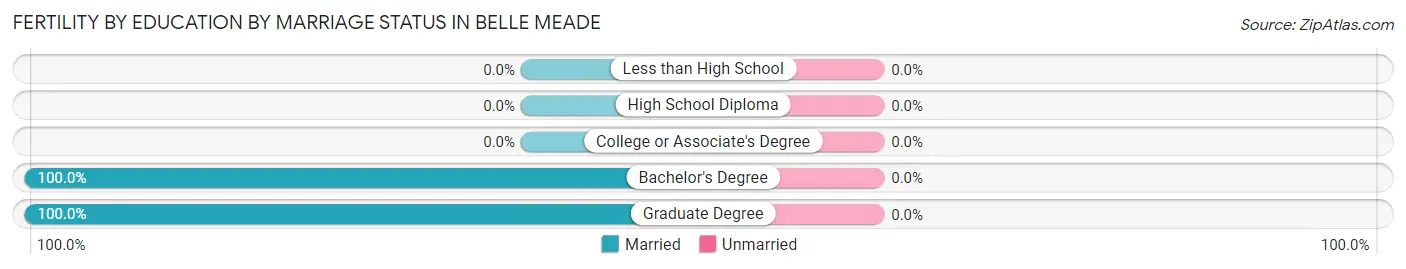
| Educational Attainment | Married | Unmarried |
| Less than High School | 0 (0.0%) | 0 (0.0%) |
| High School Diploma | 0 (0.0%) | 0 (0.0%) |
| College or Associate's Degree | 0 (0.0%) | 0 (0.0%) |
| Bachelor's Degree | 9 (100.0%) | 0 (0.0%) |
| Graduate Degree | 26 (100.0%) | 0 (0.0%) |
| Total | 35 (100.0%) | 0 (0.0%) |
Employment Characteristics in Belle Meade
Employment by Class of Employer in Belle Meade
Among the 1,330 employed individuals in Belle Meade, private company employees (750 | 56.4%), not-for-profit organizations (232 | 17.4%), and self-employed (not incorporated) (147 | 11.1%) make up the most common classes of employment.
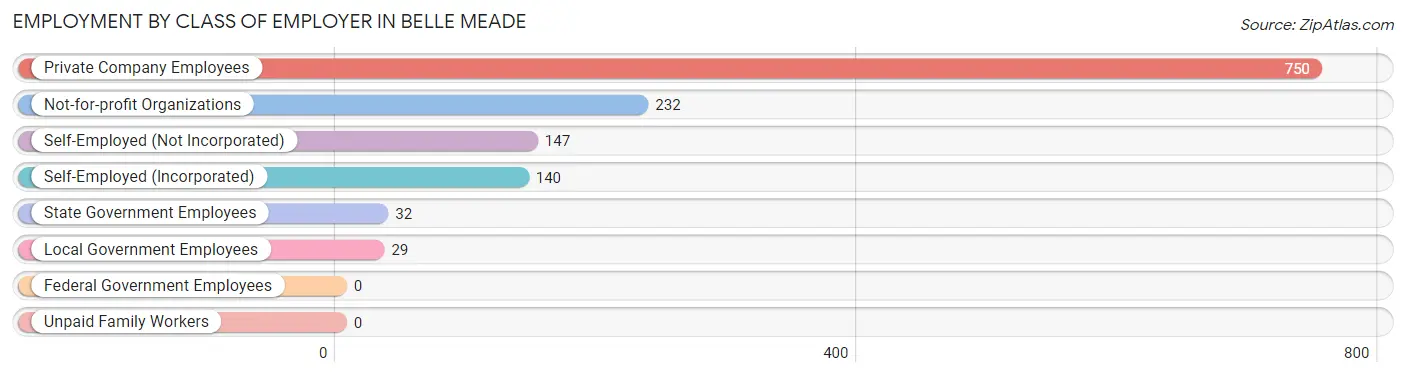
| Employer Class | # Employees | % Employees |
| Private Company Employees | 750 | 56.4% |
| Self-Employed (Incorporated) | 140 | 10.5% |
| Self-Employed (Not Incorporated) | 147 | 11.1% |
| Not-for-profit Organizations | 232 | 17.4% |
| Local Government Employees | 29 | 2.2% |
| State Government Employees | 32 | 2.4% |
| Federal Government Employees | 0 | 0.0% |
| Unpaid Family Workers | 0 | 0.0% |
| Total | 1,330 | 100.0% |
Employment Status by Age in Belle Meade
According to the labor force statistics for Belle Meade, out of the total population over 16 years of age (2,275), 59.5% or 1,354 individuals are in the labor force, with 1.0% or 14 of them unemployed. The age group with the highest labor force participation rate is 25 to 29 years, with 100.0% or 116 individuals in the labor force. Within the labor force, the 25 to 29 years age range has the highest percentage of unemployed individuals, with 5.2% or 6 of them being unemployed.
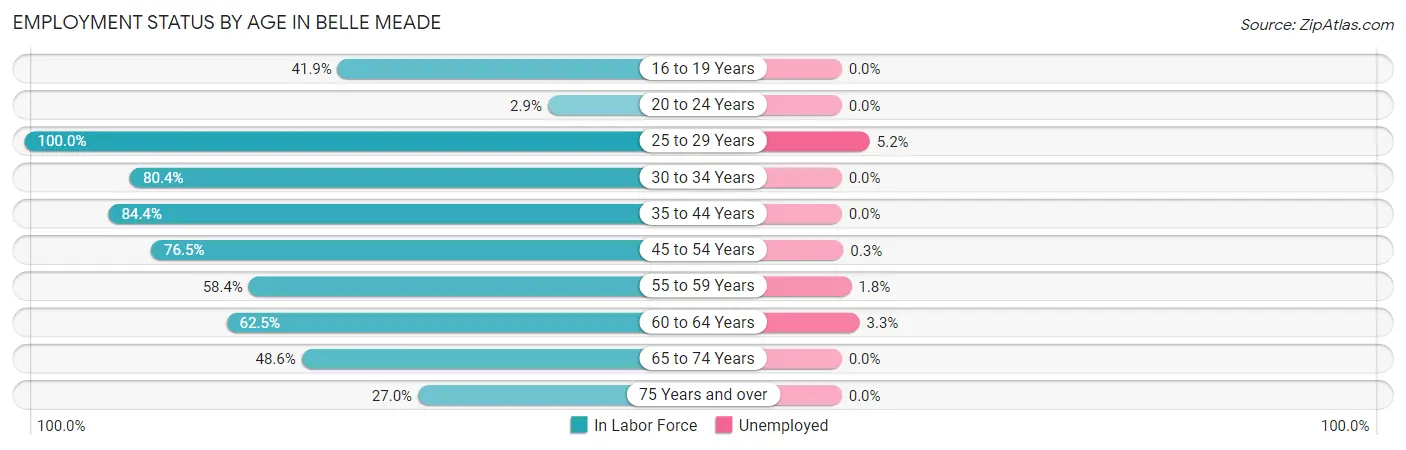
| Age Bracket | In Labor Force | Unemployed |
| 16 to 19 Years | 116 (41.9%) | 0 (0.0%) |
| 20 to 24 Years | 3 (2.9%) | 0 (0.0%) |
| 25 to 29 Years | 116 (100.0%) | 6 (5.2%) |
| 30 to 34 Years | 37 (80.4%) | 0 (0.0%) |
| 35 to 44 Years | 270 (84.4%) | 0 (0.0%) |
| 45 to 54 Years | 322 (76.5%) | 1 (0.3%) |
| 55 to 59 Years | 171 (58.4%) | 3 (1.8%) |
| 60 to 64 Years | 120 (62.5%) | 4 (3.3%) |
| 65 to 74 Years | 138 (48.6%) | 0 (0.0%) |
| 75 Years and over | 60 (27.0%) | 0 (0.0%) |
| Total | 1,354 (59.5%) | 14 (1.0%) |
Employment Status by Educational Attainment in Belle Meade
According to labor force statistics for Belle Meade, 74.6% of individuals (1,035) out of the total population between 25 and 64 years of age (1,388) are in the labor force, with 1.4% or 14 of them being unemployed. The group with the highest labor force participation rate are those with the educational attainment of high school diploma, with 89.1% or 57 individuals in the labor force. Within the labor force, individuals with college / associate degree education have the highest percentage of unemployment, with 20.0% or 6 of them being unemployed.
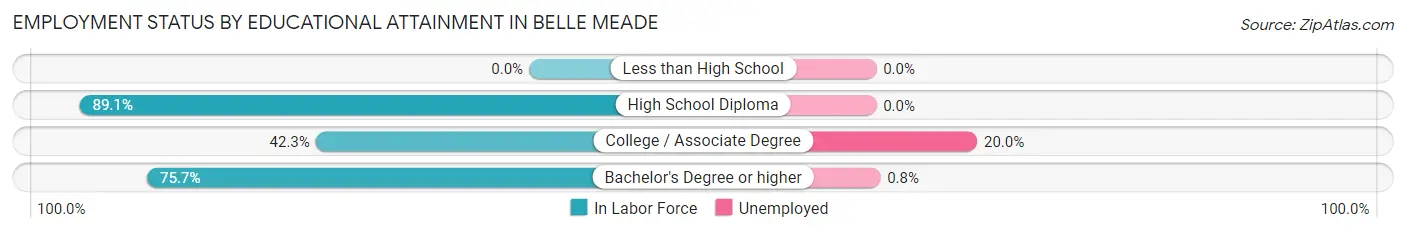
| Educational Attainment | In Labor Force | Unemployed |
| Less than High School | 0 (0.0%) | 0 (0.0%) |
| High School Diploma | 57 (89.1%) | 0 (0.0%) |
| College / Associate Degree | 30 (42.3%) | 14 (20.0%) |
| Bachelor's Degree or higher | 949 (75.7%) | 10 (0.8%) |
| Total | 1,035 (74.6%) | 19 (1.4%) |
Employment Occupations by Sex in Belle Meade
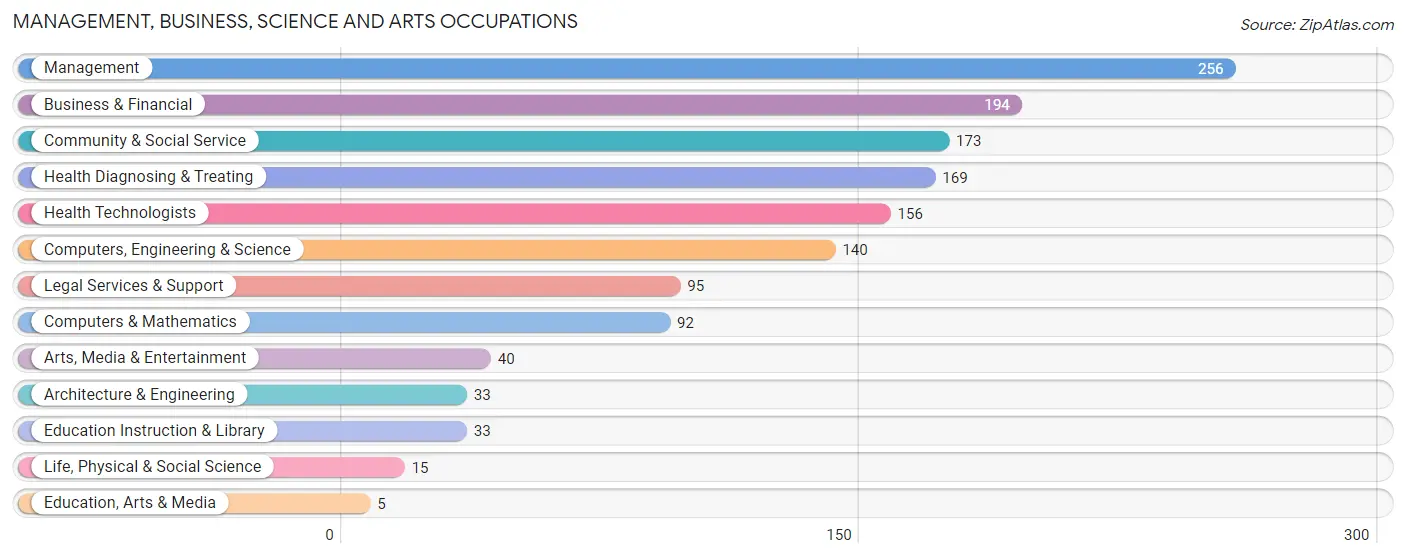
Management, Business, Science and Arts Occupations
The most common Management, Business, Science and Arts occupations in Belle Meade are Management (256 | 19.1%), Business & Financial (194 | 14.5%), Community & Social Service (173 | 12.9%), Health Diagnosing & Treating (169 | 12.6%), and Health Technologists (156 | 11.7%).
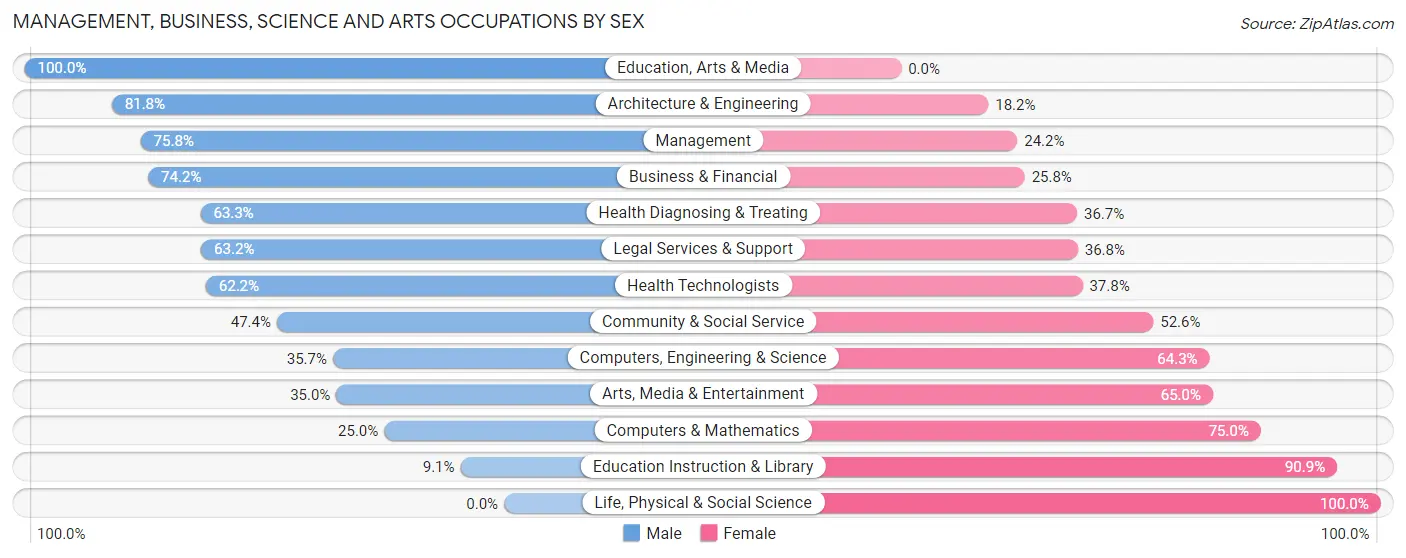
Management, Business, Science and Arts Occupations by Sex
Within the Management, Business, Science and Arts occupations in Belle Meade, the most male-oriented occupations are Education, Arts & Media (100.0%), Architecture & Engineering (81.8%), and Management (75.8%), while the most female-oriented occupations are Life, Physical & Social Science (100.0%), Education Instruction & Library (90.9%), and Computers & Mathematics (75.0%).
| Occupation | Male | Female |
| Management | 194 (75.8%) | 62 (24.2%) |
| Business & Financial | 144 (74.2%) | 50 (25.8%) |
| Computers, Engineering & Science | 50 (35.7%) | 90 (64.3%) |
| Computers & Mathematics | 23 (25.0%) | 69 (75.0%) |
| Architecture & Engineering | 27 (81.8%) | 6 (18.2%) |
| Life, Physical & Social Science | 0 (0.0%) | 15 (100.0%) |
| Community & Social Service | 82 (47.4%) | 91 (52.6%) |
| Education, Arts & Media | 5 (100.0%) | 0 (0.0%) |
| Legal Services & Support | 60 (63.2%) | 35 (36.8%) |
| Education Instruction & Library | 3 (9.1%) | 30 (90.9%) |
| Arts, Media & Entertainment | 14 (35.0%) | 26 (65.0%) |
| Health Diagnosing & Treating | 107 (63.3%) | 62 (36.7%) |
| Health Technologists | 97 (62.2%) | 59 (37.8%) |
| Total (Category) | 577 (61.9%) | 355 (38.1%) |
| Total (Overall) | 805 (60.1%) | 534 (39.9%) |
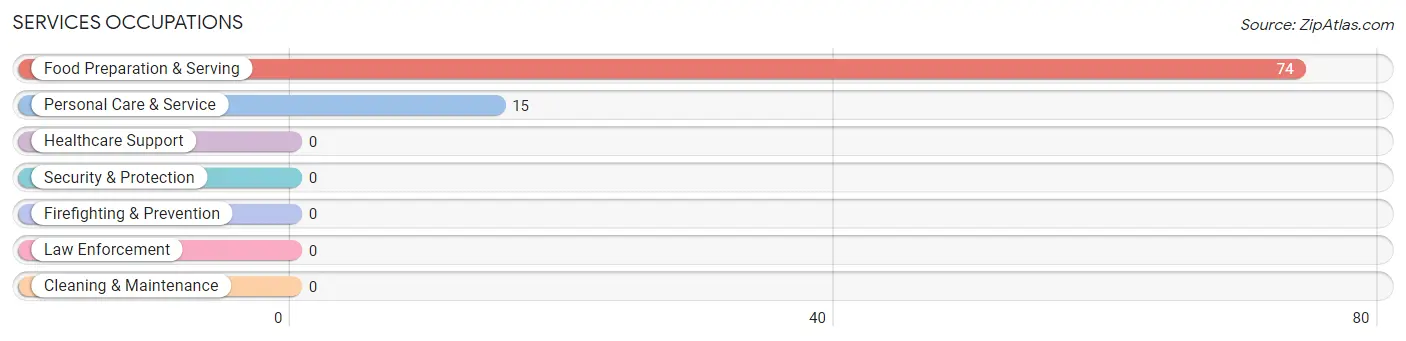
Services Occupations
The most common Services occupations in Belle Meade are Food Preparation & Serving (74 | 5.5%), and Personal Care & Service (15 | 1.1%).
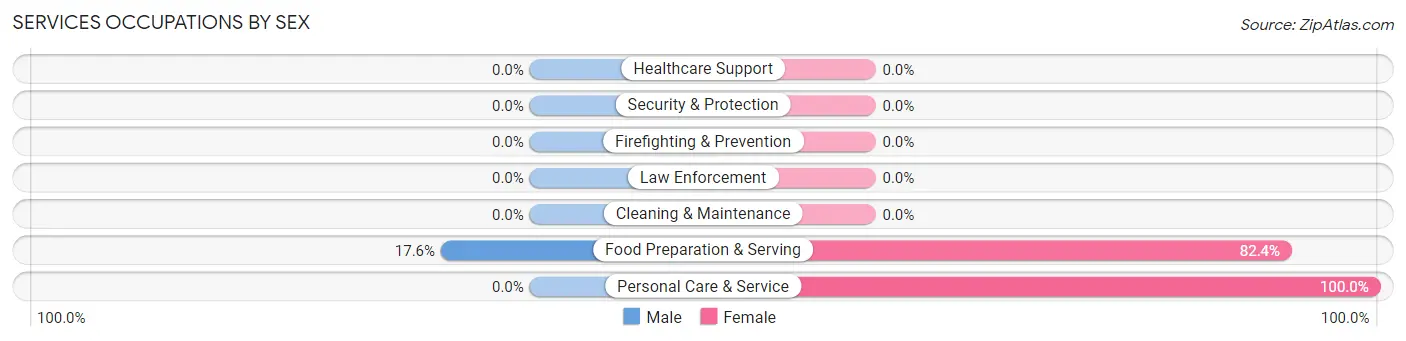
Services Occupations by Sex
| Occupation | Male | Female |
| Healthcare Support | 0 (0.0%) | 0 (0.0%) |
| Security & Protection | 0 (0.0%) | 0 (0.0%) |
| Firefighting & Prevention | 0 (0.0%) | 0 (0.0%) |
| Law Enforcement | 0 (0.0%) | 0 (0.0%) |
| Food Preparation & Serving | 13 (17.6%) | 61 (82.4%) |
| Cleaning & Maintenance | 0 (0.0%) | 0 (0.0%) |
| Personal Care & Service | 0 (0.0%) | 15 (100.0%) |
| Total (Category) | 13 (14.6%) | 76 (85.4%) |
| Total (Overall) | 805 (60.1%) | 534 (39.9%) |
Sales and Office Occupations
The most common Sales and Office occupations in Belle Meade are Sales & Related (158 | 11.8%), and Office & Administration (63 | 4.7%).

Sales and Office Occupations by Sex

| Occupation | Male | Female |
| Sales & Related | 105 (66.5%) | 53 (33.5%) |
| Office & Administration | 20 (31.8%) | 43 (68.2%) |
| Total (Category) | 125 (56.6%) | 96 (43.4%) |
| Total (Overall) | 805 (60.1%) | 534 (39.9%) |
Natural Resources, Construction and Maintenance Occupations
The most common Natural Resources, Construction and Maintenance occupations in Belle Meade are Construction & Extraction (32 | 2.4%), and Installation, Maintenance & Repair (13 | 1.0%).

Natural Resources, Construction and Maintenance Occupations by Sex

| Occupation | Male | Female |
| Farming, Fishing & Forestry | 0 (0.0%) | 0 (0.0%) |
| Construction & Extraction | 32 (100.0%) | 0 (0.0%) |
| Installation, Maintenance & Repair | 13 (100.0%) | 0 (0.0%) |
| Total (Category) | 45 (100.0%) | 0 (0.0%) |
| Total (Overall) | 805 (60.1%) | 534 (39.9%) |
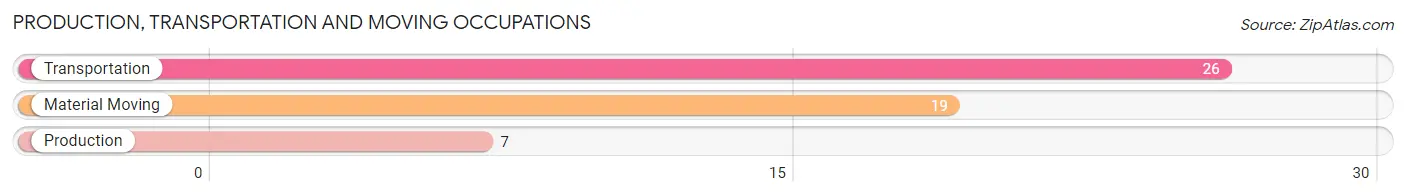
Production, Transportation and Moving Occupations
The most common Production, Transportation and Moving occupations in Belle Meade are Transportation (26 | 1.9%), Material Moving (19 | 1.4%), and Production (7 | 0.5%).
Production, Transportation and Moving Occupations by Sex
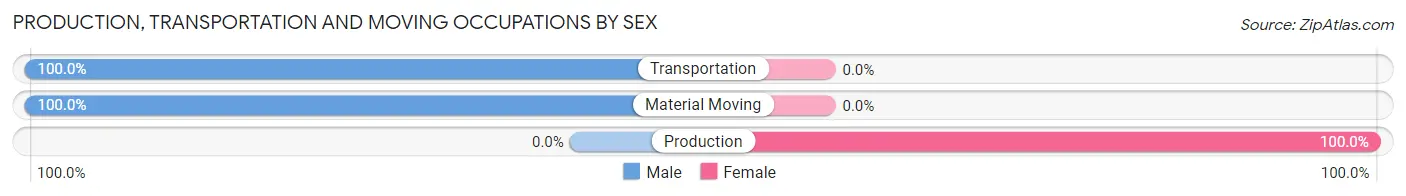
| Occupation | Male | Female |
| Production | 0 (0.0%) | 7 (100.0%) |
| Transportation | 26 (100.0%) | 0 (0.0%) |
| Material Moving | 19 (100.0%) | 0 (0.0%) |
| Total (Category) | 45 (86.5%) | 7 (13.5%) |
| Total (Overall) | 805 (60.1%) | 534 (39.9%) |
Employment Industries by Sex in Belle Meade
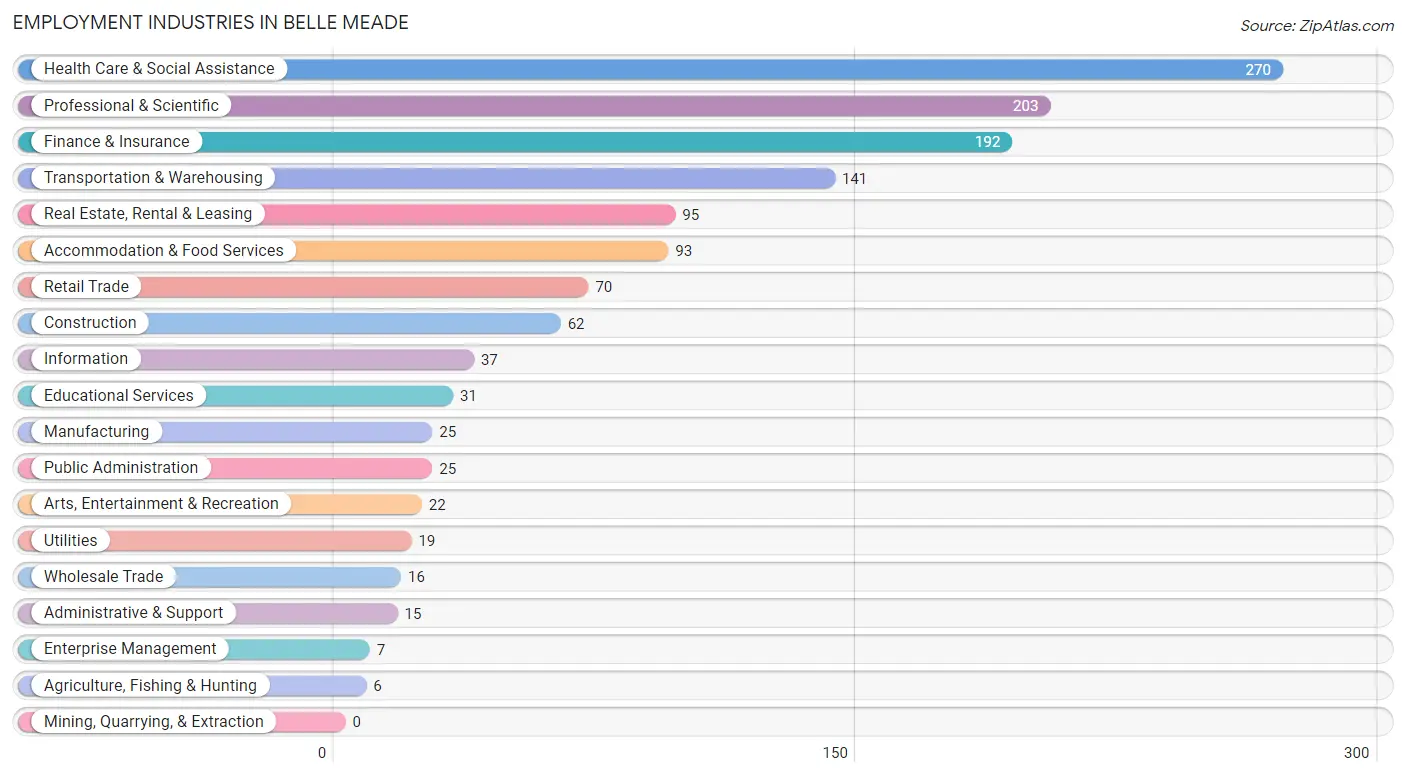
Employment Industries in Belle Meade
The major employment industries in Belle Meade include Health Care & Social Assistance (270 | 20.2%), Professional & Scientific (203 | 15.2%), Finance & Insurance (192 | 14.3%), Transportation & Warehousing (141 | 10.5%), and Real Estate, Rental & Leasing (95 | 7.1%).
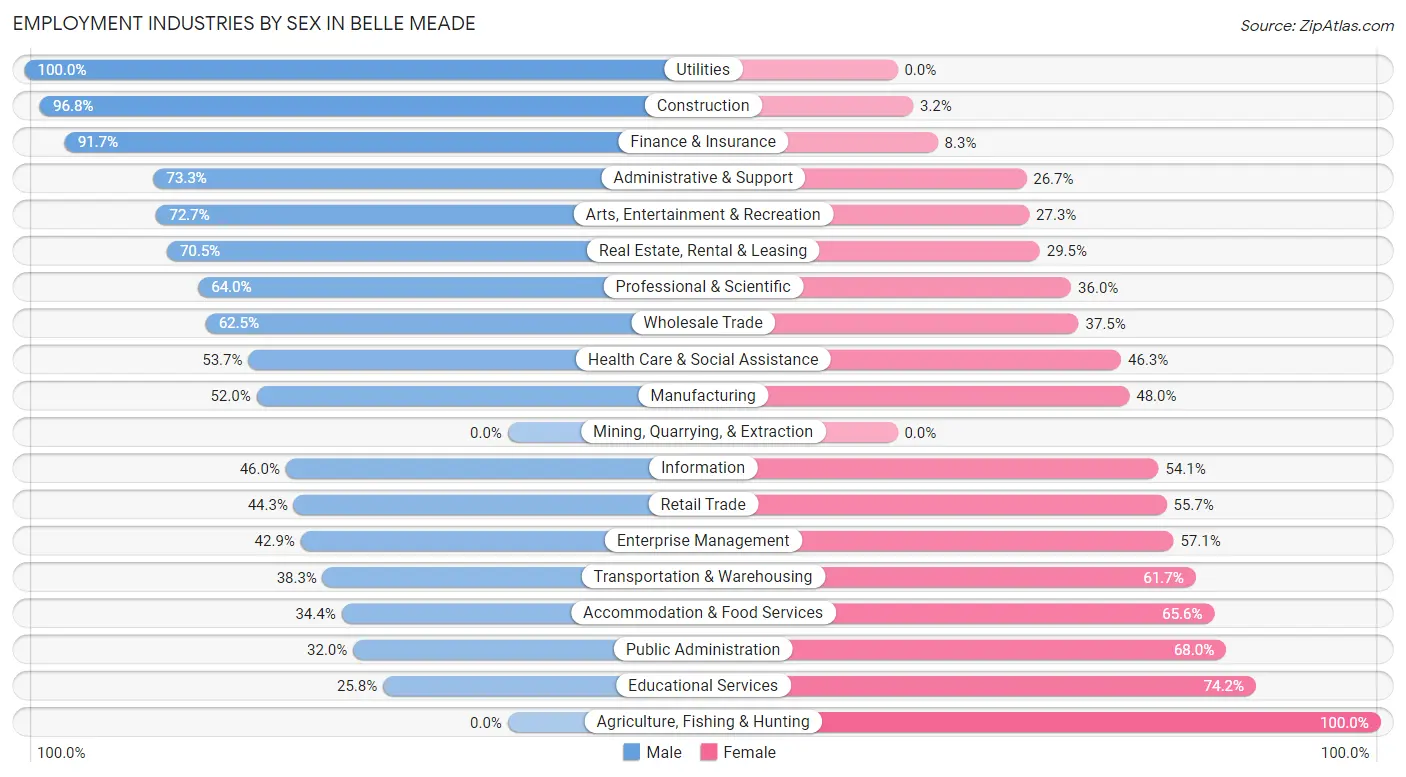
Employment Industries by Sex in Belle Meade
The Belle Meade industries that see more men than women are Utilities (100.0%), Construction (96.8%), and Finance & Insurance (91.7%), whereas the industries that tend to have a higher number of women are Agriculture, Fishing & Hunting (100.0%), Educational Services (74.2%), and Public Administration (68.0%).
| Industry | Male | Female |
| Agriculture, Fishing & Hunting | 0 (0.0%) | 6 (100.0%) |
| Mining, Quarrying, & Extraction | 0 (0.0%) | 0 (0.0%) |
| Construction | 60 (96.8%) | 2 (3.2%) |
| Manufacturing | 13 (52.0%) | 12 (48.0%) |
| Wholesale Trade | 10 (62.5%) | 6 (37.5%) |
| Retail Trade | 31 (44.3%) | 39 (55.7%) |
| Transportation & Warehousing | 54 (38.3%) | 87 (61.7%) |
| Utilities | 19 (100.0%) | 0 (0.0%) |
| Information | 17 (46.0%) | 20 (54.0%) |
| Finance & Insurance | 176 (91.7%) | 16 (8.3%) |
| Real Estate, Rental & Leasing | 67 (70.5%) | 28 (29.5%) |
| Professional & Scientific | 130 (64.0%) | 73 (36.0%) |
| Enterprise Management | 3 (42.9%) | 4 (57.1%) |
| Administrative & Support | 11 (73.3%) | 4 (26.7%) |
| Educational Services | 8 (25.8%) | 23 (74.2%) |
| Health Care & Social Assistance | 145 (53.7%) | 125 (46.3%) |
| Arts, Entertainment & Recreation | 16 (72.7%) | 6 (27.3%) |
| Accommodation & Food Services | 32 (34.4%) | 61 (65.6%) |
| Public Administration | 8 (32.0%) | 17 (68.0%) |
| Total | 805 (60.1%) | 534 (39.9%) |
Education in Belle Meade
School Enrollment in Belle Meade
The most common levels of schooling among the 948 students in Belle Meade are high school (234 | 24.7%), middle school (232 | 24.5%), and elementary school (176 | 18.6%).
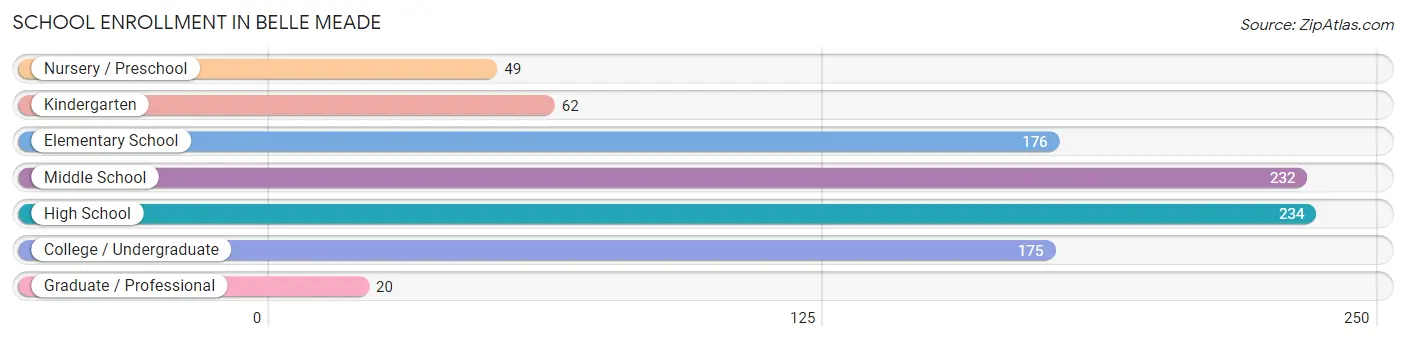
| School Level | # Students | % Students |
| Nursery / Preschool | 49 | 5.2% |
| Kindergarten | 62 | 6.5% |
| Elementary School | 176 | 18.6% |
| Middle School | 232 | 24.5% |
| High School | 234 | 24.7% |
| College / Undergraduate | 175 | 18.5% |
| Graduate / Professional | 20 | 2.1% |
| Total | 948 | 100.0% |
School Enrollment by Age by Funding Source in Belle Meade
Out of a total of 948 students who are enrolled in schools in Belle Meade, 760 (80.2%) attend a private institution, while the remaining 188 (19.8%) are enrolled in public schools. The age group of 3 to 4 year olds has the highest likelihood of being enrolled in private schools, with 38 (100.0% in the age bracket) enrolled. Conversely, the age group of 18 to 19 year olds has the lowest likelihood of being enrolled in a private school, with 65 (43.3% in the age bracket) attending a public institution.
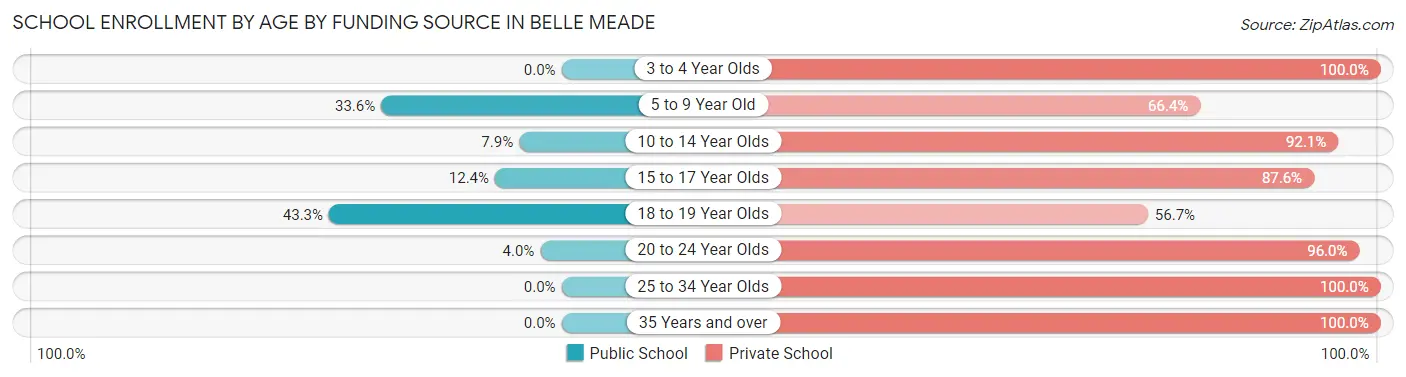
| Age Bracket | Public School | Private School |
| 3 to 4 Year Olds | 0 (0.0%) | 38 (100.0%) |
| 5 to 9 Year Old | 82 (33.6%) | 162 (66.4%) |
| 10 to 14 Year Olds | 20 (7.9%) | 233 (92.1%) |
| 15 to 17 Year Olds | 17 (12.4%) | 120 (87.6%) |
| 18 to 19 Year Olds | 65 (43.3%) | 85 (56.7%) |
| 20 to 24 Year Olds | 4 (4.0%) | 97 (96.0%) |
| 25 to 34 Year Olds | 0 (0.0%) | 19 (100.0%) |
| 35 Years and over | 0 (0.0%) | 6 (100.0%) |
| Total | 188 (19.8%) | 760 (80.2%) |
Educational Attainment by Field of Study in Belle Meade
Business (413 | 23.0%), social sciences (216 | 12.0%), liberal arts & history (178 | 9.9%), literature & languages (164 | 9.1%), and engineering (121 | 6.7%) are the most common fields of study among 1,797 individuals in Belle Meade who have obtained a bachelor's degree or higher.
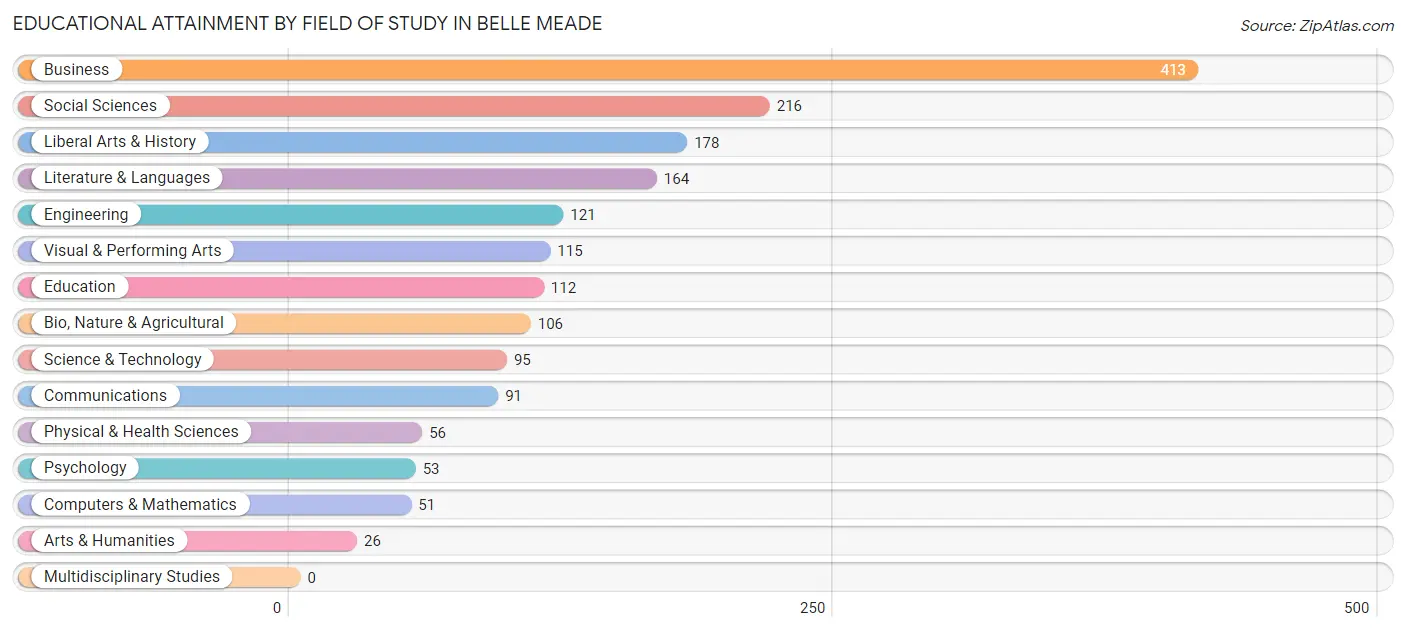
| Field of Study | # Graduates | % Graduates |
| Computers & Mathematics | 51 | 2.8% |
| Bio, Nature & Agricultural | 106 | 5.9% |
| Physical & Health Sciences | 56 | 3.1% |
| Psychology | 53 | 2.9% |
| Social Sciences | 216 | 12.0% |
| Engineering | 121 | 6.7% |
| Multidisciplinary Studies | 0 | 0.0% |
| Science & Technology | 95 | 5.3% |
| Business | 413 | 23.0% |
| Education | 112 | 6.2% |
| Literature & Languages | 164 | 9.1% |
| Liberal Arts & History | 178 | 9.9% |
| Visual & Performing Arts | 115 | 6.4% |
| Communications | 91 | 5.1% |
| Arts & Humanities | 26 | 1.5% |
| Total | 1,797 | 100.0% |
Transportation & Commute in Belle Meade
Vehicle Availability by Sex in Belle Meade
The most prevalent vehicle ownership categories in Belle Meade are males with 2 vehicles (469, accounting for 58.5%) and females with 2 vehicles (194, making up 89.3%).
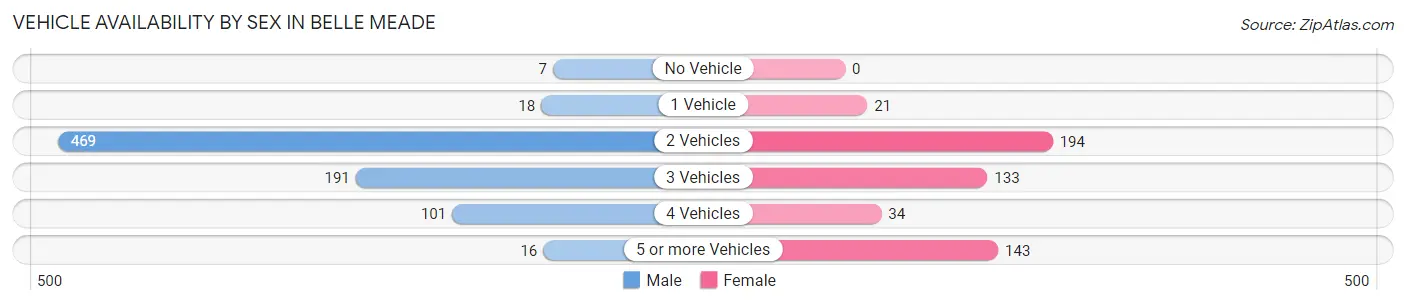
| Vehicles Available | Male | Female |
| No Vehicle | 7 (0.9%) | 0 (0.0%) |
| 1 Vehicle | 18 (2.2%) | 21 (4.0%) |
| 2 Vehicles | 469 (58.5%) | 194 (36.9%) |
| 3 Vehicles | 191 (23.8%) | 133 (25.3%) |
| 4 Vehicles | 101 (12.6%) | 34 (6.5%) |
| 5 or more Vehicles | 16 (2.0%) | 143 (27.2%) |
| Total | 802 (100.0%) | 525 (100.0%) |
Commute Time in Belle Meade
The most frequently occuring commute durations in Belle Meade are 15 to 19 minutes (361 commuters, 34.6%), 20 to 24 minutes (223 commuters, 21.4%), and 10 to 14 minutes (156 commuters, 14.9%).
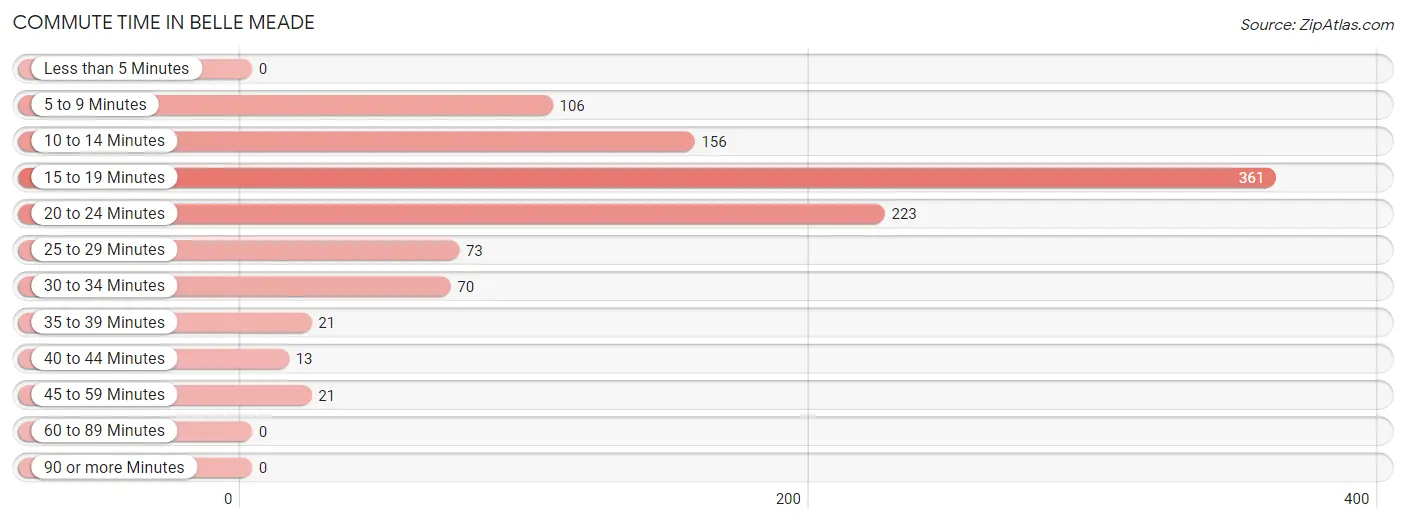
| Commute Time | # Commuters | % Commuters |
| Less than 5 Minutes | 0 | 0.0% |
| 5 to 9 Minutes | 106 | 10.2% |
| 10 to 14 Minutes | 156 | 14.9% |
| 15 to 19 Minutes | 361 | 34.6% |
| 20 to 24 Minutes | 223 | 21.4% |
| 25 to 29 Minutes | 73 | 7.0% |
| 30 to 34 Minutes | 70 | 6.7% |
| 35 to 39 Minutes | 21 | 2.0% |
| 40 to 44 Minutes | 13 | 1.3% |
| 45 to 59 Minutes | 21 | 2.0% |
| 60 to 89 Minutes | 0 | 0.0% |
| 90 or more Minutes | 0 | 0.0% |
Commute Time by Sex in Belle Meade
The most common commute times in Belle Meade are 15 to 19 minutes (153 commuters, 25.5%) for males and 15 to 19 minutes (208 commuters, 46.7%) for females.
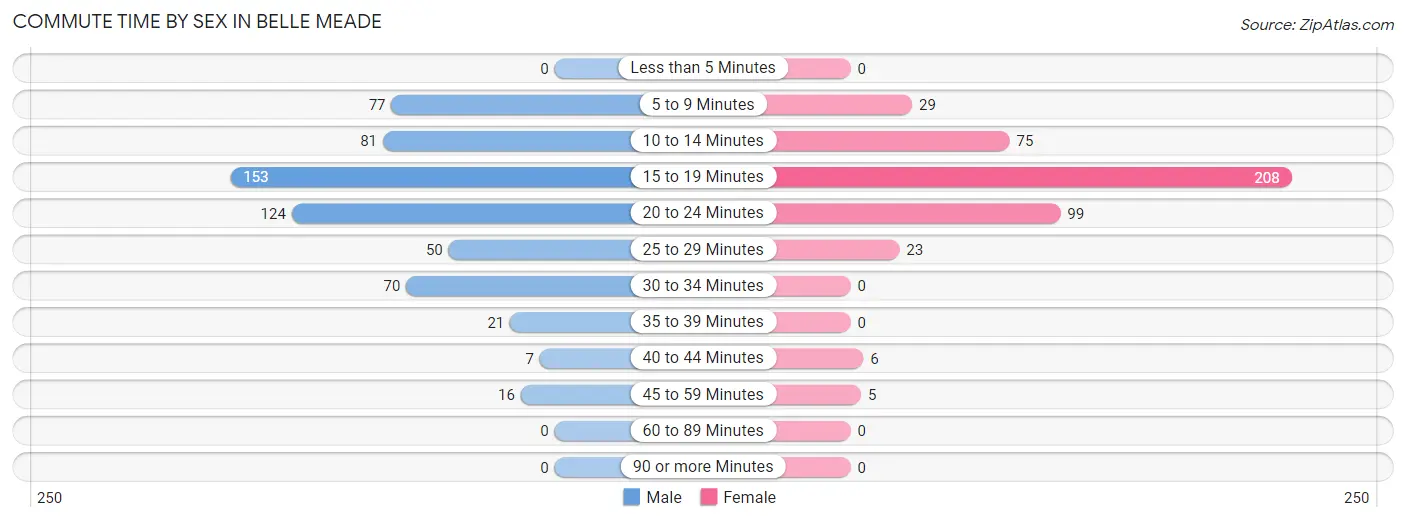
| Commute Time | Male | Female |
| Less than 5 Minutes | 0 (0.0%) | 0 (0.0%) |
| 5 to 9 Minutes | 77 (12.9%) | 29 (6.5%) |
| 10 to 14 Minutes | 81 (13.5%) | 75 (16.9%) |
| 15 to 19 Minutes | 153 (25.5%) | 208 (46.7%) |
| 20 to 24 Minutes | 124 (20.7%) | 99 (22.3%) |
| 25 to 29 Minutes | 50 (8.4%) | 23 (5.2%) |
| 30 to 34 Minutes | 70 (11.7%) | 0 (0.0%) |
| 35 to 39 Minutes | 21 (3.5%) | 0 (0.0%) |
| 40 to 44 Minutes | 7 (1.2%) | 6 (1.3%) |
| 45 to 59 Minutes | 16 (2.7%) | 5 (1.1%) |
| 60 to 89 Minutes | 0 (0.0%) | 0 (0.0%) |
| 90 or more Minutes | 0 (0.0%) | 0 (0.0%) |
Time of Departure to Work by Sex in Belle Meade
The most frequent times of departure to work in Belle Meade are 7:30 AM to 7:59 AM (164, 27.4%) for males and 8:00 AM to 8:29 AM (197, 44.3%) for females.
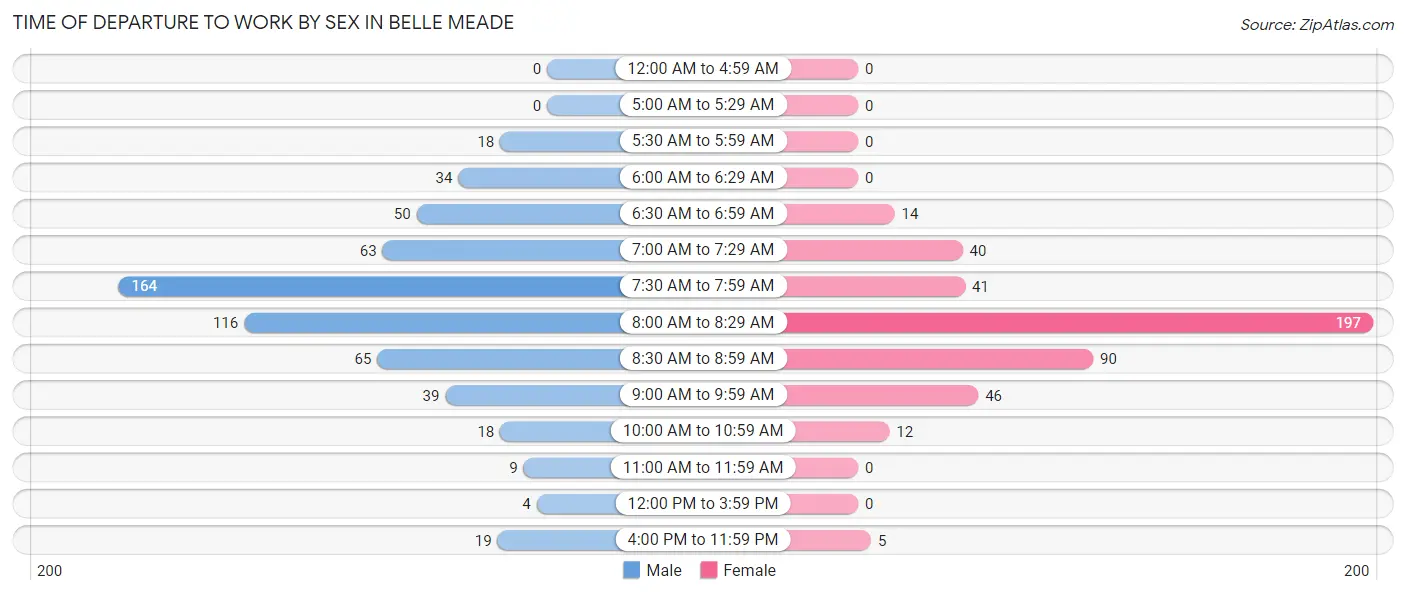
| Time of Departure | Male | Female |
| 12:00 AM to 4:59 AM | 0 (0.0%) | 0 (0.0%) |
| 5:00 AM to 5:29 AM | 0 (0.0%) | 0 (0.0%) |
| 5:30 AM to 5:59 AM | 18 (3.0%) | 0 (0.0%) |
| 6:00 AM to 6:29 AM | 34 (5.7%) | 0 (0.0%) |
| 6:30 AM to 6:59 AM | 50 (8.4%) | 14 (3.2%) |
| 7:00 AM to 7:29 AM | 63 (10.5%) | 40 (9.0%) |
| 7:30 AM to 7:59 AM | 164 (27.4%) | 41 (9.2%) |
| 8:00 AM to 8:29 AM | 116 (19.4%) | 197 (44.3%) |
| 8:30 AM to 8:59 AM | 65 (10.8%) | 90 (20.2%) |
| 9:00 AM to 9:59 AM | 39 (6.5%) | 46 (10.3%) |
| 10:00 AM to 10:59 AM | 18 (3.0%) | 12 (2.7%) |
| 11:00 AM to 11:59 AM | 9 (1.5%) | 0 (0.0%) |
| 12:00 PM to 3:59 PM | 4 (0.7%) | 0 (0.0%) |
| 4:00 PM to 11:59 PM | 19 (3.2%) | 5 (1.1%) |
| Total | 599 (100.0%) | 445 (100.0%) |
Housing Occupancy in Belle Meade
Occupancy by Ownership in Belle Meade
Of the total 915 dwellings in Belle Meade, owner-occupied units account for 885 (96.7%), while renter-occupied units make up 30 (3.3%).
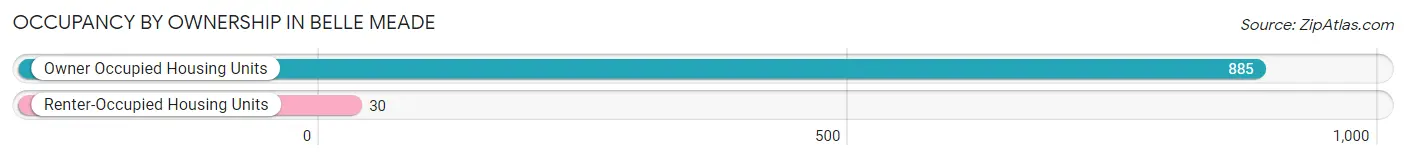
| Occupancy | # Housing Units | % Housing Units |
| Owner Occupied Housing Units | 885 | 96.7% |
| Renter-Occupied Housing Units | 30 | 3.3% |
| Total Occupied Housing Units | 915 | 100.0% |
Occupancy by Household Size in Belle Meade
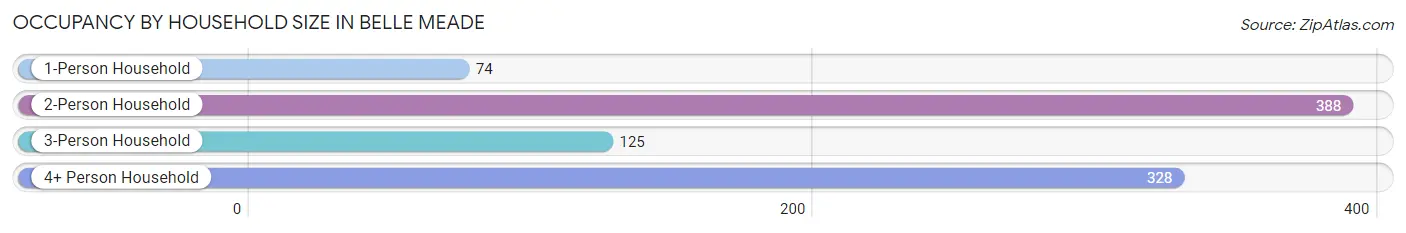
| Household Size | # Housing Units | % Housing Units |
| 1-Person Household | 74 | 8.1% |
| 2-Person Household | 388 | 42.4% |
| 3-Person Household | 125 | 13.7% |
| 4+ Person Household | 328 | 35.8% |
| Total Housing Units | 915 | 100.0% |
Occupancy by Ownership by Household Size in Belle Meade
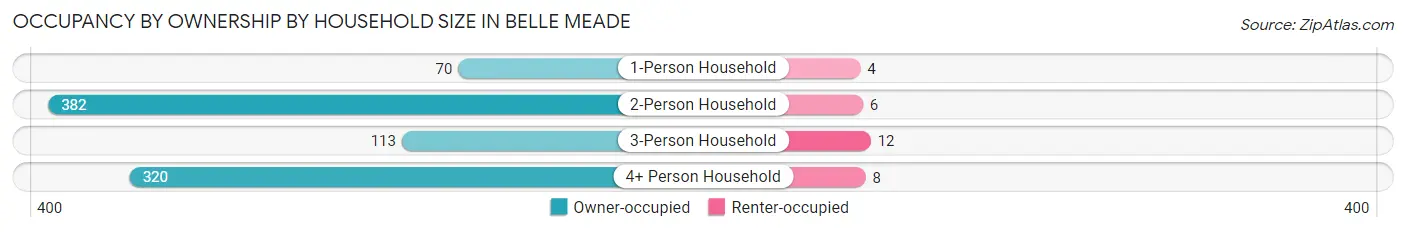
| Household Size | Owner-occupied | Renter-occupied |
| 1-Person Household | 70 (94.6%) | 4 (5.4%) |
| 2-Person Household | 382 (98.5%) | 6 (1.5%) |
| 3-Person Household | 113 (90.4%) | 12 (9.6%) |
| 4+ Person Household | 320 (97.6%) | 8 (2.4%) |
| Total Housing Units | 885 (96.7%) | 30 (3.3%) |
Occupancy by Educational Attainment in Belle Meade
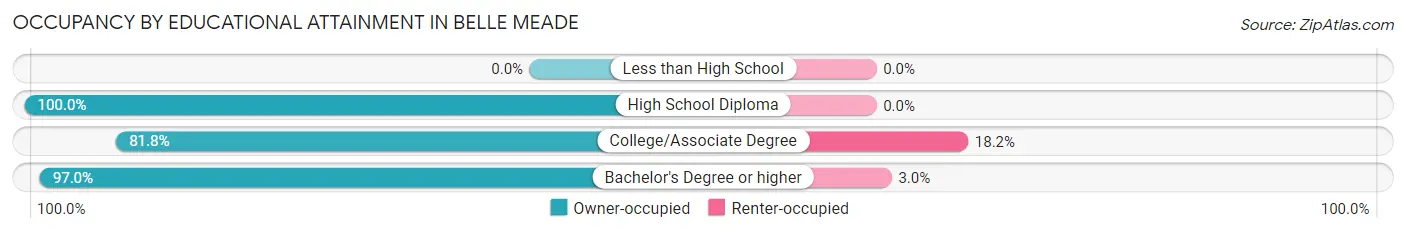
| Household Size | Owner-occupied | Renter-occupied |
| Less than High School | 0 (0.0%) | 0 (0.0%) |
| High School Diploma | 34 (100.0%) | 0 (0.0%) |
| College/Associate Degree | 18 (81.8%) | 4 (18.2%) |
| Bachelor's Degree or higher | 833 (97.0%) | 26 (3.0%) |
Occupancy by Age of Householder in Belle Meade
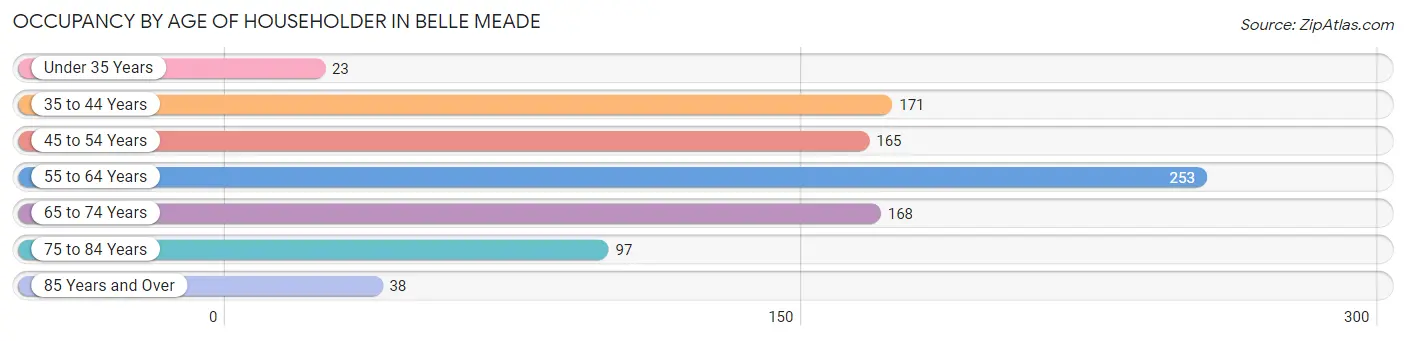
| Age Bracket | # Households | % Households |
| Under 35 Years | 23 | 2.5% |
| 35 to 44 Years | 171 | 18.7% |
| 45 to 54 Years | 165 | 18.0% |
| 55 to 64 Years | 253 | 27.7% |
| 65 to 74 Years | 168 | 18.4% |
| 75 to 84 Years | 97 | 10.6% |
| 85 Years and Over | 38 | 4.2% |
| Total | 915 | 100.0% |
Housing Finances in Belle Meade
Median Income by Occupancy in Belle Meade
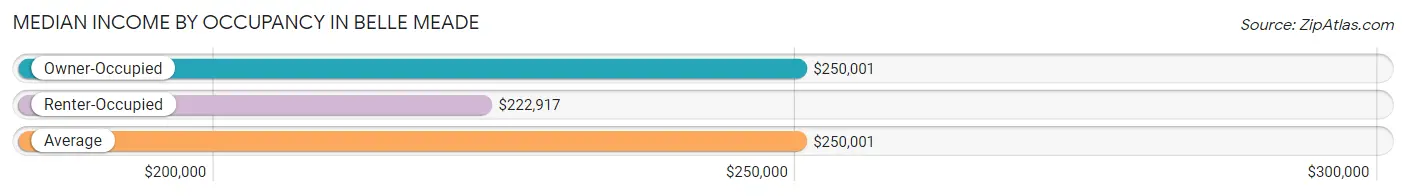
| Occupancy Type | # Households | Median Income |
| Owner-Occupied | 885 (96.7%) | $250,001 |
| Renter-Occupied | 30 (3.3%) | $222,917 |
| Average | 915 (100.0%) | $250,001 |
Occupancy by Householder Income Bracket in Belle Meade
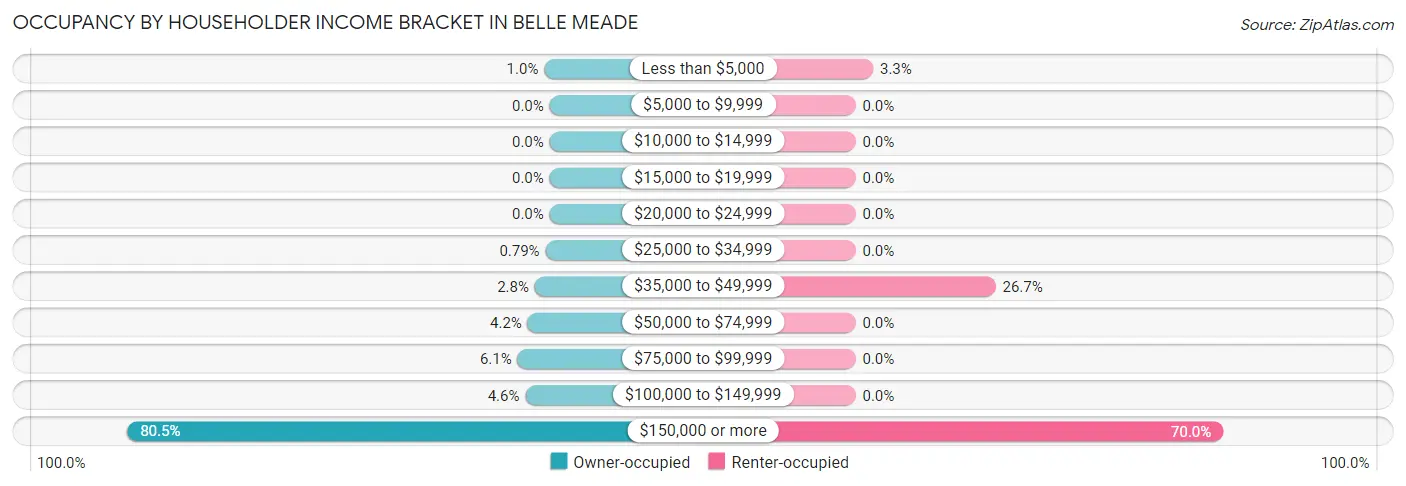
| Income Bracket | Owner-occupied | Renter-occupied |
| Less than $5,000 | 9 (1.0%) | 1 (3.3%) |
| $5,000 to $9,999 | 0 (0.0%) | 0 (0.0%) |
| $10,000 to $14,999 | 0 (0.0%) | 0 (0.0%) |
| $15,000 to $19,999 | 0 (0.0%) | 0 (0.0%) |
| $20,000 to $24,999 | 0 (0.0%) | 0 (0.0%) |
| $25,000 to $34,999 | 7 (0.8%) | 0 (0.0%) |
| $35,000 to $49,999 | 25 (2.8%) | 8 (26.7%) |
| $50,000 to $74,999 | 37 (4.2%) | 0 (0.0%) |
| $75,000 to $99,999 | 54 (6.1%) | 0 (0.0%) |
| $100,000 to $149,999 | 41 (4.6%) | 0 (0.0%) |
| $150,000 or more | 712 (80.4%) | 21 (70.0%) |
| Total | 885 (100.0%) | 30 (100.0%) |
Monthly Housing Cost Tiers in Belle Meade
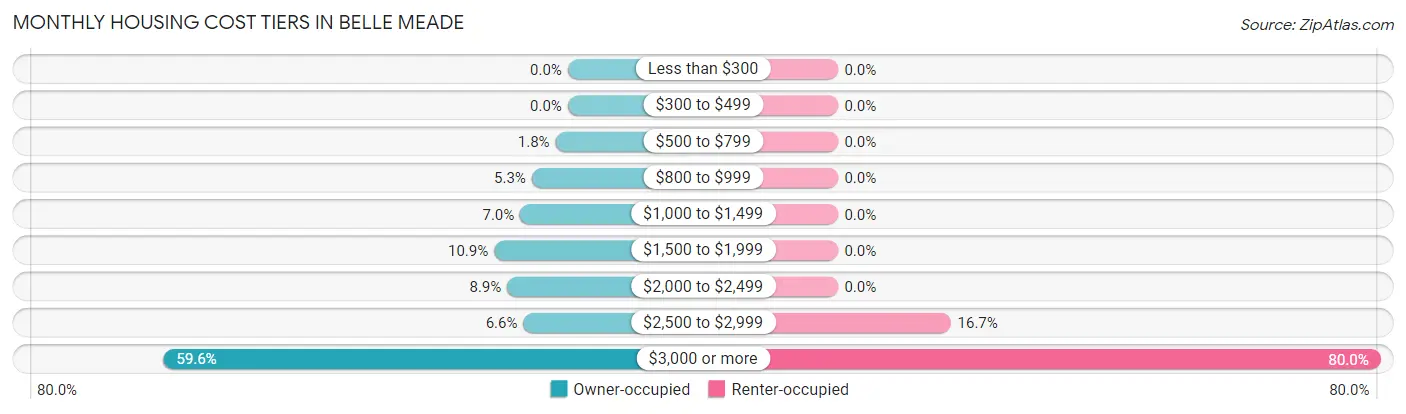
| Monthly Cost | Owner-occupied | Renter-occupied |
| Less than $300 | 0 (0.0%) | 0 (0.0%) |
| $300 to $499 | 0 (0.0%) | 0 (0.0%) |
| $500 to $799 | 16 (1.8%) | 0 (0.0%) |
| $800 to $999 | 47 (5.3%) | 0 (0.0%) |
| $1,000 to $1,499 | 62 (7.0%) | 0 (0.0%) |
| $1,500 to $1,999 | 96 (10.8%) | 0 (0.0%) |
| $2,000 to $2,499 | 79 (8.9%) | 0 (0.0%) |
| $2,500 to $2,999 | 58 (6.6%) | 5 (16.7%) |
| $3,000 or more | 527 (59.6%) | 24 (80.0%) |
| Total | 885 (100.0%) | 30 (100.0%) |
Physical Housing Characteristics in Belle Meade
Housing Structures in Belle Meade
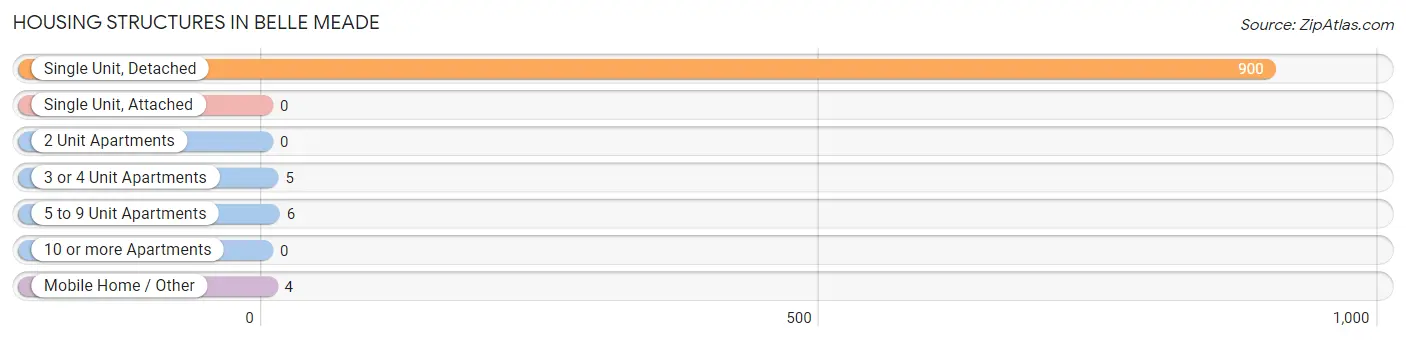
| Structure Type | # Housing Units | % Housing Units |
| Single Unit, Detached | 900 | 98.4% |
| Single Unit, Attached | 0 | 0.0% |
| 2 Unit Apartments | 0 | 0.0% |
| 3 or 4 Unit Apartments | 5 | 0.5% |
| 5 to 9 Unit Apartments | 6 | 0.7% |
| 10 or more Apartments | 0 | 0.0% |
| Mobile Home / Other | 4 | 0.4% |
| Total | 915 | 100.0% |
Housing Structures by Occupancy in Belle Meade
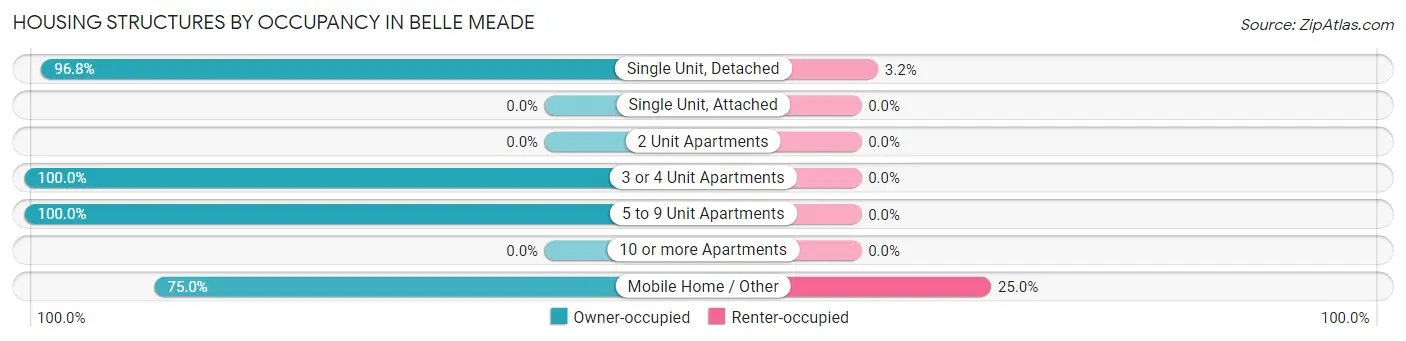
| Structure Type | Owner-occupied | Renter-occupied |
| Single Unit, Detached | 871 (96.8%) | 29 (3.2%) |
| Single Unit, Attached | 0 (0.0%) | 0 (0.0%) |
| 2 Unit Apartments | 0 (0.0%) | 0 (0.0%) |
| 3 or 4 Unit Apartments | 5 (100.0%) | 0 (0.0%) |
| 5 to 9 Unit Apartments | 6 (100.0%) | 0 (0.0%) |
| 10 or more Apartments | 0 (0.0%) | 0 (0.0%) |
| Mobile Home / Other | 3 (75.0%) | 1 (25.0%) |
| Total | 885 (96.7%) | 30 (3.3%) |
Housing Structures by Number of Rooms in Belle Meade
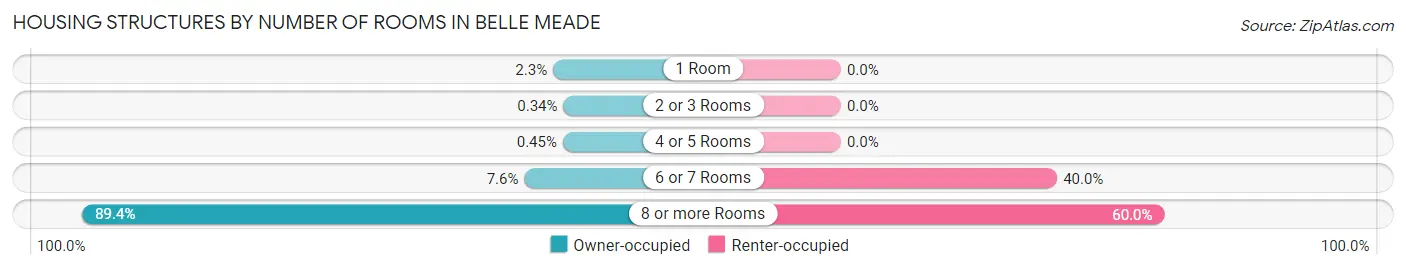
| Number of Rooms | Owner-occupied | Renter-occupied |
| 1 Room | 20 (2.3%) | 0 (0.0%) |
| 2 or 3 Rooms | 3 (0.3%) | 0 (0.0%) |
| 4 or 5 Rooms | 4 (0.4%) | 0 (0.0%) |
| 6 or 7 Rooms | 67 (7.6%) | 12 (40.0%) |
| 8 or more Rooms | 791 (89.4%) | 18 (60.0%) |
| Total | 885 (100.0%) | 30 (100.0%) |
Housing Structure by Heating Type in Belle Meade
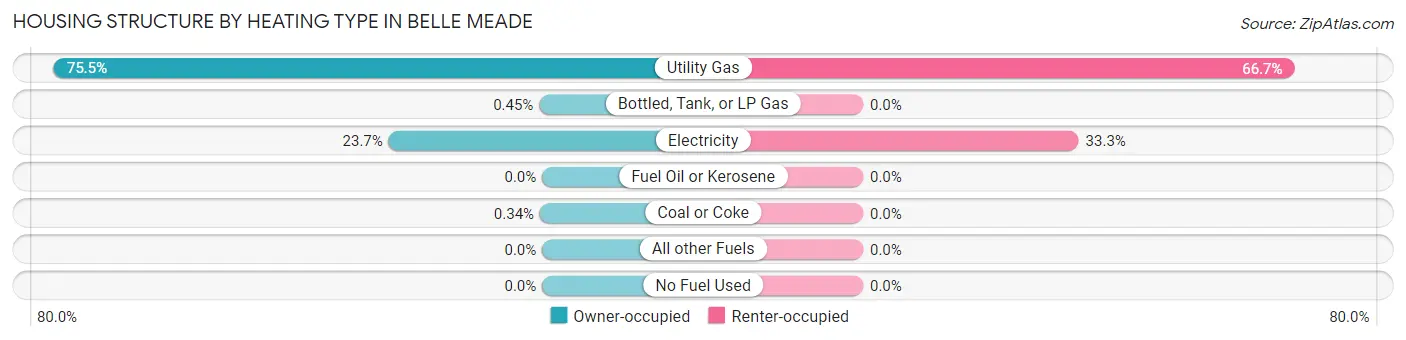
| Heating Type | Owner-occupied | Renter-occupied |
| Utility Gas | 668 (75.5%) | 20 (66.7%) |
| Bottled, Tank, or LP Gas | 4 (0.4%) | 0 (0.0%) |
| Electricity | 210 (23.7%) | 10 (33.3%) |
| Fuel Oil or Kerosene | 0 (0.0%) | 0 (0.0%) |
| Coal or Coke | 3 (0.3%) | 0 (0.0%) |
| All other Fuels | 0 (0.0%) | 0 (0.0%) |
| No Fuel Used | 0 (0.0%) | 0 (0.0%) |
| Total | 885 (100.0%) | 30 (100.0%) |
Household Vehicle Usage in Belle Meade
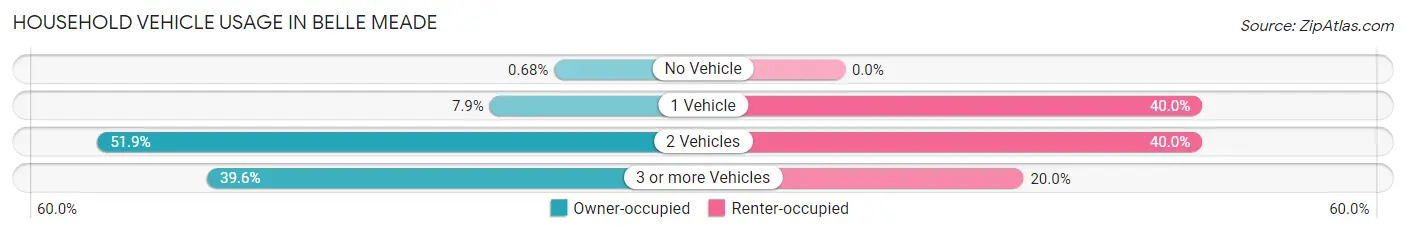
| Vehicles per Household | Owner-occupied | Renter-occupied |
| No Vehicle | 6 (0.7%) | 0 (0.0%) |
| 1 Vehicle | 70 (7.9%) | 12 (40.0%) |
| 2 Vehicles | 459 (51.9%) | 12 (40.0%) |
| 3 or more Vehicles | 350 (39.6%) | 6 (20.0%) |
| Total | 885 (100.0%) | 30 (100.0%) |
Real Estate & Mortgages in Belle Meade
Real Estate and Mortgage Overview in Belle Meade
| Characteristic | Without Mortgage | With Mortgage |
| Housing Units | 414 | 471 |
| Median Property Value | $2,000,001 | $2,000,001 |
| Median Household Income | $250,001 | $379 |
| Monthly Housing Costs | $1,501 | $402 |
| Real Estate Taxes | $10,001 | $0 |
Property Value by Mortgage Status in Belle Meade
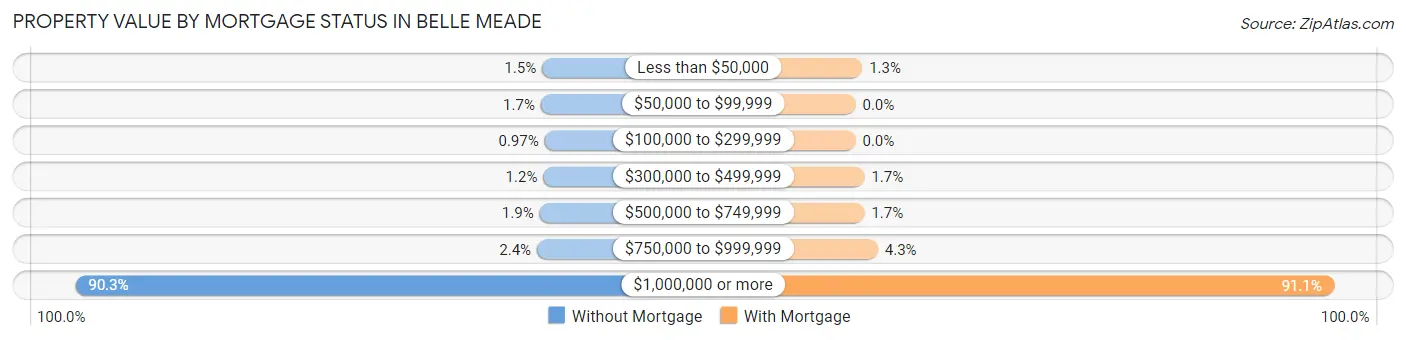
| Property Value | Without Mortgage | With Mortgage |
| Less than $50,000 | 6 (1.5%) | 6 (1.3%) |
| $50,000 to $99,999 | 7 (1.7%) | 0 (0.0%) |
| $100,000 to $299,999 | 4 (1.0%) | 0 (0.0%) |
| $300,000 to $499,999 | 5 (1.2%) | 8 (1.7%) |
| $500,000 to $749,999 | 8 (1.9%) | 8 (1.7%) |
| $750,000 to $999,999 | 10 (2.4%) | 20 (4.3%) |
| $1,000,000 or more | 374 (90.3%) | 429 (91.1%) |
| Total | 414 (100.0%) | 471 (100.0%) |
Household Income by Mortgage Status in Belle Meade
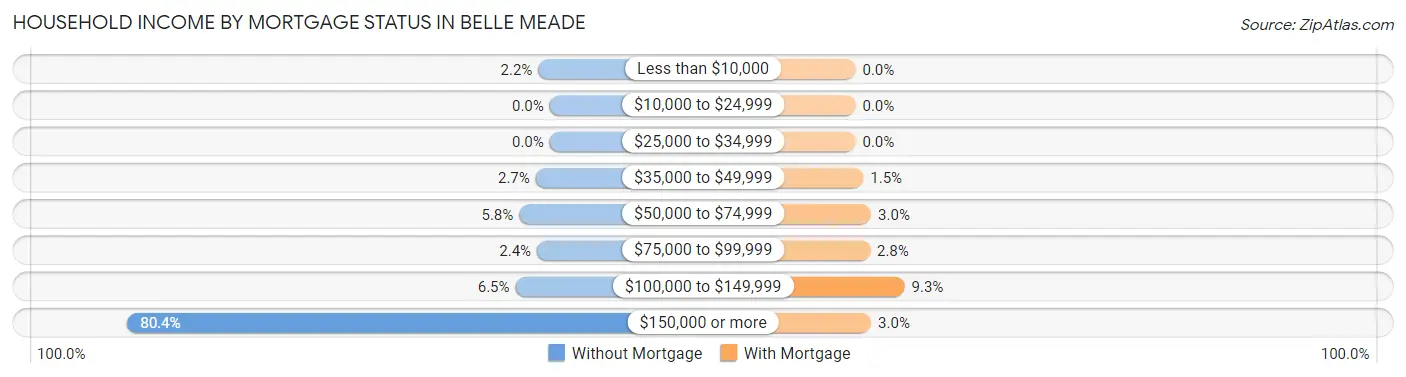
| Household Income | Without Mortgage | With Mortgage |
| Less than $10,000 | 9 (2.2%) | 0 (0.0%) |
| $10,000 to $24,999 | 0 (0.0%) | 0 (0.0%) |
| $25,000 to $34,999 | 0 (0.0%) | 0 (0.0%) |
| $35,000 to $49,999 | 11 (2.7%) | 7 (1.5%) |
| $50,000 to $74,999 | 24 (5.8%) | 14 (3.0%) |
| $75,000 to $99,999 | 10 (2.4%) | 13 (2.8%) |
| $100,000 to $149,999 | 27 (6.5%) | 44 (9.3%) |
| $150,000 or more | 333 (80.4%) | 14 (3.0%) |
| Total | 414 (100.0%) | 471 (100.0%) |
Property Value to Household Income Ratio in Belle Meade
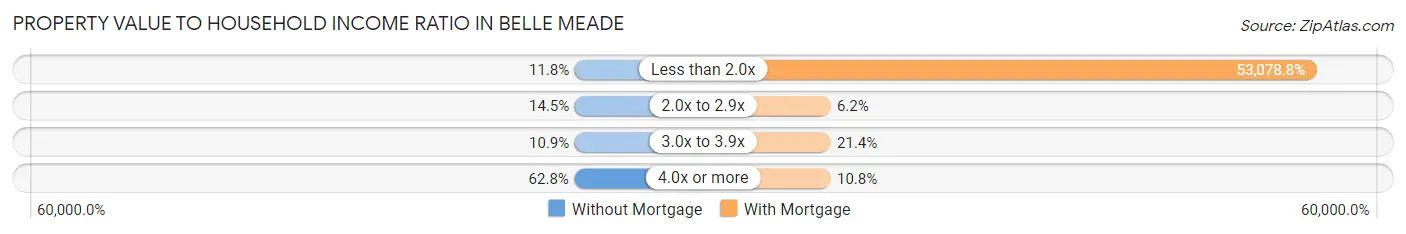
| Value-to-Income Ratio | Without Mortgage | With Mortgage |
| Less than 2.0x | 49 (11.8%) | 250,001 (53,078.8%) |
| 2.0x to 2.9x | 60 (14.5%) | 29 (6.2%) |
| 3.0x to 3.9x | 45 (10.9%) | 101 (21.4%) |
| 4.0x or more | 260 (62.8%) | 51 (10.8%) |
| Total | 414 (100.0%) | 471 (100.0%) |
Real Estate Taxes by Mortgage Status in Belle Meade
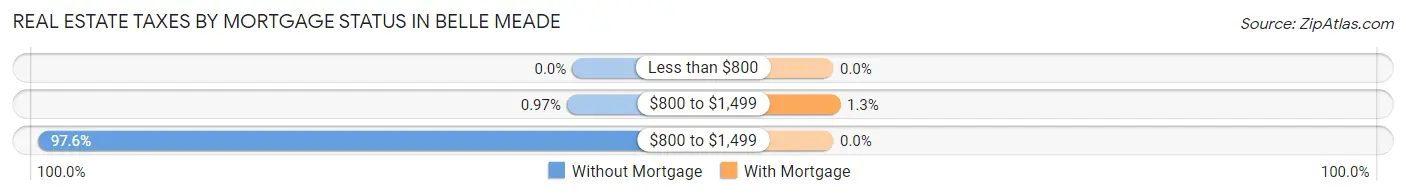
| Property Taxes | Without Mortgage | With Mortgage |
| Less than $800 | 0 (0.0%) | 0 (0.0%) |
| $800 to $1,499 | 4 (1.0%) | 6 (1.3%) |
| $800 to $1,499 | 404 (97.6%) | 0 (0.0%) |
| Total | 414 (100.0%) | 471 (100.0%) |
Health & Disability in Belle Meade
Health Insurance Coverage by Age in Belle Meade
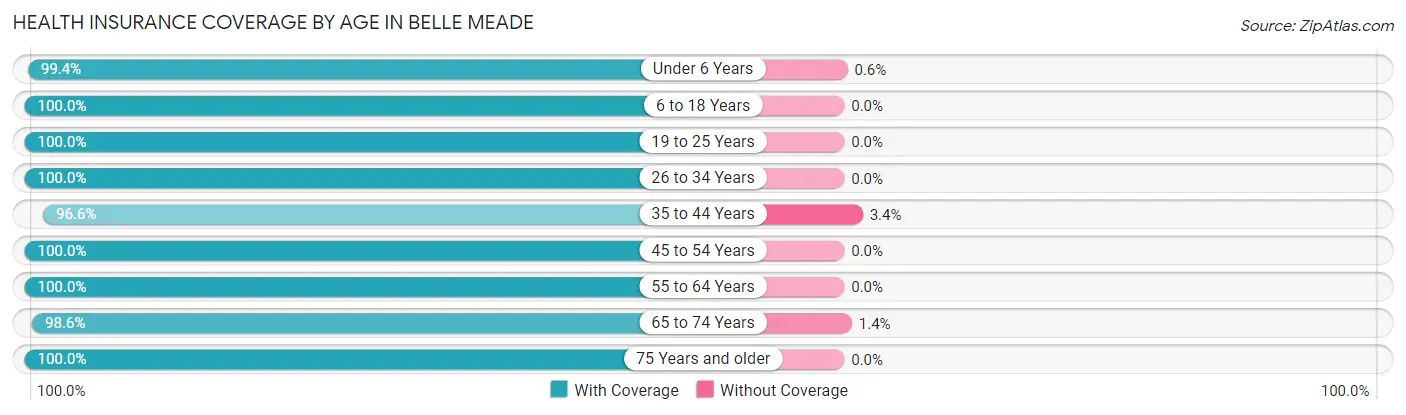
| Age Bracket | With Coverage | Without Coverage |
| Under 6 Years | 165 (99.4%) | 1 (0.6%) |
| 6 to 18 Years | 704 (100.0%) | 0 (0.0%) |
| 19 to 25 Years | 175 (100.0%) | 0 (0.0%) |
| 26 to 34 Years | 156 (100.0%) | 0 (0.0%) |
| 35 to 44 Years | 309 (96.6%) | 11 (3.4%) |
| 45 to 54 Years | 421 (100.0%) | 0 (0.0%) |
| 55 to 64 Years | 485 (100.0%) | 0 (0.0%) |
| 65 to 74 Years | 280 (98.6%) | 4 (1.4%) |
| 75 Years and older | 222 (100.0%) | 0 (0.0%) |
| Total | 2,917 (99.5%) | 16 (0.5%) |
Health Insurance Coverage by Citizenship Status in Belle Meade
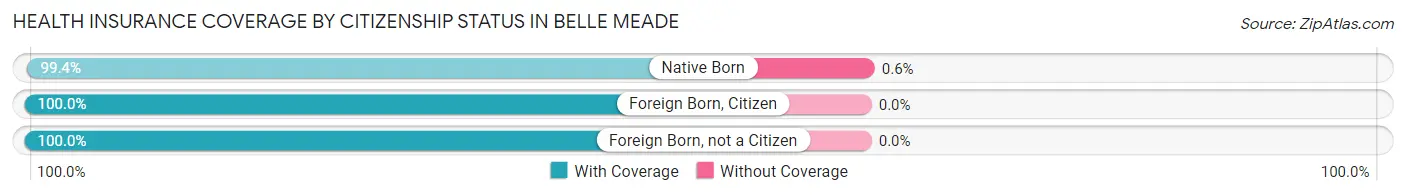
| Citizenship Status | With Coverage | Without Coverage |
| Native Born | 165 (99.4%) | 1 (0.6%) |
| Foreign Born, Citizen | 704 (100.0%) | 0 (0.0%) |
| Foreign Born, not a Citizen | 175 (100.0%) | 0 (0.0%) |
Health Insurance Coverage by Household Income in Belle Meade
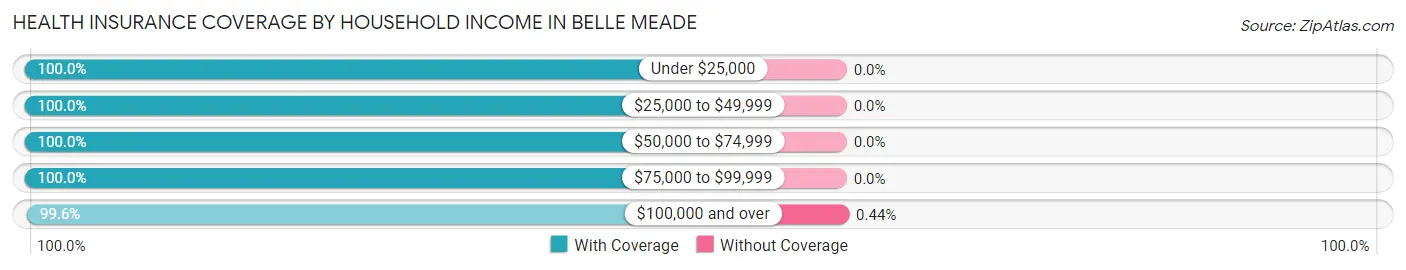
| Household Income | With Coverage | Without Coverage |
| Under $25,000 | 18 (100.0%) | 0 (0.0%) |
| $25,000 to $49,999 | 92 (100.0%) | 0 (0.0%) |
| $50,000 to $74,999 | 66 (100.0%) | 0 (0.0%) |
| $75,000 to $99,999 | 211 (100.0%) | 0 (0.0%) |
| $100,000 and over | 2,517 (99.6%) | 11 (0.4%) |
Public vs Private Health Insurance Coverage by Age in Belle Meade
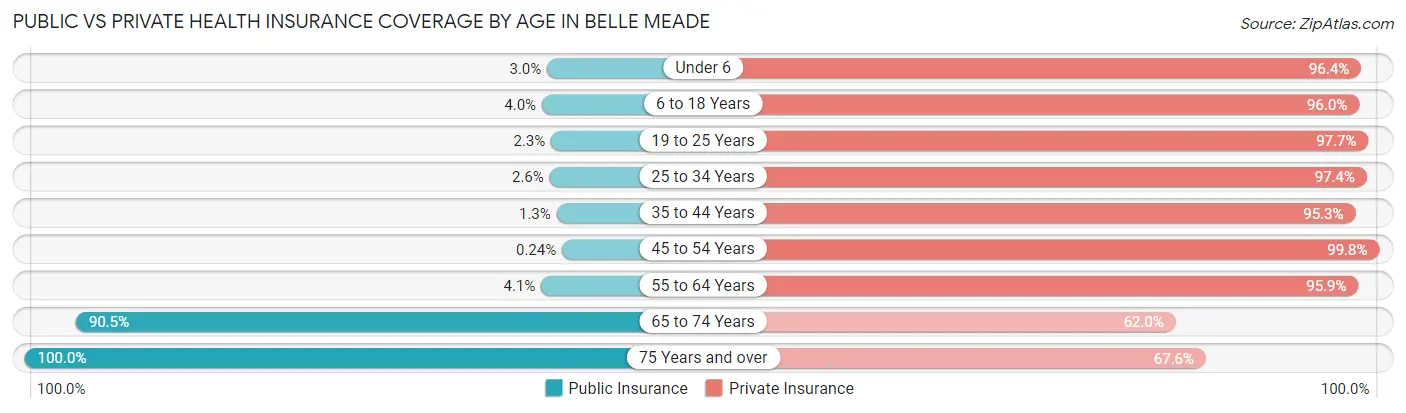
| Age Bracket | Public Insurance | Private Insurance |
| Under 6 | 5 (3.0%) | 160 (96.4%) |
| 6 to 18 Years | 28 (4.0%) | 676 (96.0%) |
| 19 to 25 Years | 4 (2.3%) | 171 (97.7%) |
| 25 to 34 Years | 4 (2.6%) | 152 (97.4%) |
| 35 to 44 Years | 4 (1.3%) | 305 (95.3%) |
| 45 to 54 Years | 1 (0.2%) | 420 (99.8%) |
| 55 to 64 Years | 20 (4.1%) | 465 (95.9%) |
| 65 to 74 Years | 257 (90.5%) | 176 (62.0%) |
| 75 Years and over | 222 (100.0%) | 150 (67.6%) |
| Total | 545 (18.6%) | 2,675 (91.2%) |
Disability Status by Sex by Age in Belle Meade
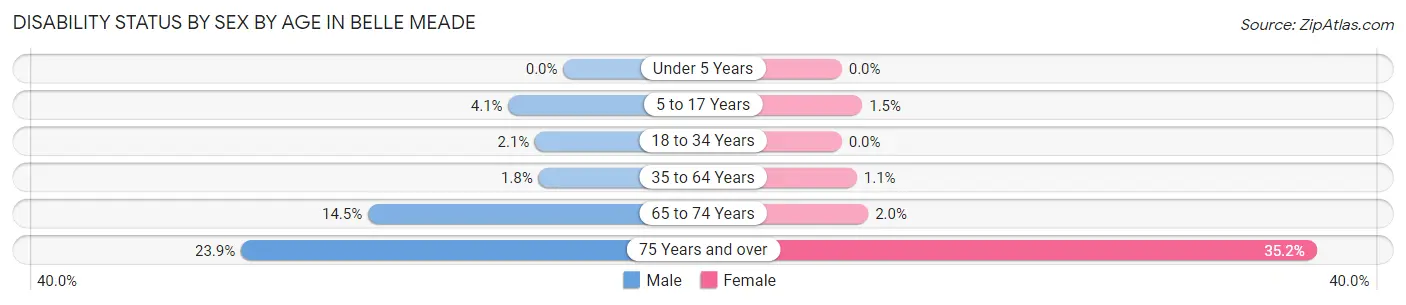
| Age Bracket | Male | Female |
| Under 5 Years | 0 (0.0%) | 0 (0.0%) |
| 5 to 17 Years | 13 (4.1%) | 5 (1.5%) |
| 18 to 34 Years | 4 (2.1%) | 0 (0.0%) |
| 35 to 64 Years | 11 (1.8%) | 7 (1.1%) |
| 65 to 74 Years | 19 (14.5%) | 3 (2.0%) |
| 75 Years and over | 28 (23.9%) | 37 (35.2%) |
Disability Class by Sex by Age in Belle Meade
Disability Class: Hearing Difficulty
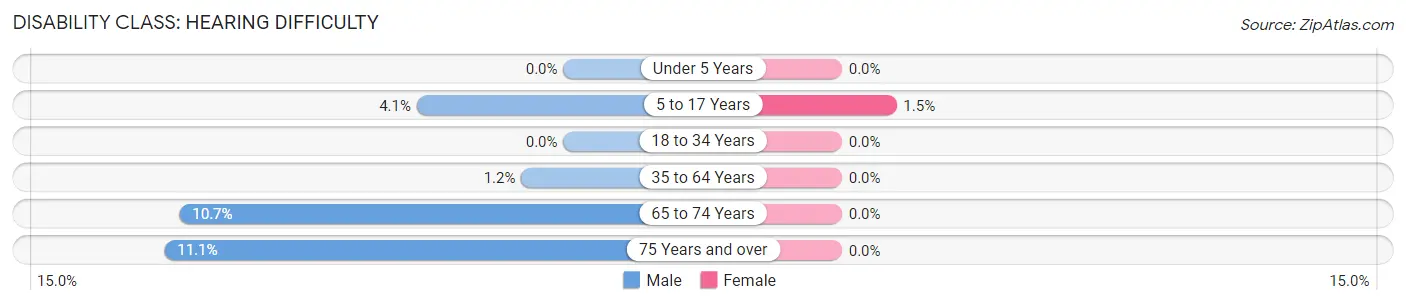
| Age Bracket | Male | Female |
| Under 5 Years | 0 (0.0%) | 0 (0.0%) |
| 5 to 17 Years | 13 (4.1%) | 5 (1.5%) |
| 18 to 34 Years | 0 (0.0%) | 0 (0.0%) |
| 35 to 64 Years | 7 (1.2%) | 0 (0.0%) |
| 65 to 74 Years | 14 (10.7%) | 0 (0.0%) |
| 75 Years and over | 13 (11.1%) | 0 (0.0%) |
Disability Class: Vision Difficulty
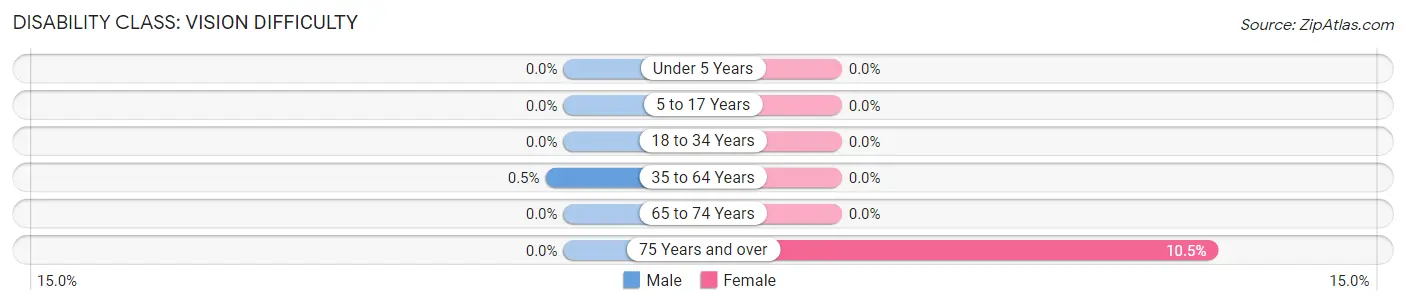
| Age Bracket | Male | Female |
| Under 5 Years | 0 (0.0%) | 0 (0.0%) |
| 5 to 17 Years | 0 (0.0%) | 0 (0.0%) |
| 18 to 34 Years | 0 (0.0%) | 0 (0.0%) |
| 35 to 64 Years | 3 (0.5%) | 0 (0.0%) |
| 65 to 74 Years | 0 (0.0%) | 0 (0.0%) |
| 75 Years and over | 0 (0.0%) | 11 (10.5%) |
Disability Class: Cognitive Difficulty
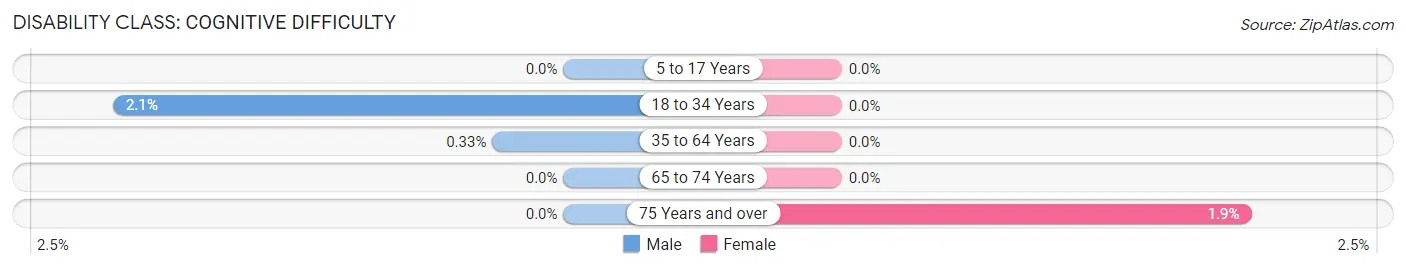
| Age Bracket | Male | Female |
| 5 to 17 Years | 0 (0.0%) | 0 (0.0%) |
| 18 to 34 Years | 4 (2.1%) | 0 (0.0%) |
| 35 to 64 Years | 2 (0.3%) | 0 (0.0%) |
| 65 to 74 Years | 0 (0.0%) | 0 (0.0%) |
| 75 Years and over | 0 (0.0%) | 2 (1.9%) |
Disability Class: Ambulatory Difficulty
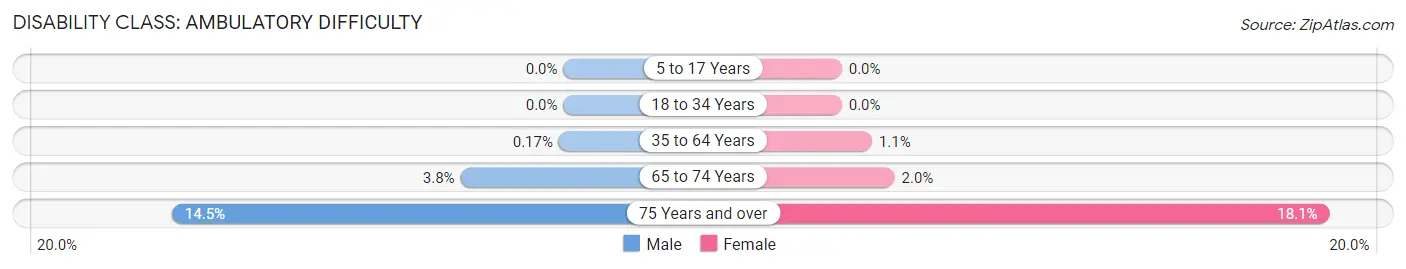
| Age Bracket | Male | Female |
| 5 to 17 Years | 0 (0.0%) | 0 (0.0%) |
| 18 to 34 Years | 0 (0.0%) | 0 (0.0%) |
| 35 to 64 Years | 1 (0.2%) | 7 (1.1%) |
| 65 to 74 Years | 5 (3.8%) | 3 (2.0%) |
| 75 Years and over | 17 (14.5%) | 19 (18.1%) |
Disability Class: Self-Care Difficulty
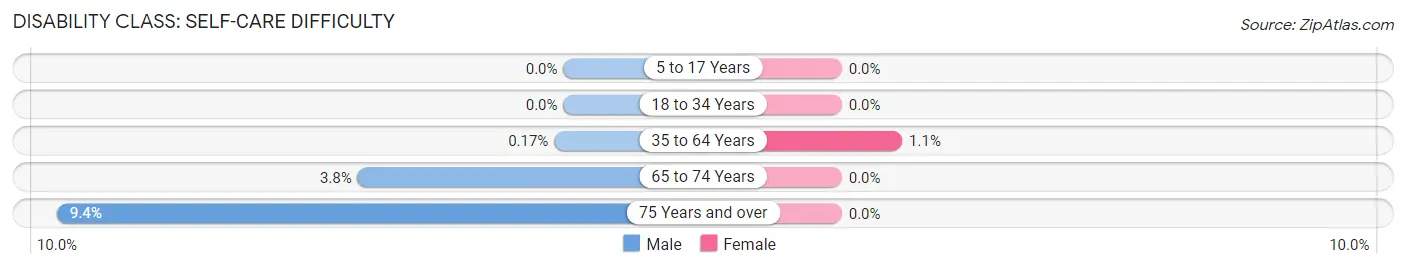
| Age Bracket | Male | Female |
| 5 to 17 Years | 0 (0.0%) | 0 (0.0%) |
| 18 to 34 Years | 0 (0.0%) | 0 (0.0%) |
| 35 to 64 Years | 1 (0.2%) | 7 (1.1%) |
| 65 to 74 Years | 5 (3.8%) | 0 (0.0%) |
| 75 Years and over | 11 (9.4%) | 0 (0.0%) |
Technology Access in Belle Meade
Computing Device Access in Belle Meade
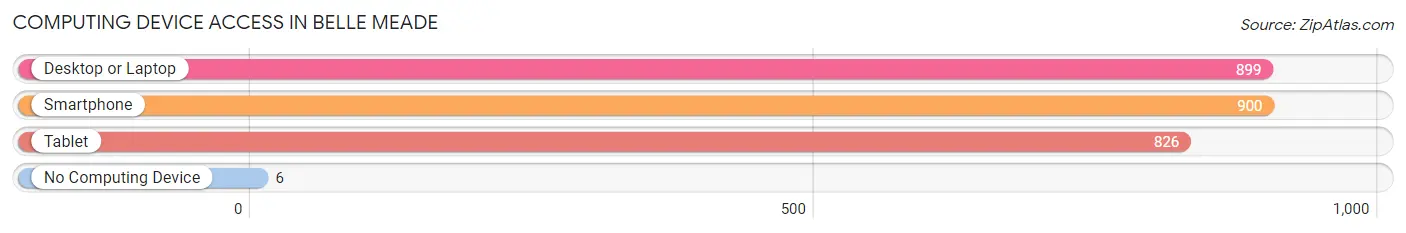
| Device Type | # Households | % Households |
| Desktop or Laptop | 899 | 98.3% |
| Smartphone | 900 | 98.4% |
| Tablet | 826 | 90.3% |
| No Computing Device | 6 | 0.7% |
| Total | 915 | 100.0% |
Internet Access in Belle Meade
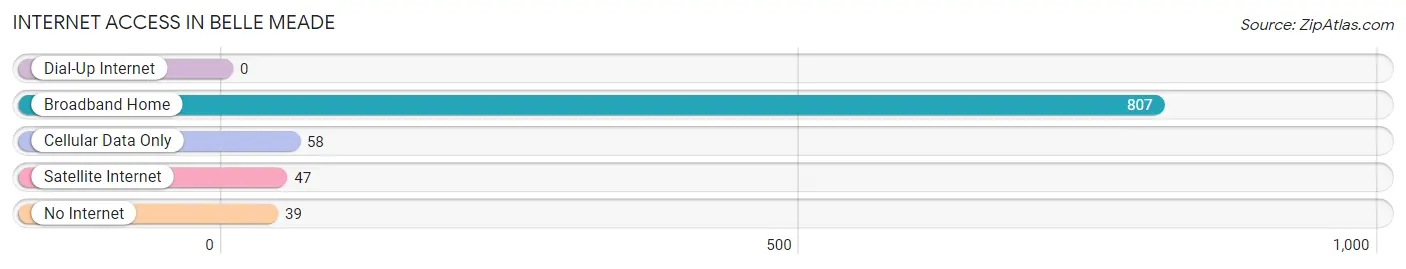
| Internet Type | # Households | % Households |
| Dial-Up Internet | 0 | 0.0% |
| Broadband Home | 807 | 88.2% |
| Cellular Data Only | 58 | 6.3% |
| Satellite Internet | 47 | 5.1% |
| No Internet | 39 | 4.3% |
| Total | 915 | 100.0% |
Belle Meade Summary
Belle Meade is a small city located in Davidson County, Tennessee. It is a suburb of Nashville and is located just south of the city. The city has a population of 2,912 people as of the 2010 census.
History
Belle Meade was founded in 1807 by John Harding, a Revolutionary War veteran. He named the area after his family’s plantation in Virginia. The city was incorporated in 1892 and was originally a farming community. In the late 19th century, the city became a popular summer resort for wealthy Nashvillians. The city was also home to a number of horse farms and was known for its thoroughbred horses.
In the early 20th century, the city began to develop into a residential suburb of Nashville. The city was annexed by Nashville in 1963 and is now part of the metropolitan area.
Geography
Belle Meade is located in Davidson County, Tennessee. It is located just south of Nashville and is bordered by the cities of Oak Hill, Forest Hills, and Green Hills. The city has a total area of 2.2 square miles, all of which is land.
The city is located in the Central Basin of Tennessee and is part of the Nashville metropolitan area. The city is located on the banks of the Cumberland River and is surrounded by rolling hills.
Economy
The economy of Belle Meade is largely based on the service industry. The city is home to a number of restaurants, retail stores, and other businesses. The city is also home to a number of medical facilities, including Vanderbilt University Medical Center and Saint Thomas Midtown Hospital.
The city is also home to a number of corporate headquarters, including Bridgestone Americas, Dollar General, and HCA Healthcare.
Demographics
As of the 2010 census, the population of Belle Meade was 2,912. The racial makeup of the city was 87.3% White, 8.2% African American, 0.7% Asian, 0.2% Native American, and 3.6% from other races. Hispanic or Latino of any race were 2.2% of the population.
The median household income in Belle Meade was $90,945, and the median family income was $103,945. The per capita income for the city was $45,945. About 4.3% of families and 5.3% of the population were below the poverty line.
Belle Meade is a small city with a rich history and a vibrant economy. The city is home to a number of corporate headquarters and medical facilities, and is a popular residential suburb of Nashville. The city has a diverse population and a median household income that is higher than the national average.
Common Questions
What is Per Capita Income in Belle Meade?
Per Capita income in Belle Meade is $154,324.
What is the Median Family Income in Belle Meade?
Median Family Income in Belle Meade is $250,001.
What is the Median Household income in Belle Meade?
Median Household Income in Belle Meade is $250,001.
What is Inequality or Gini Index in Belle Meade?
Inequality or Gini Index in Belle Meade is 0.45.
What is the Total Population of Belle Meade?
Total Population of Belle Meade is 2,933.
What is the Total Male Population of Belle Meade?
Total Male Population of Belle Meade is 1,435.
What is the Total Female Population of Belle Meade?
Total Female Population of Belle Meade is 1,498.
What is the Ratio of Males per 100 Females in Belle Meade?
There are 95.79 Males per 100 Females in Belle Meade.
What is the Ratio of Females per 100 Males in Belle Meade?
There are 104.39 Females per 100 Males in Belle Meade.
What is the Median Population Age in Belle Meade?
Median Population Age in Belle Meade is 43.6 Years.
What is the Average Family Size in Belle Meade
Average Family Size in Belle Meade is 3.4 People.
What is the Average Household Size in Belle Meade
Average Household Size in Belle Meade is 3.2 People.
How Large is the Labor Force in Belle Meade?
There are 1,354 People in the Labor Forcein in Belle Meade.
What is the Percentage of People in the Labor Force in Belle Meade?
59.5% of People are in the Labor Force in Belle Meade.
What is the Unemployment Rate in Belle Meade?
Unemployment Rate in Belle Meade is 1.0%.