St Paul, MO Map & Demographics
St Paul Map
St Paul Overview
$56,804
PER CAPITA INCOME
$153,571
AVG FAMILY INCOME
$142,946
AVG HOUSEHOLD INCOME
15.4%
WAGE / INCOME GAP [ % ]
84.6¢/ $1
WAGE / INCOME GAP [ $ ]
0.36
INEQUALITY / GINI INDEX
3,149
TOTAL POPULATION
1,683
MALE POPULATION
1,466
FEMALE POPULATION
114.80
MALES / 100 FEMALES
87.11
FEMALES / 100 MALES
43.4
MEDIAN AGE
3.0
AVG FAMILY SIZE
2.8
AVG HOUSEHOLD SIZE
1,613
LABOR FORCE [ PEOPLE ]
61.2%
PERCENT IN LABOR FORCE
0.5%
UNEMPLOYMENT RATE
Income in St Paul
Income Overview in St Paul
Per Capita Income in St Paul is $56,804, while median incomes of families and households are $153,571 and $142,946 respectively.
| Characteristic | Number | Measure |
| Per Capita Income | 3,149 | $56,804 |
| Median Family Income | 978 | $153,571 |
| Mean Family Income | 978 | $171,066 |
| Median Household Income | 1,129 | $142,946 |
| Mean Household Income | 1,129 | $159,936 |
| Income Deficit | 978 | $0 |
| Wage / Income Gap (%) | 3,149 | 15.45% |
| Wage / Income Gap ($) | 3,149 | 84.55¢ per $1 |
| Gini / Inequality Index | 3,149 | 0.36 |
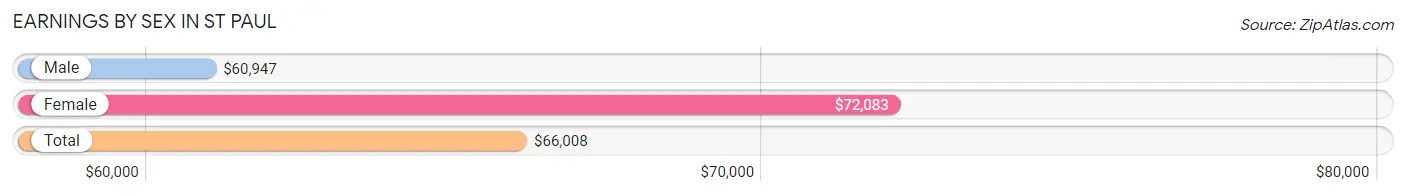
Earnings by Sex in St Paul
Average Earnings in St Paul are $66,008, $60,947 for men and $72,083 for women, a difference of 15.4%.
| Sex | Number | Average Earnings |
| Male | 967 (53.3%) | $60,947 |
| Female | 848 (46.7%) | $72,083 |
| Total | 1,815 (100.0%) | $66,008 |
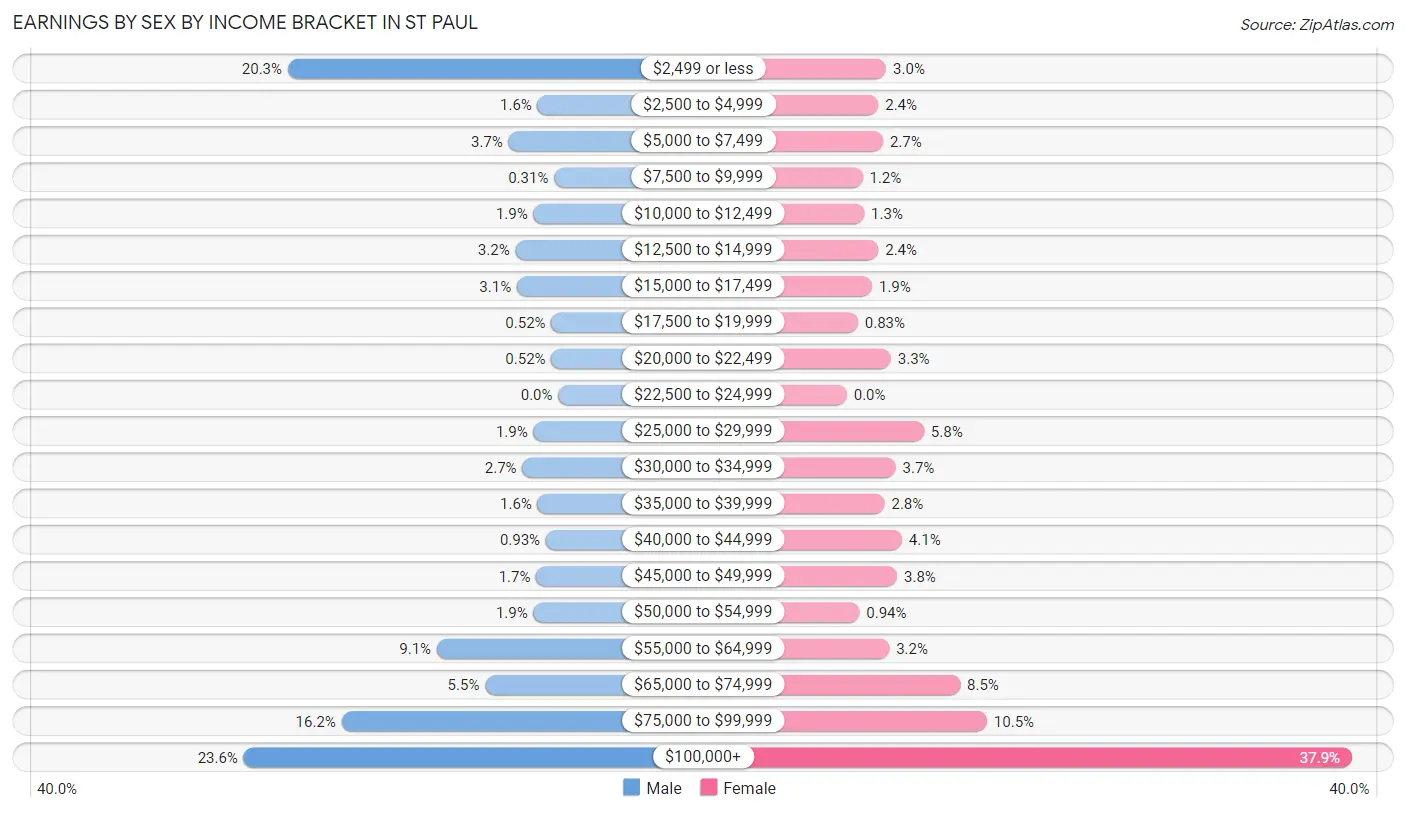
Earnings by Sex by Income Bracket in St Paul
The most common earnings brackets in St Paul are $100,000+ for men (228 | 23.6%) and $100,000+ for women (321 | 37.9%).
| Income | Male | Female |
| $2,499 or less | 196 (20.3%) | 25 (2.9%) |
| $2,500 to $4,999 | 15 (1.5%) | 20 (2.4%) |
| $5,000 to $7,499 | 36 (3.7%) | 23 (2.7%) |
| $7,500 to $9,999 | 3 (0.3%) | 10 (1.2%) |
| $10,000 to $12,499 | 18 (1.9%) | 11 (1.3%) |
| $12,500 to $14,999 | 31 (3.2%) | 20 (2.4%) |
| $15,000 to $17,499 | 30 (3.1%) | 16 (1.9%) |
| $17,500 to $19,999 | 5 (0.5%) | 7 (0.8%) |
| $20,000 to $22,499 | 5 (0.5%) | 28 (3.3%) |
| $22,500 to $24,999 | 0 (0.0%) | 0 (0.0%) |
| $25,000 to $29,999 | 18 (1.9%) | 49 (5.8%) |
| $30,000 to $34,999 | 26 (2.7%) | 31 (3.7%) |
| $35,000 to $39,999 | 15 (1.5%) | 24 (2.8%) |
| $40,000 to $44,999 | 9 (0.9%) | 35 (4.1%) |
| $45,000 to $49,999 | 16 (1.7%) | 32 (3.8%) |
| $50,000 to $54,999 | 18 (1.9%) | 8 (0.9%) |
| $55,000 to $64,999 | 88 (9.1%) | 27 (3.2%) |
| $65,000 to $74,999 | 53 (5.5%) | 72 (8.5%) |
| $75,000 to $99,999 | 157 (16.2%) | 89 (10.5%) |
| $100,000+ | 228 (23.6%) | 321 (37.9%) |
| Total | 967 (100.0%) | 848 (100.0%) |
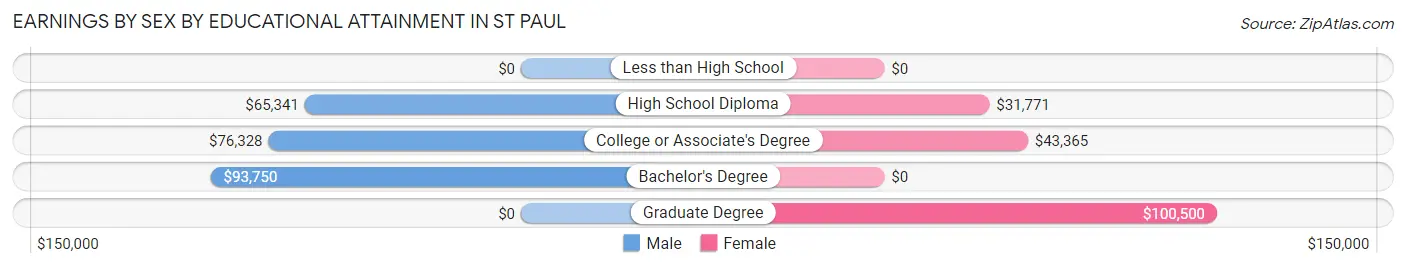
Earnings by Sex by Educational Attainment in St Paul
Average earnings in St Paul are $76,915 for men and $80,804 for women, a difference of 4.8%. Men with an educational attainment of bachelor's degree enjoy the highest average annual earnings of $93,750, while those with high school diploma education earn the least with $65,341. Women with an educational attainment of graduate degree earn the most with the average annual earnings of $100,500, while those with high school diploma education have the smallest earnings of $31,771.
| Educational Attainment | Male Income | Female Income |
| Less than High School | - | - |
| High School Diploma | $65,341 | $31,771 |
| College or Associate's Degree | $76,328 | $43,365 |
| Bachelor's Degree | $93,750 | $0 |
| Graduate Degree | - | - |
| Total | $76,915 | $80,804 |
Family Income in St Paul
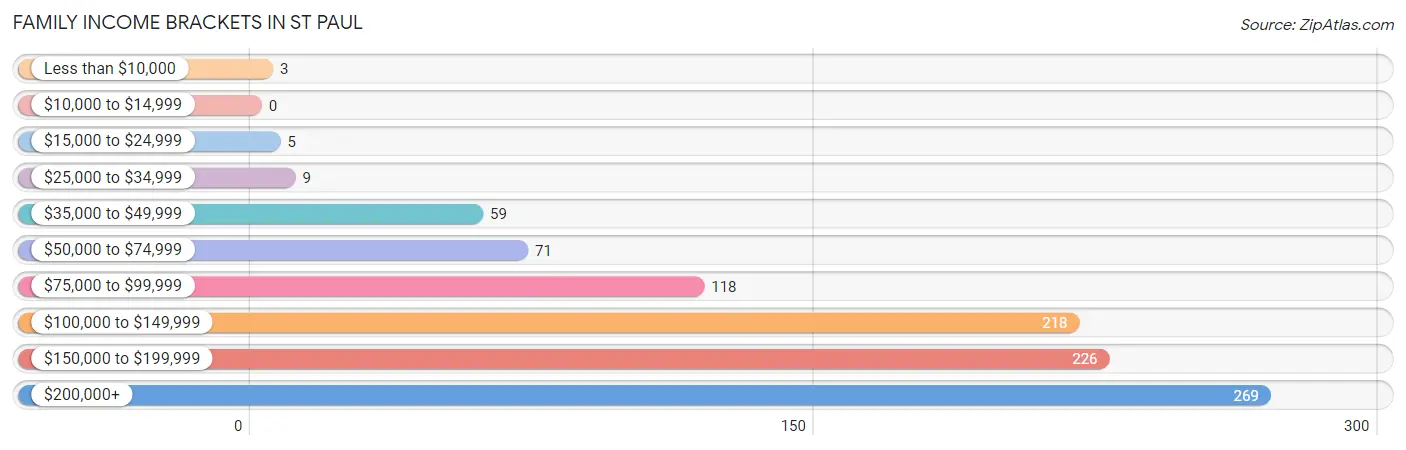
Family Income Brackets in St Paul
According to the St Paul family income data, there are 269 families falling into the $200,000+ income range, which is the most common income bracket and makes up 27.5% of all families.
| Income Bracket | # Families | % Families |
| Less than $10,000 | 3 | 0.3% |
| $10,000 to $14,999 | 0 | 0.0% |
| $15,000 to $24,999 | 5 | 0.5% |
| $25,000 to $34,999 | 9 | 0.9% |
| $35,000 to $49,999 | 59 | 6.0% |
| $50,000 to $74,999 | 71 | 7.3% |
| $75,000 to $99,999 | 118 | 12.1% |
| $100,000 to $149,999 | 218 | 22.3% |
| $150,000 to $199,999 | 226 | 23.1% |
| $200,000+ | 269 | 27.5% |
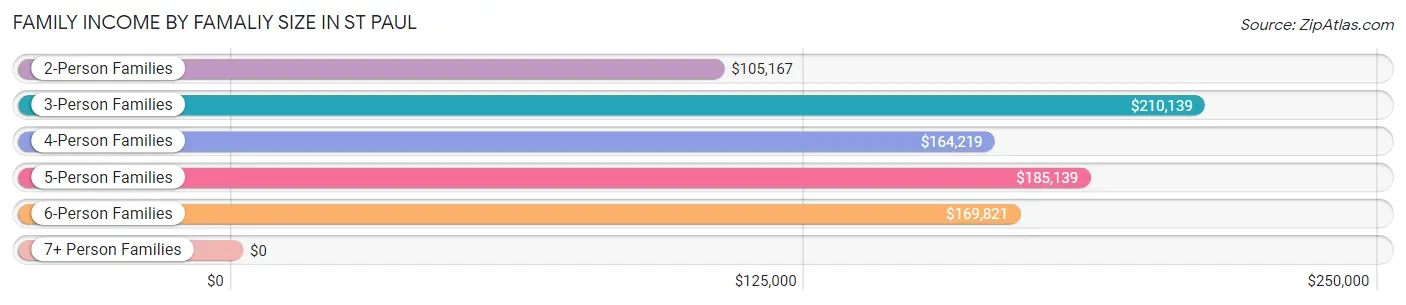
Family Income by Famaliy Size in St Paul
3-person families (378 | 38.7%) account for the highest median family income in St Paul with $210,139 per family, while 3-person families (378 | 38.7%) have the highest median income of $70,046 per family member.
| Income Bracket | # Families | Median Income |
| 2-Person Families | 414 (42.3%) | $105,167 |
| 3-Person Families | 378 (38.7%) | $210,139 |
| 4-Person Families | 137 (14.0%) | $164,219 |
| 5-Person Families | 33 (3.4%) | $185,139 |
| 6-Person Families | 13 (1.3%) | $169,821 |
| 7+ Person Families | 3 (0.3%) | $0 |
| Total | 978 (100.0%) | $153,571 |
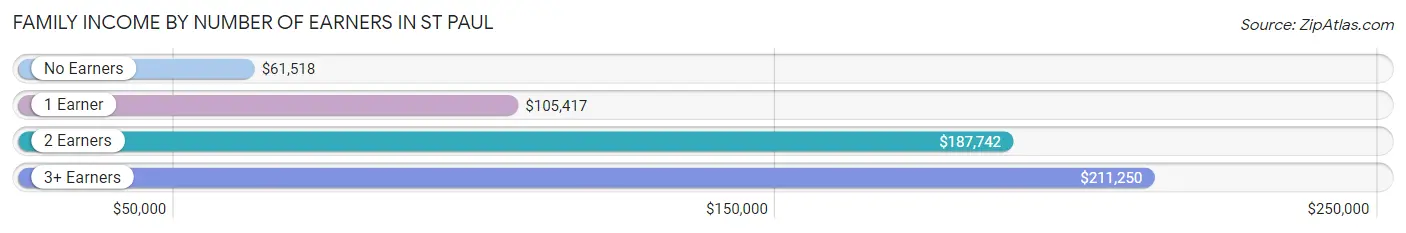
Family Income by Number of Earners in St Paul
The median family income in St Paul is $153,571, with families comprising 3+ earners (94) having the highest median family income of $211,250, while families with no earners (115) have the lowest median family income of $61,518, accounting for 9.6% and 11.8% of families, respectively.
| Number of Earners | # Families | Median Income |
| No Earners | 115 (11.8%) | $61,518 |
| 1 Earner | 219 (22.4%) | $105,417 |
| 2 Earners | 550 (56.2%) | $187,742 |
| 3+ Earners | 94 (9.6%) | $211,250 |
| Total | 978 (100.0%) | $153,571 |
Household Income in St Paul
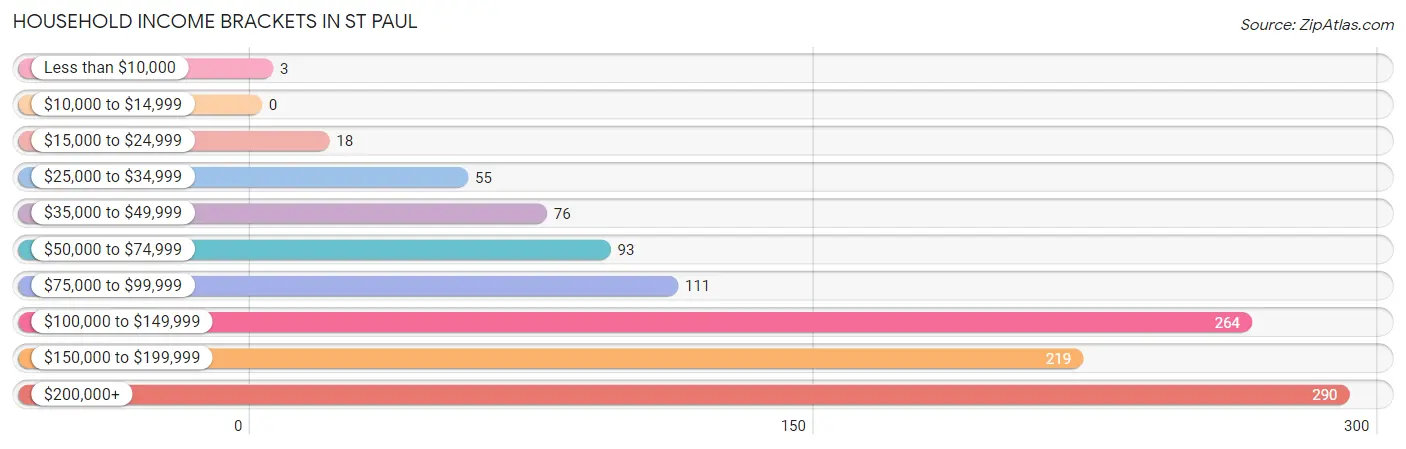
Household Income Brackets in St Paul
With 290 households falling in the category, the $200,000+ income range is the most frequent in St Paul, accounting for 25.7% of all households.
| Income Bracket | # Households | % Households |
| Less than $10,000 | 3 | 0.3% |
| $10,000 to $14,999 | 0 | 0.0% |
| $15,000 to $24,999 | 18 | 1.6% |
| $25,000 to $34,999 | 55 | 4.9% |
| $35,000 to $49,999 | 76 | 6.7% |
| $50,000 to $74,999 | 93 | 8.2% |
| $75,000 to $99,999 | 111 | 9.8% |
| $100,000 to $149,999 | 264 | 23.4% |
| $150,000 to $199,999 | 219 | 19.4% |
| $200,000+ | 290 | 25.7% |
Household Income by Householder Age in St Paul
The median household income in St Paul is $142,946, with the highest median household income of $197,852 found in the 25 to 44 years age bracket for the primary householder. A total of 451 households (40.0%) fall into this category. Meanwhile, the 15 to 24 years age bracket for the primary householder has the lowest median household income of $0, with 7 households (0.6%) in this group.
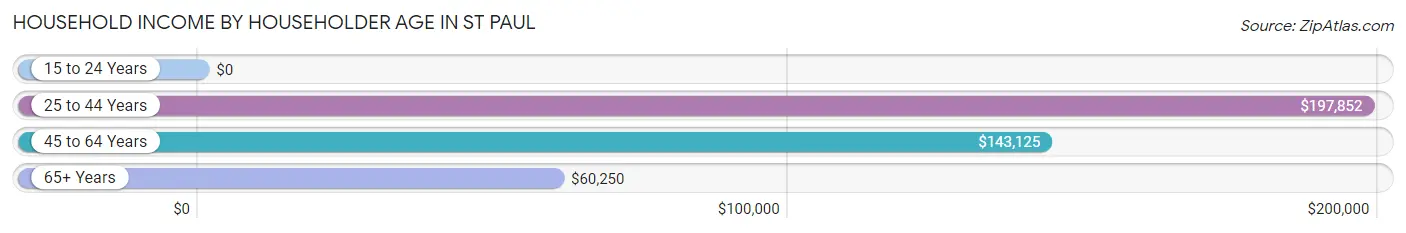
| Income Bracket | # Households | Median Income |
| 15 to 24 Years | 7 (0.6%) | $0 |
| 25 to 44 Years | 451 (40.0%) | $197,852 |
| 45 to 64 Years | 363 (32.2%) | $143,125 |
| 65+ Years | 308 (27.3%) | $60,250 |
| Total | 1,129 (100.0%) | $142,946 |
Poverty in St Paul
Income Below Poverty by Sex and Age in St Paul
With 0.2% poverty level for males and 0.2% for females among the residents of St Paul, 55 to 64 year old males and 55 to 64 year old females are the most vulnerable to poverty, with 4 males (1.2%) and 3 females (1.1%) in their respective age groups living below the poverty level.
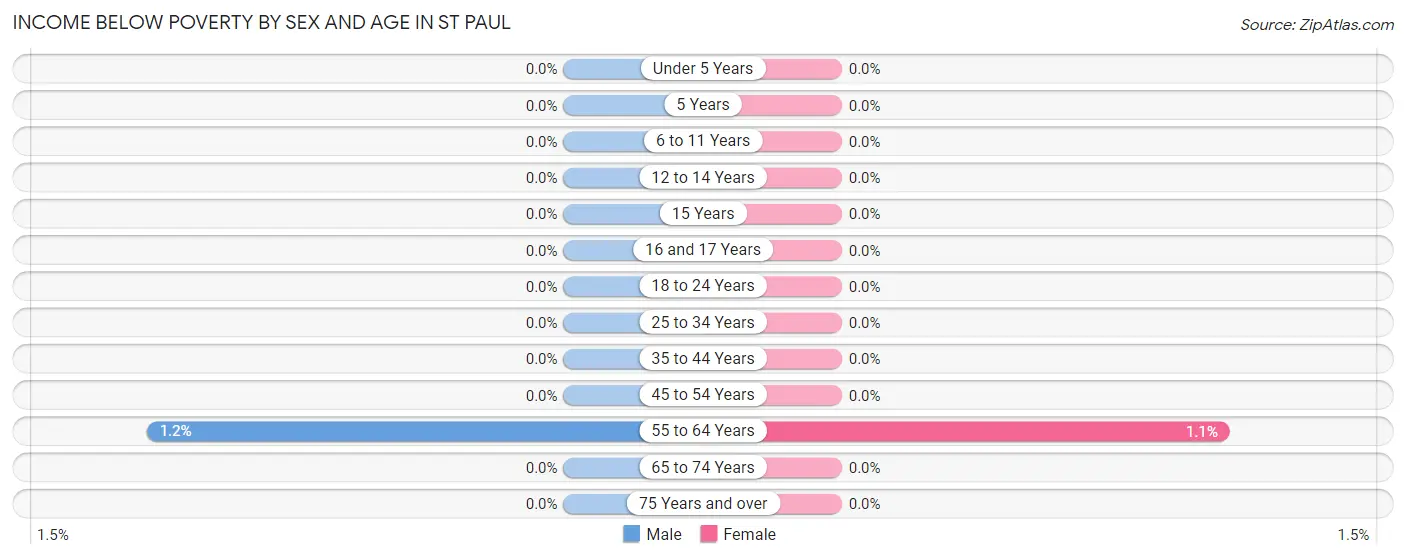
| Age Bracket | Male | Female |
| Under 5 Years | 0 (0.0%) | 0 (0.0%) |
| 5 Years | 0 (0.0%) | 0 (0.0%) |
| 6 to 11 Years | 0 (0.0%) | 0 (0.0%) |
| 12 to 14 Years | 0 (0.0%) | 0 (0.0%) |
| 15 Years | 0 (0.0%) | 0 (0.0%) |
| 16 and 17 Years | 0 (0.0%) | 0 (0.0%) |
| 18 to 24 Years | 0 (0.0%) | 0 (0.0%) |
| 25 to 34 Years | 0 (0.0%) | 0 (0.0%) |
| 35 to 44 Years | 0 (0.0%) | 0 (0.0%) |
| 45 to 54 Years | 0 (0.0%) | 0 (0.0%) |
| 55 to 64 Years | 4 (1.2%) | 3 (1.1%) |
| 65 to 74 Years | 0 (0.0%) | 0 (0.0%) |
| 75 Years and over | 0 (0.0%) | 0 (0.0%) |
| Total | 4 (0.2%) | 3 (0.2%) |
Income Above Poverty by Sex and Age in St Paul
According to the poverty statistics in St Paul, males aged under 5 years and females aged under 5 years are the age groups that are most secure financially, with 100.0% of males and 100.0% of females in these age groups living above the poverty line.
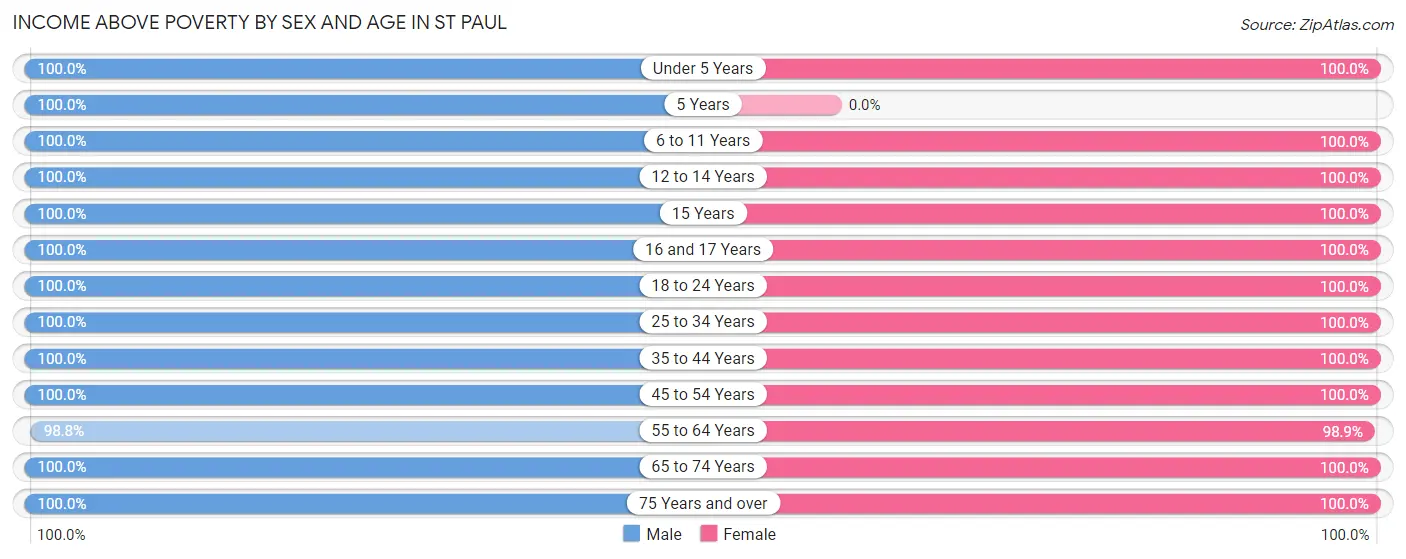
| Age Bracket | Male | Female |
| Under 5 Years | 61 (100.0%) | 177 (100.0%) |
| 5 Years | 3 (100.0%) | 0 (0.0%) |
| 6 to 11 Years | 81 (100.0%) | 68 (100.0%) |
| 12 to 14 Years | 49 (100.0%) | 30 (100.0%) |
| 15 Years | 16 (100.0%) | 28 (100.0%) |
| 16 and 17 Years | 11 (100.0%) | 10 (100.0%) |
| 18 to 24 Years | 273 (100.0%) | 56 (100.0%) |
| 25 to 34 Years | 179 (100.0%) | 159 (100.0%) |
| 35 to 44 Years | 323 (100.0%) | 169 (100.0%) |
| 45 to 54 Years | 118 (100.0%) | 226 (100.0%) |
| 55 to 64 Years | 341 (98.8%) | 276 (98.9%) |
| 65 to 74 Years | 103 (100.0%) | 145 (100.0%) |
| 75 Years and over | 121 (100.0%) | 119 (100.0%) |
| Total | 1,679 (99.8%) | 1,463 (99.8%) |
Income Below Poverty Among Married-Couple Families in St Paul
The poverty statistics for married-couple families in St Paul show that 0.3% or 3 of the total 881 families live below the poverty line. Families with no children have the highest poverty rate of 0.5%, comprising of 3 families. On the other hand, families with 1 or 2 children have the lowest poverty rate of 0.0%, which includes 0 families.
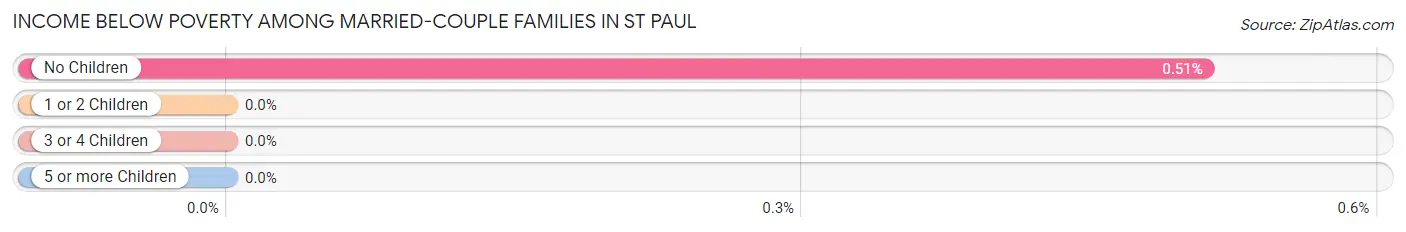
| Children | Above Poverty | Below Poverty |
| No Children | 585 (99.5%) | 3 (0.5%) |
| 1 or 2 Children | 259 (100.0%) | 0 (0.0%) |
| 3 or 4 Children | 31 (100.0%) | 0 (0.0%) |
| 5 or more Children | 3 (100.0%) | 0 (0.0%) |
| Total | 878 (99.7%) | 3 (0.3%) |
Income Below Poverty Among Single-Parent Households in St Paul
| Children | Single Father | Single Mother |
| No Children | 0 (0.0%) | 0 (0.0%) |
| 1 or 2 Children | 0 (0.0%) | 0 (0.0%) |
| 3 or 4 Children | 0 (0.0%) | 0 (0.0%) |
| 5 or more Children | 0 (0.0%) | 0 (0.0%) |
| Total | 0 (0.0%) | 0 (0.0%) |
Income Below Poverty Among Married-Couple vs Single-Parent Households in St Paul
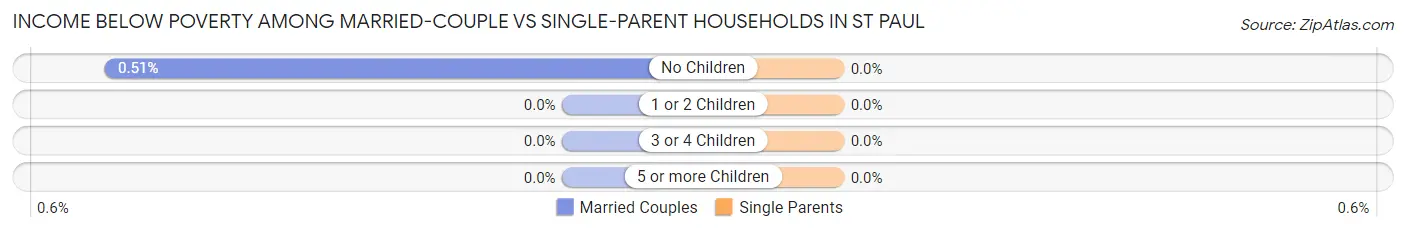
| Children | Married-Couple Families | Single-Parent Households |
| No Children | 3 (0.5%) | 0 (0.0%) |
| 1 or 2 Children | 0 (0.0%) | 0 (0.0%) |
| 3 or 4 Children | 0 (0.0%) | 0 (0.0%) |
| 5 or more Children | 0 (0.0%) | 0 (0.0%) |
| Total | 3 (0.3%) | 0 (0.0%) |
Race in St Paul
The most populous races in St Paul are White / Caucasian (3,018 | 95.8%), Two or more Races (87 | 2.8%), and Hispanic or Latino (60 | 1.9%).
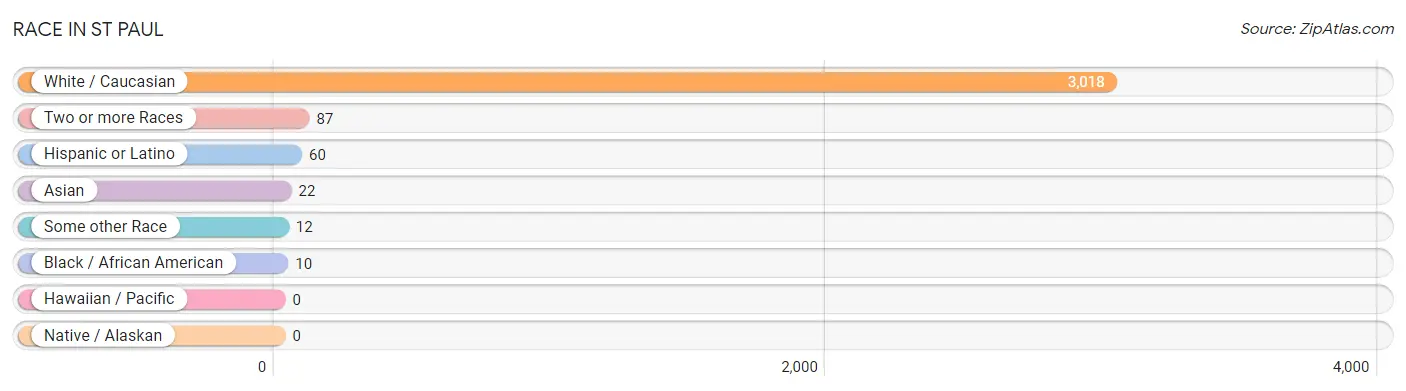
| Race | # Population | % Population |
| Asian | 22 | 0.7% |
| Black / African American | 10 | 0.3% |
| Hawaiian / Pacific | 0 | 0.0% |
| Hispanic or Latino | 60 | 1.9% |
| Native / Alaskan | 0 | 0.0% |
| White / Caucasian | 3,018 | 95.8% |
| Two or more Races | 87 | 2.8% |
| Some other Race | 12 | 0.4% |
| Total | 3,149 | 100.0% |
Ancestry in St Paul
The most populous ancestries reported in St Paul are German (1,220 | 38.7%), English (497 | 15.8%), Italian (417 | 13.2%), Irish (365 | 11.6%), and Polish (170 | 5.4%), together accounting for 84.8% of all St Paul residents.
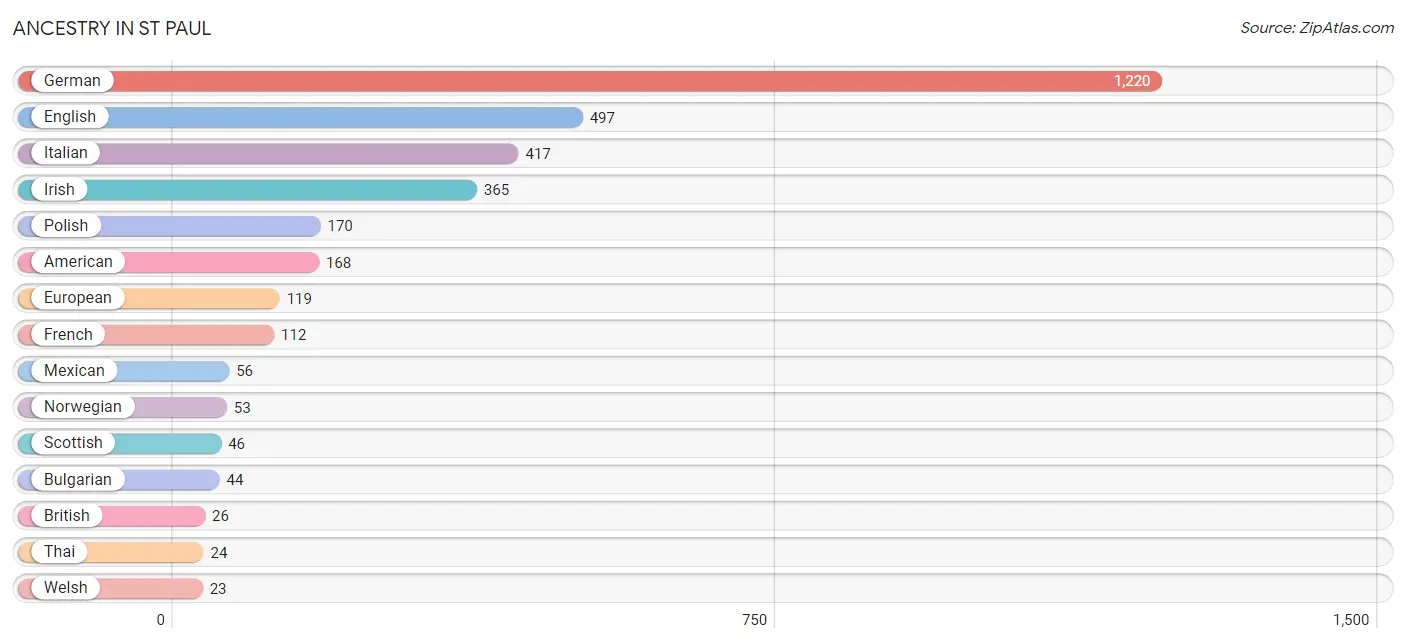
| Ancestry | # Population | % Population |
| American | 168 | 5.3% |
| Arab | 9 | 0.3% |
| Belgian | 5 | 0.2% |
| Bhutanese | 12 | 0.4% |
| Brazilian | 4 | 0.1% |
| British | 26 | 0.8% |
| Bulgarian | 44 | 1.4% |
| Cherokee | 4 | 0.1% |
| Croatian | 6 | 0.2% |
| Czech | 5 | 0.2% |
| Czechoslovakian | 13 | 0.4% |
| Dutch | 15 | 0.5% |
| English | 497 | 15.8% |
| European | 119 | 3.8% |
| French | 112 | 3.6% |
| German | 1,220 | 38.7% |
| Hungarian | 12 | 0.4% |
| Irish | 365 | 11.6% |
| Israeli | 5 | 0.2% |
| Italian | 417 | 13.2% |
| Korean | 9 | 0.3% |
| Lebanese | 4 | 0.1% |
| Lithuanian | 4 | 0.1% |
| Mexican | 56 | 1.8% |
| Norwegian | 53 | 1.7% |
| Polish | 170 | 5.4% |
| Scandinavian | 9 | 0.3% |
| Scotch-Irish | 5 | 0.2% |
| Scottish | 46 | 1.5% |
| Slavic | 4 | 0.1% |
| Sri Lankan | 5 | 0.2% |
| Swedish | 19 | 0.6% |
| Thai | 24 | 0.8% |
| Ukrainian | 8 | 0.3% |
| Welsh | 23 | 0.7% | View All 35 Rows |
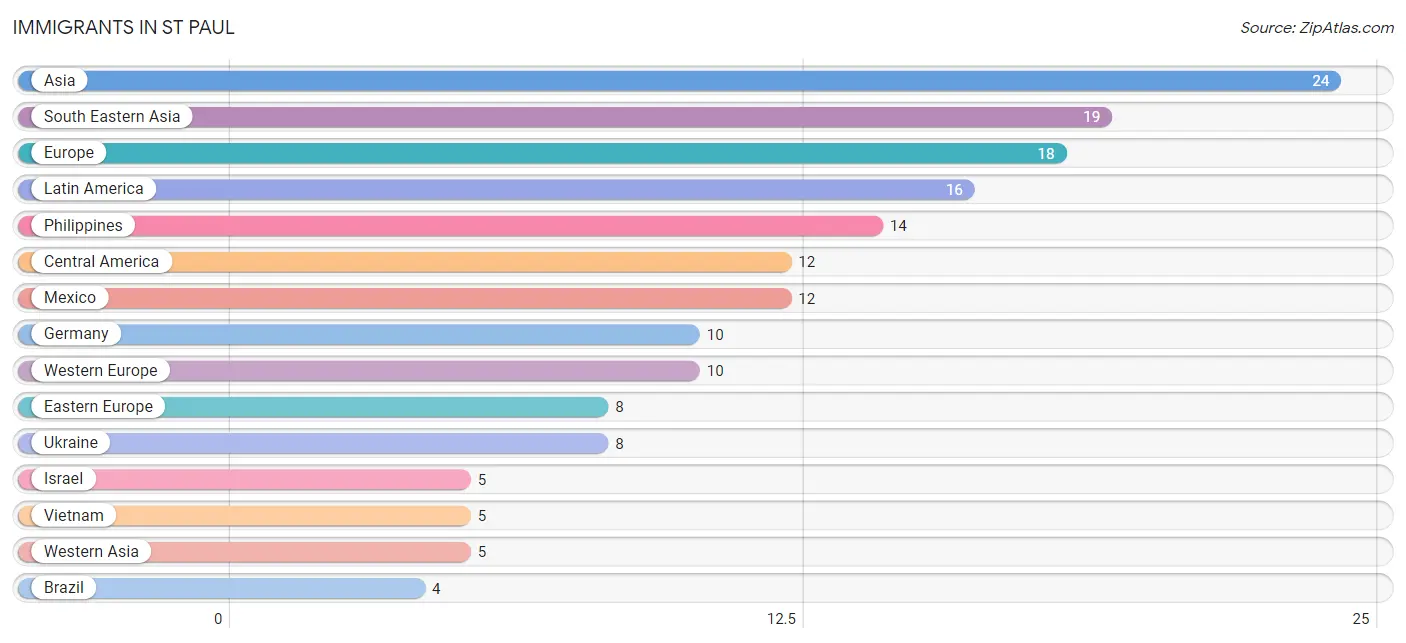
Immigrants in St Paul
The most numerous immigrant groups reported in St Paul came from Asia (24 | 0.8%), South Eastern Asia (19 | 0.6%), Europe (18 | 0.6%), Latin America (16 | 0.5%), and Philippines (14 | 0.4%), together accounting for 2.9% of all St Paul residents.
| Immigration Origin | # Population | % Population |
| Asia | 24 | 0.8% |
| Brazil | 4 | 0.1% |
| Central America | 12 | 0.4% |
| Eastern Europe | 8 | 0.3% |
| Europe | 18 | 0.6% |
| Germany | 10 | 0.3% |
| Israel | 5 | 0.2% |
| Latin America | 16 | 0.5% |
| Mexico | 12 | 0.4% |
| Philippines | 14 | 0.4% |
| South America | 4 | 0.1% |
| South Eastern Asia | 19 | 0.6% |
| Ukraine | 8 | 0.3% |
| Vietnam | 5 | 0.2% |
| Western Asia | 5 | 0.2% |
| Western Europe | 10 | 0.3% | View All 16 Rows |
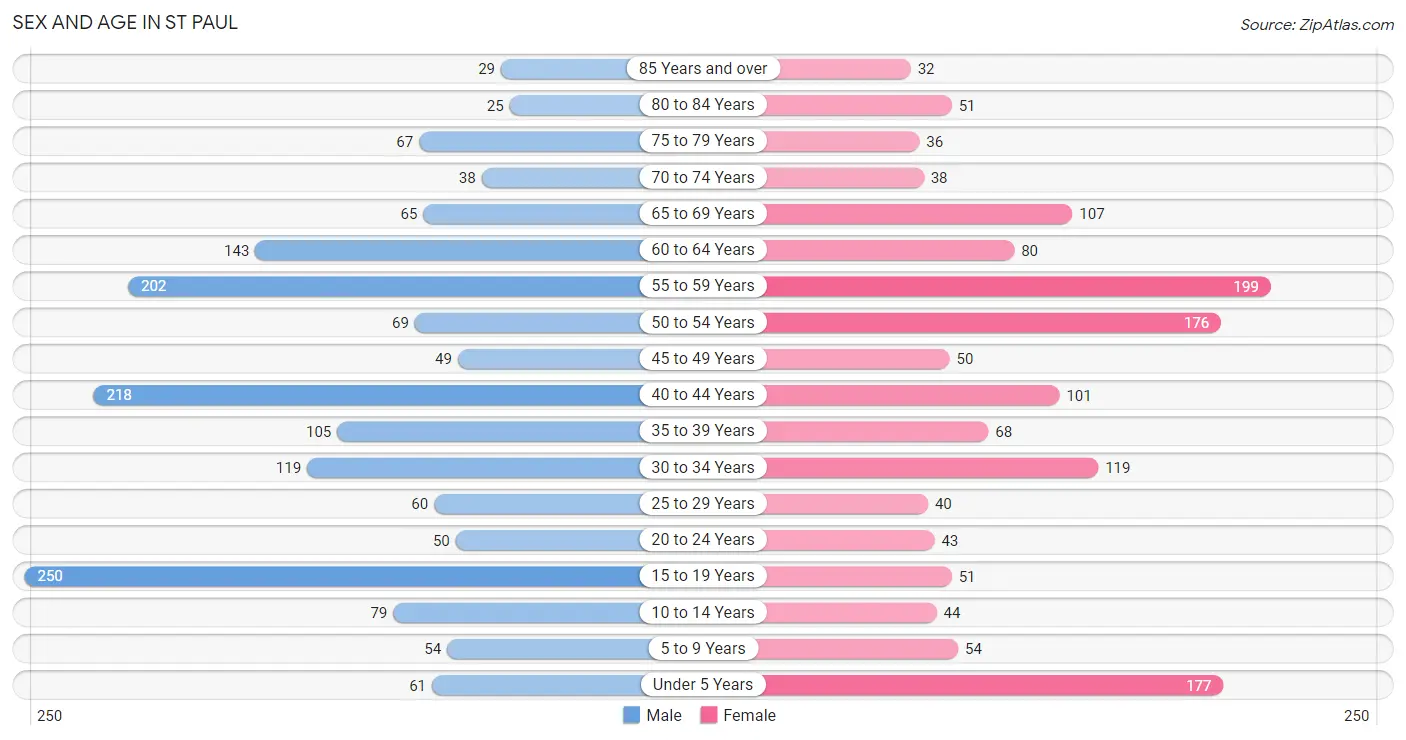
Sex and Age in St Paul
Sex and Age in St Paul
The most populous age groups in St Paul are 15 to 19 Years (250 | 14.8%) for men and 55 to 59 Years (199 | 13.6%) for women.
| Age Bracket | Male | Female |
| Under 5 Years | 61 (3.6%) | 177 (12.1%) |
| 5 to 9 Years | 54 (3.2%) | 54 (3.7%) |
| 10 to 14 Years | 79 (4.7%) | 44 (3.0%) |
| 15 to 19 Years | 250 (14.8%) | 51 (3.5%) |
| 20 to 24 Years | 50 (3.0%) | 43 (2.9%) |
| 25 to 29 Years | 60 (3.6%) | 40 (2.7%) |
| 30 to 34 Years | 119 (7.1%) | 119 (8.1%) |
| 35 to 39 Years | 105 (6.2%) | 68 (4.6%) |
| 40 to 44 Years | 218 (13.0%) | 101 (6.9%) |
| 45 to 49 Years | 49 (2.9%) | 50 (3.4%) |
| 50 to 54 Years | 69 (4.1%) | 176 (12.0%) |
| 55 to 59 Years | 202 (12.0%) | 199 (13.6%) |
| 60 to 64 Years | 143 (8.5%) | 80 (5.5%) |
| 65 to 69 Years | 65 (3.9%) | 107 (7.3%) |
| 70 to 74 Years | 38 (2.3%) | 38 (2.6%) |
| 75 to 79 Years | 67 (4.0%) | 36 (2.5%) |
| 80 to 84 Years | 25 (1.5%) | 51 (3.5%) |
| 85 Years and over | 29 (1.7%) | 32 (2.2%) |
| Total | 1,683 (100.0%) | 1,466 (100.0%) |
Families and Households in St Paul
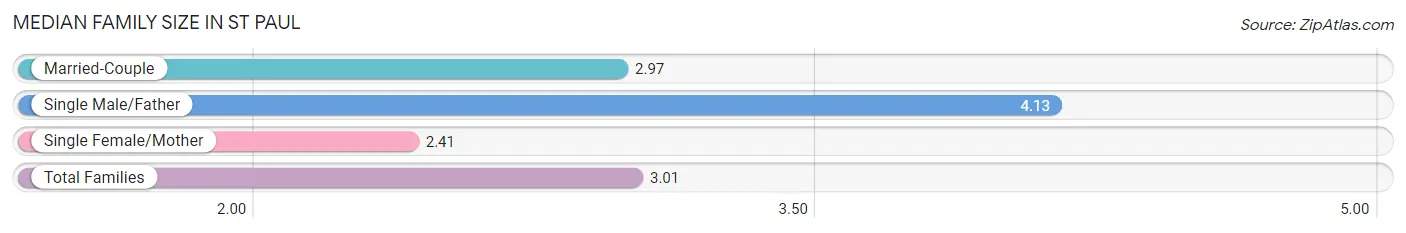
Median Family Size in St Paul
The median family size in St Paul is 3.01 persons per family, with single male/father families (53 | 5.4%) accounting for the largest median family size of 4.13 persons per family. On the other hand, single female/mother families (44 | 4.5%) represent the smallest median family size with 2.41 persons per family.
| Family Type | # Families | Family Size |
| Married-Couple | 881 (90.1%) | 2.97 |
| Single Male/Father | 53 (5.4%) | 4.13 |
| Single Female/Mother | 44 (4.5%) | 2.41 |
| Total Families | 978 (100.0%) | 3.01 |
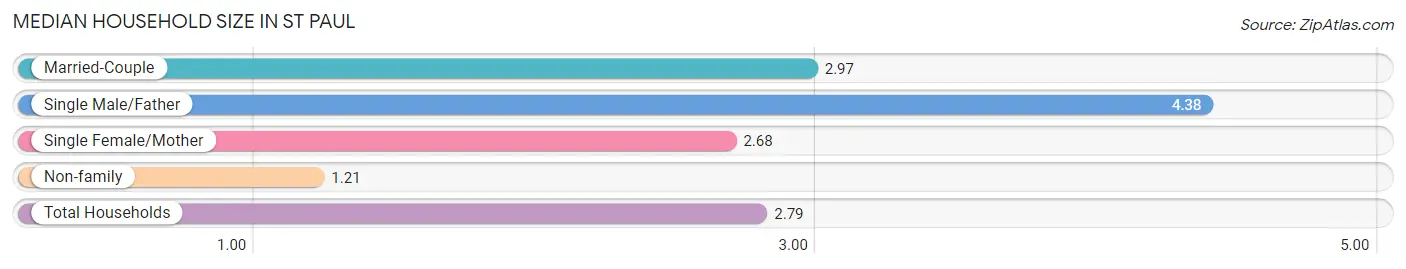
Median Household Size in St Paul
The median household size in St Paul is 2.79 persons per household, with single male/father households (53 | 4.7%) accounting for the largest median household size of 4.38 persons per household. non-family households (151 | 13.4%) represent the smallest median household size with 1.21 persons per household.
| Household Type | # Households | Household Size |
| Married-Couple | 881 (78.0%) | 2.97 |
| Single Male/Father | 53 (4.7%) | 4.38 |
| Single Female/Mother | 44 (3.9%) | 2.68 |
| Non-family | 151 (13.4%) | 1.21 |
| Total Households | 1,129 (100.0%) | 2.79 |
Household Size by Marriage Status in St Paul
Out of a total of 1,129 households in St Paul, 978 (86.6%) are family households, while 151 (13.4%) are nonfamily households. The most numerous type of family households are 2-person households, comprising 395, and the most common type of nonfamily households are 1-person households, comprising 120.
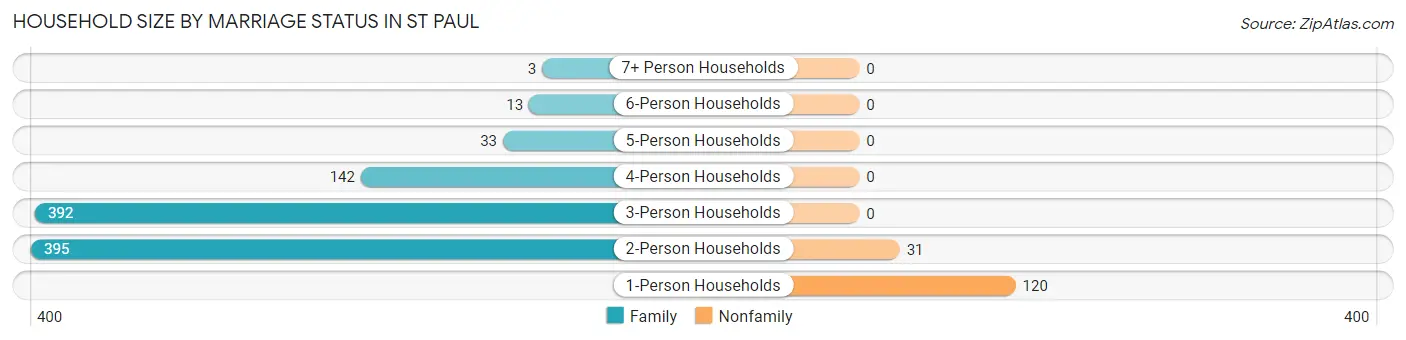
| Household Size | Family Households | Nonfamily Households |
| 1-Person Households | - | 120 (10.6%) |
| 2-Person Households | 395 (35.0%) | 31 (2.8%) |
| 3-Person Households | 392 (34.7%) | 0 (0.0%) |
| 4-Person Households | 142 (12.6%) | 0 (0.0%) |
| 5-Person Households | 33 (2.9%) | 0 (0.0%) |
| 6-Person Households | 13 (1.1%) | 0 (0.0%) |
| 7+ Person Households | 3 (0.3%) | 0 (0.0%) |
| Total | 978 (86.6%) | 151 (13.4%) |
Female Fertility in St Paul
Fertility by Age in St Paul
Average fertility rate in St Paul is 123.0 births per 1,000 women. Women in the age bracket of 20 to 34 years have the highest fertility rate with 287.0 births per 1,000 women. Women in the age bracket of 20 to 34 years acount for 78.4% of all women with births.
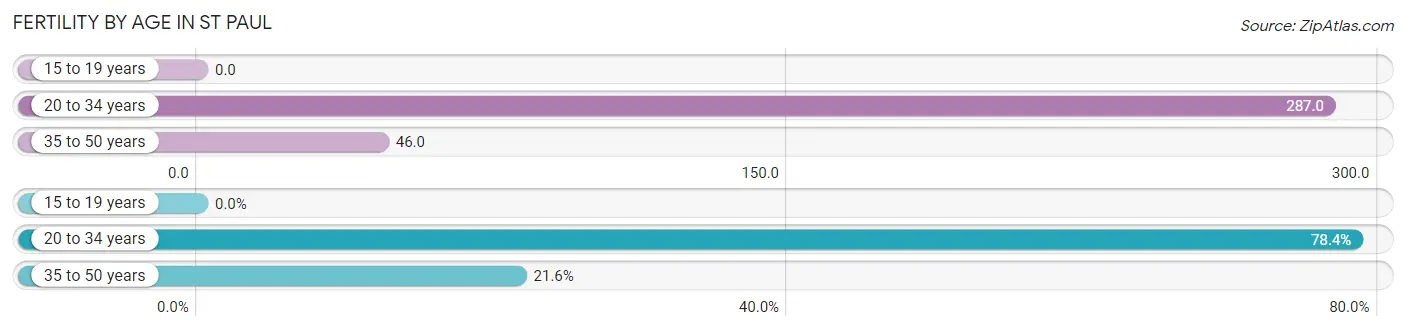
| Age Bracket | Women with Births | Births / 1,000 Women |
| 15 to 19 years | 0 (0.0%) | 0.0 |
| 20 to 34 years | 58 (78.4%) | 287.0 |
| 35 to 50 years | 16 (21.6%) | 46.0 |
| Total | 74 (100.0%) | 123.0 |
Fertility by Age by Marriage Status in St Paul
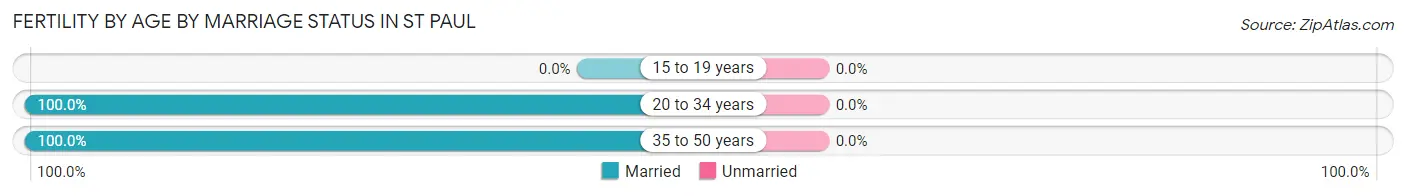
| Age Bracket | Married | Unmarried |
| 15 to 19 years | 0 (0.0%) | 0 (0.0%) |
| 20 to 34 years | 58 (100.0%) | 0 (0.0%) |
| 35 to 50 years | 16 (100.0%) | 0 (0.0%) |
| Total | 74 (100.0%) | 0 (0.0%) |
Fertility by Education in St Paul
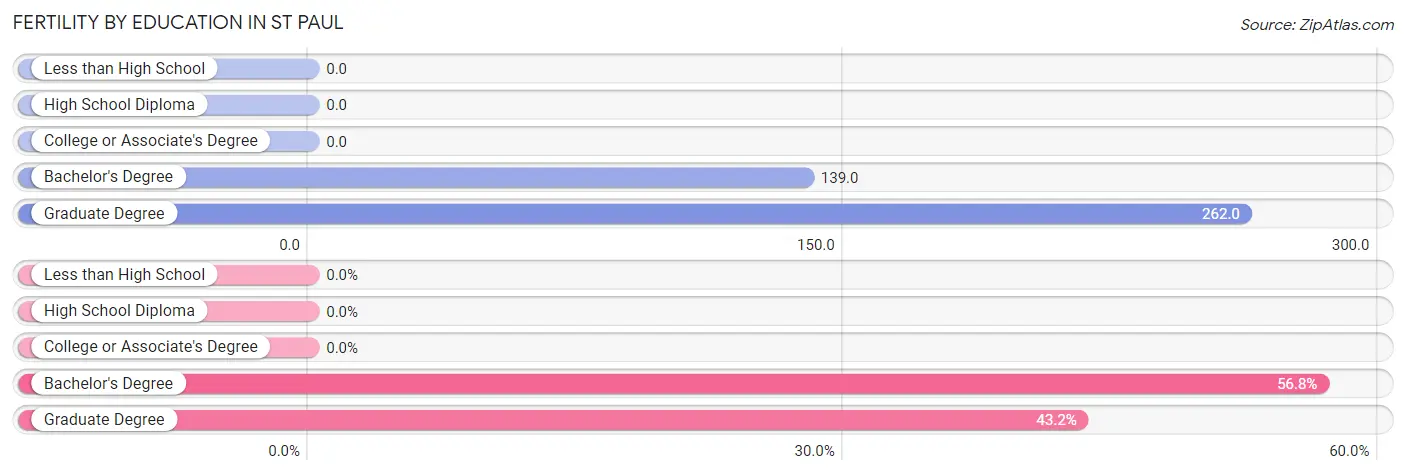
| Educational Attainment | Women with Births | Births / 1,000 Women |
| Less than High School | 0 (0.0%) | 0.0 |
| High School Diploma | 0 (0.0%) | 0.0 |
| College or Associate's Degree | 0 (0.0%) | 0.0 |
| Bachelor's Degree | 42 (56.8%) | 139.0 |
| Graduate Degree | 32 (43.2%) | 262.0 |
| Total | 74 (100.0%) | 123.0 |
Fertility by Education by Marriage Status in St Paul
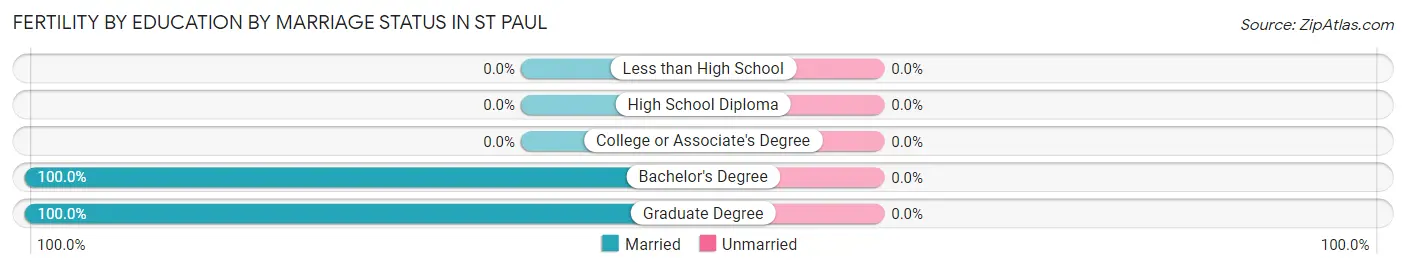
| Educational Attainment | Married | Unmarried |
| Less than High School | 0 (0.0%) | 0 (0.0%) |
| High School Diploma | 0 (0.0%) | 0 (0.0%) |
| College or Associate's Degree | 0 (0.0%) | 0 (0.0%) |
| Bachelor's Degree | 42 (100.0%) | 0 (0.0%) |
| Graduate Degree | 32 (100.0%) | 0 (0.0%) |
| Total | 74 (100.0%) | 0 (0.0%) |
Employment Characteristics in St Paul
Employment by Class of Employer in St Paul
Among the 1,594 employed individuals in St Paul, private company employees (1,231 | 77.2%), self-employed (incorporated) (92 | 5.8%), and not-for-profit organizations (92 | 5.8%) make up the most common classes of employment.
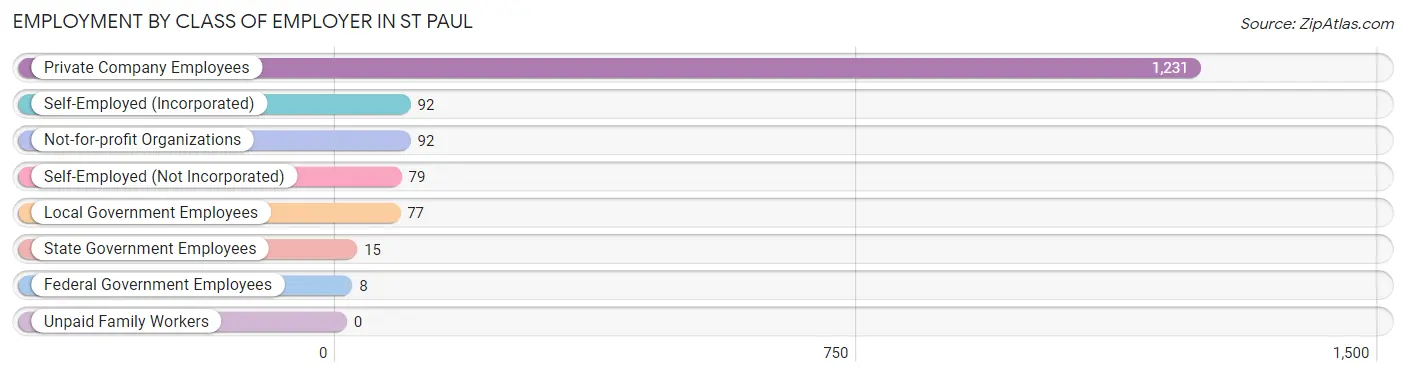
| Employer Class | # Employees | % Employees |
| Private Company Employees | 1,231 | 77.2% |
| Self-Employed (Incorporated) | 92 | 5.8% |
| Self-Employed (Not Incorporated) | 79 | 5.0% |
| Not-for-profit Organizations | 92 | 5.8% |
| Local Government Employees | 77 | 4.8% |
| State Government Employees | 15 | 0.9% |
| Federal Government Employees | 8 | 0.5% |
| Unpaid Family Workers | 0 | 0.0% |
| Total | 1,594 | 100.0% |
Employment Status by Age in St Paul
According to the labor force statistics for St Paul, out of the total population over 16 years of age (2,636), 61.2% or 1,613 individuals are in the labor force, with 0.5% or 8 of them unemployed. The age group with the highest labor force participation rate is 25 to 29 years, with 100.0% or 100 individuals in the labor force. Within the labor force, the 20 to 24 years age range has the highest percentage of unemployed individuals, with 9.6% or 8 of them being unemployed.
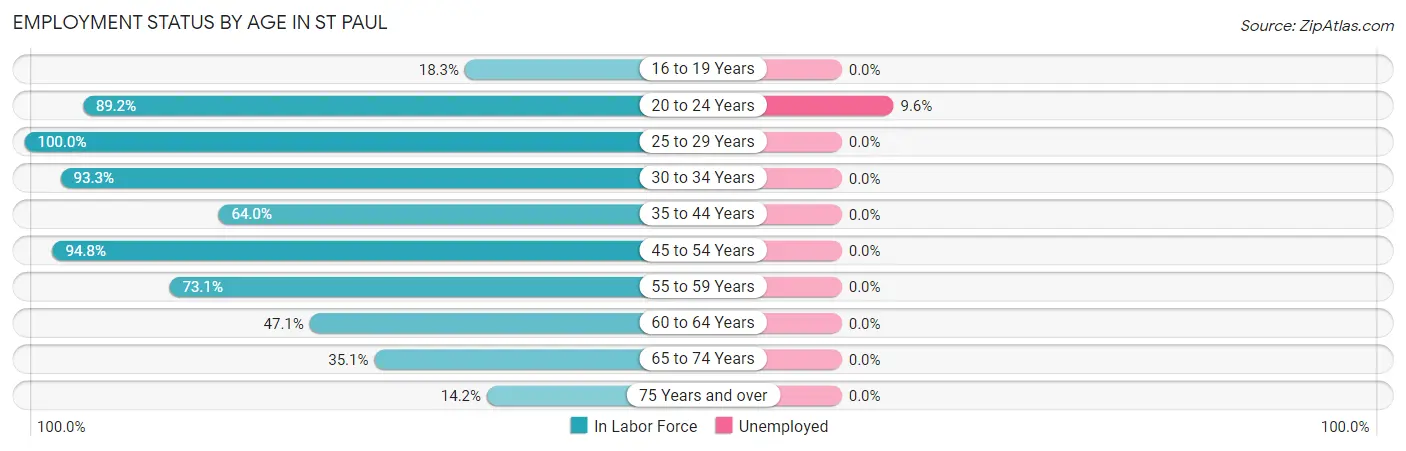
| Age Bracket | In Labor Force | Unemployed |
| 16 to 19 Years | 47 (18.3%) | 0 (0.0%) |
| 20 to 24 Years | 83 (89.2%) | 8 (9.6%) |
| 25 to 29 Years | 100 (100.0%) | 0 (0.0%) |
| 30 to 34 Years | 222 (93.3%) | 0 (0.0%) |
| 35 to 44 Years | 315 (64.0%) | 0 (0.0%) |
| 45 to 54 Years | 326 (94.8%) | 0 (0.0%) |
| 55 to 59 Years | 293 (73.1%) | 0 (0.0%) |
| 60 to 64 Years | 105 (47.1%) | 0 (0.0%) |
| 65 to 74 Years | 87 (35.1%) | 0 (0.0%) |
| 75 Years and over | 34 (14.2%) | 0 (0.0%) |
| Total | 1,613 (61.2%) | 8 (0.5%) |
Employment Status by Educational Attainment in St Paul
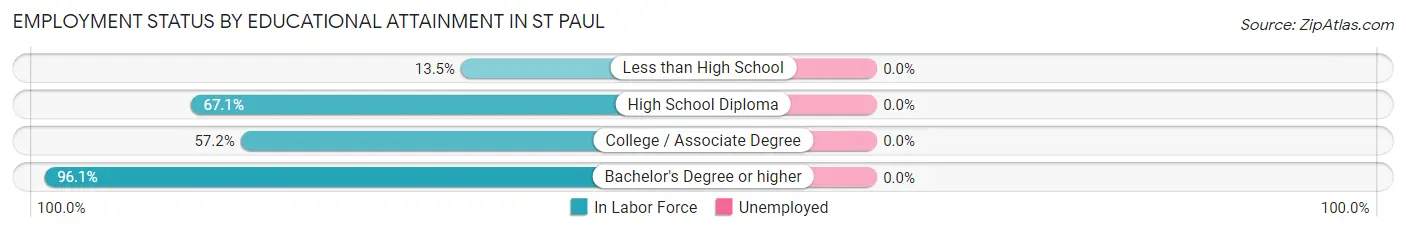
| Educational Attainment | In Labor Force | Unemployed |
| Less than High School | 5 (13.5%) | 0 (0.0%) |
| High School Diploma | 230 (67.1%) | 0 (0.0%) |
| College / Associate Degree | 347 (57.2%) | 0 (0.0%) |
| Bachelor's Degree or higher | 779 (96.1%) | 0 (0.0%) |
| Total | 1,361 (75.7%) | 0 (0.0%) |
Employment Occupations by Sex in St Paul
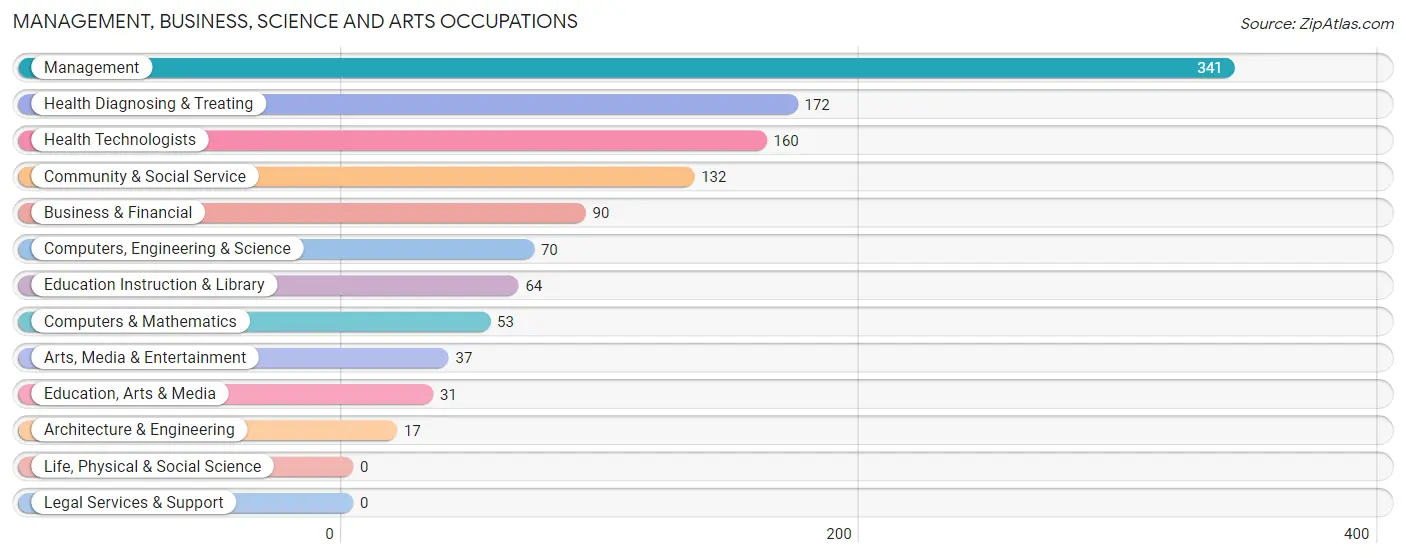
Management, Business, Science and Arts Occupations
The most common Management, Business, Science and Arts occupations in St Paul are Management (341 | 21.4%), Health Diagnosing & Treating (172 | 10.8%), Health Technologists (160 | 10.0%), Community & Social Service (132 | 8.3%), and Business & Financial (90 | 5.6%).
Management, Business, Science and Arts Occupations by Sex
Within the Management, Business, Science and Arts occupations in St Paul, the most male-oriented occupations are Architecture & Engineering (100.0%), Education, Arts & Media (100.0%), and Computers, Engineering & Science (65.7%), while the most female-oriented occupations are Health Diagnosing & Treating (96.5%), Health Technologists (96.3%), and Education Instruction & Library (87.5%).
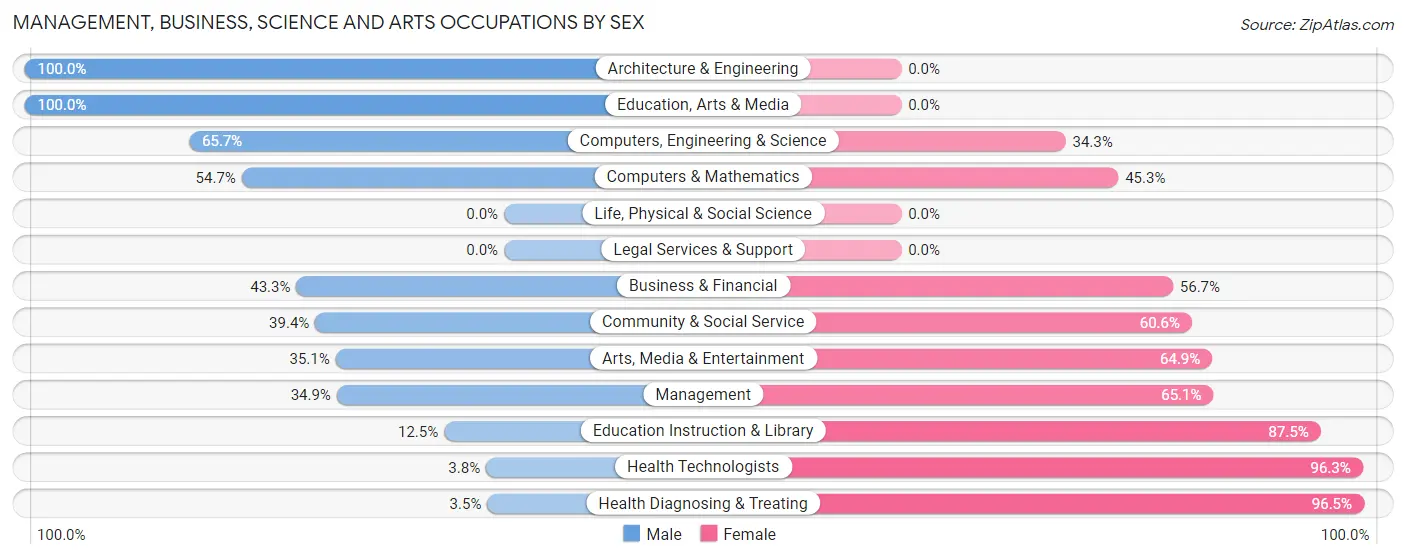
| Occupation | Male | Female |
| Management | 119 (34.9%) | 222 (65.1%) |
| Business & Financial | 39 (43.3%) | 51 (56.7%) |
| Computers, Engineering & Science | 46 (65.7%) | 24 (34.3%) |
| Computers & Mathematics | 29 (54.7%) | 24 (45.3%) |
| Architecture & Engineering | 17 (100.0%) | 0 (0.0%) |
| Life, Physical & Social Science | 0 (0.0%) | 0 (0.0%) |
| Community & Social Service | 52 (39.4%) | 80 (60.6%) |
| Education, Arts & Media | 31 (100.0%) | 0 (0.0%) |
| Legal Services & Support | 0 (0.0%) | 0 (0.0%) |
| Education Instruction & Library | 8 (12.5%) | 56 (87.5%) |
| Arts, Media & Entertainment | 13 (35.1%) | 24 (64.9%) |
| Health Diagnosing & Treating | 6 (3.5%) | 166 (96.5%) |
| Health Technologists | 6 (3.7%) | 154 (96.3%) |
| Total (Category) | 262 (32.6%) | 543 (67.4%) |
| Total (Overall) | 761 (47.7%) | 835 (52.3%) |
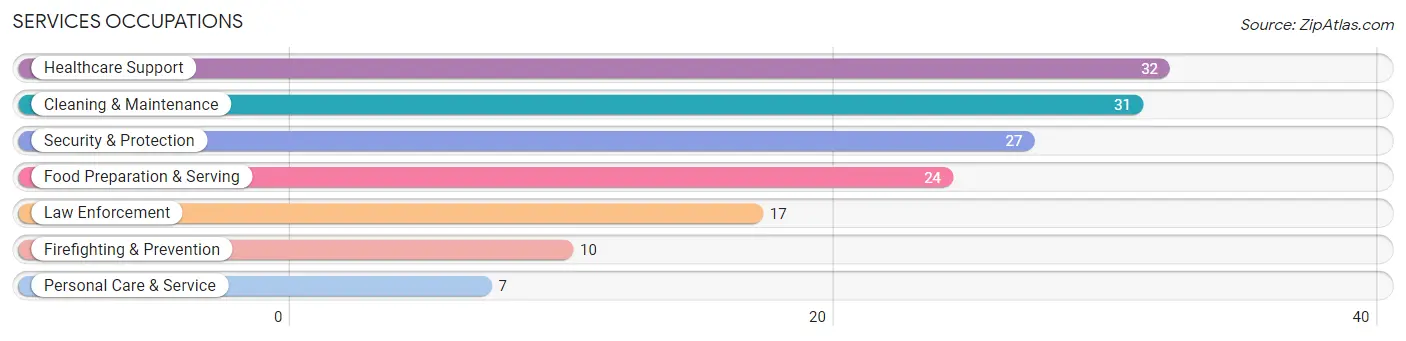
Services Occupations
The most common Services occupations in St Paul are Healthcare Support (32 | 2.0%), Cleaning & Maintenance (31 | 1.9%), Security & Protection (27 | 1.7%), Food Preparation & Serving (24 | 1.5%), and Law Enforcement (17 | 1.1%).
Services Occupations by Sex
Within the Services occupations in St Paul, the most male-oriented occupations are Law Enforcement (70.6%), Cleaning & Maintenance (67.7%), and Security & Protection (59.3%), while the most female-oriented occupations are Healthcare Support (100.0%), Food Preparation & Serving (100.0%), and Personal Care & Service (100.0%).
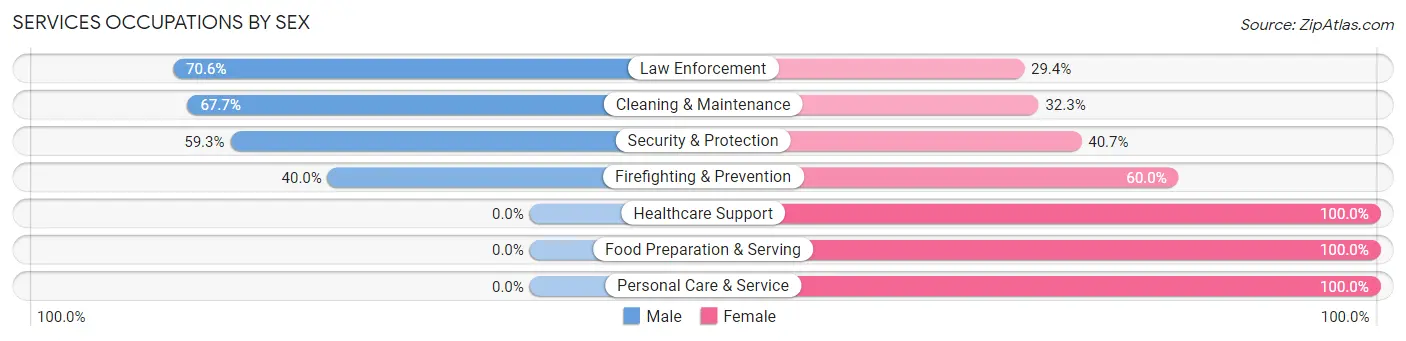
| Occupation | Male | Female |
| Healthcare Support | 0 (0.0%) | 32 (100.0%) |
| Security & Protection | 16 (59.3%) | 11 (40.7%) |
| Firefighting & Prevention | 4 (40.0%) | 6 (60.0%) |
| Law Enforcement | 12 (70.6%) | 5 (29.4%) |
| Food Preparation & Serving | 0 (0.0%) | 24 (100.0%) |
| Cleaning & Maintenance | 21 (67.7%) | 10 (32.3%) |
| Personal Care & Service | 0 (0.0%) | 7 (100.0%) |
| Total (Category) | 37 (30.6%) | 84 (69.4%) |
| Total (Overall) | 761 (47.7%) | 835 (52.3%) |
Sales and Office Occupations
The most common Sales and Office occupations in St Paul are Sales & Related (157 | 9.8%), and Office & Administration (146 | 9.1%).
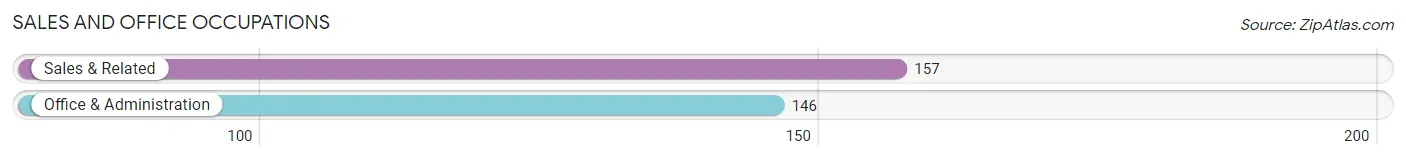
Sales and Office Occupations by Sex
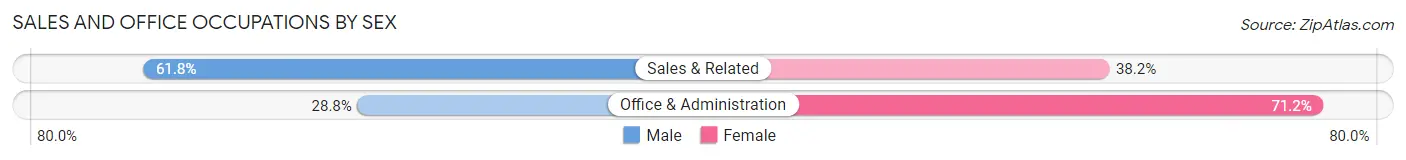
| Occupation | Male | Female |
| Sales & Related | 97 (61.8%) | 60 (38.2%) |
| Office & Administration | 42 (28.8%) | 104 (71.2%) |
| Total (Category) | 139 (45.9%) | 164 (54.1%) |
| Total (Overall) | 761 (47.7%) | 835 (52.3%) |
Natural Resources, Construction and Maintenance Occupations
The most common Natural Resources, Construction and Maintenance occupations in St Paul are Construction & Extraction (182 | 11.4%), and Installation, Maintenance & Repair (64 | 4.0%).
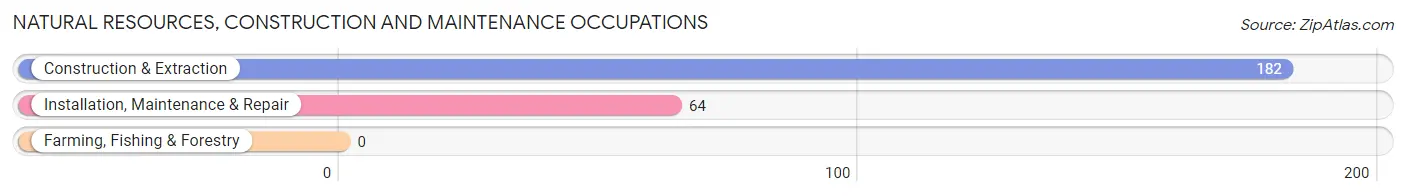
Natural Resources, Construction and Maintenance Occupations by Sex
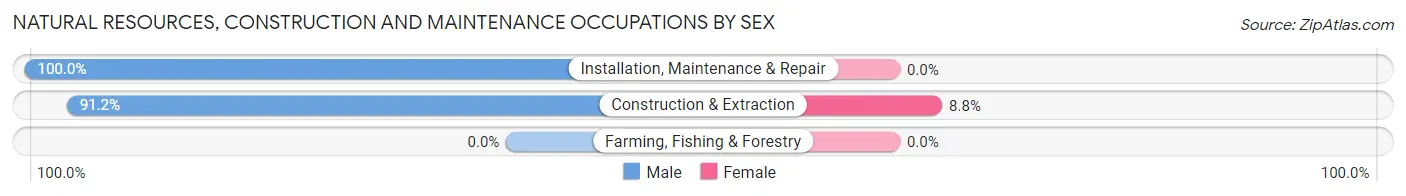
| Occupation | Male | Female |
| Farming, Fishing & Forestry | 0 (0.0%) | 0 (0.0%) |
| Construction & Extraction | 166 (91.2%) | 16 (8.8%) |
| Installation, Maintenance & Repair | 64 (100.0%) | 0 (0.0%) |
| Total (Category) | 230 (93.5%) | 16 (6.5%) |
| Total (Overall) | 761 (47.7%) | 835 (52.3%) |
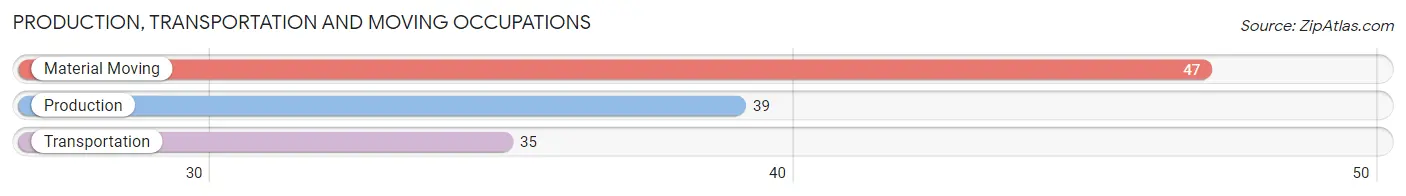
Production, Transportation and Moving Occupations
The most common Production, Transportation and Moving occupations in St Paul are Material Moving (47 | 2.9%), Production (39 | 2.4%), and Transportation (35 | 2.2%).
Production, Transportation and Moving Occupations by Sex
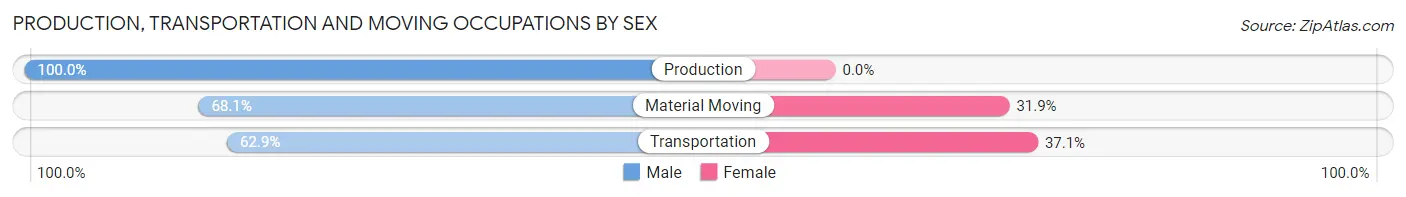
| Occupation | Male | Female |
| Production | 39 (100.0%) | 0 (0.0%) |
| Transportation | 22 (62.9%) | 13 (37.1%) |
| Material Moving | 32 (68.1%) | 15 (31.9%) |
| Total (Category) | 93 (76.9%) | 28 (23.1%) |
| Total (Overall) | 761 (47.7%) | 835 (52.3%) |
Employment Industries by Sex in St Paul
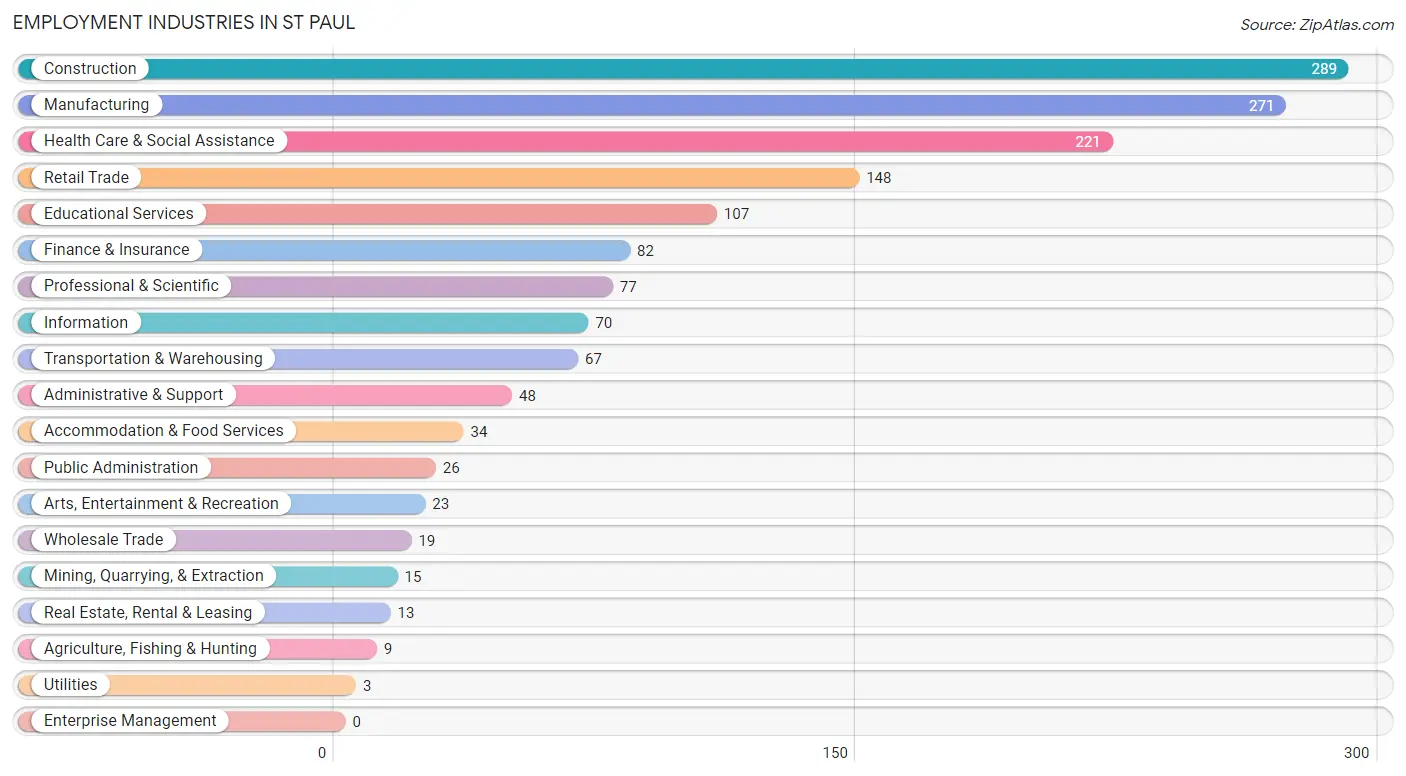
Employment Industries in St Paul
The major employment industries in St Paul include Construction (289 | 18.1%), Manufacturing (271 | 17.0%), Health Care & Social Assistance (221 | 13.9%), Retail Trade (148 | 9.3%), and Educational Services (107 | 6.7%).
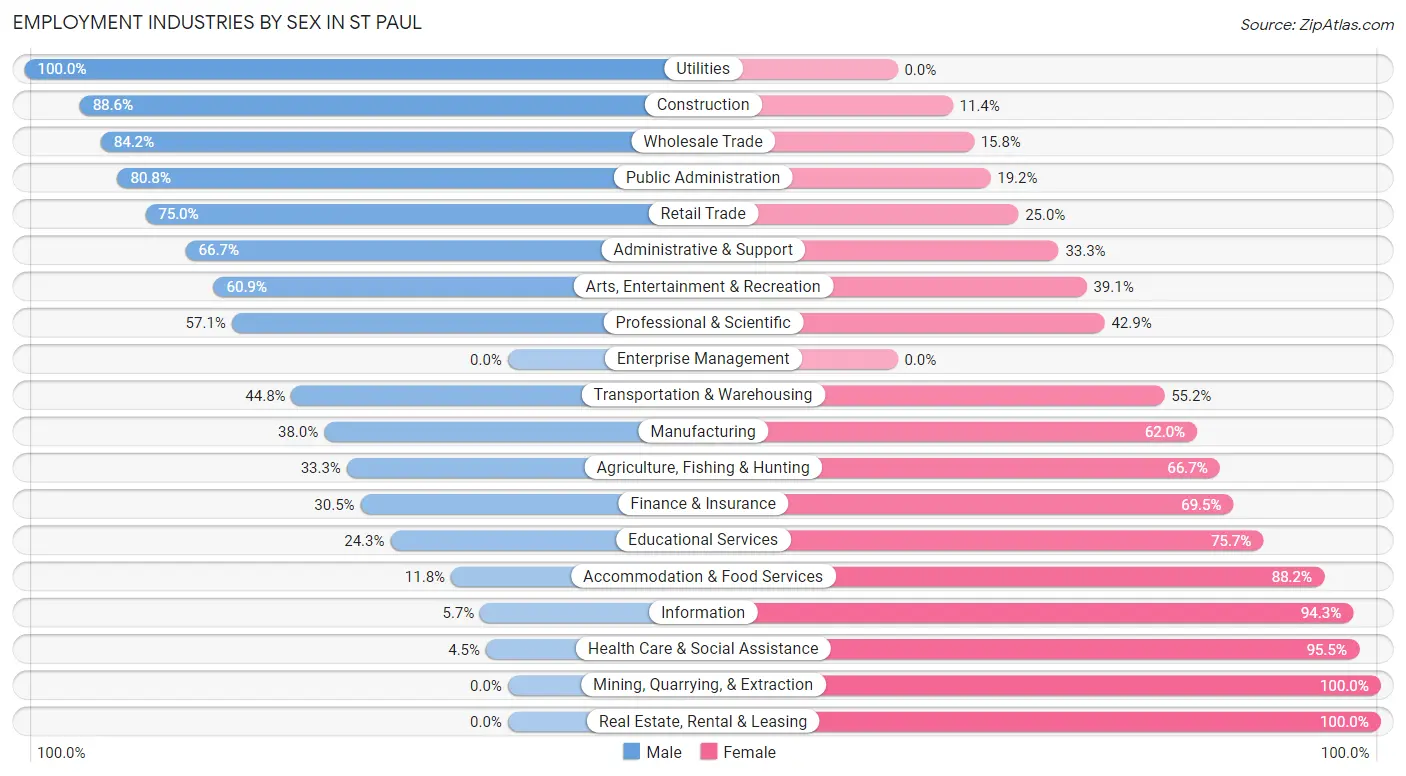
Employment Industries by Sex in St Paul
The St Paul industries that see more men than women are Utilities (100.0%), Construction (88.6%), and Wholesale Trade (84.2%), whereas the industries that tend to have a higher number of women are Mining, Quarrying, & Extraction (100.0%), Real Estate, Rental & Leasing (100.0%), and Health Care & Social Assistance (95.5%).
| Industry | Male | Female |
| Agriculture, Fishing & Hunting | 3 (33.3%) | 6 (66.7%) |
| Mining, Quarrying, & Extraction | 0 (0.0%) | 15 (100.0%) |
| Construction | 256 (88.6%) | 33 (11.4%) |
| Manufacturing | 103 (38.0%) | 168 (62.0%) |
| Wholesale Trade | 16 (84.2%) | 3 (15.8%) |
| Retail Trade | 111 (75.0%) | 37 (25.0%) |
| Transportation & Warehousing | 30 (44.8%) | 37 (55.2%) |
| Utilities | 3 (100.0%) | 0 (0.0%) |
| Information | 4 (5.7%) | 66 (94.3%) |
| Finance & Insurance | 25 (30.5%) | 57 (69.5%) |
| Real Estate, Rental & Leasing | 0 (0.0%) | 13 (100.0%) |
| Professional & Scientific | 44 (57.1%) | 33 (42.9%) |
| Enterprise Management | 0 (0.0%) | 0 (0.0%) |
| Administrative & Support | 32 (66.7%) | 16 (33.3%) |
| Educational Services | 26 (24.3%) | 81 (75.7%) |
| Health Care & Social Assistance | 10 (4.5%) | 211 (95.5%) |
| Arts, Entertainment & Recreation | 14 (60.9%) | 9 (39.1%) |
| Accommodation & Food Services | 4 (11.8%) | 30 (88.2%) |
| Public Administration | 21 (80.8%) | 5 (19.2%) |
| Total | 761 (47.7%) | 835 (52.3%) |
Education in St Paul
School Enrollment in St Paul
The most common levels of schooling among the 661 students in St Paul are college / undergraduate (279 | 42.2%), middle school (104 | 15.7%), and high school (85 | 12.9%).
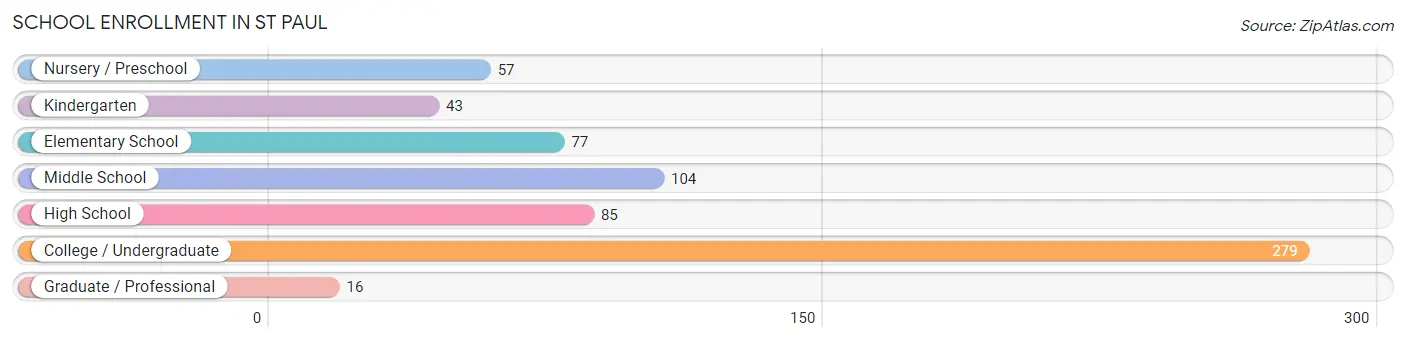
| School Level | # Students | % Students |
| Nursery / Preschool | 57 | 8.6% |
| Kindergarten | 43 | 6.5% |
| Elementary School | 77 | 11.7% |
| Middle School | 104 | 15.7% |
| High School | 85 | 12.9% |
| College / Undergraduate | 279 | 42.2% |
| Graduate / Professional | 16 | 2.4% |
| Total | 661 | 100.0% |
School Enrollment by Age by Funding Source in St Paul
Out of a total of 661 students who are enrolled in schools in St Paul, 186 (28.1%) attend a private institution, while the remaining 475 (71.9%) are enrolled in public schools. The age group of 3 to 4 year olds has the highest likelihood of being enrolled in private schools, with 53 (93.0% in the age bracket) enrolled. Conversely, the age group of 20 to 24 year olds has the lowest likelihood of being enrolled in a private school, with 48 (100.0% in the age bracket) attending a public institution.
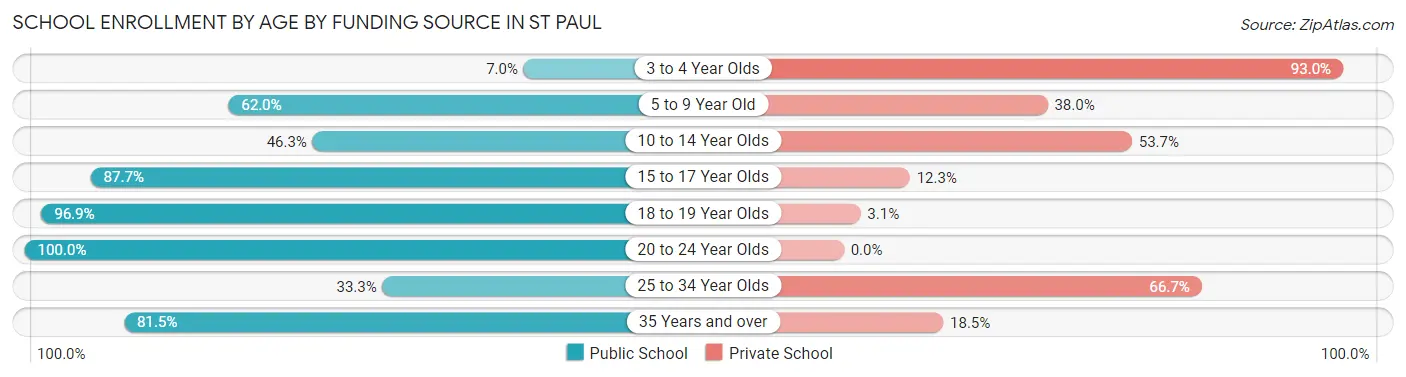
| Age Bracket | Public School | Private School |
| 3 to 4 Year Olds | 4 (7.0%) | 53 (93.0%) |
| 5 to 9 Year Old | 67 (62.0%) | 41 (38.0%) |
| 10 to 14 Year Olds | 57 (46.3%) | 66 (53.7%) |
| 15 to 17 Year Olds | 57 (87.7%) | 8 (12.3%) |
| 18 to 19 Year Olds | 217 (96.9%) | 7 (3.1%) |
| 20 to 24 Year Olds | 48 (100.0%) | 0 (0.0%) |
| 25 to 34 Year Olds | 3 (33.3%) | 6 (66.7%) |
| 35 Years and over | 22 (81.5%) | 5 (18.5%) |
| Total | 475 (71.9%) | 186 (28.1%) |
Educational Attainment by Field of Study in St Paul
Business (355 | 35.5%), science & technology (179 | 17.9%), education (107 | 10.7%), engineering (69 | 6.9%), and visual & performing arts (47 | 4.7%) are the most common fields of study among 1,000 individuals in St Paul who have obtained a bachelor's degree or higher.
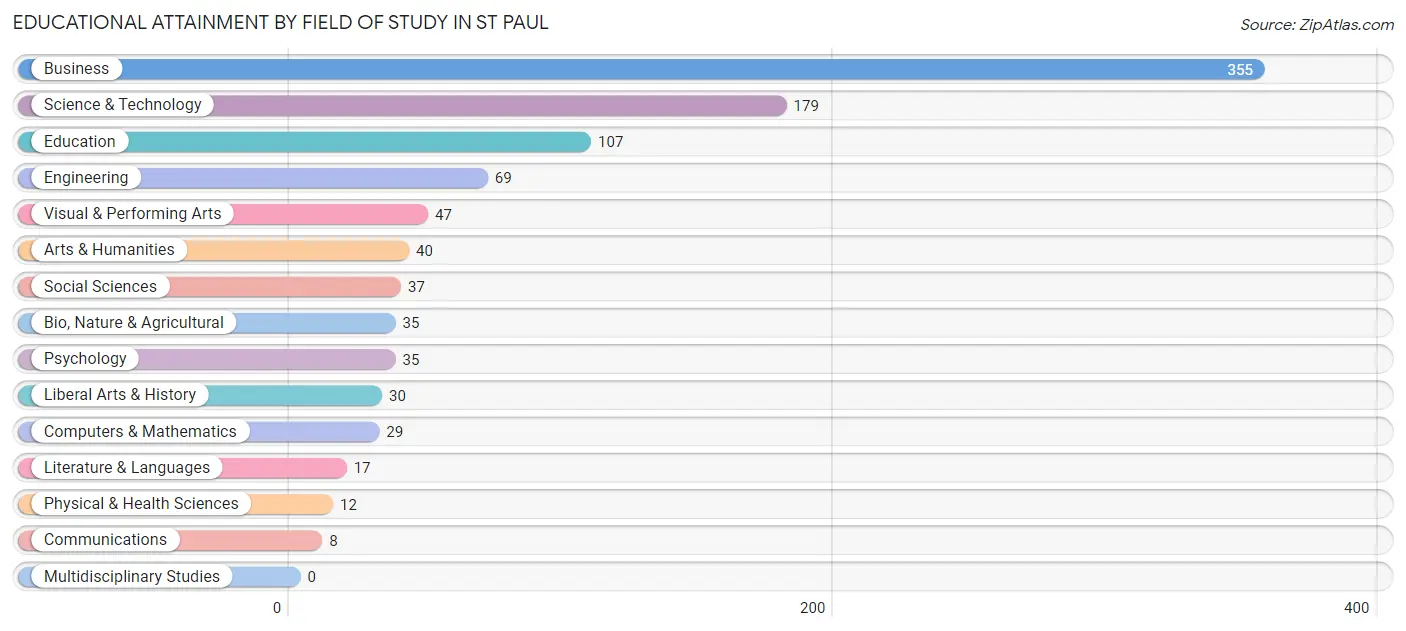
| Field of Study | # Graduates | % Graduates |
| Computers & Mathematics | 29 | 2.9% |
| Bio, Nature & Agricultural | 35 | 3.5% |
| Physical & Health Sciences | 12 | 1.2% |
| Psychology | 35 | 3.5% |
| Social Sciences | 37 | 3.7% |
| Engineering | 69 | 6.9% |
| Multidisciplinary Studies | 0 | 0.0% |
| Science & Technology | 179 | 17.9% |
| Business | 355 | 35.5% |
| Education | 107 | 10.7% |
| Literature & Languages | 17 | 1.7% |
| Liberal Arts & History | 30 | 3.0% |
| Visual & Performing Arts | 47 | 4.7% |
| Communications | 8 | 0.8% |
| Arts & Humanities | 40 | 4.0% |
| Total | 1,000 | 100.0% |
Transportation & Commute in St Paul
Vehicle Availability by Sex in St Paul
The most prevalent vehicle ownership categories in St Paul are males with 2 vehicles (325, accounting for 42.6%) and females with 2 vehicles (335, making up 39.1%).
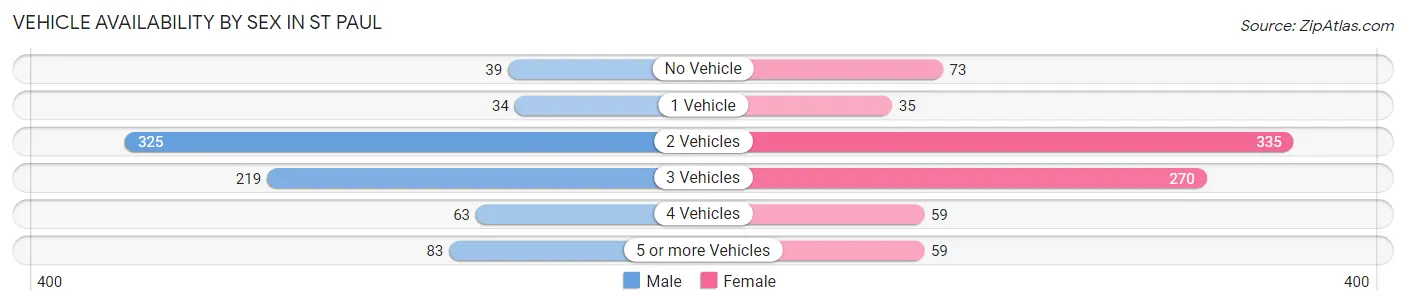
| Vehicles Available | Male | Female |
| No Vehicle | 39 (5.1%) | 73 (8.8%) |
| 1 Vehicle | 34 (4.5%) | 35 (4.2%) |
| 2 Vehicles | 325 (42.6%) | 335 (40.3%) |
| 3 Vehicles | 219 (28.7%) | 270 (32.5%) |
| 4 Vehicles | 63 (8.3%) | 59 (7.1%) |
| 5 or more Vehicles | 83 (10.9%) | 59 (7.1%) |
| Total | 763 (100.0%) | 831 (100.0%) |
Commute Time in St Paul
The most frequently occuring commute durations in St Paul are 30 to 34 minutes (232 commuters, 16.4%), 15 to 19 minutes (193 commuters, 13.7%), and 45 to 59 minutes (186 commuters, 13.2%).
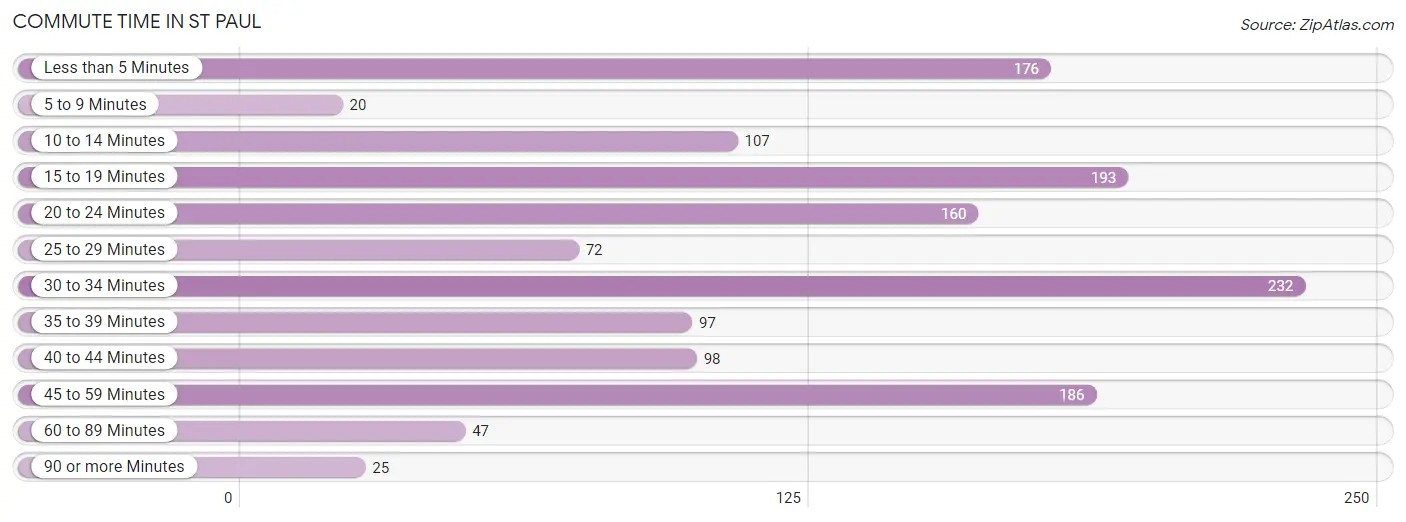
| Commute Time | # Commuters | % Commuters |
| Less than 5 Minutes | 176 | 12.5% |
| 5 to 9 Minutes | 20 | 1.4% |
| 10 to 14 Minutes | 107 | 7.6% |
| 15 to 19 Minutes | 193 | 13.7% |
| 20 to 24 Minutes | 160 | 11.3% |
| 25 to 29 Minutes | 72 | 5.1% |
| 30 to 34 Minutes | 232 | 16.4% |
| 35 to 39 Minutes | 97 | 6.9% |
| 40 to 44 Minutes | 98 | 6.9% |
| 45 to 59 Minutes | 186 | 13.2% |
| 60 to 89 Minutes | 47 | 3.3% |
| 90 or more Minutes | 25 | 1.8% |
Commute Time by Sex in St Paul
The most common commute times in St Paul are 30 to 34 minutes (122 commuters, 17.3%) for males and less than 5 minutes (149 commuters, 21.1%) for females.
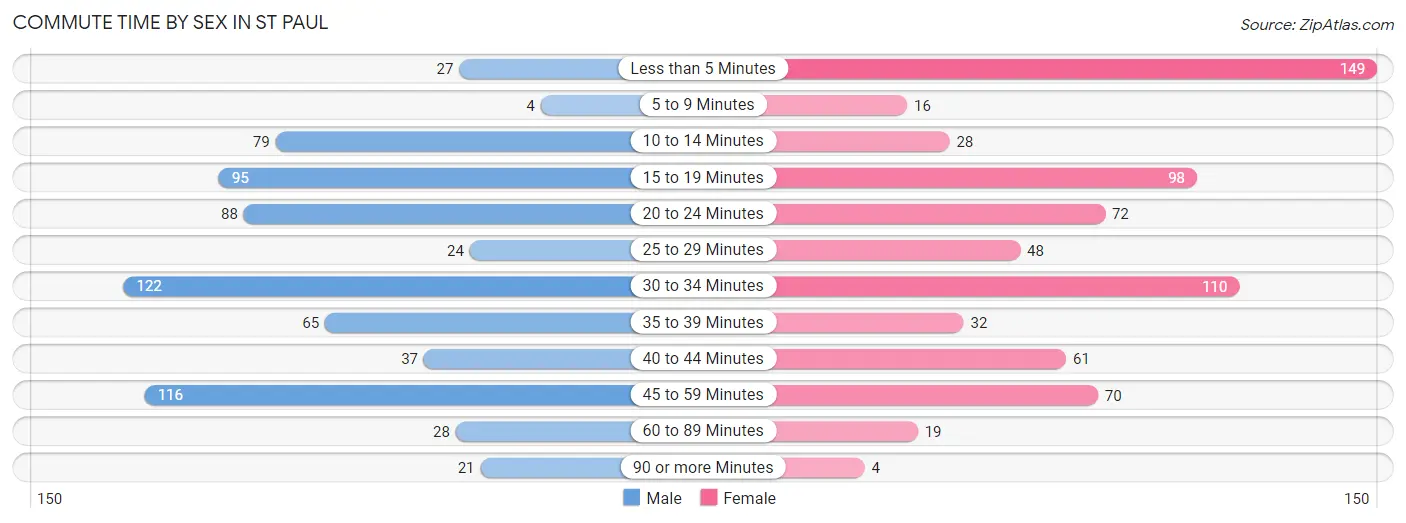
| Commute Time | Male | Female |
| Less than 5 Minutes | 27 (3.8%) | 149 (21.1%) |
| 5 to 9 Minutes | 4 (0.6%) | 16 (2.3%) |
| 10 to 14 Minutes | 79 (11.2%) | 28 (4.0%) |
| 15 to 19 Minutes | 95 (13.5%) | 98 (13.9%) |
| 20 to 24 Minutes | 88 (12.5%) | 72 (10.2%) |
| 25 to 29 Minutes | 24 (3.4%) | 48 (6.8%) |
| 30 to 34 Minutes | 122 (17.3%) | 110 (15.6%) |
| 35 to 39 Minutes | 65 (9.2%) | 32 (4.5%) |
| 40 to 44 Minutes | 37 (5.2%) | 61 (8.6%) |
| 45 to 59 Minutes | 116 (16.4%) | 70 (9.9%) |
| 60 to 89 Minutes | 28 (4.0%) | 19 (2.7%) |
| 90 or more Minutes | 21 (3.0%) | 4 (0.6%) |
Time of Departure to Work by Sex in St Paul
The most frequent times of departure to work in St Paul are 6:30 AM to 6:59 AM (128, 18.1%) for males and 5:30 AM to 5:59 AM (124, 17.5%) for females.
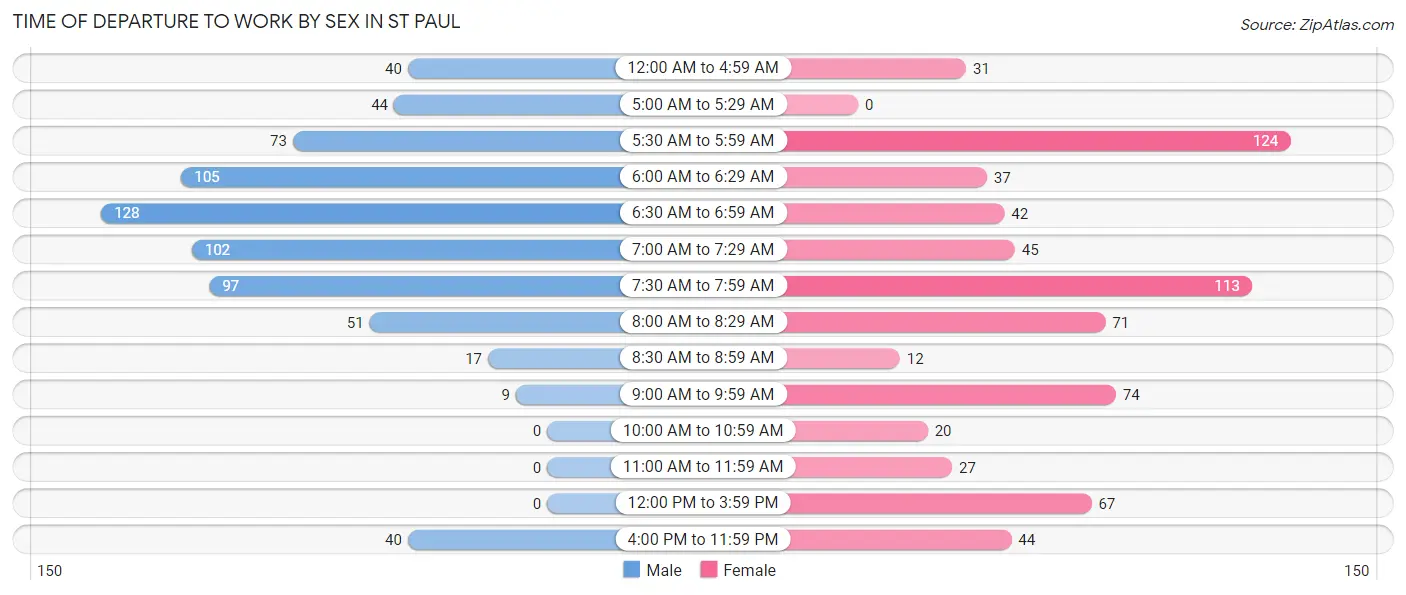
| Time of Departure | Male | Female |
| 12:00 AM to 4:59 AM | 40 (5.7%) | 31 (4.4%) |
| 5:00 AM to 5:29 AM | 44 (6.2%) | 0 (0.0%) |
| 5:30 AM to 5:59 AM | 73 (10.3%) | 124 (17.5%) |
| 6:00 AM to 6:29 AM | 105 (14.9%) | 37 (5.2%) |
| 6:30 AM to 6:59 AM | 128 (18.1%) | 42 (5.9%) |
| 7:00 AM to 7:29 AM | 102 (14.4%) | 45 (6.4%) |
| 7:30 AM to 7:59 AM | 97 (13.7%) | 113 (16.0%) |
| 8:00 AM to 8:29 AM | 51 (7.2%) | 71 (10.0%) |
| 8:30 AM to 8:59 AM | 17 (2.4%) | 12 (1.7%) |
| 9:00 AM to 9:59 AM | 9 (1.3%) | 74 (10.5%) |
| 10:00 AM to 10:59 AM | 0 (0.0%) | 20 (2.8%) |
| 11:00 AM to 11:59 AM | 0 (0.0%) | 27 (3.8%) |
| 12:00 PM to 3:59 PM | 0 (0.0%) | 67 (9.5%) |
| 4:00 PM to 11:59 PM | 40 (5.7%) | 44 (6.2%) |
| Total | 706 (100.0%) | 707 (100.0%) |
Housing Occupancy in St Paul
Occupancy by Ownership in St Paul
Of the total 1,129 dwellings in St Paul, owner-occupied units account for 1,077 (95.4%), while renter-occupied units make up 52 (4.6%).
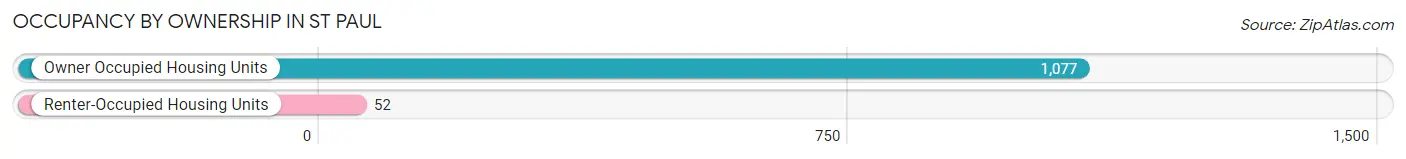
| Occupancy | # Housing Units | % Housing Units |
| Owner Occupied Housing Units | 1,077 | 95.4% |
| Renter-Occupied Housing Units | 52 | 4.6% |
| Total Occupied Housing Units | 1,129 | 100.0% |
Occupancy by Household Size in St Paul
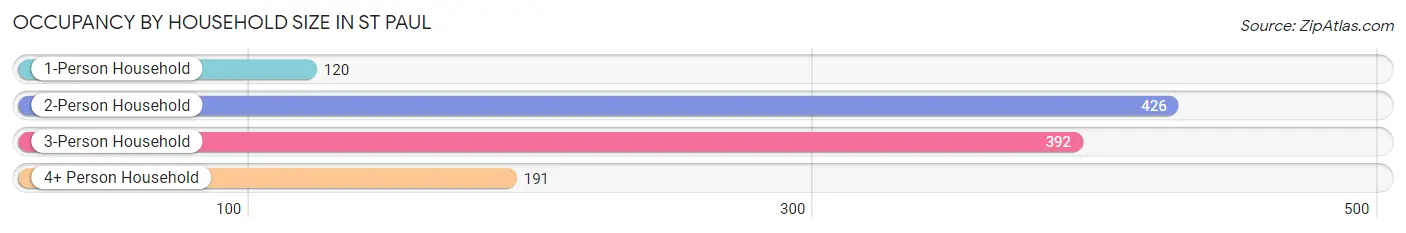
| Household Size | # Housing Units | % Housing Units |
| 1-Person Household | 120 | 10.6% |
| 2-Person Household | 426 | 37.7% |
| 3-Person Household | 392 | 34.7% |
| 4+ Person Household | 191 | 16.9% |
| Total Housing Units | 1,129 | 100.0% |
Occupancy by Ownership by Household Size in St Paul
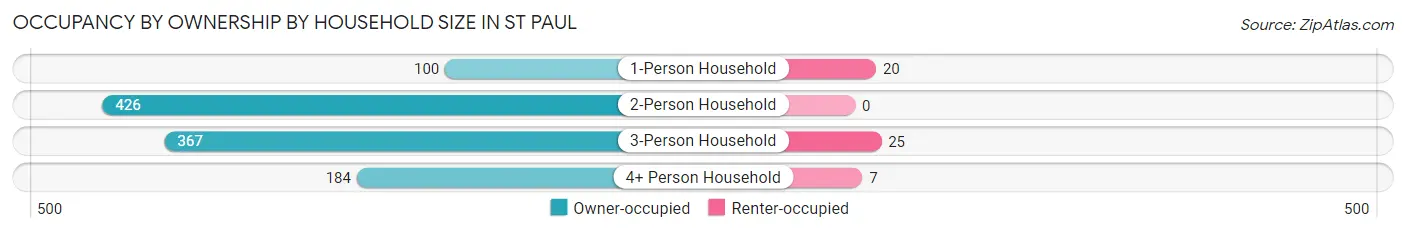
| Household Size | Owner-occupied | Renter-occupied |
| 1-Person Household | 100 (83.3%) | 20 (16.7%) |
| 2-Person Household | 426 (100.0%) | 0 (0.0%) |
| 3-Person Household | 367 (93.6%) | 25 (6.4%) |
| 4+ Person Household | 184 (96.3%) | 7 (3.7%) |
| Total Housing Units | 1,077 (95.4%) | 52 (4.6%) |
Occupancy by Educational Attainment in St Paul
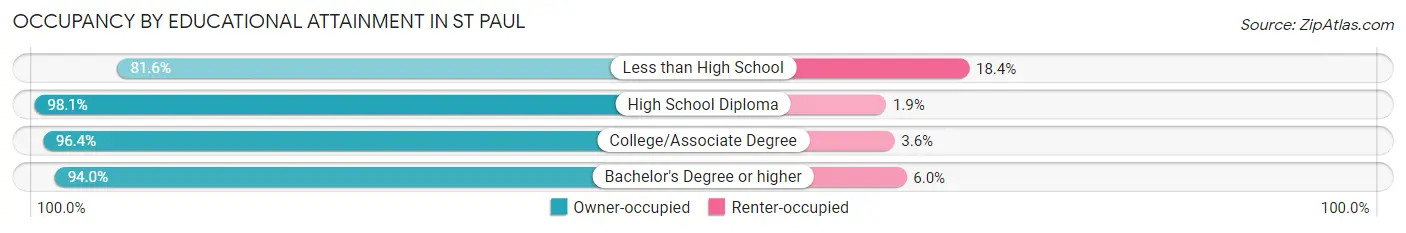
| Household Size | Owner-occupied | Renter-occupied |
| Less than High School | 31 (81.6%) | 7 (18.4%) |
| High School Diploma | 253 (98.1%) | 5 (1.9%) |
| College/Associate Degree | 400 (96.4%) | 15 (3.6%) |
| Bachelor's Degree or higher | 393 (94.0%) | 25 (6.0%) |
Occupancy by Age of Householder in St Paul
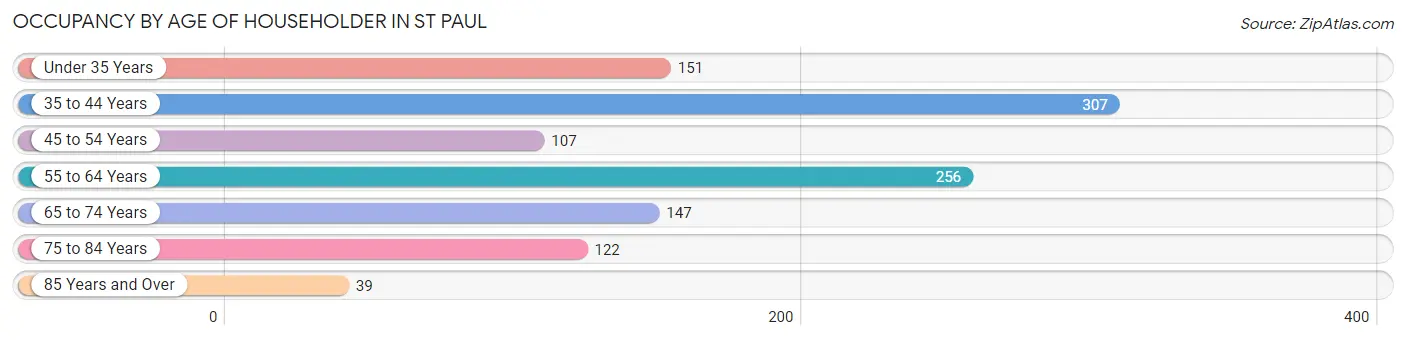
| Age Bracket | # Households | % Households |
| Under 35 Years | 151 | 13.4% |
| 35 to 44 Years | 307 | 27.2% |
| 45 to 54 Years | 107 | 9.5% |
| 55 to 64 Years | 256 | 22.7% |
| 65 to 74 Years | 147 | 13.0% |
| 75 to 84 Years | 122 | 10.8% |
| 85 Years and Over | 39 | 3.5% |
| Total | 1,129 | 100.0% |
Housing Finances in St Paul
Median Income by Occupancy in St Paul
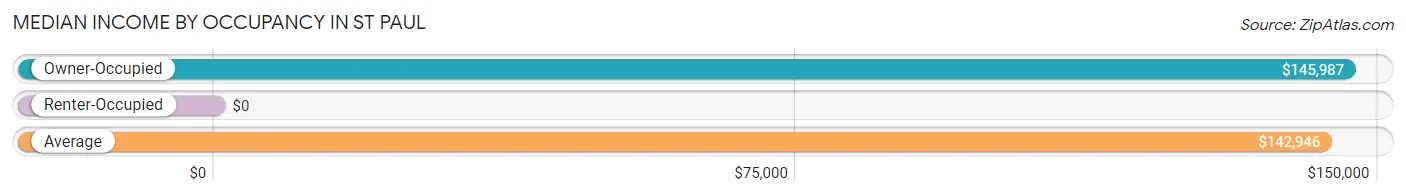
| Occupancy Type | # Households | Median Income |
| Owner-Occupied | 1,077 (95.4%) | $145,987 |
| Renter-Occupied | 52 (4.6%) | $0 |
| Average | 1,129 (100.0%) | $142,946 |
Occupancy by Householder Income Bracket in St Paul
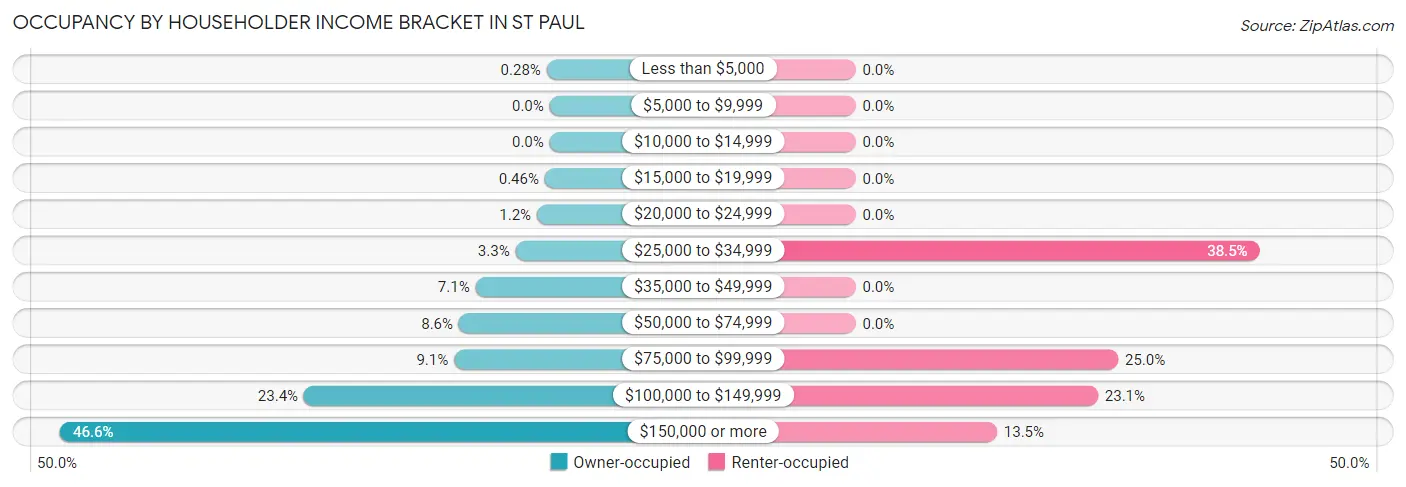
| Income Bracket | Owner-occupied | Renter-occupied |
| Less than $5,000 | 3 (0.3%) | 0 (0.0%) |
| $5,000 to $9,999 | 0 (0.0%) | 0 (0.0%) |
| $10,000 to $14,999 | 0 (0.0%) | 0 (0.0%) |
| $15,000 to $19,999 | 5 (0.5%) | 0 (0.0%) |
| $20,000 to $24,999 | 13 (1.2%) | 0 (0.0%) |
| $25,000 to $34,999 | 35 (3.3%) | 20 (38.5%) |
| $35,000 to $49,999 | 76 (7.1%) | 0 (0.0%) |
| $50,000 to $74,999 | 93 (8.6%) | 0 (0.0%) |
| $75,000 to $99,999 | 98 (9.1%) | 13 (25.0%) |
| $100,000 to $149,999 | 252 (23.4%) | 12 (23.1%) |
| $150,000 or more | 502 (46.6%) | 7 (13.5%) |
| Total | 1,077 (100.0%) | 52 (100.0%) |
Monthly Housing Cost Tiers in St Paul
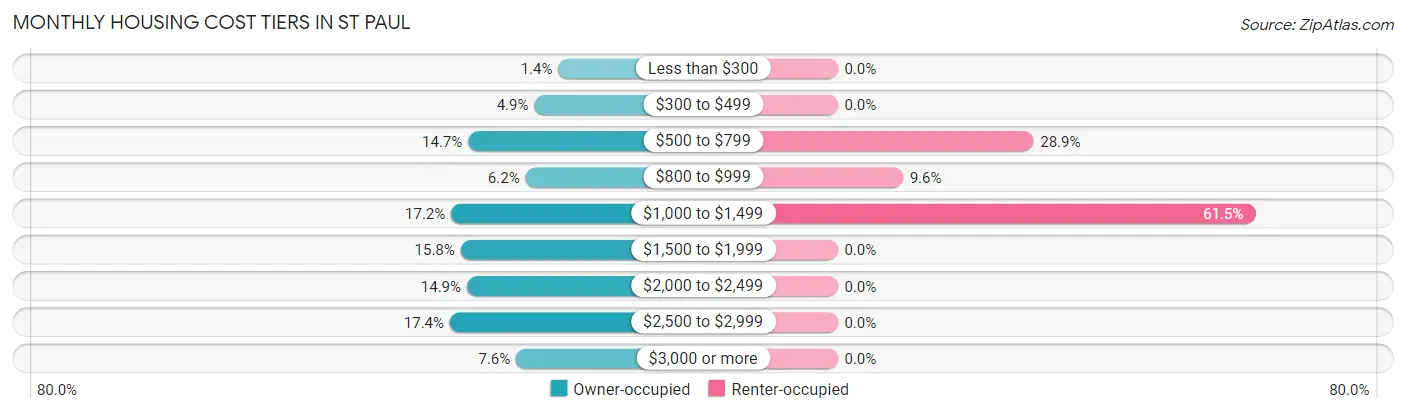
| Monthly Cost | Owner-occupied | Renter-occupied |
| Less than $300 | 15 (1.4%) | 0 (0.0%) |
| $300 to $499 | 53 (4.9%) | 0 (0.0%) |
| $500 to $799 | 158 (14.7%) | 15 (28.8%) |
| $800 to $999 | 67 (6.2%) | 5 (9.6%) |
| $1,000 to $1,499 | 185 (17.2%) | 32 (61.5%) |
| $1,500 to $1,999 | 170 (15.8%) | 0 (0.0%) |
| $2,000 to $2,499 | 160 (14.9%) | 0 (0.0%) |
| $2,500 to $2,999 | 187 (17.4%) | 0 (0.0%) |
| $3,000 or more | 82 (7.6%) | 0 (0.0%) |
| Total | 1,077 (100.0%) | 52 (100.0%) |
Physical Housing Characteristics in St Paul
Housing Structures in St Paul
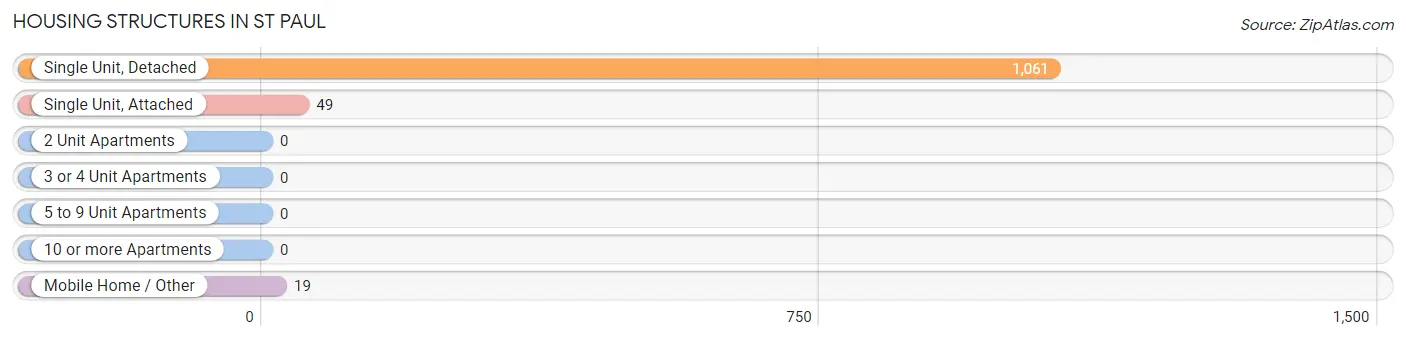
| Structure Type | # Housing Units | % Housing Units |
| Single Unit, Detached | 1,061 | 94.0% |
| Single Unit, Attached | 49 | 4.3% |
| 2 Unit Apartments | 0 | 0.0% |
| 3 or 4 Unit Apartments | 0 | 0.0% |
| 5 to 9 Unit Apartments | 0 | 0.0% |
| 10 or more Apartments | 0 | 0.0% |
| Mobile Home / Other | 19 | 1.7% |
| Total | 1,129 | 100.0% |
Housing Structures by Occupancy in St Paul
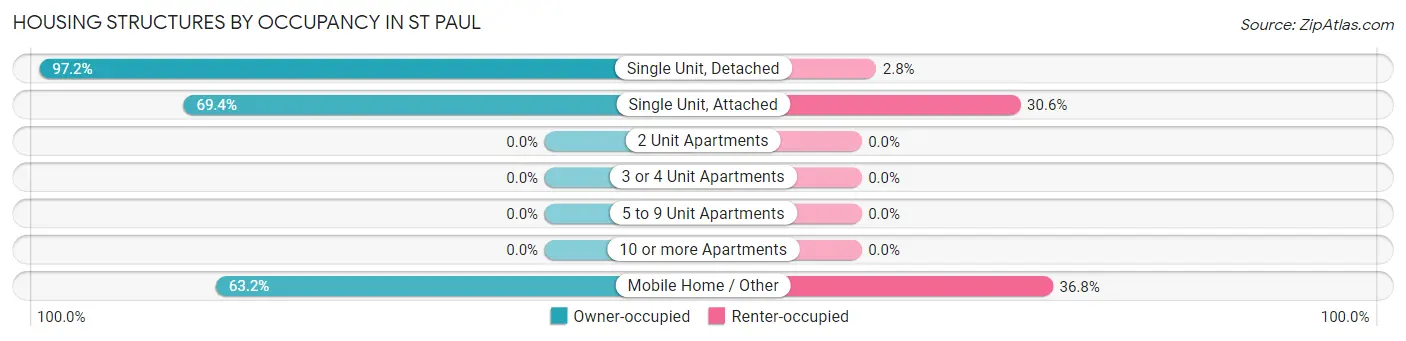
| Structure Type | Owner-occupied | Renter-occupied |
| Single Unit, Detached | 1,031 (97.2%) | 30 (2.8%) |
| Single Unit, Attached | 34 (69.4%) | 15 (30.6%) |
| 2 Unit Apartments | 0 (0.0%) | 0 (0.0%) |
| 3 or 4 Unit Apartments | 0 (0.0%) | 0 (0.0%) |
| 5 to 9 Unit Apartments | 0 (0.0%) | 0 (0.0%) |
| 10 or more Apartments | 0 (0.0%) | 0 (0.0%) |
| Mobile Home / Other | 12 (63.2%) | 7 (36.8%) |
| Total | 1,077 (95.4%) | 52 (4.6%) |
Housing Structures by Number of Rooms in St Paul
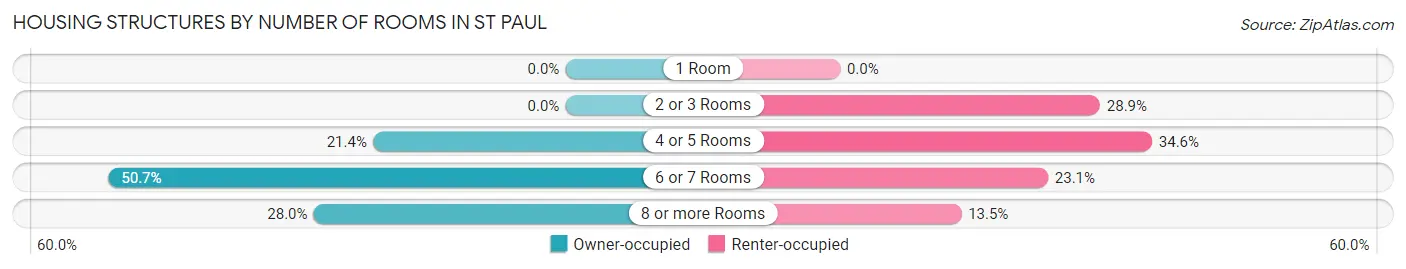
| Number of Rooms | Owner-occupied | Renter-occupied |
| 1 Room | 0 (0.0%) | 0 (0.0%) |
| 2 or 3 Rooms | 0 (0.0%) | 15 (28.8%) |
| 4 or 5 Rooms | 230 (21.4%) | 18 (34.6%) |
| 6 or 7 Rooms | 546 (50.7%) | 12 (23.1%) |
| 8 or more Rooms | 301 (28.0%) | 7 (13.5%) |
| Total | 1,077 (100.0%) | 52 (100.0%) |
Housing Structure by Heating Type in St Paul
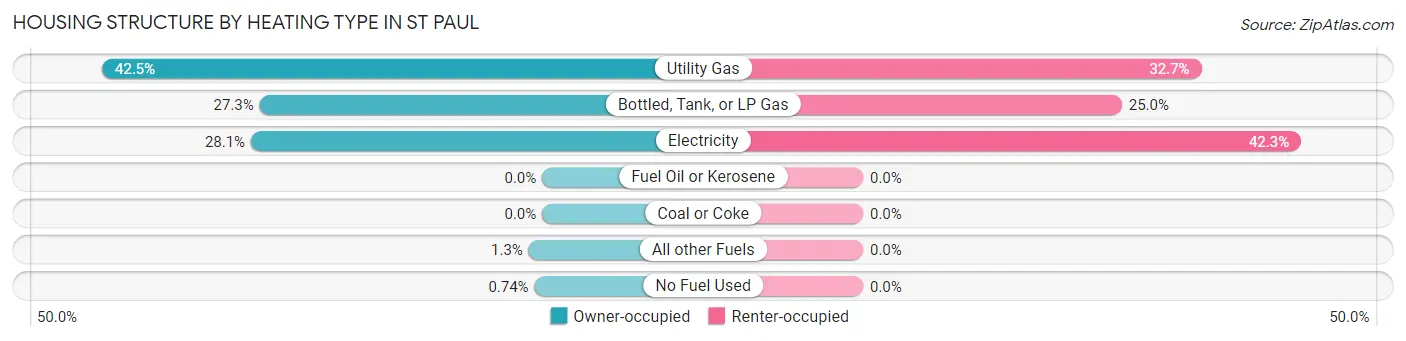
| Heating Type | Owner-occupied | Renter-occupied |
| Utility Gas | 458 (42.5%) | 17 (32.7%) |
| Bottled, Tank, or LP Gas | 294 (27.3%) | 13 (25.0%) |
| Electricity | 303 (28.1%) | 22 (42.3%) |
| Fuel Oil or Kerosene | 0 (0.0%) | 0 (0.0%) |
| Coal or Coke | 0 (0.0%) | 0 (0.0%) |
| All other Fuels | 14 (1.3%) | 0 (0.0%) |
| No Fuel Used | 8 (0.7%) | 0 (0.0%) |
| Total | 1,077 (100.0%) | 52 (100.0%) |
Household Vehicle Usage in St Paul
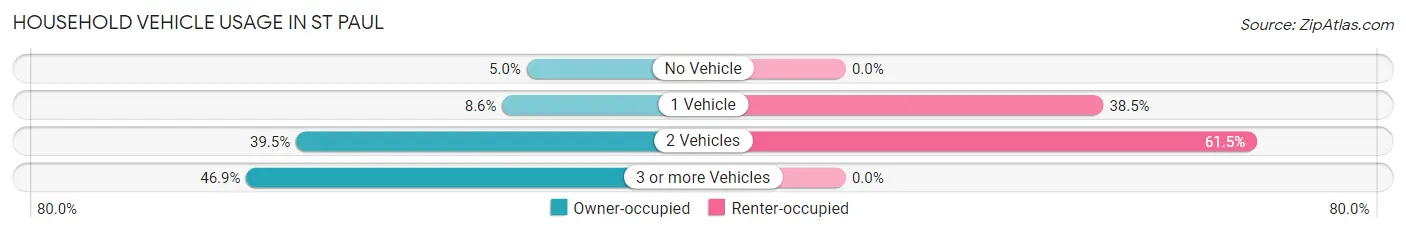
| Vehicles per Household | Owner-occupied | Renter-occupied |
| No Vehicle | 54 (5.0%) | 0 (0.0%) |
| 1 Vehicle | 93 (8.6%) | 20 (38.5%) |
| 2 Vehicles | 425 (39.5%) | 32 (61.5%) |
| 3 or more Vehicles | 505 (46.9%) | 0 (0.0%) |
| Total | 1,077 (100.0%) | 52 (100.0%) |
Real Estate & Mortgages in St Paul
Real Estate and Mortgage Overview in St Paul
| Characteristic | Without Mortgage | With Mortgage |
| Housing Units | 361 | 716 |
| Median Property Value | $376,200 | $392,900 |
| Median Household Income | $96,023 | $390 |
| Monthly Housing Costs | $756 | $78 |
| Real Estate Taxes | $4,211 | $0 |
Property Value by Mortgage Status in St Paul
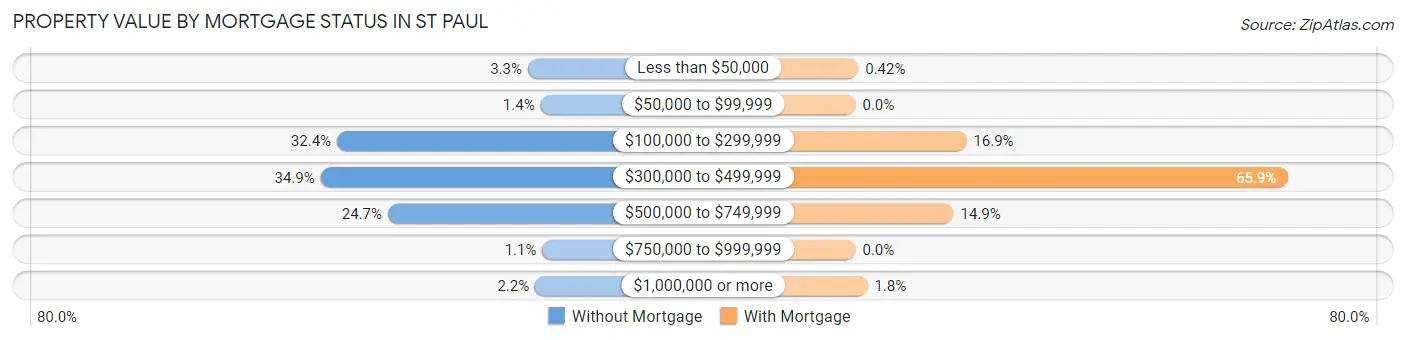
| Property Value | Without Mortgage | With Mortgage |
| Less than $50,000 | 12 (3.3%) | 3 (0.4%) |
| $50,000 to $99,999 | 5 (1.4%) | 0 (0.0%) |
| $100,000 to $299,999 | 117 (32.4%) | 121 (16.9%) |
| $300,000 to $499,999 | 126 (34.9%) | 472 (65.9%) |
| $500,000 to $749,999 | 89 (24.6%) | 107 (14.9%) |
| $750,000 to $999,999 | 4 (1.1%) | 0 (0.0%) |
| $1,000,000 or more | 8 (2.2%) | 13 (1.8%) |
| Total | 361 (100.0%) | 716 (100.0%) |
Household Income by Mortgage Status in St Paul
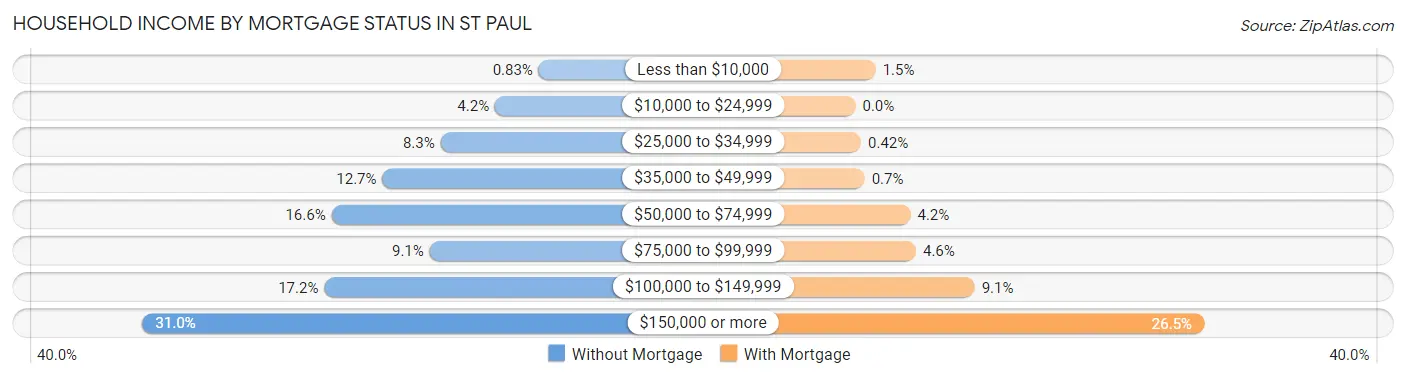
| Household Income | Without Mortgage | With Mortgage |
| Less than $10,000 | 3 (0.8%) | 11 (1.5%) |
| $10,000 to $24,999 | 15 (4.2%) | 0 (0.0%) |
| $25,000 to $34,999 | 30 (8.3%) | 3 (0.4%) |
| $35,000 to $49,999 | 46 (12.7%) | 5 (0.7%) |
| $50,000 to $74,999 | 60 (16.6%) | 30 (4.2%) |
| $75,000 to $99,999 | 33 (9.1%) | 33 (4.6%) |
| $100,000 to $149,999 | 62 (17.2%) | 65 (9.1%) |
| $150,000 or more | 112 (31.0%) | 190 (26.5%) |
| Total | 361 (100.0%) | 716 (100.0%) |
Property Value to Household Income Ratio in St Paul
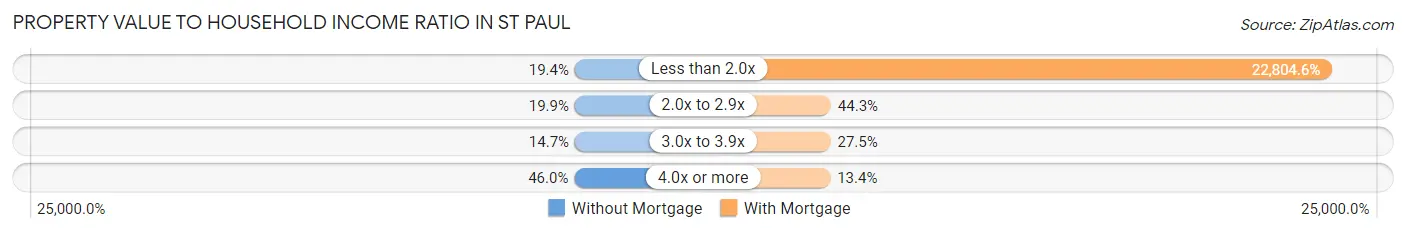
| Value-to-Income Ratio | Without Mortgage | With Mortgage |
| Less than 2.0x | 70 (19.4%) | 163,281 (22,804.6%) |
| 2.0x to 2.9x | 72 (19.9%) | 317 (44.3%) |
| 3.0x to 3.9x | 53 (14.7%) | 197 (27.5%) |
| 4.0x or more | 166 (46.0%) | 96 (13.4%) |
| Total | 361 (100.0%) | 716 (100.0%) |
Real Estate Taxes by Mortgage Status in St Paul
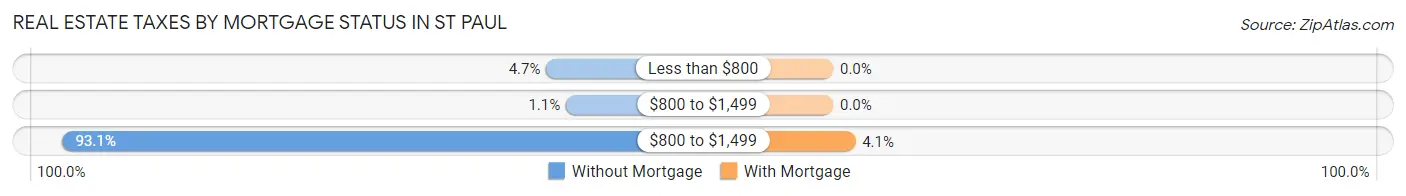
| Property Taxes | Without Mortgage | With Mortgage |
| Less than $800 | 17 (4.7%) | 0 (0.0%) |
| $800 to $1,499 | 4 (1.1%) | 0 (0.0%) |
| $800 to $1,499 | 336 (93.1%) | 29 (4.1%) |
| Total | 361 (100.0%) | 716 (100.0%) |
Health & Disability in St Paul
Health Insurance Coverage by Age in St Paul
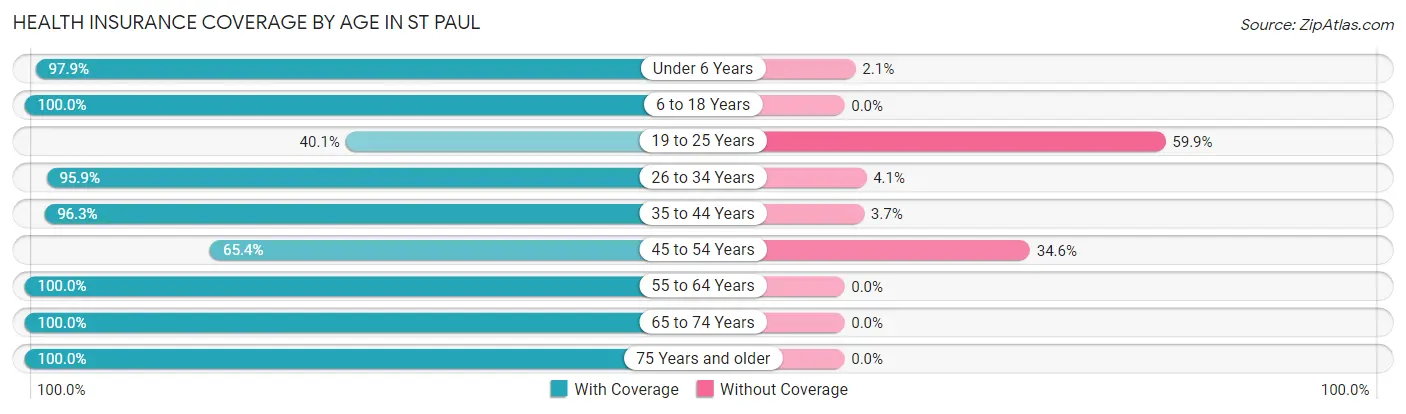
| Age Bracket | With Coverage | Without Coverage |
| Under 6 Years | 236 (97.9%) | 5 (2.1%) |
| 6 to 18 Years | 325 (100.0%) | 0 (0.0%) |
| 19 to 25 Years | 124 (40.1%) | 185 (59.9%) |
| 26 to 34 Years | 305 (95.9%) | 13 (4.1%) |
| 35 to 44 Years | 474 (96.3%) | 18 (3.7%) |
| 45 to 54 Years | 225 (65.4%) | 119 (34.6%) |
| 55 to 64 Years | 624 (100.0%) | 0 (0.0%) |
| 65 to 74 Years | 248 (100.0%) | 0 (0.0%) |
| 75 Years and older | 240 (100.0%) | 0 (0.0%) |
| Total | 2,801 (89.2%) | 340 (10.8%) |
Health Insurance Coverage by Citizenship Status in St Paul
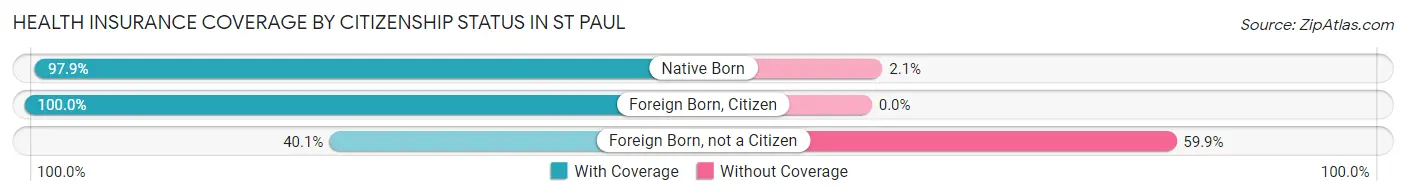
| Citizenship Status | With Coverage | Without Coverage |
| Native Born | 236 (97.9%) | 5 (2.1%) |
| Foreign Born, Citizen | 325 (100.0%) | 0 (0.0%) |
| Foreign Born, not a Citizen | 124 (40.1%) | 185 (59.9%) |
Health Insurance Coverage by Household Income in St Paul
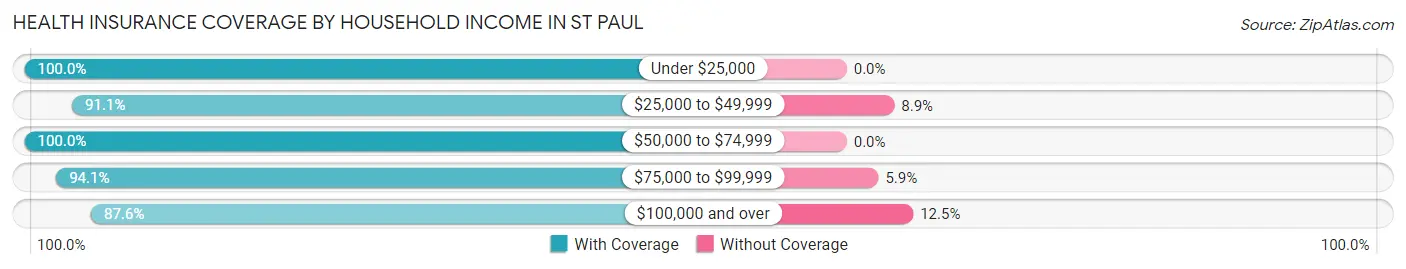
| Household Income | With Coverage | Without Coverage |
| Under $25,000 | 29 (100.0%) | 0 (0.0%) |
| $25,000 to $49,999 | 184 (91.1%) | 18 (8.9%) |
| $50,000 to $74,999 | 183 (100.0%) | 0 (0.0%) |
| $75,000 to $99,999 | 254 (94.1%) | 16 (5.9%) |
| $100,000 and over | 2,151 (87.5%) | 306 (12.4%) |
Public vs Private Health Insurance Coverage by Age in St Paul
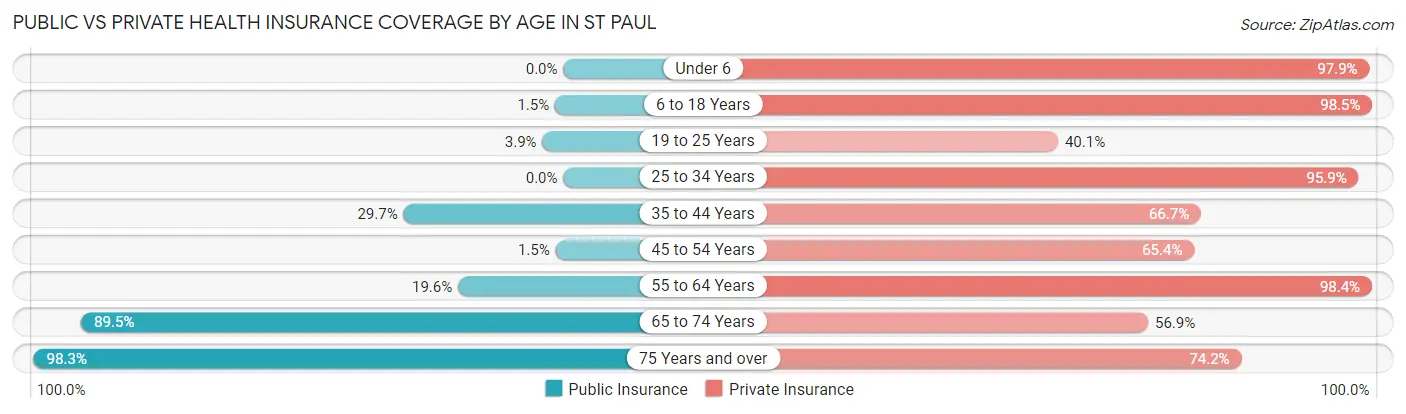
| Age Bracket | Public Insurance | Private Insurance |
| Under 6 | 0 (0.0%) | 236 (97.9%) |
| 6 to 18 Years | 5 (1.5%) | 320 (98.5%) |
| 19 to 25 Years | 12 (3.9%) | 124 (40.1%) |
| 25 to 34 Years | 0 (0.0%) | 305 (95.9%) |
| 35 to 44 Years | 146 (29.7%) | 328 (66.7%) |
| 45 to 54 Years | 5 (1.5%) | 225 (65.4%) |
| 55 to 64 Years | 122 (19.6%) | 614 (98.4%) |
| 65 to 74 Years | 222 (89.5%) | 141 (56.9%) |
| 75 Years and over | 236 (98.3%) | 178 (74.2%) |
| Total | 748 (23.8%) | 2,471 (78.7%) |
Disability Status by Sex by Age in St Paul
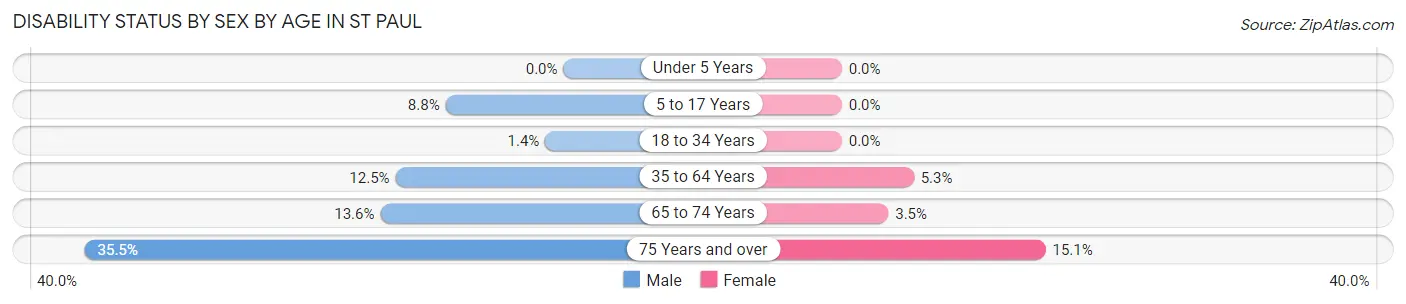
| Age Bracket | Male | Female |
| Under 5 Years | 0 (0.0%) | 0 (0.0%) |
| 5 to 17 Years | 14 (8.7%) | 0 (0.0%) |
| 18 to 34 Years | 6 (1.3%) | 0 (0.0%) |
| 35 to 64 Years | 98 (12.5%) | 36 (5.3%) |
| 65 to 74 Years | 14 (13.6%) | 5 (3.5%) |
| 75 Years and over | 43 (35.5%) | 18 (15.1%) |
Disability Class by Sex by Age in St Paul
Disability Class: Hearing Difficulty
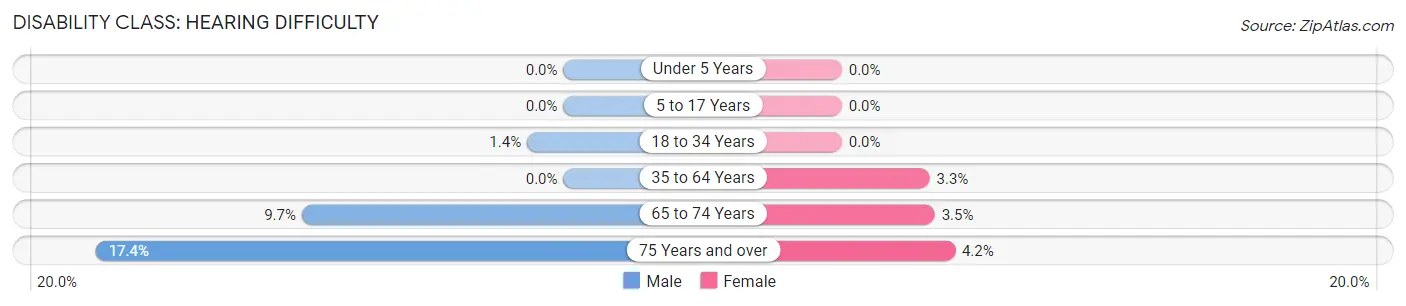
| Age Bracket | Male | Female |
| Under 5 Years | 0 (0.0%) | 0 (0.0%) |
| 5 to 17 Years | 0 (0.0%) | 0 (0.0%) |
| 18 to 34 Years | 6 (1.3%) | 0 (0.0%) |
| 35 to 64 Years | 0 (0.0%) | 22 (3.3%) |
| 65 to 74 Years | 10 (9.7%) | 5 (3.5%) |
| 75 Years and over | 21 (17.4%) | 5 (4.2%) |
Disability Class: Vision Difficulty
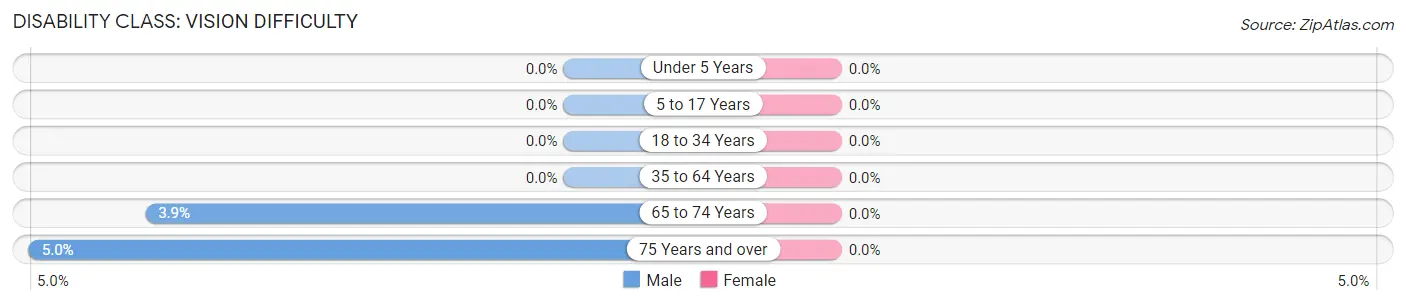
| Age Bracket | Male | Female |
| Under 5 Years | 0 (0.0%) | 0 (0.0%) |
| 5 to 17 Years | 0 (0.0%) | 0 (0.0%) |
| 18 to 34 Years | 0 (0.0%) | 0 (0.0%) |
| 35 to 64 Years | 0 (0.0%) | 0 (0.0%) |
| 65 to 74 Years | 4 (3.9%) | 0 (0.0%) |
| 75 Years and over | 6 (5.0%) | 0 (0.0%) |
Disability Class: Cognitive Difficulty
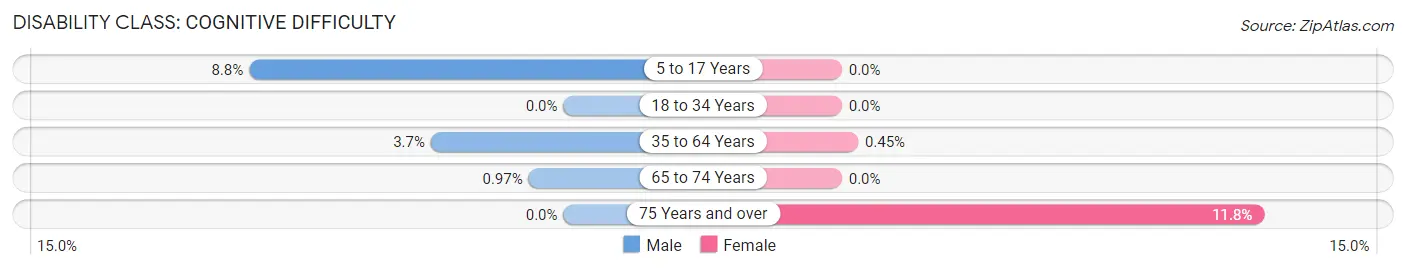
| Age Bracket | Male | Female |
| 5 to 17 Years | 14 (8.7%) | 0 (0.0%) |
| 18 to 34 Years | 0 (0.0%) | 0 (0.0%) |
| 35 to 64 Years | 29 (3.7%) | 3 (0.4%) |
| 65 to 74 Years | 1 (1.0%) | 0 (0.0%) |
| 75 Years and over | 0 (0.0%) | 14 (11.8%) |
Disability Class: Ambulatory Difficulty
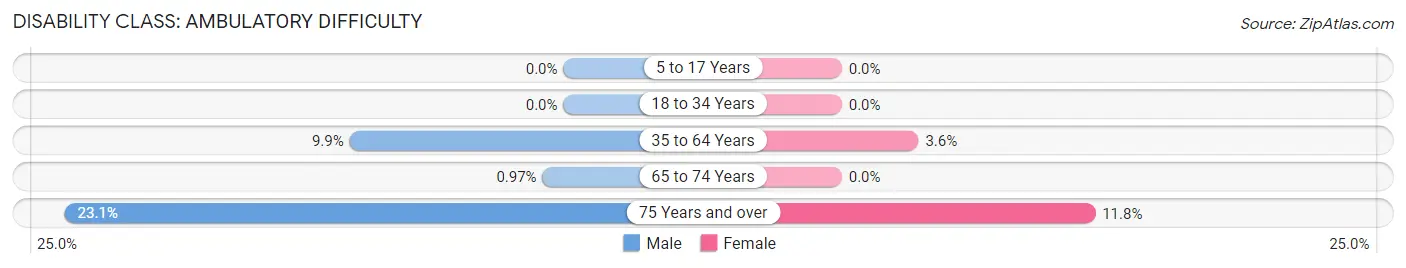
| Age Bracket | Male | Female |
| 5 to 17 Years | 0 (0.0%) | 0 (0.0%) |
| 18 to 34 Years | 0 (0.0%) | 0 (0.0%) |
| 35 to 64 Years | 78 (9.9%) | 24 (3.6%) |
| 65 to 74 Years | 1 (1.0%) | 0 (0.0%) |
| 75 Years and over | 28 (23.1%) | 14 (11.8%) |
Disability Class: Self-Care Difficulty
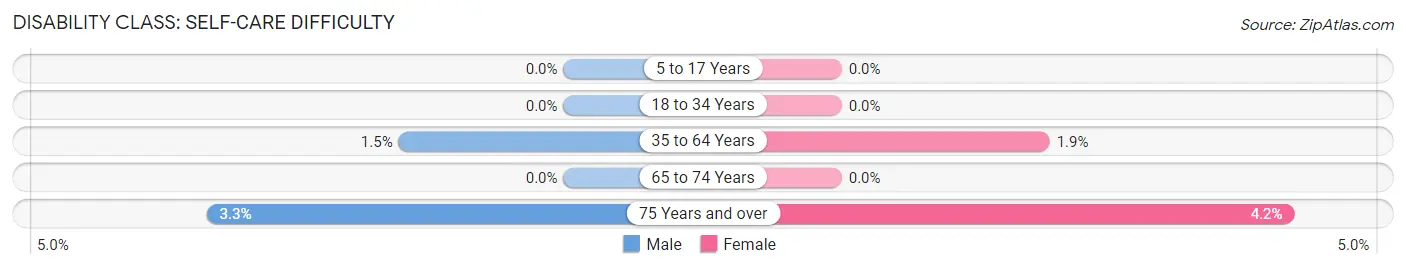
| Age Bracket | Male | Female |
| 5 to 17 Years | 0 (0.0%) | 0 (0.0%) |
| 18 to 34 Years | 0 (0.0%) | 0 (0.0%) |
| 35 to 64 Years | 12 (1.5%) | 13 (1.9%) |
| 65 to 74 Years | 0 (0.0%) | 0 (0.0%) |
| 75 Years and over | 4 (3.3%) | 5 (4.2%) |
Technology Access in St Paul
Computing Device Access in St Paul
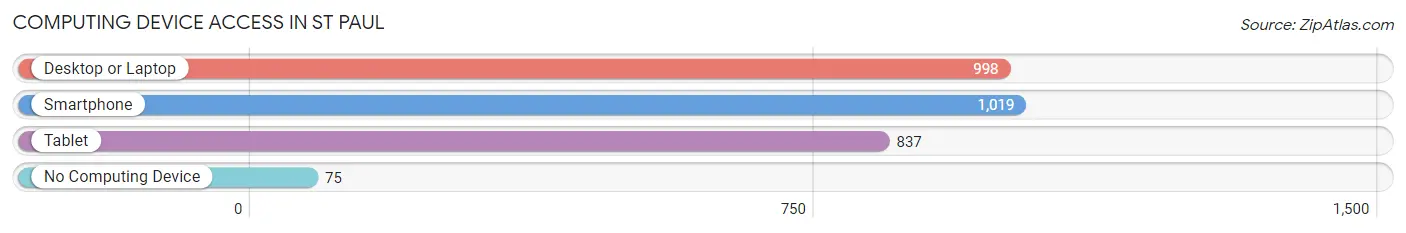
| Device Type | # Households | % Households |
| Desktop or Laptop | 998 | 88.4% |
| Smartphone | 1,019 | 90.3% |
| Tablet | 837 | 74.1% |
| No Computing Device | 75 | 6.6% |
| Total | 1,129 | 100.0% |
Internet Access in St Paul
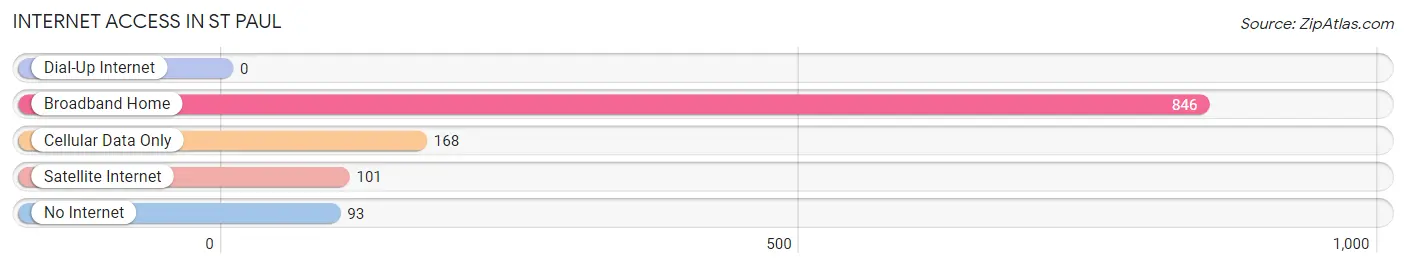
| Internet Type | # Households | % Households |
| Dial-Up Internet | 0 | 0.0% |
| Broadband Home | 846 | 74.9% |
| Cellular Data Only | 168 | 14.9% |
| Satellite Internet | 101 | 8.9% |
| No Internet | 93 | 8.2% |
| Total | 1,129 | 100.0% |
St Paul Summary
St. Paul, Missouri is a small town located in the northeast corner of the state, in the heart of the Ozark Mountains. It is a rural community with a population of just over 1,000 people, and is the county seat of St. Francois County. The town was founded in 1819 and has a rich history of farming, logging, and mining.
Geography
St. Paul is located in the northeast corner of Missouri, in the Ozark Mountains. It is situated in the foothills of the St. Francois Mountains, and is surrounded by rolling hills and forests. The town is located on the banks of the St. Francis River, and is just a few miles from the Mark Twain National Forest. The town is located about an hour and a half from St. Louis, and is close to the cities of Farmington and Park Hills.
The climate in St. Paul is humid subtropical, with hot summers and mild winters. The average temperature in the summer is around 80 degrees Fahrenheit, and the average temperature in the winter is around 40 degrees Fahrenheit. The town receives an average of 45 inches of rain per year, and the average snowfall is around 10 inches.
Economy
The economy of St. Paul is largely based on agriculture and tourism. The town is home to several farms, and the surrounding area is known for its production of corn, soybeans, and hay. The town is also home to several small businesses, including restaurants, shops, and a few manufacturing companies.
Tourism is an important part of the economy in St. Paul. The town is home to several attractions, including the St. Francois County Museum, the St. Francois County Historical Society, and the St. Francois County Fair. The town is also home to several outdoor recreation areas, including the Mark Twain National Forest and the St. Francois State Park.
Demographics
As of the 2010 census, the population of St. Paul was 1,037. The racial makeup of the town was 95.3% White, 1.2% African American, 0.3% Native American, 0.2% Asian, 0.1% Pacific Islander, and 2.9% from other races. The median household income was $35,938, and the median family income was $41,250.
The town is home to several churches, including the First Baptist Church, the First United Methodist Church, and the St. Paul Lutheran Church. The town is also home to several schools, including the St. Francois County R-I School District, the St. Francois County R-II School District, and the St. Francois County R-III School District.
Conclusion
St. Paul, Missouri is a small town located in the northeast corner of the state, in the heart of the Ozark Mountains. It is a rural community with a population of just over 1,000 people, and is the county seat of St. Francois County. The town was founded in 1819 and has a rich history of farming, logging, and mining. The economy of St. Paul is largely based on agriculture and tourism, and the town is home to several attractions, churches, and schools. The population of St. Paul is mostly White, with a small percentage of African American, Native American, Asian, and Pacific Islander residents.
Common Questions
What is Per Capita Income in St Paul?
Per Capita income in St Paul is $56,804.
What is the Median Family Income in St Paul?
Median Family Income in St Paul is $153,571.
What is the Median Household income in St Paul?
Median Household Income in St Paul is $142,946.
What is Income or Wage Gap in St Paul?
Income or Wage Gap in St Paul is 15.4%.
Women in St Paul earn 84.6 cents for every dollar earned by a man.
What is Inequality or Gini Index in St Paul?
Inequality or Gini Index in St Paul is 0.36.
What is the Total Population of St Paul?
Total Population of St Paul is 3,149.
What is the Total Male Population of St Paul?
Total Male Population of St Paul is 1,683.
What is the Total Female Population of St Paul?
Total Female Population of St Paul is 1,466.
What is the Ratio of Males per 100 Females in St Paul?
There are 114.80 Males per 100 Females in St Paul.
What is the Ratio of Females per 100 Males in St Paul?
There are 87.11 Females per 100 Males in St Paul.
What is the Median Population Age in St Paul?
Median Population Age in St Paul is 43.4 Years.
What is the Average Family Size in St Paul
Average Family Size in St Paul is 3.0 People.
What is the Average Household Size in St Paul
Average Household Size in St Paul is 2.8 People.
How Large is the Labor Force in St Paul?
There are 1,613 People in the Labor Forcein in St Paul.
What is the Percentage of People in the Labor Force in St Paul?
61.2% of People are in the Labor Force in St Paul.
What is the Unemployment Rate in St Paul?
Unemployment Rate in St Paul is 0.5%.