Cana, VA Map & Demographics
Cana Map
Cana Overview
$36,062
PER CAPITA INCOME
$95,435
AVG FAMILY INCOME
$69,444
AVG HOUSEHOLD INCOME
22.2%
WAGE / INCOME GAP [ % ]
77.8¢/ $1
WAGE / INCOME GAP [ $ ]
0.36
INEQUALITY / GINI INDEX
1,330
TOTAL POPULATION
715
MALE POPULATION
615
FEMALE POPULATION
116.26
MALES / 100 FEMALES
86.01
FEMALES / 100 MALES
37.9
MEDIAN AGE
3.1
AVG FAMILY SIZE
2.6
AVG HOUSEHOLD SIZE
797
LABOR FORCE [ PEOPLE ]
70.7%
PERCENT IN LABOR FORCE
2.1%
UNEMPLOYMENT RATE
Cana Zip Codes
Cana Area Codes
Income in Cana
Income Overview in Cana
Per Capita Income in Cana is $36,062, while median incomes of families and households are $95,435 and $69,444 respectively.
| Characteristic | Number | Measure |
| Per Capita Income | 1,330 | $36,062 |
| Median Family Income | 378 | $95,435 |
| Mean Family Income | 378 | $96,858 |
| Median Household Income | 512 | $69,444 |
| Mean Household Income | 512 | $82,513 |
| Income Deficit | 378 | $0 |
| Wage / Income Gap (%) | 1,330 | 22.24% |
| Wage / Income Gap ($) | 1,330 | 77.76¢ per $1 |
| Gini / Inequality Index | 1,330 | 0.36 |
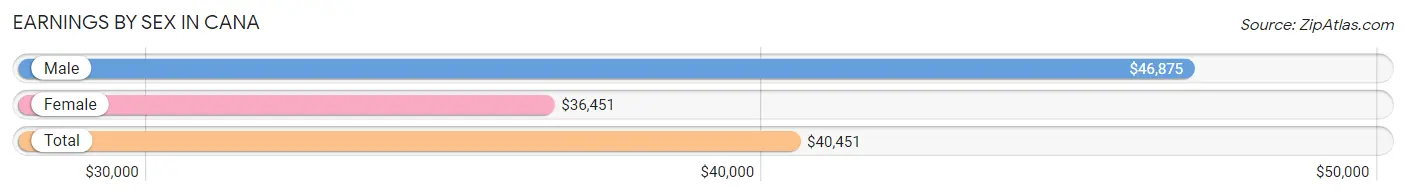
Earnings by Sex in Cana
Average Earnings in Cana are $40,451, $46,875 for men and $36,451 for women, a difference of 22.2%.
| Sex | Number | Average Earnings |
| Male | 447 (53.9%) | $46,875 |
| Female | 382 (46.1%) | $36,451 |
| Total | 829 (100.0%) | $40,451 |
Earnings by Sex by Income Bracket in Cana
The most common earnings brackets in Cana are $100,000+ for men (152 | 34.0%) and $55,000 to $64,999 for women (92 | 24.1%).
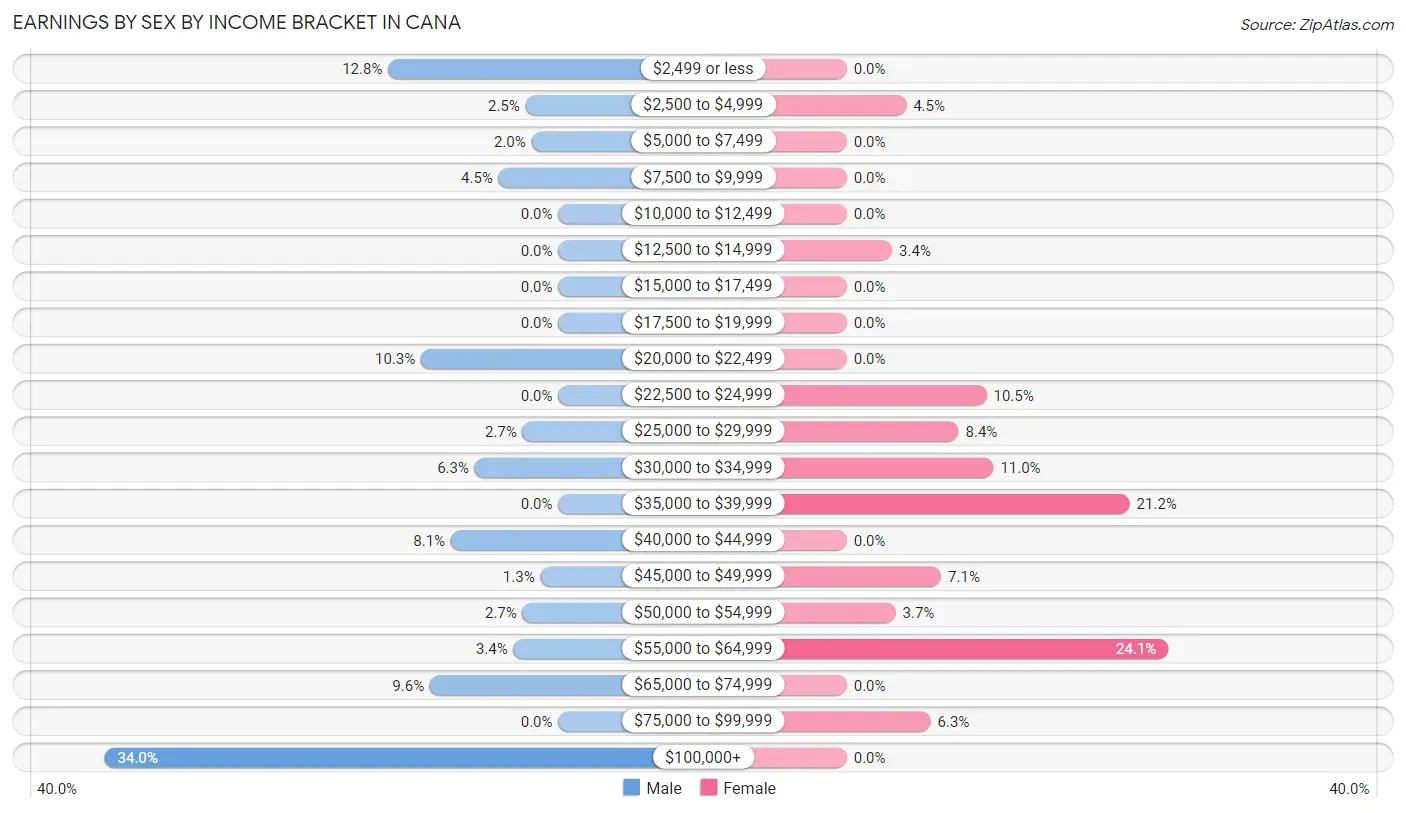
| Income | Male | Female |
| $2,499 or less | 57 (12.8%) | 0 (0.0%) |
| $2,500 to $4,999 | 11 (2.5%) | 17 (4.4%) |
| $5,000 to $7,499 | 9 (2.0%) | 0 (0.0%) |
| $7,500 to $9,999 | 20 (4.5%) | 0 (0.0%) |
| $10,000 to $12,499 | 0 (0.0%) | 0 (0.0%) |
| $12,500 to $14,999 | 0 (0.0%) | 13 (3.4%) |
| $15,000 to $17,499 | 0 (0.0%) | 0 (0.0%) |
| $17,500 to $19,999 | 0 (0.0%) | 0 (0.0%) |
| $20,000 to $22,499 | 46 (10.3%) | 0 (0.0%) |
| $22,500 to $24,999 | 0 (0.0%) | 40 (10.5%) |
| $25,000 to $29,999 | 12 (2.7%) | 32 (8.4%) |
| $30,000 to $34,999 | 28 (6.3%) | 42 (11.0%) |
| $35,000 to $39,999 | 0 (0.0%) | 81 (21.2%) |
| $40,000 to $44,999 | 36 (8.1%) | 0 (0.0%) |
| $45,000 to $49,999 | 6 (1.3%) | 27 (7.1%) |
| $50,000 to $54,999 | 12 (2.7%) | 14 (3.7%) |
| $55,000 to $64,999 | 15 (3.4%) | 92 (24.1%) |
| $65,000 to $74,999 | 43 (9.6%) | 0 (0.0%) |
| $75,000 to $99,999 | 0 (0.0%) | 24 (6.3%) |
| $100,000+ | 152 (34.0%) | 0 (0.0%) |
| Total | 447 (100.0%) | 382 (100.0%) |
Earnings by Sex by Educational Attainment in Cana
Average earnings in Cana are $61,167 for men and $36,451 for women, a difference of 40.4%. Men with an educational attainment of college or associate's degree enjoy the highest average annual earnings of $113,269, while those with high school diploma education earn the least with $30,395. Women with an educational attainment of bachelor's degree earn the most with the average annual earnings of $56,114, while those with college or associate's degree education have the smallest earnings of $34,420.
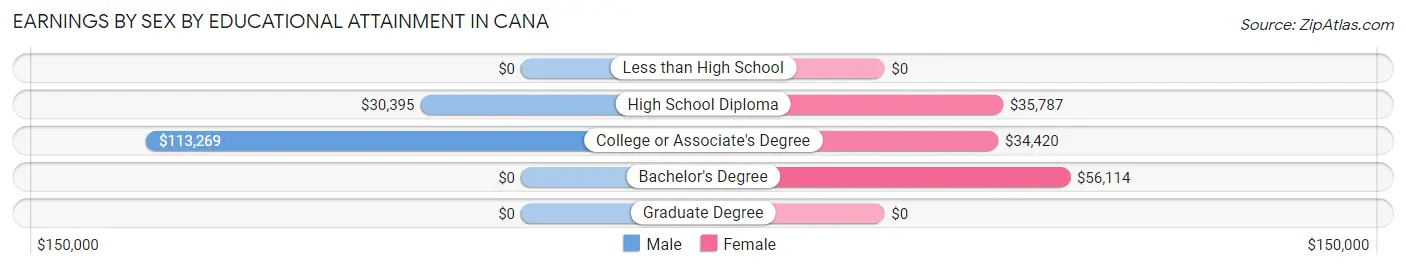
| Educational Attainment | Male Income | Female Income |
| Less than High School | - | - |
| High School Diploma | $30,395 | $35,787 |
| College or Associate's Degree | $113,269 | $34,420 |
| Bachelor's Degree | - | - |
| Graduate Degree | - | - |
| Total | $61,167 | $36,451 |
Family Income in Cana
Family Income Brackets in Cana
According to the Cana family income data, there are 107 families falling into the $150,000 to $199,999 income range, which is the most common income bracket and makes up 28.3% of all families.
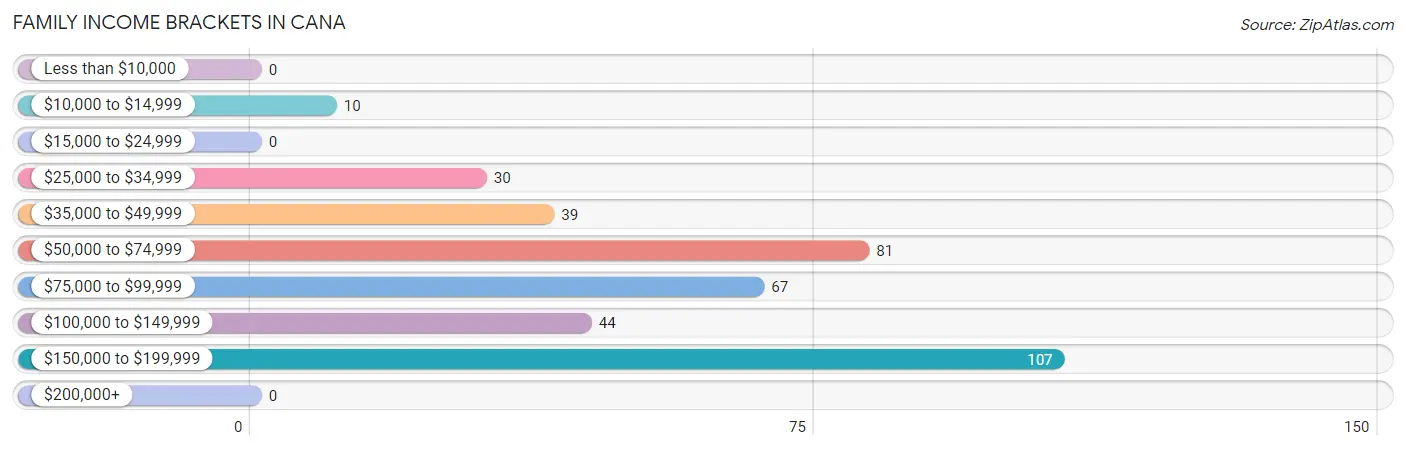
| Income Bracket | # Families | % Families |
| Less than $10,000 | 0 | 0.0% |
| $10,000 to $14,999 | 10 | 2.6% |
| $15,000 to $24,999 | 0 | 0.0% |
| $25,000 to $34,999 | 30 | 7.9% |
| $35,000 to $49,999 | 39 | 10.3% |
| $50,000 to $74,999 | 81 | 21.4% |
| $75,000 to $99,999 | 67 | 17.7% |
| $100,000 to $149,999 | 44 | 11.6% |
| $150,000 to $199,999 | 107 | 28.3% |
| $200,000+ | 0 | 0.0% |
Family Income by Famaliy Size in Cana
4-person families (41 | 10.8%) account for the highest median family income in Cana with $106,417 per family, while 3-person families (75 | 19.8%) have the highest median income of $31,821 per family member.
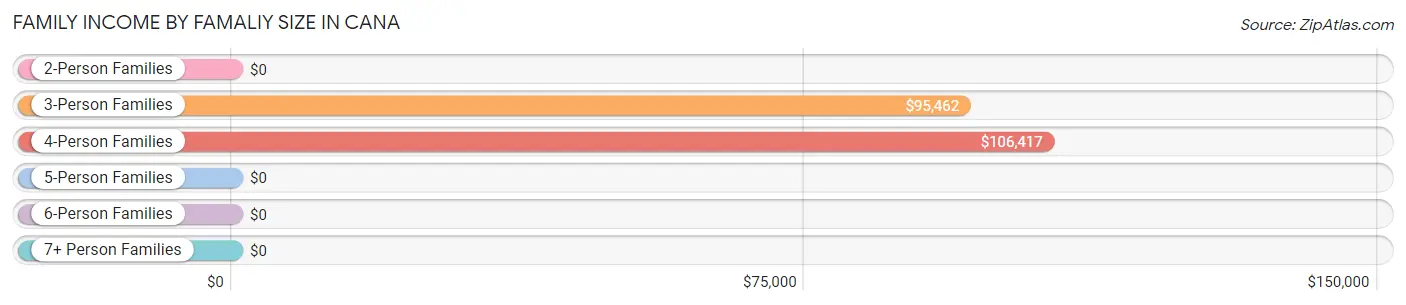
| Income Bracket | # Families | Median Income |
| 2-Person Families | 227 (60.1%) | $0 |
| 3-Person Families | 75 (19.8%) | $95,462 |
| 4-Person Families | 41 (10.8%) | $106,417 |
| 5-Person Families | 20 (5.3%) | $0 |
| 6-Person Families | 0 (0.0%) | $0 |
| 7+ Person Families | 15 (4.0%) | $0 |
| Total | 378 (100.0%) | $95,435 |
Family Income by Number of Earners in Cana
The median family income in Cana is $95,435, with families comprising 2 earners (187) having the highest median family income of $124,732, while families with 1 earner (65) have the lowest median family income of $41,705, accounting for 49.5% and 17.2% of families, respectively.
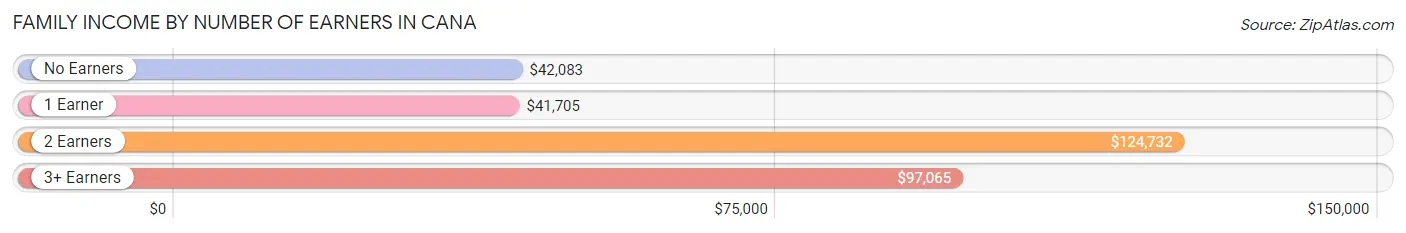
| Number of Earners | # Families | Median Income |
| No Earners | 50 (13.2%) | $42,083 |
| 1 Earner | 65 (17.2%) | $41,705 |
| 2 Earners | 187 (49.5%) | $124,732 |
| 3+ Earners | 76 (20.1%) | $97,065 |
| Total | 378 (100.0%) | $95,435 |
Household Income in Cana
Household Income Brackets in Cana
With 107 households falling in the category, the $150,000 to $199,999 income range is the most frequent in Cana, accounting for 20.9% of all households.
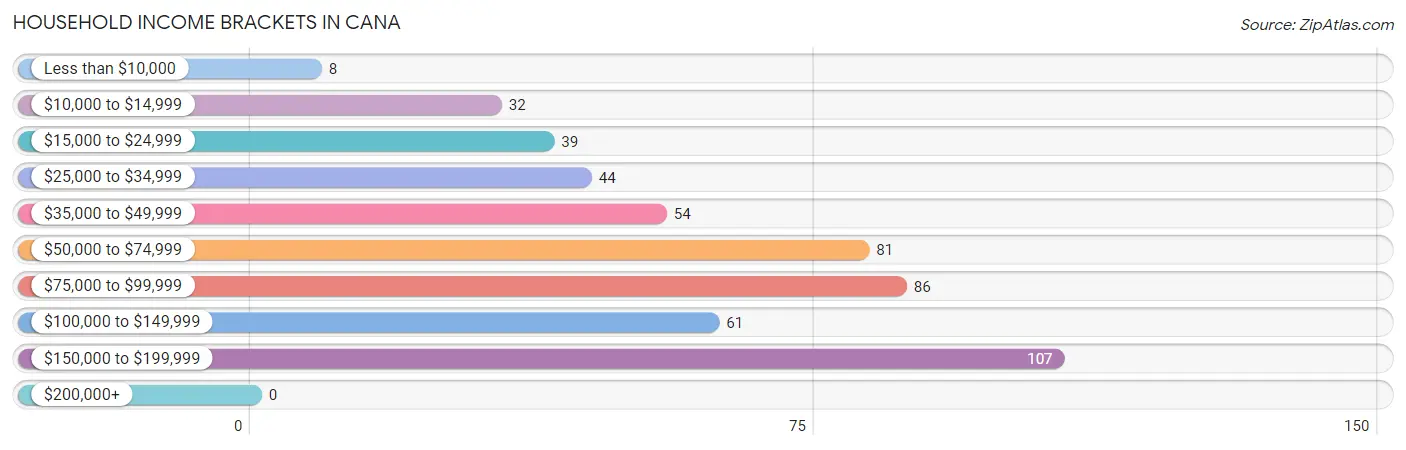
| Income Bracket | # Households | % Households |
| Less than $10,000 | 8 | 1.6% |
| $10,000 to $14,999 | 32 | 6.3% |
| $15,000 to $24,999 | 39 | 7.6% |
| $25,000 to $34,999 | 44 | 8.6% |
| $35,000 to $49,999 | 54 | 10.5% |
| $50,000 to $74,999 | 81 | 15.8% |
| $75,000 to $99,999 | 86 | 16.8% |
| $100,000 to $149,999 | 61 | 11.9% |
| $150,000 to $199,999 | 107 | 20.9% |
| $200,000+ | 0 | 0.0% |
Household Income by Householder Age in Cana
The median household income in Cana is $69,444, with the highest median household income of $168,057 found in the 25 to 44 years age bracket for the primary householder. A total of 143 households (27.9%) fall into this category.
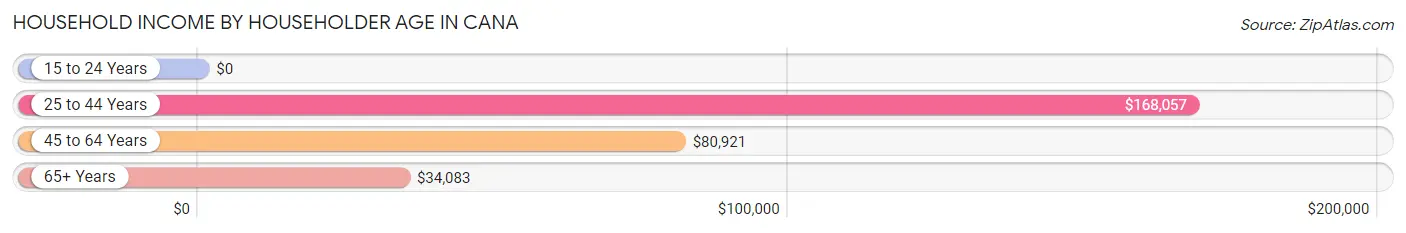
| Income Bracket | # Households | Median Income |
| 15 to 24 Years | 0 (0.0%) | $0 |
| 25 to 44 Years | 143 (27.9%) | $168,057 |
| 45 to 64 Years | 230 (44.9%) | $80,921 |
| 65+ Years | 139 (27.2%) | $34,083 |
| Total | 512 (100.0%) | $69,444 |
Poverty in Cana
Income Below Poverty by Sex and Age in Cana
With 2.5% poverty level for males and 3.1% for females among the residents of Cana, 65 to 74 year old males and 55 to 64 year old females are the most vulnerable to poverty, with 10 males (17.9%) and 19 females (14.8%) in their respective age groups living below the poverty level.
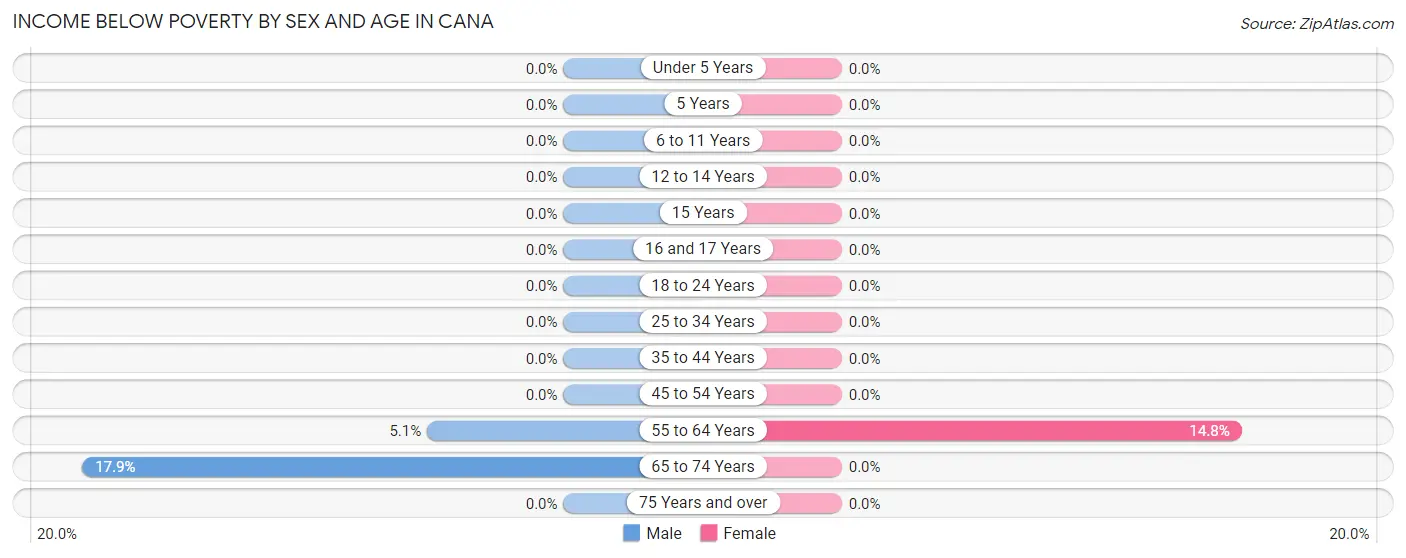
| Age Bracket | Male | Female |
| Under 5 Years | 0 (0.0%) | 0 (0.0%) |
| 5 Years | 0 (0.0%) | 0 (0.0%) |
| 6 to 11 Years | 0 (0.0%) | 0 (0.0%) |
| 12 to 14 Years | 0 (0.0%) | 0 (0.0%) |
| 15 Years | 0 (0.0%) | 0 (0.0%) |
| 16 and 17 Years | 0 (0.0%) | 0 (0.0%) |
| 18 to 24 Years | 0 (0.0%) | 0 (0.0%) |
| 25 to 34 Years | 0 (0.0%) | 0 (0.0%) |
| 35 to 44 Years | 0 (0.0%) | 0 (0.0%) |
| 45 to 54 Years | 0 (0.0%) | 0 (0.0%) |
| 55 to 64 Years | 8 (5.1%) | 19 (14.8%) |
| 65 to 74 Years | 10 (17.9%) | 0 (0.0%) |
| 75 Years and over | 0 (0.0%) | 0 (0.0%) |
| Total | 18 (2.5%) | 19 (3.1%) |
Income Above Poverty by Sex and Age in Cana
According to the poverty statistics in Cana, males aged under 5 years and females aged under 5 years are the age groups that are most secure financially, with 100.0% of males and 100.0% of females in these age groups living above the poverty line.
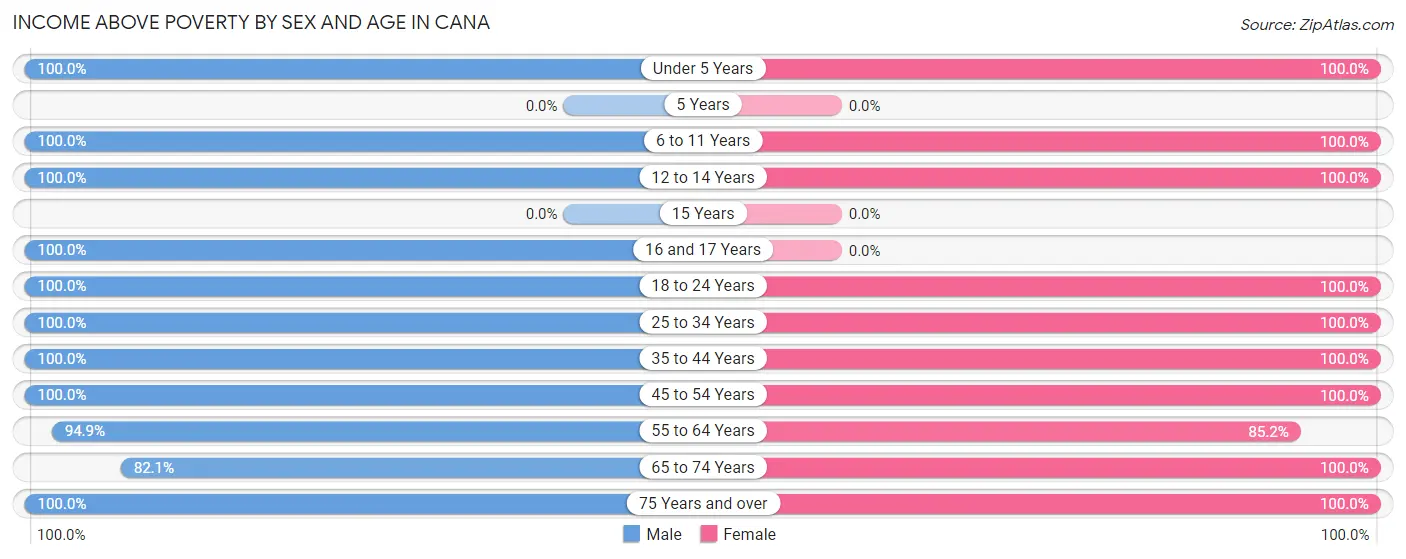
| Age Bracket | Male | Female |
| Under 5 Years | 97 (100.0%) | 14 (100.0%) |
| 5 Years | 0 (0.0%) | 0 (0.0%) |
| 6 to 11 Years | 22 (100.0%) | 16 (100.0%) |
| 12 to 14 Years | 46 (100.0%) | 7 (100.0%) |
| 15 Years | 0 (0.0%) | 0 (0.0%) |
| 16 and 17 Years | 20 (100.0%) | 0 (0.0%) |
| 18 to 24 Years | 41 (100.0%) | 35 (100.0%) |
| 25 to 34 Years | 39 (100.0%) | 198 (100.0%) |
| 35 to 44 Years | 161 (100.0%) | 9 (100.0%) |
| 45 to 54 Years | 52 (100.0%) | 96 (100.0%) |
| 55 to 64 Years | 150 (94.9%) | 109 (85.2%) |
| 65 to 74 Years | 46 (82.1%) | 68 (100.0%) |
| 75 Years and over | 23 (100.0%) | 44 (100.0%) |
| Total | 697 (97.5%) | 596 (96.9%) |
Income Below Poverty Among Married-Couple Families in Cana
The poverty statistics for married-couple families in Cana show that 2.7% or 10 of the total 373 families live below the poverty line. Families with no children have the highest poverty rate of 3.5%, comprising of 10 families. On the other hand, families with 1 or 2 children have the lowest poverty rate of 0.0%, which includes 0 families.
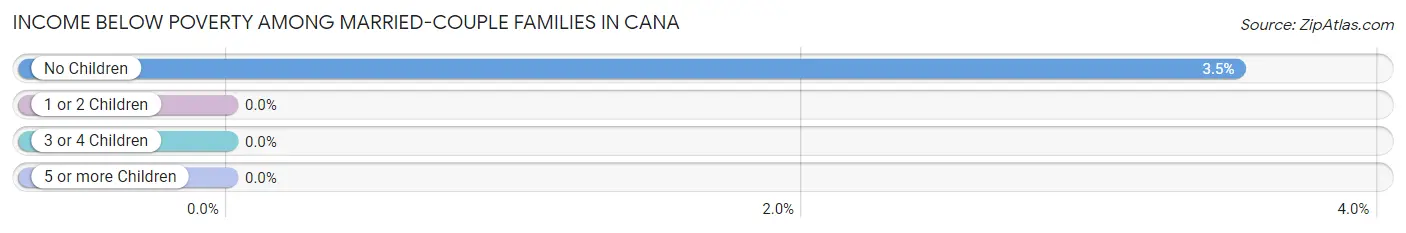
| Children | Above Poverty | Below Poverty |
| No Children | 275 (96.5%) | 10 (3.5%) |
| 1 or 2 Children | 53 (100.0%) | 0 (0.0%) |
| 3 or 4 Children | 35 (100.0%) | 0 (0.0%) |
| 5 or more Children | 0 (0.0%) | 0 (0.0%) |
| Total | 363 (97.3%) | 10 (2.7%) |
Income Below Poverty Among Single-Parent Households in Cana
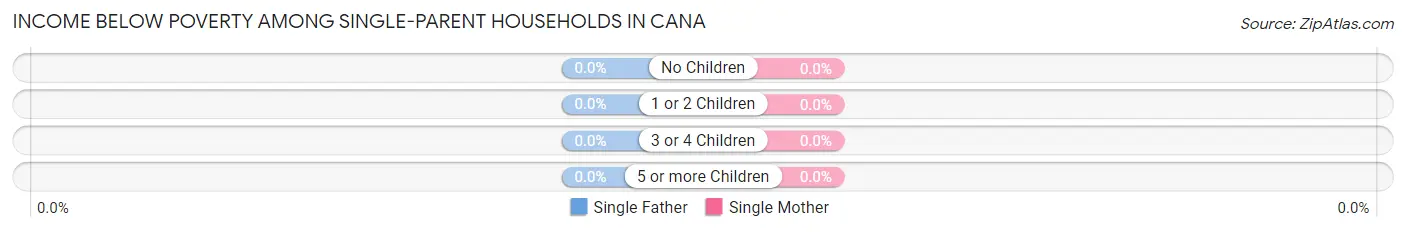
| Children | Single Father | Single Mother |
| No Children | 0 (0.0%) | 0 (0.0%) |
| 1 or 2 Children | 0 (0.0%) | 0 (0.0%) |
| 3 or 4 Children | 0 (0.0%) | 0 (0.0%) |
| 5 or more Children | 0 (0.0%) | 0 (0.0%) |
| Total | 0 (0.0%) | 0 (0.0%) |
Income Below Poverty Among Married-Couple vs Single-Parent Households in Cana
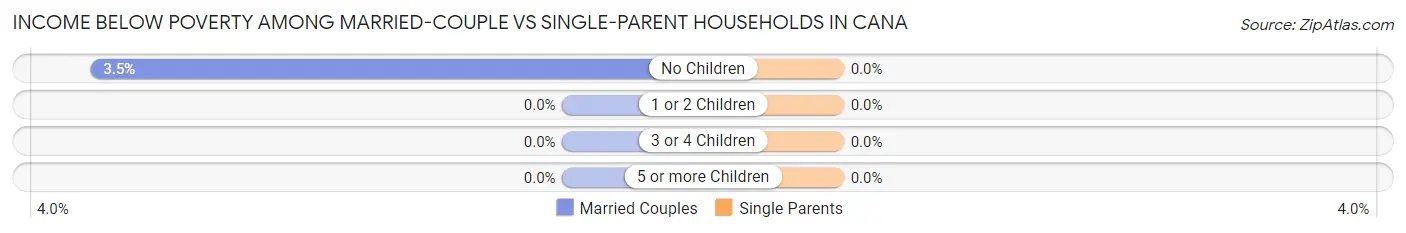
| Children | Married-Couple Families | Single-Parent Households |
| No Children | 10 (3.5%) | 0 (0.0%) |
| 1 or 2 Children | 0 (0.0%) | 0 (0.0%) |
| 3 or 4 Children | 0 (0.0%) | 0 (0.0%) |
| 5 or more Children | 0 (0.0%) | 0 (0.0%) |
| Total | 10 (2.7%) | 0 (0.0%) |
Race in Cana
The most populous races in Cana are White / Caucasian (1,322 | 99.4%), and Native / Alaskan (8 | 0.6%).
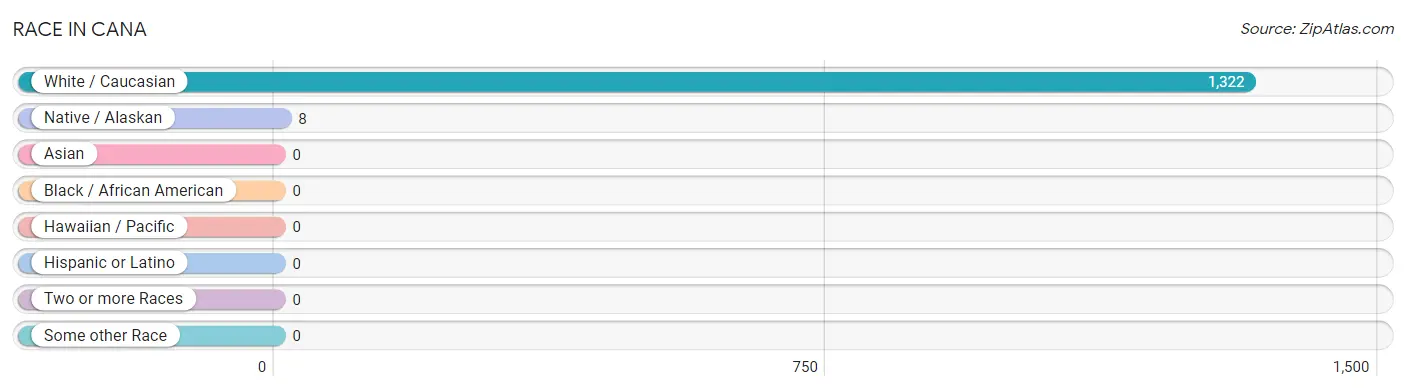
| Race | # Population | % Population |
| Asian | 0 | 0.0% |
| Black / African American | 0 | 0.0% |
| Hawaiian / Pacific | 0 | 0.0% |
| Hispanic or Latino | 0 | 0.0% |
| Native / Alaskan | 8 | 0.6% |
| White / Caucasian | 1,322 | 99.4% |
| Two or more Races | 0 | 0.0% |
| Some other Race | 0 | 0.0% |
| Total | 1,330 | 100.0% |
Ancestry in Cana
The most populous ancestries reported in Cana are English (340 | 25.6%), Irish (204 | 15.3%), American (158 | 11.9%), Scotch-Irish (137 | 10.3%), and German (102 | 7.7%), together accounting for 70.8% of all Cana residents.
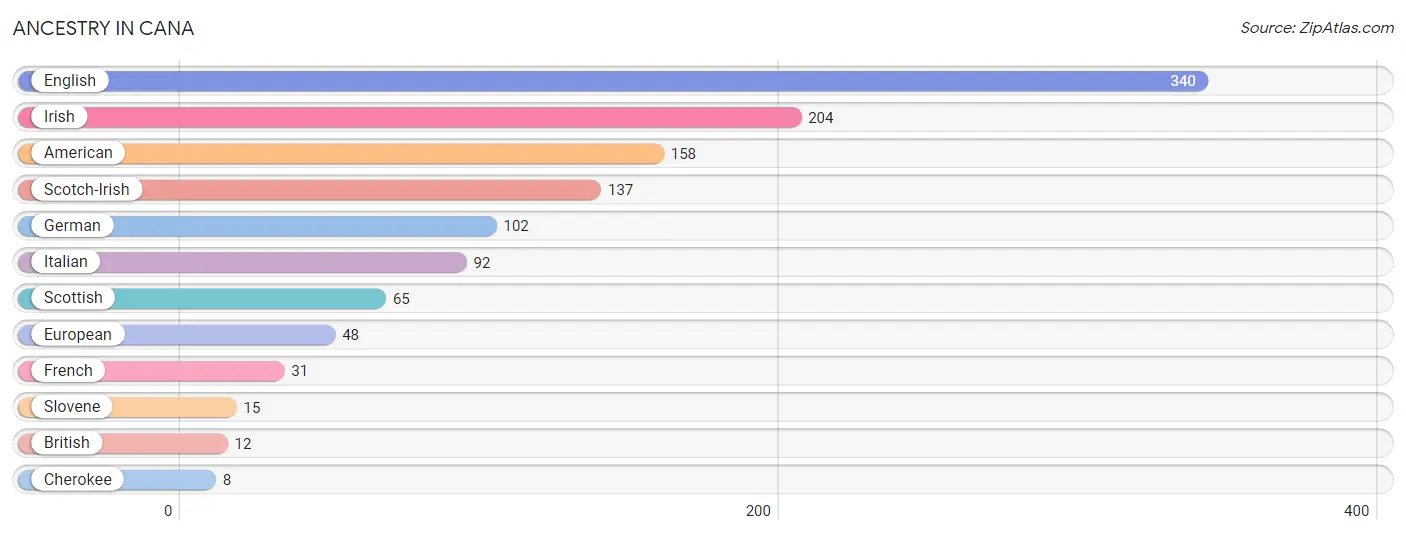
| Ancestry | # Population | % Population |
| American | 158 | 11.9% |
| British | 12 | 0.9% |
| Cherokee | 8 | 0.6% |
| English | 340 | 25.6% |
| European | 48 | 3.6% |
| French | 31 | 2.3% |
| German | 102 | 7.7% |
| Irish | 204 | 15.3% |
| Italian | 92 | 6.9% |
| Scotch-Irish | 137 | 10.3% |
| Scottish | 65 | 4.9% |
| Slovene | 15 | 1.1% | View All 12 Rows |
Immigrants in Cana
The most numerous immigrant groups reported in Cana came from Central America (8 | 0.6%), Latin America (8 | 0.6%), and Mexico (8 | 0.6%), together accounting for 1.8% of all Cana residents.
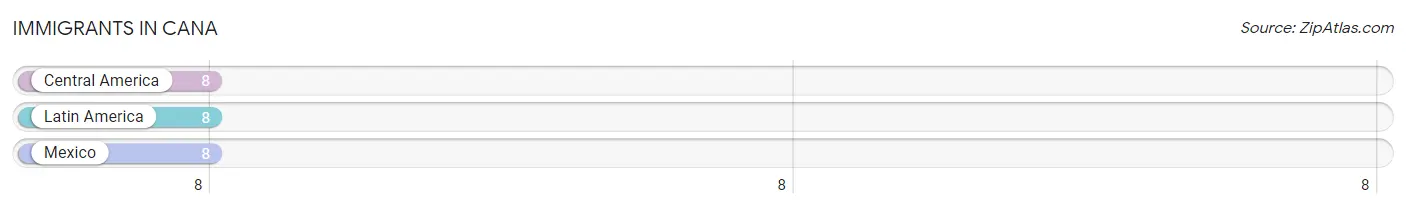
| Immigration Origin | # Population | % Population |
| Central America | 8 | 0.6% |
| Latin America | 8 | 0.6% |
| Mexico | 8 | 0.6% | View All 3 Rows |
Sex and Age in Cana
Sex and Age in Cana
The most populous age groups in Cana are 35 to 39 Years (152 | 21.3%) for men and 30 to 34 Years (117 | 19.0%) for women.
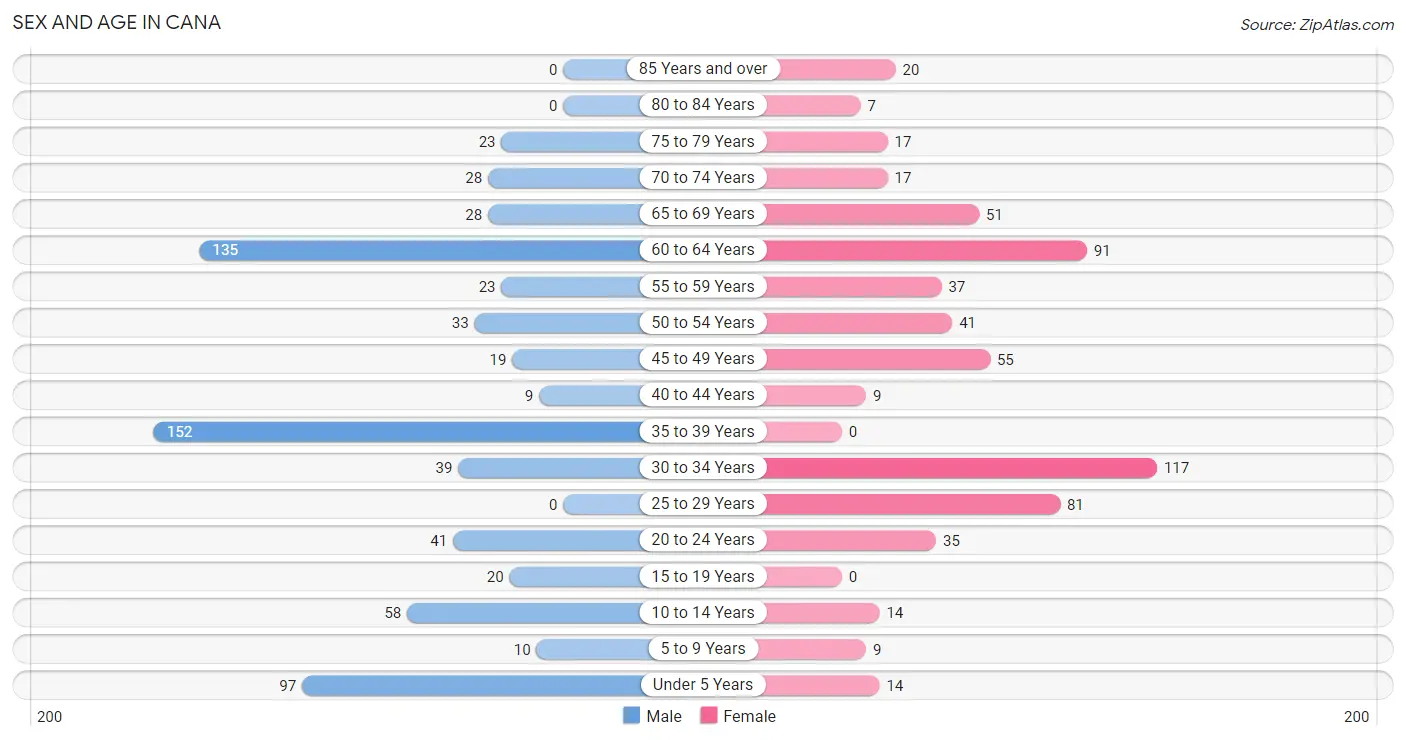
| Age Bracket | Male | Female |
| Under 5 Years | 97 (13.6%) | 14 (2.3%) |
| 5 to 9 Years | 10 (1.4%) | 9 (1.5%) |
| 10 to 14 Years | 58 (8.1%) | 14 (2.3%) |
| 15 to 19 Years | 20 (2.8%) | 0 (0.0%) |
| 20 to 24 Years | 41 (5.7%) | 35 (5.7%) |
| 25 to 29 Years | 0 (0.0%) | 81 (13.2%) |
| 30 to 34 Years | 39 (5.4%) | 117 (19.0%) |
| 35 to 39 Years | 152 (21.3%) | 0 (0.0%) |
| 40 to 44 Years | 9 (1.3%) | 9 (1.5%) |
| 45 to 49 Years | 19 (2.7%) | 55 (8.9%) |
| 50 to 54 Years | 33 (4.6%) | 41 (6.7%) |
| 55 to 59 Years | 23 (3.2%) | 37 (6.0%) |
| 60 to 64 Years | 135 (18.9%) | 91 (14.8%) |
| 65 to 69 Years | 28 (3.9%) | 51 (8.3%) |
| 70 to 74 Years | 28 (3.9%) | 17 (2.8%) |
| 75 to 79 Years | 23 (3.2%) | 17 (2.8%) |
| 80 to 84 Years | 0 (0.0%) | 7 (1.1%) |
| 85 Years and over | 0 (0.0%) | 20 (3.3%) |
| Total | 715 (100.0%) | 615 (100.0%) |
Families and Households in Cana
Median Family Size in Cana
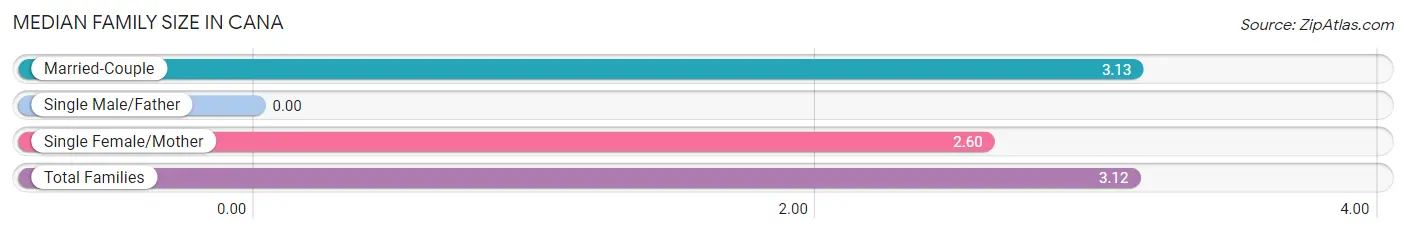
| Family Type | # Families | Family Size |
| Married-Couple | 373 (98.7%) | 3.13 |
| Single Male/Father | 0 (0.0%) | - |
| Single Female/Mother | 5 (1.3%) | 2.60 |
| Total Families | 378 (100.0%) | 3.12 |
Median Household Size in Cana
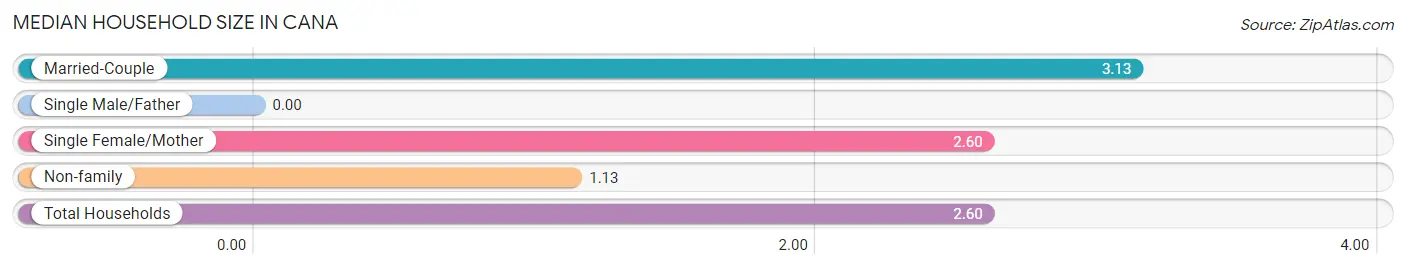
| Household Type | # Households | Household Size |
| Married-Couple | 373 (72.9%) | 3.13 |
| Single Male/Father | 0 (0.0%) | - |
| Single Female/Mother | 5 (1.0%) | 2.60 |
| Non-family | 134 (26.2%) | 1.13 |
| Total Households | 512 (100.0%) | 2.60 |
Household Size by Marriage Status in Cana
Out of a total of 512 households in Cana, 378 (73.8%) are family households, while 134 (26.2%) are nonfamily households. The most numerous type of family households are 2-person households, comprising 227, and the most common type of nonfamily households are 1-person households, comprising 115.
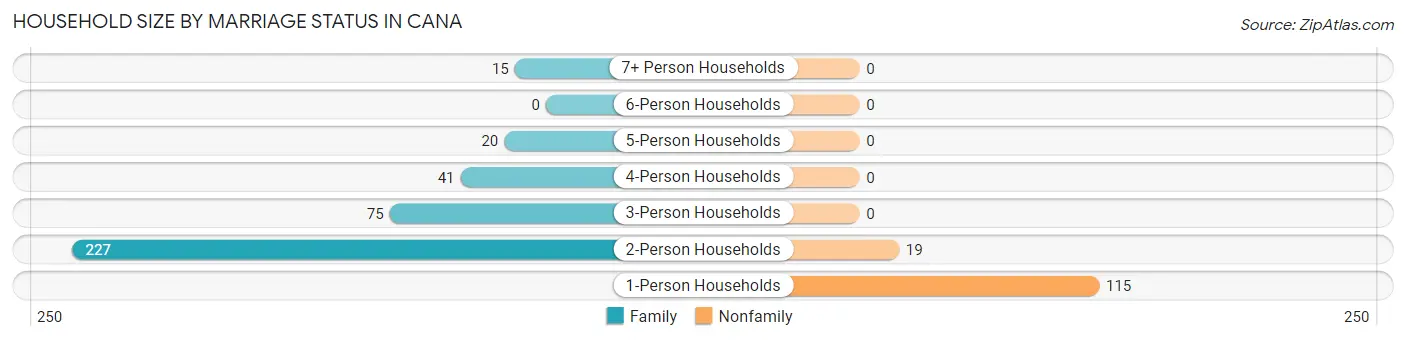
| Household Size | Family Households | Nonfamily Households |
| 1-Person Households | - | 115 (22.5%) |
| 2-Person Households | 227 (44.3%) | 19 (3.7%) |
| 3-Person Households | 75 (14.6%) | 0 (0.0%) |
| 4-Person Households | 41 (8.0%) | 0 (0.0%) |
| 5-Person Households | 20 (3.9%) | 0 (0.0%) |
| 6-Person Households | 0 (0.0%) | 0 (0.0%) |
| 7+ Person Households | 15 (2.9%) | 0 (0.0%) |
| Total | 378 (73.8%) | 134 (26.2%) |
Female Fertility in Cana
Fertility by Age in Cana
| Age Bracket | Women with Births | Births / 1,000 Women |
| 15 to 19 years | 0 (0.0%) | 0.0 |
| 20 to 34 years | 0 (0.0%) | 0.0 |
| 35 to 50 years | 0 (0.0%) | 0.0 |
| Total | 0 (0.0%) | 0.0 |
Fertility by Age by Marriage Status in Cana
| Age Bracket | Married | Unmarried |
| 15 to 19 years | 0 (0.0%) | 0 (0.0%) |
| 20 to 34 years | 0 (0.0%) | 0 (0.0%) |
| 35 to 50 years | 0 (0.0%) | 0 (0.0%) |
| Total | 0 (0.0%) | 0 (0.0%) |
Fertility by Education in Cana
| Educational Attainment | Women with Births | Births / 1,000 Women |
| Less than High School | 0 (0.0%) | 0.0 |
| High School Diploma | 0 (0.0%) | 0.0 |
| College or Associate's Degree | 0 (0.0%) | 0.0 |
| Bachelor's Degree | 0 (0.0%) | 0.0 |
| Graduate Degree | 0 (0.0%) | 0.0 |
| Total | 0 (0.0%) | 0.0 |
Fertility by Education by Marriage Status in Cana
| Educational Attainment | Married | Unmarried |
| Less than High School | 0 (0.0%) | 0 (0.0%) |
| High School Diploma | 0 (0.0%) | 0 (0.0%) |
| College or Associate's Degree | 0 (0.0%) | 0 (0.0%) |
| Bachelor's Degree | 0 (0.0%) | 0 (0.0%) |
| Graduate Degree | 0 (0.0%) | 0 (0.0%) |
| Total | 0 (0.0%) | 0 (0.0%) |
Employment Characteristics in Cana
Employment by Class of Employer in Cana
Among the 762 employed individuals in Cana, private company employees (536 | 70.3%), local government employees (106 | 13.9%), and self-employed (not incorporated) (42 | 5.5%) make up the most common classes of employment.
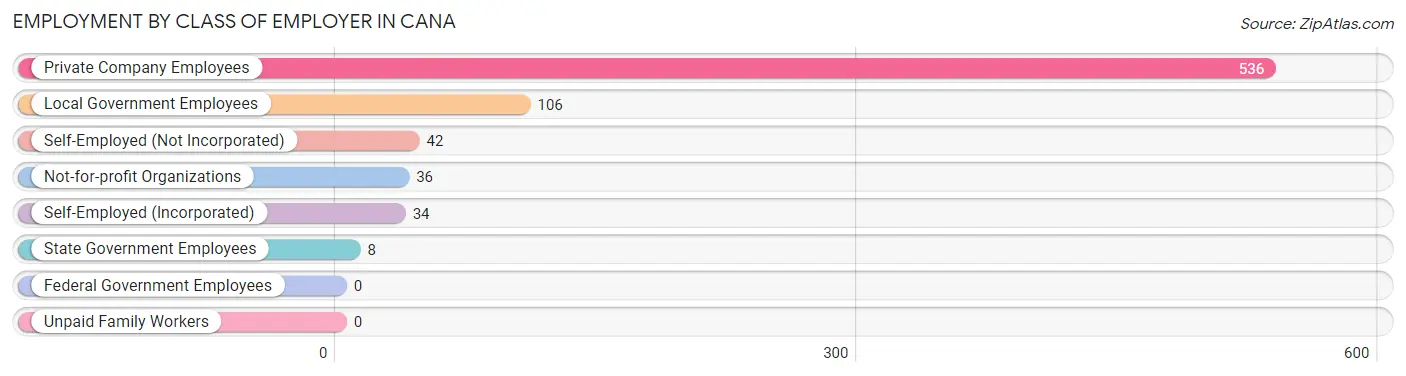
| Employer Class | # Employees | % Employees |
| Private Company Employees | 536 | 70.3% |
| Self-Employed (Incorporated) | 34 | 4.5% |
| Self-Employed (Not Incorporated) | 42 | 5.5% |
| Not-for-profit Organizations | 36 | 4.7% |
| Local Government Employees | 106 | 13.9% |
| State Government Employees | 8 | 1.1% |
| Federal Government Employees | 0 | 0.0% |
| Unpaid Family Workers | 0 | 0.0% |
| Total | 762 | 100.0% |
Employment Status by Age in Cana
According to the labor force statistics for Cana, out of the total population over 16 years of age (1,128), 70.7% or 797 individuals are in the labor force, with 2.1% or 17 of them unemployed. The age group with the highest labor force participation rate is 25 to 29 years, with 100.0% or 81 individuals in the labor force. Within the labor force, the 60 to 64 years age range has the highest percentage of unemployed individuals, with 10.4% or 17 of them being unemployed.
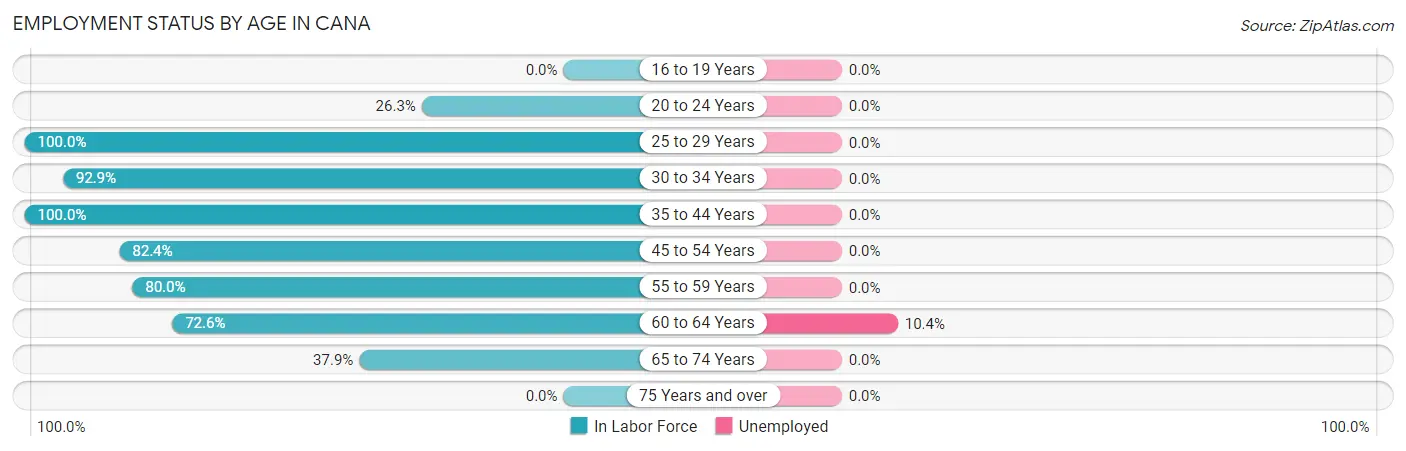
| Age Bracket | In Labor Force | Unemployed |
| 16 to 19 Years | 0 (0.0%) | 0 (0.0%) |
| 20 to 24 Years | 20 (26.3%) | 0 (0.0%) |
| 25 to 29 Years | 81 (100.0%) | 0 (0.0%) |
| 30 to 34 Years | 145 (92.9%) | 0 (0.0%) |
| 35 to 44 Years | 170 (100.0%) | 0 (0.0%) |
| 45 to 54 Years | 122 (82.4%) | 0 (0.0%) |
| 55 to 59 Years | 48 (80.0%) | 0 (0.0%) |
| 60 to 64 Years | 164 (72.6%) | 17 (10.4%) |
| 65 to 74 Years | 47 (37.9%) | 0 (0.0%) |
| 75 Years and over | 0 (0.0%) | 0 (0.0%) |
| Total | 797 (70.7%) | 17 (2.1%) |
Employment Status by Educational Attainment in Cana
According to labor force statistics for Cana, 86.8% of individuals (730) out of the total population between 25 and 64 years of age (841) are in the labor force, with 2.3% or 17 of them being unemployed. The group with the highest labor force participation rate are those with the educational attainment of bachelor's degree or higher, with 96.4% or 213 individuals in the labor force. Within the labor force, individuals with bachelor's degree or higher education have the highest percentage of unemployment, with 8.0% or 17 of them being unemployed.
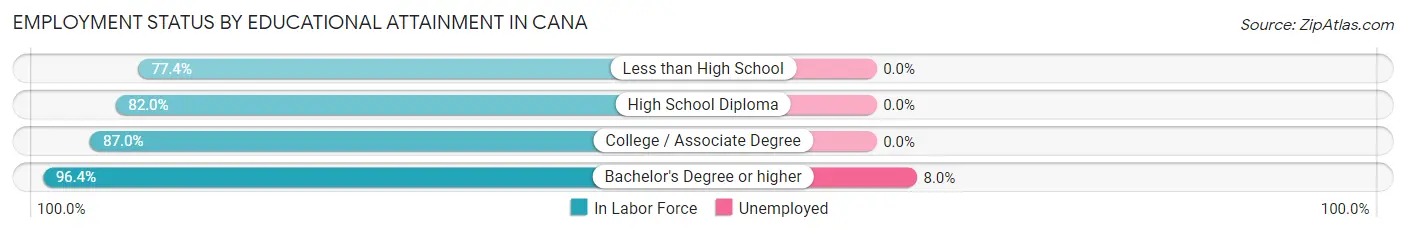
| Educational Attainment | In Labor Force | Unemployed |
| Less than High School | 48 (77.4%) | 0 (0.0%) |
| High School Diploma | 269 (82.0%) | 0 (0.0%) |
| College / Associate Degree | 200 (87.0%) | 0 (0.0%) |
| Bachelor's Degree or higher | 213 (96.4%) | 18 (8.0%) |
| Total | 730 (86.8%) | 19 (2.3%) |
Employment Occupations by Sex in Cana
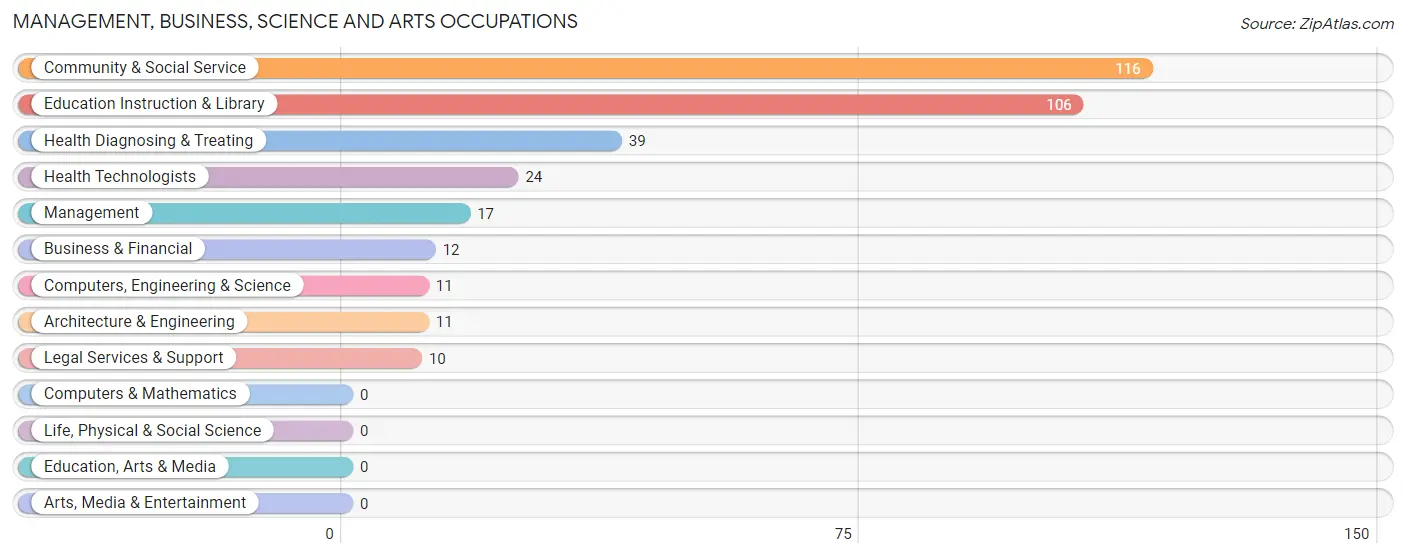
Management, Business, Science and Arts Occupations
The most common Management, Business, Science and Arts occupations in Cana are Community & Social Service (116 | 14.9%), Education Instruction & Library (106 | 13.6%), Health Diagnosing & Treating (39 | 5.0%), Health Technologists (24 | 3.1%), and Management (17 | 2.2%).
Management, Business, Science and Arts Occupations by Sex
Within the Management, Business, Science and Arts occupations in Cana, the most male-oriented occupations are Management (100.0%), Business & Financial (100.0%), and Computers, Engineering & Science (100.0%), while the most female-oriented occupations are Education Instruction & Library (100.0%), Health Diagnosing & Treating (100.0%), and Health Technologists (100.0%).
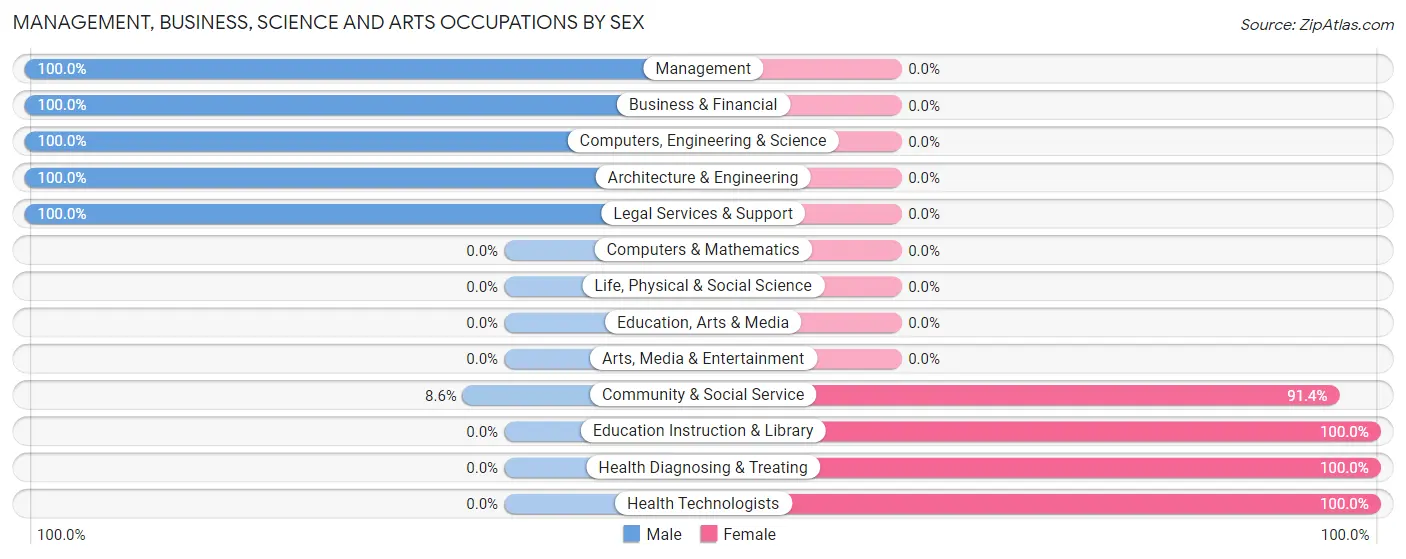
| Occupation | Male | Female |
| Management | 17 (100.0%) | 0 (0.0%) |
| Business & Financial | 12 (100.0%) | 0 (0.0%) |
| Computers, Engineering & Science | 11 (100.0%) | 0 (0.0%) |
| Computers & Mathematics | 0 (0.0%) | 0 (0.0%) |
| Architecture & Engineering | 11 (100.0%) | 0 (0.0%) |
| Life, Physical & Social Science | 0 (0.0%) | 0 (0.0%) |
| Community & Social Service | 10 (8.6%) | 106 (91.4%) |
| Education, Arts & Media | 0 (0.0%) | 0 (0.0%) |
| Legal Services & Support | 10 (100.0%) | 0 (0.0%) |
| Education Instruction & Library | 0 (0.0%) | 106 (100.0%) |
| Arts, Media & Entertainment | 0 (0.0%) | 0 (0.0%) |
| Health Diagnosing & Treating | 0 (0.0%) | 39 (100.0%) |
| Health Technologists | 0 (0.0%) | 24 (100.0%) |
| Total (Category) | 50 (25.6%) | 145 (74.4%) |
| Total (Overall) | 415 (53.2%) | 365 (46.8%) |
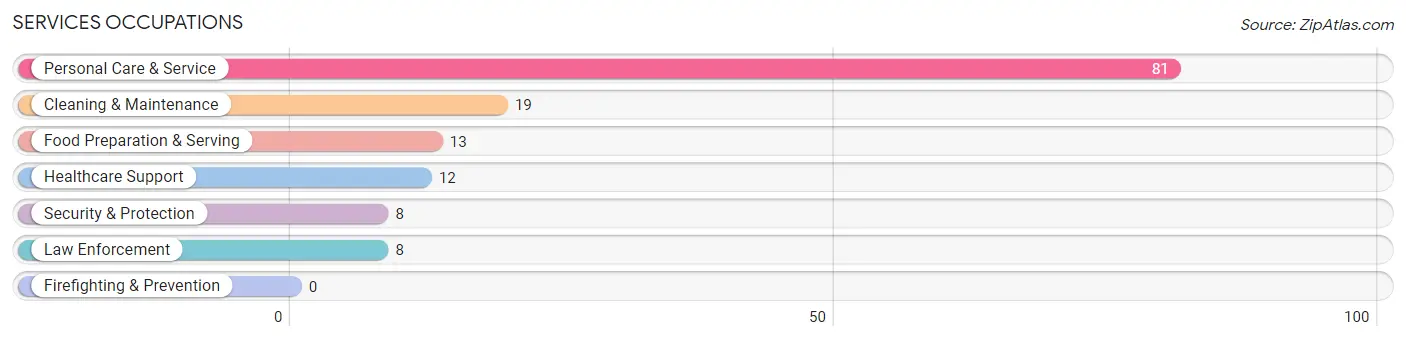
Services Occupations
The most common Services occupations in Cana are Personal Care & Service (81 | 10.4%), Cleaning & Maintenance (19 | 2.4%), Food Preparation & Serving (13 | 1.7%), Healthcare Support (12 | 1.5%), and Security & Protection (8 | 1.0%).
Services Occupations by Sex
Within the Services occupations in Cana, the most male-oriented occupations are Security & Protection (100.0%), and Law Enforcement (100.0%), while the most female-oriented occupations are Healthcare Support (100.0%), Food Preparation & Serving (100.0%), and Cleaning & Maintenance (100.0%).
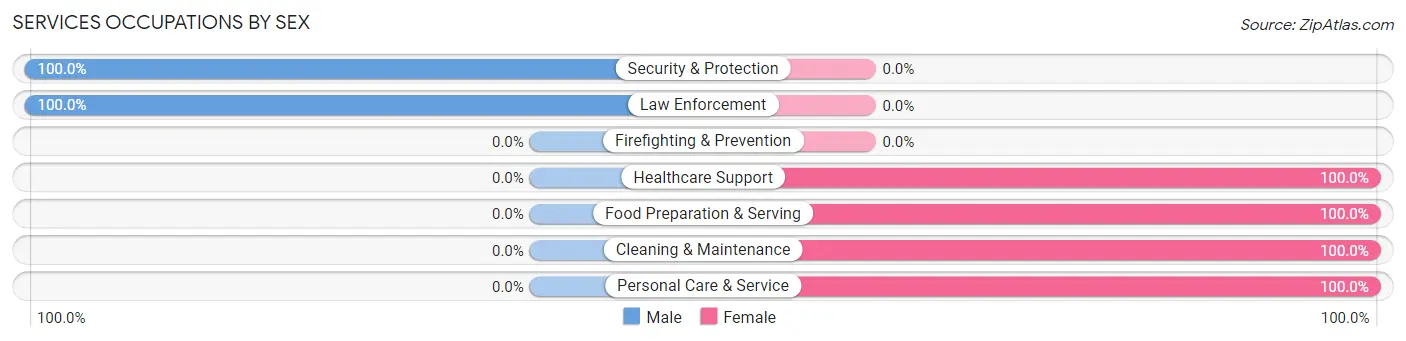
| Occupation | Male | Female |
| Healthcare Support | 0 (0.0%) | 12 (100.0%) |
| Security & Protection | 8 (100.0%) | 0 (0.0%) |
| Firefighting & Prevention | 0 (0.0%) | 0 (0.0%) |
| Law Enforcement | 8 (100.0%) | 0 (0.0%) |
| Food Preparation & Serving | 0 (0.0%) | 13 (100.0%) |
| Cleaning & Maintenance | 0 (0.0%) | 19 (100.0%) |
| Personal Care & Service | 0 (0.0%) | 81 (100.0%) |
| Total (Category) | 8 (6.0%) | 125 (94.0%) |
| Total (Overall) | 415 (53.2%) | 365 (46.8%) |
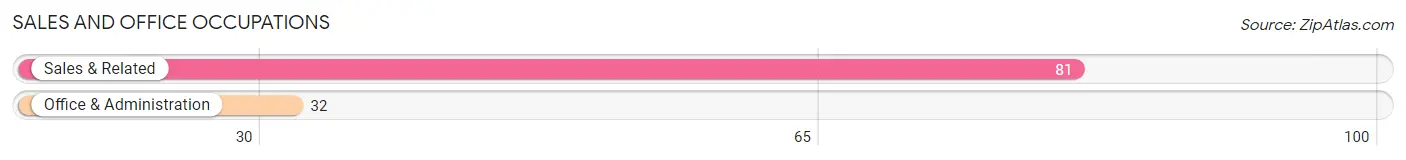
Sales and Office Occupations
The most common Sales and Office occupations in Cana are Sales & Related (81 | 10.4%), and Office & Administration (32 | 4.1%).
Sales and Office Occupations by Sex
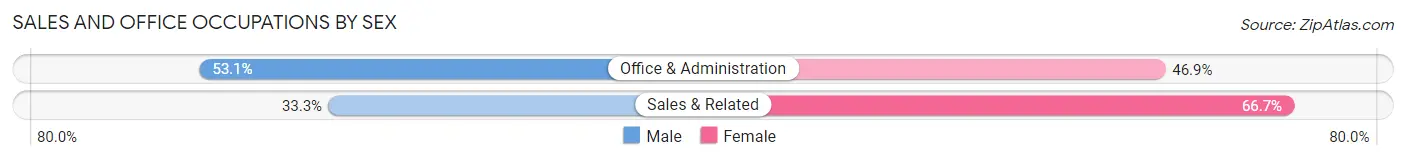
| Occupation | Male | Female |
| Sales & Related | 27 (33.3%) | 54 (66.7%) |
| Office & Administration | 17 (53.1%) | 15 (46.9%) |
| Total (Category) | 44 (38.9%) | 69 (61.1%) |
| Total (Overall) | 415 (53.2%) | 365 (46.8%) |
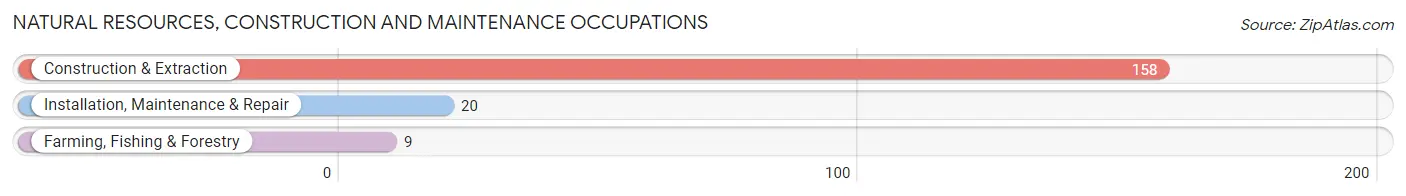
Natural Resources, Construction and Maintenance Occupations
The most common Natural Resources, Construction and Maintenance occupations in Cana are Construction & Extraction (158 | 20.3%), Installation, Maintenance & Repair (20 | 2.6%), and Farming, Fishing & Forestry (9 | 1.1%).
Natural Resources, Construction and Maintenance Occupations by Sex
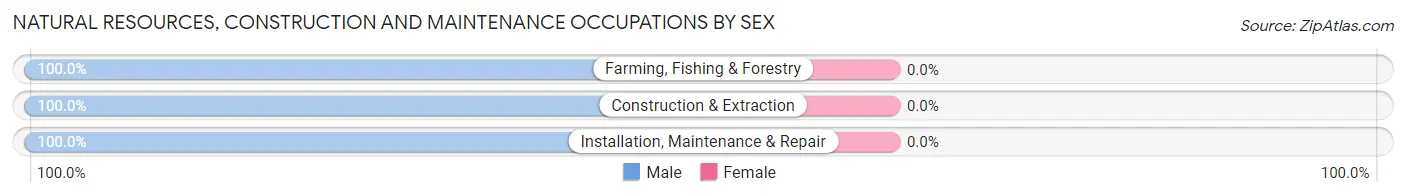
| Occupation | Male | Female |
| Farming, Fishing & Forestry | 9 (100.0%) | 0 (0.0%) |
| Construction & Extraction | 158 (100.0%) | 0 (0.0%) |
| Installation, Maintenance & Repair | 20 (100.0%) | 0 (0.0%) |
| Total (Category) | 187 (100.0%) | 0 (0.0%) |
| Total (Overall) | 415 (53.2%) | 365 (46.8%) |
Production, Transportation and Moving Occupations
The most common Production, Transportation and Moving occupations in Cana are Transportation (81 | 10.4%), and Production (71 | 9.1%).
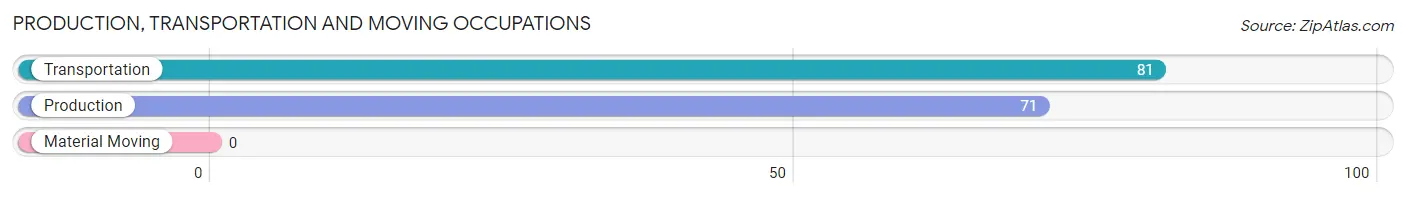
Production, Transportation and Moving Occupations by Sex
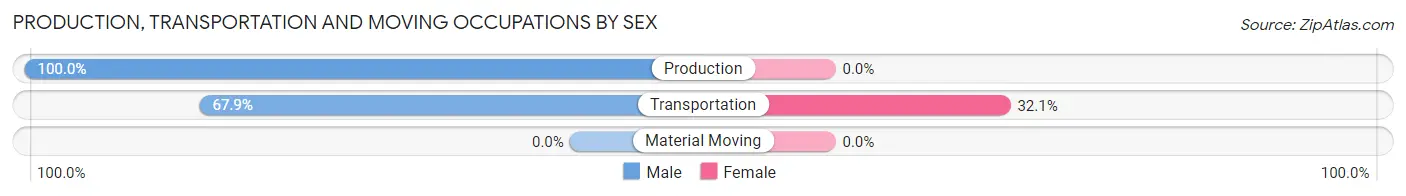
| Occupation | Male | Female |
| Production | 71 (100.0%) | 0 (0.0%) |
| Transportation | 55 (67.9%) | 26 (32.1%) |
| Material Moving | 0 (0.0%) | 0 (0.0%) |
| Total (Category) | 126 (82.9%) | 26 (17.1%) |
| Total (Overall) | 415 (53.2%) | 365 (46.8%) |
Employment Industries by Sex in Cana
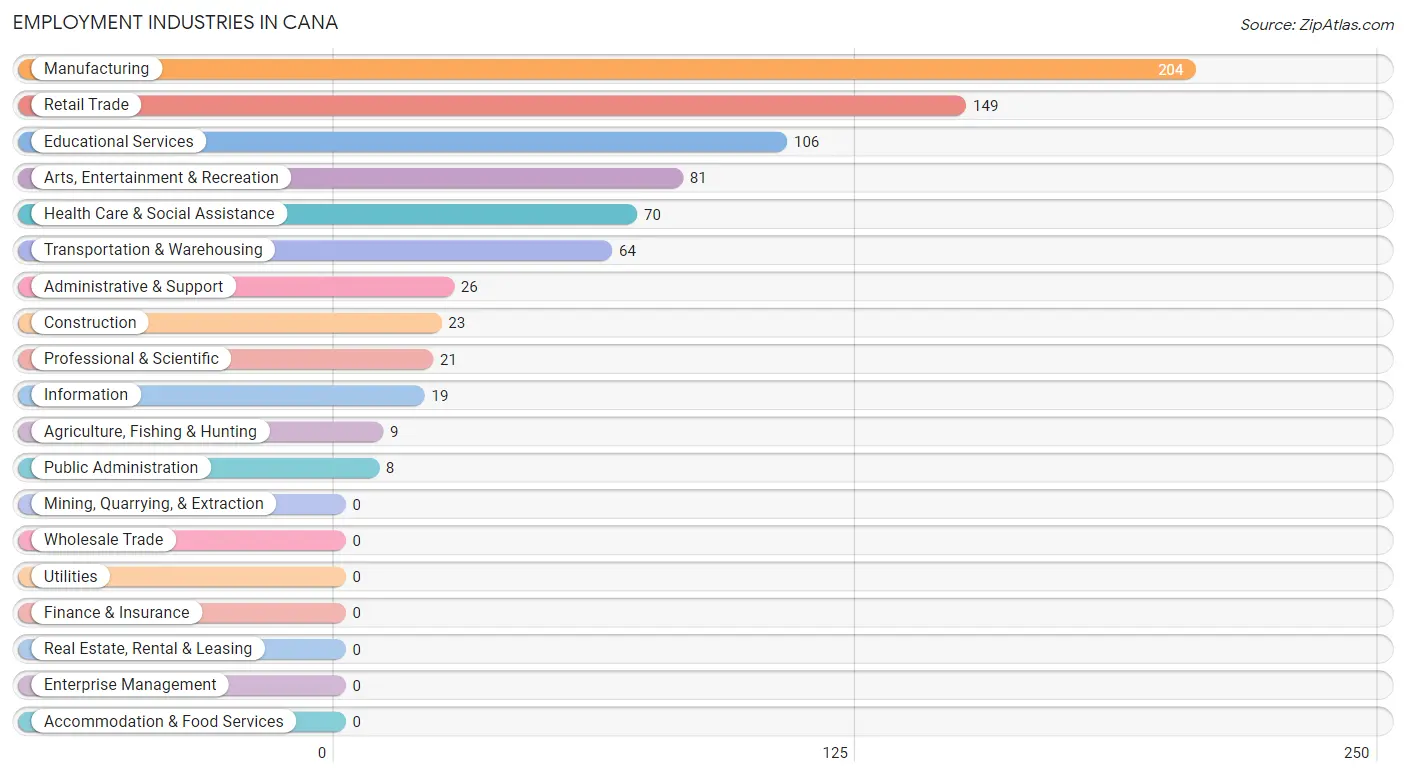
Employment Industries in Cana
The major employment industries in Cana include Manufacturing (204 | 26.2%), Retail Trade (149 | 19.1%), Educational Services (106 | 13.6%), Arts, Entertainment & Recreation (81 | 10.4%), and Health Care & Social Assistance (70 | 9.0%).
Employment Industries by Sex in Cana
The Cana industries that see more men than women are Agriculture, Fishing & Hunting (100.0%), Construction (100.0%), and Manufacturing (100.0%), whereas the industries that tend to have a higher number of women are Educational Services (100.0%), Health Care & Social Assistance (100.0%), and Arts, Entertainment & Recreation (100.0%).
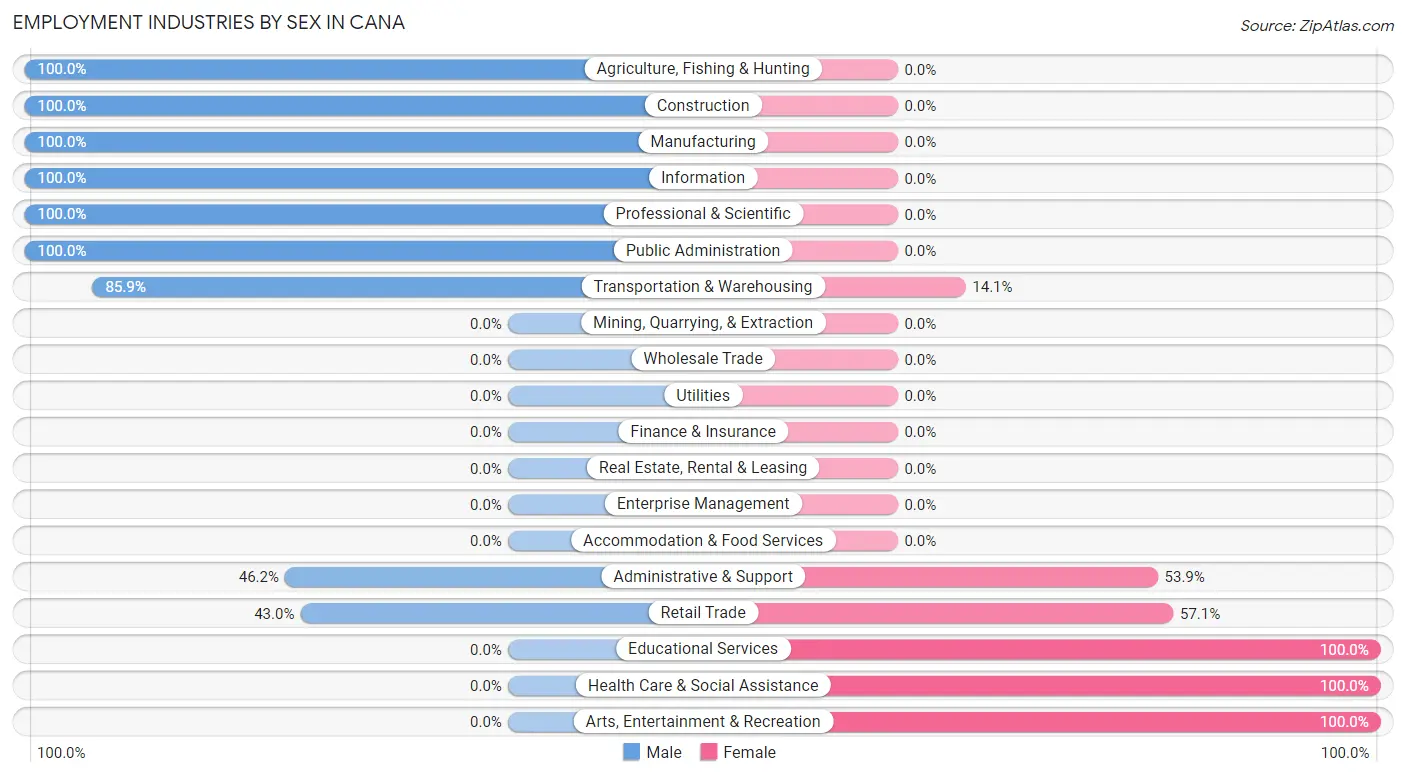
| Industry | Male | Female |
| Agriculture, Fishing & Hunting | 9 (100.0%) | 0 (0.0%) |
| Mining, Quarrying, & Extraction | 0 (0.0%) | 0 (0.0%) |
| Construction | 23 (100.0%) | 0 (0.0%) |
| Manufacturing | 204 (100.0%) | 0 (0.0%) |
| Wholesale Trade | 0 (0.0%) | 0 (0.0%) |
| Retail Trade | 64 (42.9%) | 85 (57.1%) |
| Transportation & Warehousing | 55 (85.9%) | 9 (14.1%) |
| Utilities | 0 (0.0%) | 0 (0.0%) |
| Information | 19 (100.0%) | 0 (0.0%) |
| Finance & Insurance | 0 (0.0%) | 0 (0.0%) |
| Real Estate, Rental & Leasing | 0 (0.0%) | 0 (0.0%) |
| Professional & Scientific | 21 (100.0%) | 0 (0.0%) |
| Enterprise Management | 0 (0.0%) | 0 (0.0%) |
| Administrative & Support | 12 (46.2%) | 14 (53.8%) |
| Educational Services | 0 (0.0%) | 106 (100.0%) |
| Health Care & Social Assistance | 0 (0.0%) | 70 (100.0%) |
| Arts, Entertainment & Recreation | 0 (0.0%) | 81 (100.0%) |
| Accommodation & Food Services | 0 (0.0%) | 0 (0.0%) |
| Public Administration | 8 (100.0%) | 0 (0.0%) |
| Total | 415 (53.2%) | 365 (46.8%) |
Education in Cana
School Enrollment in Cana
The most common levels of schooling among the 163 students in Cana are middle school (53 | 32.5%), nursery / preschool (41 | 25.2%), and elementary school (29 | 17.8%).
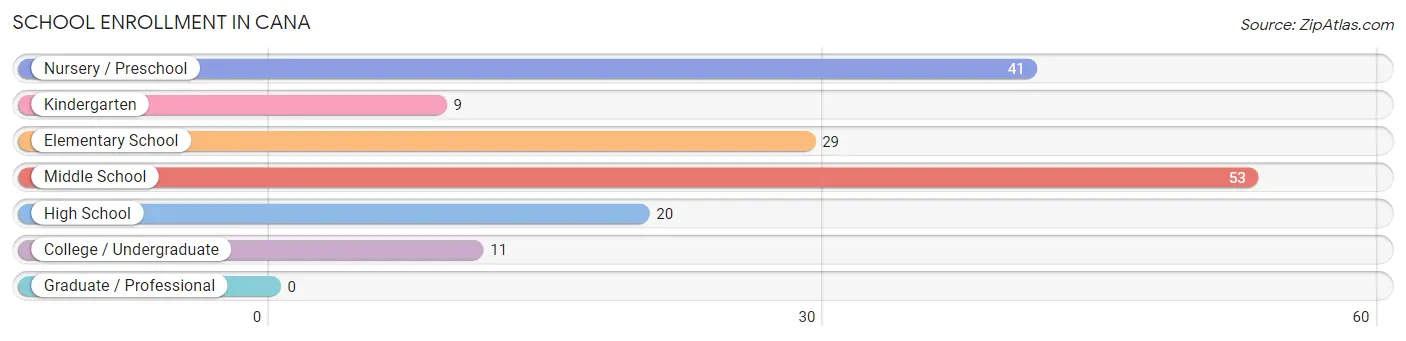
| School Level | # Students | % Students |
| Nursery / Preschool | 41 | 25.2% |
| Kindergarten | 9 | 5.5% |
| Elementary School | 29 | 17.8% |
| Middle School | 53 | 32.5% |
| High School | 20 | 12.3% |
| College / Undergraduate | 11 | 6.8% |
| Graduate / Professional | 0 | 0.0% |
| Total | 163 | 100.0% |
School Enrollment by Age by Funding Source in Cana
Out of a total of 163 students who are enrolled in schools in Cana, 52 (31.9%) attend a private institution, while the remaining 111 (68.1%) are enrolled in public schools. The age group of 10 to 14 year olds has the highest likelihood of being enrolled in private schools, with 42 (58.3% in the age bracket) enrolled. Conversely, the age group of 3 to 4 year olds has the lowest likelihood of being enrolled in a private school, with 41 (100.0% in the age bracket) attending a public institution.
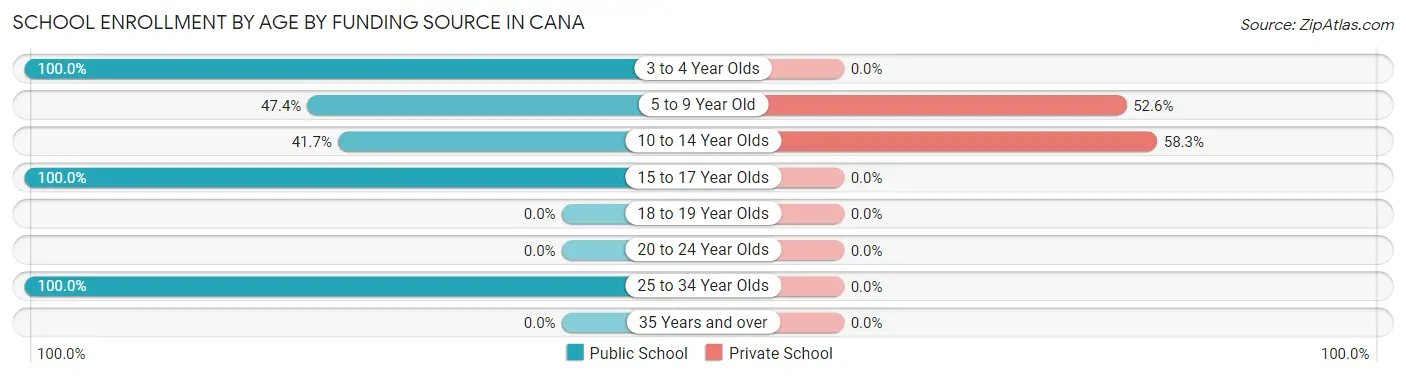
| Age Bracket | Public School | Private School |
| 3 to 4 Year Olds | 41 (100.0%) | 0 (0.0%) |
| 5 to 9 Year Old | 9 (47.4%) | 10 (52.6%) |
| 10 to 14 Year Olds | 30 (41.7%) | 42 (58.3%) |
| 15 to 17 Year Olds | 20 (100.0%) | 0 (0.0%) |
| 18 to 19 Year Olds | 0 (0.0%) | 0 (0.0%) |
| 20 to 24 Year Olds | 0 (0.0%) | 0 (0.0%) |
| 25 to 34 Year Olds | 11 (100.0%) | 0 (0.0%) |
| 35 Years and over | 0 (0.0%) | 0 (0.0%) |
| Total | 111 (68.1%) | 52 (31.9%) |
Educational Attainment by Field of Study in Cana
Bio, nature & agricultural (117 | 36.2%), education (100 | 31.0%), business (29 | 9.0%), arts & humanities (26 | 8.1%), and science & technology (24 | 7.4%) are the most common fields of study among 323 individuals in Cana who have obtained a bachelor's degree or higher.
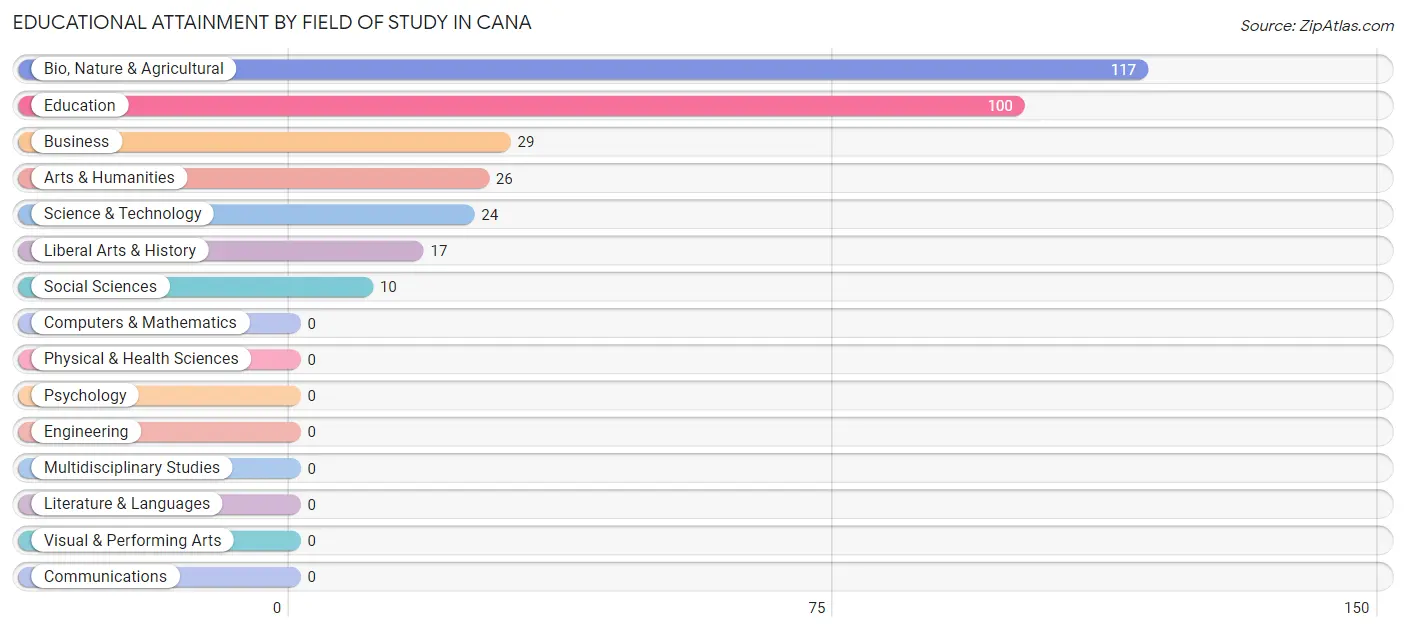
| Field of Study | # Graduates | % Graduates |
| Computers & Mathematics | 0 | 0.0% |
| Bio, Nature & Agricultural | 117 | 36.2% |
| Physical & Health Sciences | 0 | 0.0% |
| Psychology | 0 | 0.0% |
| Social Sciences | 10 | 3.1% |
| Engineering | 0 | 0.0% |
| Multidisciplinary Studies | 0 | 0.0% |
| Science & Technology | 24 | 7.4% |
| Business | 29 | 9.0% |
| Education | 100 | 31.0% |
| Literature & Languages | 0 | 0.0% |
| Liberal Arts & History | 17 | 5.3% |
| Visual & Performing Arts | 0 | 0.0% |
| Communications | 0 | 0.0% |
| Arts & Humanities | 26 | 8.1% |
| Total | 323 | 100.0% |
Transportation & Commute in Cana
Vehicle Availability by Sex in Cana
The most prevalent vehicle ownership categories in Cana are males with 3 vehicles (203, accounting for 50.0%) and females with 3 vehicles (228, making up 57.0%).
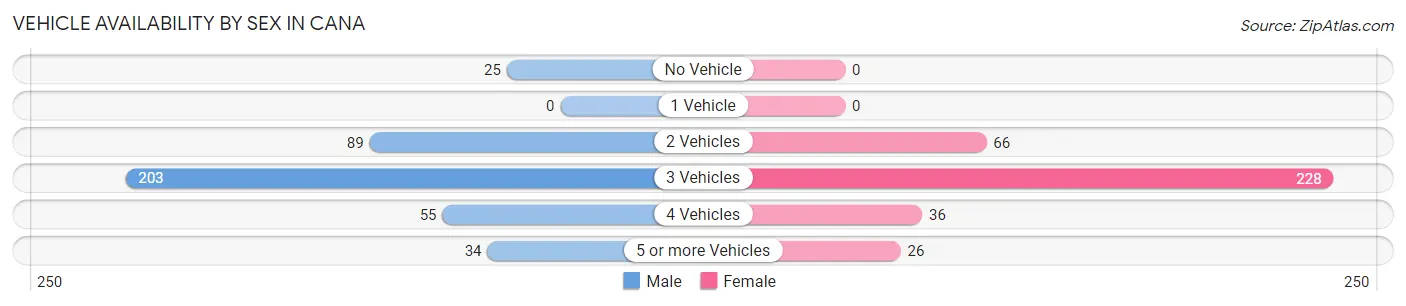
| Vehicles Available | Male | Female |
| No Vehicle | 25 (6.2%) | 0 (0.0%) |
| 1 Vehicle | 0 (0.0%) | 0 (0.0%) |
| 2 Vehicles | 89 (21.9%) | 66 (18.5%) |
| 3 Vehicles | 203 (50.0%) | 228 (64.0%) |
| 4 Vehicles | 55 (13.6%) | 36 (10.1%) |
| 5 or more Vehicles | 34 (8.4%) | 26 (7.3%) |
| Total | 406 (100.0%) | 356 (100.0%) |
Commute Time in Cana
The most frequently occuring commute durations in Cana are 35 to 39 minutes (147 commuters, 19.5%), 20 to 24 minutes (143 commuters, 19.0%), and 45 to 59 minutes (108 commuters, 14.3%).
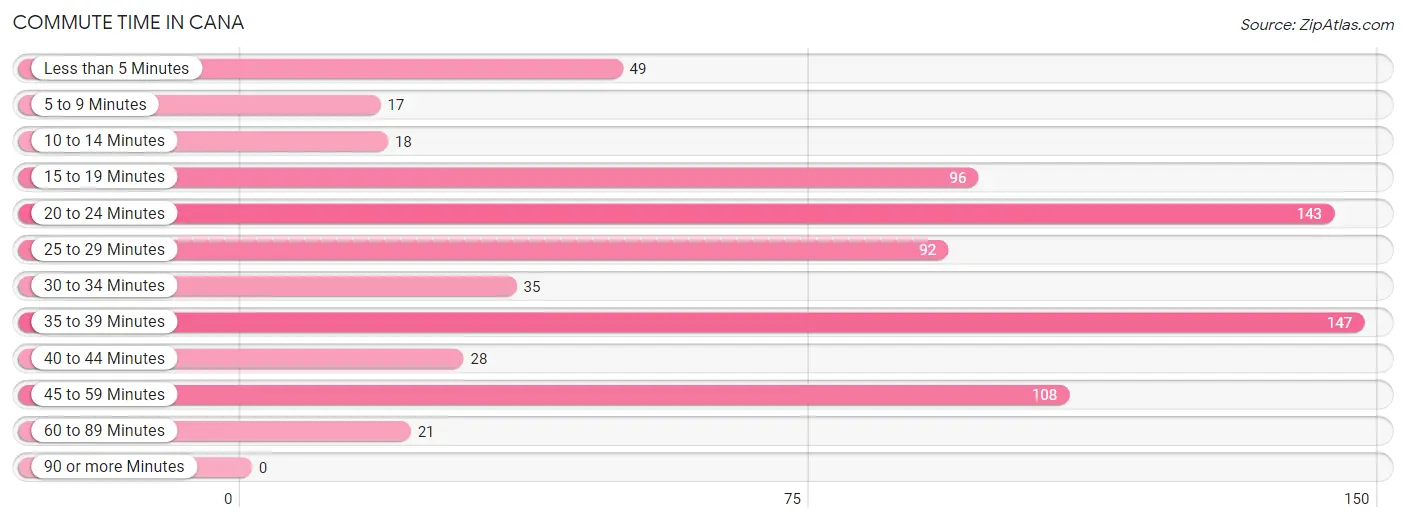
| Commute Time | # Commuters | % Commuters |
| Less than 5 Minutes | 49 | 6.5% |
| 5 to 9 Minutes | 17 | 2.2% |
| 10 to 14 Minutes | 18 | 2.4% |
| 15 to 19 Minutes | 96 | 12.7% |
| 20 to 24 Minutes | 143 | 19.0% |
| 25 to 29 Minutes | 92 | 12.2% |
| 30 to 34 Minutes | 35 | 4.6% |
| 35 to 39 Minutes | 147 | 19.5% |
| 40 to 44 Minutes | 28 | 3.7% |
| 45 to 59 Minutes | 108 | 14.3% |
| 60 to 89 Minutes | 21 | 2.8% |
| 90 or more Minutes | 0 | 0.0% |
Commute Time by Sex in Cana
The most common commute times in Cana are 35 to 39 minutes (135 commuters, 33.9%) for males and 45 to 59 minutes (96 commuters, 27.0%) for females.
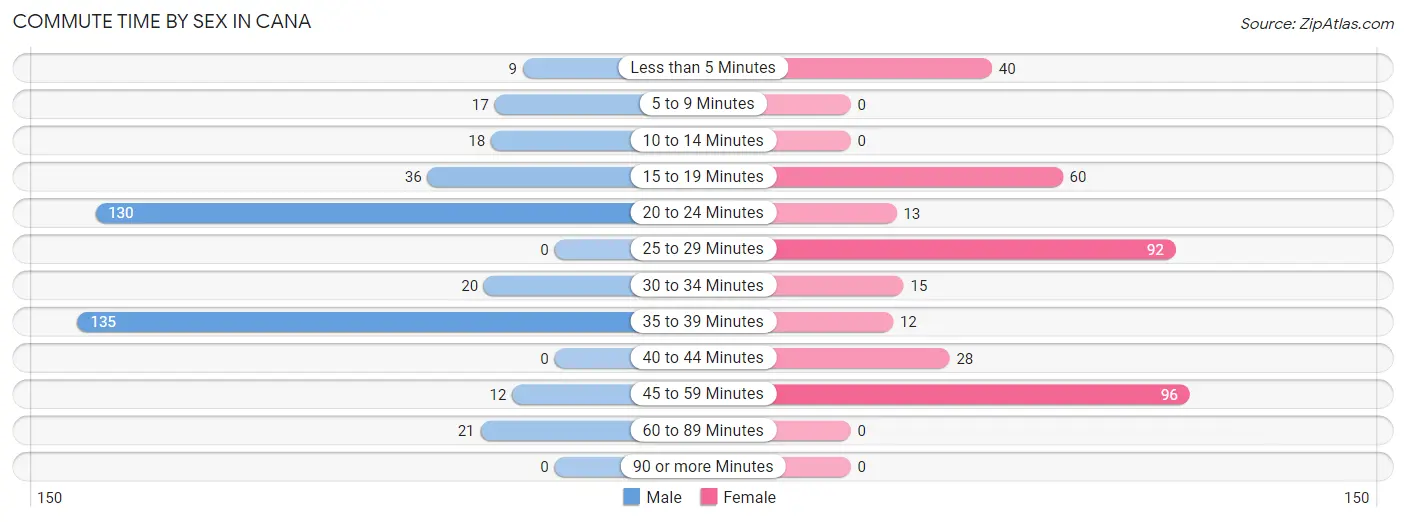
| Commute Time | Male | Female |
| Less than 5 Minutes | 9 (2.3%) | 40 (11.2%) |
| 5 to 9 Minutes | 17 (4.3%) | 0 (0.0%) |
| 10 to 14 Minutes | 18 (4.5%) | 0 (0.0%) |
| 15 to 19 Minutes | 36 (9.0%) | 60 (16.9%) |
| 20 to 24 Minutes | 130 (32.7%) | 13 (3.6%) |
| 25 to 29 Minutes | 0 (0.0%) | 92 (25.8%) |
| 30 to 34 Minutes | 20 (5.0%) | 15 (4.2%) |
| 35 to 39 Minutes | 135 (33.9%) | 12 (3.4%) |
| 40 to 44 Minutes | 0 (0.0%) | 28 (7.9%) |
| 45 to 59 Minutes | 12 (3.0%) | 96 (27.0%) |
| 60 to 89 Minutes | 21 (5.3%) | 0 (0.0%) |
| 90 or more Minutes | 0 (0.0%) | 0 (0.0%) |
Time of Departure to Work by Sex in Cana
The most frequent times of departure to work in Cana are 7:00 AM to 7:29 AM (150, 37.7%) for males and 7:00 AM to 7:29 AM (133, 37.4%) for females.
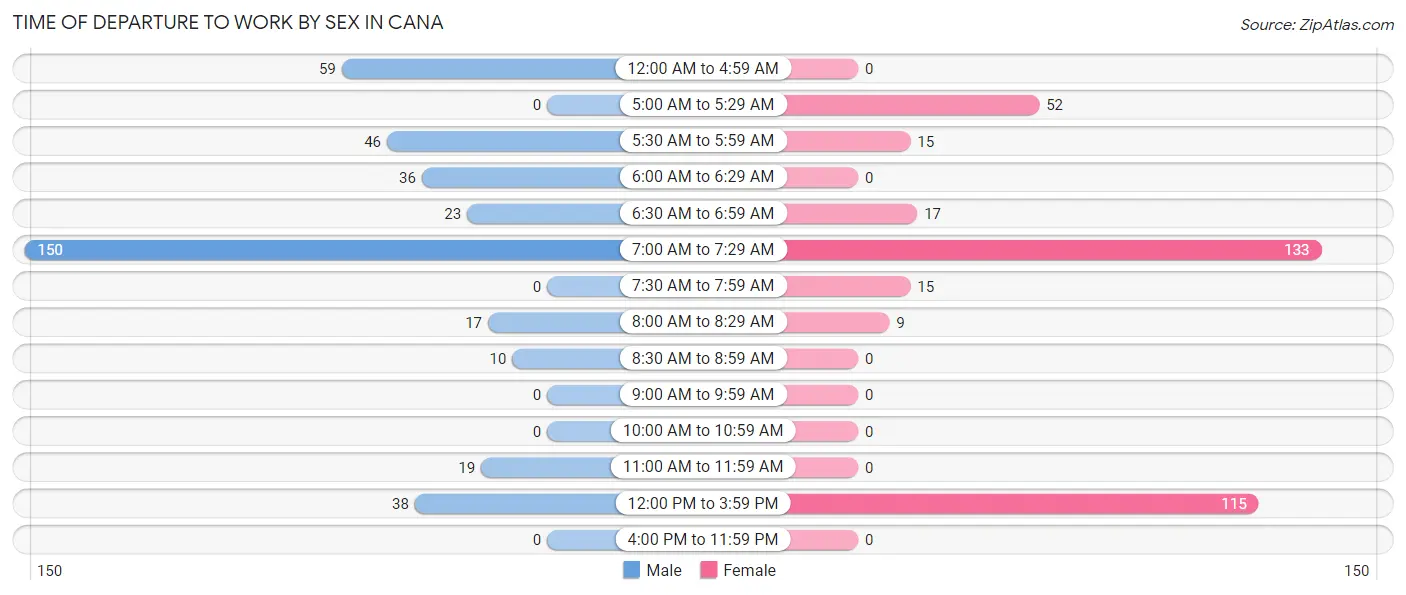
| Time of Departure | Male | Female |
| 12:00 AM to 4:59 AM | 59 (14.8%) | 0 (0.0%) |
| 5:00 AM to 5:29 AM | 0 (0.0%) | 52 (14.6%) |
| 5:30 AM to 5:59 AM | 46 (11.6%) | 15 (4.2%) |
| 6:00 AM to 6:29 AM | 36 (9.0%) | 0 (0.0%) |
| 6:30 AM to 6:59 AM | 23 (5.8%) | 17 (4.8%) |
| 7:00 AM to 7:29 AM | 150 (37.7%) | 133 (37.4%) |
| 7:30 AM to 7:59 AM | 0 (0.0%) | 15 (4.2%) |
| 8:00 AM to 8:29 AM | 17 (4.3%) | 9 (2.5%) |
| 8:30 AM to 8:59 AM | 10 (2.5%) | 0 (0.0%) |
| 9:00 AM to 9:59 AM | 0 (0.0%) | 0 (0.0%) |
| 10:00 AM to 10:59 AM | 0 (0.0%) | 0 (0.0%) |
| 11:00 AM to 11:59 AM | 19 (4.8%) | 0 (0.0%) |
| 12:00 PM to 3:59 PM | 38 (9.6%) | 115 (32.3%) |
| 4:00 PM to 11:59 PM | 0 (0.0%) | 0 (0.0%) |
| Total | 398 (100.0%) | 356 (100.0%) |
Housing Occupancy in Cana
Occupancy by Ownership in Cana
Of the total 512 dwellings in Cana, owner-occupied units account for 368 (71.9%), while renter-occupied units make up 144 (28.1%).
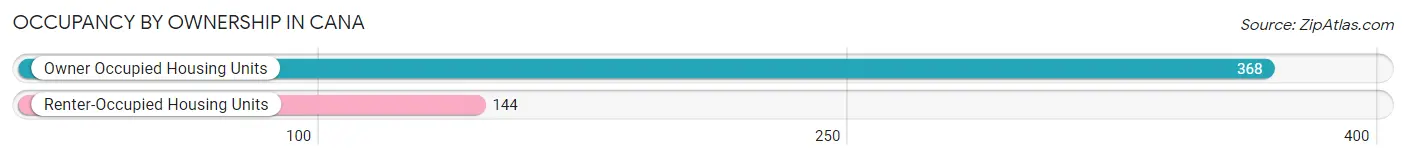
| Occupancy | # Housing Units | % Housing Units |
| Owner Occupied Housing Units | 368 | 71.9% |
| Renter-Occupied Housing Units | 144 | 28.1% |
| Total Occupied Housing Units | 512 | 100.0% |
Occupancy by Household Size in Cana
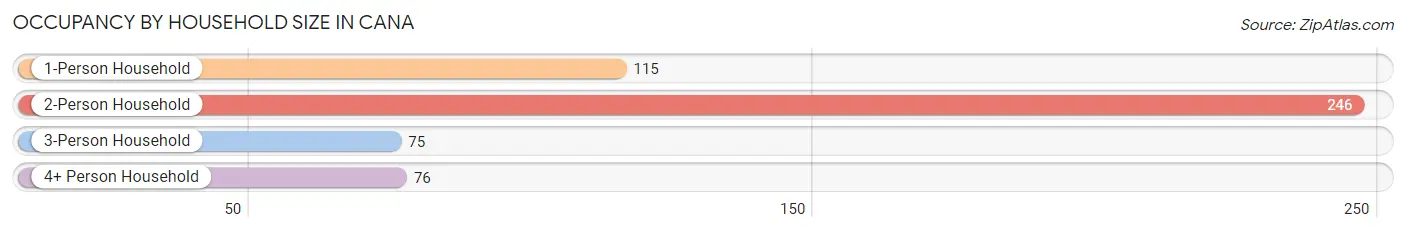
| Household Size | # Housing Units | % Housing Units |
| 1-Person Household | 115 | 22.5% |
| 2-Person Household | 246 | 48.0% |
| 3-Person Household | 75 | 14.6% |
| 4+ Person Household | 76 | 14.8% |
| Total Housing Units | 512 | 100.0% |
Occupancy by Ownership by Household Size in Cana
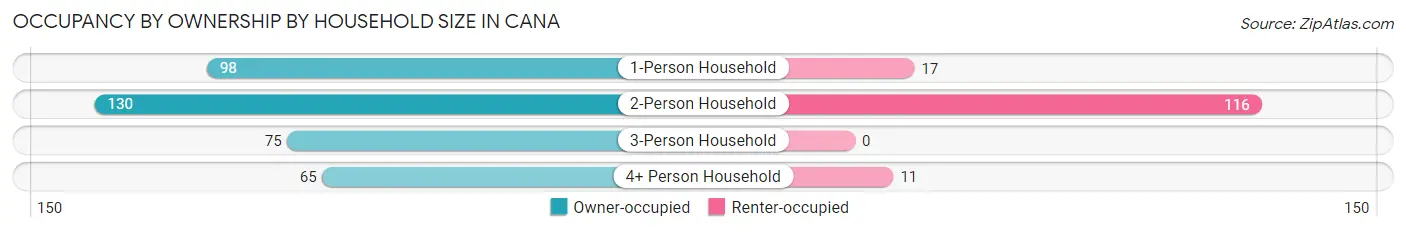
| Household Size | Owner-occupied | Renter-occupied |
| 1-Person Household | 98 (85.2%) | 17 (14.8%) |
| 2-Person Household | 130 (52.8%) | 116 (47.1%) |
| 3-Person Household | 75 (100.0%) | 0 (0.0%) |
| 4+ Person Household | 65 (85.5%) | 11 (14.5%) |
| Total Housing Units | 368 (71.9%) | 144 (28.1%) |
Occupancy by Educational Attainment in Cana
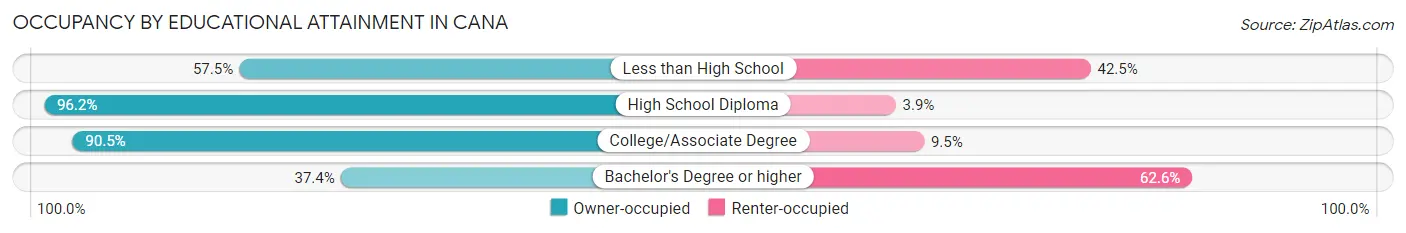
| Household Size | Owner-occupied | Renter-occupied |
| Less than High School | 23 (57.5%) | 17 (42.5%) |
| High School Diploma | 175 (96.2%) | 7 (3.8%) |
| College/Associate Degree | 105 (90.5%) | 11 (9.5%) |
| Bachelor's Degree or higher | 65 (37.4%) | 109 (62.6%) |
Occupancy by Age of Householder in Cana
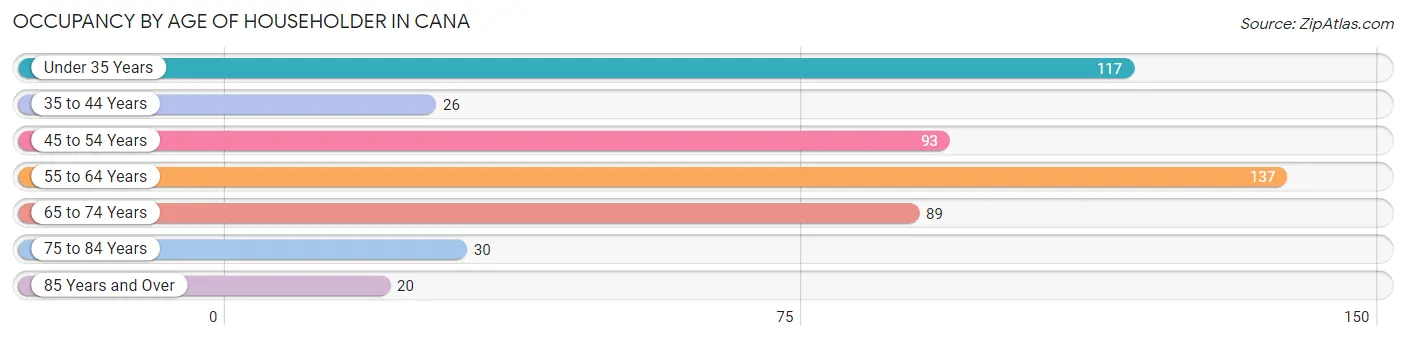
| Age Bracket | # Households | % Households |
| Under 35 Years | 117 | 22.9% |
| 35 to 44 Years | 26 | 5.1% |
| 45 to 54 Years | 93 | 18.2% |
| 55 to 64 Years | 137 | 26.8% |
| 65 to 74 Years | 89 | 17.4% |
| 75 to 84 Years | 30 | 5.9% |
| 85 Years and Over | 20 | 3.9% |
| Total | 512 | 100.0% |
Housing Finances in Cana
Median Income by Occupancy in Cana
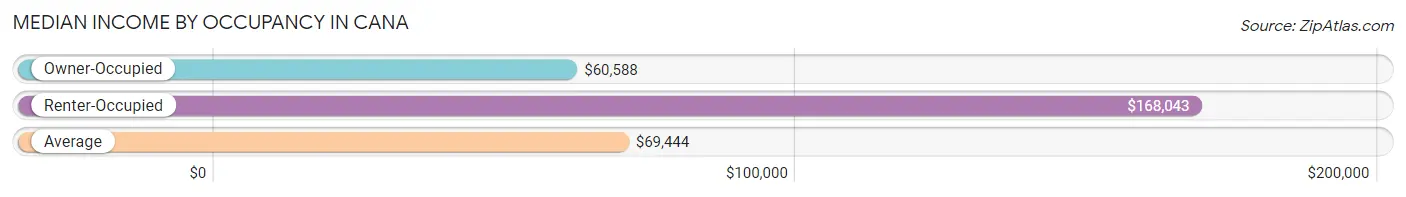
| Occupancy Type | # Households | Median Income |
| Owner-Occupied | 368 (71.9%) | $60,588 |
| Renter-Occupied | 144 (28.1%) | $168,043 |
| Average | 512 (100.0%) | $69,444 |
Occupancy by Householder Income Bracket in Cana
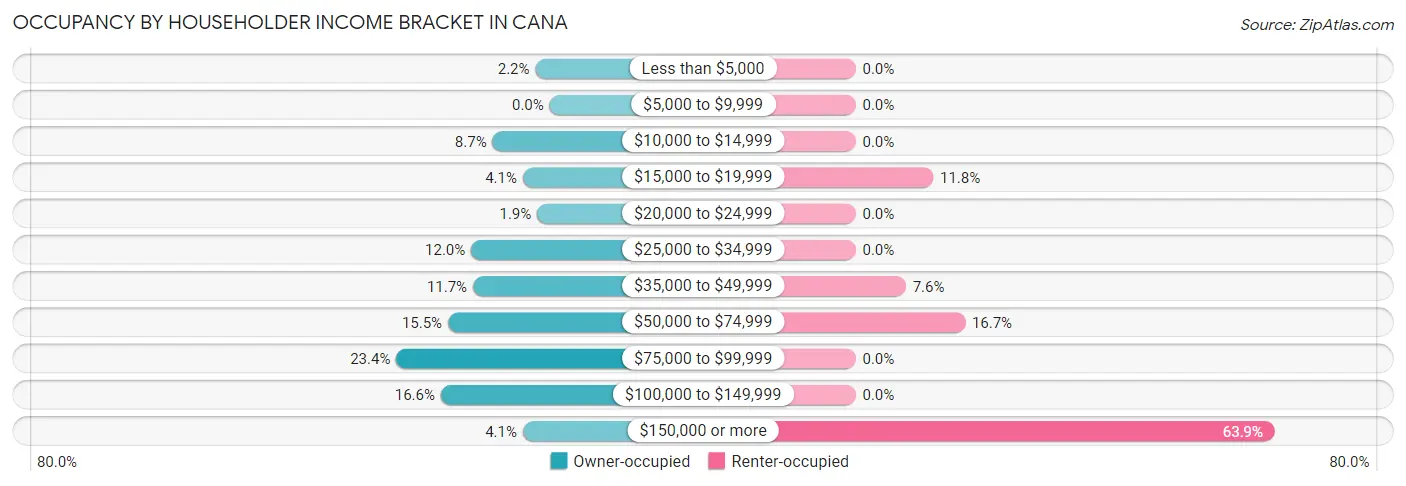
| Income Bracket | Owner-occupied | Renter-occupied |
| Less than $5,000 | 8 (2.2%) | 0 (0.0%) |
| $5,000 to $9,999 | 0 (0.0%) | 0 (0.0%) |
| $10,000 to $14,999 | 32 (8.7%) | 0 (0.0%) |
| $15,000 to $19,999 | 15 (4.1%) | 17 (11.8%) |
| $20,000 to $24,999 | 7 (1.9%) | 0 (0.0%) |
| $25,000 to $34,999 | 44 (12.0%) | 0 (0.0%) |
| $35,000 to $49,999 | 43 (11.7%) | 11 (7.6%) |
| $50,000 to $74,999 | 57 (15.5%) | 24 (16.7%) |
| $75,000 to $99,999 | 86 (23.4%) | 0 (0.0%) |
| $100,000 to $149,999 | 61 (16.6%) | 0 (0.0%) |
| $150,000 or more | 15 (4.1%) | 92 (63.9%) |
| Total | 368 (100.0%) | 144 (100.0%) |
Monthly Housing Cost Tiers in Cana
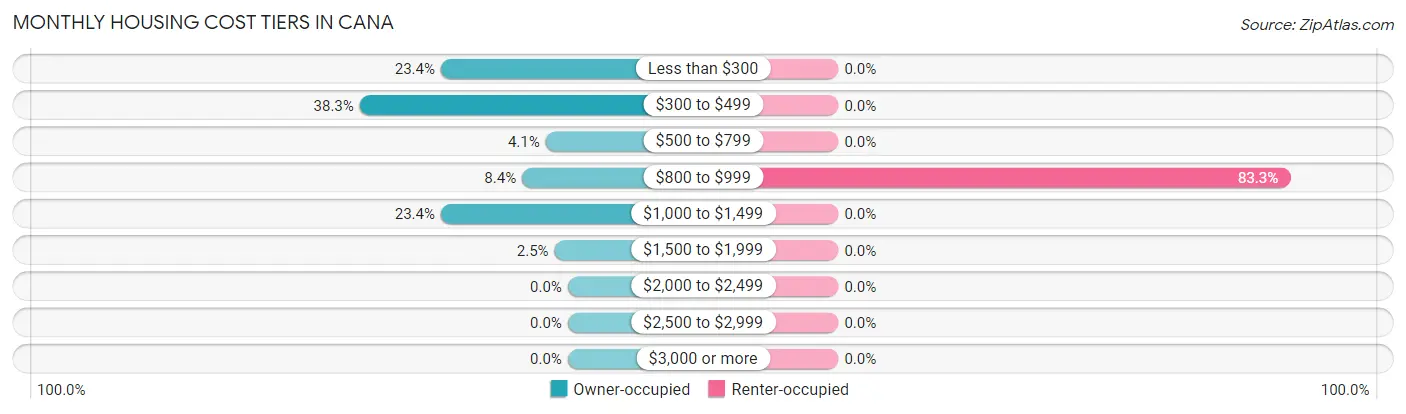
| Monthly Cost | Owner-occupied | Renter-occupied |
| Less than $300 | 86 (23.4%) | 0 (0.0%) |
| $300 to $499 | 141 (38.3%) | 0 (0.0%) |
| $500 to $799 | 15 (4.1%) | 0 (0.0%) |
| $800 to $999 | 31 (8.4%) | 120 (83.3%) |
| $1,000 to $1,499 | 86 (23.4%) | 0 (0.0%) |
| $1,500 to $1,999 | 9 (2.5%) | 0 (0.0%) |
| $2,000 to $2,499 | 0 (0.0%) | 0 (0.0%) |
| $2,500 to $2,999 | 0 (0.0%) | 0 (0.0%) |
| $3,000 or more | 0 (0.0%) | 0 (0.0%) |
| Total | 368 (100.0%) | 144 (100.0%) |
Physical Housing Characteristics in Cana
Housing Structures in Cana
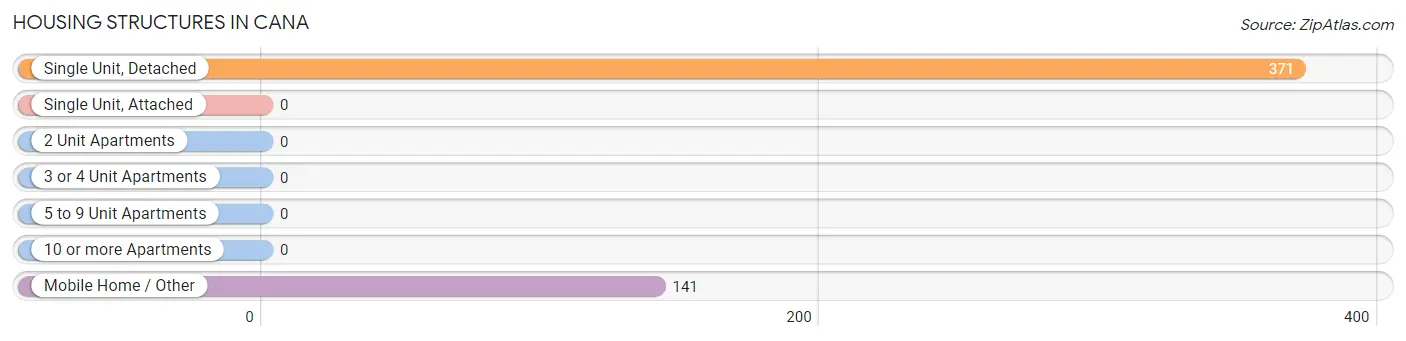
| Structure Type | # Housing Units | % Housing Units |
| Single Unit, Detached | 371 | 72.5% |
| Single Unit, Attached | 0 | 0.0% |
| 2 Unit Apartments | 0 | 0.0% |
| 3 or 4 Unit Apartments | 0 | 0.0% |
| 5 to 9 Unit Apartments | 0 | 0.0% |
| 10 or more Apartments | 0 | 0.0% |
| Mobile Home / Other | 141 | 27.5% |
| Total | 512 | 100.0% |
Housing Structures by Occupancy in Cana
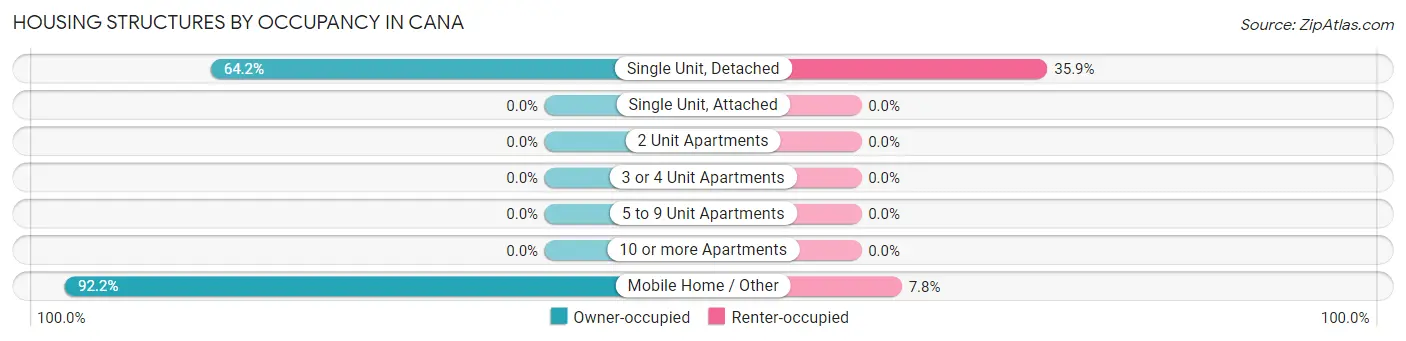
| Structure Type | Owner-occupied | Renter-occupied |
| Single Unit, Detached | 238 (64.1%) | 133 (35.8%) |
| Single Unit, Attached | 0 (0.0%) | 0 (0.0%) |
| 2 Unit Apartments | 0 (0.0%) | 0 (0.0%) |
| 3 or 4 Unit Apartments | 0 (0.0%) | 0 (0.0%) |
| 5 to 9 Unit Apartments | 0 (0.0%) | 0 (0.0%) |
| 10 or more Apartments | 0 (0.0%) | 0 (0.0%) |
| Mobile Home / Other | 130 (92.2%) | 11 (7.8%) |
| Total | 368 (71.9%) | 144 (28.1%) |
Housing Structures by Number of Rooms in Cana
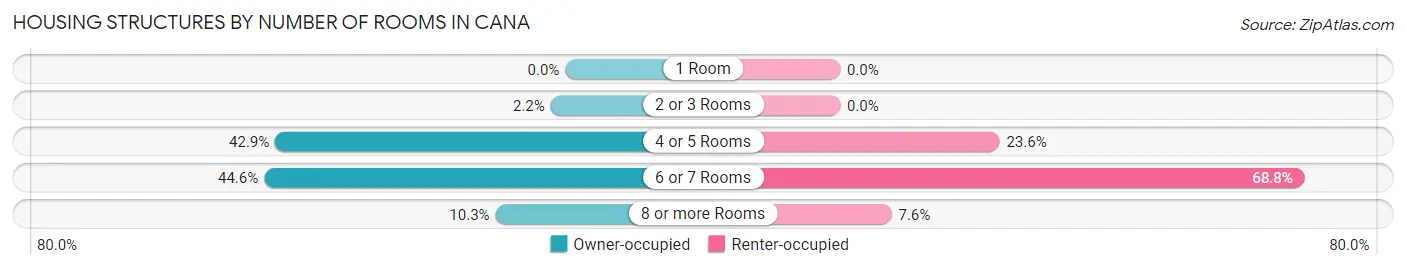
| Number of Rooms | Owner-occupied | Renter-occupied |
| 1 Room | 0 (0.0%) | 0 (0.0%) |
| 2 or 3 Rooms | 8 (2.2%) | 0 (0.0%) |
| 4 or 5 Rooms | 158 (42.9%) | 34 (23.6%) |
| 6 or 7 Rooms | 164 (44.6%) | 99 (68.8%) |
| 8 or more Rooms | 38 (10.3%) | 11 (7.6%) |
| Total | 368 (100.0%) | 144 (100.0%) |
Housing Structure by Heating Type in Cana
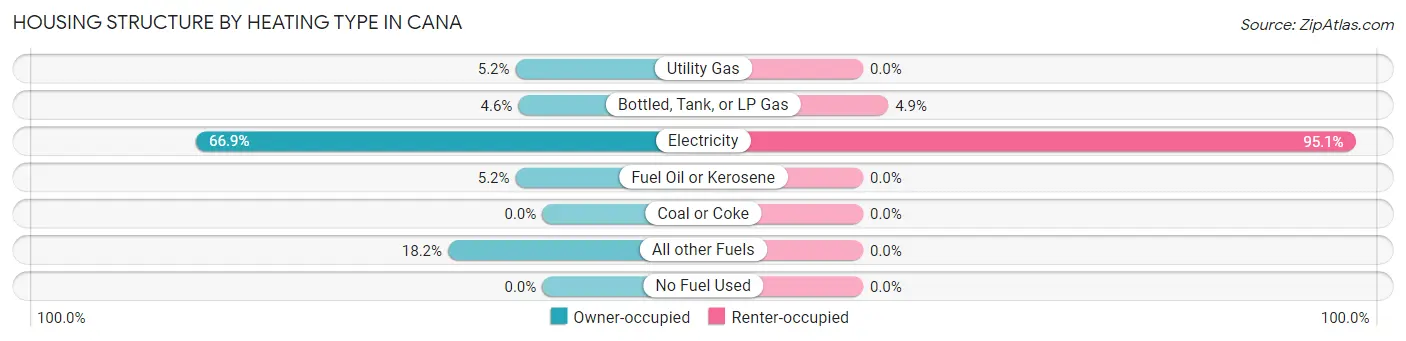
| Heating Type | Owner-occupied | Renter-occupied |
| Utility Gas | 19 (5.2%) | 0 (0.0%) |
| Bottled, Tank, or LP Gas | 17 (4.6%) | 7 (4.9%) |
| Electricity | 246 (66.8%) | 137 (95.1%) |
| Fuel Oil or Kerosene | 19 (5.2%) | 0 (0.0%) |
| Coal or Coke | 0 (0.0%) | 0 (0.0%) |
| All other Fuels | 67 (18.2%) | 0 (0.0%) |
| No Fuel Used | 0 (0.0%) | 0 (0.0%) |
| Total | 368 (100.0%) | 144 (100.0%) |
Household Vehicle Usage in Cana
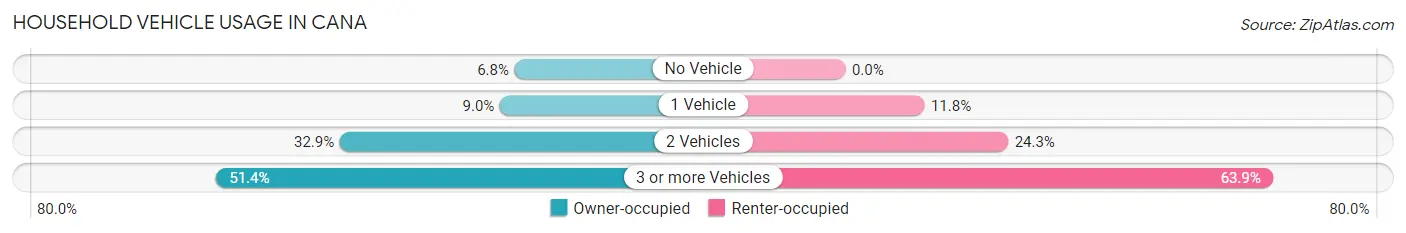
| Vehicles per Household | Owner-occupied | Renter-occupied |
| No Vehicle | 25 (6.8%) | 0 (0.0%) |
| 1 Vehicle | 33 (9.0%) | 17 (11.8%) |
| 2 Vehicles | 121 (32.9%) | 35 (24.3%) |
| 3 or more Vehicles | 189 (51.4%) | 92 (63.9%) |
| Total | 368 (100.0%) | 144 (100.0%) |
Real Estate & Mortgages in Cana
Real Estate and Mortgage Overview in Cana
| Characteristic | Without Mortgage | With Mortgage |
| Housing Units | 232 | 136 |
| Median Property Value | $93,500 | $122,100 |
| Median Household Income | $46,935 | $15 |
| Monthly Housing Costs | $361 | $0 |
| Real Estate Taxes | $922 | $0 |
Property Value by Mortgage Status in Cana
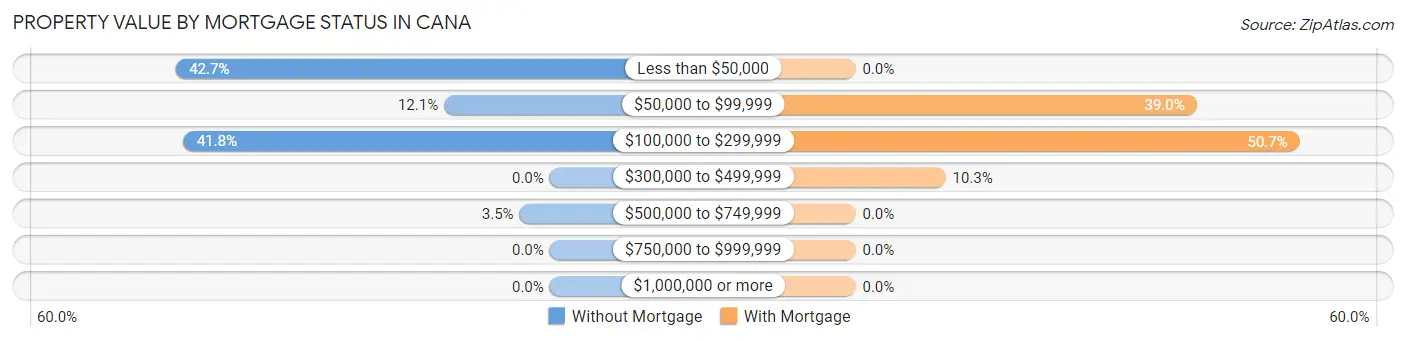
| Property Value | Without Mortgage | With Mortgage |
| Less than $50,000 | 99 (42.7%) | 0 (0.0%) |
| $50,000 to $99,999 | 28 (12.1%) | 53 (39.0%) |
| $100,000 to $299,999 | 97 (41.8%) | 69 (50.7%) |
| $300,000 to $499,999 | 0 (0.0%) | 14 (10.3%) |
| $500,000 to $749,999 | 8 (3.5%) | 0 (0.0%) |
| $750,000 to $999,999 | 0 (0.0%) | 0 (0.0%) |
| $1,000,000 or more | 0 (0.0%) | 0 (0.0%) |
| Total | 232 (100.0%) | 136 (100.0%) |
Household Income by Mortgage Status in Cana
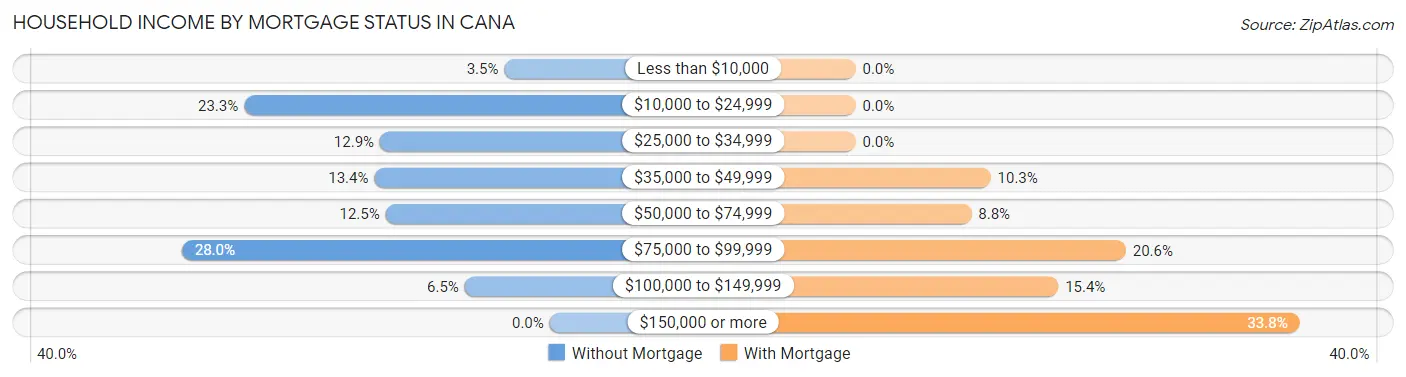
| Household Income | Without Mortgage | With Mortgage |
| Less than $10,000 | 8 (3.5%) | 0 (0.0%) |
| $10,000 to $24,999 | 54 (23.3%) | 0 (0.0%) |
| $25,000 to $34,999 | 30 (12.9%) | 0 (0.0%) |
| $35,000 to $49,999 | 31 (13.4%) | 14 (10.3%) |
| $50,000 to $74,999 | 29 (12.5%) | 12 (8.8%) |
| $75,000 to $99,999 | 65 (28.0%) | 28 (20.6%) |
| $100,000 to $149,999 | 15 (6.5%) | 21 (15.4%) |
| $150,000 or more | 0 (0.0%) | 46 (33.8%) |
| Total | 232 (100.0%) | 136 (100.0%) |
Property Value to Household Income Ratio in Cana
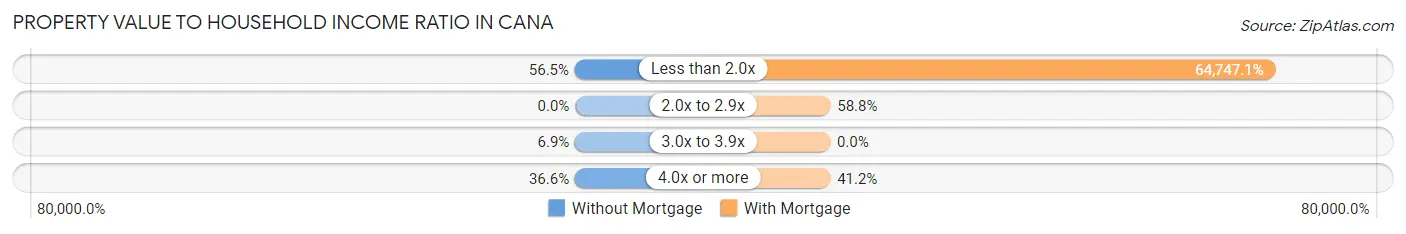
| Value-to-Income Ratio | Without Mortgage | With Mortgage |
| Less than 2.0x | 131 (56.5%) | 88,056 (64,747.1%) |
| 2.0x to 2.9x | 0 (0.0%) | 80 (58.8%) |
| 3.0x to 3.9x | 16 (6.9%) | 0 (0.0%) |
| 4.0x or more | 85 (36.6%) | 56 (41.2%) |
| Total | 232 (100.0%) | 136 (100.0%) |
Real Estate Taxes by Mortgage Status in Cana
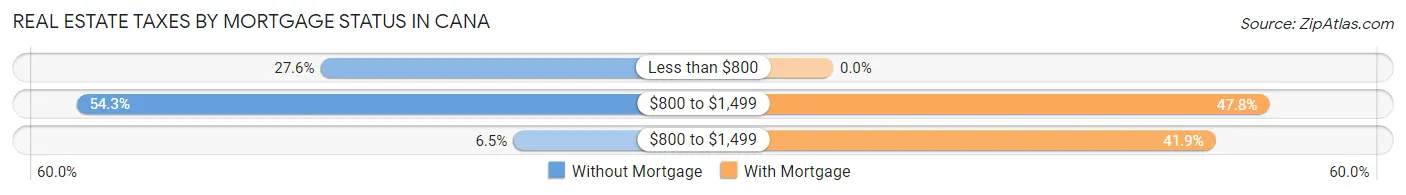
| Property Taxes | Without Mortgage | With Mortgage |
| Less than $800 | 64 (27.6%) | 0 (0.0%) |
| $800 to $1,499 | 126 (54.3%) | 65 (47.8%) |
| $800 to $1,499 | 15 (6.5%) | 57 (41.9%) |
| Total | 232 (100.0%) | 136 (100.0%) |
Health & Disability in Cana
Health Insurance Coverage by Age in Cana
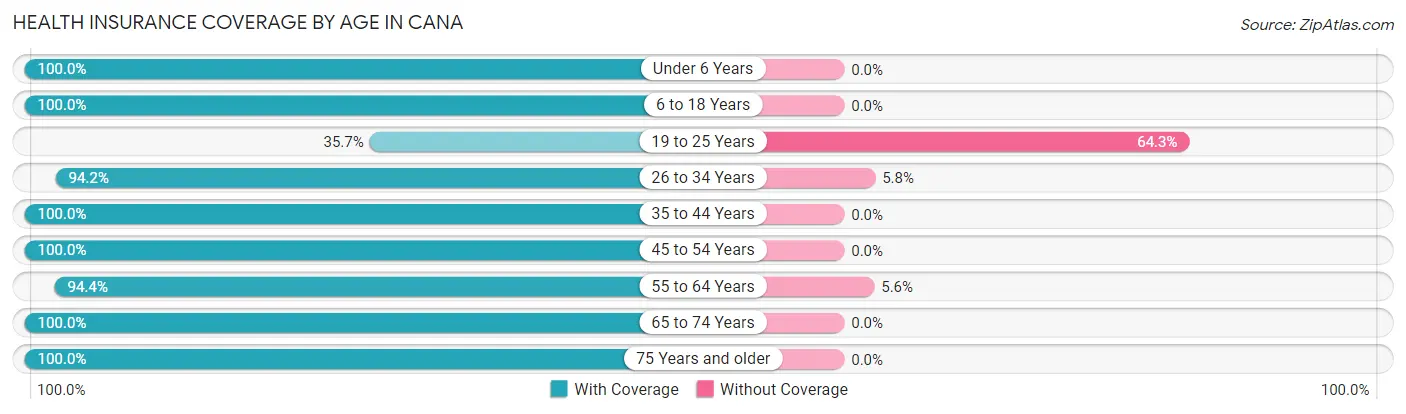
| Age Bracket | With Coverage | Without Coverage |
| Under 6 Years | 111 (100.0%) | 0 (0.0%) |
| 6 to 18 Years | 111 (100.0%) | 0 (0.0%) |
| 19 to 25 Years | 56 (35.7%) | 101 (64.3%) |
| 26 to 34 Years | 147 (94.2%) | 9 (5.8%) |
| 35 to 44 Years | 170 (100.0%) | 0 (0.0%) |
| 45 to 54 Years | 148 (100.0%) | 0 (0.0%) |
| 55 to 64 Years | 270 (94.4%) | 16 (5.6%) |
| 65 to 74 Years | 124 (100.0%) | 0 (0.0%) |
| 75 Years and older | 67 (100.0%) | 0 (0.0%) |
| Total | 1,204 (90.5%) | 126 (9.5%) |
Health Insurance Coverage by Citizenship Status in Cana
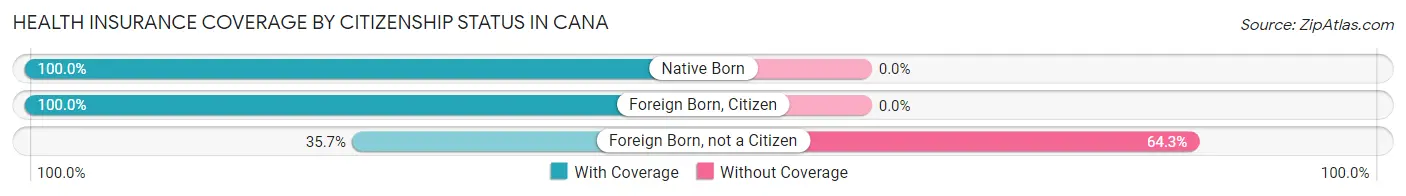
| Citizenship Status | With Coverage | Without Coverage |
| Native Born | 111 (100.0%) | 0 (0.0%) |
| Foreign Born, Citizen | 111 (100.0%) | 0 (0.0%) |
| Foreign Born, not a Citizen | 56 (35.7%) | 101 (64.3%) |
Health Insurance Coverage by Household Income in Cana
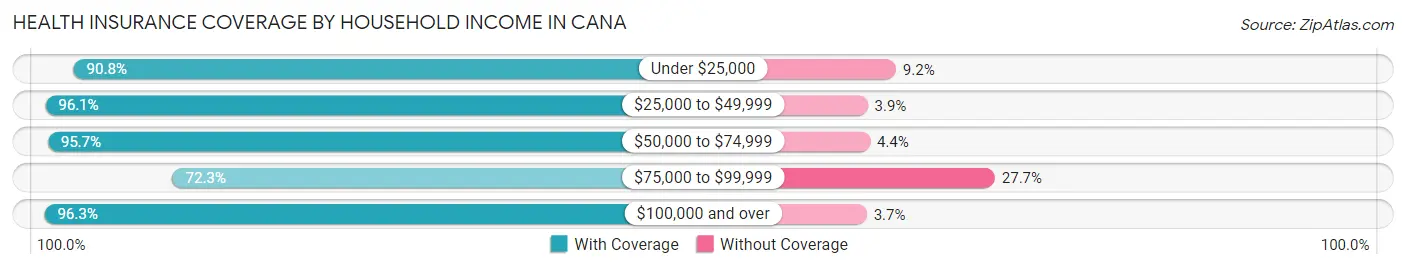
| Household Income | With Coverage | Without Coverage |
| Under $25,000 | 79 (90.8%) | 8 (9.2%) |
| $25,000 to $49,999 | 222 (96.1%) | 9 (3.9%) |
| $50,000 to $74,999 | 176 (95.7%) | 8 (4.3%) |
| $75,000 to $99,999 | 211 (72.3%) | 81 (27.7%) |
| $100,000 and over | 516 (96.3%) | 20 (3.7%) |
Public vs Private Health Insurance Coverage by Age in Cana
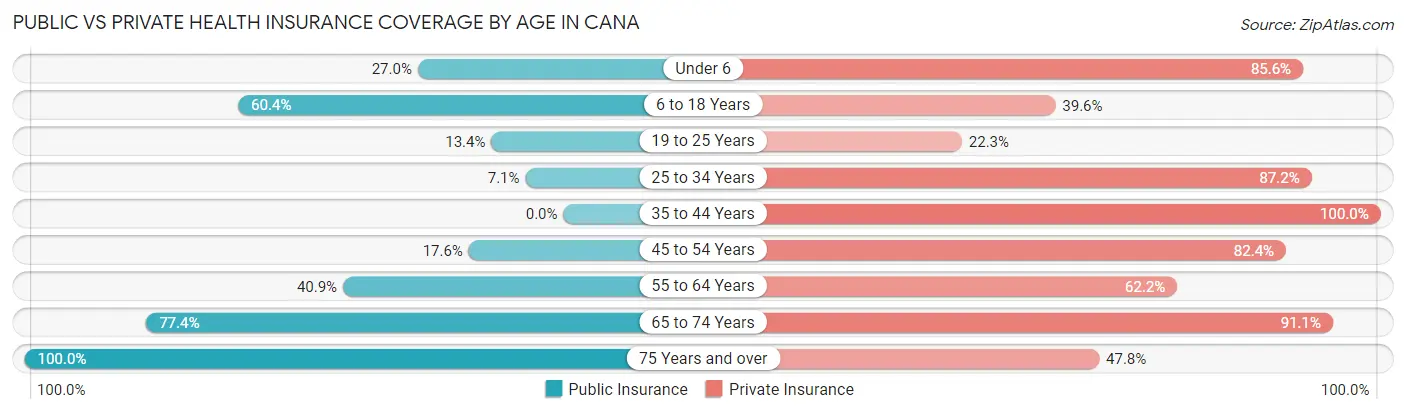
| Age Bracket | Public Insurance | Private Insurance |
| Under 6 | 30 (27.0%) | 95 (85.6%) |
| 6 to 18 Years | 67 (60.4%) | 44 (39.6%) |
| 19 to 25 Years | 21 (13.4%) | 35 (22.3%) |
| 25 to 34 Years | 11 (7.0%) | 136 (87.2%) |
| 35 to 44 Years | 0 (0.0%) | 170 (100.0%) |
| 45 to 54 Years | 26 (17.6%) | 122 (82.4%) |
| 55 to 64 Years | 117 (40.9%) | 178 (62.2%) |
| 65 to 74 Years | 96 (77.4%) | 113 (91.1%) |
| 75 Years and over | 67 (100.0%) | 32 (47.8%) |
| Total | 435 (32.7%) | 925 (69.6%) |
Disability Status by Sex by Age in Cana
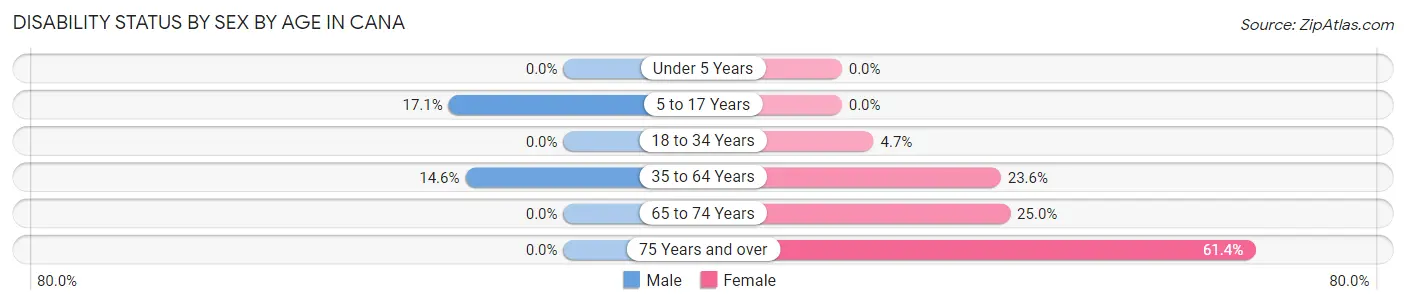
| Age Bracket | Male | Female |
| Under 5 Years | 0 (0.0%) | 0 (0.0%) |
| 5 to 17 Years | 15 (17.1%) | 0 (0.0%) |
| 18 to 34 Years | 0 (0.0%) | 11 (4.7%) |
| 35 to 64 Years | 54 (14.6%) | 55 (23.6%) |
| 65 to 74 Years | 0 (0.0%) | 17 (25.0%) |
| 75 Years and over | 0 (0.0%) | 27 (61.4%) |
Disability Class by Sex by Age in Cana
Disability Class: Hearing Difficulty
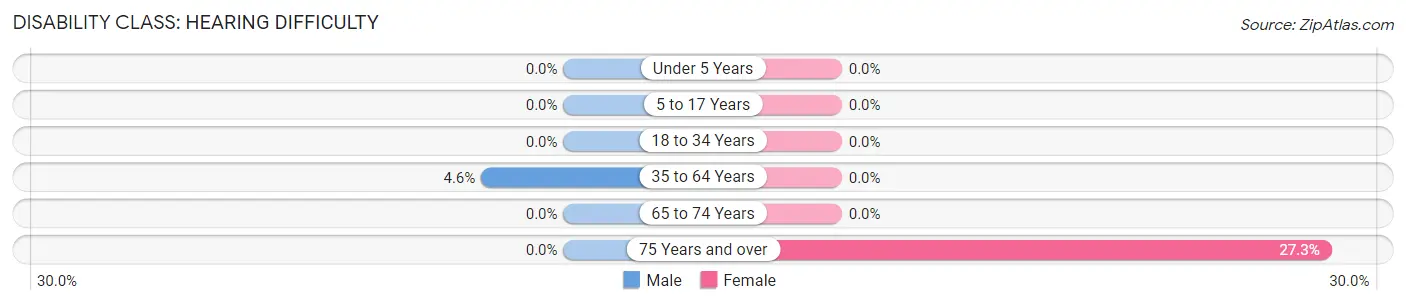
| Age Bracket | Male | Female |
| Under 5 Years | 0 (0.0%) | 0 (0.0%) |
| 5 to 17 Years | 0 (0.0%) | 0 (0.0%) |
| 18 to 34 Years | 0 (0.0%) | 0 (0.0%) |
| 35 to 64 Years | 17 (4.6%) | 0 (0.0%) |
| 65 to 74 Years | 0 (0.0%) | 0 (0.0%) |
| 75 Years and over | 0 (0.0%) | 12 (27.3%) |
Disability Class: Vision Difficulty
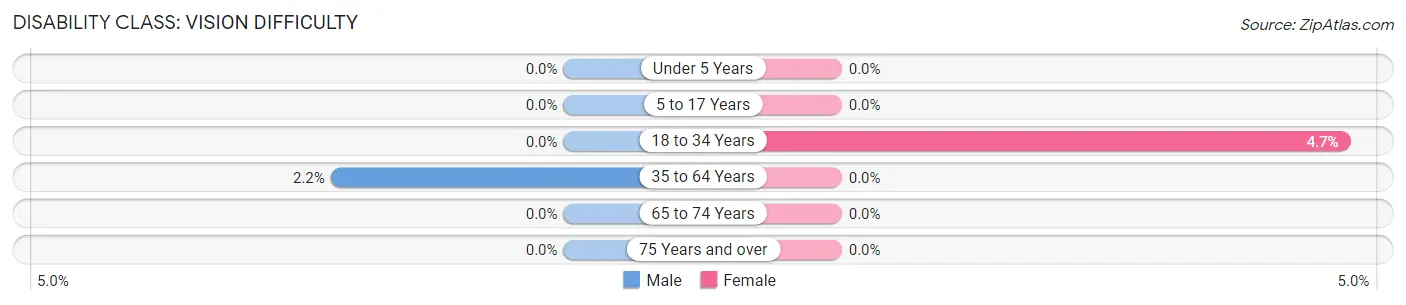
| Age Bracket | Male | Female |
| Under 5 Years | 0 (0.0%) | 0 (0.0%) |
| 5 to 17 Years | 0 (0.0%) | 0 (0.0%) |
| 18 to 34 Years | 0 (0.0%) | 11 (4.7%) |
| 35 to 64 Years | 8 (2.2%) | 0 (0.0%) |
| 65 to 74 Years | 0 (0.0%) | 0 (0.0%) |
| 75 Years and over | 0 (0.0%) | 0 (0.0%) |
Disability Class: Cognitive Difficulty
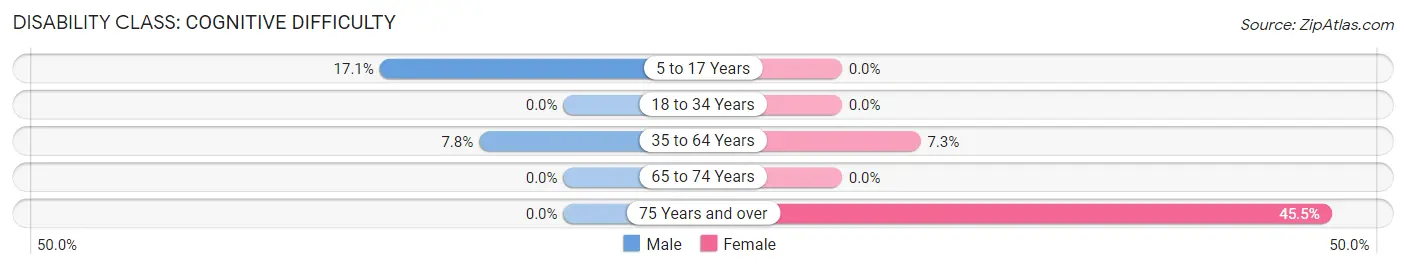
| Age Bracket | Male | Female |
| 5 to 17 Years | 15 (17.1%) | 0 (0.0%) |
| 18 to 34 Years | 0 (0.0%) | 0 (0.0%) |
| 35 to 64 Years | 29 (7.8%) | 17 (7.3%) |
| 65 to 74 Years | 0 (0.0%) | 0 (0.0%) |
| 75 Years and over | 0 (0.0%) | 20 (45.5%) |
Disability Class: Ambulatory Difficulty
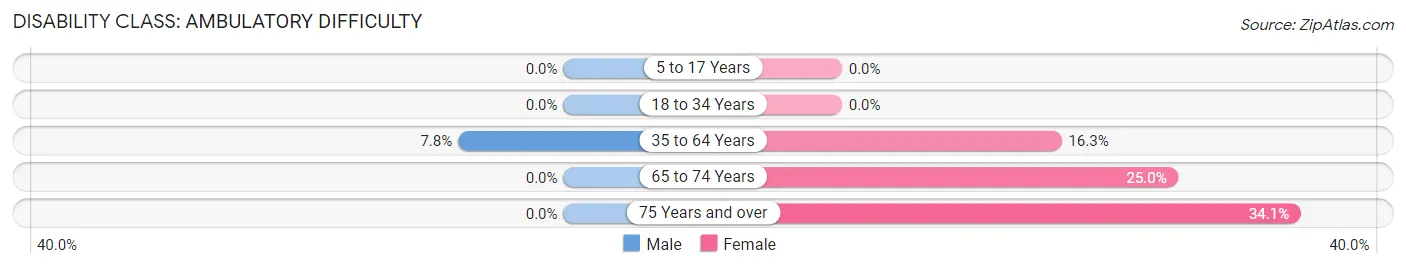
| Age Bracket | Male | Female |
| 5 to 17 Years | 0 (0.0%) | 0 (0.0%) |
| 18 to 34 Years | 0 (0.0%) | 0 (0.0%) |
| 35 to 64 Years | 29 (7.8%) | 38 (16.3%) |
| 65 to 74 Years | 0 (0.0%) | 17 (25.0%) |
| 75 Years and over | 0 (0.0%) | 15 (34.1%) |
Disability Class: Self-Care Difficulty
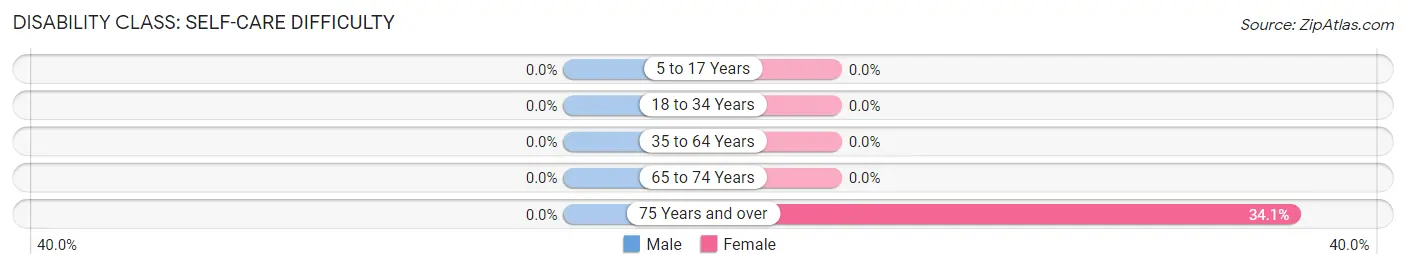
| Age Bracket | Male | Female |
| 5 to 17 Years | 0 (0.0%) | 0 (0.0%) |
| 18 to 34 Years | 0 (0.0%) | 0 (0.0%) |
| 35 to 64 Years | 0 (0.0%) | 0 (0.0%) |
| 65 to 74 Years | 0 (0.0%) | 0 (0.0%) |
| 75 Years and over | 0 (0.0%) | 15 (34.1%) |
Technology Access in Cana
Computing Device Access in Cana
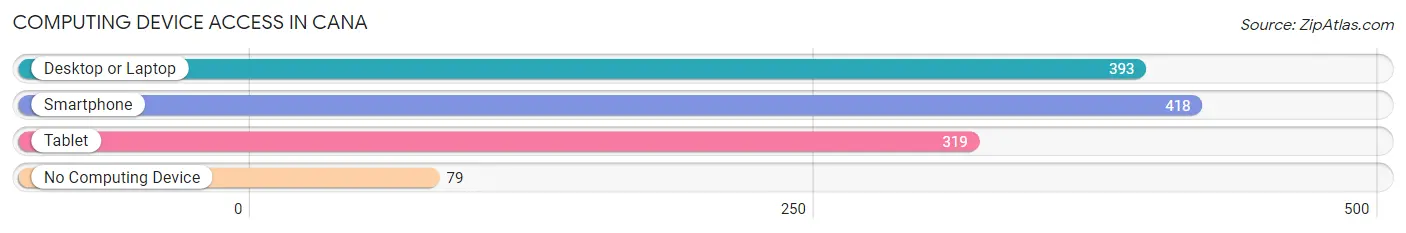
| Device Type | # Households | % Households |
| Desktop or Laptop | 393 | 76.8% |
| Smartphone | 418 | 81.6% |
| Tablet | 319 | 62.3% |
| No Computing Device | 79 | 15.4% |
| Total | 512 | 100.0% |
Internet Access in Cana
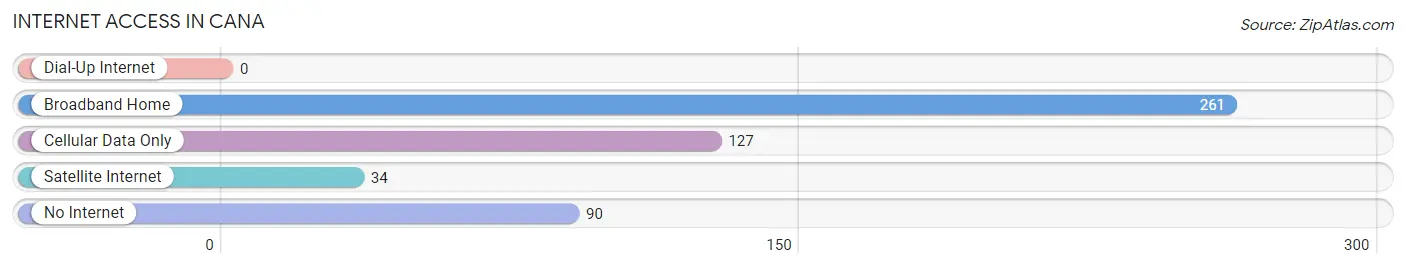
| Internet Type | # Households | % Households |
| Dial-Up Internet | 0 | 0.0% |
| Broadband Home | 261 | 51.0% |
| Cellular Data Only | 127 | 24.8% |
| Satellite Internet | 34 | 6.6% |
| No Internet | 90 | 17.6% |
| Total | 512 | 100.0% |
Cana Summary
Cana is a small town located in Carroll County, Virginia. It is situated in the Blue Ridge Mountains and is part of the Mount Rogers National Recreation Area. The town has a population of approximately 1,000 people and is known for its rural charm and scenic beauty.
Geography
Cana is located in the Blue Ridge Mountains of southwestern Virginia. It is situated in the Mount Rogers National Recreation Area, which is a popular destination for outdoor recreation. The town is surrounded by the New River, which is a major tributary of the Roanoke River. The town is also located near the Appalachian Trail, which is a popular hiking destination.
The town is located at an elevation of 1,800 feet and has a total area of 0.7 square miles. The terrain is mostly mountainous and is covered with forests. The climate is humid and subtropical, with hot summers and mild winters.
Economy
Cana is a small, rural town with a limited economy. The town is home to several small businesses, including a grocery store, a hardware store, and a few restaurants. The town also has a few small manufacturing companies that produce furniture and other wood products.
The town is also home to several farms, which produce a variety of crops, including corn, soybeans, and hay. The town also has a few wineries, which produce a variety of wines.
Demographics
As of the 2010 census, the population of Cana was 1,000 people. The racial makeup of the town was 97.2% White, 0.7% African American, 0.3% Native American, 0.2% Asian, and 1.6% from other races. The median household income was $35,000, and the median family income was $41,000.
The town has a high rate of poverty, with 28.3% of the population living below the poverty line. The town also has a high rate of unemployment, with 8.3% of the population unemployed.
Conclusion
Cana is a small, rural town located in the Blue Ridge Mountains of southwestern Virginia. The town has a population of approximately 1,000 people and is known for its rural charm and scenic beauty. The town has a limited economy, with several small businesses and farms. The town also has a high rate of poverty and unemployment. Despite these challenges, Cana is a beautiful and peaceful place to live and visit.
Common Questions
What is Per Capita Income in Cana?
Per Capita income in Cana is $36,062.
What is the Median Family Income in Cana?
Median Family Income in Cana is $95,435.
What is the Median Household income in Cana?
Median Household Income in Cana is $69,444.
What is Income or Wage Gap in Cana?
Income or Wage Gap in Cana is 22.2%.
Women in Cana earn 77.8 cents for every dollar earned by a man.
What is Inequality or Gini Index in Cana?
Inequality or Gini Index in Cana is 0.36.
What is the Total Population of Cana?
Total Population of Cana is 1,330.
What is the Total Male Population of Cana?
Total Male Population of Cana is 715.
What is the Total Female Population of Cana?
Total Female Population of Cana is 615.
What is the Ratio of Males per 100 Females in Cana?
There are 116.26 Males per 100 Females in Cana.
What is the Ratio of Females per 100 Males in Cana?
There are 86.01 Females per 100 Males in Cana.
What is the Median Population Age in Cana?
Median Population Age in Cana is 37.9 Years.
What is the Average Family Size in Cana
Average Family Size in Cana is 3.1 People.
What is the Average Household Size in Cana
Average Household Size in Cana is 2.6 People.
How Large is the Labor Force in Cana?
There are 797 People in the Labor Forcein in Cana.
What is the Percentage of People in the Labor Force in Cana?
70.7% of People are in the Labor Force in Cana.
What is the Unemployment Rate in Cana?
Unemployment Rate in Cana is 2.1%.