Union Hall, VA Map & Demographics
Union Hall Map
Union Hall Overview
$78,214
PER CAPITA INCOME
$121,458
AVG FAMILY INCOME
$108,750
AVG HOUSEHOLD INCOME
59.4%
WAGE / INCOME GAP [ % ]
40.6¢/ $1
WAGE / INCOME GAP [ $ ]
0.50
INEQUALITY / GINI INDEX
1,071
TOTAL POPULATION
533
MALE POPULATION
538
FEMALE POPULATION
99.07
MALES / 100 FEMALES
100.94
FEMALES / 100 MALES
61.4
MEDIAN AGE
2.4
AVG FAMILY SIZE
2.0
AVG HOUSEHOLD SIZE
444
LABOR FORCE [ PEOPLE ]
43.8%
PERCENT IN LABOR FORCE
1.8%
UNEMPLOYMENT RATE
Union Hall Zip Codes
Union Hall Area Codes
Income in Union Hall
Income Overview in Union Hall
Per Capita Income in Union Hall is $78,214, while median incomes of families and households are $121,458 and $108,750 respectively.
| Characteristic | Number | Measure |
| Per Capita Income | 1,071 | $78,214 |
| Median Family Income | 389 | $121,458 |
| Mean Family Income | 389 | $190,074 |
| Median Household Income | 530 | $108,750 |
| Mean Household Income | 530 | $157,822 |
| Income Deficit | 389 | $0 |
| Wage / Income Gap (%) | 1,071 | 59.43% |
| Wage / Income Gap ($) | 1,071 | 40.57¢ per $1 |
| Gini / Inequality Index | 1,071 | 0.50 |
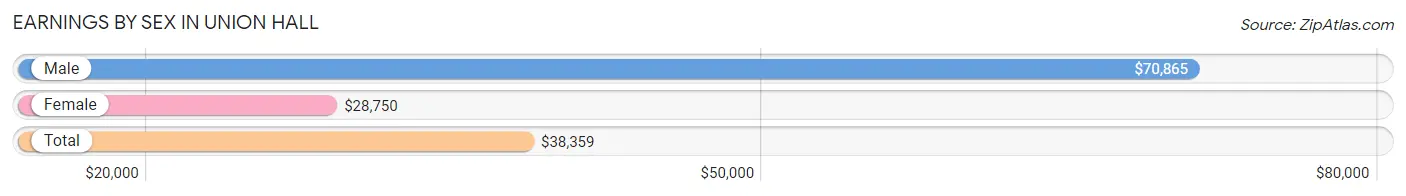
Earnings by Sex in Union Hall
Average Earnings in Union Hall are $38,359, $70,865 for men and $28,750 for women, a difference of 59.4%.
| Sex | Number | Average Earnings |
| Male | 261 (54.7%) | $70,865 |
| Female | 216 (45.3%) | $28,750 |
| Total | 477 (100.0%) | $38,359 |
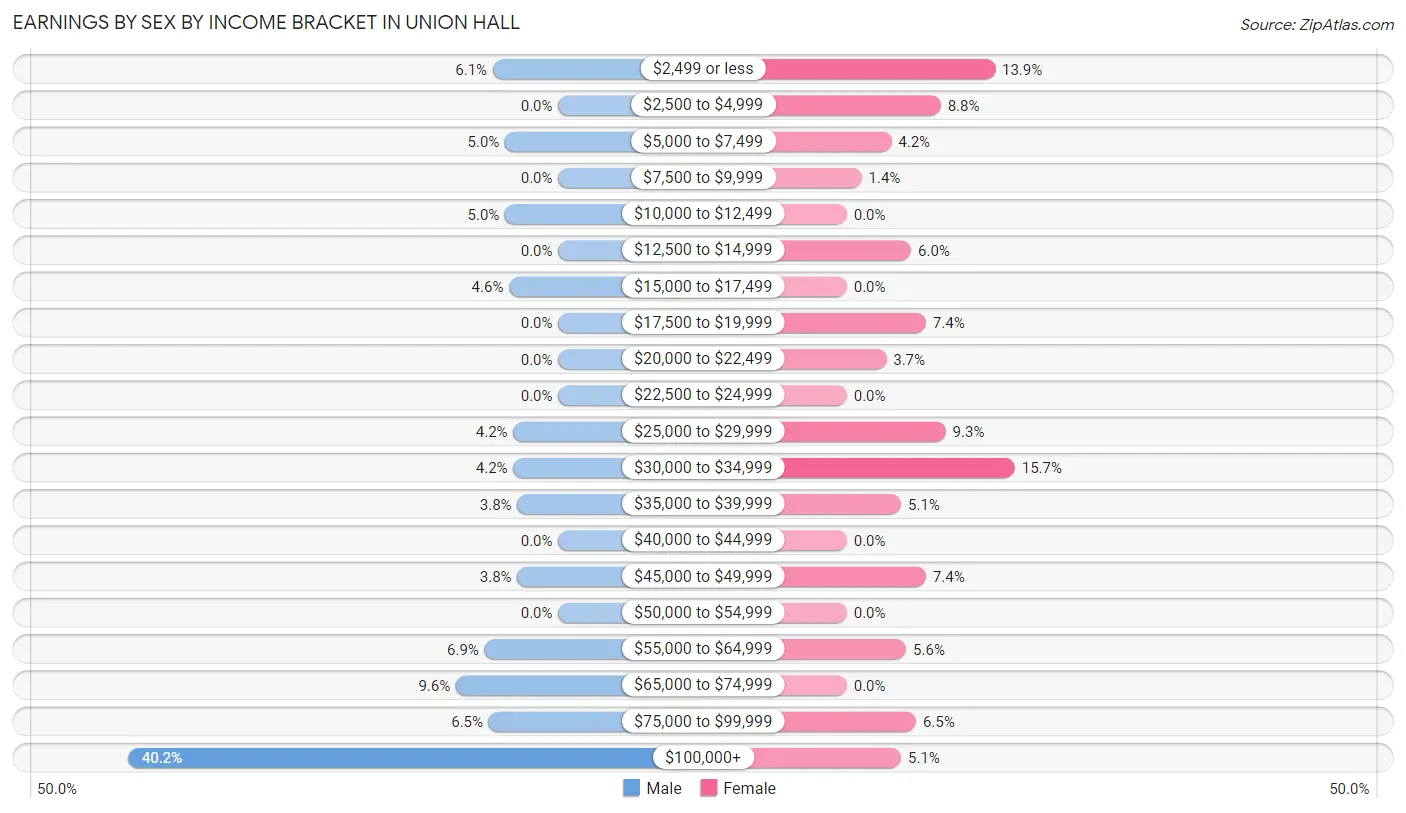
Earnings by Sex by Income Bracket in Union Hall
The most common earnings brackets in Union Hall are $100,000+ for men (105 | 40.2%) and $30,000 to $34,999 for women (34 | 15.7%).
| Income | Male | Female |
| $2,499 or less | 16 (6.1%) | 30 (13.9%) |
| $2,500 to $4,999 | 0 (0.0%) | 19 (8.8%) |
| $5,000 to $7,499 | 13 (5.0%) | 9 (4.2%) |
| $7,500 to $9,999 | 0 (0.0%) | 3 (1.4%) |
| $10,000 to $12,499 | 13 (5.0%) | 0 (0.0%) |
| $12,500 to $14,999 | 0 (0.0%) | 13 (6.0%) |
| $15,000 to $17,499 | 12 (4.6%) | 0 (0.0%) |
| $17,500 to $19,999 | 0 (0.0%) | 16 (7.4%) |
| $20,000 to $22,499 | 0 (0.0%) | 8 (3.7%) |
| $22,500 to $24,999 | 0 (0.0%) | 0 (0.0%) |
| $25,000 to $29,999 | 11 (4.2%) | 20 (9.3%) |
| $30,000 to $34,999 | 11 (4.2%) | 34 (15.7%) |
| $35,000 to $39,999 | 10 (3.8%) | 11 (5.1%) |
| $40,000 to $44,999 | 0 (0.0%) | 0 (0.0%) |
| $45,000 to $49,999 | 10 (3.8%) | 16 (7.4%) |
| $50,000 to $54,999 | 0 (0.0%) | 0 (0.0%) |
| $55,000 to $64,999 | 18 (6.9%) | 12 (5.6%) |
| $65,000 to $74,999 | 25 (9.6%) | 0 (0.0%) |
| $75,000 to $99,999 | 17 (6.5%) | 14 (6.5%) |
| $100,000+ | 105 (40.2%) | 11 (5.1%) |
| Total | 261 (100.0%) | 216 (100.0%) |
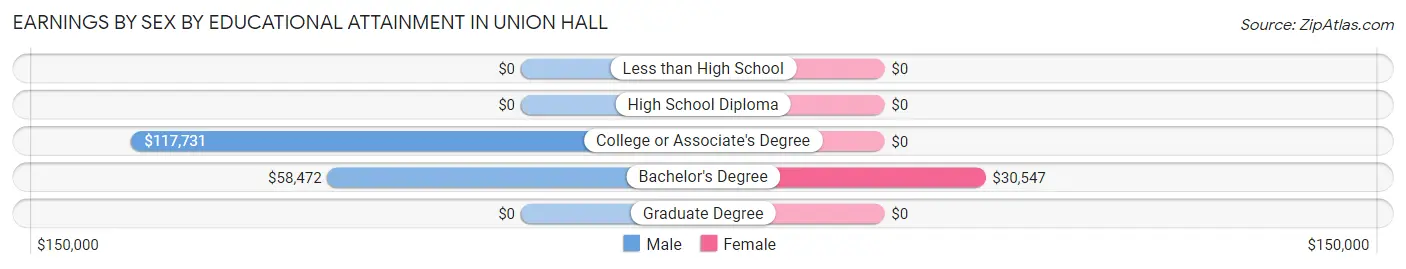
Earnings by Sex by Educational Attainment in Union Hall
Average earnings in Union Hall are $83,281 for men and $29,438 for women, a difference of 64.6%. Men with an educational attainment of college or associate's degree enjoy the highest average annual earnings of $117,731, while those with bachelor's degree education earn the least with $58,472. Women with an educational attainment of bachelor's degree earn the most with the average annual earnings of $30,547, while those with bachelor's degree education have the smallest earnings of $30,547.
| Educational Attainment | Male Income | Female Income |
| Less than High School | - | - |
| High School Diploma | - | - |
| College or Associate's Degree | $117,731 | $0 |
| Bachelor's Degree | $58,472 | $30,547 |
| Graduate Degree | - | - |
| Total | $83,281 | $29,438 |
Family Income in Union Hall
Family Income Brackets in Union Hall
According to the Union Hall family income data, there are 123 families falling into the $200,000+ income range, which is the most common income bracket and makes up 31.6% of all families.
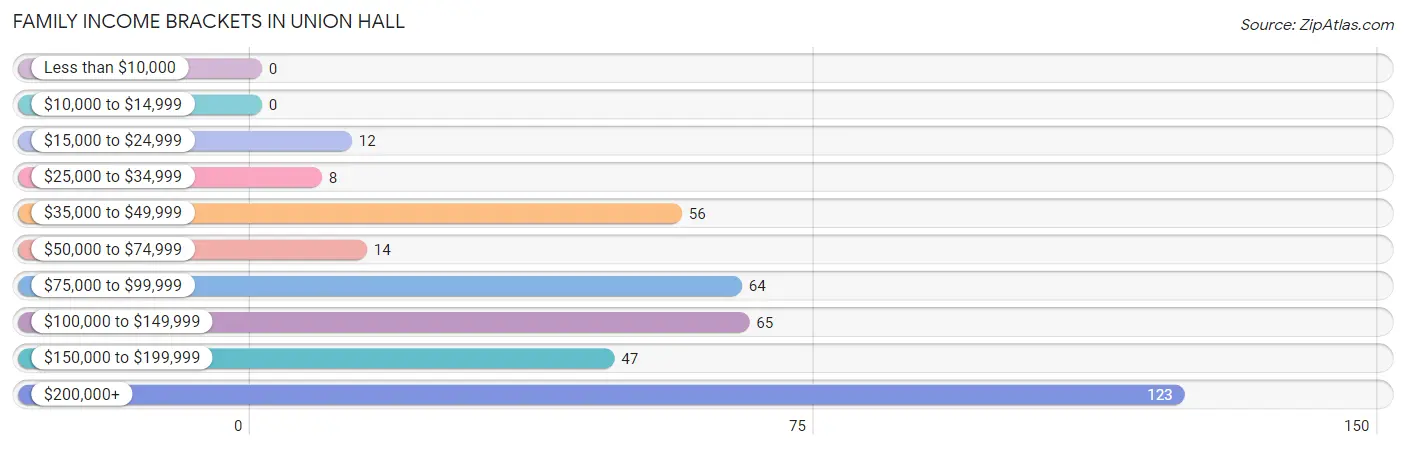
| Income Bracket | # Families | % Families |
| Less than $10,000 | 0 | 0.0% |
| $10,000 to $14,999 | 0 | 0.0% |
| $15,000 to $24,999 | 12 | 3.1% |
| $25,000 to $34,999 | 8 | 2.1% |
| $35,000 to $49,999 | 56 | 14.4% |
| $50,000 to $74,999 | 14 | 3.6% |
| $75,000 to $99,999 | 64 | 16.5% |
| $100,000 to $149,999 | 65 | 16.7% |
| $150,000 to $199,999 | 47 | 12.1% |
| $200,000+ | 123 | 31.6% |
Family Income by Famaliy Size in Union Hall
4-person families (25 | 6.4%) account for the highest median family income in Union Hall with $250,001 per family, while 4-person families (25 | 6.4%) have the highest median income of $62,500 per family member.
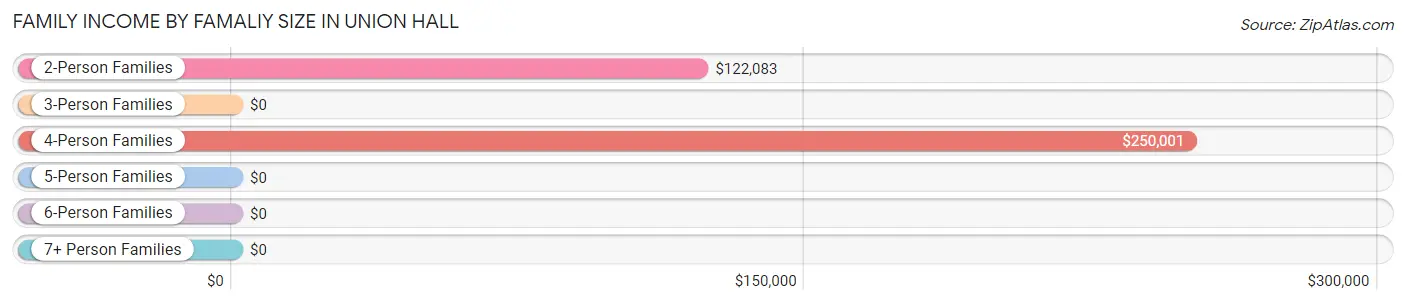
| Income Bracket | # Families | Median Income |
| 2-Person Families | 290 (74.6%) | $122,083 |
| 3-Person Families | 61 (15.7%) | $0 |
| 4-Person Families | 25 (6.4%) | $250,001 |
| 5-Person Families | 13 (3.3%) | $0 |
| 6-Person Families | 0 (0.0%) | $0 |
| 7+ Person Families | 0 (0.0%) | $0 |
| Total | 389 (100.0%) | $121,458 |
Family Income by Number of Earners in Union Hall
The median family income in Union Hall is $121,458, with families comprising 2 earners (98) having the highest median family income of $171,346, while families with 3+ earners (33) have the lowest median family income of $110,673, accounting for 25.2% and 8.5% of families, respectively.
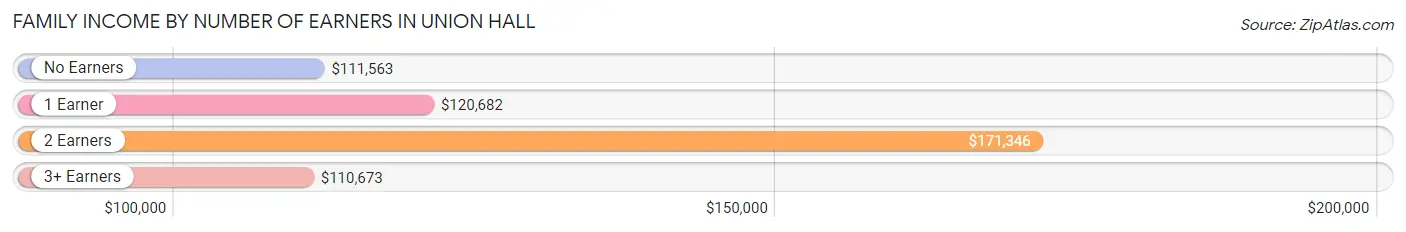
| Number of Earners | # Families | Median Income |
| No Earners | 146 (37.5%) | $111,563 |
| 1 Earner | 112 (28.8%) | $120,682 |
| 2 Earners | 98 (25.2%) | $171,346 |
| 3+ Earners | 33 (8.5%) | $110,673 |
| Total | 389 (100.0%) | $121,458 |
Household Income in Union Hall
Household Income Brackets in Union Hall
With 127 households falling in the category, the $200,000+ income range is the most frequent in Union Hall, accounting for 24.0% of all households. In contrast, only 9 households (1.7%) fall into the less than $10,000 income bracket, making it the least populous group.
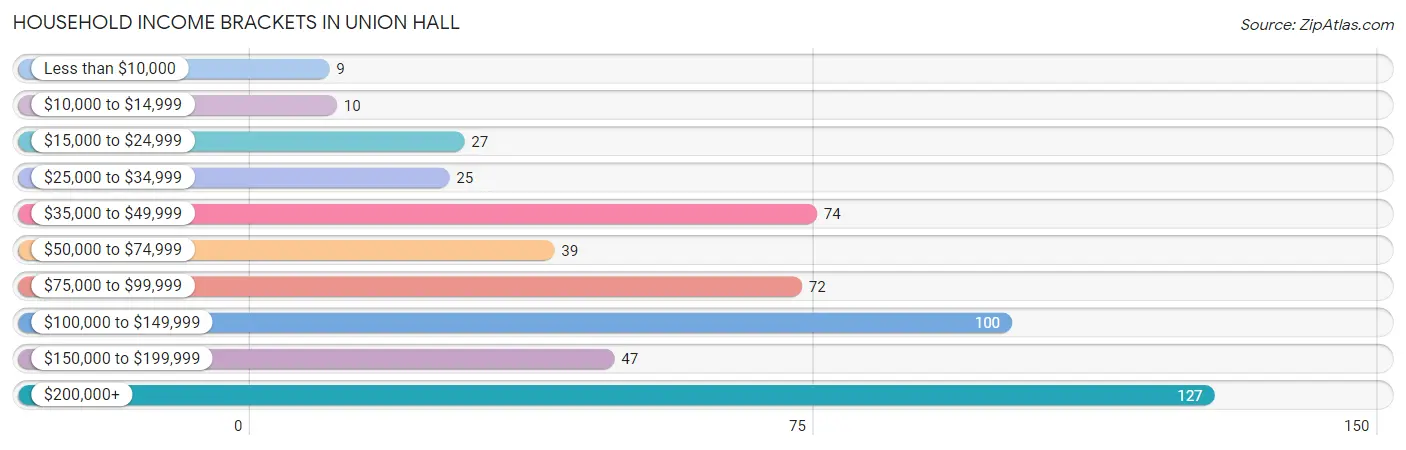
| Income Bracket | # Households | % Households |
| Less than $10,000 | 9 | 1.7% |
| $10,000 to $14,999 | 10 | 1.9% |
| $15,000 to $24,999 | 27 | 5.1% |
| $25,000 to $34,999 | 25 | 4.7% |
| $35,000 to $49,999 | 74 | 14.0% |
| $50,000 to $74,999 | 39 | 7.4% |
| $75,000 to $99,999 | 72 | 13.6% |
| $100,000 to $149,999 | 100 | 18.9% |
| $150,000 to $199,999 | 47 | 8.9% |
| $200,000+ | 127 | 24.0% |
Household Income by Householder Age in Union Hall
The median household income in Union Hall is $108,750, with the highest median household income of $126,250 found in the 45 to 64 years age bracket for the primary householder. A total of 164 households (30.9%) fall into this category.
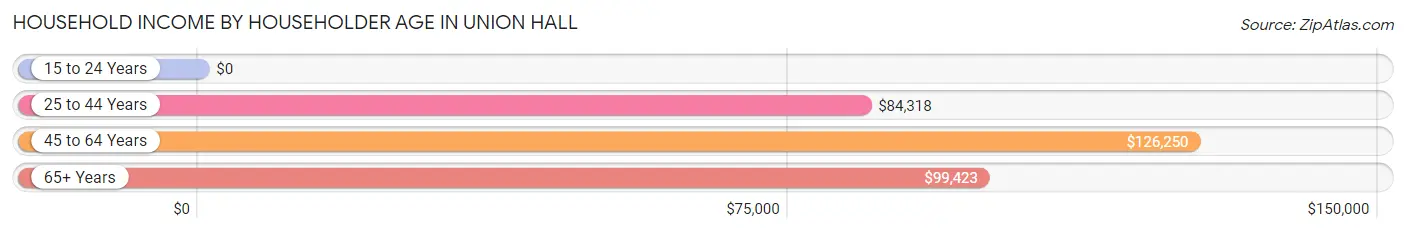
| Income Bracket | # Households | Median Income |
| 15 to 24 Years | 0 (0.0%) | $0 |
| 25 to 44 Years | 70 (13.2%) | $84,318 |
| 45 to 64 Years | 164 (30.9%) | $126,250 |
| 65+ Years | 296 (55.8%) | $99,423 |
| Total | 530 (100.0%) | $108,750 |
Poverty in Union Hall
Income Below Poverty by Sex and Age in Union Hall
With 3.6% poverty level for males and 2.2% for females among the residents of Union Hall, 75 year old and over males and 75 year old and over females are the most vulnerable to poverty, with 9 males (8.0%) and 6 females (7.6%) in their respective age groups living below the poverty level.
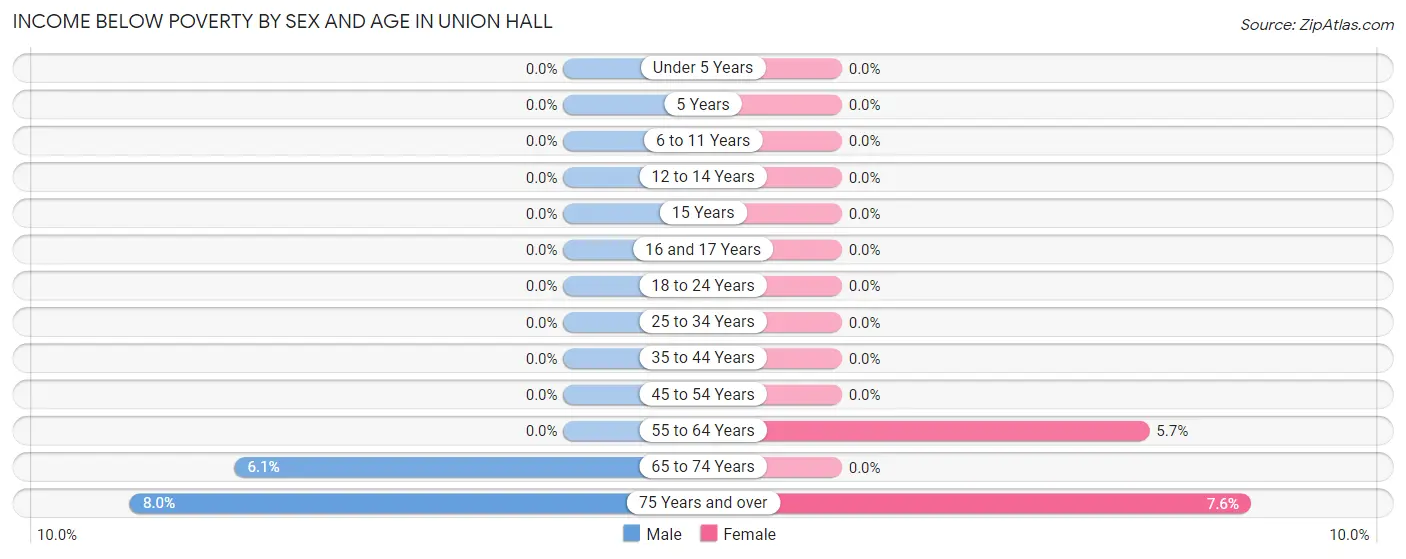
| Age Bracket | Male | Female |
| Under 5 Years | 0 (0.0%) | 0 (0.0%) |
| 5 Years | 0 (0.0%) | 0 (0.0%) |
| 6 to 11 Years | 0 (0.0%) | 0 (0.0%) |
| 12 to 14 Years | 0 (0.0%) | 0 (0.0%) |
| 15 Years | 0 (0.0%) | 0 (0.0%) |
| 16 and 17 Years | 0 (0.0%) | 0 (0.0%) |
| 18 to 24 Years | 0 (0.0%) | 0 (0.0%) |
| 25 to 34 Years | 0 (0.0%) | 0 (0.0%) |
| 35 to 44 Years | 0 (0.0%) | 0 (0.0%) |
| 45 to 54 Years | 0 (0.0%) | 0 (0.0%) |
| 55 to 64 Years | 0 (0.0%) | 6 (5.7%) |
| 65 to 74 Years | 10 (6.1%) | 0 (0.0%) |
| 75 Years and over | 9 (8.0%) | 6 (7.6%) |
| Total | 19 (3.6%) | 12 (2.2%) |
Income Above Poverty by Sex and Age in Union Hall
According to the poverty statistics in Union Hall, males aged under 5 years and females aged under 5 years are the age groups that are most secure financially, with 100.0% of males and 100.0% of females in these age groups living above the poverty line.
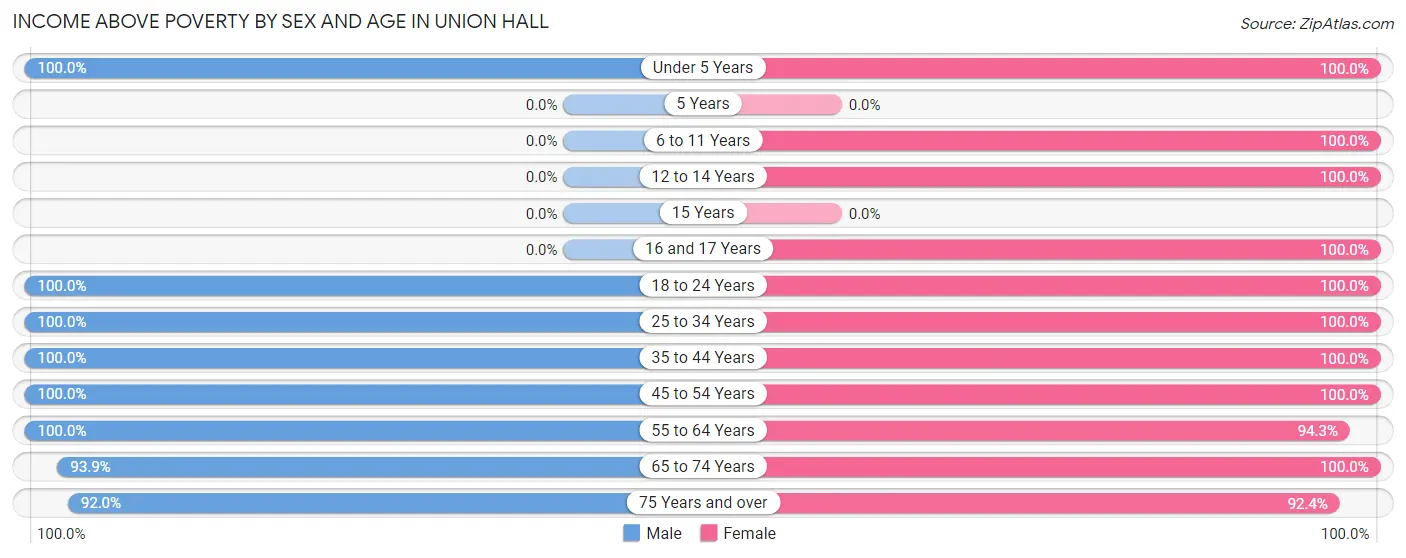
| Age Bracket | Male | Female |
| Under 5 Years | 12 (100.0%) | 15 (100.0%) |
| 5 Years | 0 (0.0%) | 0 (0.0%) |
| 6 to 11 Years | 0 (0.0%) | 27 (100.0%) |
| 12 to 14 Years | 0 (0.0%) | 4 (100.0%) |
| 15 Years | 0 (0.0%) | 0 (0.0%) |
| 16 and 17 Years | 0 (0.0%) | 3 (100.0%) |
| 18 to 24 Years | 22 (100.0%) | 41 (100.0%) |
| 25 to 34 Years | 24 (100.0%) | 36 (100.0%) |
| 35 to 44 Years | 60 (100.0%) | 15 (100.0%) |
| 45 to 54 Years | 20 (100.0%) | 91 (100.0%) |
| 55 to 64 Years | 119 (100.0%) | 99 (94.3%) |
| 65 to 74 Years | 154 (93.9%) | 122 (100.0%) |
| 75 Years and over | 103 (92.0%) | 73 (92.4%) |
| Total | 514 (96.4%) | 526 (97.8%) |
Income Below Poverty Among Married-Couple Families in Union Hall
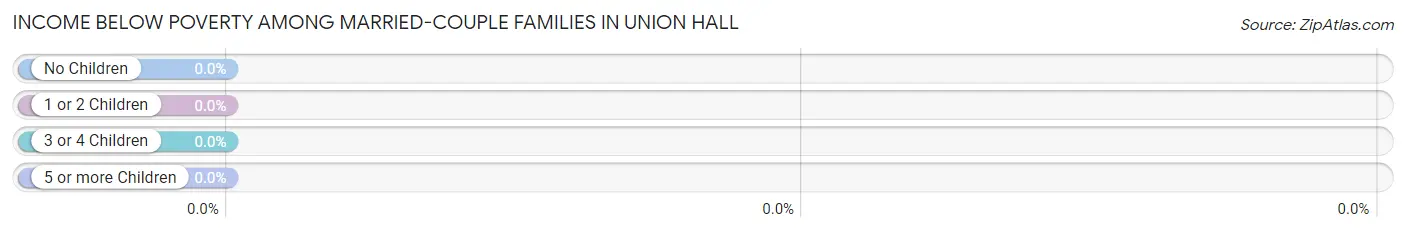
| Children | Above Poverty | Below Poverty |
| No Children | 313 (100.0%) | 0 (0.0%) |
| 1 or 2 Children | 15 (100.0%) | 0 (0.0%) |
| 3 or 4 Children | 0 (0.0%) | 0 (0.0%) |
| 5 or more Children | 0 (0.0%) | 0 (0.0%) |
| Total | 328 (100.0%) | 0 (0.0%) |
Income Below Poverty Among Single-Parent Households in Union Hall
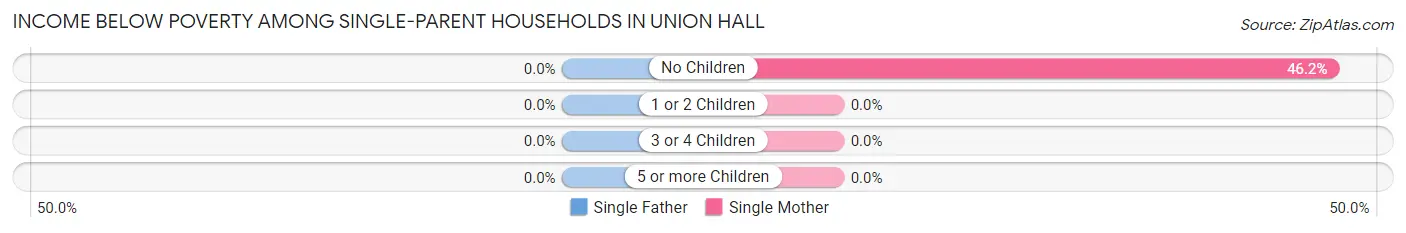
| Children | Single Father | Single Mother |
| No Children | 0 (0.0%) | 6 (46.2%) |
| 1 or 2 Children | 0 (0.0%) | 0 (0.0%) |
| 3 or 4 Children | 0 (0.0%) | 0 (0.0%) |
| 5 or more Children | 0 (0.0%) | 0 (0.0%) |
| Total | 0 (0.0%) | 6 (12.5%) |
Income Below Poverty Among Married-Couple vs Single-Parent Households in Union Hall
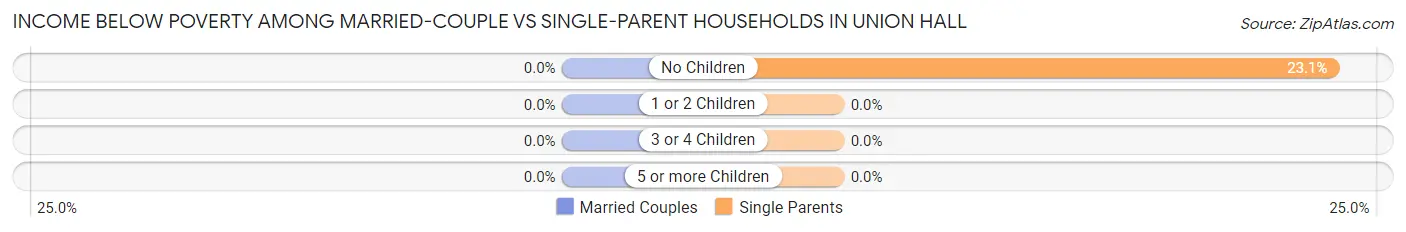
| Children | Married-Couple Families | Single-Parent Households |
| No Children | 0 (0.0%) | 6 (23.1%) |
| 1 or 2 Children | 0 (0.0%) | 0 (0.0%) |
| 3 or 4 Children | 0 (0.0%) | 0 (0.0%) |
| 5 or more Children | 0 (0.0%) | 0 (0.0%) |
| Total | 0 (0.0%) | 6 (9.8%) |
Race in Union Hall
The most populous races in Union Hall are White / Caucasian (1,011 | 94.4%), Two or more Races (36 | 3.4%), and Black / African American (24 | 2.2%).
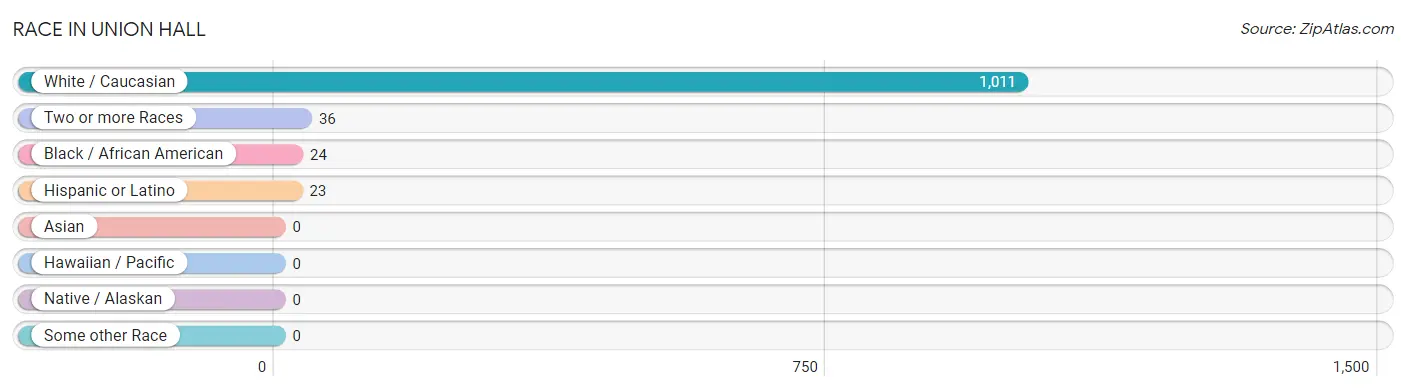
| Race | # Population | % Population |
| Asian | 0 | 0.0% |
| Black / African American | 24 | 2.2% |
| Hawaiian / Pacific | 0 | 0.0% |
| Hispanic or Latino | 23 | 2.1% |
| Native / Alaskan | 0 | 0.0% |
| White / Caucasian | 1,011 | 94.4% |
| Two or more Races | 36 | 3.4% |
| Some other Race | 0 | 0.0% |
| Total | 1,071 | 100.0% |
Ancestry in Union Hall
The most populous ancestries reported in Union Hall are English (303 | 28.3%), German (289 | 27.0%), Irish (242 | 22.6%), Italian (77 | 7.2%), and American (54 | 5.0%), together accounting for 90.1% of all Union Hall residents.
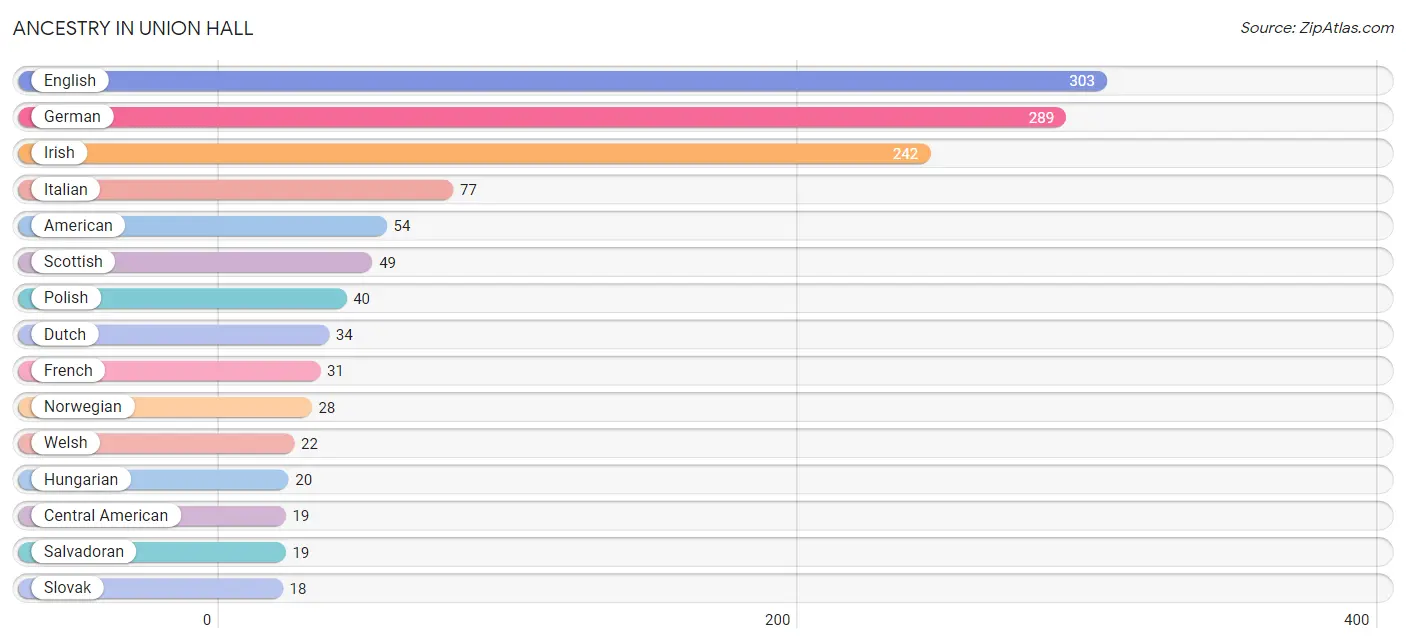
| Ancestry | # Population | % Population |
| American | 54 | 5.0% |
| Canadian | 6 | 0.6% |
| Central American | 19 | 1.8% |
| Cherokee | 3 | 0.3% |
| Czech | 8 | 0.7% |
| Dutch | 34 | 3.2% |
| English | 303 | 28.3% |
| European | 6 | 0.6% |
| Finnish | 6 | 0.6% |
| French | 31 | 2.9% |
| French Canadian | 9 | 0.8% |
| German | 289 | 27.0% |
| Hungarian | 20 | 1.9% |
| Irish | 242 | 22.6% |
| Italian | 77 | 7.2% |
| Lithuanian | 6 | 0.6% |
| Norwegian | 28 | 2.6% |
| Peruvian | 4 | 0.4% |
| Polish | 40 | 3.7% |
| Russian | 8 | 0.7% |
| Salvadoran | 19 | 1.8% |
| Scotch-Irish | 11 | 1.0% |
| Scottish | 49 | 4.6% |
| Slovak | 18 | 1.7% |
| South American | 4 | 0.4% |
| Swedish | 6 | 0.6% |
| Swiss | 12 | 1.1% |
| Welsh | 22 | 2.1% | View All 28 Rows |
Immigrants in Union Hall

| Immigration Origin | # Population | % Population | View All 0 Rows |
Sex and Age in Union Hall
Sex and Age in Union Hall
The most populous age groups in Union Hall are 65 to 69 Years (93 | 17.4%) for men and 50 to 54 Years (75 | 13.9%) for women.
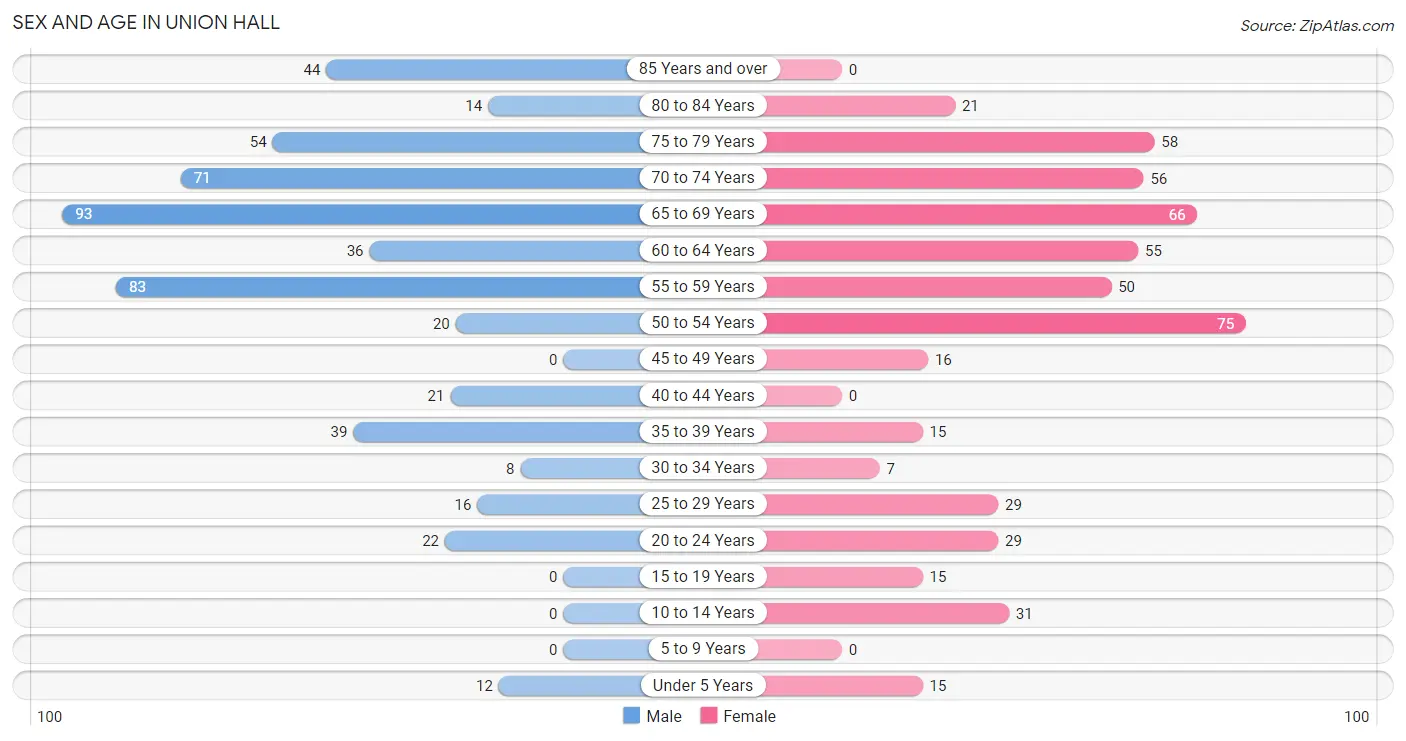
| Age Bracket | Male | Female |
| Under 5 Years | 12 (2.2%) | 15 (2.8%) |
| 5 to 9 Years | 0 (0.0%) | 0 (0.0%) |
| 10 to 14 Years | 0 (0.0%) | 31 (5.8%) |
| 15 to 19 Years | 0 (0.0%) | 15 (2.8%) |
| 20 to 24 Years | 22 (4.1%) | 29 (5.4%) |
| 25 to 29 Years | 16 (3.0%) | 29 (5.4%) |
| 30 to 34 Years | 8 (1.5%) | 7 (1.3%) |
| 35 to 39 Years | 39 (7.3%) | 15 (2.8%) |
| 40 to 44 Years | 21 (3.9%) | 0 (0.0%) |
| 45 to 49 Years | 0 (0.0%) | 16 (3.0%) |
| 50 to 54 Years | 20 (3.7%) | 75 (13.9%) |
| 55 to 59 Years | 83 (15.6%) | 50 (9.3%) |
| 60 to 64 Years | 36 (6.8%) | 55 (10.2%) |
| 65 to 69 Years | 93 (17.4%) | 66 (12.3%) |
| 70 to 74 Years | 71 (13.3%) | 56 (10.4%) |
| 75 to 79 Years | 54 (10.1%) | 58 (10.8%) |
| 80 to 84 Years | 14 (2.6%) | 21 (3.9%) |
| 85 Years and over | 44 (8.3%) | 0 (0.0%) |
| Total | 533 (100.0%) | 538 (100.0%) |
Families and Households in Union Hall
Median Family Size in Union Hall
The median family size in Union Hall is 2.35 persons per family, with single female/mother families (48 | 12.3%) accounting for the largest median family size of 3.13 persons per family. On the other hand, single male/father families (13 | 3.3%) represent the smallest median family size with 1.92 persons per family.
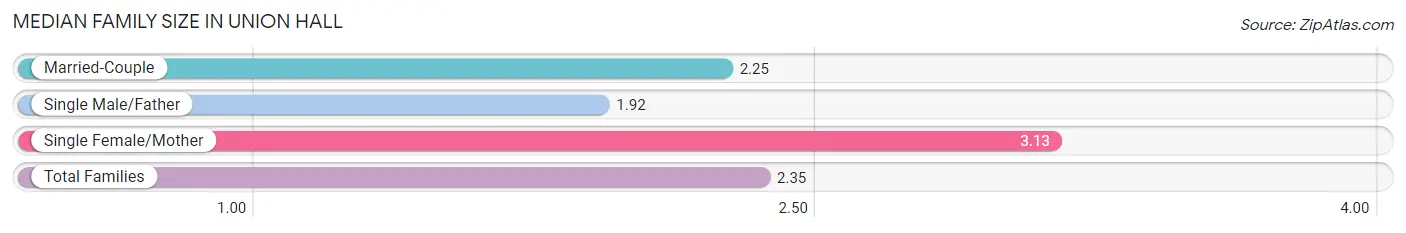
| Family Type | # Families | Family Size |
| Married-Couple | 328 (84.3%) | 2.25 |
| Single Male/Father | 13 (3.3%) | 1.92 |
| Single Female/Mother | 48 (12.3%) | 3.13 |
| Total Families | 389 (100.0%) | 2.35 |
Median Household Size in Union Hall
The median household size in Union Hall is 2.02 persons per household, with single female/mother households (48 | 9.1%) accounting for the largest median household size of 3.13 persons per household. non-family households (141 | 26.6%) represent the smallest median household size with 1.11 persons per household.
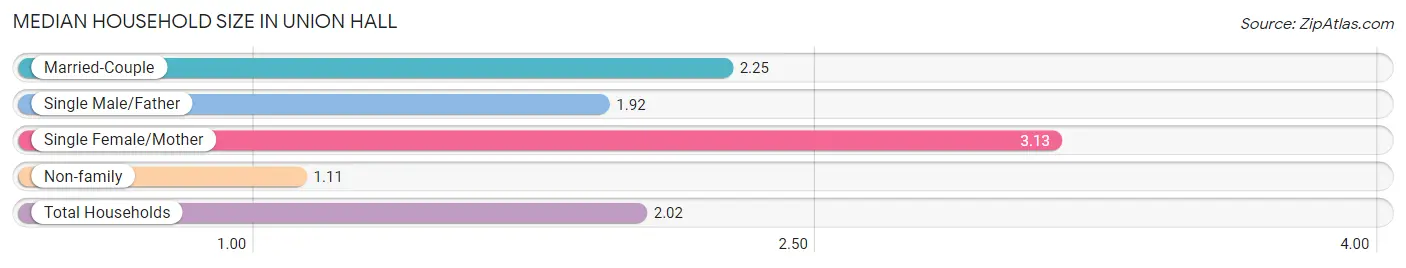
| Household Type | # Households | Household Size |
| Married-Couple | 328 (61.9%) | 2.25 |
| Single Male/Father | 13 (2.5%) | 1.92 |
| Single Female/Mother | 48 (9.1%) | 3.13 |
| Non-family | 141 (26.6%) | 1.11 |
| Total Households | 530 (100.0%) | 2.02 |
Household Size by Marriage Status in Union Hall
Out of a total of 530 households in Union Hall, 389 (73.4%) are family households, while 141 (26.6%) are nonfamily households. The most numerous type of family households are 2-person households, comprising 290, and the most common type of nonfamily households are 1-person households, comprising 133.
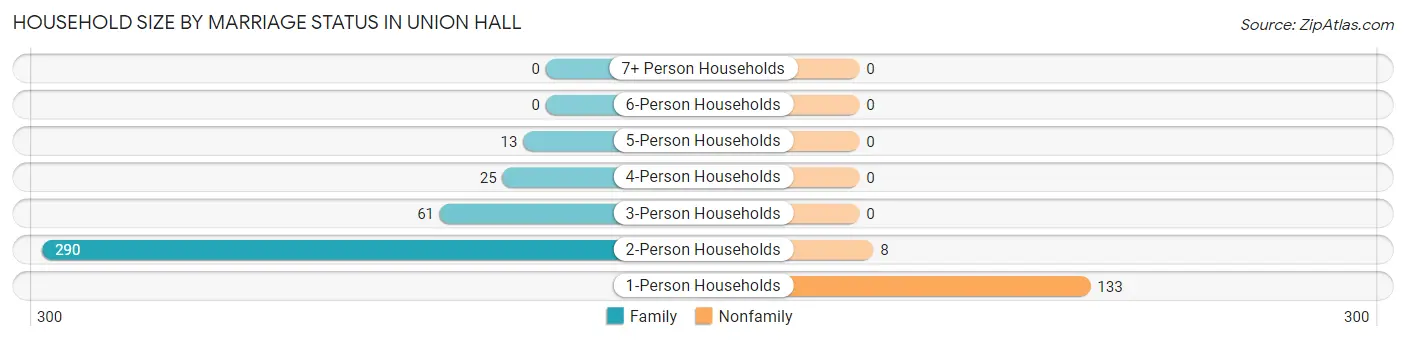
| Household Size | Family Households | Nonfamily Households |
| 1-Person Households | - | 133 (25.1%) |
| 2-Person Households | 290 (54.7%) | 8 (1.5%) |
| 3-Person Households | 61 (11.5%) | 0 (0.0%) |
| 4-Person Households | 25 (4.7%) | 0 (0.0%) |
| 5-Person Households | 13 (2.5%) | 0 (0.0%) |
| 6-Person Households | 0 (0.0%) | 0 (0.0%) |
| 7+ Person Households | 0 (0.0%) | 0 (0.0%) |
| Total | 389 (73.4%) | 141 (26.6%) |
Female Fertility in Union Hall
Fertility by Age in Union Hall
| Age Bracket | Women with Births | Births / 1,000 Women |
| 15 to 19 years | 0 (0.0%) | 0.0 |
| 20 to 34 years | 0 (0.0%) | 0.0 |
| 35 to 50 years | 0 (0.0%) | 0.0 |
| Total | 0 (0.0%) | 0.0 |
Fertility by Age by Marriage Status in Union Hall
| Age Bracket | Married | Unmarried |
| 15 to 19 years | 0 (0.0%) | 0 (0.0%) |
| 20 to 34 years | 0 (0.0%) | 0 (0.0%) |
| 35 to 50 years | 0 (0.0%) | 0 (0.0%) |
| Total | 0 (0.0%) | 0 (0.0%) |
Fertility by Education in Union Hall
| Educational Attainment | Women with Births | Births / 1,000 Women |
| Less than High School | 0 (0.0%) | 0.0 |
| High School Diploma | 0 (0.0%) | 0.0 |
| College or Associate's Degree | 0 (0.0%) | 0.0 |
| Bachelor's Degree | 0 (0.0%) | 0.0 |
| Graduate Degree | 0 (0.0%) | 0.0 |
| Total | 0 (0.0%) | 0.0 |
Fertility by Education by Marriage Status in Union Hall
| Educational Attainment | Married | Unmarried |
| Less than High School | 0 (0.0%) | 0 (0.0%) |
| High School Diploma | 0 (0.0%) | 0 (0.0%) |
| College or Associate's Degree | 0 (0.0%) | 0 (0.0%) |
| Bachelor's Degree | 0 (0.0%) | 0 (0.0%) |
| Graduate Degree | 0 (0.0%) | 0 (0.0%) |
| Total | 0 (0.0%) | 0 (0.0%) |
Employment Characteristics in Union Hall
Employment by Class of Employer in Union Hall
Among the 399 employed individuals in Union Hall, private company employees (225 | 56.4%), self-employed (incorporated) (82 | 20.5%), and not-for-profit organizations (33 | 8.3%) make up the most common classes of employment.
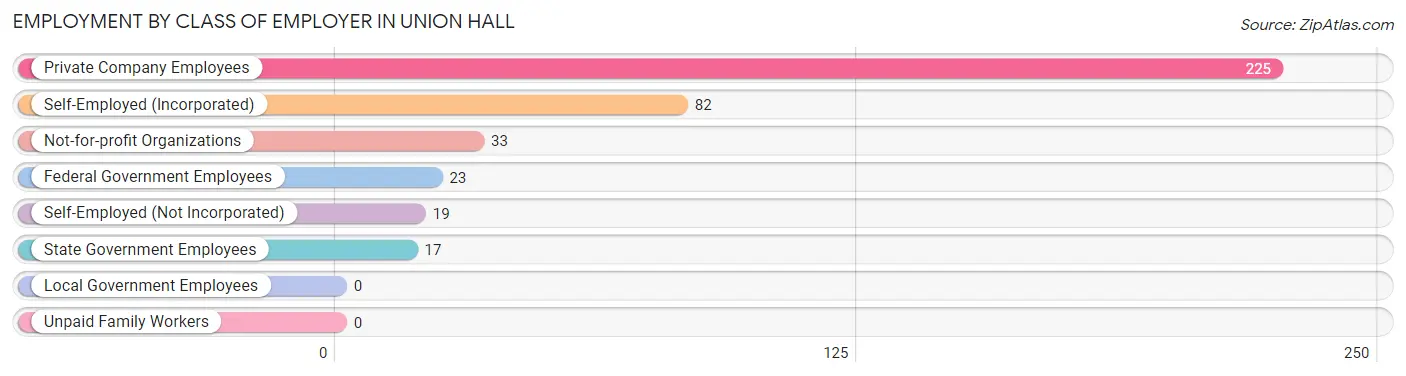
| Employer Class | # Employees | % Employees |
| Private Company Employees | 225 | 56.4% |
| Self-Employed (Incorporated) | 82 | 20.5% |
| Self-Employed (Not Incorporated) | 19 | 4.8% |
| Not-for-profit Organizations | 33 | 8.3% |
| Local Government Employees | 0 | 0.0% |
| State Government Employees | 17 | 4.3% |
| Federal Government Employees | 23 | 5.8% |
| Unpaid Family Workers | 0 | 0.0% |
| Total | 399 | 100.0% |
Employment Status by Age in Union Hall
According to the labor force statistics for Union Hall, out of the total population over 16 years of age (1,013), 43.8% or 444 individuals are in the labor force, with 1.8% or 8 of them unemployed. The age group with the highest labor force participation rate is 16 to 19 years, with 100.0% or 15 individuals in the labor force. Within the labor force, the 35 to 44 years age range has the highest percentage of unemployed individuals, with 15.4% or 8 of them being unemployed.
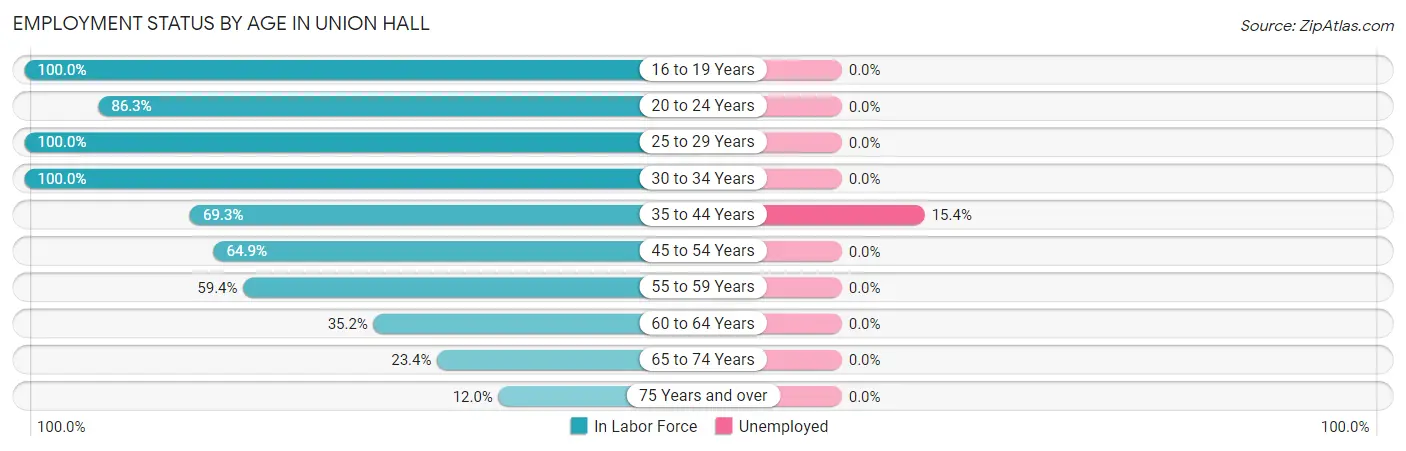
| Age Bracket | In Labor Force | Unemployed |
| 16 to 19 Years | 15 (100.0%) | 0 (0.0%) |
| 20 to 24 Years | 44 (86.3%) | 0 (0.0%) |
| 25 to 29 Years | 45 (100.0%) | 0 (0.0%) |
| 30 to 34 Years | 15 (100.0%) | 0 (0.0%) |
| 35 to 44 Years | 52 (69.3%) | 8 (15.4%) |
| 45 to 54 Years | 72 (64.9%) | 0 (0.0%) |
| 55 to 59 Years | 79 (59.4%) | 0 (0.0%) |
| 60 to 64 Years | 32 (35.2%) | 0 (0.0%) |
| 65 to 74 Years | 67 (23.4%) | 0 (0.0%) |
| 75 Years and over | 23 (12.0%) | 0 (0.0%) |
| Total | 444 (43.8%) | 8 (1.8%) |
Employment Status by Educational Attainment in Union Hall
According to labor force statistics for Union Hall, 62.8% of individuals (295) out of the total population between 25 and 64 years of age (470) are in the labor force, with 2.7% or 8 of them being unemployed. The group with the highest labor force participation rate are those with the educational attainment of less than high school, with 100.0% or 7 individuals in the labor force. Within the labor force, individuals with high school diploma education have the highest percentage of unemployment, with 17.4% or 8 of them being unemployed.
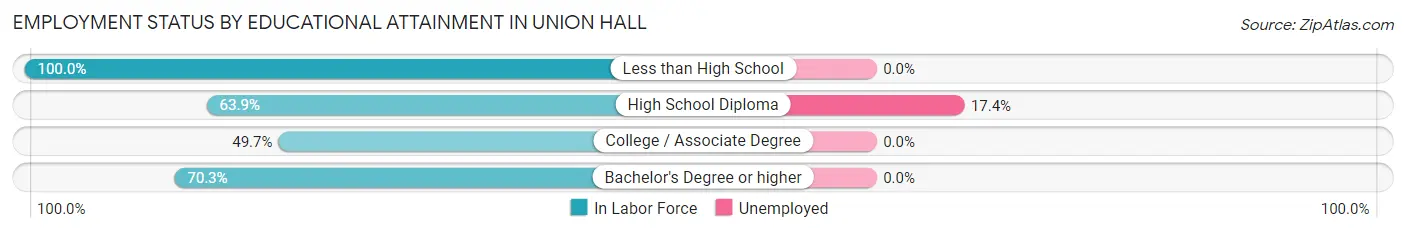
| Educational Attainment | In Labor Force | Unemployed |
| Less than High School | 7 (100.0%) | 0 (0.0%) |
| High School Diploma | 46 (63.9%) | 13 (17.4%) |
| College / Associate Degree | 79 (49.7%) | 0 (0.0%) |
| Bachelor's Degree or higher | 163 (70.3%) | 0 (0.0%) |
| Total | 295 (62.8%) | 13 (2.7%) |
Employment Occupations by Sex in Union Hall
Management, Business, Science and Arts Occupations
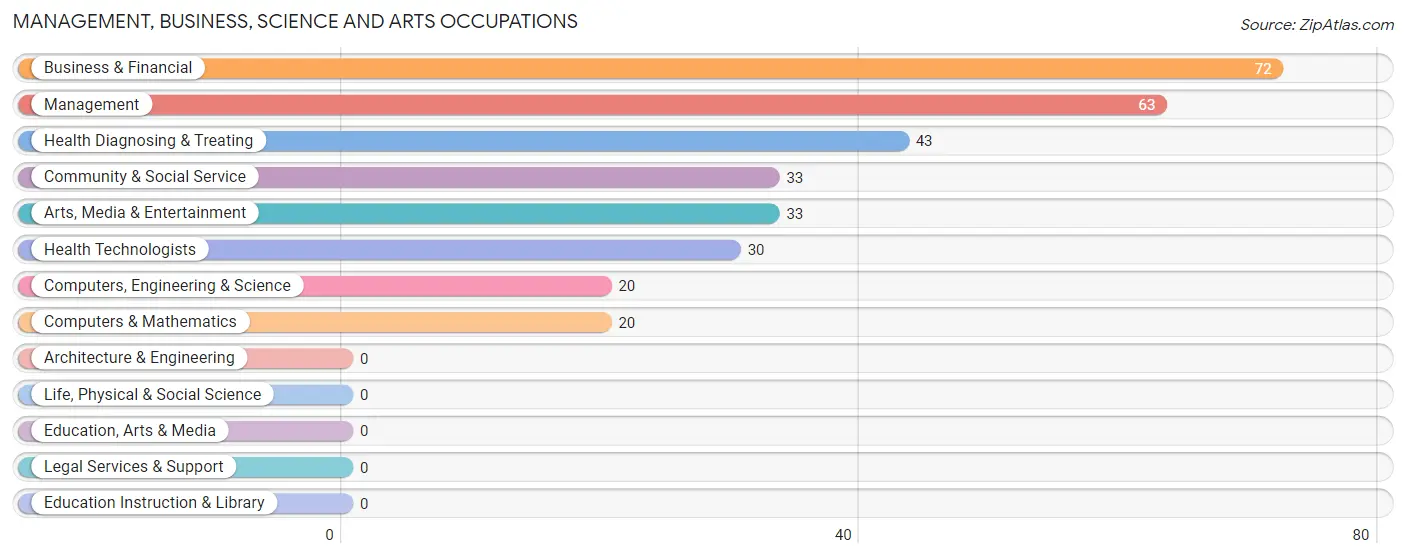
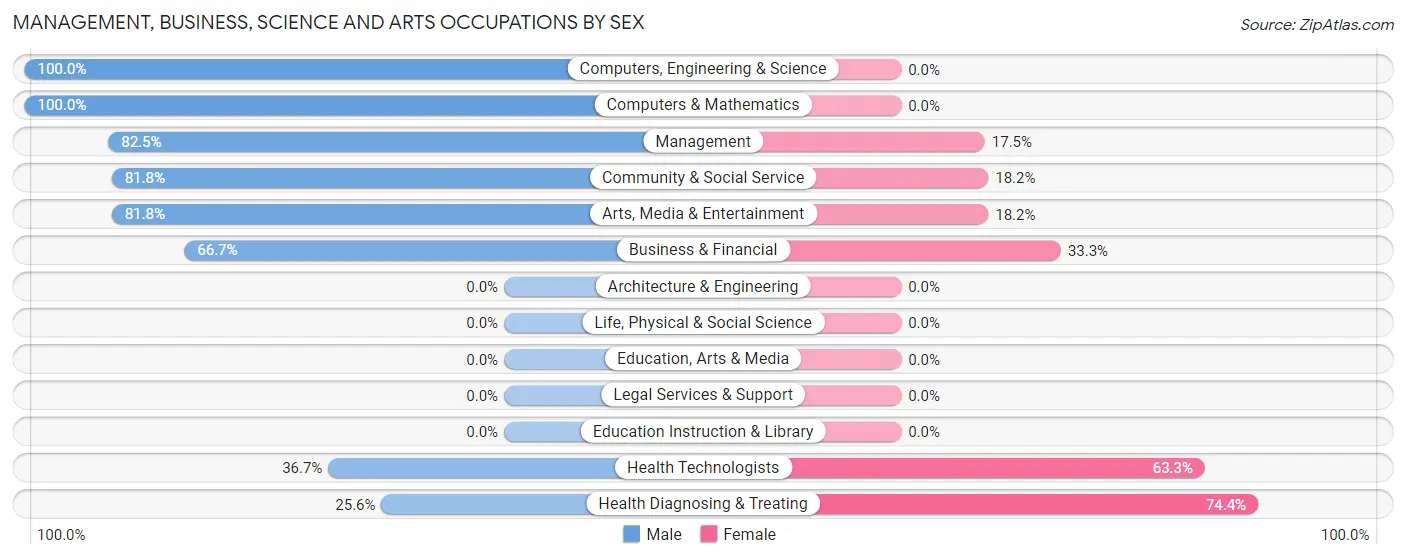
The most common Management, Business, Science and Arts occupations in Union Hall are Business & Financial (72 | 16.5%), Management (63 | 14.4%), Health Diagnosing & Treating (43 | 9.9%), Community & Social Service (33 | 7.6%), and Arts, Media & Entertainment (33 | 7.6%).
Management, Business, Science and Arts Occupations by Sex
Within the Management, Business, Science and Arts occupations in Union Hall, the most male-oriented occupations are Computers, Engineering & Science (100.0%), Computers & Mathematics (100.0%), and Management (82.5%), while the most female-oriented occupations are Health Diagnosing & Treating (74.4%), Health Technologists (63.3%), and Business & Financial (33.3%).
| Occupation | Male | Female |
| Management | 52 (82.5%) | 11 (17.5%) |
| Business & Financial | 48 (66.7%) | 24 (33.3%) |
| Computers, Engineering & Science | 20 (100.0%) | 0 (0.0%) |
| Computers & Mathematics | 20 (100.0%) | 0 (0.0%) |
| Architecture & Engineering | 0 (0.0%) | 0 (0.0%) |
| Life, Physical & Social Science | 0 (0.0%) | 0 (0.0%) |
| Community & Social Service | 27 (81.8%) | 6 (18.2%) |
| Education, Arts & Media | 0 (0.0%) | 0 (0.0%) |
| Legal Services & Support | 0 (0.0%) | 0 (0.0%) |
| Education Instruction & Library | 0 (0.0%) | 0 (0.0%) |
| Arts, Media & Entertainment | 27 (81.8%) | 6 (18.2%) |
| Health Diagnosing & Treating | 11 (25.6%) | 32 (74.4%) |
| Health Technologists | 11 (36.7%) | 19 (63.3%) |
| Total (Category) | 158 (68.4%) | 73 (31.6%) |
| Total (Overall) | 241 (55.3%) | 195 (44.7%) |
Services Occupations
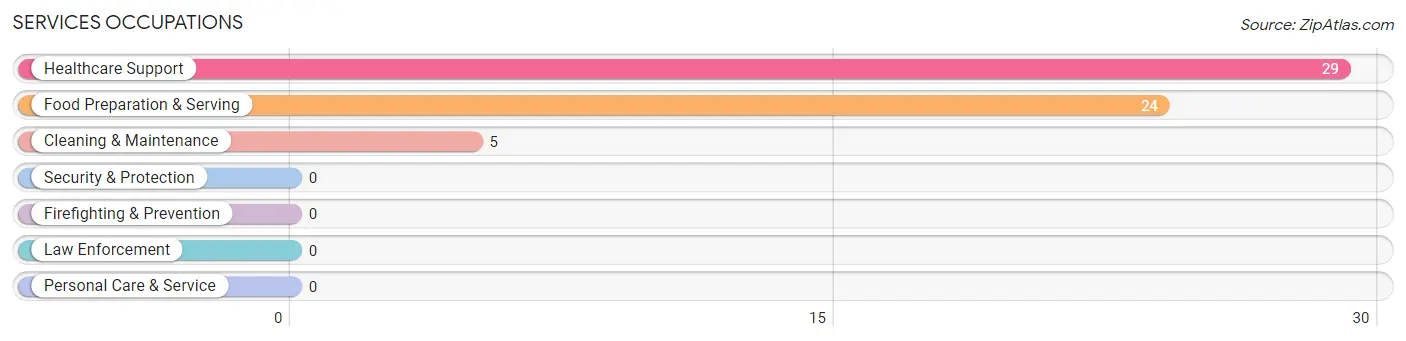
The most common Services occupations in Union Hall are Healthcare Support (29 | 6.7%), Food Preparation & Serving (24 | 5.5%), and Cleaning & Maintenance (5 | 1.1%).
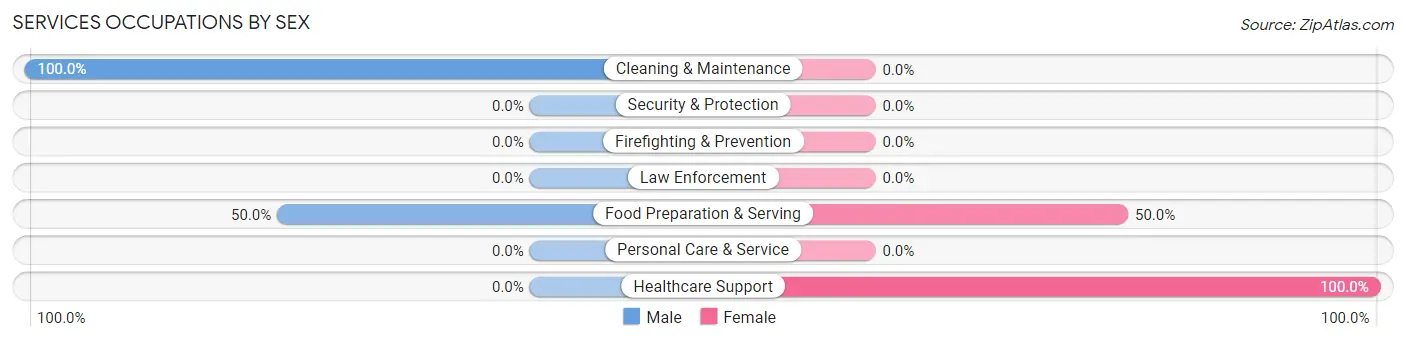
Services Occupations by Sex
Within the Services occupations in Union Hall, the most male-oriented occupations are Cleaning & Maintenance (100.0%), and Food Preparation & Serving (50.0%), while the most female-oriented occupations are Healthcare Support (100.0%), and Food Preparation & Serving (50.0%).
| Occupation | Male | Female |
| Healthcare Support | 0 (0.0%) | 29 (100.0%) |
| Security & Protection | 0 (0.0%) | 0 (0.0%) |
| Firefighting & Prevention | 0 (0.0%) | 0 (0.0%) |
| Law Enforcement | 0 (0.0%) | 0 (0.0%) |
| Food Preparation & Serving | 12 (50.0%) | 12 (50.0%) |
| Cleaning & Maintenance | 5 (100.0%) | 0 (0.0%) |
| Personal Care & Service | 0 (0.0%) | 0 (0.0%) |
| Total (Category) | 17 (29.3%) | 41 (70.7%) |
| Total (Overall) | 241 (55.3%) | 195 (44.7%) |
Sales and Office Occupations
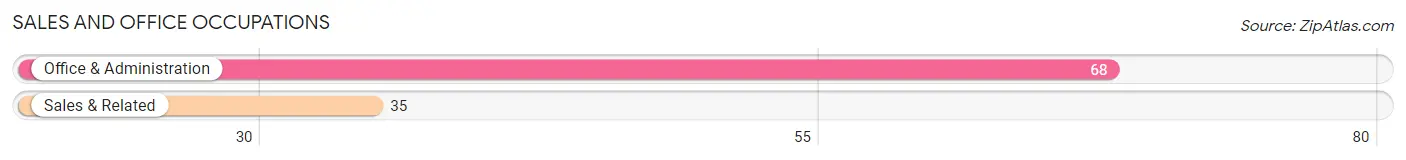
The most common Sales and Office occupations in Union Hall are Office & Administration (68 | 15.6%), and Sales & Related (35 | 8.0%).
Sales and Office Occupations by Sex
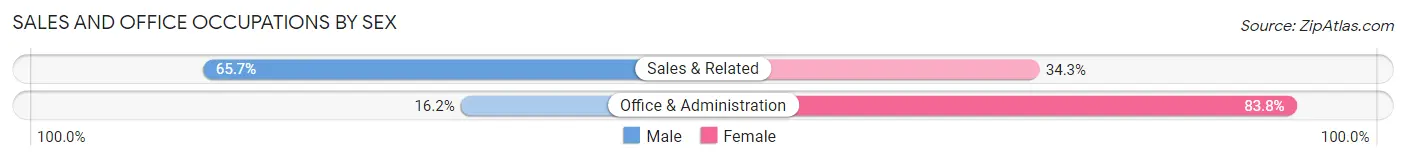
| Occupation | Male | Female |
| Sales & Related | 23 (65.7%) | 12 (34.3%) |
| Office & Administration | 11 (16.2%) | 57 (83.8%) |
| Total (Category) | 34 (33.0%) | 69 (67.0%) |
| Total (Overall) | 241 (55.3%) | 195 (44.7%) |
Natural Resources, Construction and Maintenance Occupations
The most common Natural Resources, Construction and Maintenance occupations in Union Hall are , and Construction & Extraction (17 | 3.9%).
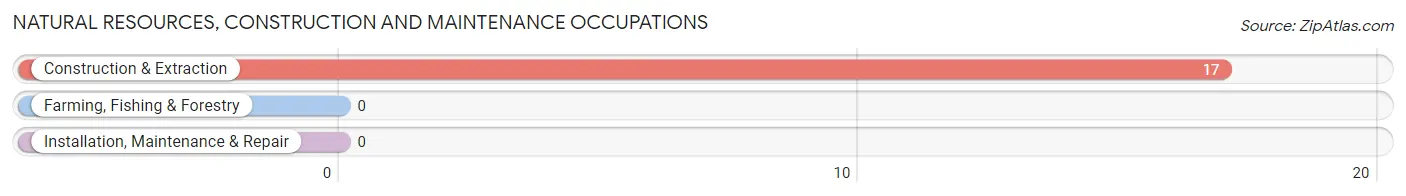
Natural Resources, Construction and Maintenance Occupations by Sex
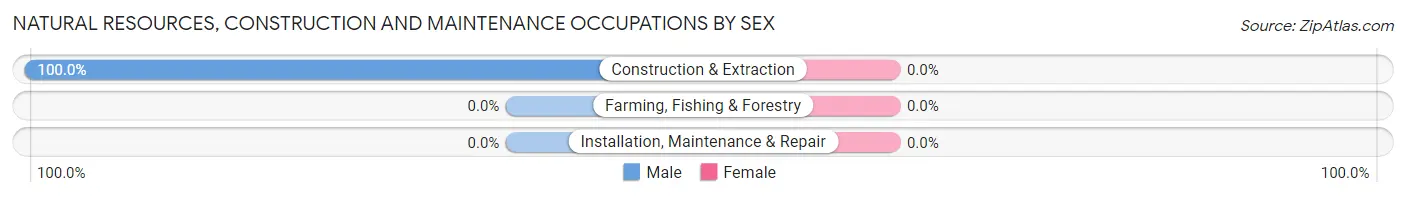
| Occupation | Male | Female |
| Farming, Fishing & Forestry | 0 (0.0%) | 0 (0.0%) |
| Construction & Extraction | 17 (100.0%) | 0 (0.0%) |
| Installation, Maintenance & Repair | 0 (0.0%) | 0 (0.0%) |
| Total (Category) | 17 (100.0%) | 0 (0.0%) |
| Total (Overall) | 241 (55.3%) | 195 (44.7%) |
Production, Transportation and Moving Occupations
The most common Production, Transportation and Moving occupations in Union Hall are Transportation (15 | 3.4%), Material Moving (7 | 1.6%), and Production (5 | 1.1%).
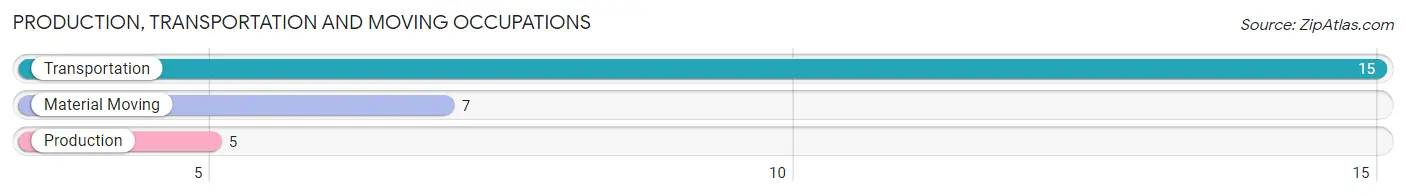
Production, Transportation and Moving Occupations by Sex
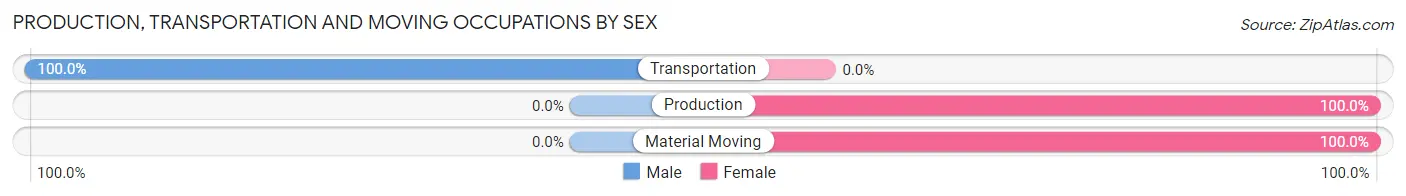
| Occupation | Male | Female |
| Production | 0 (0.0%) | 5 (100.0%) |
| Transportation | 15 (100.0%) | 0 (0.0%) |
| Material Moving | 0 (0.0%) | 7 (100.0%) |
| Total (Category) | 15 (55.6%) | 12 (44.4%) |
| Total (Overall) | 241 (55.3%) | 195 (44.7%) |
Employment Industries by Sex in Union Hall
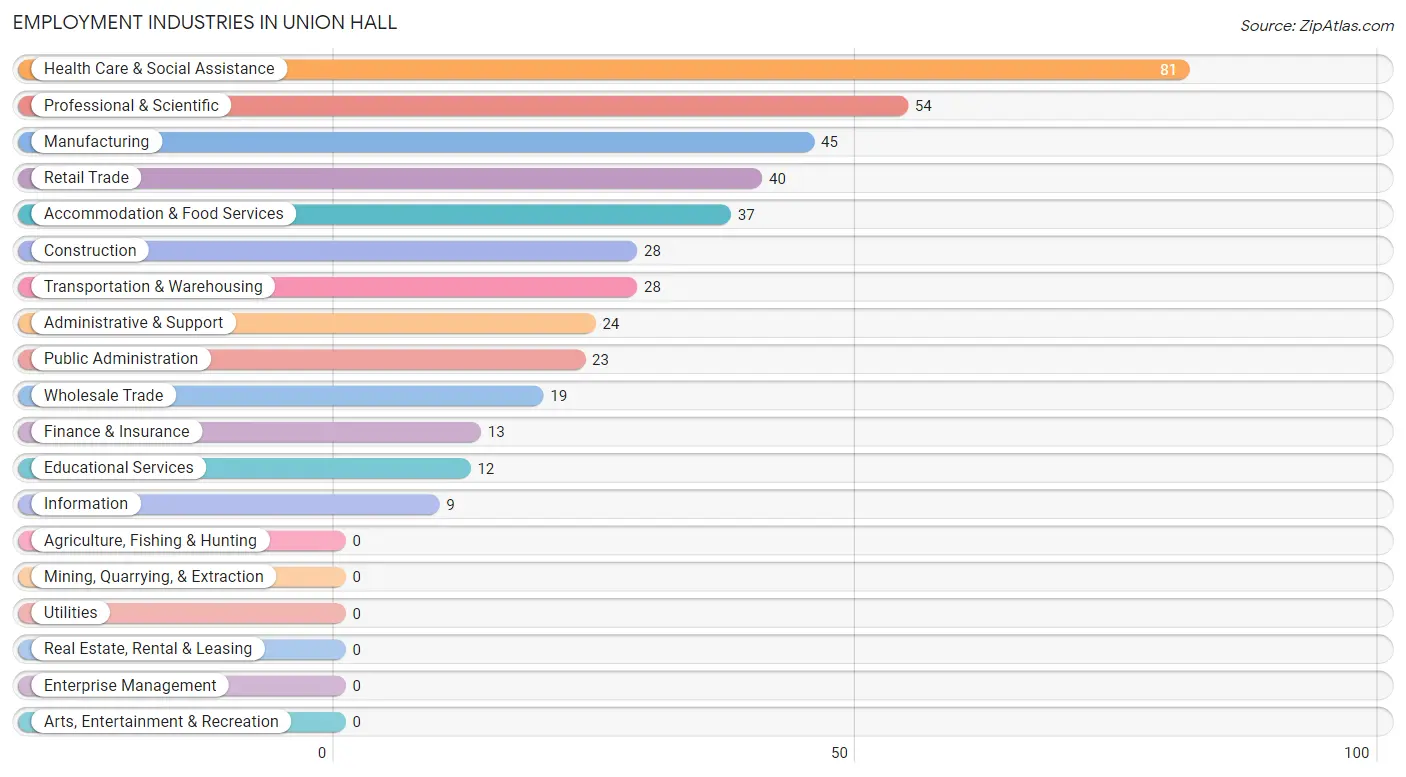
Employment Industries in Union Hall
The major employment industries in Union Hall include Health Care & Social Assistance (81 | 18.6%), Professional & Scientific (54 | 12.4%), Manufacturing (45 | 10.3%), Retail Trade (40 | 9.2%), and Accommodation & Food Services (37 | 8.5%).
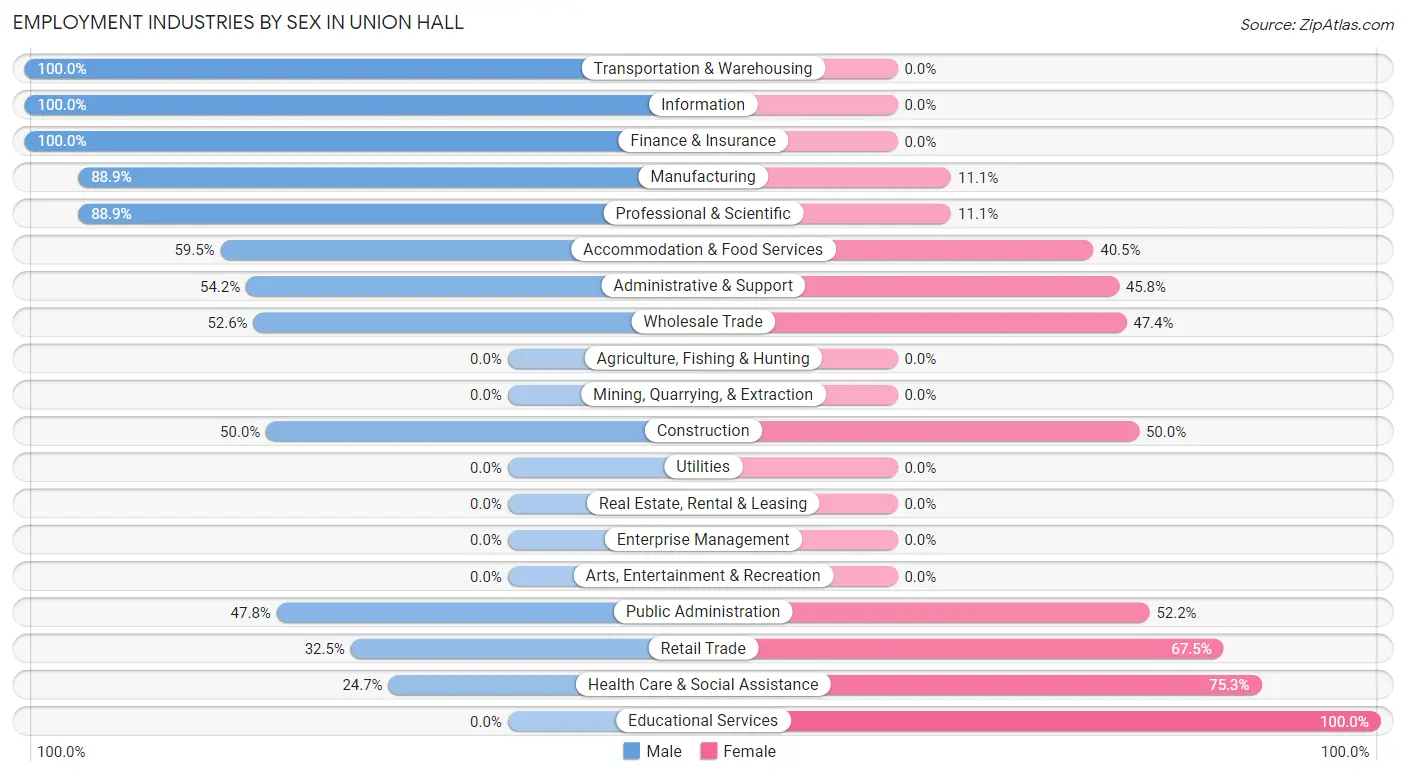
Employment Industries by Sex in Union Hall
The Union Hall industries that see more men than women are Transportation & Warehousing (100.0%), Information (100.0%), and Finance & Insurance (100.0%), whereas the industries that tend to have a higher number of women are Educational Services (100.0%), Health Care & Social Assistance (75.3%), and Retail Trade (67.5%).
| Industry | Male | Female |
| Agriculture, Fishing & Hunting | 0 (0.0%) | 0 (0.0%) |
| Mining, Quarrying, & Extraction | 0 (0.0%) | 0 (0.0%) |
| Construction | 14 (50.0%) | 14 (50.0%) |
| Manufacturing | 40 (88.9%) | 5 (11.1%) |
| Wholesale Trade | 10 (52.6%) | 9 (47.4%) |
| Retail Trade | 13 (32.5%) | 27 (67.5%) |
| Transportation & Warehousing | 28 (100.0%) | 0 (0.0%) |
| Utilities | 0 (0.0%) | 0 (0.0%) |
| Information | 9 (100.0%) | 0 (0.0%) |
| Finance & Insurance | 13 (100.0%) | 0 (0.0%) |
| Real Estate, Rental & Leasing | 0 (0.0%) | 0 (0.0%) |
| Professional & Scientific | 48 (88.9%) | 6 (11.1%) |
| Enterprise Management | 0 (0.0%) | 0 (0.0%) |
| Administrative & Support | 13 (54.2%) | 11 (45.8%) |
| Educational Services | 0 (0.0%) | 12 (100.0%) |
| Health Care & Social Assistance | 20 (24.7%) | 61 (75.3%) |
| Arts, Entertainment & Recreation | 0 (0.0%) | 0 (0.0%) |
| Accommodation & Food Services | 22 (59.5%) | 15 (40.5%) |
| Public Administration | 11 (47.8%) | 12 (52.2%) |
| Total | 241 (55.3%) | 195 (44.7%) |
Education in Union Hall
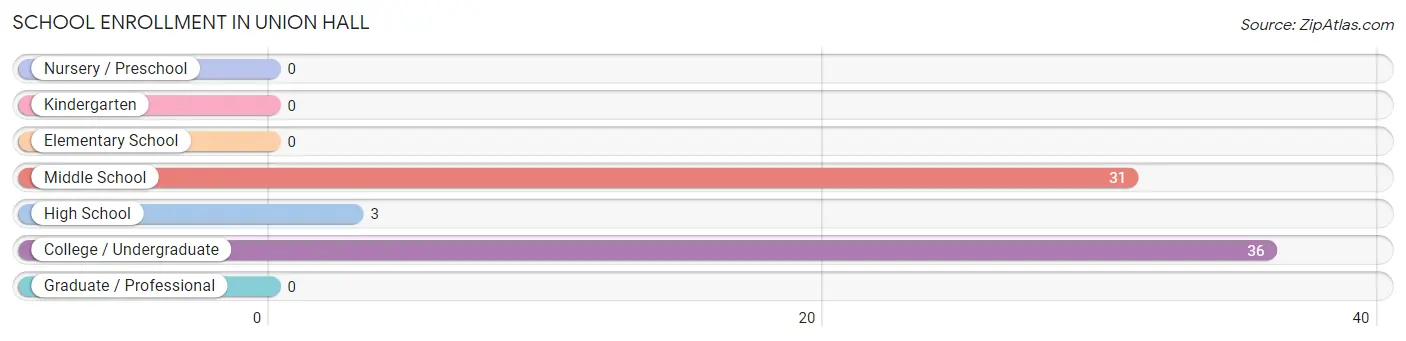
School Enrollment in Union Hall
The most common levels of schooling among the 70 students in Union Hall are college / undergraduate (36 | 51.4%), middle school (31 | 44.3%), and high school (3 | 4.3%).
| School Level | # Students | % Students |
| Nursery / Preschool | 0 | 0.0% |
| Kindergarten | 0 | 0.0% |
| Elementary School | 0 | 0.0% |
| Middle School | 31 | 44.3% |
| High School | 3 | 4.3% |
| College / Undergraduate | 36 | 51.4% |
| Graduate / Professional | 0 | 0.0% |
| Total | 70 | 100.0% |
School Enrollment by Age by Funding Source in Union Hall
Out of a total of 70 students who are enrolled in schools in Union Hall, 41 (58.6%) attend a private institution, while the remaining 29 (41.4%) are enrolled in public schools. The age group of 15 to 17 year olds has the highest likelihood of being enrolled in private schools, with 3 (100.0% in the age bracket) enrolled. Conversely, the age group of 20 to 24 year olds has the lowest likelihood of being enrolled in a private school, with 21 (67.7% in the age bracket) attending a public institution.
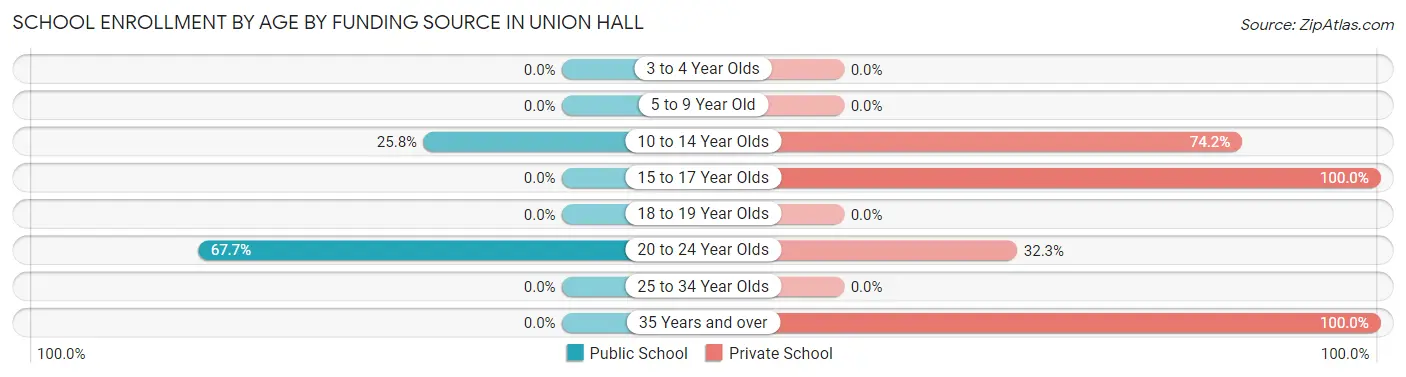
| Age Bracket | Public School | Private School |
| 3 to 4 Year Olds | 0 (0.0%) | 0 (0.0%) |
| 5 to 9 Year Old | 0 (0.0%) | 0 (0.0%) |
| 10 to 14 Year Olds | 8 (25.8%) | 23 (74.2%) |
| 15 to 17 Year Olds | 0 (0.0%) | 3 (100.0%) |
| 18 to 19 Year Olds | 0 (0.0%) | 0 (0.0%) |
| 20 to 24 Year Olds | 21 (67.7%) | 10 (32.3%) |
| 25 to 34 Year Olds | 0 (0.0%) | 0 (0.0%) |
| 35 Years and over | 0 (0.0%) | 5 (100.0%) |
| Total | 29 (41.4%) | 41 (58.6%) |
Educational Attainment by Field of Study in Union Hall
Business (133 | 26.4%), education (76 | 15.1%), computers & mathematics (46 | 9.1%), bio, nature & agricultural (38 | 7.5%), and engineering (35 | 6.9%) are the most common fields of study among 504 individuals in Union Hall who have obtained a bachelor's degree or higher.
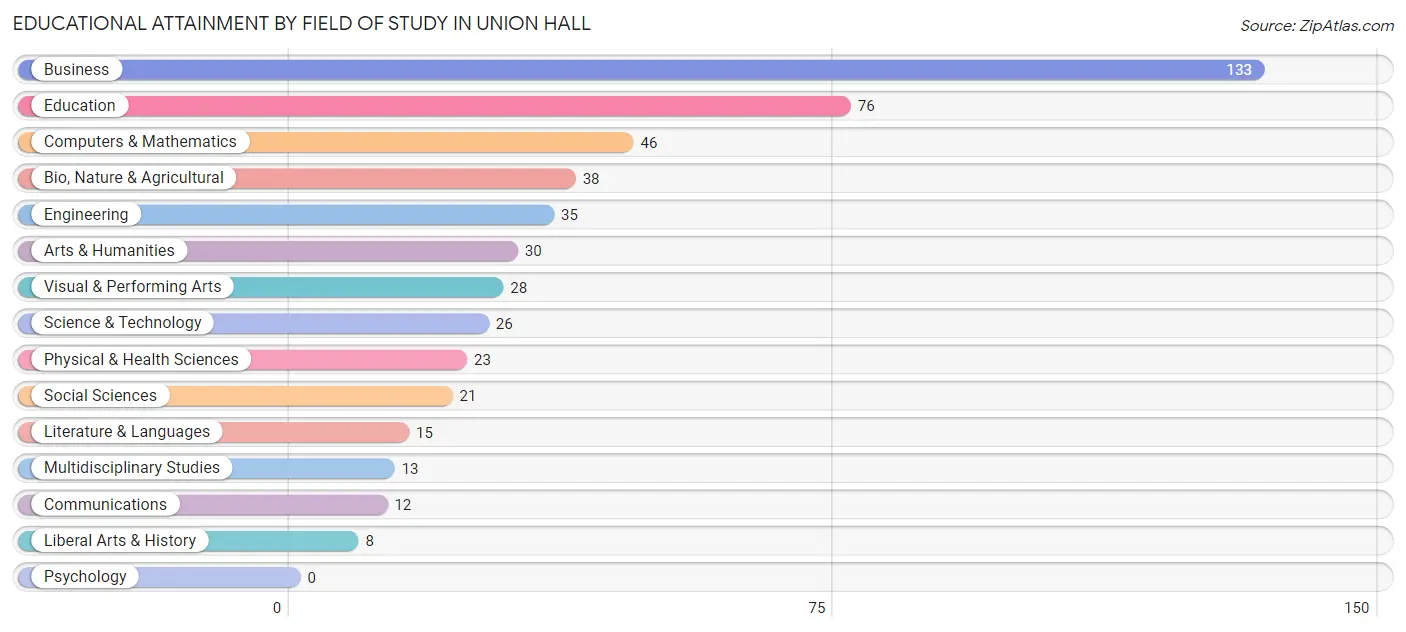
| Field of Study | # Graduates | % Graduates |
| Computers & Mathematics | 46 | 9.1% |
| Bio, Nature & Agricultural | 38 | 7.5% |
| Physical & Health Sciences | 23 | 4.6% |
| Psychology | 0 | 0.0% |
| Social Sciences | 21 | 4.2% |
| Engineering | 35 | 6.9% |
| Multidisciplinary Studies | 13 | 2.6% |
| Science & Technology | 26 | 5.2% |
| Business | 133 | 26.4% |
| Education | 76 | 15.1% |
| Literature & Languages | 15 | 3.0% |
| Liberal Arts & History | 8 | 1.6% |
| Visual & Performing Arts | 28 | 5.6% |
| Communications | 12 | 2.4% |
| Arts & Humanities | 30 | 5.9% |
| Total | 504 | 100.0% |
Transportation & Commute in Union Hall
Vehicle Availability by Sex in Union Hall
The most prevalent vehicle ownership categories in Union Hall are males with 2 vehicles (96, accounting for 42.9%) and females with 2 vehicles (33, making up 54.9%).
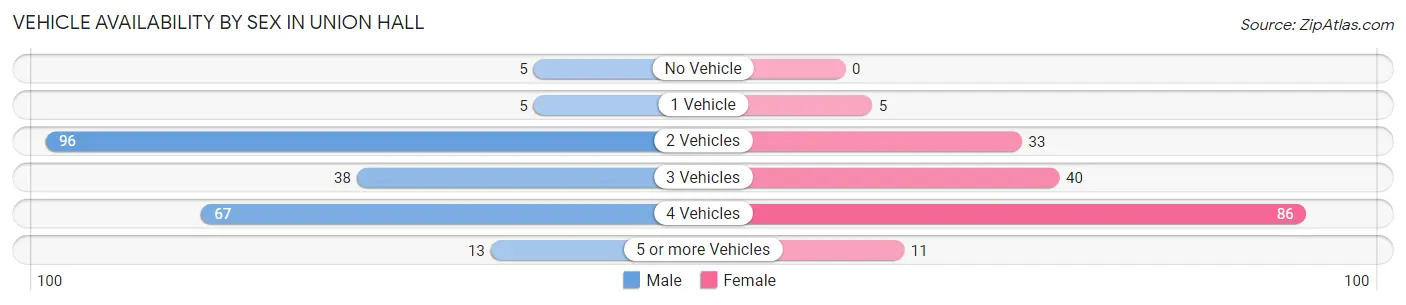
| Vehicles Available | Male | Female |
| No Vehicle | 5 (2.2%) | 0 (0.0%) |
| 1 Vehicle | 5 (2.2%) | 5 (2.9%) |
| 2 Vehicles | 96 (42.9%) | 33 (18.9%) |
| 3 Vehicles | 38 (17.0%) | 40 (22.9%) |
| 4 Vehicles | 67 (29.9%) | 86 (49.1%) |
| 5 or more Vehicles | 13 (5.8%) | 11 (6.3%) |
| Total | 224 (100.0%) | 175 (100.0%) |
Commute Time in Union Hall
The most frequently occuring commute durations in Union Hall are 45 to 59 minutes (139 commuters, 50.0%), 25 to 29 minutes (37 commuters, 13.3%), and 20 to 24 minutes (33 commuters, 11.9%).
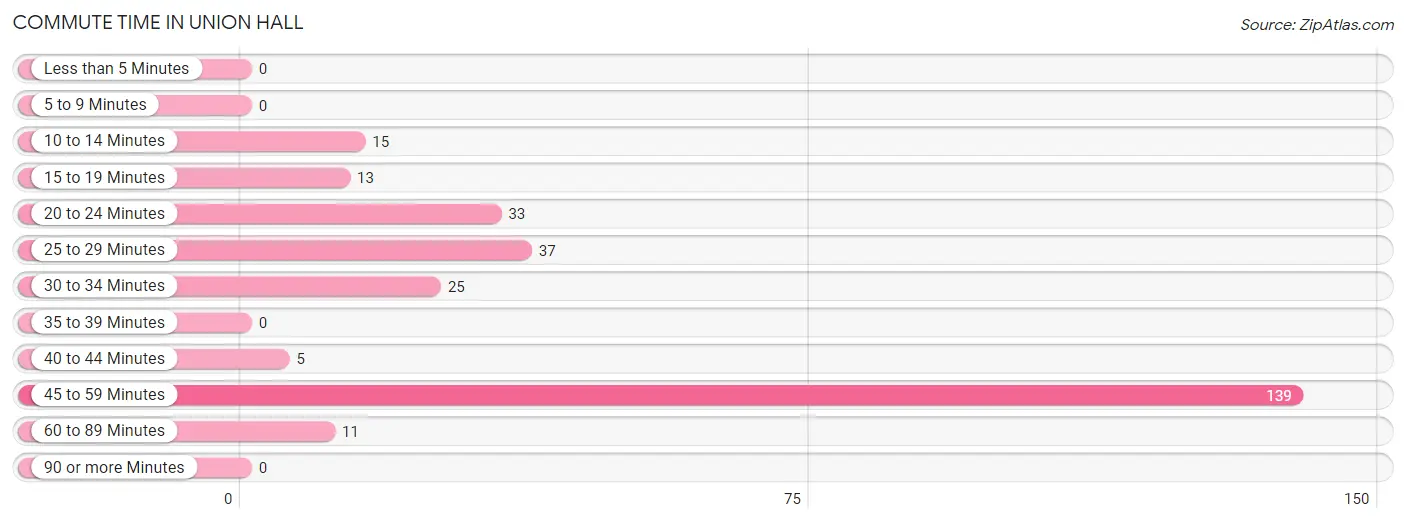
| Commute Time | # Commuters | % Commuters |
| Less than 5 Minutes | 0 | 0.0% |
| 5 to 9 Minutes | 0 | 0.0% |
| 10 to 14 Minutes | 15 | 5.4% |
| 15 to 19 Minutes | 13 | 4.7% |
| 20 to 24 Minutes | 33 | 11.9% |
| 25 to 29 Minutes | 37 | 13.3% |
| 30 to 34 Minutes | 25 | 9.0% |
| 35 to 39 Minutes | 0 | 0.0% |
| 40 to 44 Minutes | 5 | 1.8% |
| 45 to 59 Minutes | 139 | 50.0% |
| 60 to 89 Minutes | 11 | 4.0% |
| 90 or more Minutes | 0 | 0.0% |
Commute Time by Sex in Union Hall
The most common commute times in Union Hall are 45 to 59 minutes (70 commuters, 53.4%) for males and 45 to 59 minutes (69 commuters, 46.9%) for females.
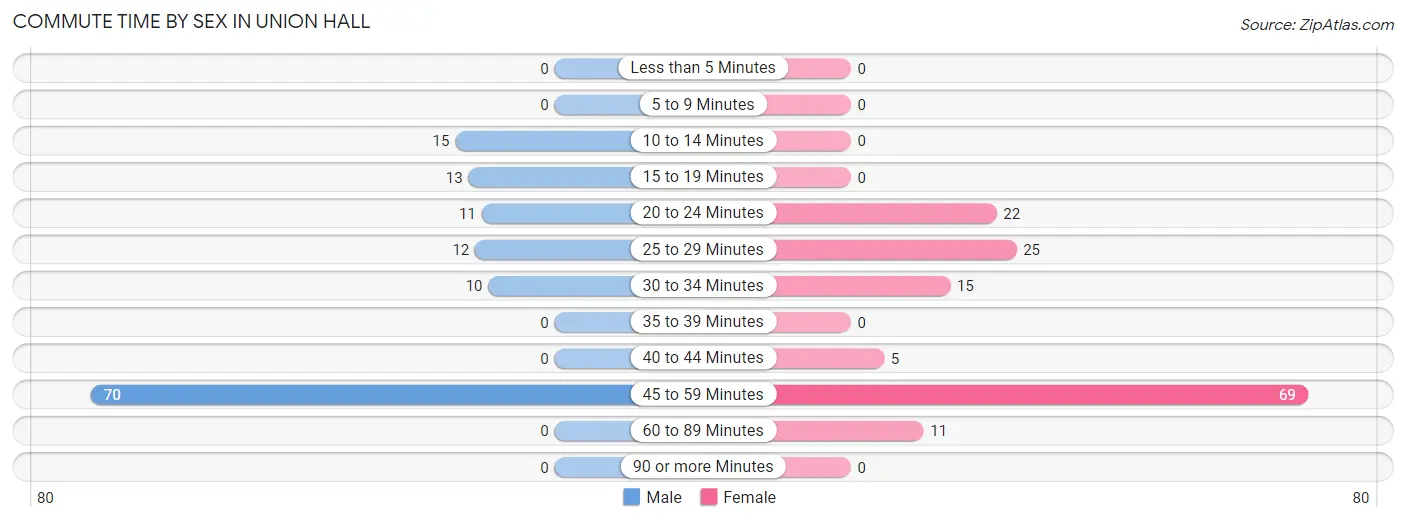
| Commute Time | Male | Female |
| Less than 5 Minutes | 0 (0.0%) | 0 (0.0%) |
| 5 to 9 Minutes | 0 (0.0%) | 0 (0.0%) |
| 10 to 14 Minutes | 15 (11.5%) | 0 (0.0%) |
| 15 to 19 Minutes | 13 (9.9%) | 0 (0.0%) |
| 20 to 24 Minutes | 11 (8.4%) | 22 (15.0%) |
| 25 to 29 Minutes | 12 (9.2%) | 25 (17.0%) |
| 30 to 34 Minutes | 10 (7.6%) | 15 (10.2%) |
| 35 to 39 Minutes | 0 (0.0%) | 0 (0.0%) |
| 40 to 44 Minutes | 0 (0.0%) | 5 (3.4%) |
| 45 to 59 Minutes | 70 (53.4%) | 69 (46.9%) |
| 60 to 89 Minutes | 0 (0.0%) | 11 (7.5%) |
| 90 or more Minutes | 0 (0.0%) | 0 (0.0%) |
Time of Departure to Work by Sex in Union Hall
The most frequent times of departure to work in Union Hall are 7:00 AM to 7:29 AM (47, 35.9%) for males and 6:30 AM to 6:59 AM (56, 38.1%) for females.
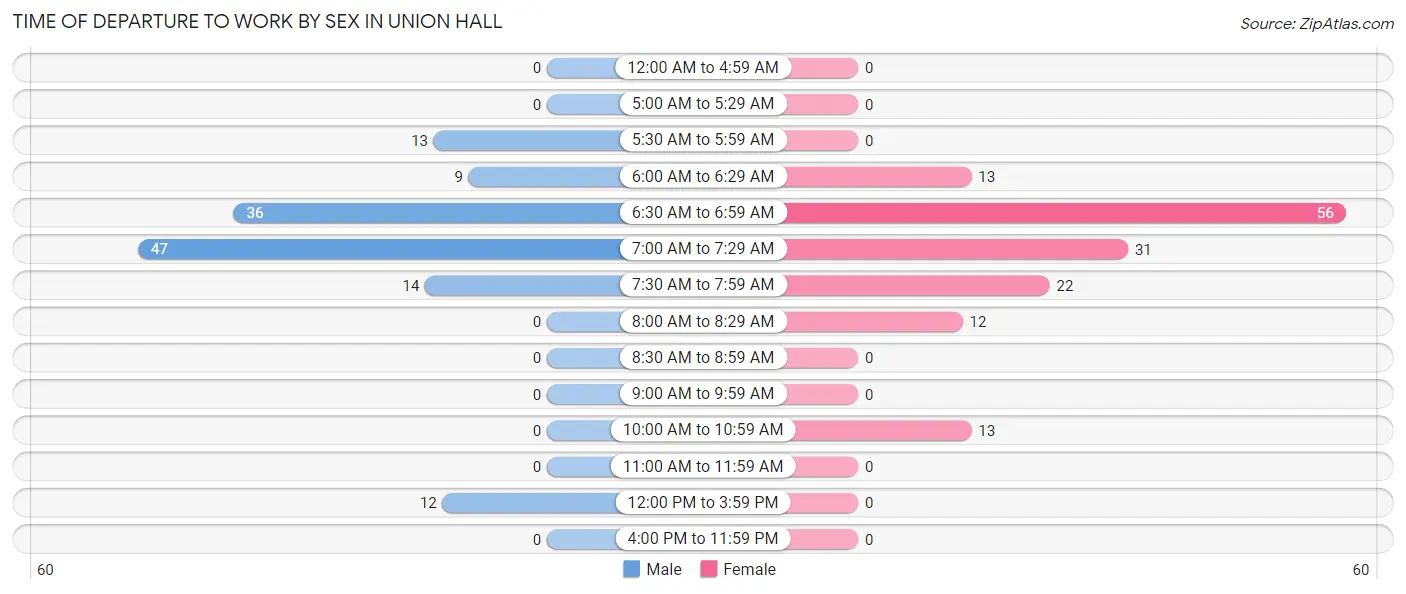
| Time of Departure | Male | Female |
| 12:00 AM to 4:59 AM | 0 (0.0%) | 0 (0.0%) |
| 5:00 AM to 5:29 AM | 0 (0.0%) | 0 (0.0%) |
| 5:30 AM to 5:59 AM | 13 (9.9%) | 0 (0.0%) |
| 6:00 AM to 6:29 AM | 9 (6.9%) | 13 (8.8%) |
| 6:30 AM to 6:59 AM | 36 (27.5%) | 56 (38.1%) |
| 7:00 AM to 7:29 AM | 47 (35.9%) | 31 (21.1%) |
| 7:30 AM to 7:59 AM | 14 (10.7%) | 22 (15.0%) |
| 8:00 AM to 8:29 AM | 0 (0.0%) | 12 (8.2%) |
| 8:30 AM to 8:59 AM | 0 (0.0%) | 0 (0.0%) |
| 9:00 AM to 9:59 AM | 0 (0.0%) | 0 (0.0%) |
| 10:00 AM to 10:59 AM | 0 (0.0%) | 13 (8.8%) |
| 11:00 AM to 11:59 AM | 0 (0.0%) | 0 (0.0%) |
| 12:00 PM to 3:59 PM | 12 (9.2%) | 0 (0.0%) |
| 4:00 PM to 11:59 PM | 0 (0.0%) | 0 (0.0%) |
| Total | 131 (100.0%) | 147 (100.0%) |
Housing Occupancy in Union Hall
Occupancy by Ownership in Union Hall
Of the total 530 dwellings in Union Hall, owner-occupied units account for 497 (93.8%), while renter-occupied units make up 33 (6.2%).
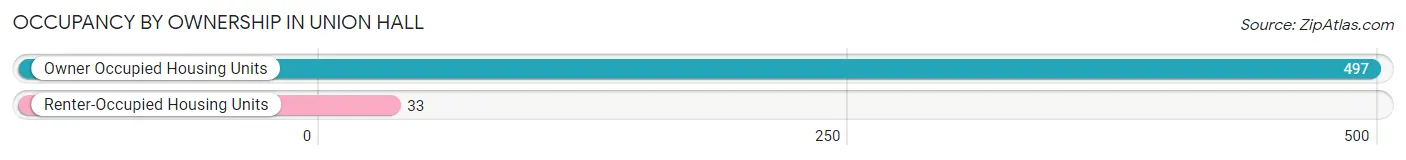
| Occupancy | # Housing Units | % Housing Units |
| Owner Occupied Housing Units | 497 | 93.8% |
| Renter-Occupied Housing Units | 33 | 6.2% |
| Total Occupied Housing Units | 530 | 100.0% |
Occupancy by Household Size in Union Hall
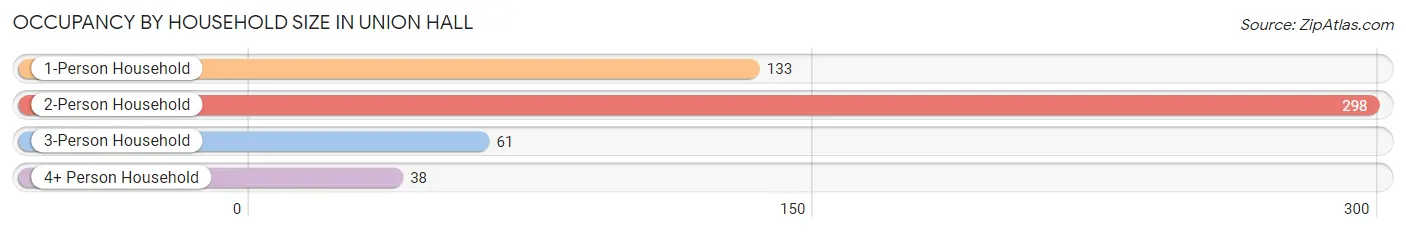
| Household Size | # Housing Units | % Housing Units |
| 1-Person Household | 133 | 25.1% |
| 2-Person Household | 298 | 56.2% |
| 3-Person Household | 61 | 11.5% |
| 4+ Person Household | 38 | 7.2% |
| Total Housing Units | 530 | 100.0% |
Occupancy by Ownership by Household Size in Union Hall
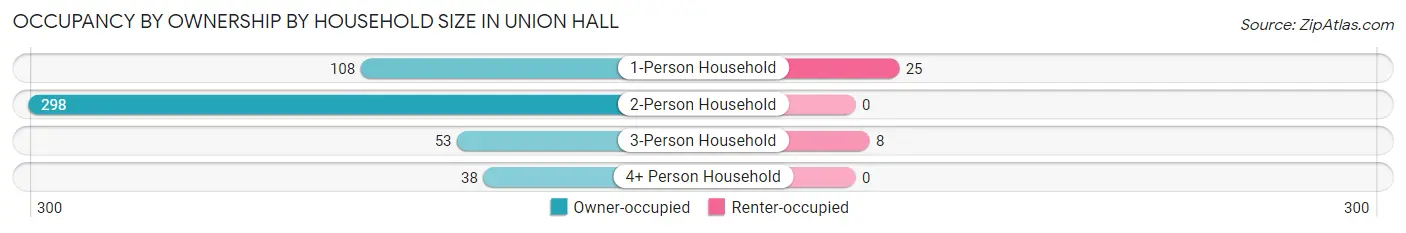
| Household Size | Owner-occupied | Renter-occupied |
| 1-Person Household | 108 (81.2%) | 25 (18.8%) |
| 2-Person Household | 298 (100.0%) | 0 (0.0%) |
| 3-Person Household | 53 (86.9%) | 8 (13.1%) |
| 4+ Person Household | 38 (100.0%) | 0 (0.0%) |
| Total Housing Units | 497 (93.8%) | 33 (6.2%) |
Occupancy by Educational Attainment in Union Hall
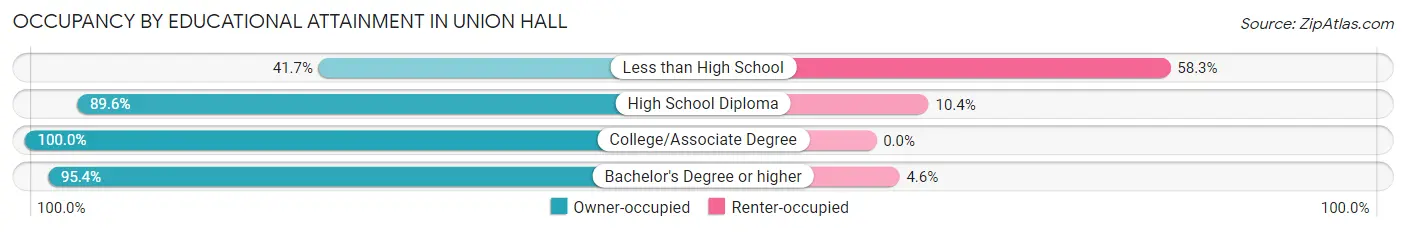
| Household Size | Owner-occupied | Renter-occupied |
| Less than High School | 10 (41.7%) | 14 (58.3%) |
| High School Diploma | 69 (89.6%) | 8 (10.4%) |
| College/Associate Degree | 191 (100.0%) | 0 (0.0%) |
| Bachelor's Degree or higher | 227 (95.4%) | 11 (4.6%) |
Occupancy by Age of Householder in Union Hall
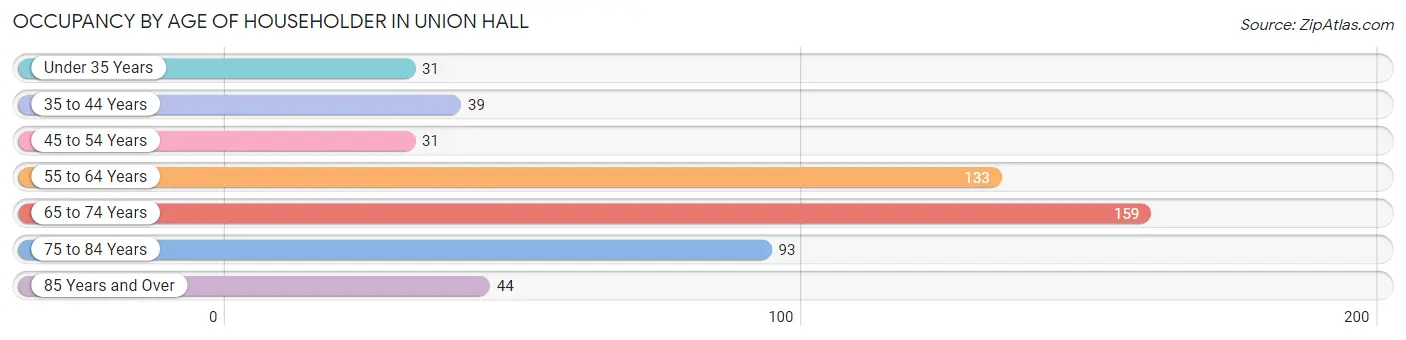
| Age Bracket | # Households | % Households |
| Under 35 Years | 31 | 5.9% |
| 35 to 44 Years | 39 | 7.4% |
| 45 to 54 Years | 31 | 5.9% |
| 55 to 64 Years | 133 | 25.1% |
| 65 to 74 Years | 159 | 30.0% |
| 75 to 84 Years | 93 | 17.5% |
| 85 Years and Over | 44 | 8.3% |
| Total | 530 | 100.0% |
Housing Finances in Union Hall
Median Income by Occupancy in Union Hall
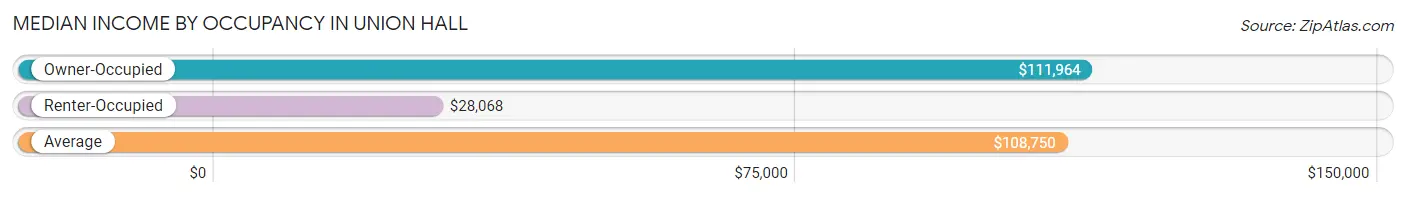
| Occupancy Type | # Households | Median Income |
| Owner-Occupied | 497 (93.8%) | $111,964 |
| Renter-Occupied | 33 (6.2%) | $28,068 |
| Average | 530 (100.0%) | $108,750 |
Occupancy by Householder Income Bracket in Union Hall
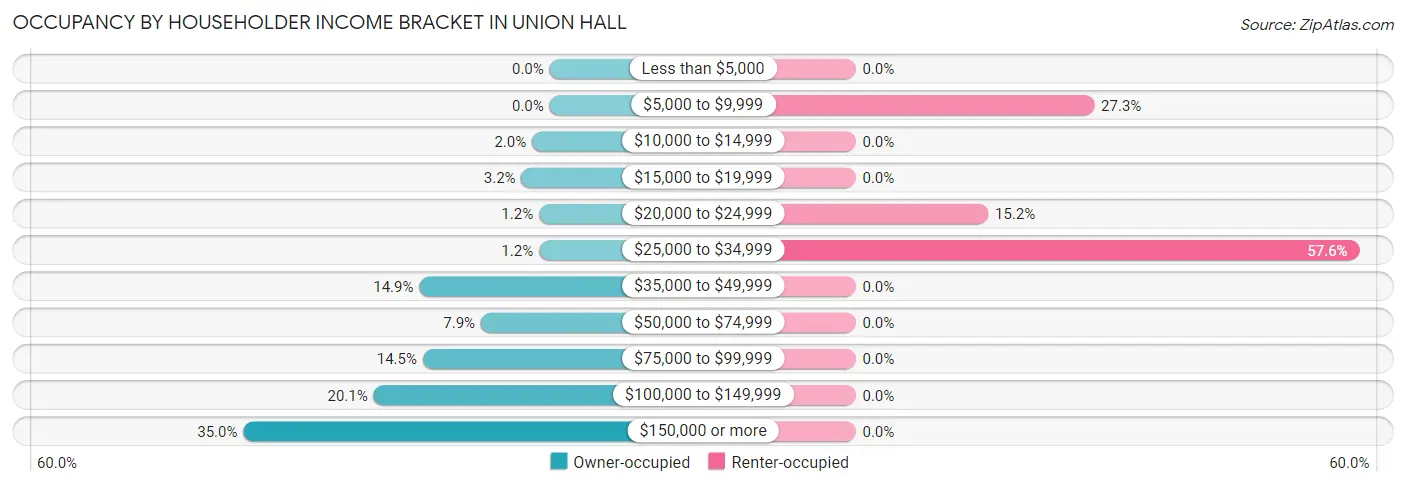
| Income Bracket | Owner-occupied | Renter-occupied |
| Less than $5,000 | 0 (0.0%) | 0 (0.0%) |
| $5,000 to $9,999 | 0 (0.0%) | 9 (27.3%) |
| $10,000 to $14,999 | 10 (2.0%) | 0 (0.0%) |
| $15,000 to $19,999 | 16 (3.2%) | 0 (0.0%) |
| $20,000 to $24,999 | 6 (1.2%) | 5 (15.1%) |
| $25,000 to $34,999 | 6 (1.2%) | 19 (57.6%) |
| $35,000 to $49,999 | 74 (14.9%) | 0 (0.0%) |
| $50,000 to $74,999 | 39 (7.9%) | 0 (0.0%) |
| $75,000 to $99,999 | 72 (14.5%) | 0 (0.0%) |
| $100,000 to $149,999 | 100 (20.1%) | 0 (0.0%) |
| $150,000 or more | 174 (35.0%) | 0 (0.0%) |
| Total | 497 (100.0%) | 33 (100.0%) |
Monthly Housing Cost Tiers in Union Hall
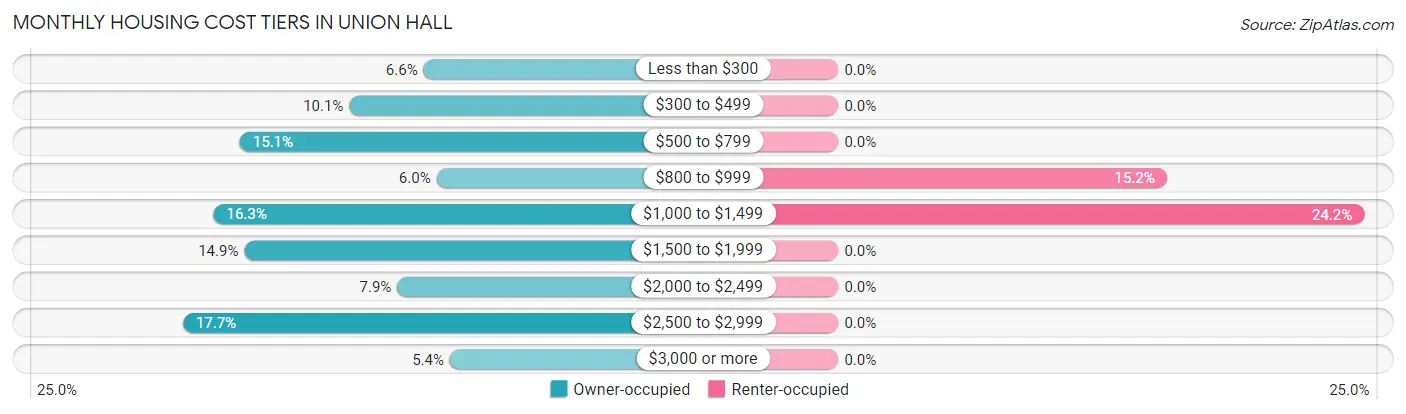
| Monthly Cost | Owner-occupied | Renter-occupied |
| Less than $300 | 33 (6.6%) | 0 (0.0%) |
| $300 to $499 | 50 (10.1%) | 0 (0.0%) |
| $500 to $799 | 75 (15.1%) | 0 (0.0%) |
| $800 to $999 | 30 (6.0%) | 5 (15.1%) |
| $1,000 to $1,499 | 81 (16.3%) | 8 (24.2%) |
| $1,500 to $1,999 | 74 (14.9%) | 0 (0.0%) |
| $2,000 to $2,499 | 39 (7.9%) | 0 (0.0%) |
| $2,500 to $2,999 | 88 (17.7%) | 0 (0.0%) |
| $3,000 or more | 27 (5.4%) | 0 (0.0%) |
| Total | 497 (100.0%) | 33 (100.0%) |
Physical Housing Characteristics in Union Hall
Housing Structures in Union Hall
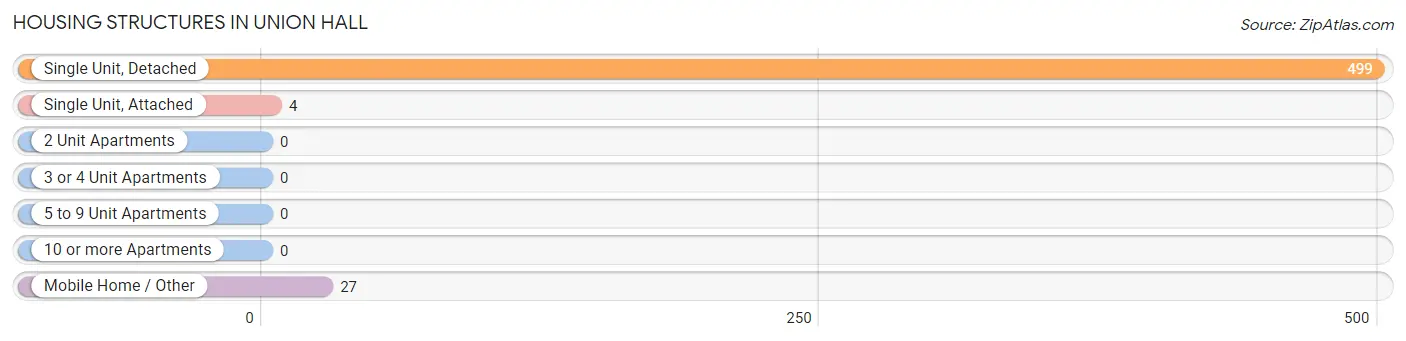
| Structure Type | # Housing Units | % Housing Units |
| Single Unit, Detached | 499 | 94.2% |
| Single Unit, Attached | 4 | 0.7% |
| 2 Unit Apartments | 0 | 0.0% |
| 3 or 4 Unit Apartments | 0 | 0.0% |
| 5 to 9 Unit Apartments | 0 | 0.0% |
| 10 or more Apartments | 0 | 0.0% |
| Mobile Home / Other | 27 | 5.1% |
| Total | 530 | 100.0% |
Housing Structures by Occupancy in Union Hall
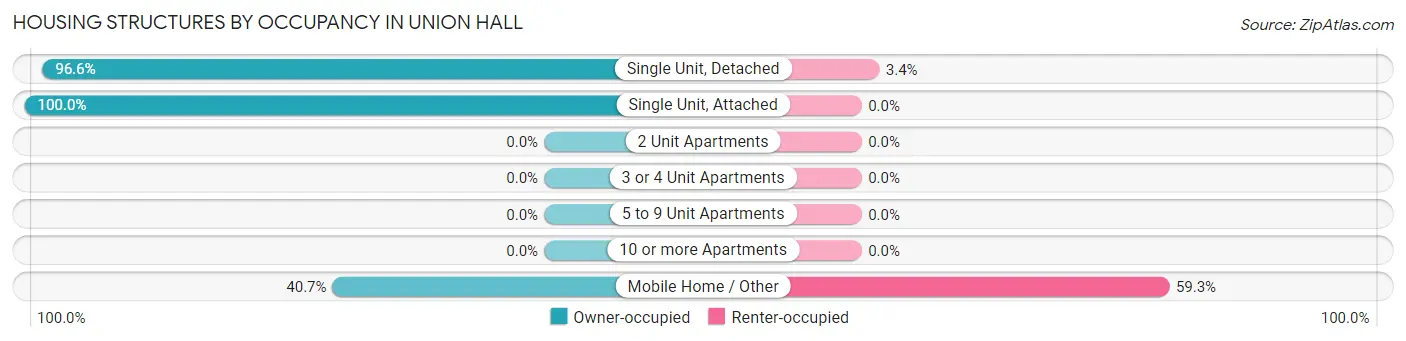
| Structure Type | Owner-occupied | Renter-occupied |
| Single Unit, Detached | 482 (96.6%) | 17 (3.4%) |
| Single Unit, Attached | 4 (100.0%) | 0 (0.0%) |
| 2 Unit Apartments | 0 (0.0%) | 0 (0.0%) |
| 3 or 4 Unit Apartments | 0 (0.0%) | 0 (0.0%) |
| 5 to 9 Unit Apartments | 0 (0.0%) | 0 (0.0%) |
| 10 or more Apartments | 0 (0.0%) | 0 (0.0%) |
| Mobile Home / Other | 11 (40.7%) | 16 (59.3%) |
| Total | 497 (93.8%) | 33 (6.2%) |
Housing Structures by Number of Rooms in Union Hall
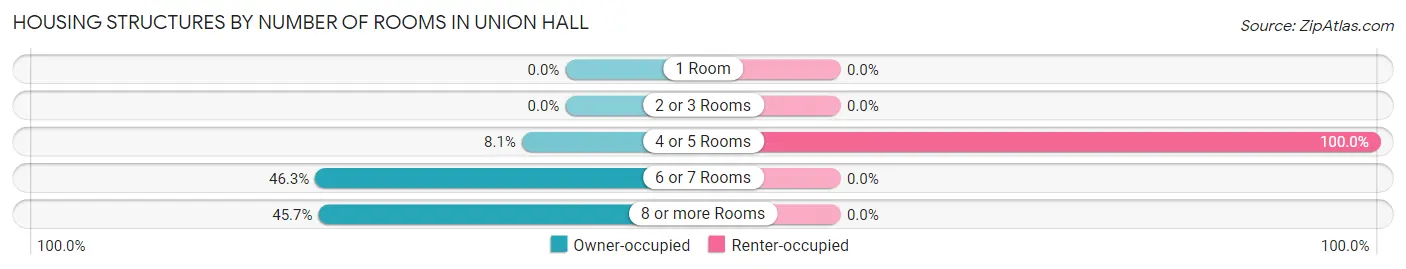
| Number of Rooms | Owner-occupied | Renter-occupied |
| 1 Room | 0 (0.0%) | 0 (0.0%) |
| 2 or 3 Rooms | 0 (0.0%) | 0 (0.0%) |
| 4 or 5 Rooms | 40 (8.1%) | 33 (100.0%) |
| 6 or 7 Rooms | 230 (46.3%) | 0 (0.0%) |
| 8 or more Rooms | 227 (45.7%) | 0 (0.0%) |
| Total | 497 (100.0%) | 33 (100.0%) |
Housing Structure by Heating Type in Union Hall
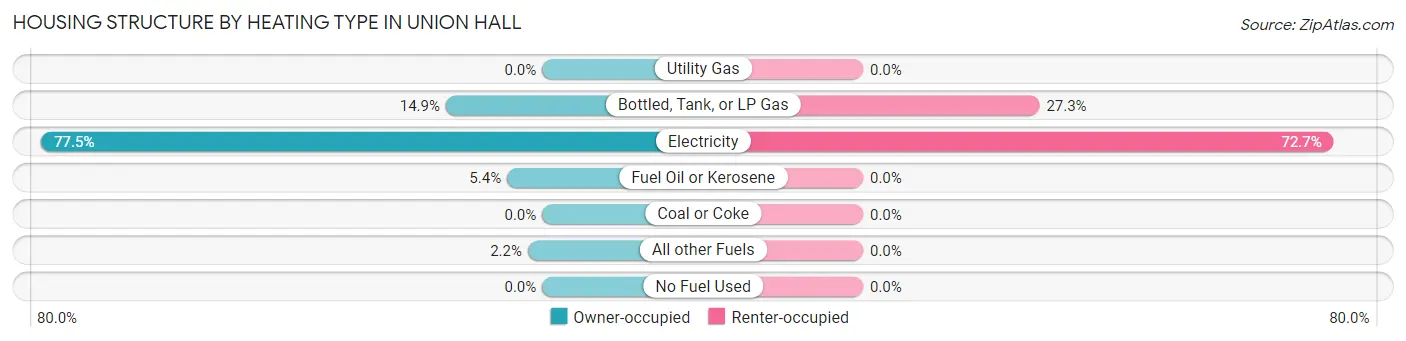
| Heating Type | Owner-occupied | Renter-occupied |
| Utility Gas | 0 (0.0%) | 0 (0.0%) |
| Bottled, Tank, or LP Gas | 74 (14.9%) | 9 (27.3%) |
| Electricity | 385 (77.5%) | 24 (72.7%) |
| Fuel Oil or Kerosene | 27 (5.4%) | 0 (0.0%) |
| Coal or Coke | 0 (0.0%) | 0 (0.0%) |
| All other Fuels | 11 (2.2%) | 0 (0.0%) |
| No Fuel Used | 0 (0.0%) | 0 (0.0%) |
| Total | 497 (100.0%) | 33 (100.0%) |
Household Vehicle Usage in Union Hall
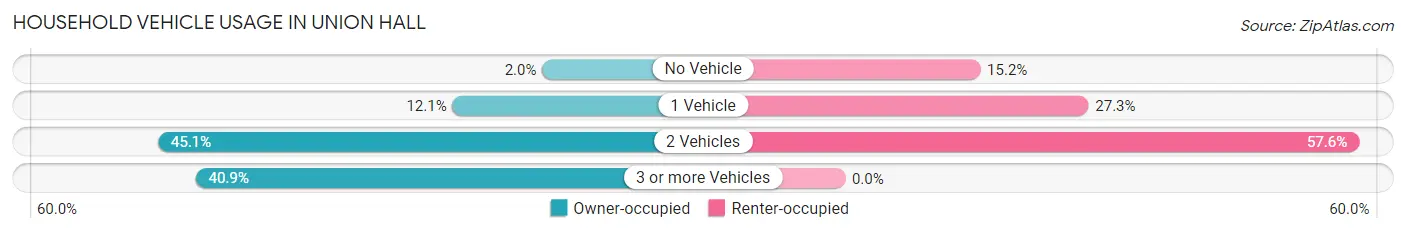
| Vehicles per Household | Owner-occupied | Renter-occupied |
| No Vehicle | 10 (2.0%) | 5 (15.1%) |
| 1 Vehicle | 60 (12.1%) | 9 (27.3%) |
| 2 Vehicles | 224 (45.1%) | 19 (57.6%) |
| 3 or more Vehicles | 203 (40.8%) | 0 (0.0%) |
| Total | 497 (100.0%) | 33 (100.0%) |
Real Estate & Mortgages in Union Hall
Real Estate and Mortgage Overview in Union Hall
| Characteristic | Without Mortgage | With Mortgage |
| Housing Units | 213 | 284 |
| Median Property Value | $536,000 | $668,100 |
| Median Household Income | $89,107 | $129 |
| Monthly Housing Costs | $544 | $27 |
| Real Estate Taxes | $2,847 | $0 |
Property Value by Mortgage Status in Union Hall
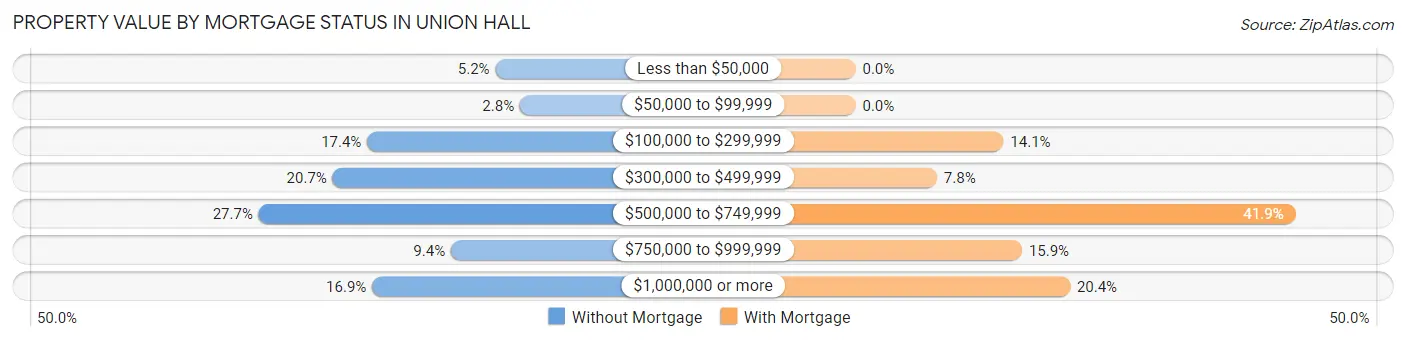
| Property Value | Without Mortgage | With Mortgage |
| Less than $50,000 | 11 (5.2%) | 0 (0.0%) |
| $50,000 to $99,999 | 6 (2.8%) | 0 (0.0%) |
| $100,000 to $299,999 | 37 (17.4%) | 40 (14.1%) |
| $300,000 to $499,999 | 44 (20.7%) | 22 (7.7%) |
| $500,000 to $749,999 | 59 (27.7%) | 119 (41.9%) |
| $750,000 to $999,999 | 20 (9.4%) | 45 (15.9%) |
| $1,000,000 or more | 36 (16.9%) | 58 (20.4%) |
| Total | 213 (100.0%) | 284 (100.0%) |
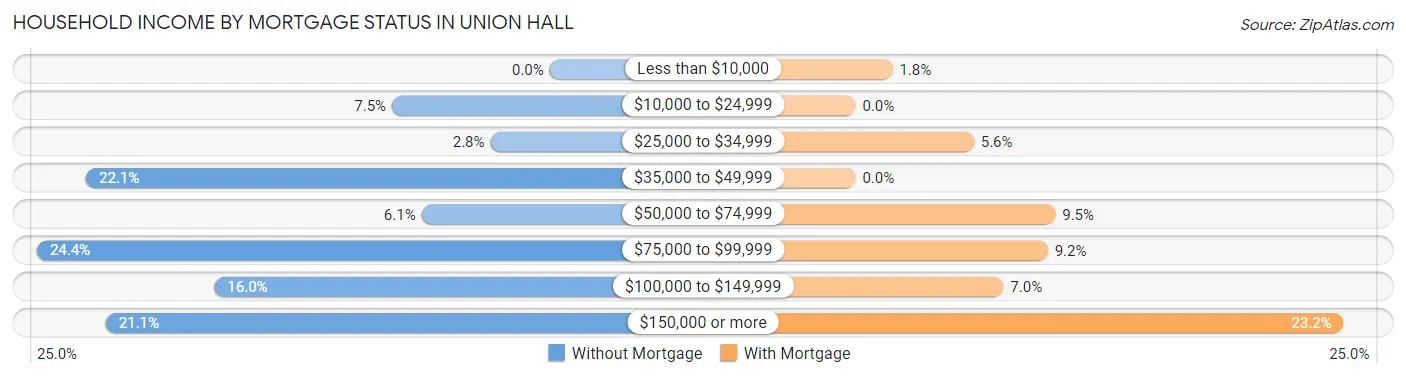
Household Income by Mortgage Status in Union Hall
| Household Income | Without Mortgage | With Mortgage |
| Less than $10,000 | 0 (0.0%) | 5 (1.8%) |
| $10,000 to $24,999 | 16 (7.5%) | 0 (0.0%) |
| $25,000 to $34,999 | 6 (2.8%) | 16 (5.6%) |
| $35,000 to $49,999 | 47 (22.1%) | 0 (0.0%) |
| $50,000 to $74,999 | 13 (6.1%) | 27 (9.5%) |
| $75,000 to $99,999 | 52 (24.4%) | 26 (9.1%) |
| $100,000 to $149,999 | 34 (16.0%) | 20 (7.0%) |
| $150,000 or more | 45 (21.1%) | 66 (23.2%) |
| Total | 213 (100.0%) | 284 (100.0%) |
Property Value to Household Income Ratio in Union Hall
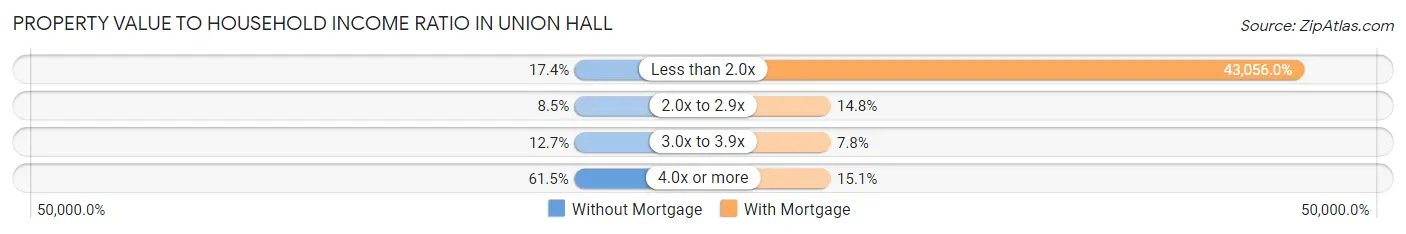
| Value-to-Income Ratio | Without Mortgage | With Mortgage |
| Less than 2.0x | 37 (17.4%) | 122,279 (43,056.0%) |
| 2.0x to 2.9x | 18 (8.5%) | 42 (14.8%) |
| 3.0x to 3.9x | 27 (12.7%) | 22 (7.7%) |
| 4.0x or more | 131 (61.5%) | 43 (15.1%) |
| Total | 213 (100.0%) | 284 (100.0%) |
Real Estate Taxes by Mortgage Status in Union Hall
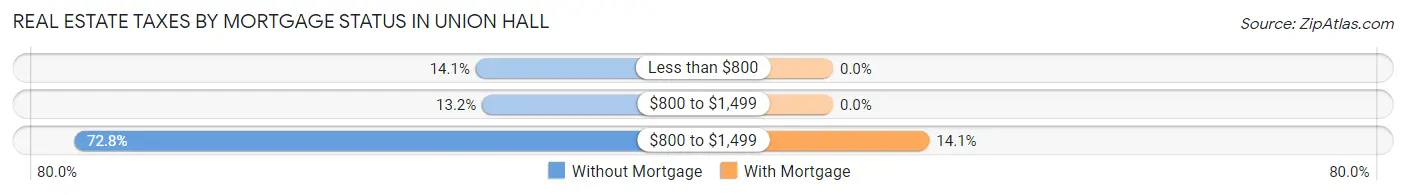
| Property Taxes | Without Mortgage | With Mortgage |
| Less than $800 | 30 (14.1%) | 0 (0.0%) |
| $800 to $1,499 | 28 (13.2%) | 0 (0.0%) |
| $800 to $1,499 | 155 (72.8%) | 40 (14.1%) |
| Total | 213 (100.0%) | 284 (100.0%) |
Health & Disability in Union Hall
Health Insurance Coverage by Age in Union Hall
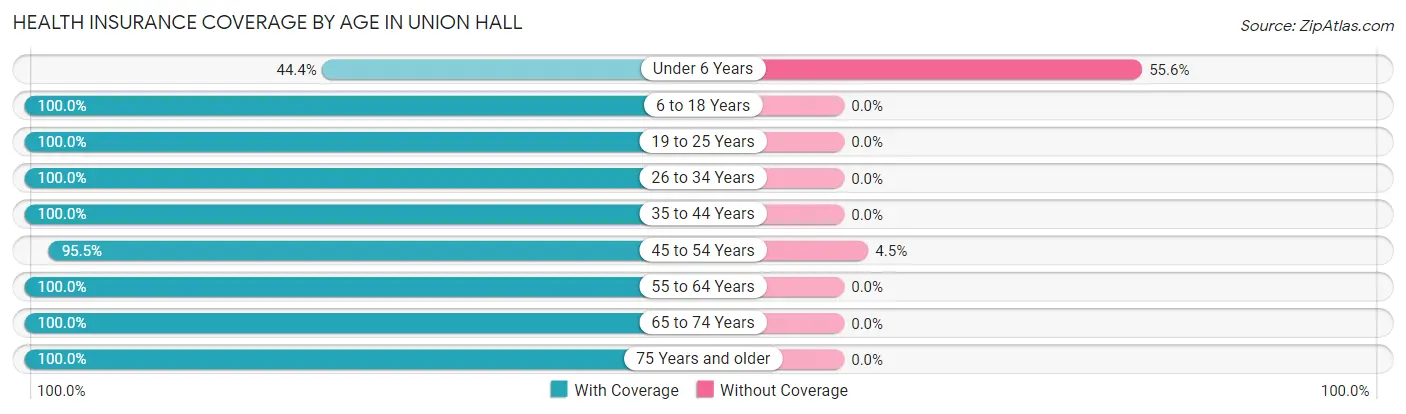
| Age Bracket | With Coverage | Without Coverage |
| Under 6 Years | 12 (44.4%) | 15 (55.6%) |
| 6 to 18 Years | 34 (100.0%) | 0 (0.0%) |
| 19 to 25 Years | 86 (100.0%) | 0 (0.0%) |
| 26 to 34 Years | 37 (100.0%) | 0 (0.0%) |
| 35 to 44 Years | 75 (100.0%) | 0 (0.0%) |
| 45 to 54 Years | 106 (95.5%) | 5 (4.5%) |
| 55 to 64 Years | 224 (100.0%) | 0 (0.0%) |
| 65 to 74 Years | 286 (100.0%) | 0 (0.0%) |
| 75 Years and older | 191 (100.0%) | 0 (0.0%) |
| Total | 1,051 (98.1%) | 20 (1.9%) |
Health Insurance Coverage by Citizenship Status in Union Hall
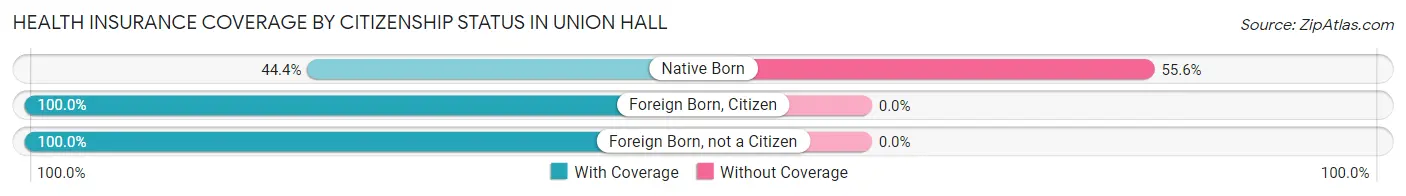
| Citizenship Status | With Coverage | Without Coverage |
| Native Born | 12 (44.4%) | 15 (55.6%) |
| Foreign Born, Citizen | 34 (100.0%) | 0 (0.0%) |
| Foreign Born, not a Citizen | 86 (100.0%) | 0 (0.0%) |
Health Insurance Coverage by Household Income in Union Hall
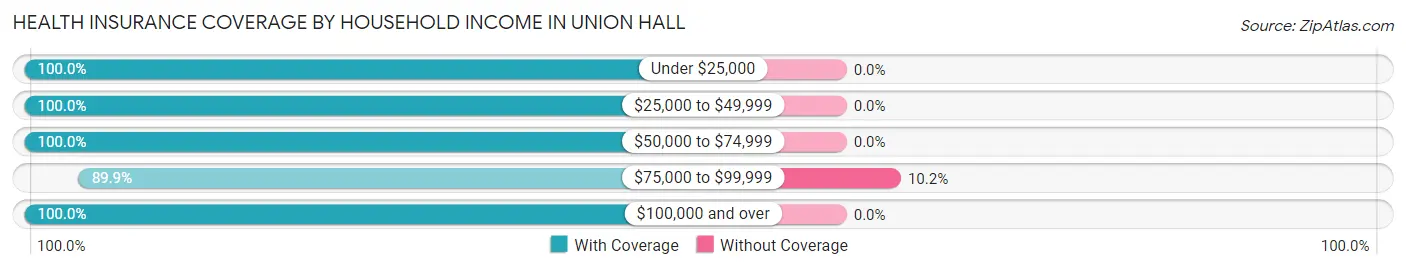
| Household Income | With Coverage | Without Coverage |
| Under $25,000 | 56 (100.0%) | 0 (0.0%) |
| $25,000 to $49,999 | 169 (100.0%) | 0 (0.0%) |
| $50,000 to $74,999 | 69 (100.0%) | 0 (0.0%) |
| $75,000 to $99,999 | 177 (89.8%) | 20 (10.2%) |
| $100,000 and over | 580 (100.0%) | 0 (0.0%) |
Public vs Private Health Insurance Coverage by Age in Union Hall
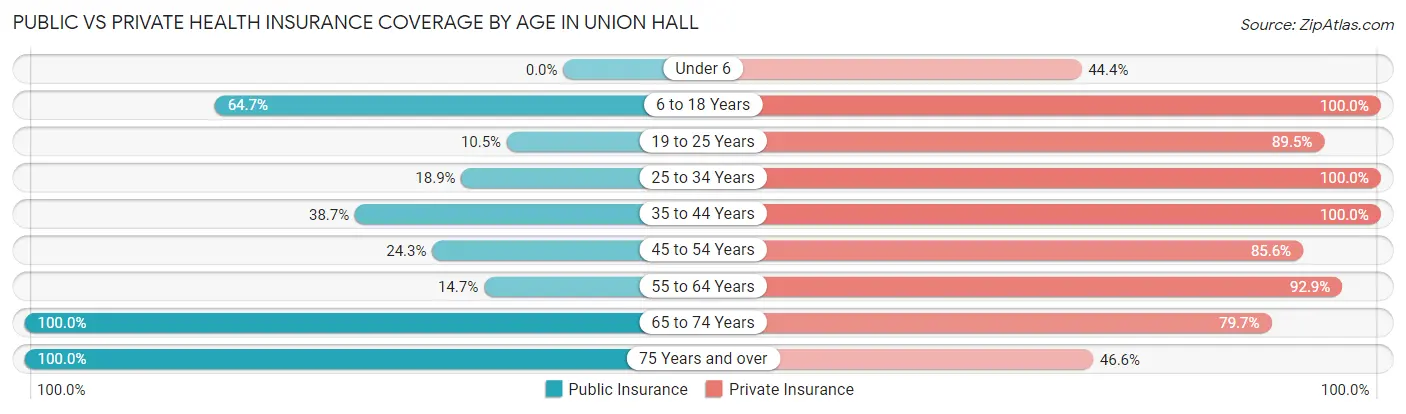
| Age Bracket | Public Insurance | Private Insurance |
| Under 6 | 0 (0.0%) | 12 (44.4%) |
| 6 to 18 Years | 22 (64.7%) | 34 (100.0%) |
| 19 to 25 Years | 9 (10.5%) | 77 (89.5%) |
| 25 to 34 Years | 7 (18.9%) | 37 (100.0%) |
| 35 to 44 Years | 29 (38.7%) | 75 (100.0%) |
| 45 to 54 Years | 27 (24.3%) | 95 (85.6%) |
| 55 to 64 Years | 33 (14.7%) | 208 (92.9%) |
| 65 to 74 Years | 286 (100.0%) | 228 (79.7%) |
| 75 Years and over | 191 (100.0%) | 89 (46.6%) |
| Total | 604 (56.4%) | 855 (79.8%) |
Disability Status by Sex by Age in Union Hall
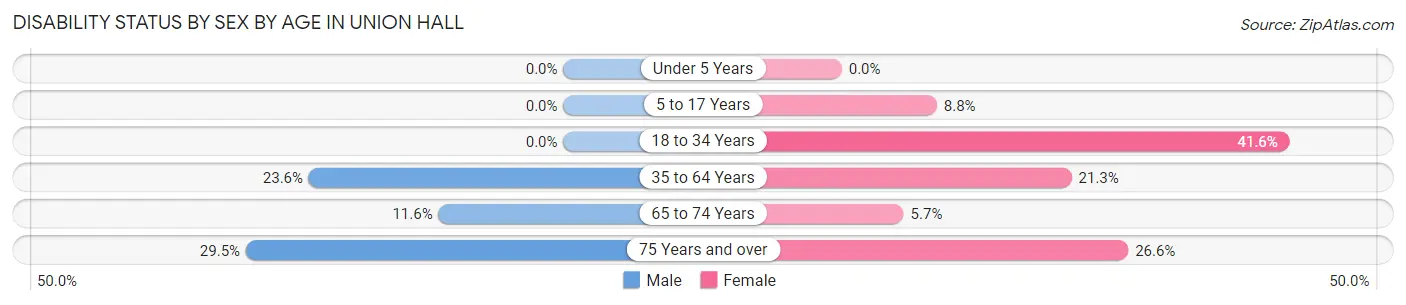
| Age Bracket | Male | Female |
| Under 5 Years | 0 (0.0%) | 0 (0.0%) |
| 5 to 17 Years | 0 (0.0%) | 3 (8.8%) |
| 18 to 34 Years | 0 (0.0%) | 32 (41.6%) |
| 35 to 64 Years | 47 (23.6%) | 45 (21.3%) |
| 65 to 74 Years | 19 (11.6%) | 7 (5.7%) |
| 75 Years and over | 33 (29.5%) | 21 (26.6%) |
Disability Class by Sex by Age in Union Hall
Disability Class: Hearing Difficulty
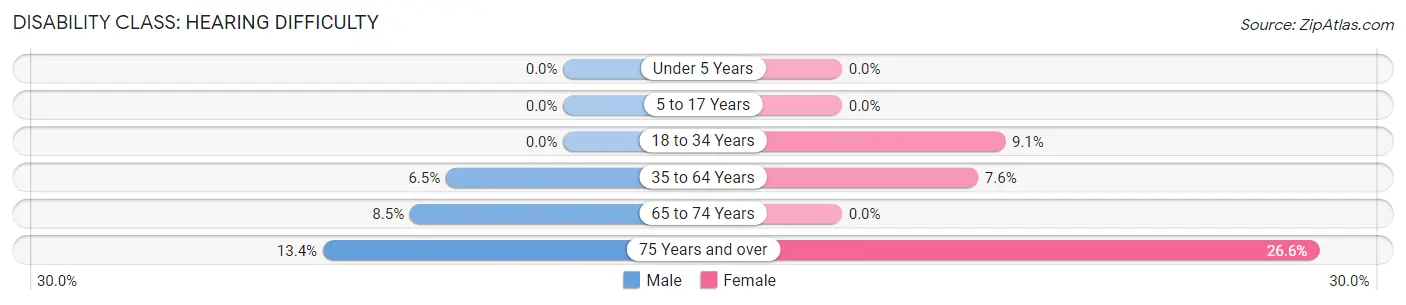
| Age Bracket | Male | Female |
| Under 5 Years | 0 (0.0%) | 0 (0.0%) |
| 5 to 17 Years | 0 (0.0%) | 0 (0.0%) |
| 18 to 34 Years | 0 (0.0%) | 7 (9.1%) |
| 35 to 64 Years | 13 (6.5%) | 16 (7.6%) |
| 65 to 74 Years | 14 (8.5%) | 0 (0.0%) |
| 75 Years and over | 15 (13.4%) | 21 (26.6%) |
Disability Class: Vision Difficulty
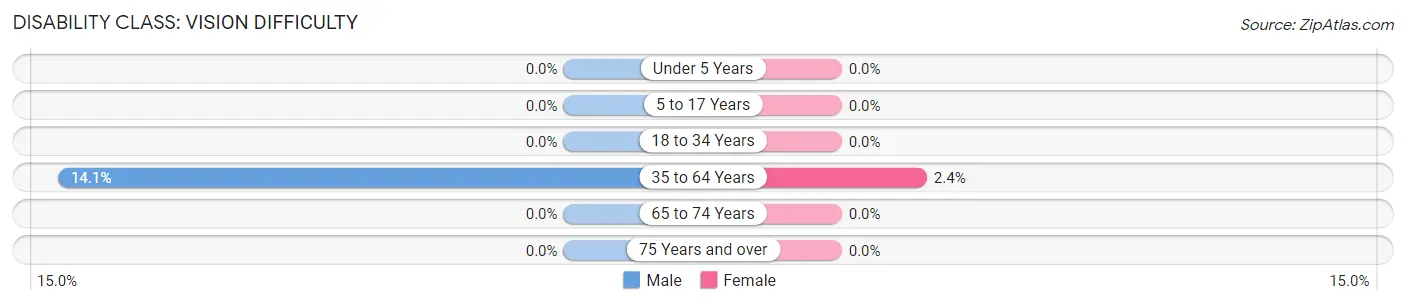
| Age Bracket | Male | Female |
| Under 5 Years | 0 (0.0%) | 0 (0.0%) |
| 5 to 17 Years | 0 (0.0%) | 0 (0.0%) |
| 18 to 34 Years | 0 (0.0%) | 0 (0.0%) |
| 35 to 64 Years | 28 (14.1%) | 5 (2.4%) |
| 65 to 74 Years | 0 (0.0%) | 0 (0.0%) |
| 75 Years and over | 0 (0.0%) | 0 (0.0%) |
Disability Class: Cognitive Difficulty
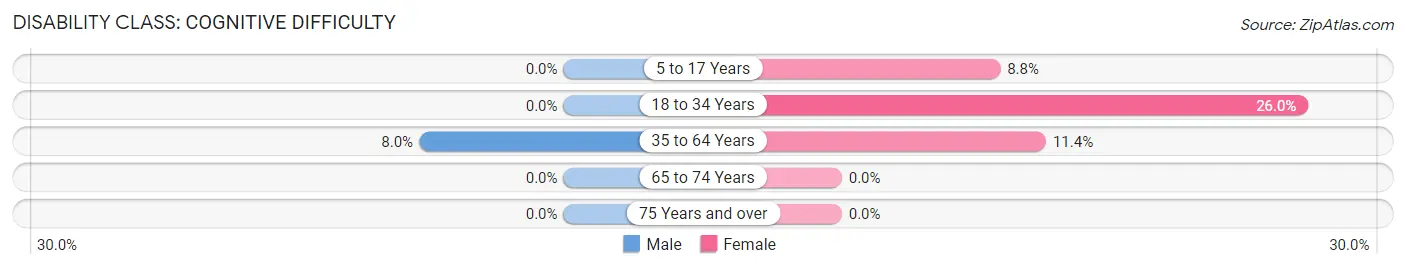
| Age Bracket | Male | Female |
| 5 to 17 Years | 0 (0.0%) | 3 (8.8%) |
| 18 to 34 Years | 0 (0.0%) | 20 (26.0%) |
| 35 to 64 Years | 16 (8.0%) | 24 (11.4%) |
| 65 to 74 Years | 0 (0.0%) | 0 (0.0%) |
| 75 Years and over | 0 (0.0%) | 0 (0.0%) |
Disability Class: Ambulatory Difficulty
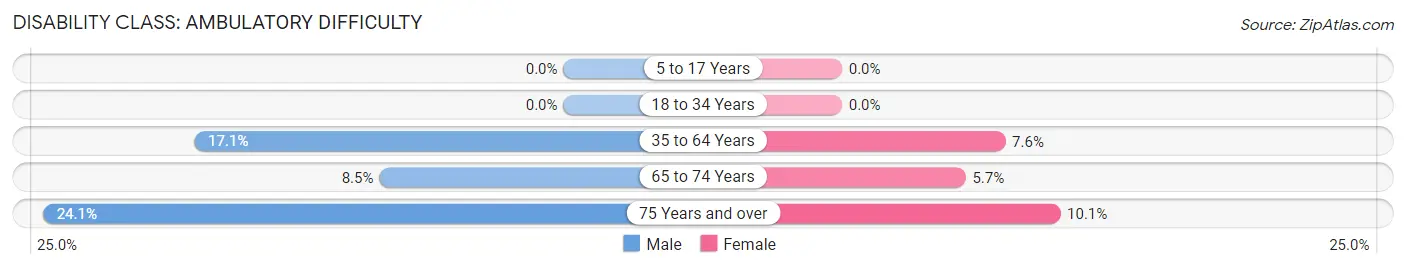
| Age Bracket | Male | Female |
| 5 to 17 Years | 0 (0.0%) | 0 (0.0%) |
| 18 to 34 Years | 0 (0.0%) | 0 (0.0%) |
| 35 to 64 Years | 34 (17.1%) | 16 (7.6%) |
| 65 to 74 Years | 14 (8.5%) | 7 (5.7%) |
| 75 Years and over | 27 (24.1%) | 8 (10.1%) |
Disability Class: Self-Care Difficulty
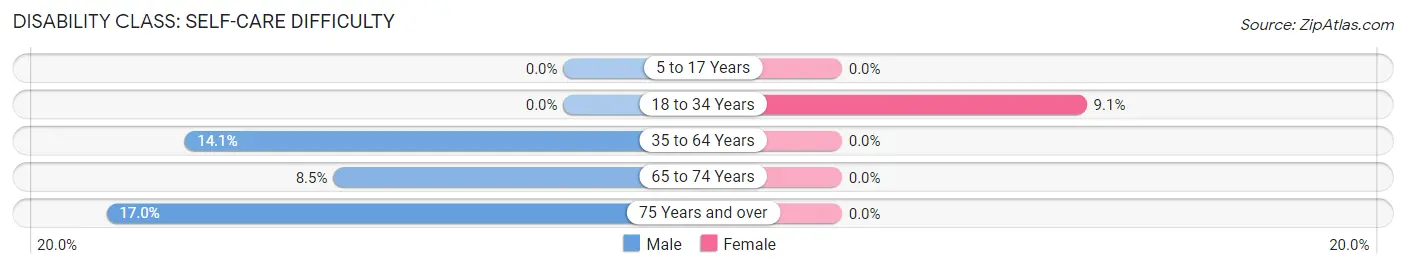
| Age Bracket | Male | Female |
| 5 to 17 Years | 0 (0.0%) | 0 (0.0%) |
| 18 to 34 Years | 0 (0.0%) | 7 (9.1%) |
| 35 to 64 Years | 28 (14.1%) | 0 (0.0%) |
| 65 to 74 Years | 14 (8.5%) | 0 (0.0%) |
| 75 Years and over | 19 (17.0%) | 0 (0.0%) |
Technology Access in Union Hall
Computing Device Access in Union Hall
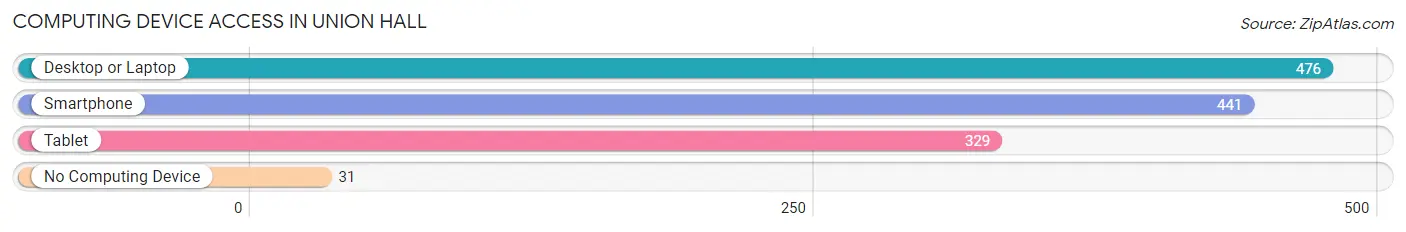
| Device Type | # Households | % Households |
| Desktop or Laptop | 476 | 89.8% |
| Smartphone | 441 | 83.2% |
| Tablet | 329 | 62.1% |
| No Computing Device | 31 | 5.9% |
| Total | 530 | 100.0% |
Internet Access in Union Hall
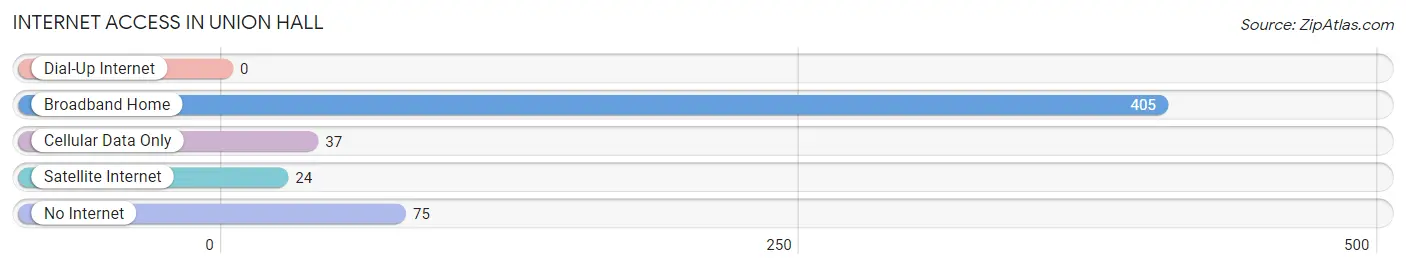
| Internet Type | # Households | % Households |
| Dial-Up Internet | 0 | 0.0% |
| Broadband Home | 405 | 76.4% |
| Cellular Data Only | 37 | 7.0% |
| Satellite Internet | 24 | 4.5% |
| No Internet | 75 | 14.1% |
| Total | 530 | 100.0% |
Union Hall Summary
Hall, Virginia is a small unincorporated community located in the northern part of the state, in the Shenandoah Valley. It is situated in the foothills of the Blue Ridge Mountains, and is part of the Winchester, Virginia metropolitan area. The town is located in Frederick County, and is home to a population of just over 1,000 people.
History
The area that is now Hall, Virginia was first settled in the late 1700s by German immigrants. The town was originally known as “Union Hall”, and was named after the Union Church that was built in the area in 1802. The church was a popular gathering place for the local community, and was the site of many important events in the town’s history.
In the early 1800s, the town was a major stop on the Valley Turnpike, a major transportation route that connected the Shenandoah Valley to the rest of the state. The town was also a major stop on the Winchester and Potomac Railroad, which connected the town to the rest of the state.
The town was officially incorporated in 1891, and was renamed “Hall” in honor of the Union Church. The town has remained relatively unchanged since then, and is still a small, rural community.
Geography
Hall, Virginia is located in the northern part of the state, in the Shenandoah Valley. The town is situated in the foothills of the Blue Ridge Mountains, and is part of the Winchester, Virginia metropolitan area. The town is located in Frederick County, and is home to a population of just over 1,000 people.
The town is located at the intersection of two major highways, US Route 11 and US Route 50. The town is also located near the Shenandoah River, which provides a scenic backdrop to the town.
Economy
The economy of Hall, Virginia is largely based on agriculture and tourism. The town is home to several farms, which produce a variety of crops, including corn, soybeans, wheat, and hay. The town is also home to several wineries, which produce a variety of wines.
The town is also home to several small businesses, including restaurants, shops, and other services. The town is also home to several bed and breakfasts, which attract tourists from all over the state.
Demographics
As of the 2010 census, the population of Hall, Virginia was 1,072. The town is predominantly white, with 92.3% of the population identifying as white. The town is also home to a small African American population, with 4.3% of the population identifying as African American. The town is also home to a small Hispanic population, with 1.7% of the population identifying as Hispanic or Latino.
The median household income in Hall, Virginia is $45,000, and the median home value is $150,000. The town has a low unemployment rate, with only 4.2% of the population unemployed. The town also has a low poverty rate, with only 8.3% of the population living below the poverty line.
Common Questions
What is Per Capita Income in Union Hall?
Per Capita income in Union Hall is $78,214.
What is the Median Family Income in Union Hall?
Median Family Income in Union Hall is $121,458.
What is the Median Household income in Union Hall?
Median Household Income in Union Hall is $108,750.
What is Income or Wage Gap in Union Hall?
Income or Wage Gap in Union Hall is 59.4%.
Women in Union Hall earn 40.6 cents for every dollar earned by a man.
What is Inequality or Gini Index in Union Hall?
Inequality or Gini Index in Union Hall is 0.50.
What is the Total Population of Union Hall?
Total Population of Union Hall is 1,071.
What is the Total Male Population of Union Hall?
Total Male Population of Union Hall is 533.
What is the Total Female Population of Union Hall?
Total Female Population of Union Hall is 538.
What is the Ratio of Males per 100 Females in Union Hall?
There are 99.07 Males per 100 Females in Union Hall.
What is the Ratio of Females per 100 Males in Union Hall?
There are 100.94 Females per 100 Males in Union Hall.
What is the Median Population Age in Union Hall?
Median Population Age in Union Hall is 61.4 Years.
What is the Average Family Size in Union Hall
Average Family Size in Union Hall is 2.4 People.
What is the Average Household Size in Union Hall
Average Household Size in Union Hall is 2.0 People.
How Large is the Labor Force in Union Hall?
There are 444 People in the Labor Forcein in Union Hall.
What is the Percentage of People in the Labor Force in Union Hall?
43.8% of People are in the Labor Force in Union Hall.
What is the Unemployment Rate in Union Hall?
Unemployment Rate in Union Hall is 1.8%.