Zip Codes with the Lowest Percentage of Owner-Occupied Units in Cincinnati, OH
RELATED REPORTS & OPTIONS
Lowest Owner-Occupied
Cincinnati
Compare Zip Codes
Map of Zip Codes with the Lowest Percentage of Owner-Occupied Units in Cincinnati
92.4%
14.0%
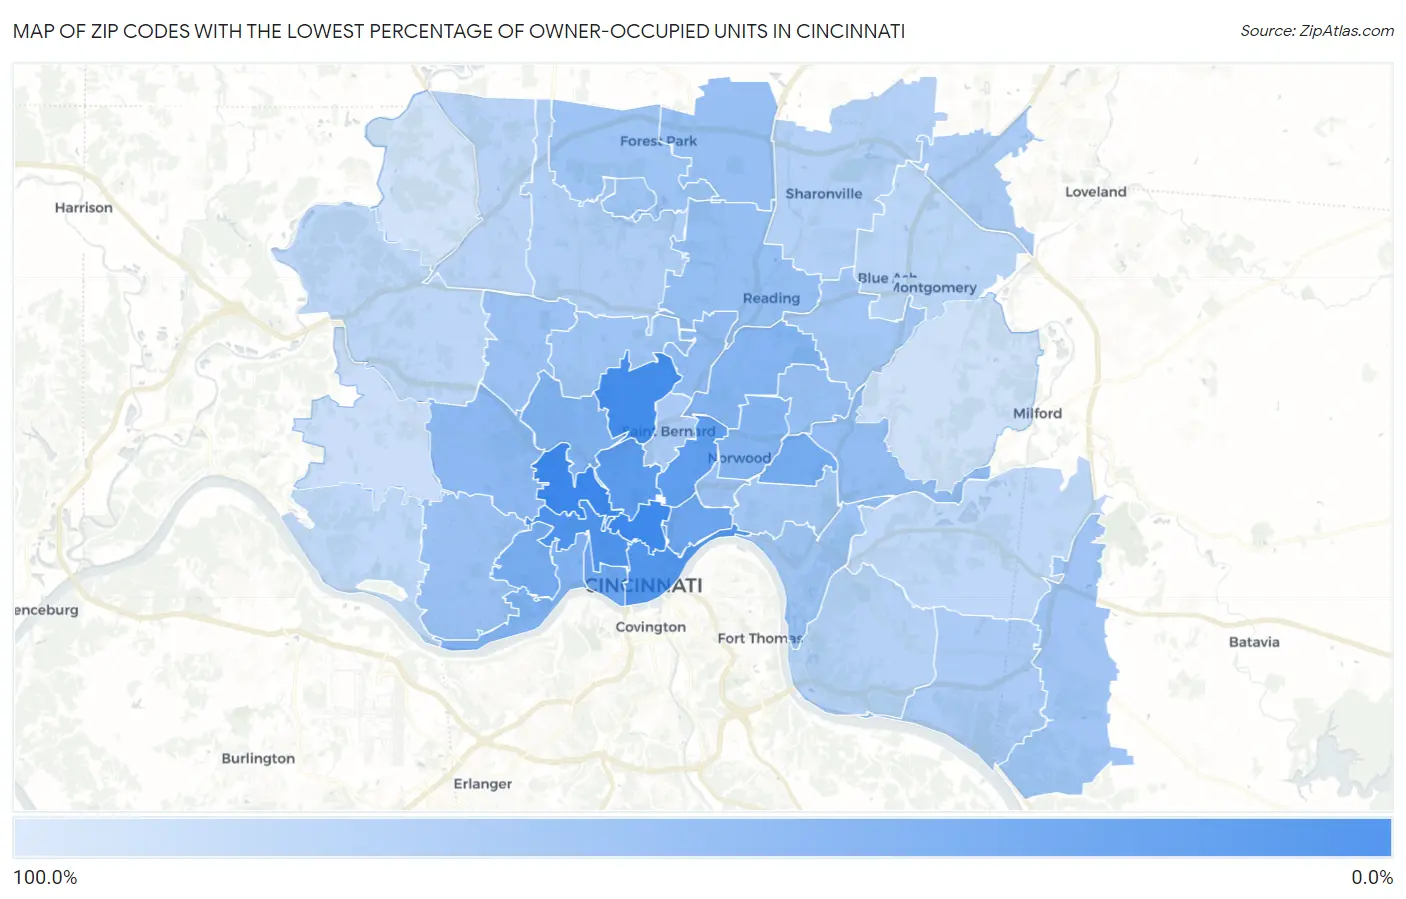
Zip Codes with the Lowest Percentage of Owner-Occupied Units in Cincinnati, OH
| Zip Code | % Owner-Occupied | vs State | vs National | |
| 1. | 45225 | 14.0% | 66.8%(-52.9)#9 | 64.8%(-50.9)#235 |
| 2. | 45219 | 14.7% | 66.8%(-52.1)#10 | 64.8%(-50.1)#249 |
| 3. | 45232 | 18.1% | 66.8%(-48.7)#13 | 64.8%(-46.7)#326 |
| 4. | 45214 | 22.7% | 66.8%(-44.1)#16 | 64.8%(-42.1)#467 |
| 5. | 45202 | 23.9% | 66.8%(-43.0)#18 | 64.8%(-41.0)#501 |
| 6. | 45220 | 27.6% | 66.8%(-39.2)#23 | 64.8%(-37.2)#644 |
| 7. | 45229 | 29.3% | 66.8%(-37.6)#26 | 64.8%(-35.6)#728 |
| 8. | 45203 | 35.5% | 66.8%(-31.4)#41 | 64.8%(-29.3)#1,110 |
| 9. | 45206 | 35.7% | 66.8%(-31.1)#42 | 64.8%(-29.1)#1,131 |
| 10. | 45209 | 39.4% | 66.8%(-27.4)#49 | 64.8%(-25.4)#1,451 |
| 11. | 45205 | 40.4% | 66.8%(-26.4)#54 | 64.8%(-24.4)#1,547 |
| 12. | 45223 | 44.8% | 66.8%(-22.0)#69 | 64.8%(-20.0)#2,016 |
| 13. | 45204 | 45.5% | 66.8%(-21.3)#74 | 64.8%(-19.3)#2,105 |
| 14. | 45212 | 47.3% | 66.8%(-19.5)#78 | 64.8%(-17.5)#2,366 |
| 15. | 45237 | 47.4% | 66.8%(-19.4)#81 | 64.8%(-17.4)#2,385 |
| 16. | 45211 | 50.7% | 66.8%(-16.1)#103 | 64.8%(-14.1)#2,913 |
| 17. | 45216 | 53.2% | 66.8%(-13.6)#125 | 64.8%(-11.6)#3,371 |
| 18. | 45227 | 54.2% | 66.8%(-12.6)#134 | 64.8%(-10.6)#3,586 |
| 19. | 45215 | 56.3% | 66.8%(-10.5)#155 | 64.8%(-8.47)#4,109 |
| 20. | 45246 | 56.9% | 66.8%(-9.90)#161 | 64.8%(-7.90)#4,258 |
| 21. | 45213 | 57.1% | 66.8%(-9.75)#162 | 64.8%(-7.75)#4,293 |
| 22. | 45238 | 58.5% | 66.8%(-8.29)#169 | 64.8%(-6.29)#4,671 |
| 23. | 45239 | 59.2% | 66.8%(-7.61)#179 | 64.8%(-5.60)#4,877 |
| 24. | 45207 | 60.1% | 66.8%(-6.70)#186 | 64.8%(-4.70)#5,144 |
| 25. | 45224 | 60.7% | 66.8%(-6.16)#190 | 64.8%(-4.15)#5,309 |
| 26. | 45226 | 60.8% | 66.8%(-5.98)#192 | 64.8%(-3.98)#5,369 |
| 27. | 45240 | 60.9% | 66.8%(-5.94)#193 | 64.8%(-3.94)#5,383 |
| 28. | 45218 | 61.7% | 66.8%(-5.11)#208 | 64.8%(-3.10)#5,693 |
| 29. | 45245 | 62.7% | 66.8%(-4.08)#224 | 64.8%(-2.08)#6,064 |
| 30. | 45208 | 63.6% | 66.8%(-3.22)#241 | 64.8%(-1.22)#6,458 |
| 31. | 45236 | 64.3% | 66.8%(-2.48)#248 | 64.8%(-0.474)#6,746 |
| 32. | 45255 | 67.1% | 66.8%(+0.291)#284 | 64.8%(+2.30)#8,084 |
| 33. | 45249 | 67.1% | 66.8%(+0.322)#285 | 64.8%(+2.33)#8,103 |
| 34. | 45217 | 68.1% | 66.8%(+1.23)#299 | 64.8%(+3.24)#8,589 |
| 35. | 45231 | 70.6% | 66.8%(+3.81)#369 | 64.8%(+5.82)#10,172 |
| 36. | 45241 | 73.5% | 66.8%(+6.70)#450 | 64.8%(+8.71)#12,183 |
| 37. | 45230 | 74.9% | 66.8%(+8.07)#487 | 64.8%(+10.1)#13,231 |
| 38. | 45251 | 76.1% | 66.8%(+9.30)#535 | 64.8%(+11.3)#14,317 |
| 39. | 45242 | 77.4% | 66.8%(+10.5)#584 | 64.8%(+12.5)#15,463 |
| 40. | 45247 | 79.9% | 66.8%(+13.1)#679 | 64.8%(+15.1)#17,788 |
| 41. | 45244 | 81.6% | 66.8%(+14.8)#751 | 64.8%(+16.8)#19,482 |
| 42. | 45233 | 82.4% | 66.8%(+15.6)#780 | 64.8%(+17.6)#20,295 |
| 43. | 45248 | 87.4% | 66.8%(+20.5)#960 | 64.8%(+22.5)#24,948 |
| 44. | 45243 | 90.6% | 66.8%(+23.7)#1,041 | 64.8%(+25.8)#27,425 |
| 45. | 45252 | 92.4% | 66.8%(+25.5)#1,078 | 64.8%(+27.5)#28,518 |
1
Common Questions
What are the Top 10 Zip Codes with the Lowest Percentage of Owner-Occupied Units in Cincinnati, OH?
Top 10 Zip Codes with the Lowest Percentage of Owner-Occupied Units in Cincinnati, OH are:
What zip code has the Lowest Percentage of Owner-Occupied Units in Cincinnati, OH?
45225 has the Lowest Percentage of Owner-Occupied Units in Cincinnati, OH with 14.0%.
What is the Percentage of Owner-Occupied Units in Cincinnati, OH?
Percentage of Owner-Occupied Units in Cincinnati is 39.3%.
What is the Percentage of Owner-Occupied Units in Ohio?
Percentage of Owner-Occupied Units in Ohio is 66.8%.
What is the Percentage of Owner-Occupied Units in the United States?
Percentage of Owner-Occupied Units in the United States is 64.8%.