Cities with the Highest Percentage of French Population in Indiana
RELATED REPORTS & OPTIONS
French
Indiana
Compare Cities
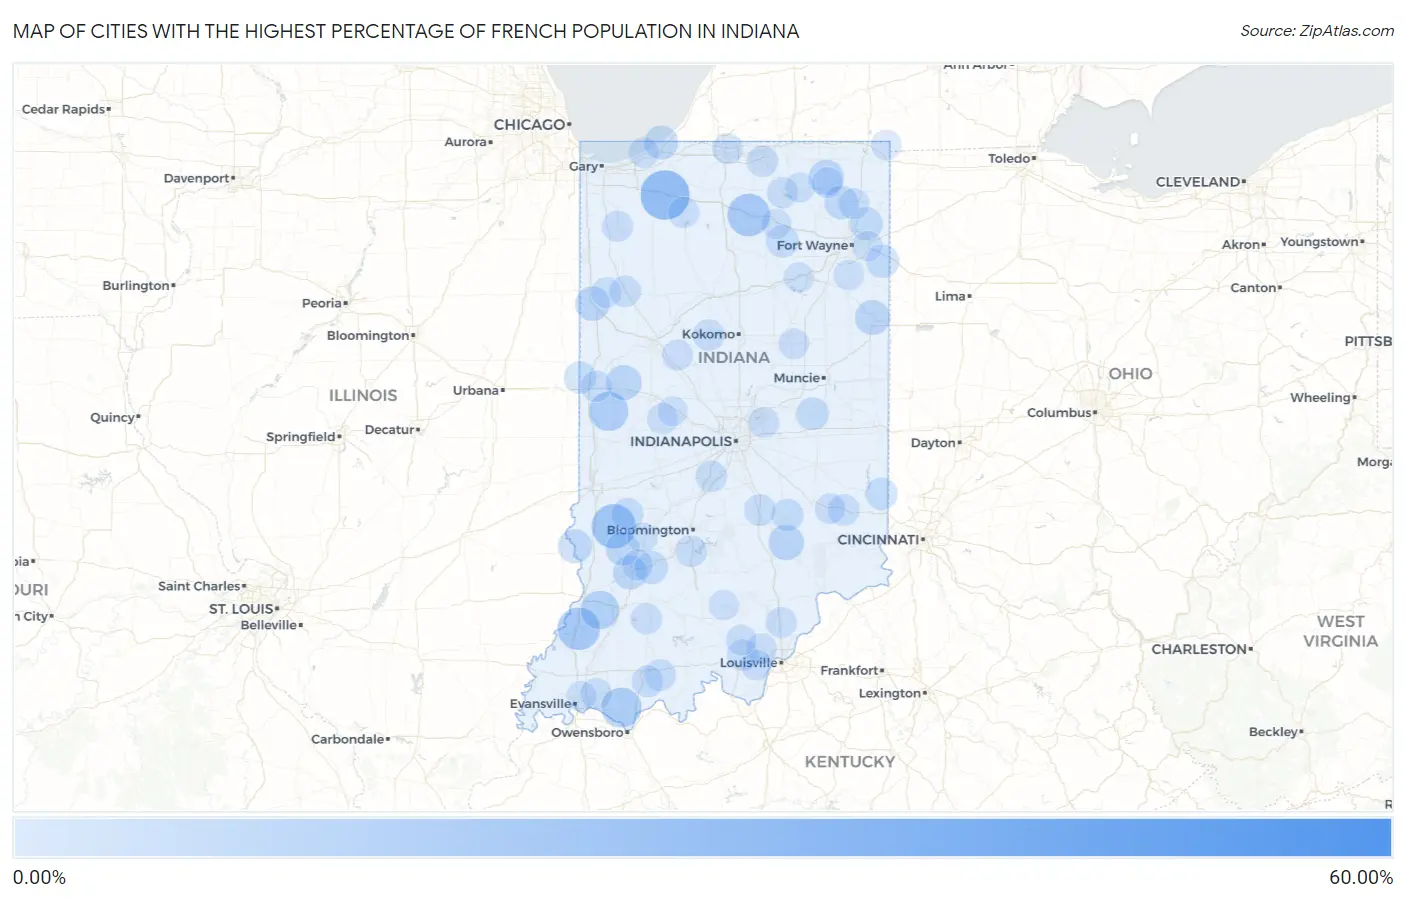
Map of Cities with the Highest Percentage of French Population in Indiana
0.00%
60.00%
Cities with the Highest Percentage of French Population in Indiana
| City | French | vs State | vs National | |
| 1. | Sandusky | 60.00% | 1.74%(+58.3)#1 | 2.07%(+57.9)#11 |
| 2. | Preble | 53.85% | 1.74%(+52.1)#2 | 2.07%(+51.8)#16 |
| 3. | Goldsmith | 52.51% | 1.74%(+50.8)#3 | 2.07%(+50.4)#17 |
| 4. | Vicksburg | 47.01% | 1.74%(+45.3)#4 | 2.07%(+44.9)#25 |
| 5. | Big Lake | 30.54% | 1.74%(+28.8)#5 | 2.07%(+28.5)#96 |
| 6. | Tunnelton | 29.69% | 1.74%(+27.9)#6 | 2.07%(+27.6)#104 |
| 7. | Pleasant Lake | 27.65% | 1.74%(+25.9)#7 | 2.07%(+25.6)#138 |
| 8. | Hanna | 27.48% | 1.74%(+25.7)#8 | 2.07%(+25.4)#140 |
| 9. | Raub | 23.21% | 1.74%(+21.5)#9 | 2.07%(+21.1)#224 |
| 10. | Metz | 22.92% | 1.74%(+21.2)#10 | 2.07%(+20.9)#231 |
| 11. | Coalmont | 21.17% | 1.74%(+19.4)#11 | 2.07%(+19.1)#283 |
| 12. | Oswego | 20.00% | 1.74%(+18.3)#12 | 2.07%(+17.9)#327 |
| 13. | Coesse | 19.01% | 1.74%(+17.3)#13 | 2.07%(+16.9)#361 |
| 14. | Etna Green | 18.98% | 1.74%(+17.2)#14 | 2.07%(+16.9)#362 |
| 15. | Hazleton | 18.78% | 1.74%(+17.0)#15 | 2.07%(+16.7)#369 |
| 16. | Tyner | 17.88% | 1.74%(+16.1)#16 | 2.07%(+15.8)#415 |
| 17. | Schnellville | 16.42% | 1.74%(+14.7)#17 | 2.07%(+14.4)#501 |
| 18. | Richland | 15.68% | 1.74%(+13.9)#18 | 2.07%(+13.6)#550 |
| 19. | Kingman | 14.85% | 1.74%(+13.1)#19 | 2.07%(+12.8)#610 |
| 20. | Monroe City | 13.84% | 1.74%(+12.1)#20 | 2.07%(+11.8)#686 |
| 21. | Lake Of The Woods | 11.69% | 1.74%(+9.96)#21 | 2.07%(+9.63)#913 |
| 22. | Poland | 11.11% | 1.74%(+9.37)#22 | 2.07%(+9.04)#980 |
| 23. | Morris | 10.80% | 1.74%(+9.06)#23 | 2.07%(+8.73)#1,031 |
| 24. | Perkinsville | 10.78% | 1.74%(+9.05)#24 | 2.07%(+8.72)#1,035 |
| 25. | Scipio | 10.17% | 1.74%(+8.43)#25 | 2.07%(+8.10)#1,142 |
| 26. | Wolcottville | 10.00% | 1.74%(+8.26)#26 | 2.07%(+7.93)#1,166 |
| 27. | Mellott | 10.00% | 1.74%(+8.26)#27 | 2.07%(+7.93)#1,169 |
| 28. | Geneva | 9.70% | 1.74%(+7.96)#28 | 2.07%(+7.63)#1,215 |
| 29. | Philadelphia | 9.34% | 1.74%(+7.61)#29 | 2.07%(+7.28)#1,290 |
| 30. | Antioch | 9.32% | 1.74%(+7.58)#30 | 2.07%(+7.25)#1,296 |
| 31. | Earl Park | 9.15% | 1.74%(+7.41)#31 | 2.07%(+7.08)#1,338 |
| 32. | Ramsey | 8.91% | 1.74%(+7.17)#32 | 2.07%(+6.84)#1,395 |
| 33. | Elnora | 8.52% | 1.74%(+6.78)#33 | 2.07%(+6.46)#1,478 |
| 34. | Merom | 8.43% | 1.74%(+6.69)#34 | 2.07%(+6.36)#1,505 |
| 35. | Michiana Shores | 8.33% | 1.74%(+6.60)#35 | 2.07%(+6.27)#1,535 |
| 36. | Avilla | 8.22% | 1.74%(+6.48)#36 | 2.07%(+6.15)#1,572 |
| 37. | Linton | 8.08% | 1.74%(+6.34)#37 | 2.07%(+6.01)#1,611 |
| 38. | Scotland | 7.69% | 1.74%(+5.95)#38 | 2.07%(+5.63)#1,727 |
| 39. | Leo Cedarville | 7.43% | 1.74%(+5.69)#39 | 2.07%(+5.36)#1,799 |
| 40. | Nyona Lake | 7.37% | 1.74%(+5.63)#40 | 2.07%(+5.30)#1,811 |
| 41. | Monroeville | 7.34% | 1.74%(+5.60)#41 | 2.07%(+5.28)#1,823 |
| 42. | Cadiz | 7.18% | 1.74%(+5.44)#42 | 2.07%(+5.12)#1,894 |
| 43. | Hoffman Lake | 7.17% | 1.74%(+5.44)#43 | 2.07%(+5.11)#1,898 |
| 44. | Delaware | 6.94% | 1.74%(+5.20)#44 | 2.07%(+4.87)#1,994 |
| 45. | Sidney | 6.58% | 1.74%(+4.84)#45 | 2.07%(+4.51)#2,148 |
| 46. | Mount Carmel | 6.45% | 1.74%(+4.71)#46 | 2.07%(+4.39)#2,231 |
| 47. | State Line City | 6.43% | 1.74%(+4.69)#47 | 2.07%(+4.36)#2,242 |
| 48. | Hartsville | 6.23% | 1.74%(+4.49)#48 | 2.07%(+4.16)#2,362 |
| 49. | Prairie Creek | 6.20% | 1.74%(+4.46)#49 | 2.07%(+4.14)#2,372 |
| 50. | Clay City | 5.99% | 1.74%(+4.25)#50 | 2.07%(+3.92)#2,487 |
| 51. | St Meinrad | 5.85% | 1.74%(+4.11)#51 | 2.07%(+3.79)#2,569 |
| 52. | Harrodsburg | 5.66% | 1.74%(+3.92)#52 | 2.07%(+3.59)#2,701 |
| 53. | Santa Claus | 5.61% | 1.74%(+3.87)#53 | 2.07%(+3.54)#2,738 |
| 54. | Batesville | 5.57% | 1.74%(+3.84)#54 | 2.07%(+3.51)#2,751 |
| 55. | Taylorsville | 5.55% | 1.74%(+3.81)#55 | 2.07%(+3.48)#2,777 |
| 56. | Burlington | 5.53% | 1.74%(+3.79)#56 | 2.07%(+3.46)#2,786 |
| 57. | Remington | 5.45% | 1.74%(+3.71)#57 | 2.07%(+3.38)#2,826 |
| 58. | Thayer | 5.41% | 1.74%(+3.67)#58 | 2.07%(+3.34)#2,853 |
| 59. | Bethany | 5.41% | 1.74%(+3.67)#59 | 2.07%(+3.34)#2,858 |
| 60. | Dunlap | 5.34% | 1.74%(+3.60)#60 | 2.07%(+3.27)#2,913 |
| 61. | Chandler | 5.23% | 1.74%(+3.50)#61 | 2.07%(+3.17)#2,987 |
| 62. | Covington | 5.20% | 1.74%(+3.46)#62 | 2.07%(+3.13)#3,015 |
| 63. | Alfordsville | 5.13% | 1.74%(+3.39)#63 | 2.07%(+3.06)#3,083 |
| 64. | New Salisbury | 5.08% | 1.74%(+3.34)#64 | 2.07%(+3.01)#3,123 |
| 65. | Newberry | 5.00% | 1.74%(+3.26)#65 | 2.07%(+2.93)#3,200 |
| 66. | Mulberry | 4.99% | 1.74%(+3.25)#66 | 2.07%(+2.93)#3,214 |
| 67. | De Motte | 4.95% | 1.74%(+3.21)#67 | 2.07%(+2.88)#3,261 |
| 68. | Knox | 4.94% | 1.74%(+3.20)#68 | 2.07%(+2.87)#3,276 |
| 69. | Garrett | 4.90% | 1.74%(+3.16)#69 | 2.07%(+2.83)#3,307 |
| 70. | Syracuse | 4.84% | 1.74%(+3.10)#70 | 2.07%(+2.77)#3,366 |
| 71. | Henryville | 4.74% | 1.74%(+3.00)#71 | 2.07%(+2.67)#3,452 |
| 72. | Galena | 4.72% | 1.74%(+2.98)#72 | 2.07%(+2.65)#3,471 |
| 73. | Mccordsville | 4.70% | 1.74%(+2.97)#73 | 2.07%(+2.64)#3,486 |
| 74. | Ladoga | 4.70% | 1.74%(+2.96)#74 | 2.07%(+2.63)#3,492 |
| 75. | Fairmount | 4.69% | 1.74%(+2.95)#75 | 2.07%(+2.62)#3,507 |
| 76. | Wadesville | 4.64% | 1.74%(+2.90)#76 | 2.07%(+2.58)#3,556 |
| 77. | Lanesville | 4.64% | 1.74%(+2.90)#77 | 2.07%(+2.57)#3,557 |
| 78. | Blairsville | 4.62% | 1.74%(+2.88)#78 | 2.07%(+2.55)#3,583 |
| 79. | New Lebanon | 4.55% | 1.74%(+2.81)#79 | 2.07%(+2.48)#3,671 |
| 80. | Indian Village | 4.51% | 1.74%(+2.77)#81 | 2.07%(+2.44)#3,721 |
| 81. | Canton | 4.51% | 1.74%(+2.77)#82 | 2.07%(+2.44)#3,722 |
| 82. | Beverly Shores | 4.50% | 1.74%(+2.76)#83 | 2.07%(+2.43)#3,736 |
| 83. | Rome City | 4.47% | 1.74%(+2.74)#84 | 2.07%(+2.41)#3,772 |
| 84. | Palmyra | 4.46% | 1.74%(+2.72)#85 | 2.07%(+2.39)#3,785 |
| 85. | Urbana | 4.31% | 1.74%(+2.57)#86 | 2.07%(+2.24)#3,969 |
| 86. | New Point | 4.31% | 1.74%(+2.57)#87 | 2.07%(+2.24)#3,972 |
| 87. | Goodland | 4.24% | 1.74%(+2.50)#88 | 2.07%(+2.17)#4,046 |
| 88. | Andrews | 4.22% | 1.74%(+2.48)#89 | 2.07%(+2.16)#4,061 |
| 89. | Campbellsburg | 4.20% | 1.74%(+2.47)#90 | 2.07%(+2.14)#4,085 |
| 90. | Ossian | 4.19% | 1.74%(+2.46)#91 | 2.07%(+2.13)#4,099 |
| 91. | Winona Lake | 4.08% | 1.74%(+2.34)#92 | 2.07%(+2.01)#4,291 |
| 92. | Clear Lake | 4.04% | 1.74%(+2.30)#93 | 2.07%(+1.97)#4,335 |
| 93. | New Haven | 4.01% | 1.74%(+2.27)#94 | 2.07%(+1.95)#4,398 |
| 94. | Lakewood | 4.01% | 1.74%(+2.27)#95 | 2.07%(+1.94)#4,402 |
| 95. | Worthington | 3.98% | 1.74%(+2.24)#96 | 2.07%(+1.91)#4,452 |
| 96. | Melody Hill | 3.97% | 1.74%(+2.24)#97 | 2.07%(+1.91)#4,459 |
| 97. | Bennetts Switch | 3.93% | 1.74%(+2.19)#98 | 2.07%(+1.86)#4,518 |
| 98. | Snow Lake | 3.91% | 1.74%(+2.17)#99 | 2.07%(+1.84)#4,545 |
| 99. | Ligonier | 3.87% | 1.74%(+2.13)#100 | 2.07%(+1.80)#4,617 |
| 100. | New Ross | 3.82% | 1.74%(+2.08)#101 | 2.07%(+1.76)#4,695 |
Common Questions
What are the Top 10 Cities with the Highest Percentage of French Population in Indiana?
Top 10 Cities with the Highest Percentage of French Population in Indiana are:
#1
27.48%
#2
21.17%
#3
18.98%
#4
18.78%
#5
15.68%
#6
14.85%
#7
13.84%
#8
10.17%
#9
10.00%
#10
10.00%
What city has the Highest Percentage of French Population in Indiana?
Hanna has the Highest Percentage of French Population in Indiana with 27.48%.
What is the Percentage of French Population in the State of Indiana?
Percentage of French Population in Indiana is 1.74%.
What is the Percentage of French Population in the United States?
Percentage of French Population in the United States is 2.07%.