Cities with the Highest Percentage of French Population in North Dakota
RELATED REPORTS & OPTIONS
French
North Dakota
Compare Cities
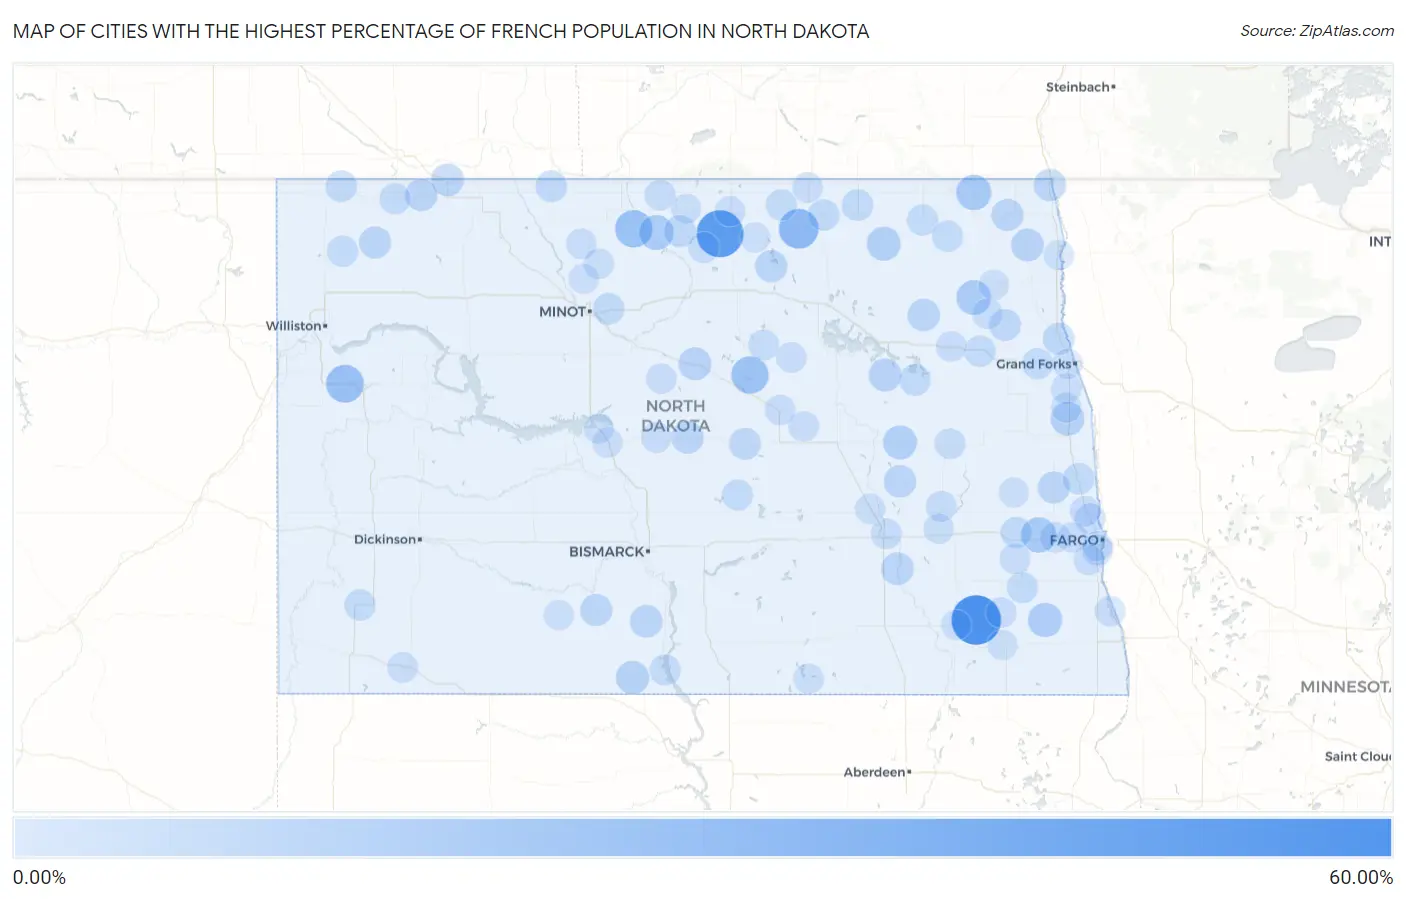
Map of Cities with the Highest Percentage of French Population in North Dakota
0.00%
60.00%
Cities with the Highest Percentage of French Population in North Dakota
| City | French | vs State | vs National | |
| 1. | Englevale | 57.50% | 2.55%(+55.0)#1 | 2.07%(+55.4)#12 |
| 2. | Overly | 50.00% | 2.55%(+47.5)#2 | 2.07%(+47.9)#20 |
| 3. | Perth | 29.41% | 2.55%(+26.9)#3 | 2.07%(+27.3)#109 |
| 4. | Arnegard | 23.87% | 2.55%(+21.3)#4 | 2.07%(+21.8)#203 |
| 5. | Newburg | 22.95% | 2.55%(+20.4)#5 | 2.07%(+20.9)#230 |
| 6. | Selz | 22.73% | 2.55%(+20.2)#6 | 2.07%(+20.7)#241 |
| 7. | Long Creek | 22.45% | 2.55%(+19.9)#7 | 2.07%(+20.4)#248 |
| 8. | Wheatland | 17.24% | 2.55%(+14.7)#8 | 2.07%(+15.2)#447 |
| 9. | Walhalla | 17.03% | 2.55%(+14.5)#9 | 2.07%(+15.0)#460 |
| 10. | Kramer | 16.00% | 2.55%(+13.5)#10 | 2.07%(+13.9)#531 |
| 11. | Lankin | 15.65% | 2.55%(+13.1)#11 | 2.07%(+13.6)#553 |
| 12. | Mcleod | 14.29% | 2.55%(+11.7)#12 | 2.07%(+12.2)#653 |
| 13. | Alsen | 13.64% | 2.55%(+11.1)#13 | 2.07%(+11.6)#704 |
| 14. | Glenfield | 13.51% | 2.55%(+11.0)#14 | 2.07%(+11.4)#711 |
| 15. | Buxton | 12.66% | 2.55%(+10.1)#15 | 2.07%(+10.6)#797 |
| 16. | Selfridge | 11.42% | 2.55%(+8.87)#16 | 2.07%(+9.35)#951 |
| 17. | Drake | 10.77% | 2.55%(+8.23)#17 | 2.07%(+8.71)#1,036 |
| 18. | St Thomas | 10.30% | 2.55%(+7.75)#18 | 2.07%(+8.23)#1,118 |
| 19. | Warwick | 10.20% | 2.55%(+7.65)#19 | 2.07%(+8.14)#1,135 |
| 20. | Montpelier | 10.10% | 2.55%(+7.55)#20 | 2.07%(+8.03)#1,154 |
| 21. | Portal | 10.00% | 2.55%(+7.45)#21 | 2.07%(+7.93)#1,170 |
| 22. | Solen | 9.46% | 2.55%(+6.91)#22 | 2.07%(+7.39)#1,264 |
| 23. | Courtenay | 9.43% | 2.55%(+6.88)#23 | 2.07%(+7.37)#1,270 |
| 24. | Brocket | 9.38% | 2.55%(+6.83)#24 | 2.07%(+7.31)#1,282 |
| 25. | Mcclusky | 9.12% | 2.55%(+6.57)#25 | 2.07%(+7.05)#1,346 |
| 26. | Columbus | 9.09% | 2.55%(+6.54)#26 | 2.07%(+7.02)#1,357 |
| 27. | Wolford | 9.09% | 2.55%(+6.54)#27 | 2.07%(+7.02)#1,361 |
| 28. | Pembina | 9.06% | 2.55%(+6.51)#28 | 2.07%(+6.99)#1,366 |
| 29. | Cavalier | 8.90% | 2.55%(+6.35)#29 | 2.07%(+6.83)#1,397 |
| 30. | Flasher | 8.48% | 2.55%(+5.93)#30 | 2.07%(+6.42)#1,489 |
| 31. | Hunter | 8.48% | 2.55%(+5.93)#31 | 2.07%(+6.41)#1,493 |
| 32. | Wildrose | 8.40% | 2.55%(+5.85)#32 | 2.07%(+6.34)#1,512 |
| 33. | Gardena | 8.11% | 2.55%(+5.56)#33 | 2.07%(+6.04)#1,604 |
| 34. | Hurdsfield | 8.00% | 2.55%(+5.45)#34 | 2.07%(+5.93)#1,638 |
| 35. | Inkster | 7.69% | 2.55%(+5.14)#35 | 2.07%(+5.63)#1,728 |
| 36. | Manvel | 7.43% | 2.55%(+4.88)#36 | 2.07%(+5.37)#1,797 |
| 37. | Sherwood | 7.20% | 2.55%(+4.65)#37 | 2.07%(+5.14)#1,883 |
| 38. | Calvin | 7.14% | 2.55%(+4.59)#38 | 2.07%(+5.08)#1,907 |
| 39. | Ambrose | 6.90% | 2.55%(+4.35)#39 | 2.07%(+4.83)#2,010 |
| 40. | Grandin | 6.76% | 2.55%(+4.21)#40 | 2.07%(+4.69)#2,068 |
| 41. | Tolna | 6.71% | 2.55%(+4.16)#41 | 2.07%(+4.64)#2,089 |
| 42. | Surrey | 6.70% | 2.55%(+4.15)#42 | 2.07%(+4.63)#2,097 |
| 43. | Buffalo | 6.62% | 2.55%(+4.07)#43 | 2.07%(+4.55)#2,132 |
| 44. | Rocklake | 6.54% | 2.55%(+3.99)#44 | 2.07%(+4.48)#2,173 |
| 45. | Niagara | 6.45% | 2.55%(+3.90)#46 | 2.07%(+4.39)#2,230 |
| 46. | Amidon | 6.45% | 2.55%(+3.90)#47 | 2.07%(+4.39)#2,232 |
| 47. | Rolla | 6.30% | 2.55%(+3.75)#48 | 2.07%(+4.24)#2,313 |
| 48. | Langdon | 6.12% | 2.55%(+3.57)#49 | 2.07%(+4.05)#2,420 |
| 49. | Emerado | 6.01% | 2.55%(+3.46)#50 | 2.07%(+3.94)#2,472 |
| 50. | Sheldon | 5.81% | 2.55%(+3.26)#51 | 2.07%(+3.74)#2,596 |
| 51. | Osnabrock | 5.71% | 2.55%(+3.16)#52 | 2.07%(+3.65)#2,662 |
| 52. | Alamo | 5.71% | 2.55%(+3.16)#53 | 2.07%(+3.65)#2,665 |
| 53. | Tuttle | 5.66% | 2.55%(+3.11)#54 | 2.07%(+3.59)#2,705 |
| 54. | Noonan | 5.63% | 2.55%(+3.08)#55 | 2.07%(+3.57)#2,727 |
| 55. | Fort Yates | 5.56% | 2.55%(+3.01)#56 | 2.07%(+3.49)#2,768 |
| 56. | Prairie Rose | 5.56% | 2.55%(+3.01)#57 | 2.07%(+3.49)#2,771 |
| 57. | Willow City | 5.49% | 2.55%(+2.95)#58 | 2.07%(+3.43)#2,799 |
| 58. | Souris | 5.26% | 2.55%(+2.71)#59 | 2.07%(+3.20)#2,965 |
| 59. | Brooktree Park | 5.13% | 2.55%(+2.58)#60 | 2.07%(+3.06)#3,081 |
| 60. | Rogers | 4.88% | 2.55%(+2.33)#61 | 2.07%(+2.81)#3,327 |
| 61. | Jamestown | 4.76% | 2.55%(+2.21)#62 | 2.07%(+2.69)#3,434 |
| 62. | Cooperstown | 4.73% | 2.55%(+2.18)#63 | 2.07%(+2.67)#3,458 |
| 63. | Esmond | 4.72% | 2.55%(+2.17)#64 | 2.07%(+2.65)#3,473 |
| 64. | Reeder | 4.65% | 2.55%(+2.10)#65 | 2.07%(+2.58)#3,551 |
| 65. | Mercer | 4.59% | 2.55%(+2.04)#66 | 2.07%(+2.52)#3,624 |
| 66. | Alice | 4.55% | 2.55%(+2.00)#67 | 2.07%(+2.48)#3,675 |
| 67. | Cathay | 4.55% | 2.55%(+2.00)#68 | 2.07%(+2.48)#3,679 |
| 68. | Lisbon | 4.54% | 2.55%(+1.99)#69 | 2.07%(+2.47)#3,684 |
| 69. | Michigan City | 4.49% | 2.55%(+1.94)#70 | 2.07%(+2.42)#3,752 |
| 70. | Casselton | 4.37% | 2.55%(+1.82)#71 | 2.07%(+2.30)#3,900 |
| 71. | Lansford | 4.35% | 2.55%(+1.80)#72 | 2.07%(+2.28)#3,922 |
| 72. | Hansboro | 4.35% | 2.55%(+1.80)#73 | 2.07%(+2.28)#3,932 |
| 73. | Maddock | 4.34% | 2.55%(+1.79)#74 | 2.07%(+2.27)#3,943 |
| 74. | Butte | 4.23% | 2.55%(+1.68)#75 | 2.07%(+2.16)#4,059 |
| 75. | Argusville | 4.19% | 2.55%(+1.64)#76 | 2.07%(+2.12)#4,109 |
| 76. | Thompson | 4.18% | 2.55%(+1.63)#77 | 2.07%(+2.12)#4,123 |
| 77. | Fessenden | 4.18% | 2.55%(+1.63)#78 | 2.07%(+2.12)#4,125 |
| 78. | Horace | 4.13% | 2.55%(+1.58)#79 | 2.07%(+2.06)#4,206 |
| 79. | Mapleton | 4.00% | 2.55%(+1.45)#80 | 2.07%(+1.93)#4,424 |
| 80. | Fordville | 3.96% | 2.55%(+1.42)#81 | 2.07%(+1.90)#4,472 |
| 81. | Sanborn | 3.91% | 2.55%(+1.36)#82 | 2.07%(+1.84)#4,551 |
| 82. | Glenburn | 3.88% | 2.55%(+1.33)#83 | 2.07%(+1.81)#4,596 |
| 83. | Dunseith | 3.85% | 2.55%(+1.30)#84 | 2.07%(+1.78)#4,641 |
| 84. | Abercrombie | 3.83% | 2.55%(+1.28)#85 | 2.07%(+1.76)#4,673 |
| 85. | Reynolds | 3.79% | 2.55%(+1.24)#86 | 2.07%(+1.72)#4,755 |
| 86. | Grand Forks | 3.75% | 2.55%(+1.20)#87 | 2.07%(+1.68)#4,824 |
| 87. | Ashley | 3.75% | 2.55%(+1.20)#88 | 2.07%(+1.68)#4,828 |
| 88. | Underwood | 3.69% | 2.55%(+1.14)#89 | 2.07%(+1.62)#4,941 |
| 89. | Buchanan | 3.66% | 2.55%(+1.11)#90 | 2.07%(+1.59)#5,000 |
| 90. | Gwinner | 3.64% | 2.55%(+1.09)#91 | 2.07%(+1.57)#5,045 |
| 91. | Page | 3.63% | 2.55%(+1.08)#92 | 2.07%(+1.56)#5,066 |
| 92. | Minot Afb | 3.60% | 2.55%(+1.05)#93 | 2.07%(+1.53)#5,121 |
| 93. | Park River | 3.53% | 2.55%(+0.985)#94 | 2.07%(+1.47)#5,273 |
| 94. | Rolette | 3.51% | 2.55%(+0.959)#95 | 2.07%(+1.44)#5,339 |
| 95. | Carson | 3.47% | 2.55%(+0.923)#96 | 2.07%(+1.41)#5,410 |
| 96. | Drayton | 3.45% | 2.55%(+0.899)#97 | 2.07%(+1.38)#5,456 |
| 97. | Bottineau | 3.37% | 2.55%(+0.825)#98 | 2.07%(+1.31)#5,616 |
| 98. | Coleharbor | 3.37% | 2.55%(+0.821)#99 | 2.07%(+1.30)#5,626 |
| 99. | Fargo | 3.37% | 2.55%(+0.816)#100 | 2.07%(+1.30)#5,637 |
| 100. | Verona | 3.36% | 2.55%(+0.812)#101 | 2.07%(+1.29)#5,659 |
Common Questions
What are the Top 10 Cities with the Highest Percentage of French Population in North Dakota?
Top 10 Cities with the Highest Percentage of French Population in North Dakota are:
What city has the Highest Percentage of French Population in North Dakota?
Englevale has the Highest Percentage of French Population in North Dakota with 57.50%.
What is the Percentage of French Population in the State of North Dakota?
Percentage of French Population in North Dakota is 2.55%.
What is the Percentage of French Population in the United States?
Percentage of French Population in the United States is 2.07%.