Zip Codes with the Highest Percentage of Population Employed in Security & Protection in Baltimore, MD
RELATED REPORTS & OPTIONS
Security & Protection
Baltimore
Compare Zip Codes
Map of Zip Codes with the Highest Percentage of Population Employed in Security & Protection in Baltimore
0.33%
5.4%
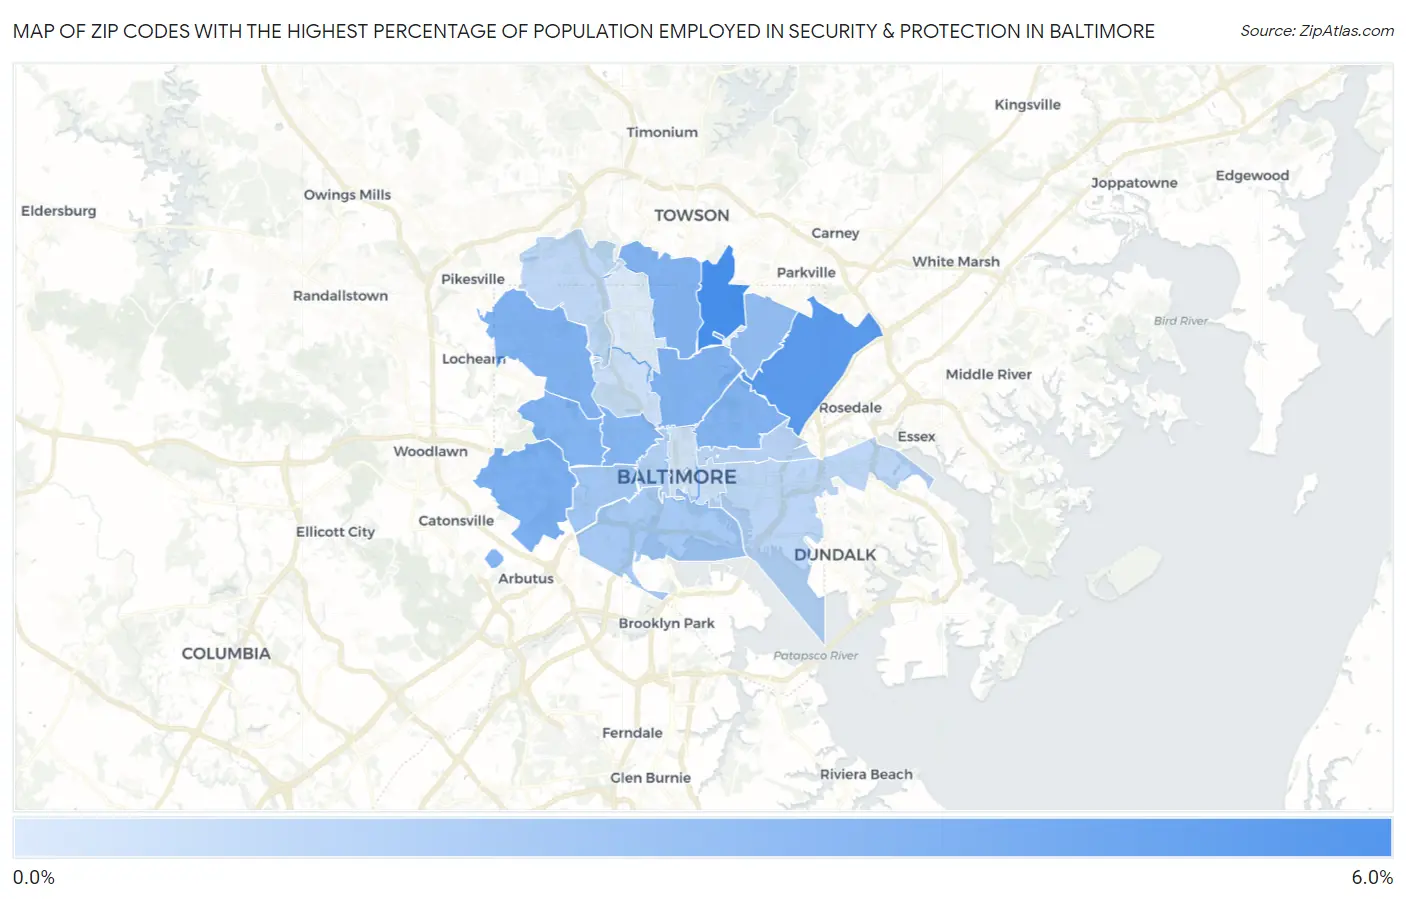
Zip Codes with the Highest Percentage of Population Employed in Security & Protection in Baltimore, MD
| Zip Code | % Employed | vs State | vs National | |
| 1. | 21239 | 5.4% | 2.8% (+2.62)#45 | 2.1% (+3.27)#2,527 |
| 2. | 21206 | 4.7% | 2.8% (+1.95)#67 | 2.1% (+2.60)#3,240 |
| 3. | 21229 | 3.6% | 2.8% (+0.798)#125 | 2.1% (+1.45)#5,408 |
| 4. | 21218 | 3.4% | 2.8% (+0.621)#138 | 2.1% (+1.27)#5,879 |
| 5. | 21215 | 3.4% | 2.8% (+0.616)#139 | 2.1% (+1.27)#5,891 |
| 6. | 21213 | 3.4% | 2.8% (+0.589)#142 | 2.1% (+1.24)#5,982 |
| 7. | 21212 | 3.4% | 2.8% (+0.553)#145 | 2.1% (+1.20)#6,089 |
| 8. | 21216 | 3.3% | 2.8% (+0.525)#146 | 2.1% (+1.17)#6,177 |
| 9. | 21250 | 3.3% | 2.8% (+0.481)#147 | 2.1% (+1.13)#6,312 |
| 10. | 21217 | 3.2% | 2.8% (+0.445)#150 | 2.1% (+1.09)#6,420 |
| 11. | 21214 | 2.8% | 2.8% (+0.000)#183 | 2.1% (+0.649)#8,123 |
| 12. | 21223 | 2.3% | 2.8% (-0.523)#225 | 2.1% (+0.126)#10,800 |
| 13. | 21230 | 2.1% | 2.8% (-0.670)#244 | 2.1% (-0.021)#11,715 |
| 14. | 21201 | 1.8% | 2.8% (-0.994)#273 | 2.1% (-0.345)#13,914 |
| 15. | 21205 | 1.5% | 2.8% (-1.26)#294 | 2.1% (-0.611)#15,896 |
| 16. | 21224 | 1.4% | 2.8% (-1.36)#302 | 2.1% (-0.712)#16,687 |
| 17. | 21209 | 1.2% | 2.8% (-1.58)#321 | 2.1% (-0.935)#18,399 |
| 18. | 21231 | 1.0% | 2.8% (-1.76)#329 | 2.1% (-1.11)#19,720 |
| 19. | 21211 | 0.86% | 2.8% (-1.94)#339 | 2.1% (-1.29)#21,045 |
| 20. | 21202 | 0.77% | 2.8% (-2.03)#347 | 2.1% (-1.38)#21,632 |
| 21. | 21210 | 0.33% | 2.8% (-2.47)#361 | 2.1% (-1.82)#24,060 |
1
Common Questions
What are the Top 10 Zip Codes with the Highest Percentage of Population Employed in Security & Protection in Baltimore, MD?
Top 10 Zip Codes with the Highest Percentage of Population Employed in Security & Protection in Baltimore, MD are:
What zip code has the Highest Percentage of Population Employed in Security & Protection in Baltimore, MD?
21239 has the Highest Percentage of Population Employed in Security & Protection in Baltimore, MD with 5.4%.
What is the Percentage of Population Employed in Security & Protection in Baltimore, MD?
Percentage of Population Employed in Security & Protection in Baltimore is 2.9%.
What is the Percentage of Population Employed in Security & Protection in Maryland?
Percentage of Population Employed in Security & Protection in Maryland is 2.8%.
What is the Percentage of Population Employed in Security & Protection in the United States?
Percentage of Population Employed in Security & Protection in the United States is 2.1%.