Aquasco, MD Map & Demographics
Aquasco Map
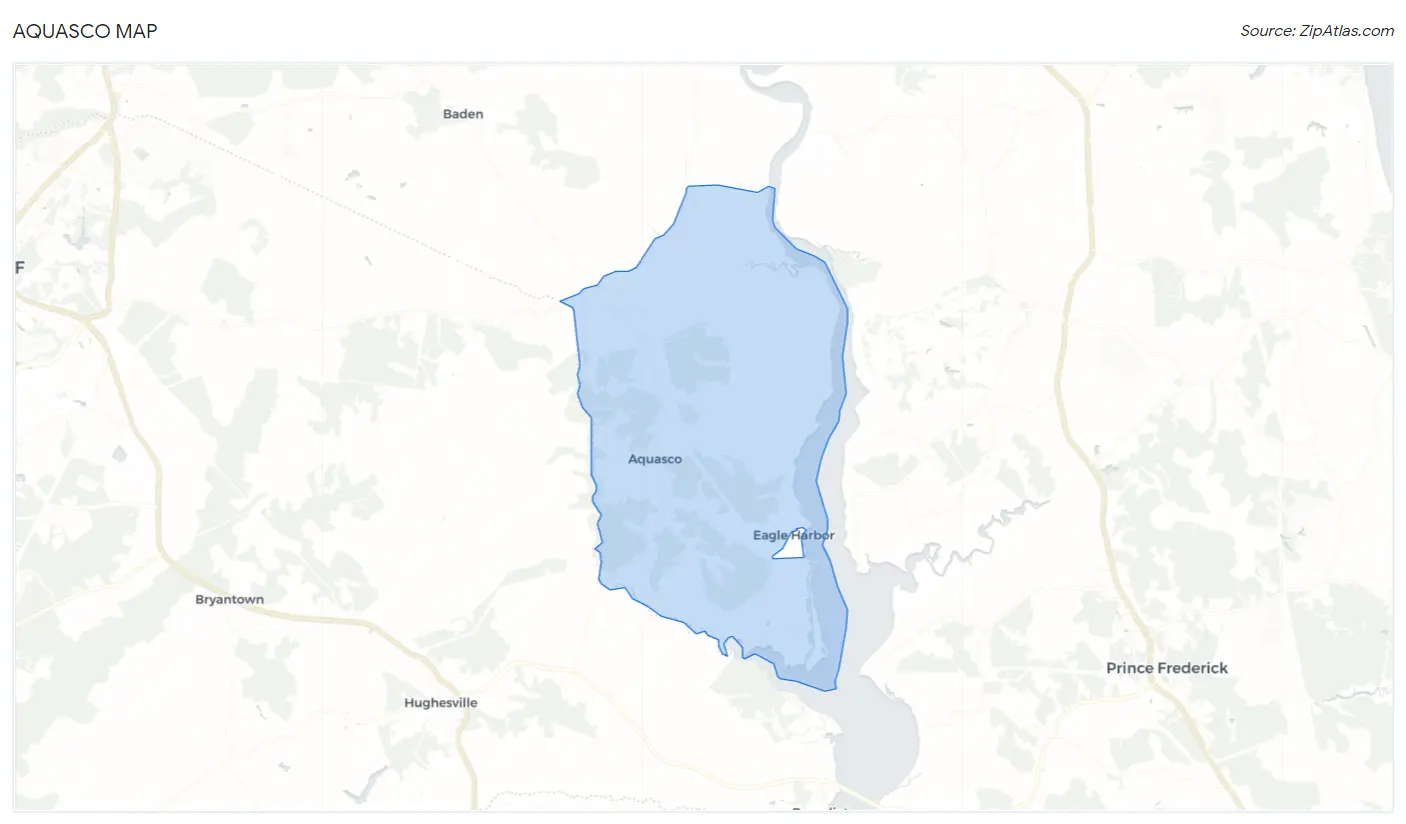
Aquasco Overview
$40,380
PER CAPITA INCOME
$103,934
AVG FAMILY INCOME
$94,028
AVG HOUSEHOLD INCOME
9.9%
WAGE / INCOME GAP [ % ]
90.1¢/ $1
WAGE / INCOME GAP [ $ ]
0.36
INEQUALITY / GINI INDEX
701
TOTAL POPULATION
397
MALE POPULATION
304
FEMALE POPULATION
130.59
MALES / 100 FEMALES
76.57
FEMALES / 100 MALES
46.1
MEDIAN AGE
3.0
AVG FAMILY SIZE
2.4
AVG HOUSEHOLD SIZE
327
LABOR FORCE [ PEOPLE ]
58.4%
PERCENT IN LABOR FORCE
3.1%
UNEMPLOYMENT RATE
Aquasco Zip Codes
Aquasco Area Codes
Income in Aquasco
Income Overview in Aquasco
Per Capita Income in Aquasco is $40,380, while median incomes of families and households are $103,934 and $94,028 respectively.
| Characteristic | Number | Measure |
| Per Capita Income | 701 | $40,380 |
| Median Family Income | 195 | $103,934 |
| Mean Family Income | 195 | $113,372 |
| Median Household Income | 293 | $94,028 |
| Mean Household Income | 293 | $95,074 |
| Income Deficit | 195 | $0 |
| Wage / Income Gap (%) | 701 | 9.87% |
| Wage / Income Gap ($) | 701 | 90.13¢ per $1 |
| Gini / Inequality Index | 701 | 0.36 |
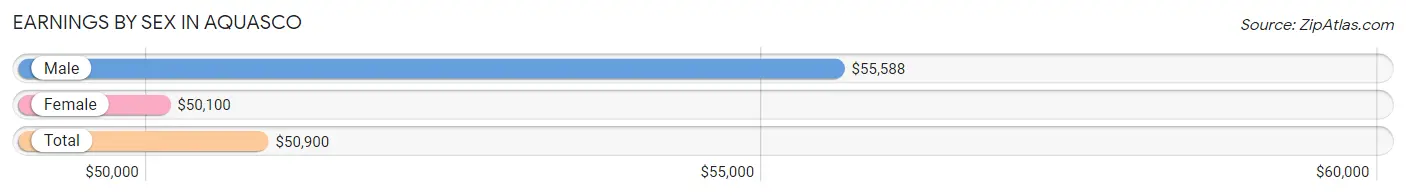
Earnings by Sex in Aquasco
Average Earnings in Aquasco are $50,900, $55,588 for men and $50,100 for women, a difference of 9.9%.
| Sex | Number | Average Earnings |
| Male | 200 (62.1%) | $55,588 |
| Female | 122 (37.9%) | $50,100 |
| Total | 322 (100.0%) | $50,900 |
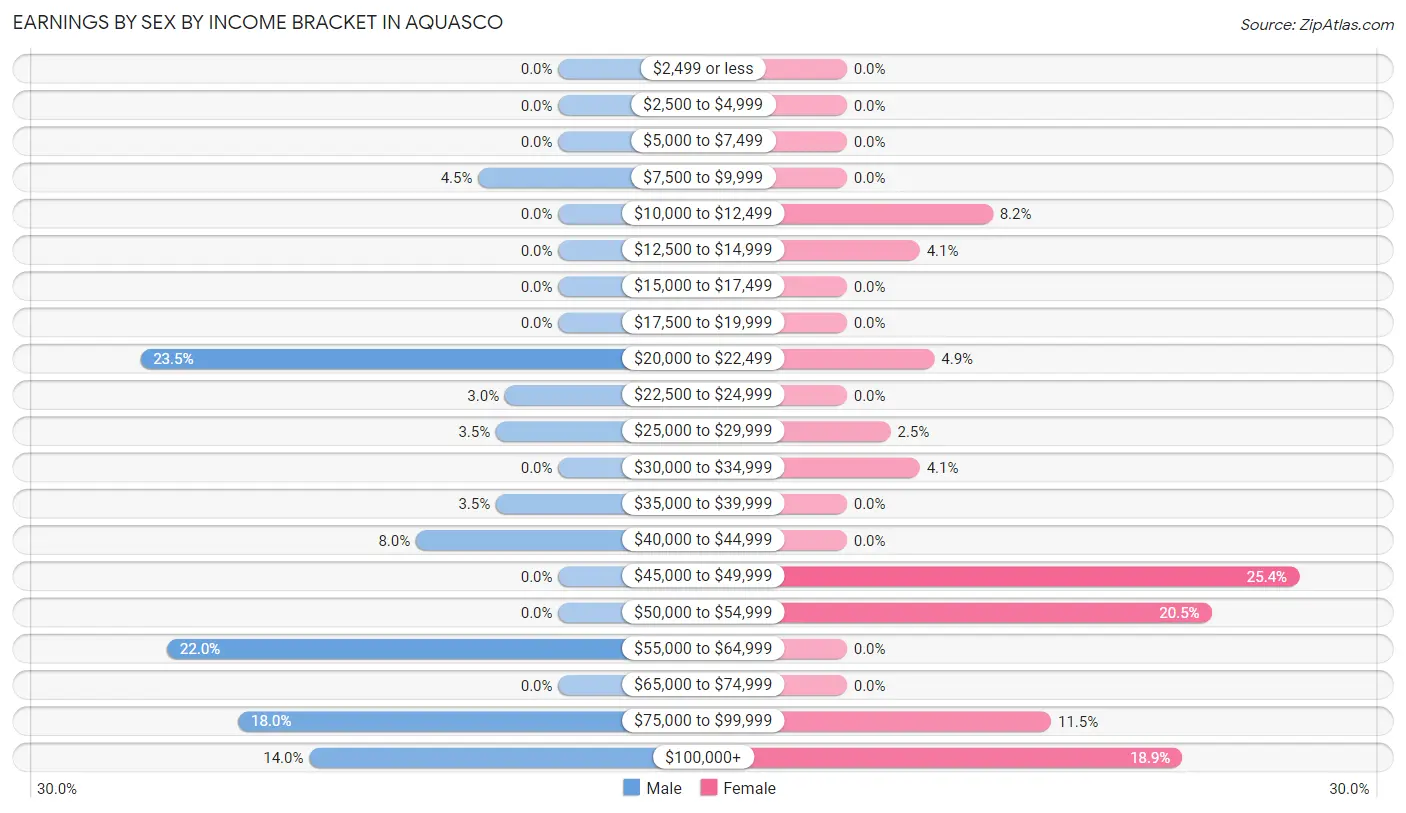
Earnings by Sex by Income Bracket in Aquasco
The most common earnings brackets in Aquasco are $20,000 to $22,499 for men (47 | 23.5%) and $45,000 to $49,999 for women (31 | 25.4%).
| Income | Male | Female |
| $2,499 or less | 0 (0.0%) | 0 (0.0%) |
| $2,500 to $4,999 | 0 (0.0%) | 0 (0.0%) |
| $5,000 to $7,499 | 0 (0.0%) | 0 (0.0%) |
| $7,500 to $9,999 | 9 (4.5%) | 0 (0.0%) |
| $10,000 to $12,499 | 0 (0.0%) | 10 (8.2%) |
| $12,500 to $14,999 | 0 (0.0%) | 5 (4.1%) |
| $15,000 to $17,499 | 0 (0.0%) | 0 (0.0%) |
| $17,500 to $19,999 | 0 (0.0%) | 0 (0.0%) |
| $20,000 to $22,499 | 47 (23.5%) | 6 (4.9%) |
| $22,500 to $24,999 | 6 (3.0%) | 0 (0.0%) |
| $25,000 to $29,999 | 7 (3.5%) | 3 (2.5%) |
| $30,000 to $34,999 | 0 (0.0%) | 5 (4.1%) |
| $35,000 to $39,999 | 7 (3.5%) | 0 (0.0%) |
| $40,000 to $44,999 | 16 (8.0%) | 0 (0.0%) |
| $45,000 to $49,999 | 0 (0.0%) | 31 (25.4%) |
| $50,000 to $54,999 | 0 (0.0%) | 25 (20.5%) |
| $55,000 to $64,999 | 44 (22.0%) | 0 (0.0%) |
| $65,000 to $74,999 | 0 (0.0%) | 0 (0.0%) |
| $75,000 to $99,999 | 36 (18.0%) | 14 (11.5%) |
| $100,000+ | 28 (14.0%) | 23 (18.9%) |
| Total | 200 (100.0%) | 122 (100.0%) |
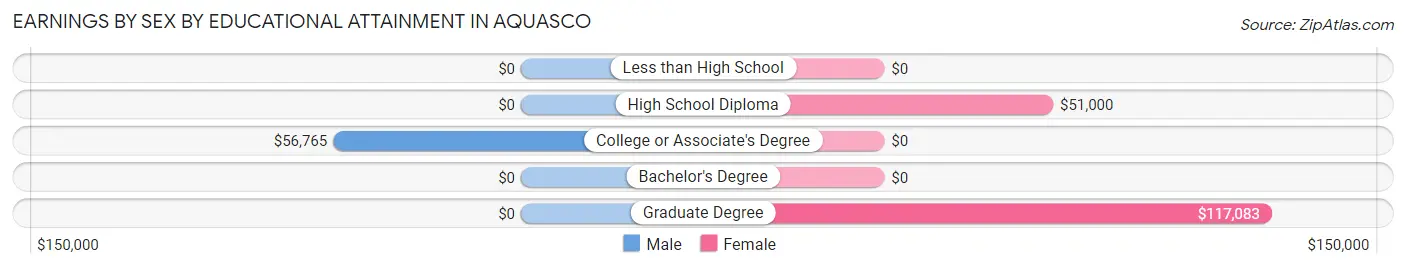
Earnings by Sex by Educational Attainment in Aquasco
Average earnings in Aquasco are $55,588 for men and $50,100 for women, a difference of 9.9%. Men with an educational attainment of college or associate's degree enjoy the highest average annual earnings of $56,765, while those with college or associate's degree education earn the least with $56,765. Women with an educational attainment of graduate degree earn the most with the average annual earnings of $117,083, while those with high school diploma education have the smallest earnings of $51,000.
| Educational Attainment | Male Income | Female Income |
| Less than High School | - | - |
| High School Diploma | - | - |
| College or Associate's Degree | $56,765 | $0 |
| Bachelor's Degree | - | - |
| Graduate Degree | - | - |
| Total | $55,588 | $50,100 |
Family Income in Aquasco
Family Income Brackets in Aquasco
According to the Aquasco family income data, there are 83 families falling into the $100,000 to $149,999 income range, which is the most common income bracket and makes up 42.6% of all families.
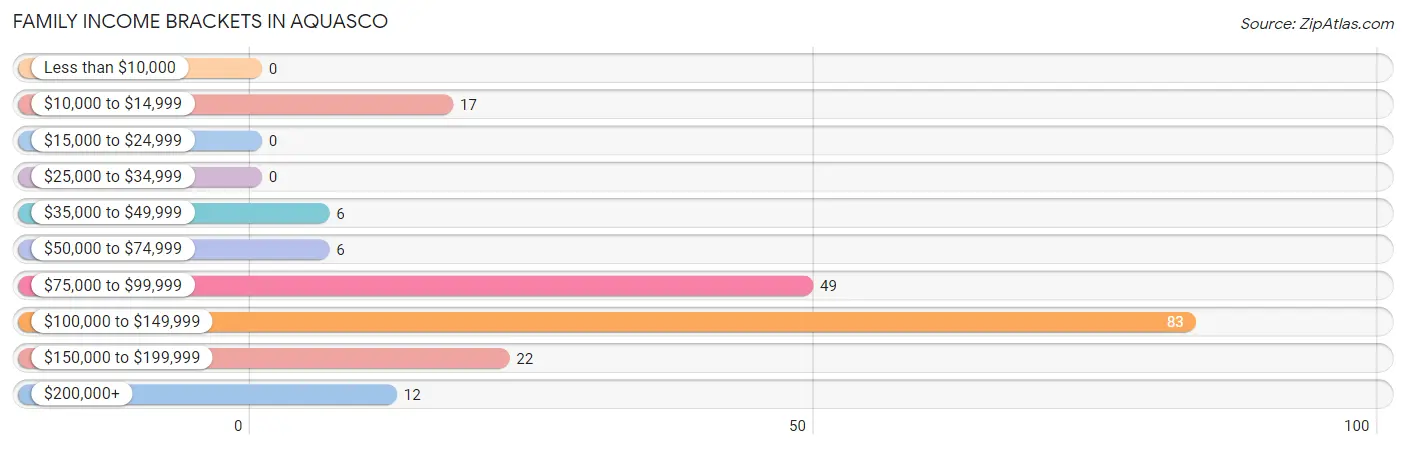
| Income Bracket | # Families | % Families |
| Less than $10,000 | 0 | 0.0% |
| $10,000 to $14,999 | 17 | 8.7% |
| $15,000 to $24,999 | 0 | 0.0% |
| $25,000 to $34,999 | 0 | 0.0% |
| $35,000 to $49,999 | 6 | 3.1% |
| $50,000 to $74,999 | 6 | 3.1% |
| $75,000 to $99,999 | 49 | 25.1% |
| $100,000 to $149,999 | 83 | 42.6% |
| $150,000 to $199,999 | 22 | 11.3% |
| $200,000+ | 12 | 6.2% |
Family Income by Famaliy Size in Aquasco
2-person families (102 | 52.3%) account for the highest median family income in Aquasco with $111,364 per family, while 2-person families (102 | 52.3%) have the highest median income of $55,682 per family member.
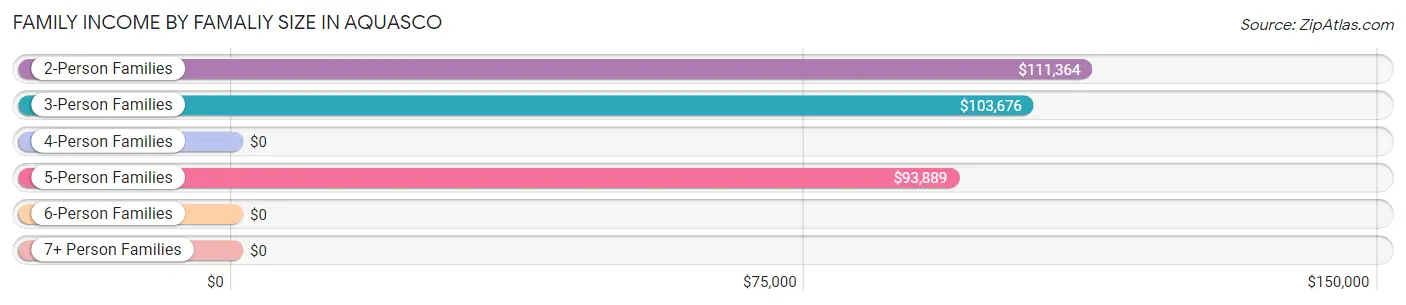
| Income Bracket | # Families | Median Income |
| 2-Person Families | 102 (52.3%) | $111,364 |
| 3-Person Families | 54 (27.7%) | $103,676 |
| 4-Person Families | 9 (4.6%) | $0 |
| 5-Person Families | 24 (12.3%) | $93,889 |
| 6-Person Families | 0 (0.0%) | $0 |
| 7+ Person Families | 6 (3.1%) | $0 |
| Total | 195 (100.0%) | $103,934 |
Family Income by Number of Earners in Aquasco
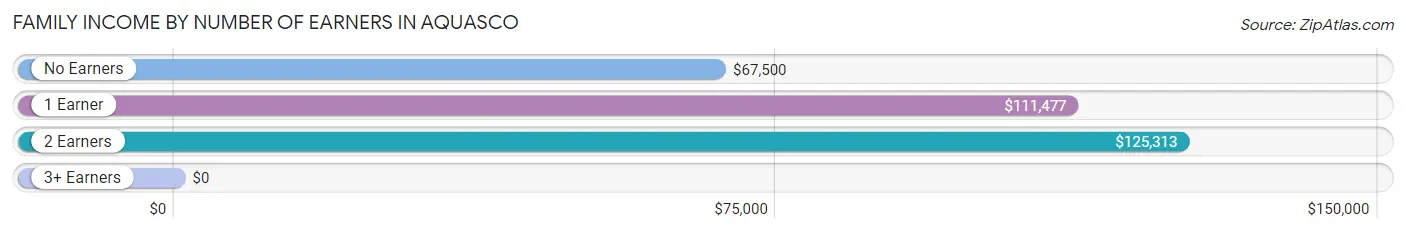
| Number of Earners | # Families | Median Income |
| No Earners | 46 (23.6%) | $67,500 |
| 1 Earner | 45 (23.1%) | $111,477 |
| 2 Earners | 104 (53.3%) | $125,313 |
| 3+ Earners | 0 (0.0%) | $0 |
| Total | 195 (100.0%) | $103,934 |
Household Income in Aquasco
Household Income Brackets in Aquasco
With 92 households falling in the category, the $100,000 to $149,999 income range is the most frequent in Aquasco, accounting for 31.4% of all households.
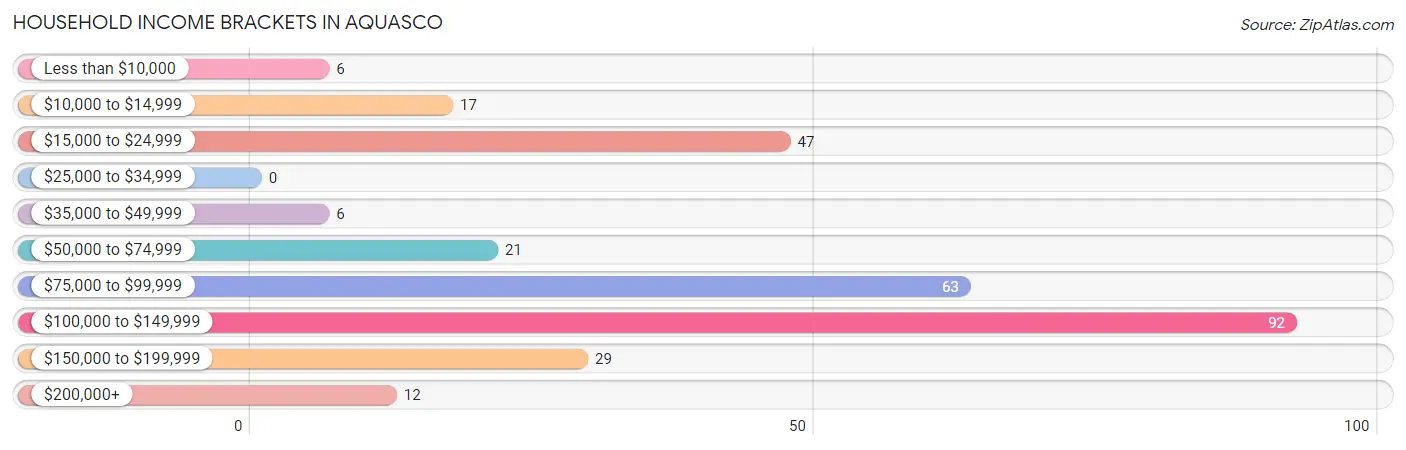
| Income Bracket | # Households | % Households |
| Less than $10,000 | 6 | 2.0% |
| $10,000 to $14,999 | 17 | 5.8% |
| $15,000 to $24,999 | 47 | 16.0% |
| $25,000 to $34,999 | 0 | 0.0% |
| $35,000 to $49,999 | 6 | 2.0% |
| $50,000 to $74,999 | 21 | 7.2% |
| $75,000 to $99,999 | 63 | 21.5% |
| $100,000 to $149,999 | 92 | 31.4% |
| $150,000 to $199,999 | 29 | 9.9% |
| $200,000+ | 12 | 4.1% |
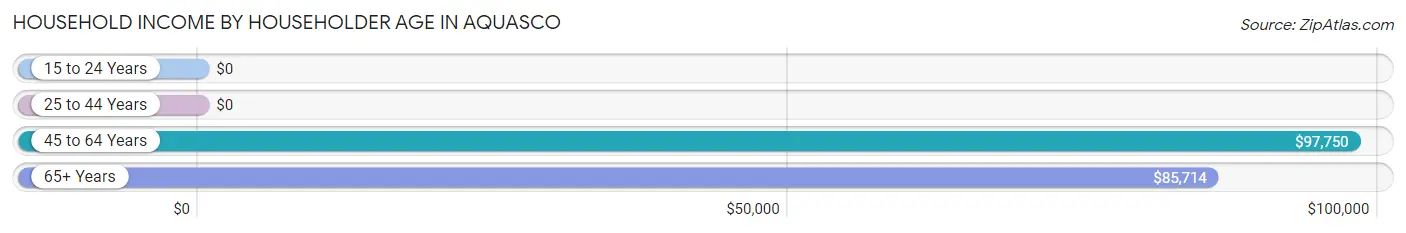
Household Income by Householder Age in Aquasco
The median household income in Aquasco is $94,028, with the highest median household income of $97,750 found in the 45 to 64 years age bracket for the primary householder. A total of 66 households (22.5%) fall into this category.
| Income Bracket | # Households | Median Income |
| 15 to 24 Years | 0 (0.0%) | $0 |
| 25 to 44 Years | 113 (38.6%) | $0 |
| 45 to 64 Years | 66 (22.5%) | $97,750 |
| 65+ Years | 114 (38.9%) | $85,714 |
| Total | 293 (100.0%) | $94,028 |
Poverty in Aquasco
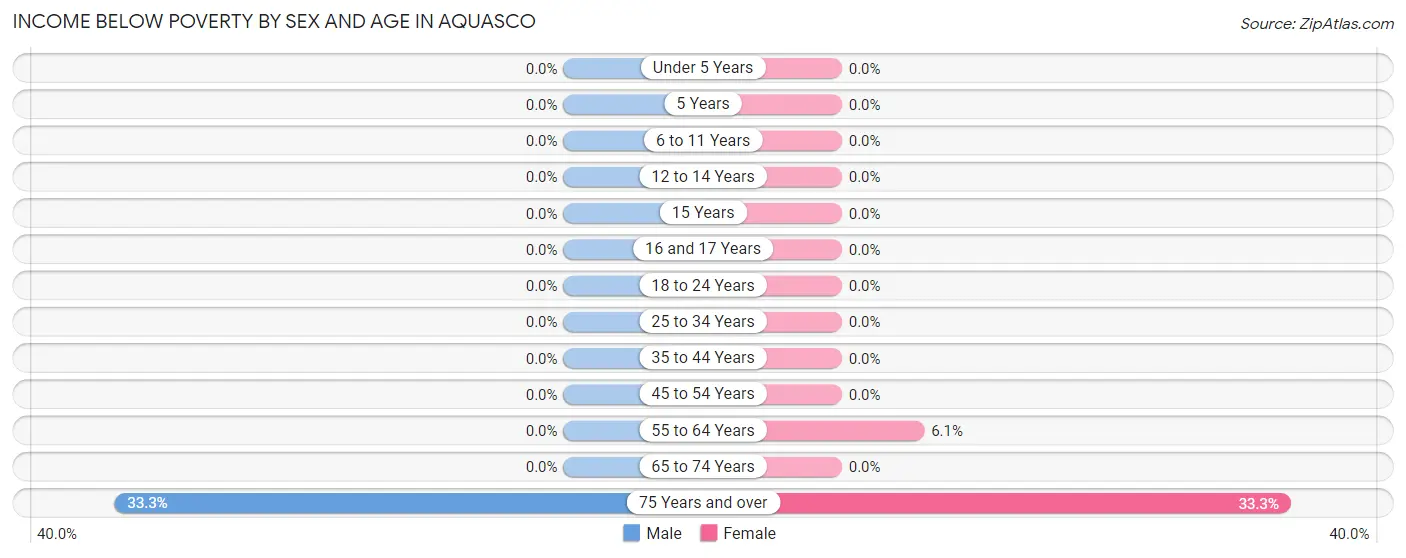
Income Below Poverty by Sex and Age in Aquasco
With 4.3% poverty level for males and 7.6% for females among the residents of Aquasco, 75 year old and over males and 75 year old and over females are the most vulnerable to poverty, with 17 males (33.3%) and 17 females (33.3%) in their respective age groups living below the poverty level.
| Age Bracket | Male | Female |
| Under 5 Years | 0 (0.0%) | 0 (0.0%) |
| 5 Years | 0 (0.0%) | 0 (0.0%) |
| 6 to 11 Years | 0 (0.0%) | 0 (0.0%) |
| 12 to 14 Years | 0 (0.0%) | 0 (0.0%) |
| 15 Years | 0 (0.0%) | 0 (0.0%) |
| 16 and 17 Years | 0 (0.0%) | 0 (0.0%) |
| 18 to 24 Years | 0 (0.0%) | 0 (0.0%) |
| 25 to 34 Years | 0 (0.0%) | 0 (0.0%) |
| 35 to 44 Years | 0 (0.0%) | 0 (0.0%) |
| 45 to 54 Years | 0 (0.0%) | 0 (0.0%) |
| 55 to 64 Years | 0 (0.0%) | 6 (6.1%) |
| 65 to 74 Years | 0 (0.0%) | 0 (0.0%) |
| 75 Years and over | 17 (33.3%) | 17 (33.3%) |
| Total | 17 (4.3%) | 23 (7.6%) |
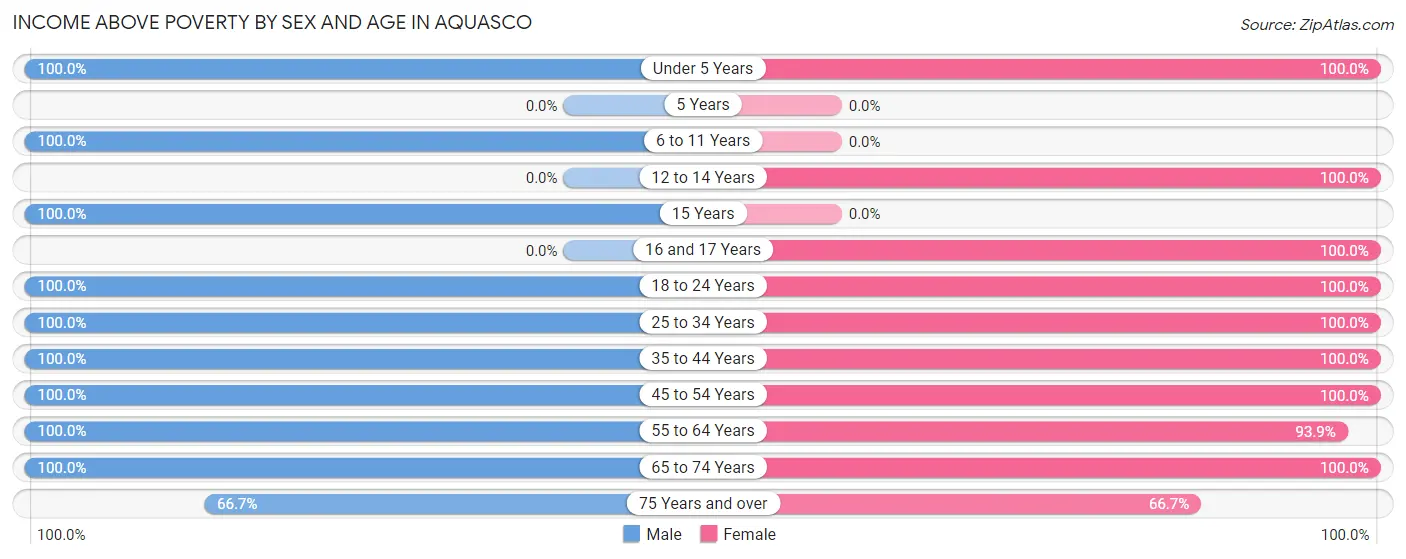
Income Above Poverty by Sex and Age in Aquasco
According to the poverty statistics in Aquasco, males aged under 5 years and females aged under 5 years are the age groups that are most secure financially, with 100.0% of males and 100.0% of females in these age groups living above the poverty line.
| Age Bracket | Male | Female |
| Under 5 Years | 68 (100.0%) | 16 (100.0%) |
| 5 Years | 0 (0.0%) | 0 (0.0%) |
| 6 to 11 Years | 45 (100.0%) | 0 (0.0%) |
| 12 to 14 Years | 0 (0.0%) | 6 (100.0%) |
| 15 Years | 6 (100.0%) | 0 (0.0%) |
| 16 and 17 Years | 0 (0.0%) | 5 (100.0%) |
| 18 to 24 Years | 19 (100.0%) | 8 (100.0%) |
| 25 to 34 Years | 43 (100.0%) | 33 (100.0%) |
| 35 to 44 Years | 67 (100.0%) | 28 (100.0%) |
| 45 to 54 Years | 33 (100.0%) | 16 (100.0%) |
| 55 to 64 Years | 17 (100.0%) | 92 (93.9%) |
| 65 to 74 Years | 48 (100.0%) | 43 (100.0%) |
| 75 Years and over | 34 (66.7%) | 34 (66.7%) |
| Total | 380 (95.7%) | 281 (92.4%) |
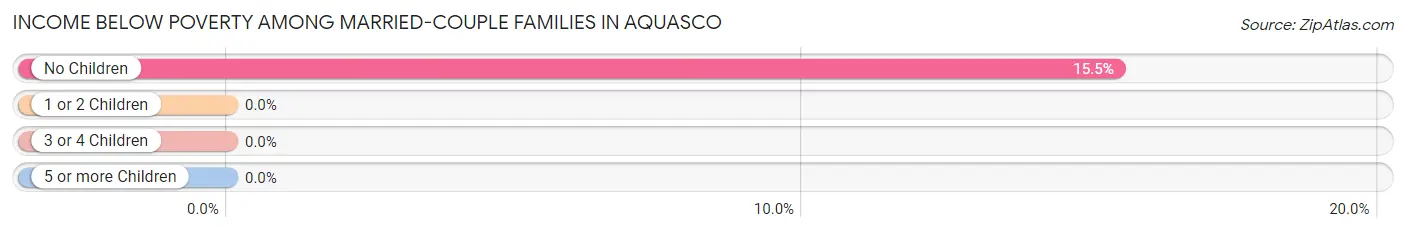
Income Below Poverty Among Married-Couple Families in Aquasco
The poverty statistics for married-couple families in Aquasco show that 9.4% or 17 of the total 180 families live below the poverty line. Families with no children have the highest poverty rate of 15.4%, comprising of 17 families. On the other hand, families with 1 or 2 children have the lowest poverty rate of 0.0%, which includes 0 families.
| Children | Above Poverty | Below Poverty |
| No Children | 93 (84.6%) | 17 (15.4%) |
| 1 or 2 Children | 50 (100.0%) | 0 (0.0%) |
| 3 or 4 Children | 14 (100.0%) | 0 (0.0%) |
| 5 or more Children | 6 (100.0%) | 0 (0.0%) |
| Total | 163 (90.6%) | 17 (9.4%) |
Income Below Poverty Among Single-Parent Households in Aquasco
| Children | Single Father | Single Mother |
| No Children | 0 (0.0%) | 0 (0.0%) |
| 1 or 2 Children | 0 (0.0%) | 0 (0.0%) |
| 3 or 4 Children | 0 (0.0%) | 0 (0.0%) |
| 5 or more Children | 0 (0.0%) | 0 (0.0%) |
| Total | 0 (0.0%) | 0 (0.0%) |
Income Below Poverty Among Married-Couple vs Single-Parent Households in Aquasco
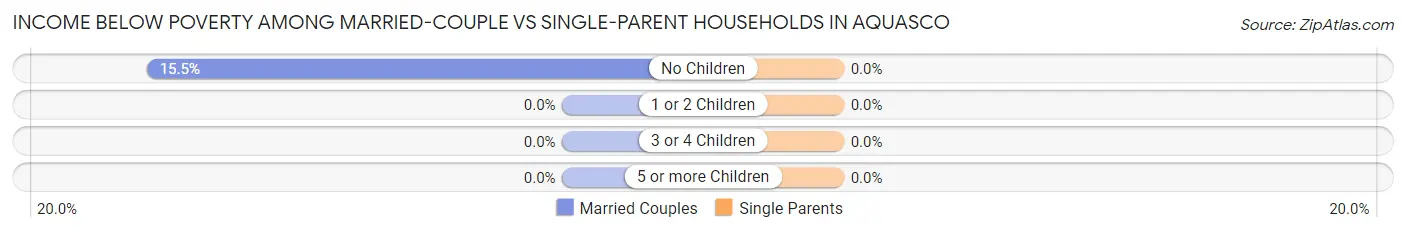
| Children | Married-Couple Families | Single-Parent Households |
| No Children | 17 (15.4%) | 0 (0.0%) |
| 1 or 2 Children | 0 (0.0%) | 0 (0.0%) |
| 3 or 4 Children | 0 (0.0%) | 0 (0.0%) |
| 5 or more Children | 0 (0.0%) | 0 (0.0%) |
| Total | 17 (9.4%) | 0 (0.0%) |
Race in Aquasco
The most populous races in Aquasco are White / Caucasian (386 | 55.1%), Black / African American (200 | 28.5%), and Hispanic or Latino (75 | 10.7%).
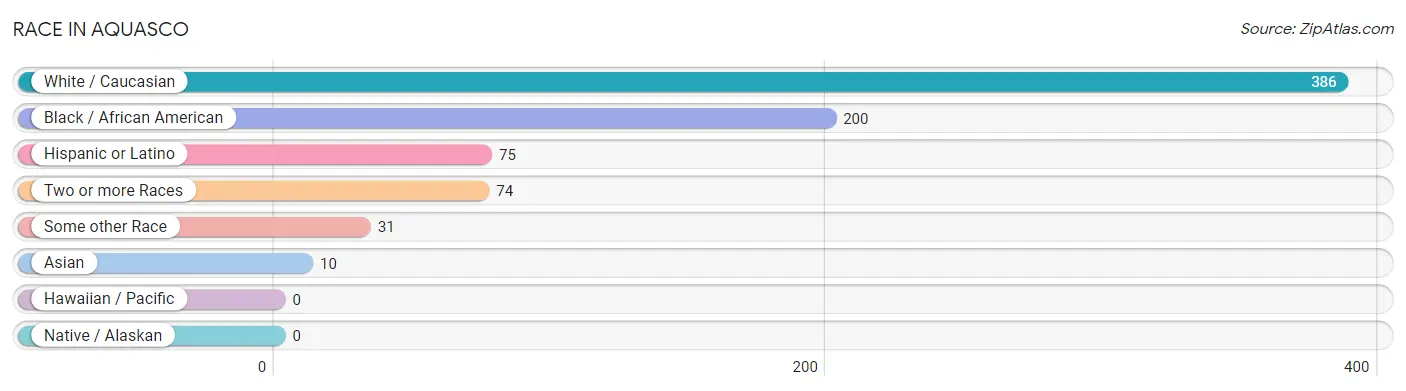
| Race | # Population | % Population |
| Asian | 10 | 1.4% |
| Black / African American | 200 | 28.5% |
| Hawaiian / Pacific | 0 | 0.0% |
| Hispanic or Latino | 75 | 10.7% |
| Native / Alaskan | 0 | 0.0% |
| White / Caucasian | 386 | 55.1% |
| Two or more Races | 74 | 10.6% |
| Some other Race | 31 | 4.4% |
| Total | 701 | 100.0% |
Ancestry in Aquasco
The most populous ancestries reported in Aquasco are English (161 | 23.0%), Irish (63 | 9.0%), European (62 | 8.8%), Cuban (47 | 6.7%), and American (43 | 6.1%), together accounting for 53.6% of all Aquasco residents.
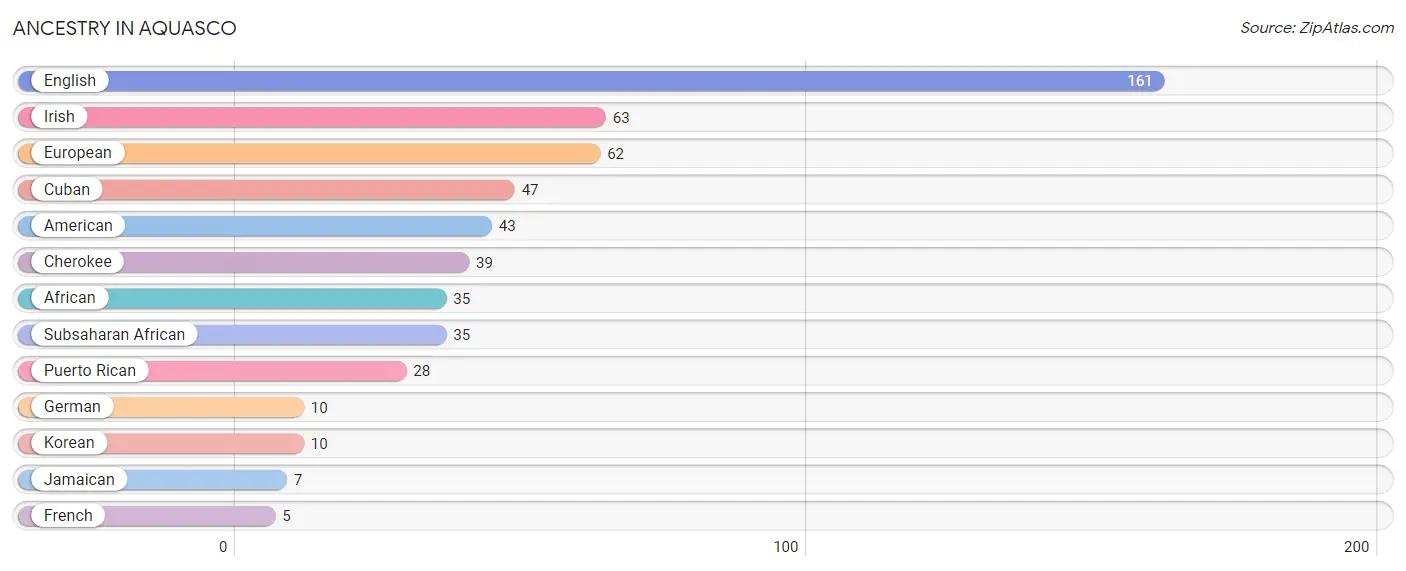
| Ancestry | # Population | % Population |
| African | 35 | 5.0% |
| American | 43 | 6.1% |
| Cherokee | 39 | 5.6% |
| Cuban | 47 | 6.7% |
| English | 161 | 23.0% |
| European | 62 | 8.8% |
| French | 5 | 0.7% |
| German | 10 | 1.4% |
| Irish | 63 | 9.0% |
| Jamaican | 7 | 1.0% |
| Korean | 10 | 1.4% |
| Puerto Rican | 28 | 4.0% |
| Subsaharan African | 35 | 5.0% | View All 13 Rows |
Immigrants in Aquasco
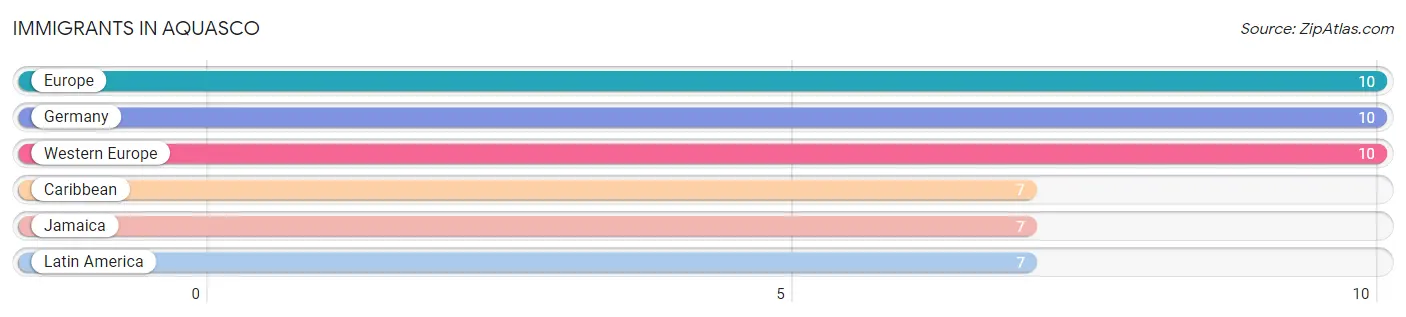
The most numerous immigrant groups reported in Aquasco came from Europe (10 | 1.4%), Germany (10 | 1.4%), Western Europe (10 | 1.4%), Caribbean (7 | 1.0%), and Jamaica (7 | 1.0%), together accounting for 6.3% of all Aquasco residents.
| Immigration Origin | # Population | % Population |
| Caribbean | 7 | 1.0% |
| Europe | 10 | 1.4% |
| Germany | 10 | 1.4% |
| Jamaica | 7 | 1.0% |
| Latin America | 7 | 1.0% |
| Western Europe | 10 | 1.4% | View All 6 Rows |
Sex and Age in Aquasco
Sex and Age in Aquasco
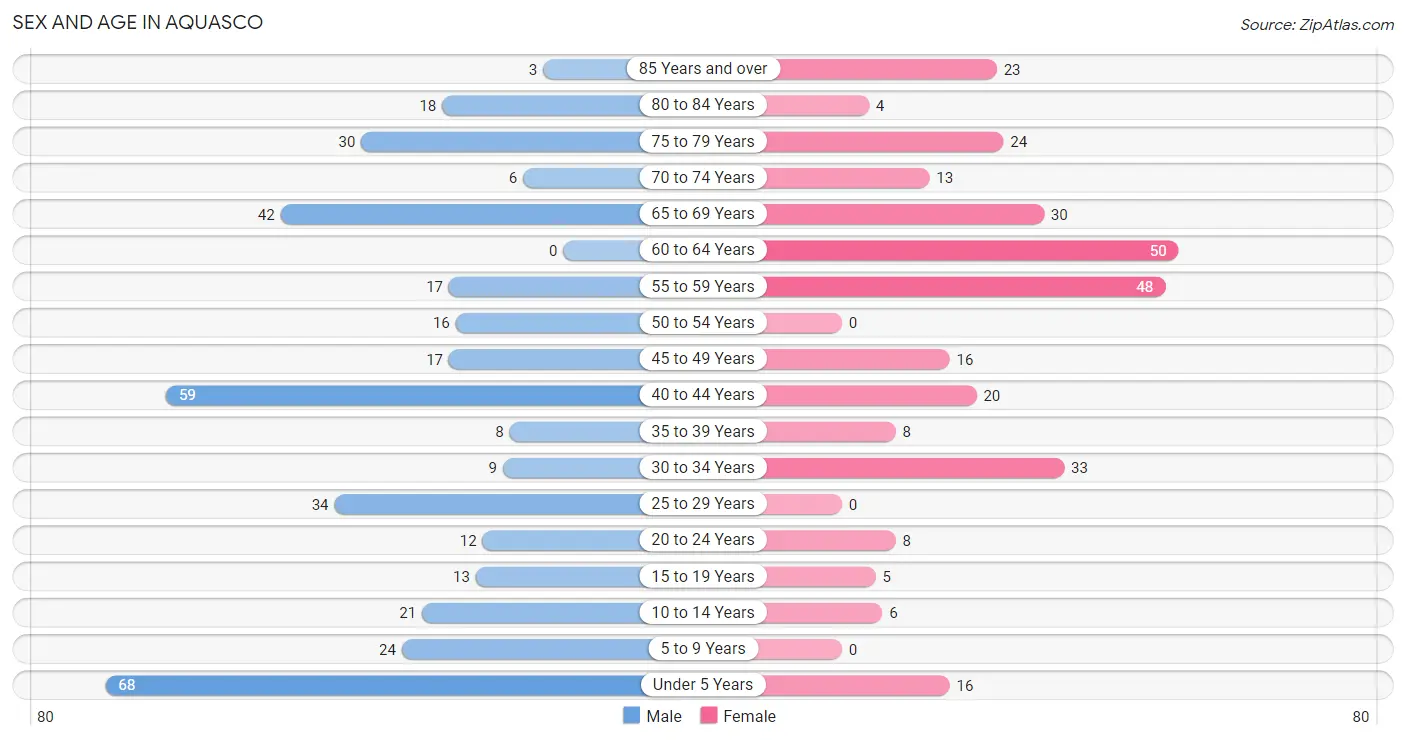
The most populous age groups in Aquasco are Under 5 Years (68 | 17.1%) for men and 60 to 64 Years (50 | 16.5%) for women.
| Age Bracket | Male | Female |
| Under 5 Years | 68 (17.1%) | 16 (5.3%) |
| 5 to 9 Years | 24 (6.0%) | 0 (0.0%) |
| 10 to 14 Years | 21 (5.3%) | 6 (2.0%) |
| 15 to 19 Years | 13 (3.3%) | 5 (1.6%) |
| 20 to 24 Years | 12 (3.0%) | 8 (2.6%) |
| 25 to 29 Years | 34 (8.6%) | 0 (0.0%) |
| 30 to 34 Years | 9 (2.3%) | 33 (10.9%) |
| 35 to 39 Years | 8 (2.0%) | 8 (2.6%) |
| 40 to 44 Years | 59 (14.9%) | 20 (6.6%) |
| 45 to 49 Years | 17 (4.3%) | 16 (5.3%) |
| 50 to 54 Years | 16 (4.0%) | 0 (0.0%) |
| 55 to 59 Years | 17 (4.3%) | 48 (15.8%) |
| 60 to 64 Years | 0 (0.0%) | 50 (16.5%) |
| 65 to 69 Years | 42 (10.6%) | 30 (9.9%) |
| 70 to 74 Years | 6 (1.5%) | 13 (4.3%) |
| 75 to 79 Years | 30 (7.6%) | 24 (7.9%) |
| 80 to 84 Years | 18 (4.5%) | 4 (1.3%) |
| 85 Years and over | 3 (0.8%) | 23 (7.6%) |
| Total | 397 (100.0%) | 304 (100.0%) |
Families and Households in Aquasco
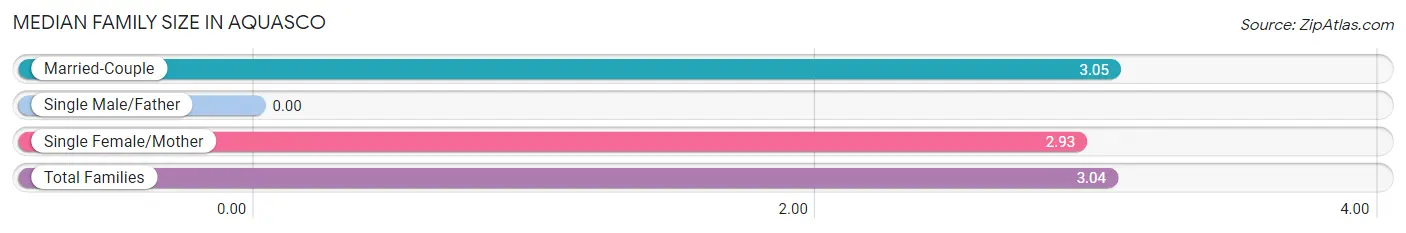
Median Family Size in Aquasco
| Family Type | # Families | Family Size |
| Married-Couple | 180 (92.3%) | 3.05 |
| Single Male/Father | 0 (0.0%) | - |
| Single Female/Mother | 15 (7.7%) | 2.93 |
| Total Families | 195 (100.0%) | 3.04 |
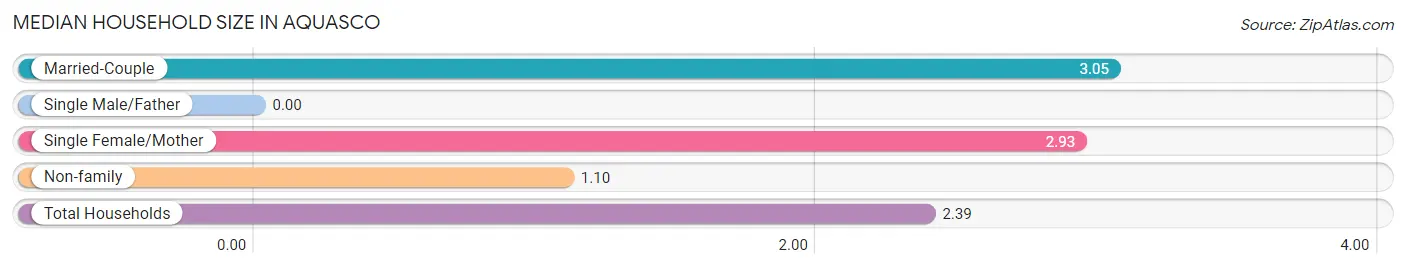
Median Household Size in Aquasco
| Household Type | # Households | Household Size |
| Married-Couple | 180 (61.4%) | 3.05 |
| Single Male/Father | 0 (0.0%) | - |
| Single Female/Mother | 15 (5.1%) | 2.93 |
| Non-family | 98 (33.5%) | 1.10 |
| Total Households | 293 (100.0%) | 2.39 |
Household Size by Marriage Status in Aquasco
Out of a total of 293 households in Aquasco, 195 (66.5%) are family households, while 98 (33.5%) are nonfamily households. The most numerous type of family households are 2-person households, comprising 102, and the most common type of nonfamily households are 1-person households, comprising 89.
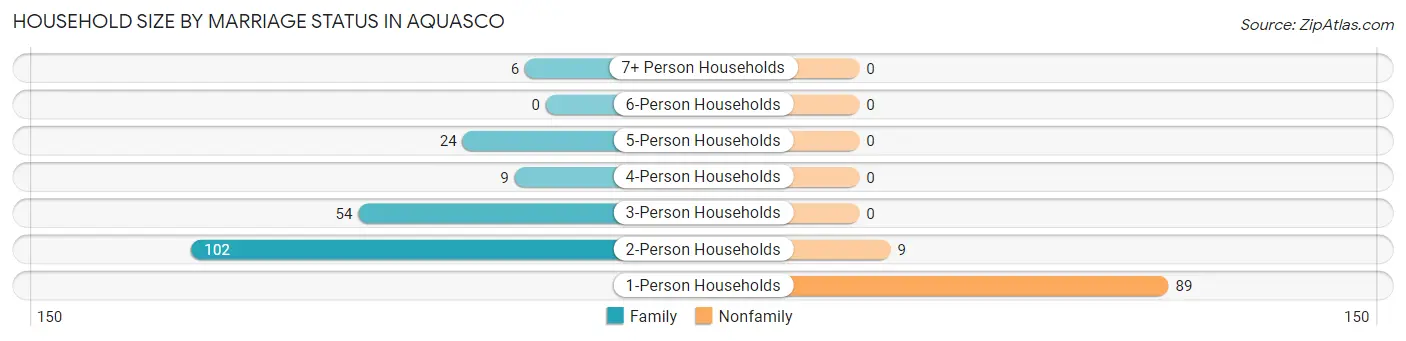
| Household Size | Family Households | Nonfamily Households |
| 1-Person Households | - | 89 (30.4%) |
| 2-Person Households | 102 (34.8%) | 9 (3.1%) |
| 3-Person Households | 54 (18.4%) | 0 (0.0%) |
| 4-Person Households | 9 (3.1%) | 0 (0.0%) |
| 5-Person Households | 24 (8.2%) | 0 (0.0%) |
| 6-Person Households | 0 (0.0%) | 0 (0.0%) |
| 7+ Person Households | 6 (2.1%) | 0 (0.0%) |
| Total | 195 (66.5%) | 98 (33.5%) |
Female Fertility in Aquasco
Fertility by Age in Aquasco
Average fertility rate in Aquasco is 356.0 births per 1,000 women. Women in the age bracket of 20 to 34 years have the highest fertility rate with 780.0 births per 1,000 women. Women in the age bracket of 20 to 34 years acount for 100.0% of all women with births.
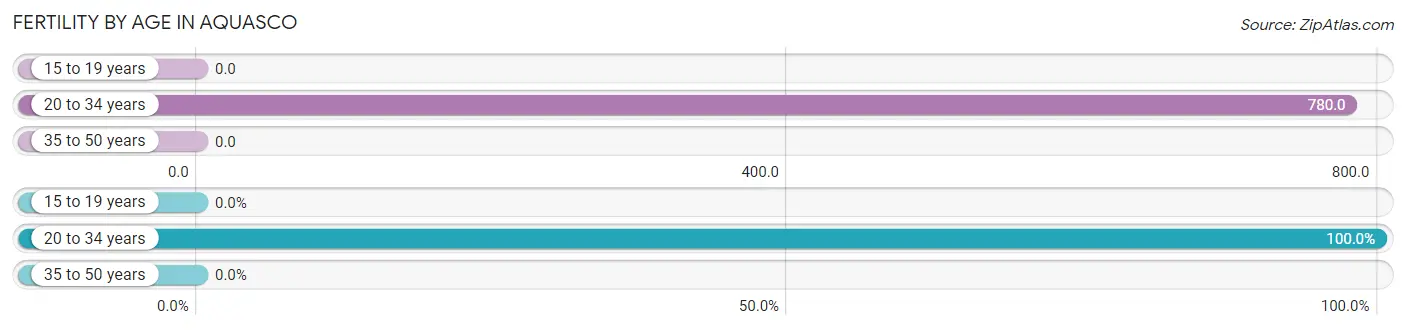
| Age Bracket | Women with Births | Births / 1,000 Women |
| 15 to 19 years | 0 (0.0%) | 0.0 |
| 20 to 34 years | 32 (100.0%) | 780.0 |
| 35 to 50 years | 0 (0.0%) | 0.0 |
| Total | 32 (100.0%) | 356.0 |
Fertility by Age by Marriage Status in Aquasco
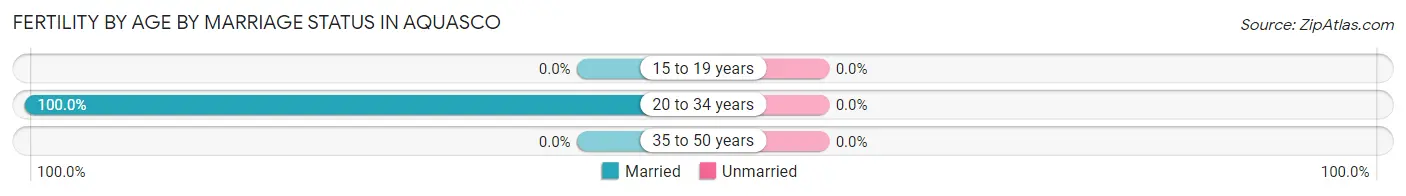
| Age Bracket | Married | Unmarried |
| 15 to 19 years | 0 (0.0%) | 0 (0.0%) |
| 20 to 34 years | 32 (100.0%) | 0 (0.0%) |
| 35 to 50 years | 0 (0.0%) | 0 (0.0%) |
| Total | 32 (100.0%) | 0 (0.0%) |
Fertility by Education in Aquasco
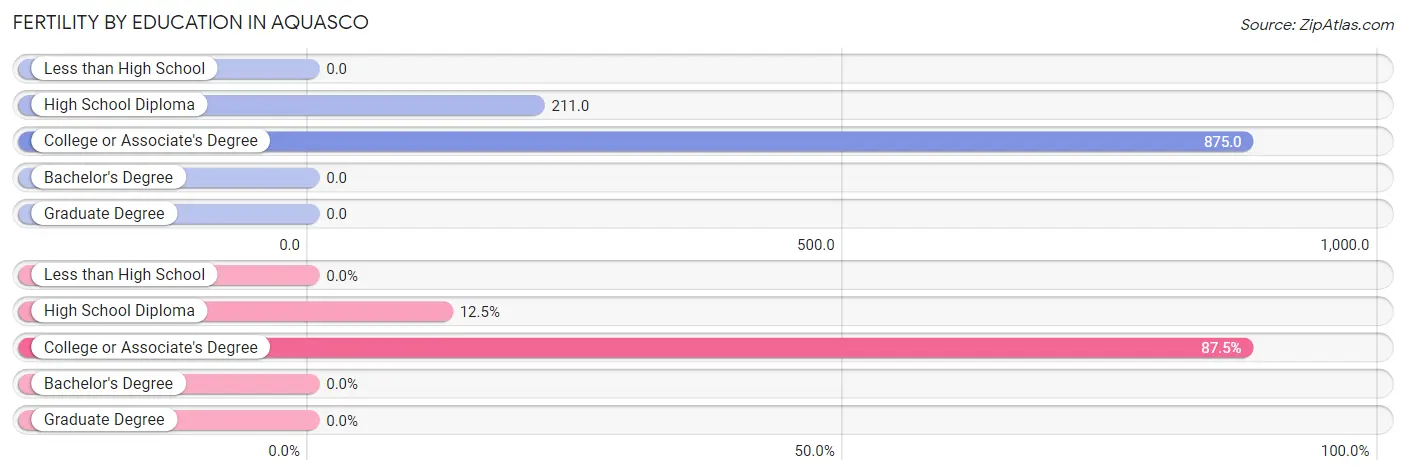
| Educational Attainment | Women with Births | Births / 1,000 Women |
| Less than High School | 0 (0.0%) | 0.0 |
| High School Diploma | 4 (12.5%) | 211.0 |
| College or Associate's Degree | 28 (87.5%) | 875.0 |
| Bachelor's Degree | 0 (0.0%) | 0.0 |
| Graduate Degree | 0 (0.0%) | 0.0 |
| Total | 32 (100.0%) | 356.0 |
Fertility by Education by Marriage Status in Aquasco
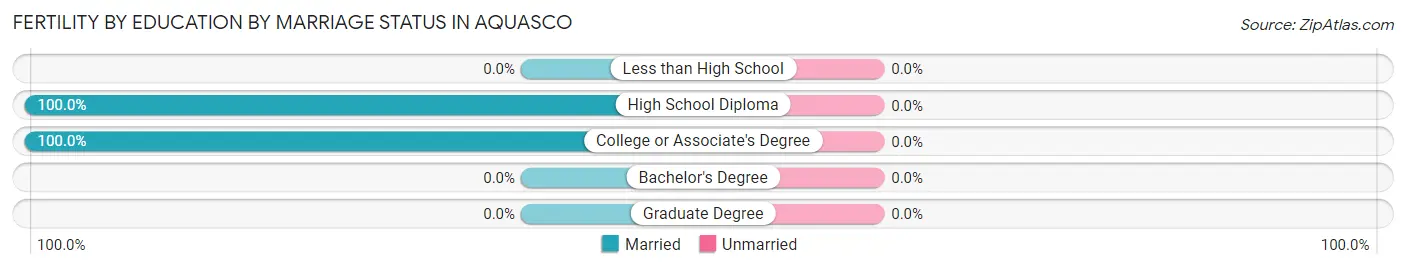
| Educational Attainment | Married | Unmarried |
| Less than High School | 0 (0.0%) | 0 (0.0%) |
| High School Diploma | 4 (100.0%) | 0 (0.0%) |
| College or Associate's Degree | 28 (100.0%) | 0 (0.0%) |
| Bachelor's Degree | 0 (0.0%) | 0 (0.0%) |
| Graduate Degree | 0 (0.0%) | 0 (0.0%) |
| Total | 32 (100.0%) | 0 (0.0%) |
Employment Characteristics in Aquasco
Employment by Class of Employer in Aquasco
Among the 314 employed individuals in Aquasco, private company employees (133 | 42.4%), local government employees (73 | 23.3%), and federal government employees (50 | 15.9%) make up the most common classes of employment.
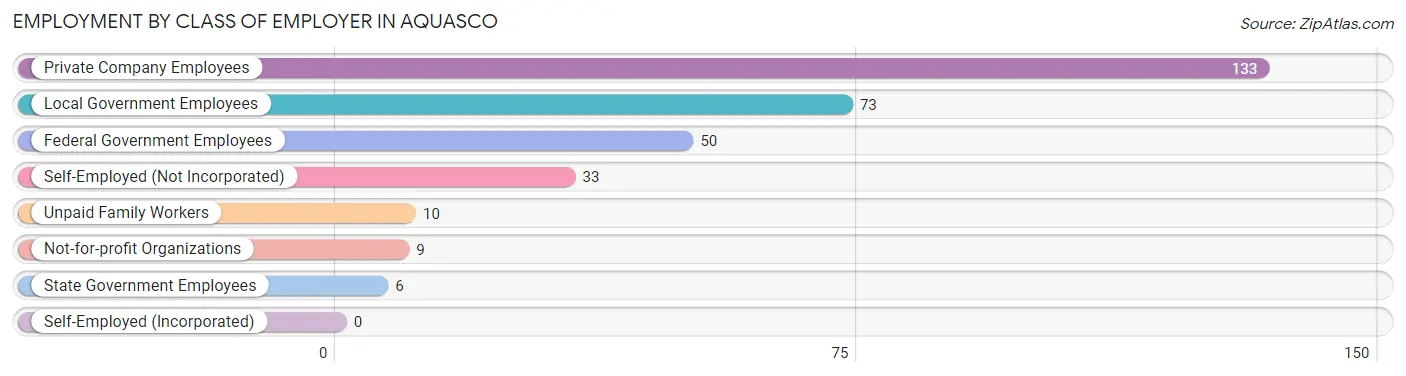
| Employer Class | # Employees | % Employees |
| Private Company Employees | 133 | 42.4% |
| Self-Employed (Incorporated) | 0 | 0.0% |
| Self-Employed (Not Incorporated) | 33 | 10.5% |
| Not-for-profit Organizations | 9 | 2.9% |
| Local Government Employees | 73 | 23.3% |
| State Government Employees | 6 | 1.9% |
| Federal Government Employees | 50 | 15.9% |
| Unpaid Family Workers | 10 | 3.2% |
| Total | 314 | 100.0% |
Employment Status by Age in Aquasco
According to the labor force statistics for Aquasco, out of the total population over 16 years of age (560), 58.4% or 327 individuals are in the labor force, with 3.1% or 10 of them unemployed. The age group with the highest labor force participation rate is 25 to 29 years, with 100.0% or 34 individuals in the labor force. Within the labor force, the 65 to 74 years age range has the highest percentage of unemployed individuals, with 10.9% or 5 of them being unemployed.
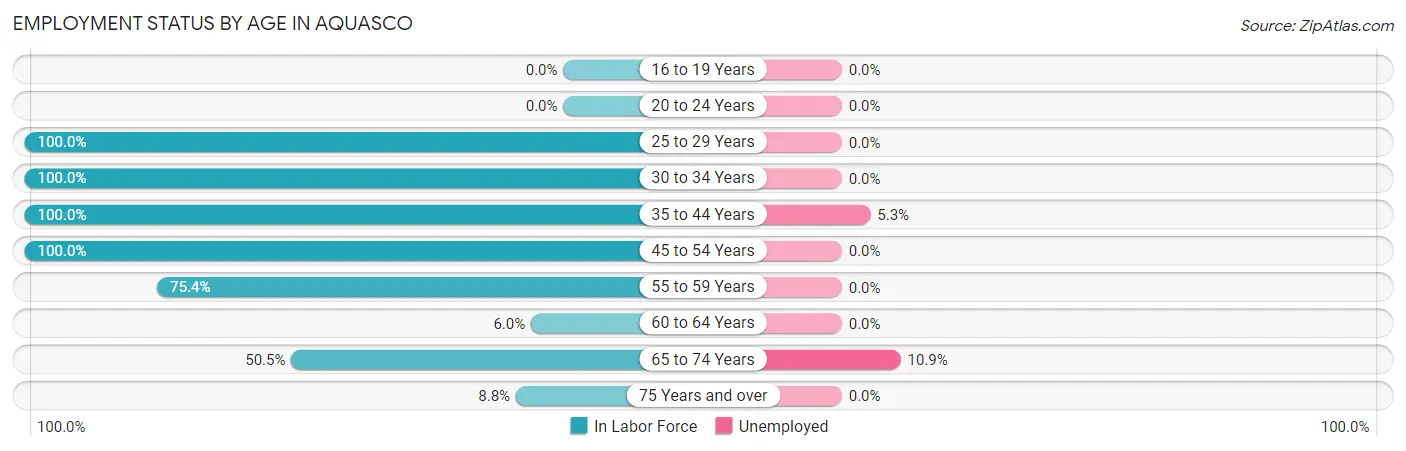
| Age Bracket | In Labor Force | Unemployed |
| 16 to 19 Years | 0 (0.0%) | 0 (0.0%) |
| 20 to 24 Years | 0 (0.0%) | 0 (0.0%) |
| 25 to 29 Years | 34 (100.0%) | 0 (0.0%) |
| 30 to 34 Years | 42 (100.0%) | 0 (0.0%) |
| 35 to 44 Years | 95 (100.0%) | 5 (5.3%) |
| 45 to 54 Years | 49 (100.0%) | 0 (0.0%) |
| 55 to 59 Years | 49 (75.4%) | 0 (0.0%) |
| 60 to 64 Years | 3 (6.0%) | 0 (0.0%) |
| 65 to 74 Years | 46 (50.5%) | 5 (10.9%) |
| 75 Years and over | 9 (8.8%) | 0 (0.0%) |
| Total | 327 (58.4%) | 10 (3.1%) |
Employment Status by Educational Attainment in Aquasco
According to labor force statistics for Aquasco, 81.2% of individuals (272) out of the total population between 25 and 64 years of age (335) are in the labor force, with 1.8% or 5 of them being unemployed. The group with the highest labor force participation rate are those with the educational attainment of less than high school, with 100.0% or 3 individuals in the labor force. Within the labor force, individuals with high school diploma education have the highest percentage of unemployment, with 5.0% or 5 of them being unemployed.
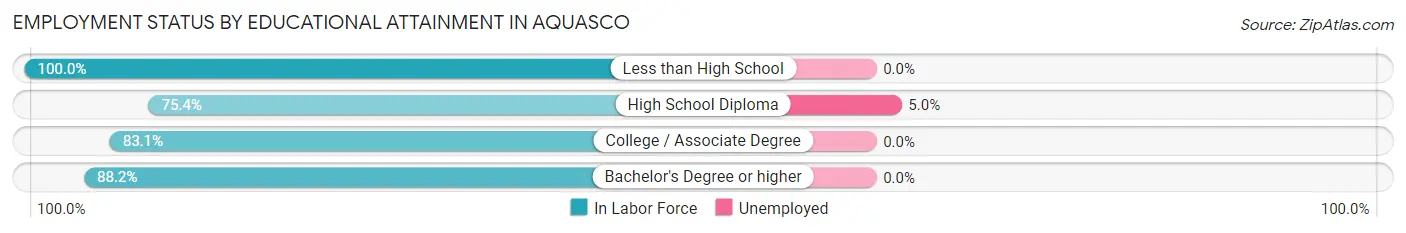
| Educational Attainment | In Labor Force | Unemployed |
| Less than High School | 3 (100.0%) | 0 (0.0%) |
| High School Diploma | 101 (75.4%) | 7 (5.0%) |
| College / Associate Degree | 108 (83.1%) | 0 (0.0%) |
| Bachelor's Degree or higher | 60 (88.2%) | 0 (0.0%) |
| Total | 272 (81.2%) | 6 (1.8%) |
Employment Occupations by Sex in Aquasco
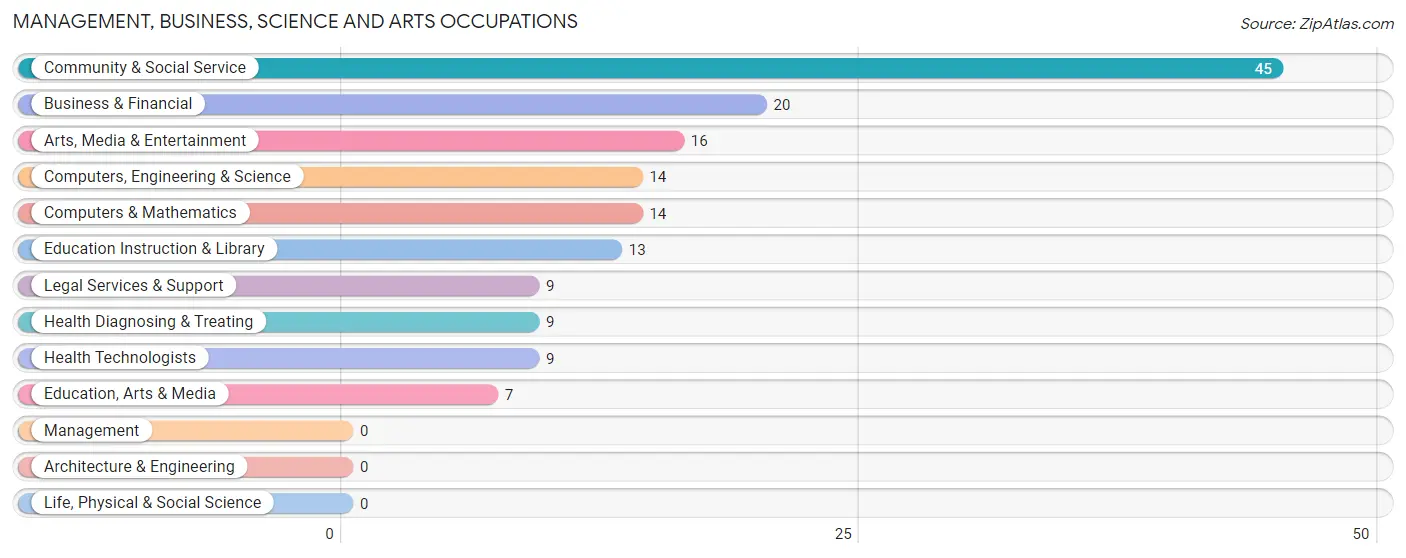
Management, Business, Science and Arts Occupations
The most common Management, Business, Science and Arts occupations in Aquasco are Community & Social Service (45 | 14.2%), Business & Financial (20 | 6.3%), Arts, Media & Entertainment (16 | 5.1%), Computers, Engineering & Science (14 | 4.4%), and Computers & Mathematics (14 | 4.4%).
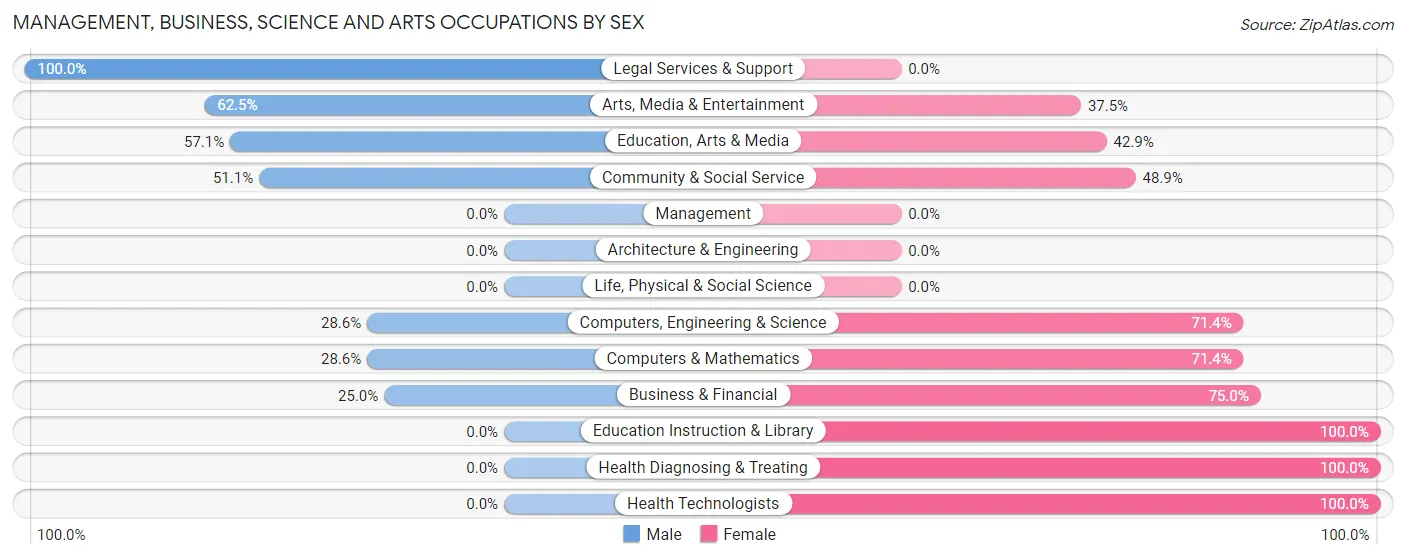
Management, Business, Science and Arts Occupations by Sex
Within the Management, Business, Science and Arts occupations in Aquasco, the most male-oriented occupations are Legal Services & Support (100.0%), Arts, Media & Entertainment (62.5%), and Education, Arts & Media (57.1%), while the most female-oriented occupations are Education Instruction & Library (100.0%), Health Diagnosing & Treating (100.0%), and Health Technologists (100.0%).
| Occupation | Male | Female |
| Management | 0 (0.0%) | 0 (0.0%) |
| Business & Financial | 5 (25.0%) | 15 (75.0%) |
| Computers, Engineering & Science | 4 (28.6%) | 10 (71.4%) |
| Computers & Mathematics | 4 (28.6%) | 10 (71.4%) |
| Architecture & Engineering | 0 (0.0%) | 0 (0.0%) |
| Life, Physical & Social Science | 0 (0.0%) | 0 (0.0%) |
| Community & Social Service | 23 (51.1%) | 22 (48.9%) |
| Education, Arts & Media | 4 (57.1%) | 3 (42.9%) |
| Legal Services & Support | 9 (100.0%) | 0 (0.0%) |
| Education Instruction & Library | 0 (0.0%) | 13 (100.0%) |
| Arts, Media & Entertainment | 10 (62.5%) | 6 (37.5%) |
| Health Diagnosing & Treating | 0 (0.0%) | 9 (100.0%) |
| Health Technologists | 0 (0.0%) | 9 (100.0%) |
| Total (Category) | 32 (36.4%) | 56 (63.6%) |
| Total (Overall) | 200 (63.1%) | 117 (36.9%) |
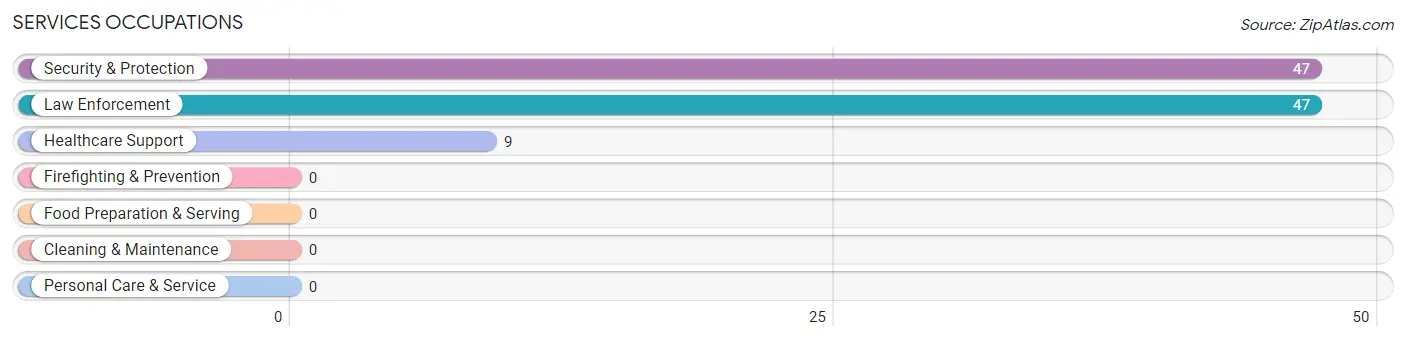
Services Occupations
The most common Services occupations in Aquasco are Security & Protection (47 | 14.8%), Law Enforcement (47 | 14.8%), and Healthcare Support (9 | 2.8%).
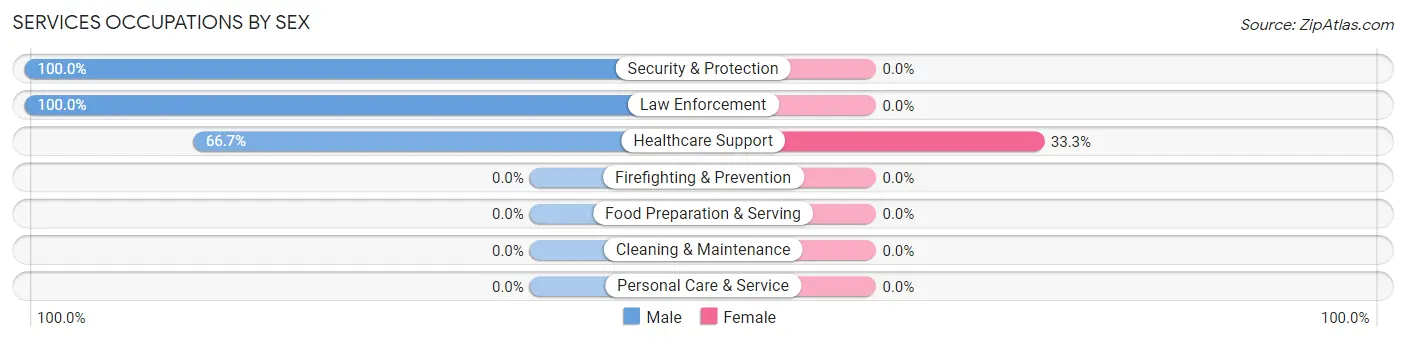
Services Occupations by Sex
| Occupation | Male | Female |
| Healthcare Support | 6 (66.7%) | 3 (33.3%) |
| Security & Protection | 47 (100.0%) | 0 (0.0%) |
| Firefighting & Prevention | 0 (0.0%) | 0 (0.0%) |
| Law Enforcement | 47 (100.0%) | 0 (0.0%) |
| Food Preparation & Serving | 0 (0.0%) | 0 (0.0%) |
| Cleaning & Maintenance | 0 (0.0%) | 0 (0.0%) |
| Personal Care & Service | 0 (0.0%) | 0 (0.0%) |
| Total (Category) | 53 (94.6%) | 3 (5.4%) |
| Total (Overall) | 200 (63.1%) | 117 (36.9%) |
Sales and Office Occupations
The most common Sales and Office occupations in Aquasco are Sales & Related (33 | 10.4%), and Office & Administration (31 | 9.8%).
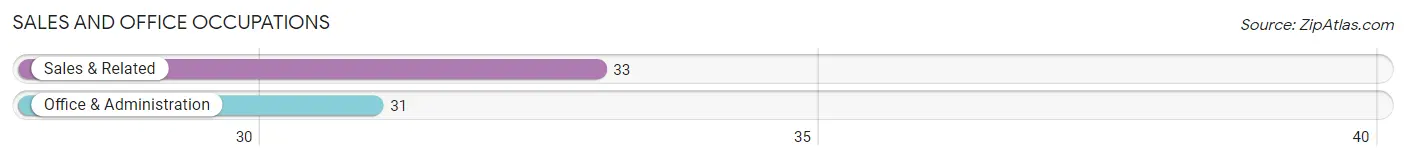
Sales and Office Occupations by Sex

| Occupation | Male | Female |
| Sales & Related | 0 (0.0%) | 33 (100.0%) |
| Office & Administration | 16 (51.6%) | 15 (48.4%) |
| Total (Category) | 16 (25.0%) | 48 (75.0%) |
| Total (Overall) | 200 (63.1%) | 117 (36.9%) |
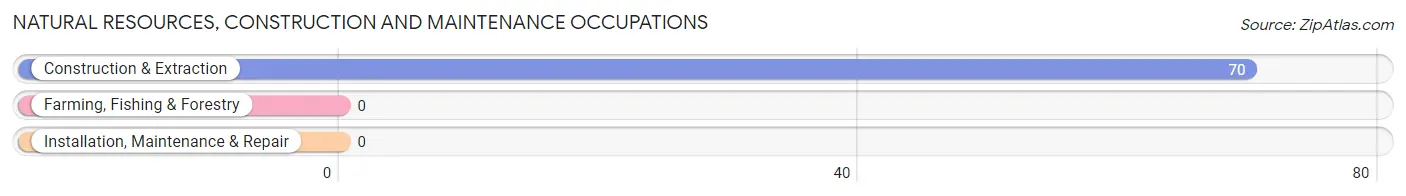
Natural Resources, Construction and Maintenance Occupations
The most common Natural Resources, Construction and Maintenance occupations in Aquasco are , and Construction & Extraction (70 | 22.1%).
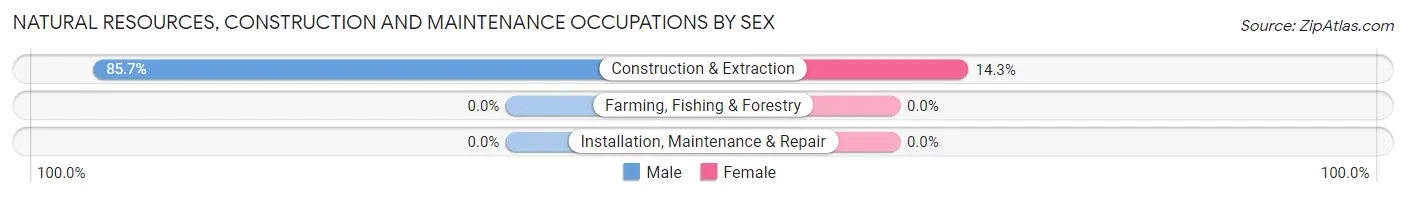
Natural Resources, Construction and Maintenance Occupations by Sex
| Occupation | Male | Female |
| Farming, Fishing & Forestry | 0 (0.0%) | 0 (0.0%) |
| Construction & Extraction | 60 (85.7%) | 10 (14.3%) |
| Installation, Maintenance & Repair | 0 (0.0%) | 0 (0.0%) |
| Total (Category) | 60 (85.7%) | 10 (14.3%) |
| Total (Overall) | 200 (63.1%) | 117 (36.9%) |
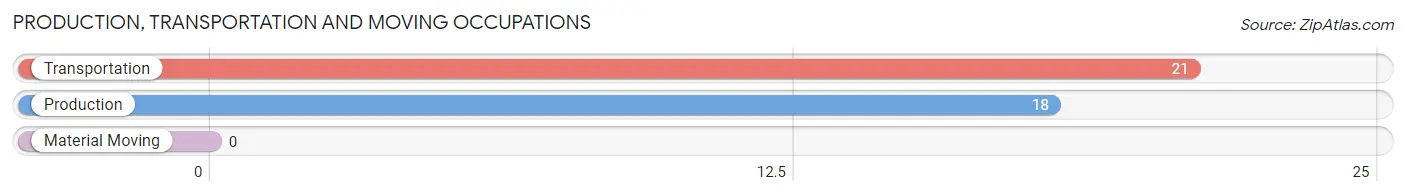
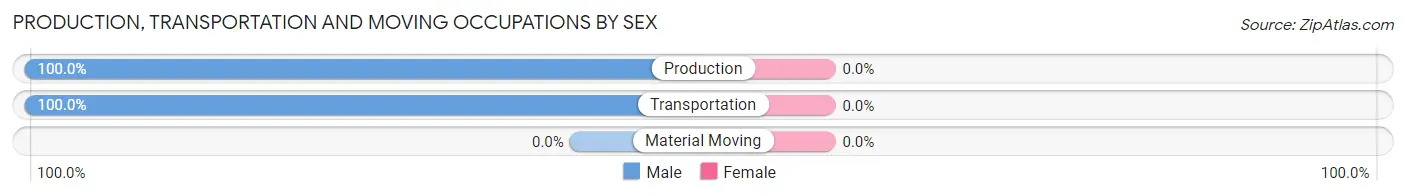
Production, Transportation and Moving Occupations
The most common Production, Transportation and Moving occupations in Aquasco are Transportation (21 | 6.6%), and Production (18 | 5.7%).
Production, Transportation and Moving Occupations by Sex
| Occupation | Male | Female |
| Production | 18 (100.0%) | 0 (0.0%) |
| Transportation | 21 (100.0%) | 0 (0.0%) |
| Material Moving | 0 (0.0%) | 0 (0.0%) |
| Total (Category) | 39 (100.0%) | 0 (0.0%) |
| Total (Overall) | 200 (63.1%) | 117 (36.9%) |
Employment Industries by Sex in Aquasco
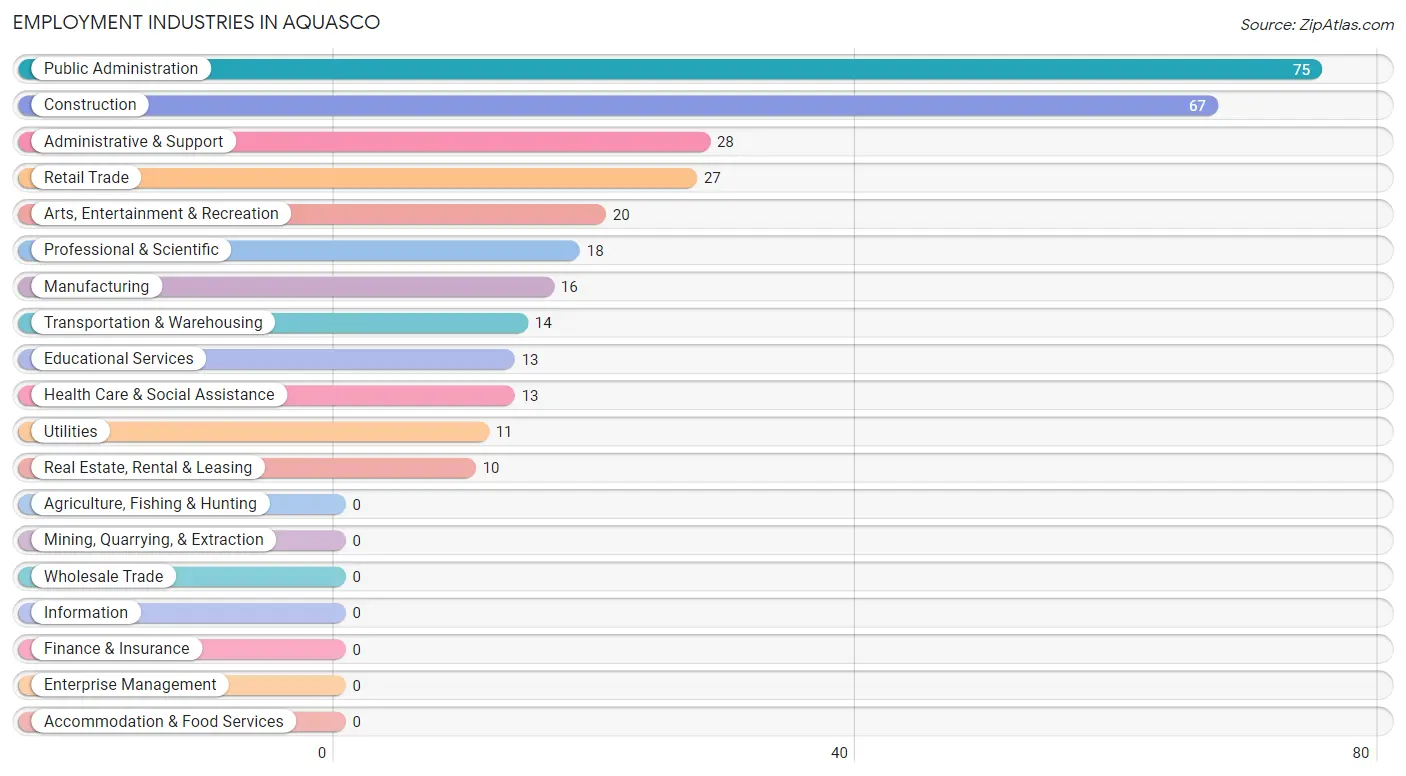
Employment Industries in Aquasco
The major employment industries in Aquasco include Public Administration (75 | 23.7%), Construction (67 | 21.1%), Administrative & Support (28 | 8.8%), Retail Trade (27 | 8.5%), and Arts, Entertainment & Recreation (20 | 6.3%).
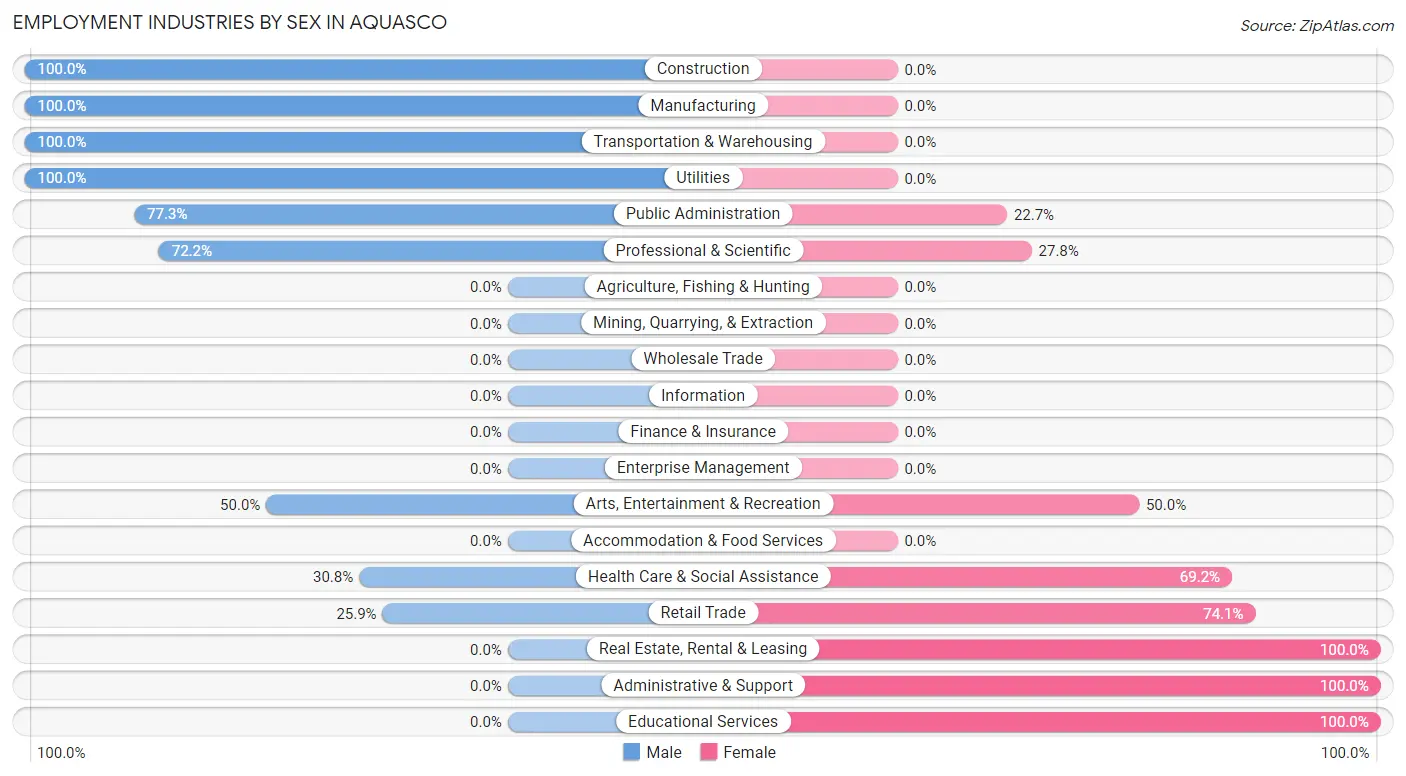
Employment Industries by Sex in Aquasco
The Aquasco industries that see more men than women are Construction (100.0%), Manufacturing (100.0%), and Transportation & Warehousing (100.0%), whereas the industries that tend to have a higher number of women are Real Estate, Rental & Leasing (100.0%), Administrative & Support (100.0%), and Educational Services (100.0%).
| Industry | Male | Female |
| Agriculture, Fishing & Hunting | 0 (0.0%) | 0 (0.0%) |
| Mining, Quarrying, & Extraction | 0 (0.0%) | 0 (0.0%) |
| Construction | 67 (100.0%) | 0 (0.0%) |
| Manufacturing | 16 (100.0%) | 0 (0.0%) |
| Wholesale Trade | 0 (0.0%) | 0 (0.0%) |
| Retail Trade | 7 (25.9%) | 20 (74.1%) |
| Transportation & Warehousing | 14 (100.0%) | 0 (0.0%) |
| Utilities | 11 (100.0%) | 0 (0.0%) |
| Information | 0 (0.0%) | 0 (0.0%) |
| Finance & Insurance | 0 (0.0%) | 0 (0.0%) |
| Real Estate, Rental & Leasing | 0 (0.0%) | 10 (100.0%) |
| Professional & Scientific | 13 (72.2%) | 5 (27.8%) |
| Enterprise Management | 0 (0.0%) | 0 (0.0%) |
| Administrative & Support | 0 (0.0%) | 28 (100.0%) |
| Educational Services | 0 (0.0%) | 13 (100.0%) |
| Health Care & Social Assistance | 4 (30.8%) | 9 (69.2%) |
| Arts, Entertainment & Recreation | 10 (50.0%) | 10 (50.0%) |
| Accommodation & Food Services | 0 (0.0%) | 0 (0.0%) |
| Public Administration | 58 (77.3%) | 17 (22.7%) |
| Total | 200 (63.1%) | 117 (36.9%) |
Education in Aquasco
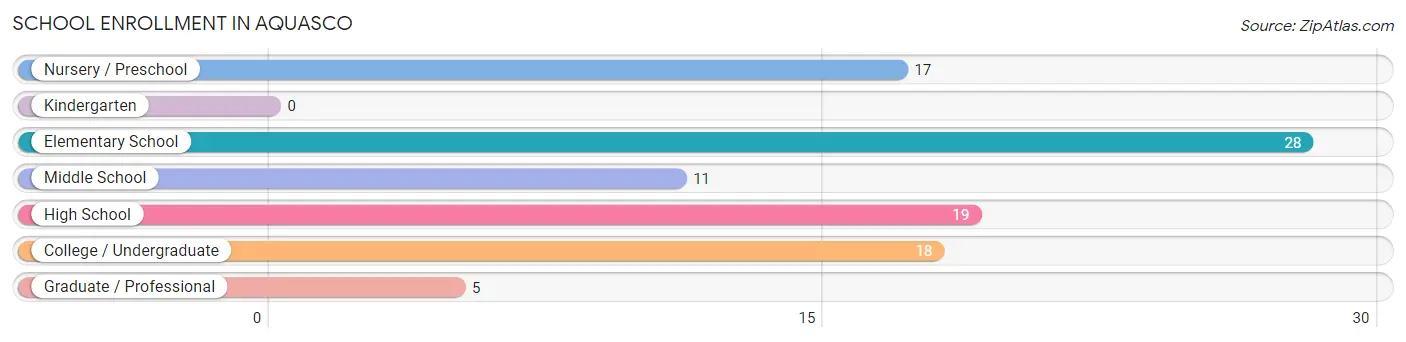
School Enrollment in Aquasco
The most common levels of schooling among the 98 students in Aquasco are elementary school (28 | 28.6%), high school (19 | 19.4%), and college / undergraduate (18 | 18.4%).
| School Level | # Students | % Students |
| Nursery / Preschool | 17 | 17.3% |
| Kindergarten | 0 | 0.0% |
| Elementary School | 28 | 28.6% |
| Middle School | 11 | 11.2% |
| High School | 19 | 19.4% |
| College / Undergraduate | 18 | 18.4% |
| Graduate / Professional | 5 | 5.1% |
| Total | 98 | 100.0% |
School Enrollment by Age by Funding Source in Aquasco
Out of a total of 98 students who are enrolled in schools in Aquasco, 38 (38.8%) attend a private institution, while the remaining 60 (61.2%) are enrolled in public schools. The age group of 18 to 19 year olds has the highest likelihood of being enrolled in private schools, with 7 (100.0% in the age bracket) enrolled. Conversely, the age group of 15 to 17 year olds has the lowest likelihood of being enrolled in a private school, with 11 (100.0% in the age bracket) attending a public institution.
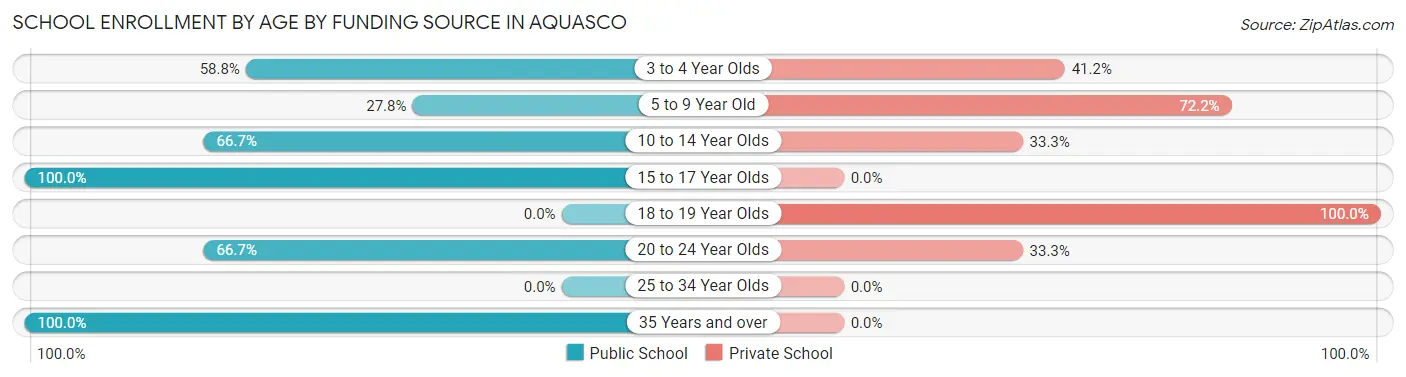
| Age Bracket | Public School | Private School |
| 3 to 4 Year Olds | 10 (58.8%) | 7 (41.2%) |
| 5 to 9 Year Old | 5 (27.8%) | 13 (72.2%) |
| 10 to 14 Year Olds | 14 (66.7%) | 7 (33.3%) |
| 15 to 17 Year Olds | 11 (100.0%) | 0 (0.0%) |
| 18 to 19 Year Olds | 0 (0.0%) | 7 (100.0%) |
| 20 to 24 Year Olds | 8 (66.7%) | 4 (33.3%) |
| 25 to 34 Year Olds | 0 (0.0%) | 0 (0.0%) |
| 35 Years and over | 12 (100.0%) | 0 (0.0%) |
| Total | 60 (61.2%) | 38 (38.8%) |
Educational Attainment by Field of Study in Aquasco
Bio, nature & agricultural (23 | 19.5%), liberal arts & history (19 | 16.1%), arts & humanities (17 | 14.4%), computers & mathematics (16 | 13.6%), and business (13 | 11.0%) are the most common fields of study among 118 individuals in Aquasco who have obtained a bachelor's degree or higher.
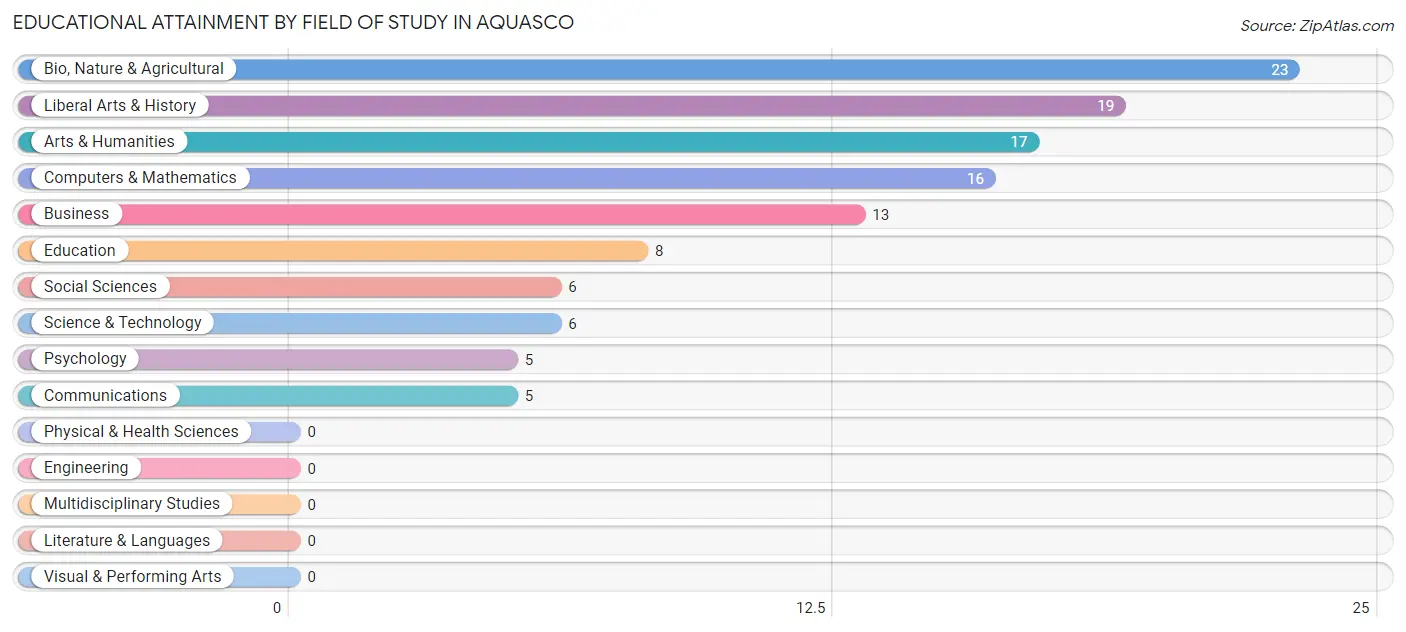
| Field of Study | # Graduates | % Graduates |
| Computers & Mathematics | 16 | 13.6% |
| Bio, Nature & Agricultural | 23 | 19.5% |
| Physical & Health Sciences | 0 | 0.0% |
| Psychology | 5 | 4.2% |
| Social Sciences | 6 | 5.1% |
| Engineering | 0 | 0.0% |
| Multidisciplinary Studies | 0 | 0.0% |
| Science & Technology | 6 | 5.1% |
| Business | 13 | 11.0% |
| Education | 8 | 6.8% |
| Literature & Languages | 0 | 0.0% |
| Liberal Arts & History | 19 | 16.1% |
| Visual & Performing Arts | 0 | 0.0% |
| Communications | 5 | 4.2% |
| Arts & Humanities | 17 | 14.4% |
| Total | 118 | 100.0% |
Transportation & Commute in Aquasco
Vehicle Availability by Sex in Aquasco
The most prevalent vehicle ownership categories in Aquasco are males with 2 vehicles (68, accounting for 34.0%) and females with 2 vehicles (41, making up 59.7%).
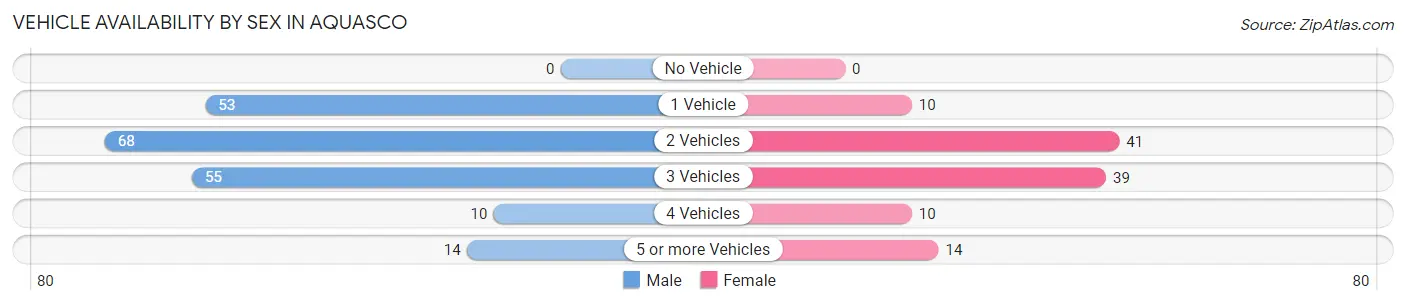
| Vehicles Available | Male | Female |
| No Vehicle | 0 (0.0%) | 0 (0.0%) |
| 1 Vehicle | 53 (26.5%) | 10 (8.8%) |
| 2 Vehicles | 68 (34.0%) | 41 (36.0%) |
| 3 Vehicles | 55 (27.5%) | 39 (34.2%) |
| 4 Vehicles | 10 (5.0%) | 10 (8.8%) |
| 5 or more Vehicles | 14 (7.0%) | 14 (12.3%) |
| Total | 200 (100.0%) | 114 (100.0%) |
Commute Time in Aquasco
The most frequently occuring commute durations in Aquasco are 45 to 59 minutes (64 commuters, 25.8%), 30 to 34 minutes (47 commuters, 19.0%), and 60 to 89 minutes (32 commuters, 12.9%).
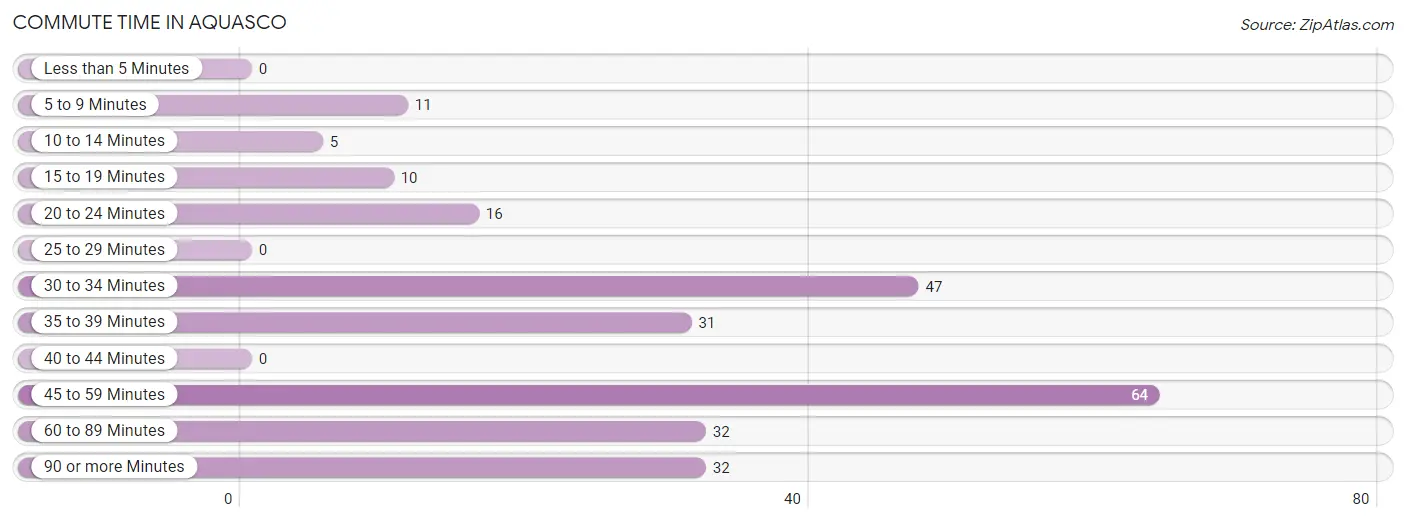
| Commute Time | # Commuters | % Commuters |
| Less than 5 Minutes | 0 | 0.0% |
| 5 to 9 Minutes | 11 | 4.4% |
| 10 to 14 Minutes | 5 | 2.0% |
| 15 to 19 Minutes | 10 | 4.0% |
| 20 to 24 Minutes | 16 | 6.5% |
| 25 to 29 Minutes | 0 | 0.0% |
| 30 to 34 Minutes | 47 | 19.0% |
| 35 to 39 Minutes | 31 | 12.5% |
| 40 to 44 Minutes | 0 | 0.0% |
| 45 to 59 Minutes | 64 | 25.8% |
| 60 to 89 Minutes | 32 | 12.9% |
| 90 or more Minutes | 32 | 12.9% |
Commute Time by Sex in Aquasco
The most common commute times in Aquasco are 45 to 59 minutes (64 commuters, 35.6%) for males and 35 to 39 minutes (23 commuters, 33.8%) for females.
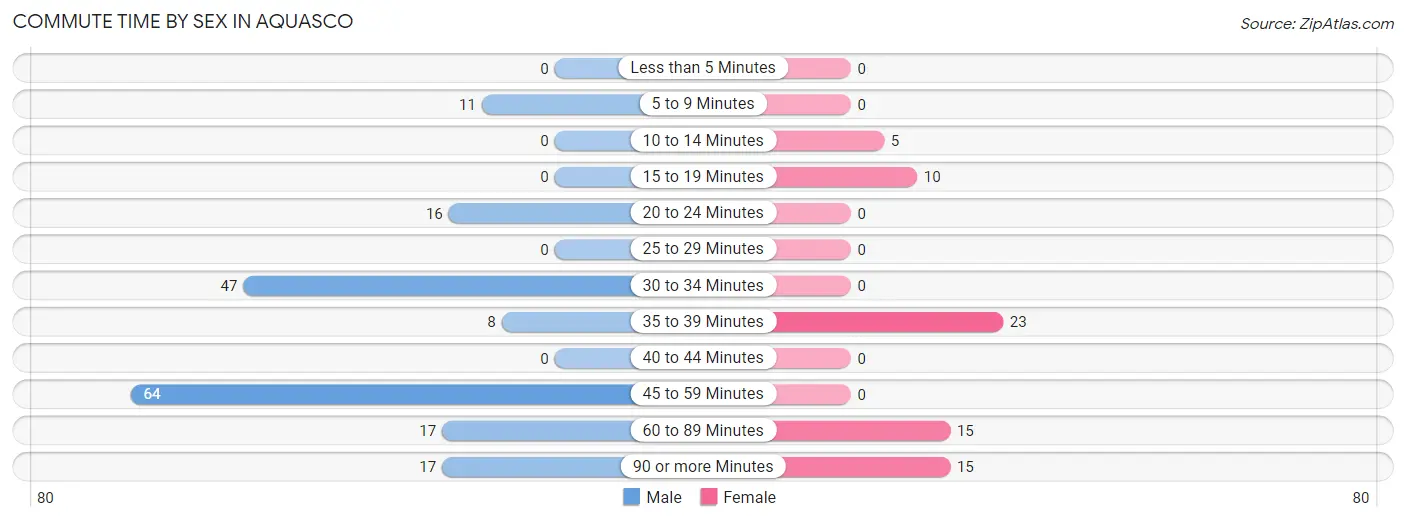
| Commute Time | Male | Female |
| Less than 5 Minutes | 0 (0.0%) | 0 (0.0%) |
| 5 to 9 Minutes | 11 (6.1%) | 0 (0.0%) |
| 10 to 14 Minutes | 0 (0.0%) | 5 (7.3%) |
| 15 to 19 Minutes | 0 (0.0%) | 10 (14.7%) |
| 20 to 24 Minutes | 16 (8.9%) | 0 (0.0%) |
| 25 to 29 Minutes | 0 (0.0%) | 0 (0.0%) |
| 30 to 34 Minutes | 47 (26.1%) | 0 (0.0%) |
| 35 to 39 Minutes | 8 (4.4%) | 23 (33.8%) |
| 40 to 44 Minutes | 0 (0.0%) | 0 (0.0%) |
| 45 to 59 Minutes | 64 (35.6%) | 0 (0.0%) |
| 60 to 89 Minutes | 17 (9.4%) | 15 (22.1%) |
| 90 or more Minutes | 17 (9.4%) | 15 (22.1%) |
Time of Departure to Work by Sex in Aquasco
The most frequent times of departure to work in Aquasco are 12:00 AM to 4:59 AM (58, 32.2%) for males and 7:00 AM to 7:29 AM (23, 33.8%) for females.
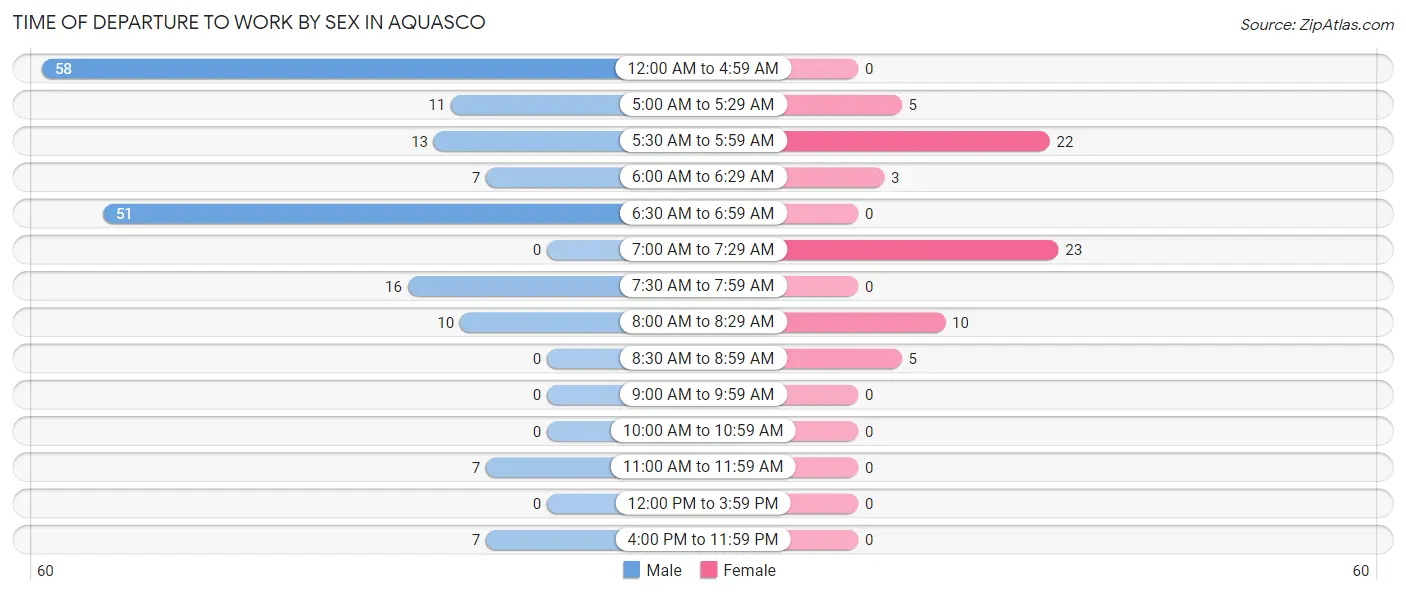
| Time of Departure | Male | Female |
| 12:00 AM to 4:59 AM | 58 (32.2%) | 0 (0.0%) |
| 5:00 AM to 5:29 AM | 11 (6.1%) | 5 (7.3%) |
| 5:30 AM to 5:59 AM | 13 (7.2%) | 22 (32.4%) |
| 6:00 AM to 6:29 AM | 7 (3.9%) | 3 (4.4%) |
| 6:30 AM to 6:59 AM | 51 (28.3%) | 0 (0.0%) |
| 7:00 AM to 7:29 AM | 0 (0.0%) | 23 (33.8%) |
| 7:30 AM to 7:59 AM | 16 (8.9%) | 0 (0.0%) |
| 8:00 AM to 8:29 AM | 10 (5.6%) | 10 (14.7%) |
| 8:30 AM to 8:59 AM | 0 (0.0%) | 5 (7.3%) |
| 9:00 AM to 9:59 AM | 0 (0.0%) | 0 (0.0%) |
| 10:00 AM to 10:59 AM | 0 (0.0%) | 0 (0.0%) |
| 11:00 AM to 11:59 AM | 7 (3.9%) | 0 (0.0%) |
| 12:00 PM to 3:59 PM | 0 (0.0%) | 0 (0.0%) |
| 4:00 PM to 11:59 PM | 7 (3.9%) | 0 (0.0%) |
| Total | 180 (100.0%) | 68 (100.0%) |
Housing Occupancy in Aquasco
Occupancy by Ownership in Aquasco
Of the total 293 dwellings in Aquasco, owner-occupied units account for 212 (72.4%), while renter-occupied units make up 81 (27.7%).
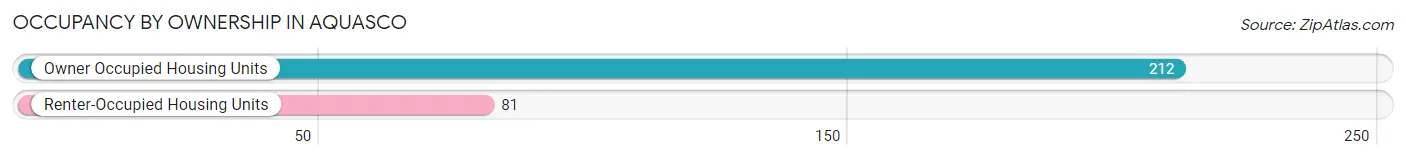
| Occupancy | # Housing Units | % Housing Units |
| Owner Occupied Housing Units | 212 | 72.4% |
| Renter-Occupied Housing Units | 81 | 27.7% |
| Total Occupied Housing Units | 293 | 100.0% |
Occupancy by Household Size in Aquasco
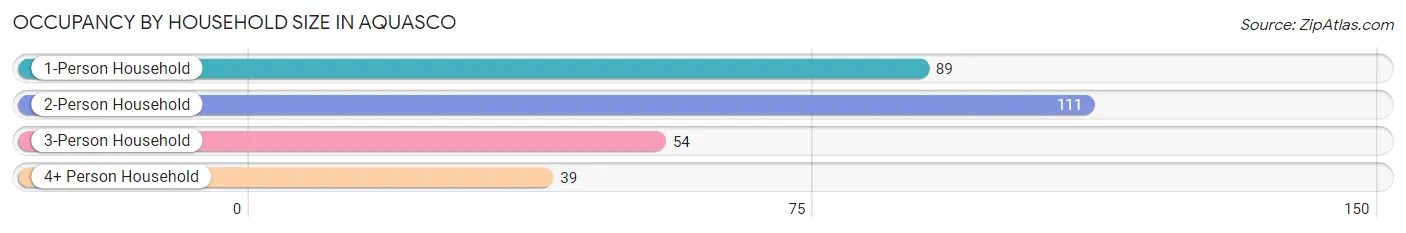
| Household Size | # Housing Units | % Housing Units |
| 1-Person Household | 89 | 30.4% |
| 2-Person Household | 111 | 37.9% |
| 3-Person Household | 54 | 18.4% |
| 4+ Person Household | 39 | 13.3% |
| Total Housing Units | 293 | 100.0% |
Occupancy by Ownership by Household Size in Aquasco
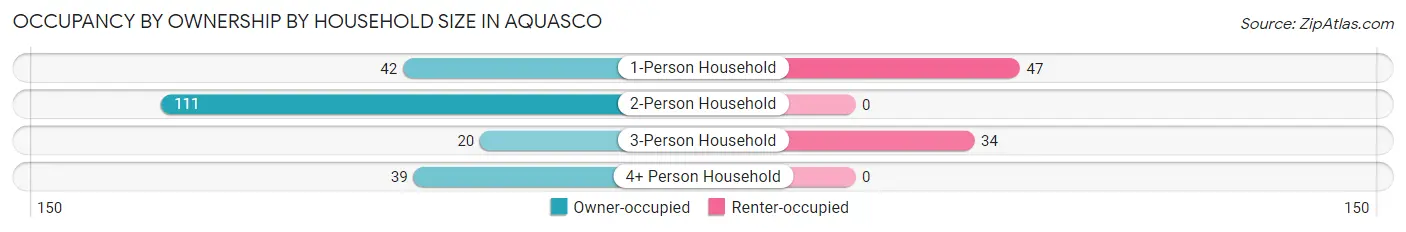
| Household Size | Owner-occupied | Renter-occupied |
| 1-Person Household | 42 (47.2%) | 47 (52.8%) |
| 2-Person Household | 111 (100.0%) | 0 (0.0%) |
| 3-Person Household | 20 (37.0%) | 34 (63.0%) |
| 4+ Person Household | 39 (100.0%) | 0 (0.0%) |
| Total Housing Units | 212 (72.4%) | 81 (27.7%) |
Occupancy by Educational Attainment in Aquasco
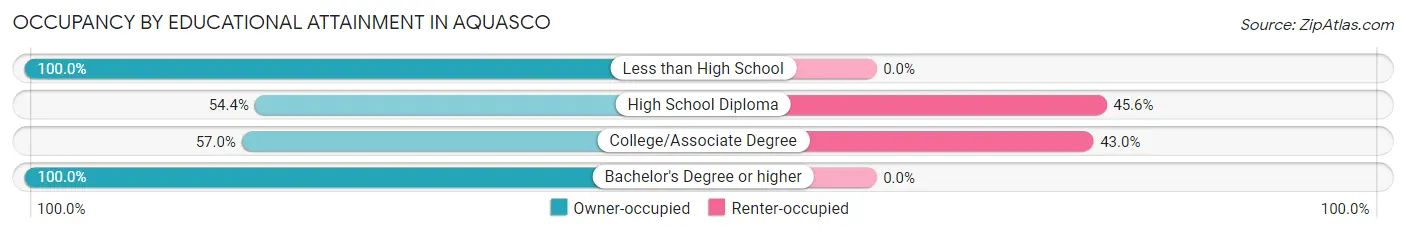
| Household Size | Owner-occupied | Renter-occupied |
| Less than High School | 17 (100.0%) | 0 (0.0%) |
| High School Diploma | 56 (54.4%) | 47 (45.6%) |
| College/Associate Degree | 45 (57.0%) | 34 (43.0%) |
| Bachelor's Degree or higher | 94 (100.0%) | 0 (0.0%) |
Occupancy by Age of Householder in Aquasco
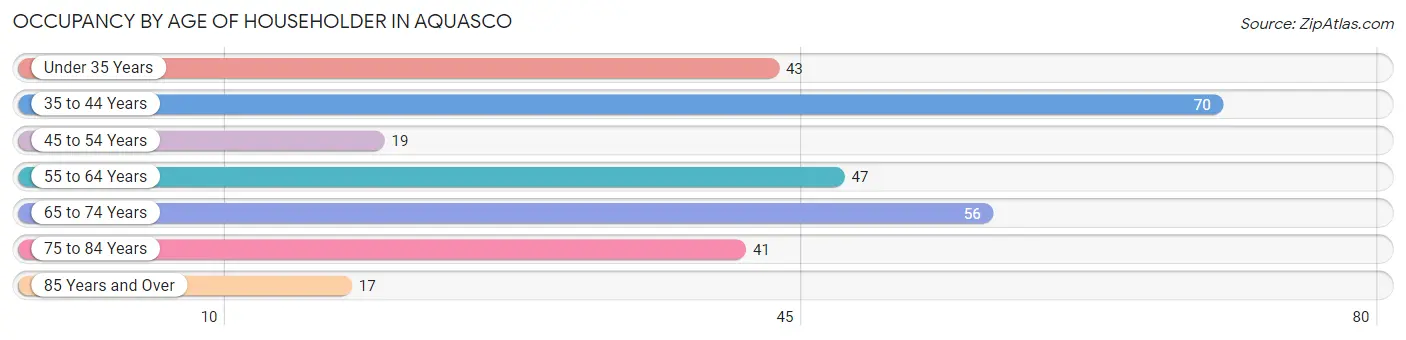
| Age Bracket | # Households | % Households |
| Under 35 Years | 43 | 14.7% |
| 35 to 44 Years | 70 | 23.9% |
| 45 to 54 Years | 19 | 6.5% |
| 55 to 64 Years | 47 | 16.0% |
| 65 to 74 Years | 56 | 19.1% |
| 75 to 84 Years | 41 | 14.0% |
| 85 Years and Over | 17 | 5.8% |
| Total | 293 | 100.0% |
Housing Finances in Aquasco
Median Income by Occupancy in Aquasco
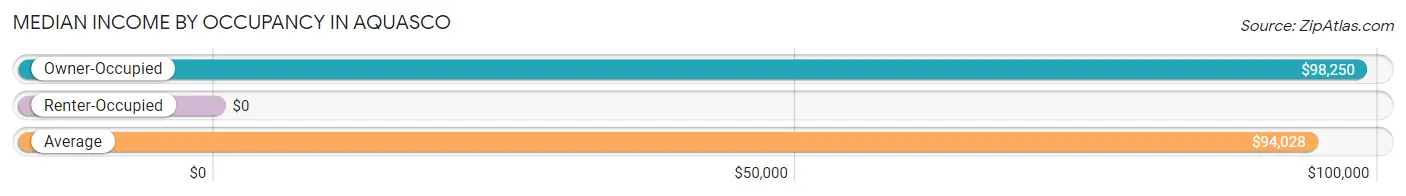
| Occupancy Type | # Households | Median Income |
| Owner-Occupied | 212 (72.4%) | $98,250 |
| Renter-Occupied | 81 (27.7%) | $0 |
| Average | 293 (100.0%) | $94,028 |
Occupancy by Householder Income Bracket in Aquasco
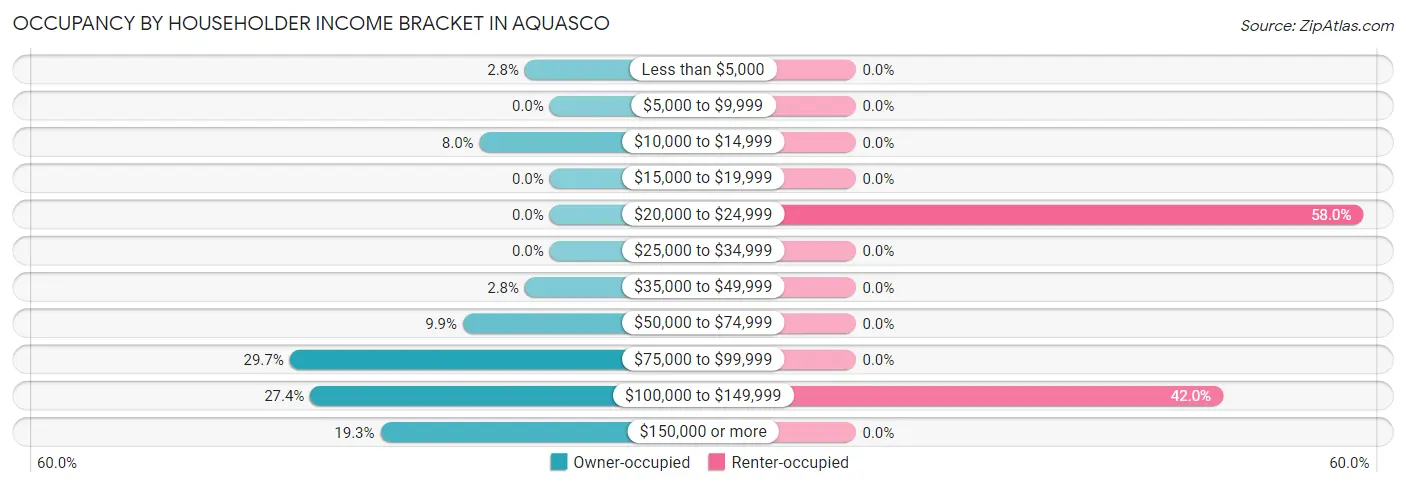
| Income Bracket | Owner-occupied | Renter-occupied |
| Less than $5,000 | 6 (2.8%) | 0 (0.0%) |
| $5,000 to $9,999 | 0 (0.0%) | 0 (0.0%) |
| $10,000 to $14,999 | 17 (8.0%) | 0 (0.0%) |
| $15,000 to $19,999 | 0 (0.0%) | 0 (0.0%) |
| $20,000 to $24,999 | 0 (0.0%) | 47 (58.0%) |
| $25,000 to $34,999 | 0 (0.0%) | 0 (0.0%) |
| $35,000 to $49,999 | 6 (2.8%) | 0 (0.0%) |
| $50,000 to $74,999 | 21 (9.9%) | 0 (0.0%) |
| $75,000 to $99,999 | 63 (29.7%) | 0 (0.0%) |
| $100,000 to $149,999 | 58 (27.4%) | 34 (42.0%) |
| $150,000 or more | 41 (19.3%) | 0 (0.0%) |
| Total | 212 (100.0%) | 81 (100.0%) |
Monthly Housing Cost Tiers in Aquasco
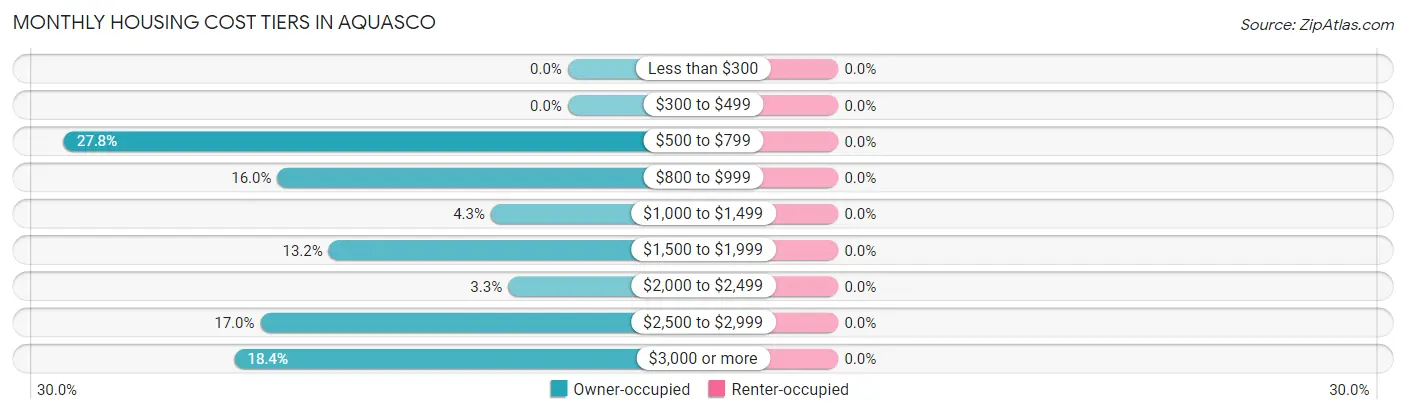
| Monthly Cost | Owner-occupied | Renter-occupied |
| Less than $300 | 0 (0.0%) | 0 (0.0%) |
| $300 to $499 | 0 (0.0%) | 0 (0.0%) |
| $500 to $799 | 59 (27.8%) | 0 (0.0%) |
| $800 to $999 | 34 (16.0%) | 0 (0.0%) |
| $1,000 to $1,499 | 9 (4.3%) | 0 (0.0%) |
| $1,500 to $1,999 | 28 (13.2%) | 0 (0.0%) |
| $2,000 to $2,499 | 7 (3.3%) | 0 (0.0%) |
| $2,500 to $2,999 | 36 (17.0%) | 0 (0.0%) |
| $3,000 or more | 39 (18.4%) | 0 (0.0%) |
| Total | 212 (100.0%) | 81 (100.0%) |
Physical Housing Characteristics in Aquasco
Housing Structures in Aquasco
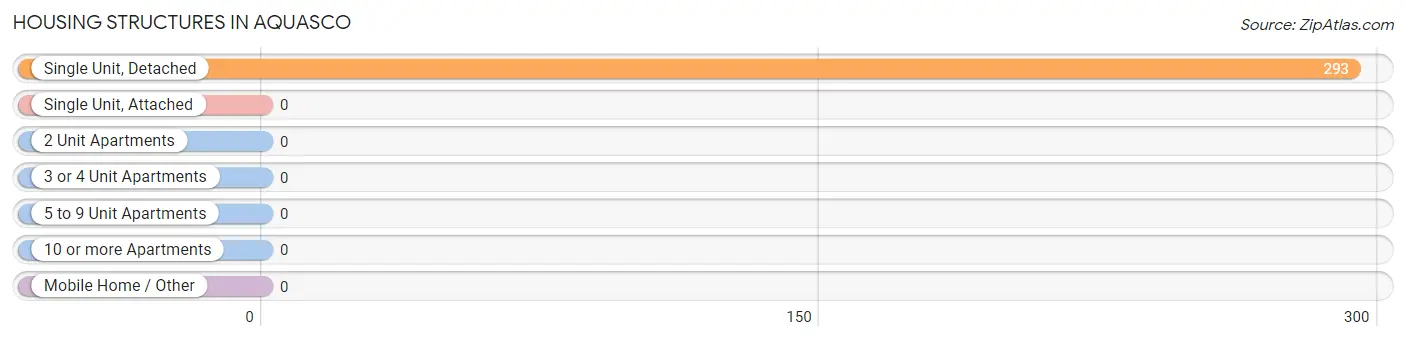
| Structure Type | # Housing Units | % Housing Units |
| Single Unit, Detached | 293 | 100.0% |
| Single Unit, Attached | 0 | 0.0% |
| 2 Unit Apartments | 0 | 0.0% |
| 3 or 4 Unit Apartments | 0 | 0.0% |
| 5 to 9 Unit Apartments | 0 | 0.0% |
| 10 or more Apartments | 0 | 0.0% |
| Mobile Home / Other | 0 | 0.0% |
| Total | 293 | 100.0% |
Housing Structures by Occupancy in Aquasco
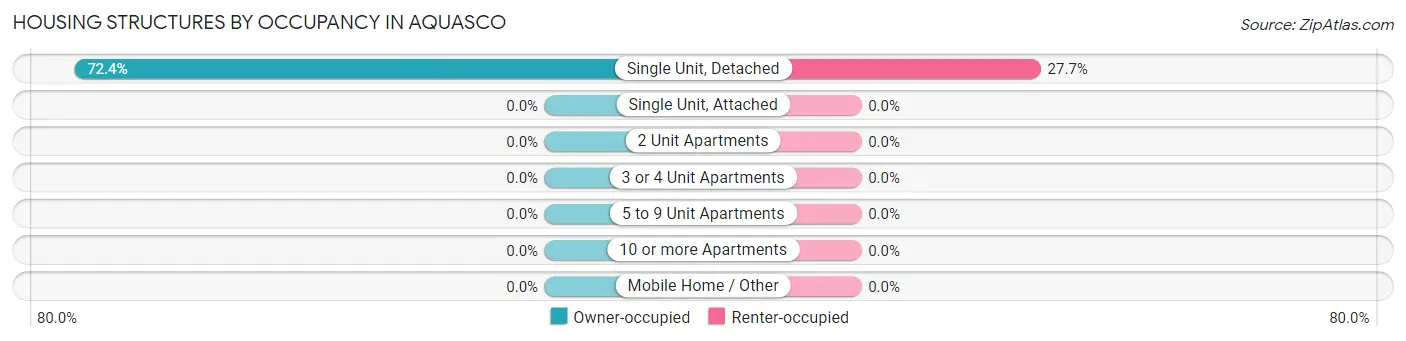
| Structure Type | Owner-occupied | Renter-occupied |
| Single Unit, Detached | 212 (72.4%) | 81 (27.7%) |
| Single Unit, Attached | 0 (0.0%) | 0 (0.0%) |
| 2 Unit Apartments | 0 (0.0%) | 0 (0.0%) |
| 3 or 4 Unit Apartments | 0 (0.0%) | 0 (0.0%) |
| 5 to 9 Unit Apartments | 0 (0.0%) | 0 (0.0%) |
| 10 or more Apartments | 0 (0.0%) | 0 (0.0%) |
| Mobile Home / Other | 0 (0.0%) | 0 (0.0%) |
| Total | 212 (72.4%) | 81 (27.7%) |
Housing Structures by Number of Rooms in Aquasco
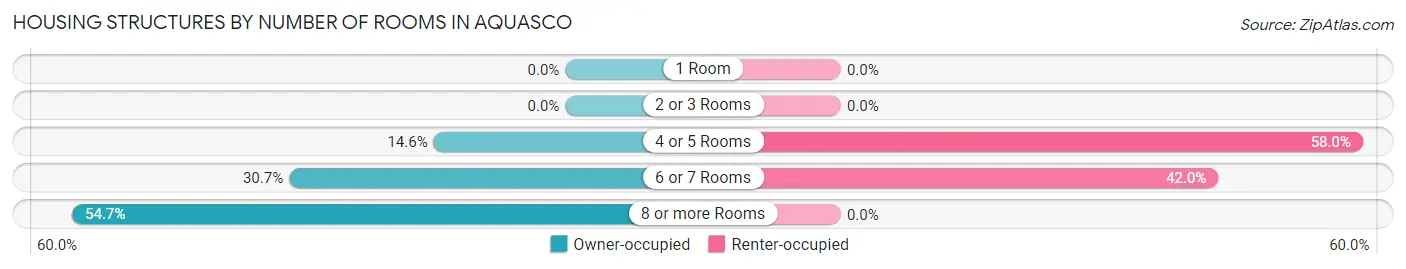
| Number of Rooms | Owner-occupied | Renter-occupied |
| 1 Room | 0 (0.0%) | 0 (0.0%) |
| 2 or 3 Rooms | 0 (0.0%) | 0 (0.0%) |
| 4 or 5 Rooms | 31 (14.6%) | 47 (58.0%) |
| 6 or 7 Rooms | 65 (30.7%) | 34 (42.0%) |
| 8 or more Rooms | 116 (54.7%) | 0 (0.0%) |
| Total | 212 (100.0%) | 81 (100.0%) |
Housing Structure by Heating Type in Aquasco
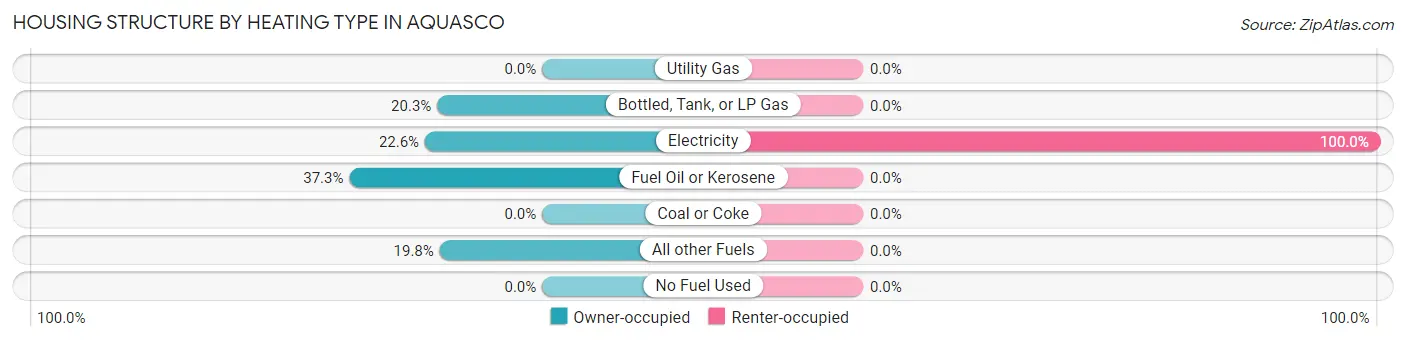
| Heating Type | Owner-occupied | Renter-occupied |
| Utility Gas | 0 (0.0%) | 0 (0.0%) |
| Bottled, Tank, or LP Gas | 43 (20.3%) | 0 (0.0%) |
| Electricity | 48 (22.6%) | 81 (100.0%) |
| Fuel Oil or Kerosene | 79 (37.3%) | 0 (0.0%) |
| Coal or Coke | 0 (0.0%) | 0 (0.0%) |
| All other Fuels | 42 (19.8%) | 0 (0.0%) |
| No Fuel Used | 0 (0.0%) | 0 (0.0%) |
| Total | 212 (100.0%) | 81 (100.0%) |
Household Vehicle Usage in Aquasco
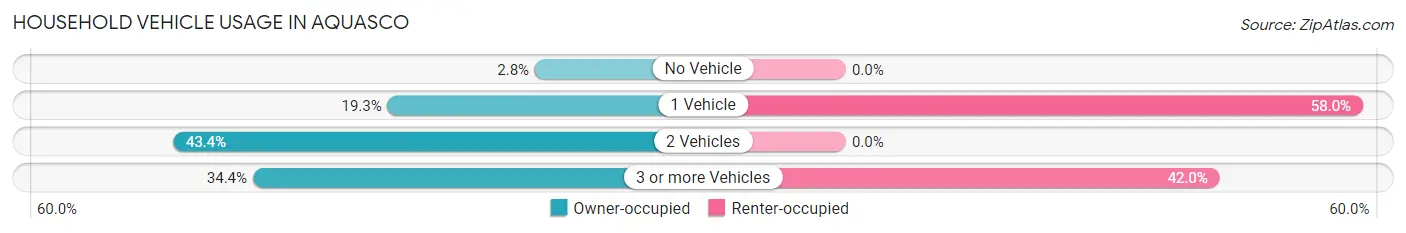
| Vehicles per Household | Owner-occupied | Renter-occupied |
| No Vehicle | 6 (2.8%) | 0 (0.0%) |
| 1 Vehicle | 41 (19.3%) | 47 (58.0%) |
| 2 Vehicles | 92 (43.4%) | 0 (0.0%) |
| 3 or more Vehicles | 73 (34.4%) | 34 (42.0%) |
| Total | 212 (100.0%) | 81 (100.0%) |
Real Estate & Mortgages in Aquasco
Real Estate and Mortgage Overview in Aquasco
| Characteristic | Without Mortgage | With Mortgage |
| Housing Units | 94 | 118 |
| Median Property Value | $545,500 | $550,000 |
| Median Household Income | $99,000 | $34 |
| Monthly Housing Costs | $763 | $39 |
| Real Estate Taxes | $5,000 | $0 |
Property Value by Mortgage Status in Aquasco
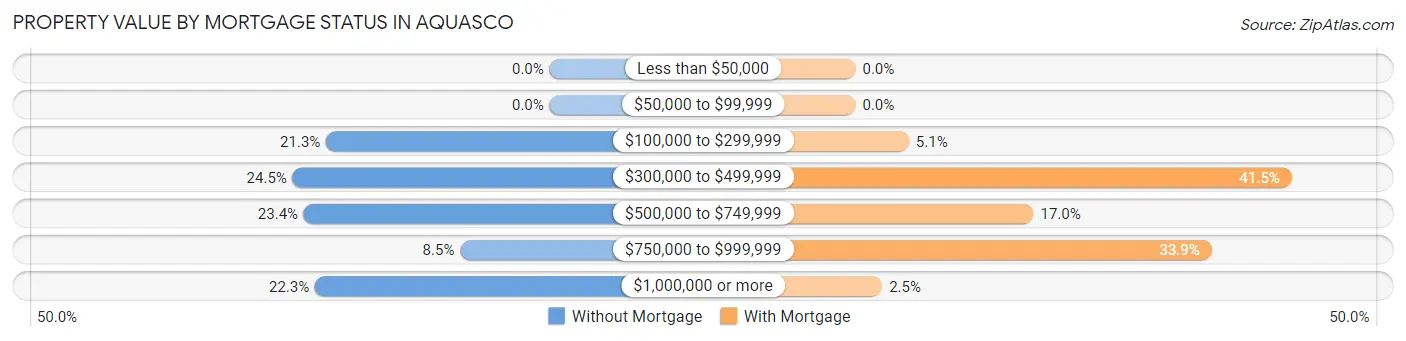
| Property Value | Without Mortgage | With Mortgage |
| Less than $50,000 | 0 (0.0%) | 0 (0.0%) |
| $50,000 to $99,999 | 0 (0.0%) | 0 (0.0%) |
| $100,000 to $299,999 | 20 (21.3%) | 6 (5.1%) |
| $300,000 to $499,999 | 23 (24.5%) | 49 (41.5%) |
| $500,000 to $749,999 | 22 (23.4%) | 20 (17.0%) |
| $750,000 to $999,999 | 8 (8.5%) | 40 (33.9%) |
| $1,000,000 or more | 21 (22.3%) | 3 (2.5%) |
| Total | 94 (100.0%) | 118 (100.0%) |
Household Income by Mortgage Status in Aquasco
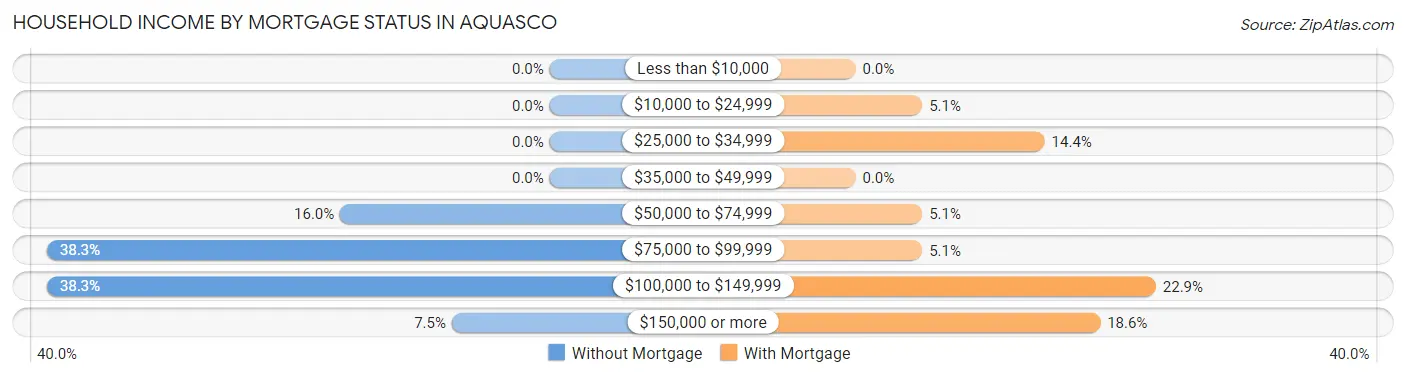
| Household Income | Without Mortgage | With Mortgage |
| Less than $10,000 | 0 (0.0%) | 0 (0.0%) |
| $10,000 to $24,999 | 0 (0.0%) | 6 (5.1%) |
| $25,000 to $34,999 | 0 (0.0%) | 17 (14.4%) |
| $35,000 to $49,999 | 0 (0.0%) | 0 (0.0%) |
| $50,000 to $74,999 | 15 (16.0%) | 6 (5.1%) |
| $75,000 to $99,999 | 36 (38.3%) | 6 (5.1%) |
| $100,000 to $149,999 | 36 (38.3%) | 27 (22.9%) |
| $150,000 or more | 7 (7.4%) | 22 (18.6%) |
| Total | 94 (100.0%) | 118 (100.0%) |
Property Value to Household Income Ratio in Aquasco
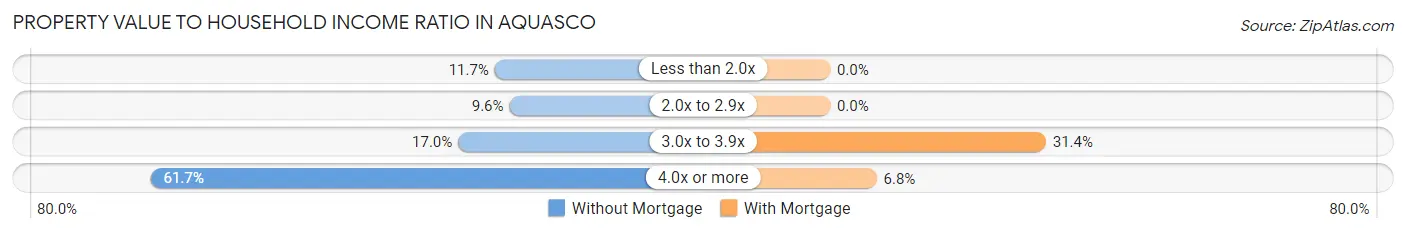
| Value-to-Income Ratio | Without Mortgage | With Mortgage |
| Less than 2.0x | 11 (11.7%) | 0 (0.0%) |
| 2.0x to 2.9x | 9 (9.6%) | 0 (0.0%) |
| 3.0x to 3.9x | 16 (17.0%) | 37 (31.4%) |
| 4.0x or more | 58 (61.7%) | 8 (6.8%) |
| Total | 94 (100.0%) | 118 (100.0%) |
Real Estate Taxes by Mortgage Status in Aquasco
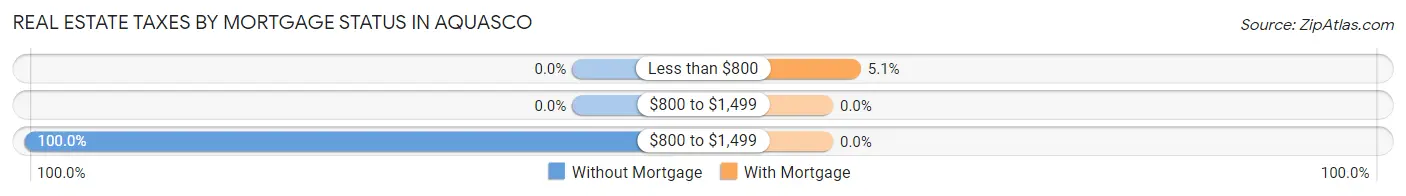
| Property Taxes | Without Mortgage | With Mortgage |
| Less than $800 | 0 (0.0%) | 6 (5.1%) |
| $800 to $1,499 | 0 (0.0%) | 0 (0.0%) |
| $800 to $1,499 | 94 (100.0%) | 0 (0.0%) |
| Total | 94 (100.0%) | 118 (100.0%) |
Health & Disability in Aquasco
Health Insurance Coverage by Age in Aquasco
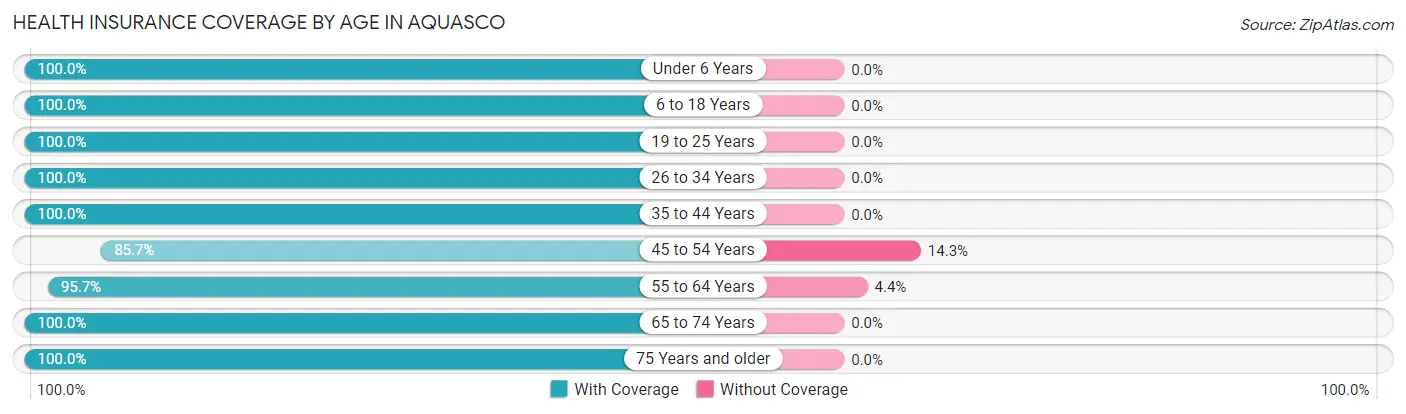
| Age Bracket | With Coverage | Without Coverage |
| Under 6 Years | 84 (100.0%) | 0 (0.0%) |
| 6 to 18 Years | 69 (100.0%) | 0 (0.0%) |
| 19 to 25 Years | 20 (100.0%) | 0 (0.0%) |
| 26 to 34 Years | 76 (100.0%) | 0 (0.0%) |
| 35 to 44 Years | 95 (100.0%) | 0 (0.0%) |
| 45 to 54 Years | 42 (85.7%) | 7 (14.3%) |
| 55 to 64 Years | 110 (95.7%) | 5 (4.3%) |
| 65 to 74 Years | 91 (100.0%) | 0 (0.0%) |
| 75 Years and older | 102 (100.0%) | 0 (0.0%) |
| Total | 689 (98.3%) | 12 (1.7%) |
Health Insurance Coverage by Citizenship Status in Aquasco
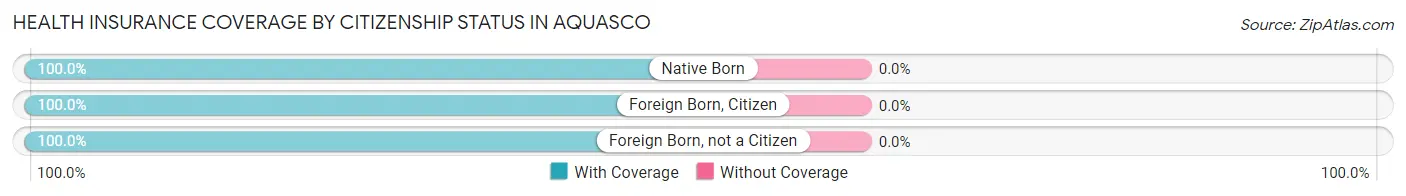
| Citizenship Status | With Coverage | Without Coverage |
| Native Born | 84 (100.0%) | 0 (0.0%) |
| Foreign Born, Citizen | 69 (100.0%) | 0 (0.0%) |
| Foreign Born, not a Citizen | 20 (100.0%) | 0 (0.0%) |
Health Insurance Coverage by Household Income in Aquasco
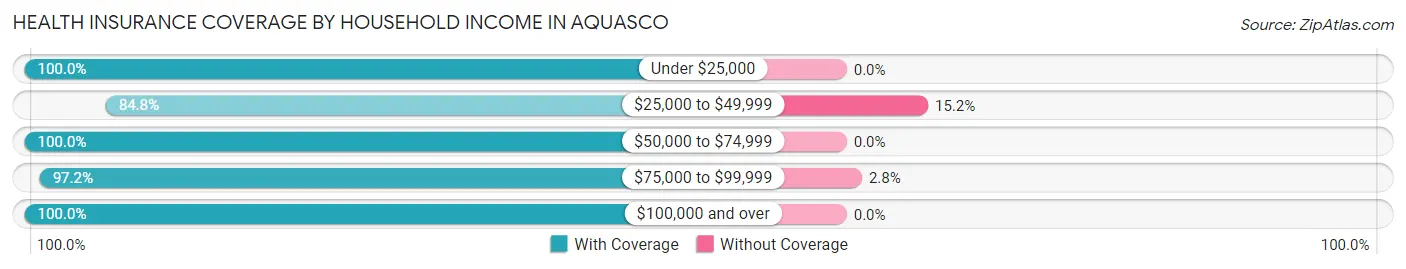
| Household Income | With Coverage | Without Coverage |
| Under $25,000 | 87 (100.0%) | 0 (0.0%) |
| $25,000 to $49,999 | 39 (84.8%) | 7 (15.2%) |
| $50,000 to $74,999 | 27 (100.0%) | 0 (0.0%) |
| $75,000 to $99,999 | 171 (97.2%) | 5 (2.8%) |
| $100,000 and over | 365 (100.0%) | 0 (0.0%) |
Public vs Private Health Insurance Coverage by Age in Aquasco
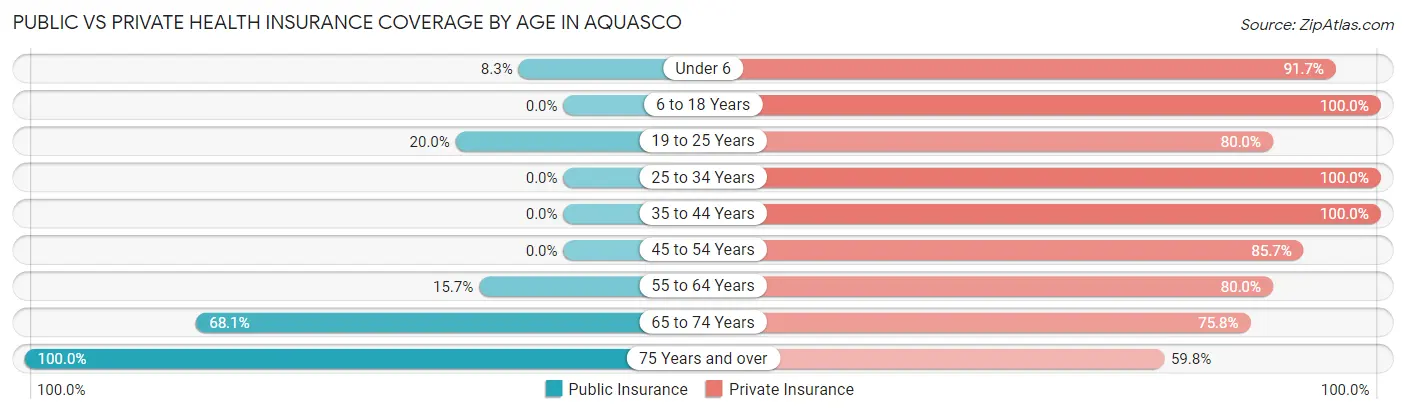
| Age Bracket | Public Insurance | Private Insurance |
| Under 6 | 7 (8.3%) | 77 (91.7%) |
| 6 to 18 Years | 0 (0.0%) | 69 (100.0%) |
| 19 to 25 Years | 4 (20.0%) | 16 (80.0%) |
| 25 to 34 Years | 0 (0.0%) | 76 (100.0%) |
| 35 to 44 Years | 0 (0.0%) | 95 (100.0%) |
| 45 to 54 Years | 0 (0.0%) | 42 (85.7%) |
| 55 to 64 Years | 18 (15.7%) | 92 (80.0%) |
| 65 to 74 Years | 62 (68.1%) | 69 (75.8%) |
| 75 Years and over | 102 (100.0%) | 61 (59.8%) |
| Total | 193 (27.5%) | 597 (85.2%) |
Disability Status by Sex by Age in Aquasco
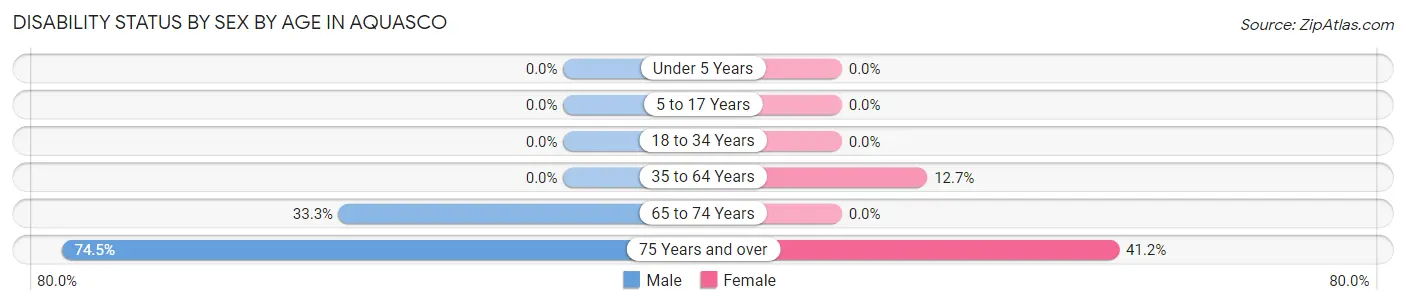
| Age Bracket | Male | Female |
| Under 5 Years | 0 (0.0%) | 0 (0.0%) |
| 5 to 17 Years | 0 (0.0%) | 0 (0.0%) |
| 18 to 34 Years | 0 (0.0%) | 0 (0.0%) |
| 35 to 64 Years | 0 (0.0%) | 18 (12.7%) |
| 65 to 74 Years | 16 (33.3%) | 0 (0.0%) |
| 75 Years and over | 38 (74.5%) | 21 (41.2%) |
Disability Class by Sex by Age in Aquasco
Disability Class: Hearing Difficulty
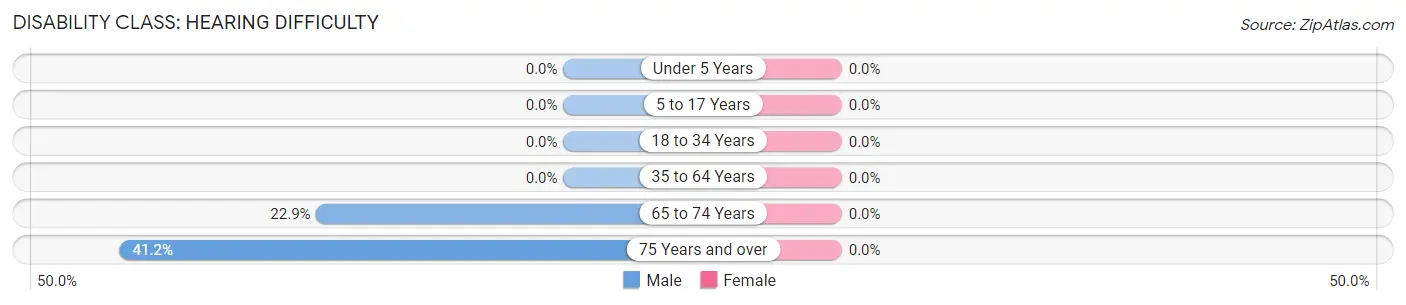
| Age Bracket | Male | Female |
| Under 5 Years | 0 (0.0%) | 0 (0.0%) |
| 5 to 17 Years | 0 (0.0%) | 0 (0.0%) |
| 18 to 34 Years | 0 (0.0%) | 0 (0.0%) |
| 35 to 64 Years | 0 (0.0%) | 0 (0.0%) |
| 65 to 74 Years | 11 (22.9%) | 0 (0.0%) |
| 75 Years and over | 21 (41.2%) | 0 (0.0%) |
Disability Class: Vision Difficulty
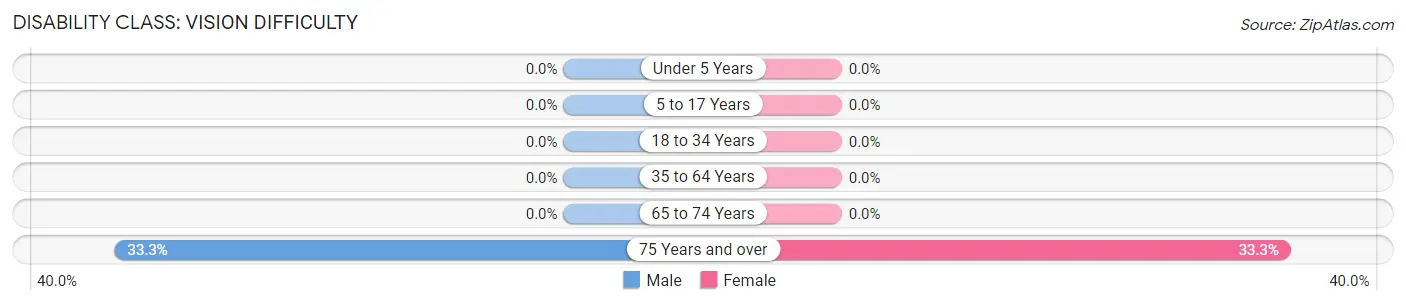
| Age Bracket | Male | Female |
| Under 5 Years | 0 (0.0%) | 0 (0.0%) |
| 5 to 17 Years | 0 (0.0%) | 0 (0.0%) |
| 18 to 34 Years | 0 (0.0%) | 0 (0.0%) |
| 35 to 64 Years | 0 (0.0%) | 0 (0.0%) |
| 65 to 74 Years | 0 (0.0%) | 0 (0.0%) |
| 75 Years and over | 17 (33.3%) | 17 (33.3%) |
Disability Class: Cognitive Difficulty
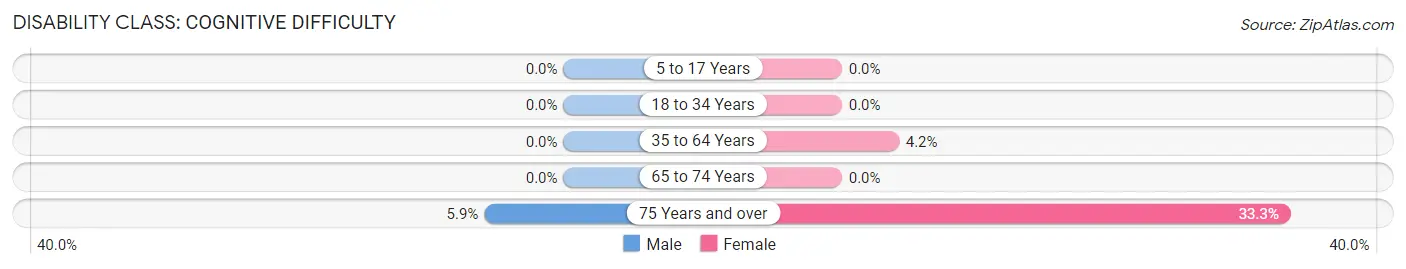
| Age Bracket | Male | Female |
| 5 to 17 Years | 0 (0.0%) | 0 (0.0%) |
| 18 to 34 Years | 0 (0.0%) | 0 (0.0%) |
| 35 to 64 Years | 0 (0.0%) | 6 (4.2%) |
| 65 to 74 Years | 0 (0.0%) | 0 (0.0%) |
| 75 Years and over | 3 (5.9%) | 17 (33.3%) |
Disability Class: Ambulatory Difficulty
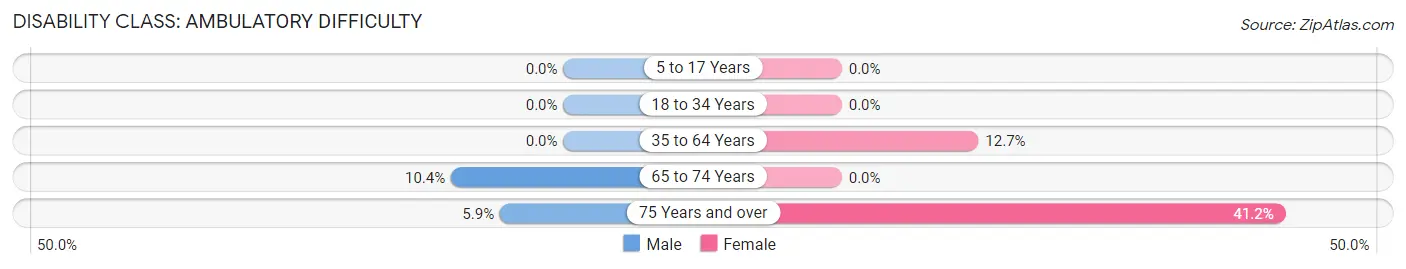
| Age Bracket | Male | Female |
| 5 to 17 Years | 0 (0.0%) | 0 (0.0%) |
| 18 to 34 Years | 0 (0.0%) | 0 (0.0%) |
| 35 to 64 Years | 0 (0.0%) | 18 (12.7%) |
| 65 to 74 Years | 5 (10.4%) | 0 (0.0%) |
| 75 Years and over | 3 (5.9%) | 21 (41.2%) |
Disability Class: Self-Care Difficulty
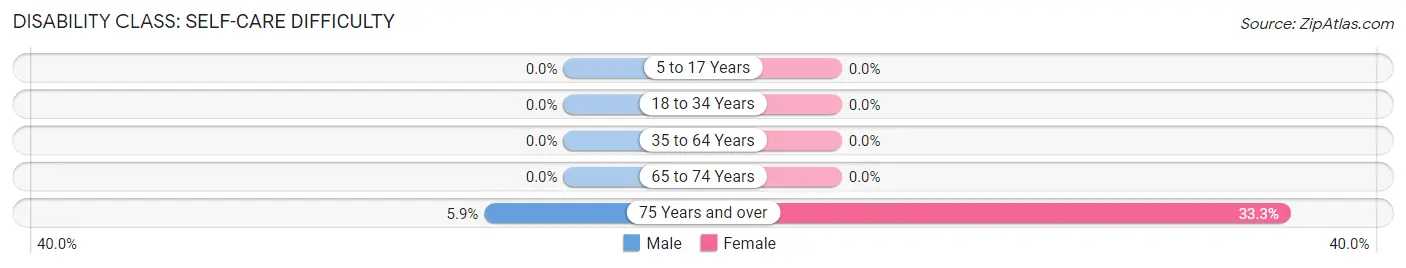
| Age Bracket | Male | Female |
| 5 to 17 Years | 0 (0.0%) | 0 (0.0%) |
| 18 to 34 Years | 0 (0.0%) | 0 (0.0%) |
| 35 to 64 Years | 0 (0.0%) | 0 (0.0%) |
| 65 to 74 Years | 0 (0.0%) | 0 (0.0%) |
| 75 Years and over | 3 (5.9%) | 17 (33.3%) |
Technology Access in Aquasco
Computing Device Access in Aquasco
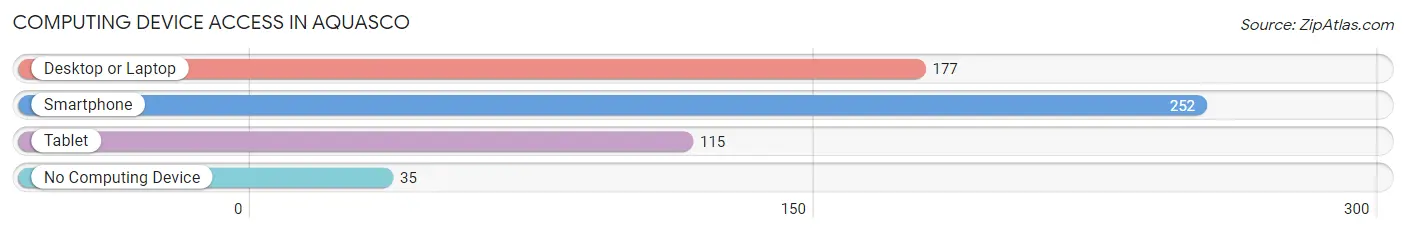
| Device Type | # Households | % Households |
| Desktop or Laptop | 177 | 60.4% |
| Smartphone | 252 | 86.0% |
| Tablet | 115 | 39.3% |
| No Computing Device | 35 | 11.9% |
| Total | 293 | 100.0% |
Internet Access in Aquasco
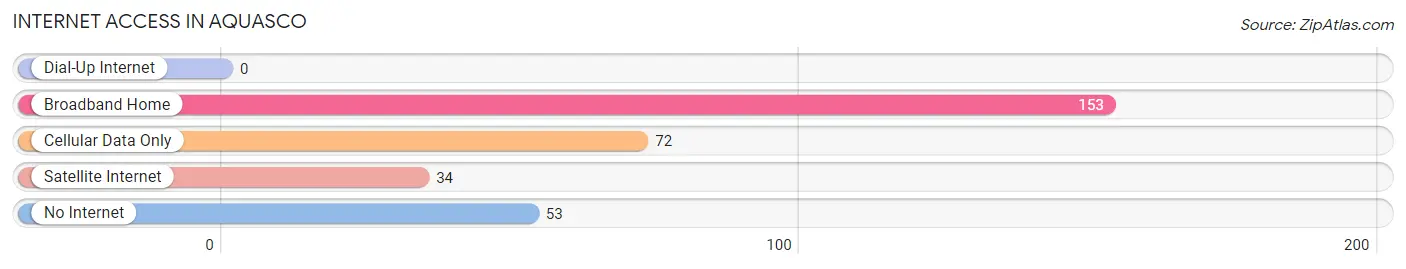
| Internet Type | # Households | % Households |
| Dial-Up Internet | 0 | 0.0% |
| Broadband Home | 153 | 52.2% |
| Cellular Data Only | 72 | 24.6% |
| Satellite Internet | 34 | 11.6% |
| No Internet | 53 | 18.1% |
| Total | 293 | 100.0% |
Aquasco Summary
Aquasco is an unincorporated community located in Prince George’s County, Maryland. It is situated along the Patuxent River, approximately 25 miles southeast of Washington, D.C. The community is home to a diverse population of approximately 1,000 people, and is known for its rural charm and close-knit community.
History
Aquasco was first settled in the early 1700s by the Aquascotan Indians, who were part of the Piscataway tribe. The name “Aquasco” is derived from the Indian word “Aquascotan,” which means “place of many springs.” The area was originally part of Charles County, but was annexed by Prince George’s County in 1791.
In the early 1800s, Aquasco was a thriving agricultural community, with tobacco, corn, and wheat being the primary crops. The area was also home to several mills, including a grist mill, a saw mill, and a paper mill.
In the late 1800s, Aquasco began to transition from an agricultural community to a residential one. The area was home to several large estates, including the Aquasco Plantation, which was owned by the prominent Bowie family. The plantation was eventually sold to the federal government in the 1940s and is now part of the Patuxent Wildlife Research Center.
Geography
Aquasco is located in southern Prince George’s County, approximately 25 miles southeast of Washington, D.C. The community is situated along the Patuxent River, and is bordered by the towns of Brandywine and Baden to the north, and the towns of Marlboro and Upper Marlboro to the south.
The area is characterized by rolling hills and wooded areas, with the Patuxent River providing a scenic backdrop. The climate is humid subtropical, with hot, humid summers and mild winters.
Economy
Aquasco is primarily a residential community, with most of its residents commuting to nearby towns and cities for work. The area is home to several small businesses, including a gas station, a convenience store, and a few restaurants.
The Aquasco area is also home to several large employers, including the Patuxent Wildlife Research Center, which is located on the former Aquasco Plantation. The center is a major employer in the area, and is responsible for the research and conservation of wildlife in the region.
Demographics
As of the 2010 census, Aquasco had a population of 1,000 people. The population is diverse, with African Americans making up the majority of the population (60%), followed by Whites (30%), Hispanics (7%), and Asians (3%).
The median household income in Aquasco is $60,000, which is slightly higher than the national average. The median home value is $250,000, which is also higher than the national average.
Aquasco is a close-knit community, with a strong sense of community pride. The area is home to several churches, a volunteer fire department, and a community center. The community also hosts several annual events, including a Fourth of July parade and a Christmas tree lighting ceremony.
Common Questions
What is Per Capita Income in Aquasco?
Per Capita income in Aquasco is $40,380.
What is the Median Family Income in Aquasco?
Median Family Income in Aquasco is $103,934.
What is the Median Household income in Aquasco?
Median Household Income in Aquasco is $94,028.
What is Income or Wage Gap in Aquasco?
Income or Wage Gap in Aquasco is 9.9%.
Women in Aquasco earn 90.1 cents for every dollar earned by a man.
What is Inequality or Gini Index in Aquasco?
Inequality or Gini Index in Aquasco is 0.36.
What is the Total Population of Aquasco?
Total Population of Aquasco is 701.
What is the Total Male Population of Aquasco?
Total Male Population of Aquasco is 397.
What is the Total Female Population of Aquasco?
Total Female Population of Aquasco is 304.
What is the Ratio of Males per 100 Females in Aquasco?
There are 130.59 Males per 100 Females in Aquasco.
What is the Ratio of Females per 100 Males in Aquasco?
There are 76.57 Females per 100 Males in Aquasco.
What is the Median Population Age in Aquasco?
Median Population Age in Aquasco is 46.1 Years.
What is the Average Family Size in Aquasco
Average Family Size in Aquasco is 3.0 People.
What is the Average Household Size in Aquasco
Average Household Size in Aquasco is 2.4 People.
How Large is the Labor Force in Aquasco?
There are 327 People in the Labor Forcein in Aquasco.
What is the Percentage of People in the Labor Force in Aquasco?
58.4% of People are in the Labor Force in Aquasco.
What is the Unemployment Rate in Aquasco?
Unemployment Rate in Aquasco is 3.1%.