Bowling Green, MD Map & Demographics
Bowling Green Map
Bowling Green Overview
$35,591
PER CAPITA INCOME
$59,750
AVG FAMILY INCOME
$59,773
AVG HOUSEHOLD INCOME
42.5%
WAGE / INCOME GAP [ % ]
57.5¢/ $1
WAGE / INCOME GAP [ $ ]
0.36
INEQUALITY / GINI INDEX
1,102
TOTAL POPULATION
510
MALE POPULATION
592
FEMALE POPULATION
86.15
MALES / 100 FEMALES
116.08
FEMALES / 100 MALES
42.9
MEDIAN AGE
2.5
AVG FAMILY SIZE
2.0
AVG HOUSEHOLD SIZE
604
LABOR FORCE [ PEOPLE ]
60.6%
PERCENT IN LABOR FORCE
5.6%
UNEMPLOYMENT RATE
Income in Bowling Green
Income Overview in Bowling Green
Per Capita Income in Bowling Green is $35,591, while median incomes of families and households are $59,750 and $59,773 respectively.
| Characteristic | Number | Measure |
| Per Capita Income | 1,102 | $35,591 |
| Median Family Income | 273 | $59,750 |
| Mean Family Income | 273 | $74,168 |
| Median Household Income | 560 | $59,773 |
| Mean Household Income | 560 | $68,290 |
| Income Deficit | 273 | $0 |
| Wage / Income Gap (%) | 1,102 | 42.47% |
| Wage / Income Gap ($) | 1,102 | 57.53¢ per $1 |
| Gini / Inequality Index | 1,102 | 0.36 |
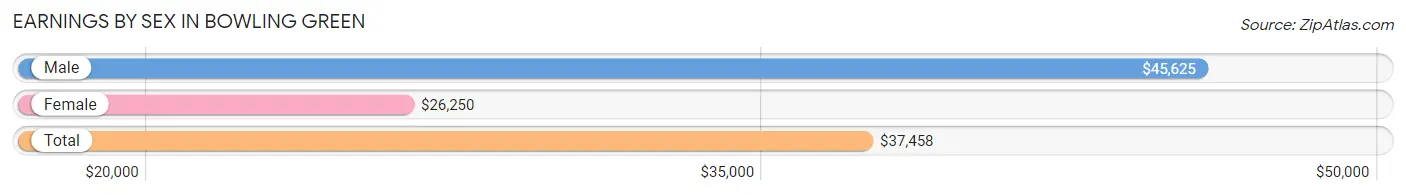
Earnings by Sex in Bowling Green
Average Earnings in Bowling Green are $37,458, $45,625 for men and $26,250 for women, a difference of 42.5%.
| Sex | Number | Average Earnings |
| Male | 345 (57.4%) | $45,625 |
| Female | 256 (42.6%) | $26,250 |
| Total | 601 (100.0%) | $37,458 |
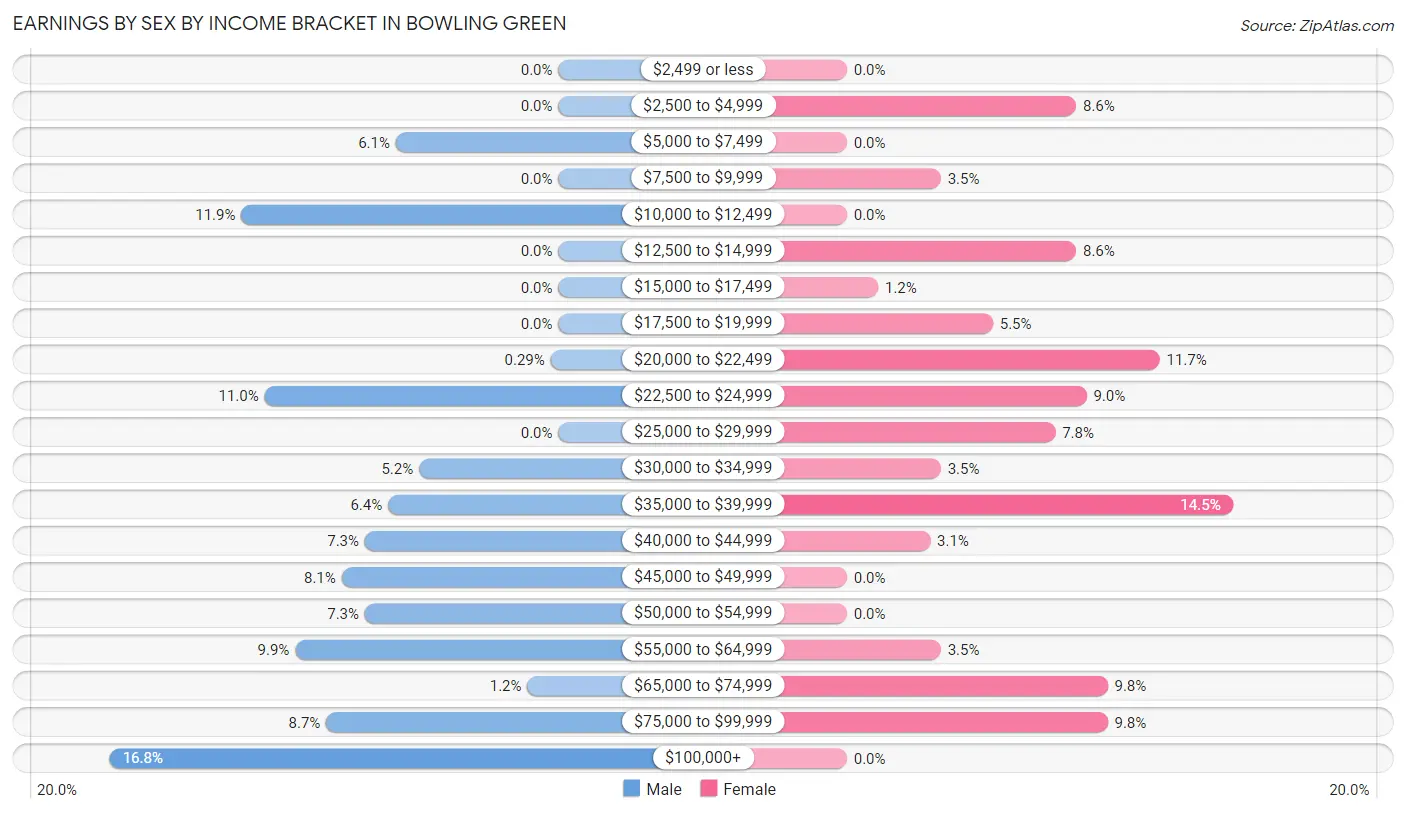
Earnings by Sex by Income Bracket in Bowling Green
The most common earnings brackets in Bowling Green are $100,000+ for men (58 | 16.8%) and $35,000 to $39,999 for women (37 | 14.4%).
| Income | Male | Female |
| $2,499 or less | 0 (0.0%) | 0 (0.0%) |
| $2,500 to $4,999 | 0 (0.0%) | 22 (8.6%) |
| $5,000 to $7,499 | 21 (6.1%) | 0 (0.0%) |
| $7,500 to $9,999 | 0 (0.0%) | 9 (3.5%) |
| $10,000 to $12,499 | 41 (11.9%) | 0 (0.0%) |
| $12,500 to $14,999 | 0 (0.0%) | 22 (8.6%) |
| $15,000 to $17,499 | 0 (0.0%) | 3 (1.2%) |
| $17,500 to $19,999 | 0 (0.0%) | 14 (5.5%) |
| $20,000 to $22,499 | 1 (0.3%) | 30 (11.7%) |
| $22,500 to $24,999 | 38 (11.0%) | 23 (9.0%) |
| $25,000 to $29,999 | 0 (0.0%) | 20 (7.8%) |
| $30,000 to $34,999 | 18 (5.2%) | 9 (3.5%) |
| $35,000 to $39,999 | 22 (6.4%) | 37 (14.4%) |
| $40,000 to $44,999 | 25 (7.2%) | 8 (3.1%) |
| $45,000 to $49,999 | 28 (8.1%) | 0 (0.0%) |
| $50,000 to $54,999 | 25 (7.2%) | 0 (0.0%) |
| $55,000 to $64,999 | 34 (9.9%) | 9 (3.5%) |
| $65,000 to $74,999 | 4 (1.2%) | 25 (9.8%) |
| $75,000 to $99,999 | 30 (8.7%) | 25 (9.8%) |
| $100,000+ | 58 (16.8%) | 0 (0.0%) |
| Total | 345 (100.0%) | 256 (100.0%) |
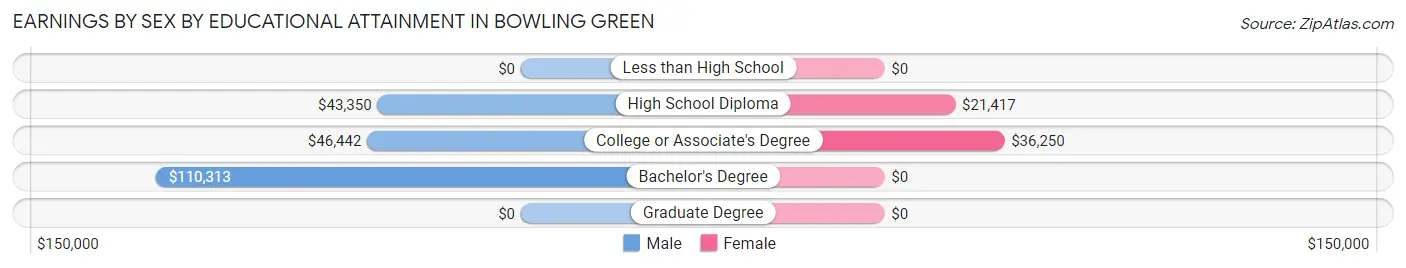
Earnings by Sex by Educational Attainment in Bowling Green
Average earnings in Bowling Green are $47,404 for men and $35,769 for women, a difference of 24.5%. Men with an educational attainment of bachelor's degree enjoy the highest average annual earnings of $110,313, while those with high school diploma education earn the least with $43,350. Women with an educational attainment of college or associate's degree earn the most with the average annual earnings of $36,250, while those with high school diploma education have the smallest earnings of $21,417.
| Educational Attainment | Male Income | Female Income |
| Less than High School | - | - |
| High School Diploma | $43,350 | $21,417 |
| College or Associate's Degree | $46,442 | $36,250 |
| Bachelor's Degree | $110,313 | $0 |
| Graduate Degree | - | - |
| Total | $47,404 | $35,769 |
Family Income in Bowling Green
Family Income Brackets in Bowling Green
According to the Bowling Green family income data, there are 62 families falling into the $15,000 to $24,999 income range, which is the most common income bracket and makes up 22.7% of all families.
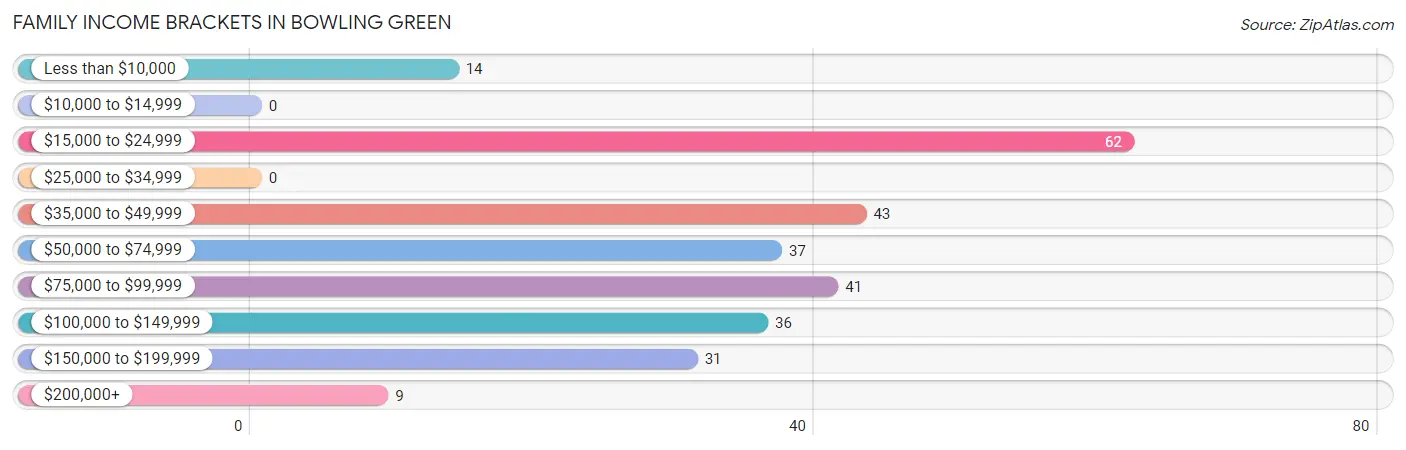
| Income Bracket | # Families | % Families |
| Less than $10,000 | 14 | 5.1% |
| $10,000 to $14,999 | 0 | 0.0% |
| $15,000 to $24,999 | 62 | 22.7% |
| $25,000 to $34,999 | 0 | 0.0% |
| $35,000 to $49,999 | 43 | 15.8% |
| $50,000 to $74,999 | 37 | 13.6% |
| $75,000 to $99,999 | 41 | 15.0% |
| $100,000 to $149,999 | 36 | 13.2% |
| $150,000 to $199,999 | 31 | 11.4% |
| $200,000+ | 9 | 3.3% |
Family Income by Famaliy Size in Bowling Green
4-person families (38 | 13.9%) account for the highest median family income in Bowling Green with $121,923 per family, while 4-person families (38 | 13.9%) have the highest median income of $30,481 per family member.
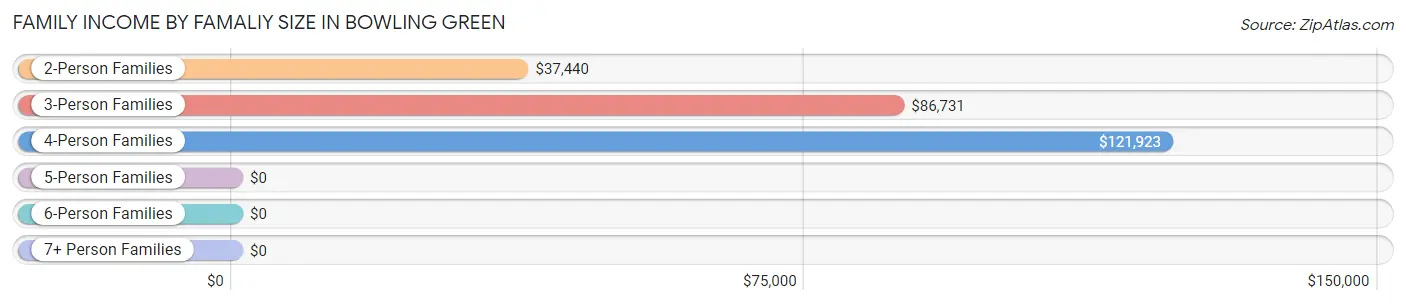
| Income Bracket | # Families | Median Income |
| 2-Person Families | 165 (60.4%) | $37,440 |
| 3-Person Families | 70 (25.6%) | $86,731 |
| 4-Person Families | 38 (13.9%) | $121,923 |
| 5-Person Families | 0 (0.0%) | $0 |
| 6-Person Families | 0 (0.0%) | $0 |
| 7+ Person Families | 0 (0.0%) | $0 |
| Total | 273 (100.0%) | $59,750 |
Family Income by Number of Earners in Bowling Green
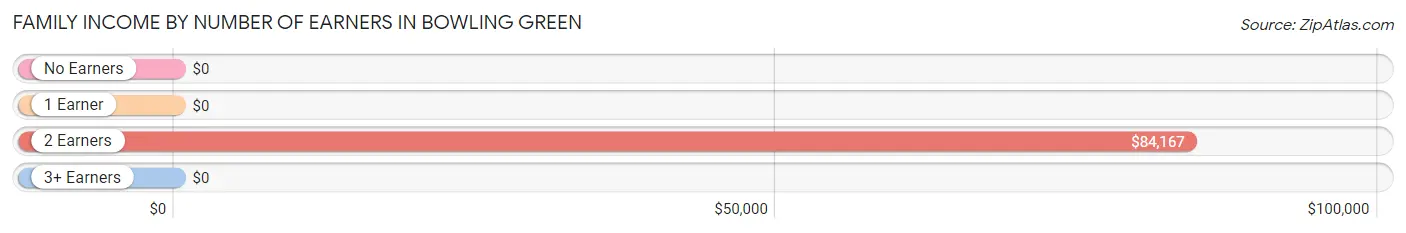
| Number of Earners | # Families | Median Income |
| No Earners | 61 (22.3%) | $0 |
| 1 Earner | 105 (38.5%) | $0 |
| 2 Earners | 82 (30.0%) | $84,167 |
| 3+ Earners | 25 (9.2%) | $0 |
| Total | 273 (100.0%) | $59,750 |
Household Income in Bowling Green
Household Income Brackets in Bowling Green
With 127 households falling in the category, the $50,000 to $74,999 income range is the most frequent in Bowling Green, accounting for 22.7% of all households. In contrast, only 9 households (1.6%) fall into the $200,000+ income bracket, making it the least populous group.
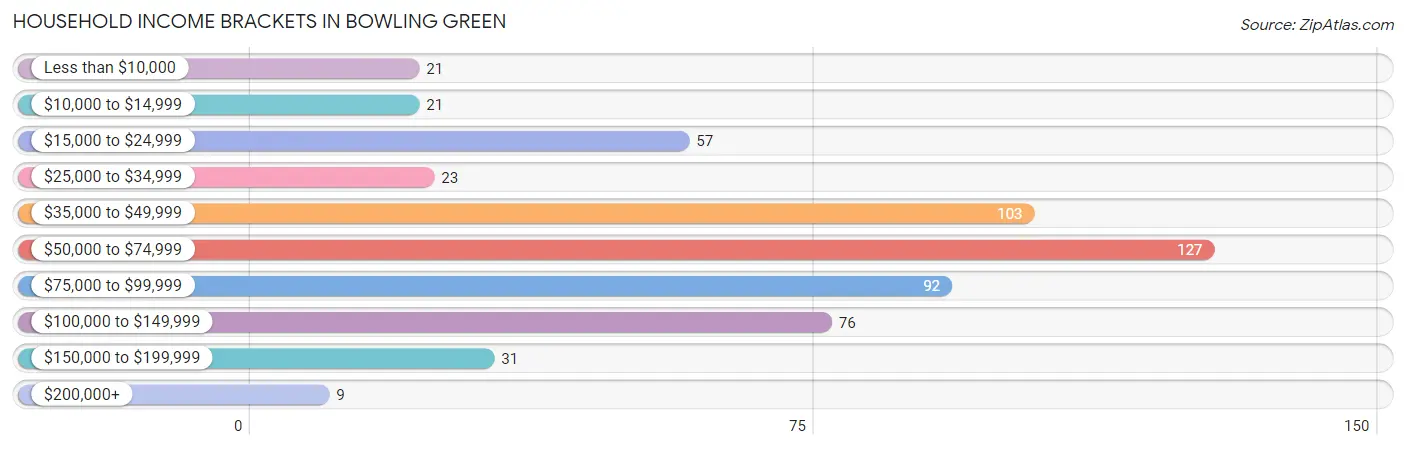
| Income Bracket | # Households | % Households |
| Less than $10,000 | 21 | 3.8% |
| $10,000 to $14,999 | 21 | 3.8% |
| $15,000 to $24,999 | 57 | 10.2% |
| $25,000 to $34,999 | 23 | 4.1% |
| $35,000 to $49,999 | 103 | 18.4% |
| $50,000 to $74,999 | 127 | 22.7% |
| $75,000 to $99,999 | 92 | 16.4% |
| $100,000 to $149,999 | 76 | 13.6% |
| $150,000 to $199,999 | 31 | 5.5% |
| $200,000+ | 9 | 1.6% |
Household Income by Householder Age in Bowling Green
The median household income in Bowling Green is $59,773, with the highest median household income of $71,202 found in the 45 to 64 years age bracket for the primary householder. A total of 306 households (54.6%) fall into this category. Meanwhile, the 15 to 24 years age bracket for the primary householder has the lowest median household income of $36,767, with 41 households (7.3%) in this group.
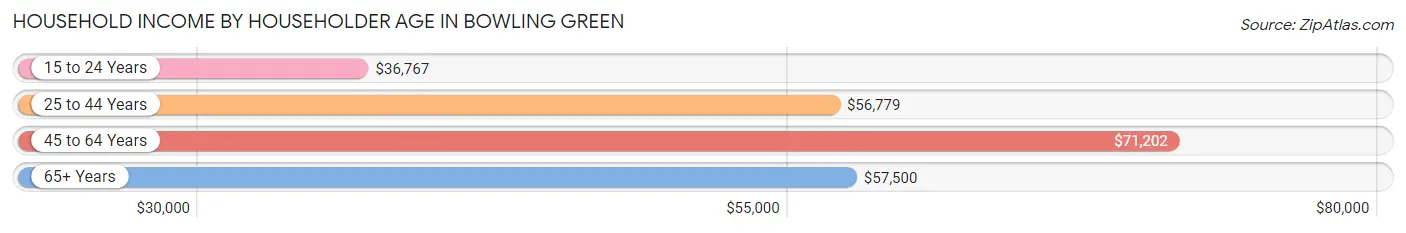
| Income Bracket | # Households | Median Income |
| 15 to 24 Years | 41 (7.3%) | $36,767 |
| 25 to 44 Years | 125 (22.3%) | $56,779 |
| 45 to 64 Years | 306 (54.6%) | $71,202 |
| 65+ Years | 88 (15.7%) | $57,500 |
| Total | 560 (100.0%) | $59,773 |
Poverty in Bowling Green
Income Below Poverty by Sex and Age in Bowling Green
With 11.8% poverty level for males and 10.0% for females among the residents of Bowling Green, under 5 year old males and 18 to 24 year old females are the most vulnerable to poverty, with 12 males (63.2%) and 24 females (30.0%) in their respective age groups living below the poverty level.
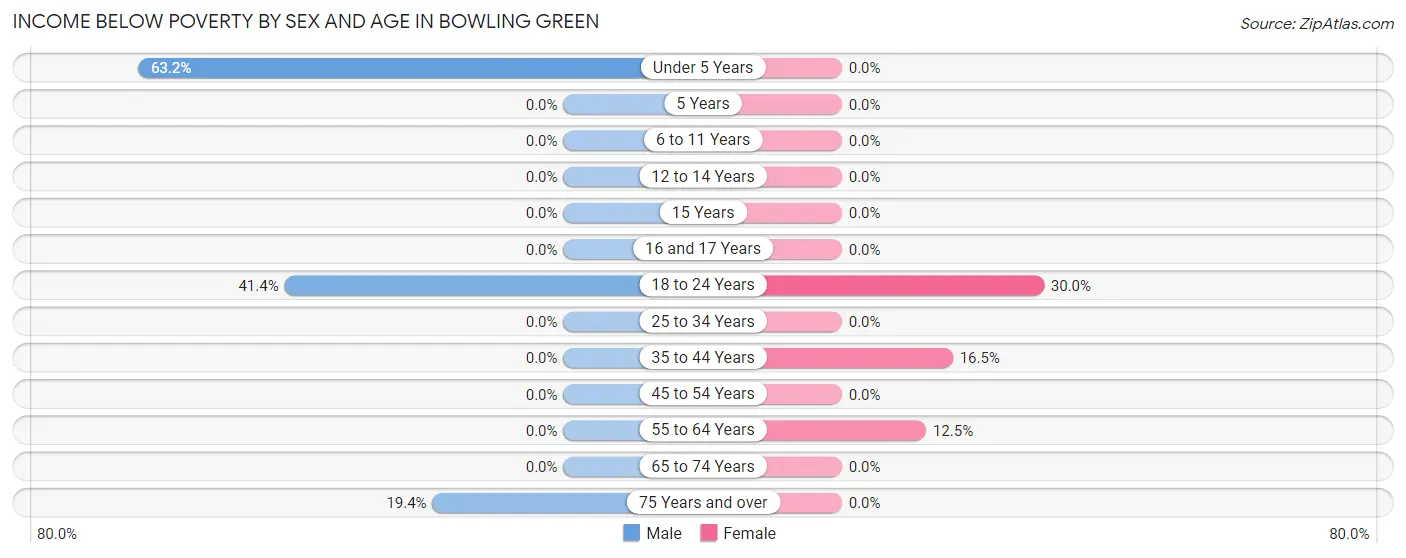
| Age Bracket | Male | Female |
| Under 5 Years | 12 (63.2%) | 0 (0.0%) |
| 5 Years | 0 (0.0%) | 0 (0.0%) |
| 6 to 11 Years | 0 (0.0%) | 0 (0.0%) |
| 12 to 14 Years | 0 (0.0%) | 0 (0.0%) |
| 15 Years | 0 (0.0%) | 0 (0.0%) |
| 16 and 17 Years | 0 (0.0%) | 0 (0.0%) |
| 18 to 24 Years | 41 (41.4%) | 24 (30.0%) |
| 25 to 34 Years | 0 (0.0%) | 0 (0.0%) |
| 35 to 44 Years | 0 (0.0%) | 14 (16.5%) |
| 45 to 54 Years | 0 (0.0%) | 0 (0.0%) |
| 55 to 64 Years | 0 (0.0%) | 21 (12.5%) |
| 65 to 74 Years | 0 (0.0%) | 0 (0.0%) |
| 75 Years and over | 7 (19.4%) | 0 (0.0%) |
| Total | 60 (11.8%) | 59 (10.0%) |
Income Above Poverty by Sex and Age in Bowling Green
According to the poverty statistics in Bowling Green, males aged 15 years and females aged 6 to 11 years are the age groups that are most secure financially, with 100.0% of males and 100.0% of females in these age groups living above the poverty line.
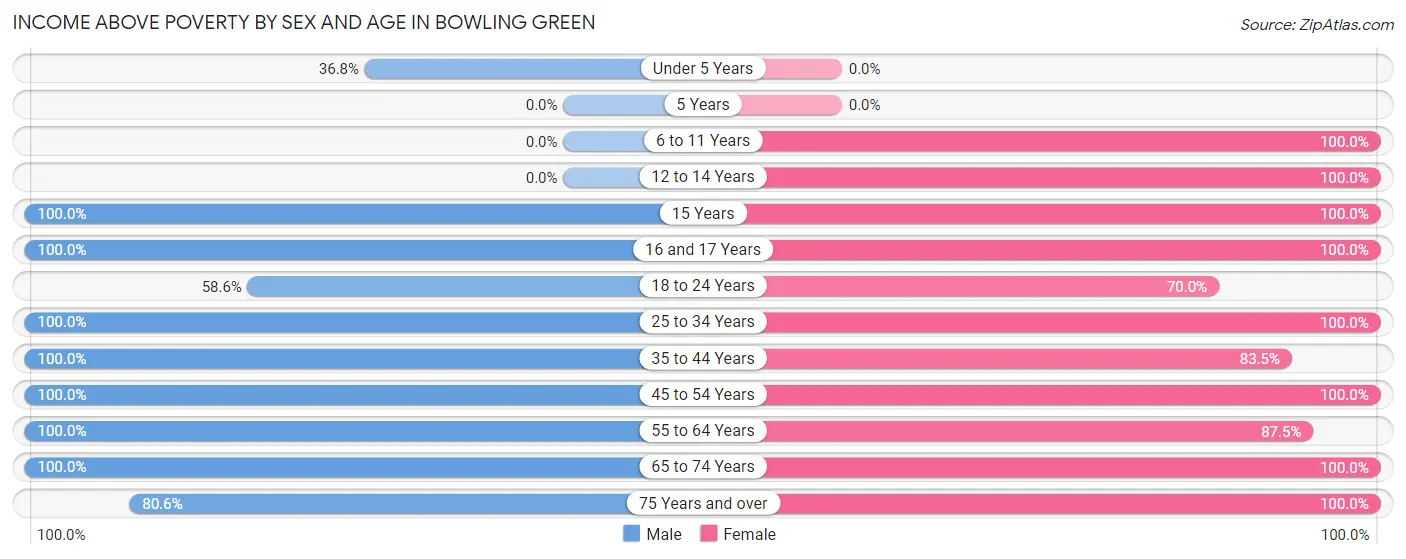
| Age Bracket | Male | Female |
| Under 5 Years | 7 (36.8%) | 0 (0.0%) |
| 5 Years | 0 (0.0%) | 0 (0.0%) |
| 6 to 11 Years | 0 (0.0%) | 31 (100.0%) |
| 12 to 14 Years | 0 (0.0%) | 20 (100.0%) |
| 15 Years | 26 (100.0%) | 10 (100.0%) |
| 16 and 17 Years | 28 (100.0%) | 13 (100.0%) |
| 18 to 24 Years | 58 (58.6%) | 56 (70.0%) |
| 25 to 34 Years | 28 (100.0%) | 39 (100.0%) |
| 35 to 44 Years | 97 (100.0%) | 71 (83.5%) |
| 45 to 54 Years | 83 (100.0%) | 76 (100.0%) |
| 55 to 64 Years | 64 (100.0%) | 147 (87.5%) |
| 65 to 74 Years | 30 (100.0%) | 37 (100.0%) |
| 75 Years and over | 29 (80.6%) | 33 (100.0%) |
| Total | 450 (88.2%) | 533 (90.0%) |
Income Below Poverty Among Married-Couple Families in Bowling Green
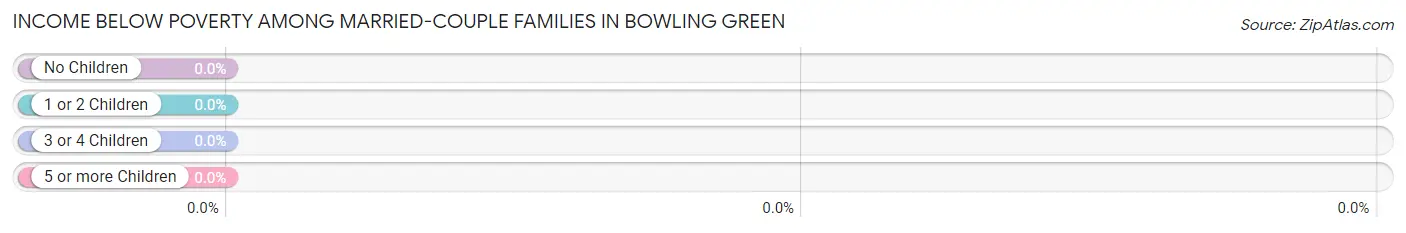
| Children | Above Poverty | Below Poverty |
| No Children | 120 (100.0%) | 0 (0.0%) |
| 1 or 2 Children | 57 (100.0%) | 0 (0.0%) |
| 3 or 4 Children | 0 (0.0%) | 0 (0.0%) |
| 5 or more Children | 0 (0.0%) | 0 (0.0%) |
| Total | 177 (100.0%) | 0 (0.0%) |
Income Below Poverty Among Single-Parent Households in Bowling Green
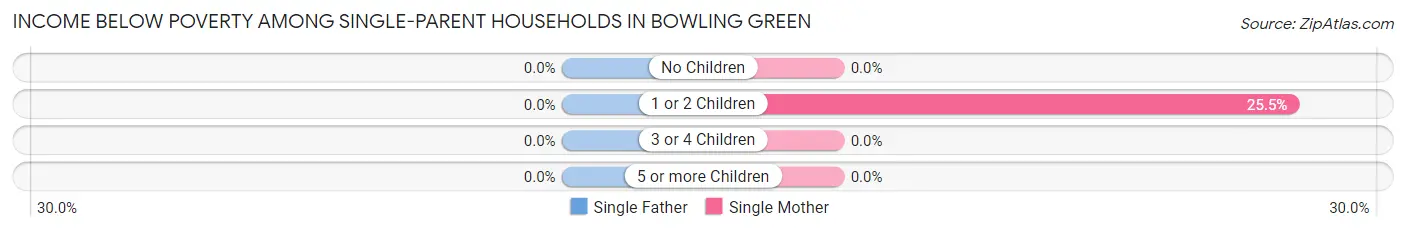
| Children | Single Father | Single Mother |
| No Children | 0 (0.0%) | 0 (0.0%) |
| 1 or 2 Children | 0 (0.0%) | 14 (25.5%) |
| 3 or 4 Children | 0 (0.0%) | 0 (0.0%) |
| 5 or more Children | 0 (0.0%) | 0 (0.0%) |
| Total | 0 (0.0%) | 14 (18.9%) |
Income Below Poverty Among Married-Couple vs Single-Parent Households in Bowling Green
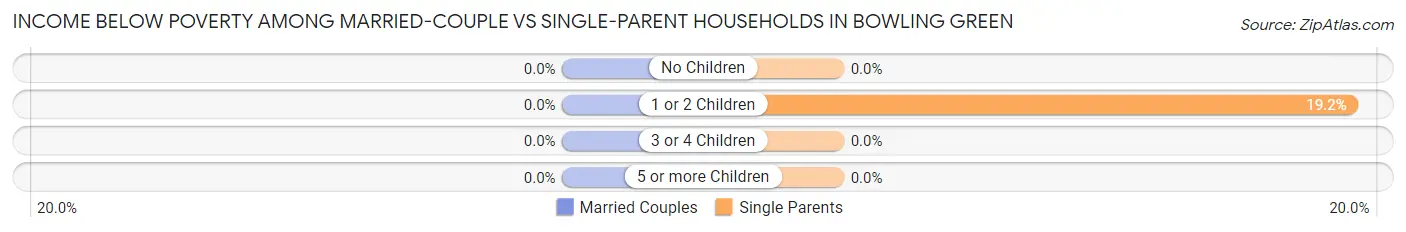
| Children | Married-Couple Families | Single-Parent Households |
| No Children | 0 (0.0%) | 0 (0.0%) |
| 1 or 2 Children | 0 (0.0%) | 14 (19.2%) |
| 3 or 4 Children | 0 (0.0%) | 0 (0.0%) |
| 5 or more Children | 0 (0.0%) | 0 (0.0%) |
| Total | 0 (0.0%) | 14 (14.6%) |
Race in Bowling Green
The most populous races in Bowling Green are White / Caucasian (1,053 | 95.6%), Two or more Races (46 | 4.2%), and Hispanic or Latino (10 | 0.9%).
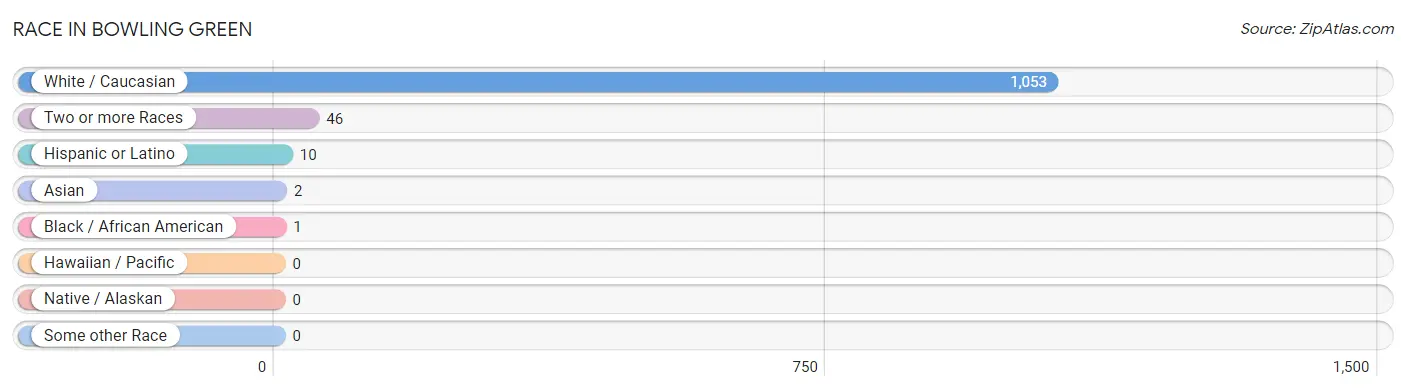
| Race | # Population | % Population |
| Asian | 2 | 0.2% |
| Black / African American | 1 | 0.1% |
| Hawaiian / Pacific | 0 | 0.0% |
| Hispanic or Latino | 10 | 0.9% |
| Native / Alaskan | 0 | 0.0% |
| White / Caucasian | 1,053 | 95.6% |
| Two or more Races | 46 | 4.2% |
| Some other Race | 0 | 0.0% |
| Total | 1,102 | 100.0% |
Ancestry in Bowling Green
The most populous ancestries reported in Bowling Green are German (354 | 32.1%), Irish (190 | 17.2%), English (113 | 10.2%), American (108 | 9.8%), and Scottish (83 | 7.5%), together accounting for 76.9% of all Bowling Green residents.
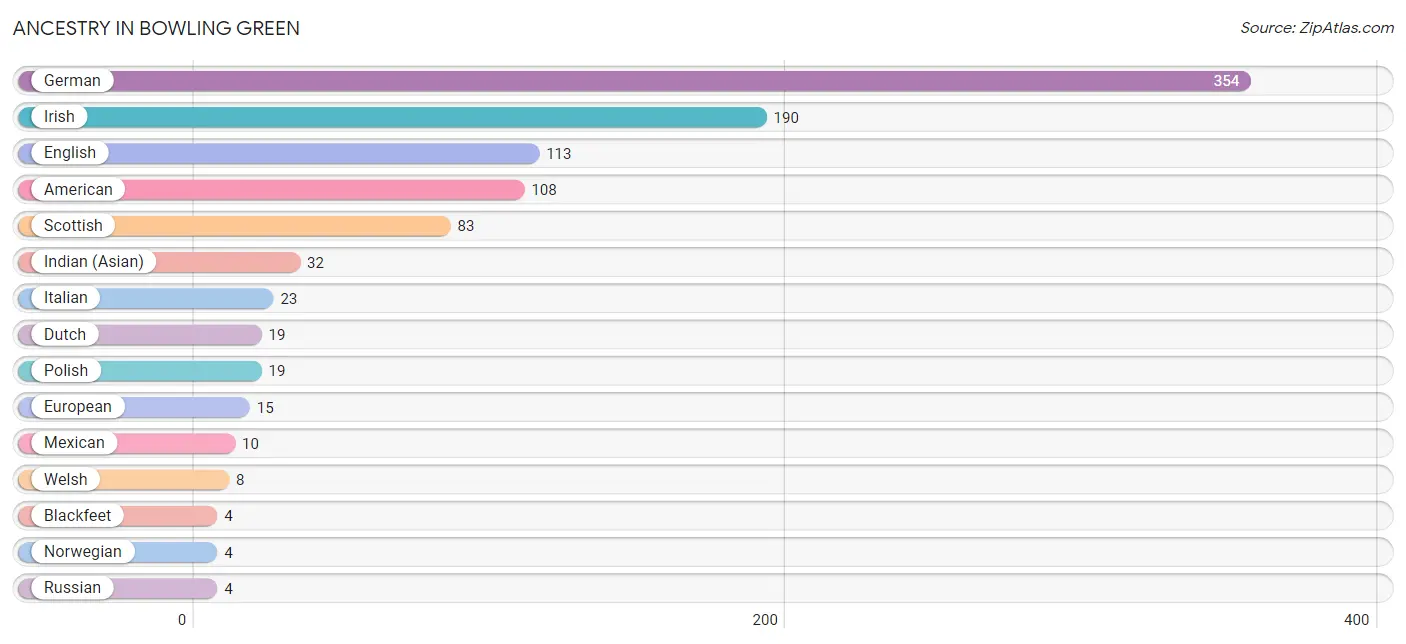
| Ancestry | # Population | % Population |
| American | 108 | 9.8% |
| Blackfeet | 4 | 0.4% |
| Dutch | 19 | 1.7% |
| English | 113 | 10.2% |
| European | 15 | 1.4% |
| French | 3 | 0.3% |
| German | 354 | 32.1% |
| Indian (Asian) | 32 | 2.9% |
| Irish | 190 | 17.2% |
| Italian | 23 | 2.1% |
| Mexican | 10 | 0.9% |
| Norwegian | 4 | 0.4% |
| Polish | 19 | 1.7% |
| Russian | 4 | 0.4% |
| Scottish | 83 | 7.5% |
| Sri Lankan | 2 | 0.2% |
| Welsh | 8 | 0.7% | View All 17 Rows |
Immigrants in Bowling Green
The most numerous immigrant groups reported in Bowling Green came from Asia (2 | 0.2%), South Eastern Asia (2 | 0.2%), and Vietnam (2 | 0.2%), together accounting for 0.5% of all Bowling Green residents.
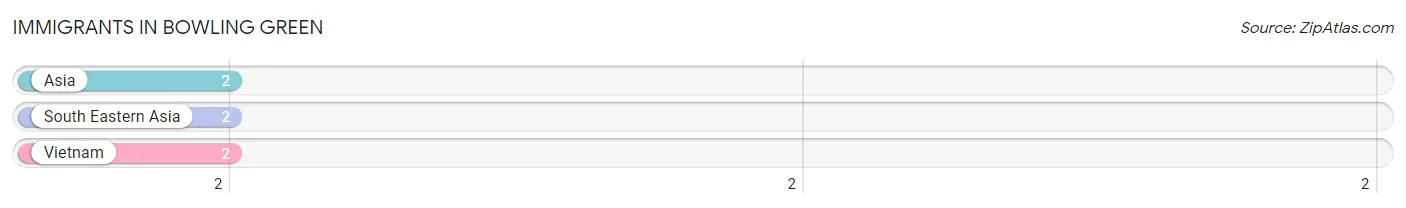
| Immigration Origin | # Population | % Population |
| Asia | 2 | 0.2% |
| South Eastern Asia | 2 | 0.2% |
| Vietnam | 2 | 0.2% | View All 3 Rows |
Sex and Age in Bowling Green
Sex and Age in Bowling Green
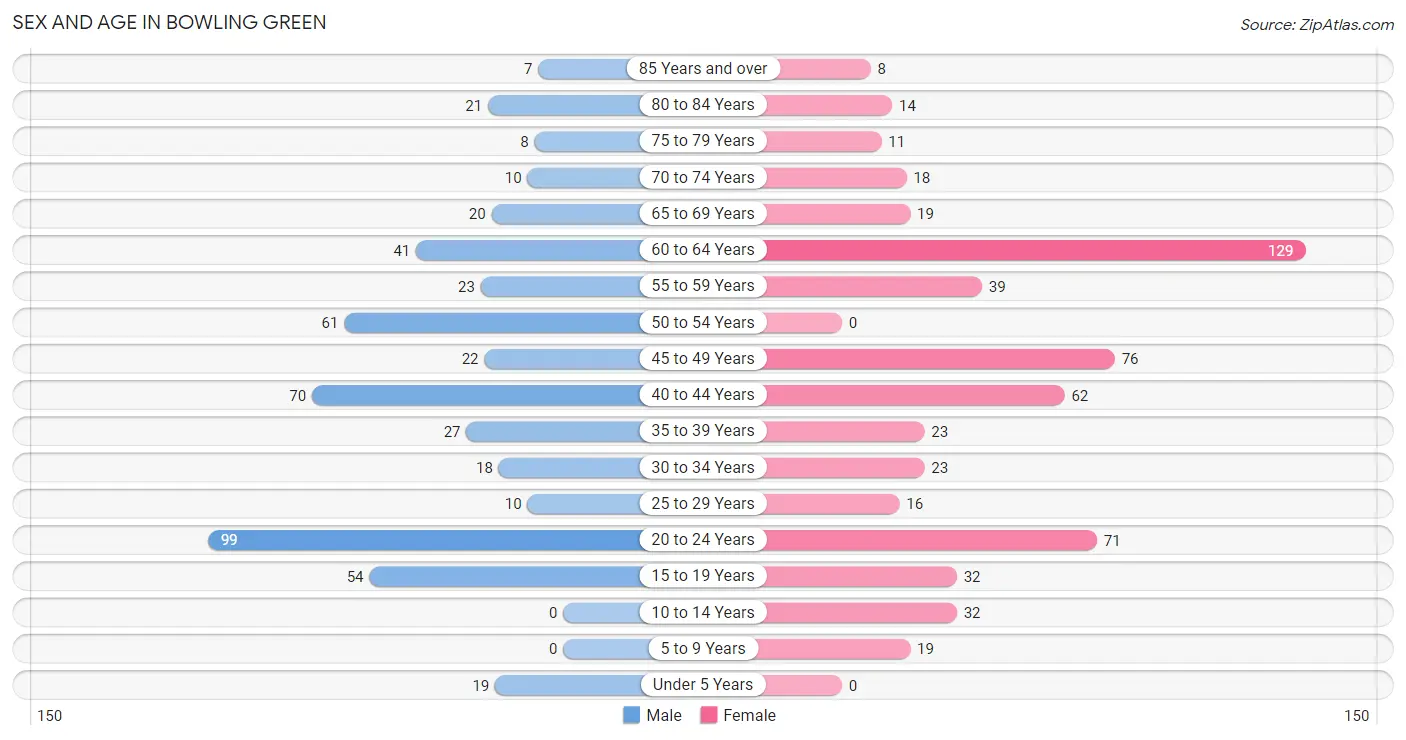
The most populous age groups in Bowling Green are 20 to 24 Years (99 | 19.4%) for men and 60 to 64 Years (129 | 21.8%) for women.
| Age Bracket | Male | Female |
| Under 5 Years | 19 (3.7%) | 0 (0.0%) |
| 5 to 9 Years | 0 (0.0%) | 19 (3.2%) |
| 10 to 14 Years | 0 (0.0%) | 32 (5.4%) |
| 15 to 19 Years | 54 (10.6%) | 32 (5.4%) |
| 20 to 24 Years | 99 (19.4%) | 71 (12.0%) |
| 25 to 29 Years | 10 (2.0%) | 16 (2.7%) |
| 30 to 34 Years | 18 (3.5%) | 23 (3.9%) |
| 35 to 39 Years | 27 (5.3%) | 23 (3.9%) |
| 40 to 44 Years | 70 (13.7%) | 62 (10.5%) |
| 45 to 49 Years | 22 (4.3%) | 76 (12.8%) |
| 50 to 54 Years | 61 (12.0%) | 0 (0.0%) |
| 55 to 59 Years | 23 (4.5%) | 39 (6.6%) |
| 60 to 64 Years | 41 (8.0%) | 129 (21.8%) |
| 65 to 69 Years | 20 (3.9%) | 19 (3.2%) |
| 70 to 74 Years | 10 (2.0%) | 18 (3.0%) |
| 75 to 79 Years | 8 (1.6%) | 11 (1.9%) |
| 80 to 84 Years | 21 (4.1%) | 14 (2.4%) |
| 85 Years and over | 7 (1.4%) | 8 (1.3%) |
| Total | 510 (100.0%) | 592 (100.0%) |
Families and Households in Bowling Green
Median Family Size in Bowling Green
The median family size in Bowling Green is 2.52 persons per family, with married-couple families (177 | 64.8%) accounting for the largest median family size of 2.67 persons per family. On the other hand, single female/mother families (74 | 27.1%) represent the smallest median family size with 2.22 persons per family.
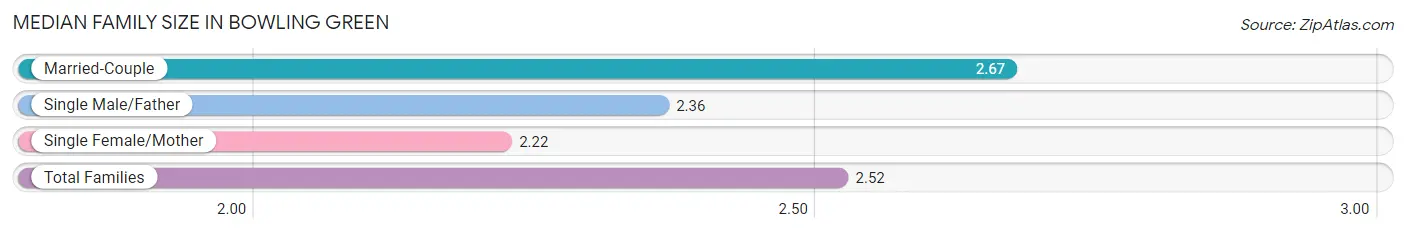
| Family Type | # Families | Family Size |
| Married-Couple | 177 (64.8%) | 2.67 |
| Single Male/Father | 22 (8.1%) | 2.36 |
| Single Female/Mother | 74 (27.1%) | 2.22 |
| Total Families | 273 (100.0%) | 2.52 |
Median Household Size in Bowling Green
The median household size in Bowling Green is 1.97 persons per household, with single male/father households (22 | 3.9%) accounting for the largest median household size of 3.82 persons per household. non-family households (287 | 51.2%) represent the smallest median household size with 1.25 persons per household.
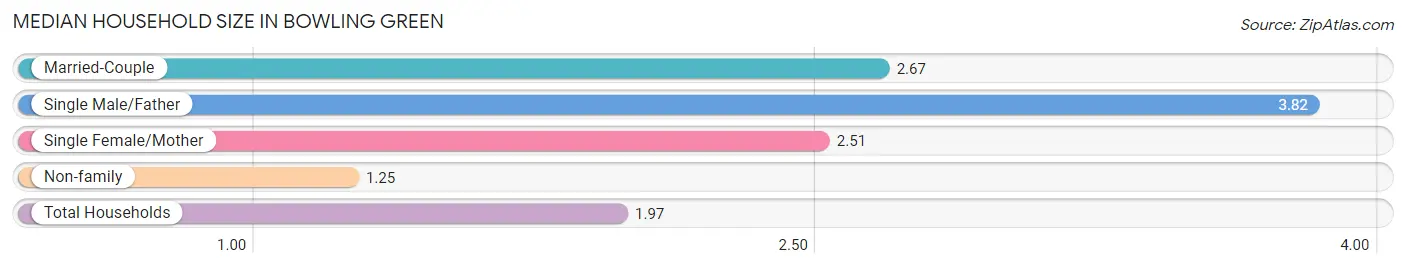
| Household Type | # Households | Household Size |
| Married-Couple | 177 (31.6%) | 2.67 |
| Single Male/Father | 22 (3.9%) | 3.82 |
| Single Female/Mother | 74 (13.2%) | 2.51 |
| Non-family | 287 (51.2%) | 1.25 |
| Total Households | 560 (100.0%) | 1.97 |
Household Size by Marriage Status in Bowling Green
Out of a total of 560 households in Bowling Green, 273 (48.7%) are family households, while 287 (51.2%) are nonfamily households. The most numerous type of family households are 2-person households, comprising 128, and the most common type of nonfamily households are 1-person households, comprising 237.
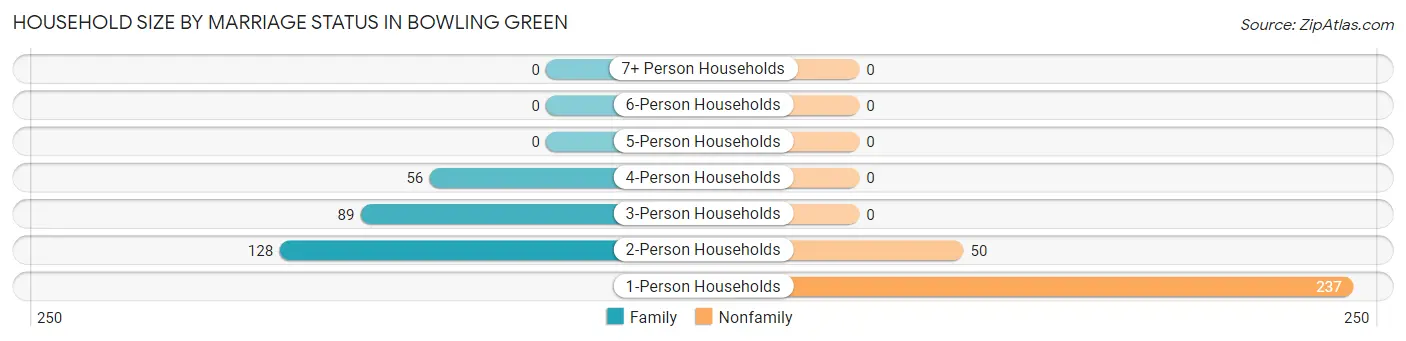
| Household Size | Family Households | Nonfamily Households |
| 1-Person Households | - | 237 (42.3%) |
| 2-Person Households | 128 (22.9%) | 50 (8.9%) |
| 3-Person Households | 89 (15.9%) | 0 (0.0%) |
| 4-Person Households | 56 (10.0%) | 0 (0.0%) |
| 5-Person Households | 0 (0.0%) | 0 (0.0%) |
| 6-Person Households | 0 (0.0%) | 0 (0.0%) |
| 7+ Person Households | 0 (0.0%) | 0 (0.0%) |
| Total | 273 (48.7%) | 287 (51.2%) |
Female Fertility in Bowling Green
Fertility by Age in Bowling Green
| Age Bracket | Women with Births | Births / 1,000 Women |
| 15 to 19 years | 0 (0.0%) | 0.0 |
| 20 to 34 years | 0 (0.0%) | 0.0 |
| 35 to 50 years | 0 (0.0%) | 0.0 |
| Total | 0 (0.0%) | 0.0 |
Fertility by Age by Marriage Status in Bowling Green
| Age Bracket | Married | Unmarried |
| 15 to 19 years | 0 (0.0%) | 0 (0.0%) |
| 20 to 34 years | 0 (0.0%) | 0 (0.0%) |
| 35 to 50 years | 0 (0.0%) | 0 (0.0%) |
| Total | 0 (0.0%) | 0 (0.0%) |
Fertility by Education in Bowling Green
| Educational Attainment | Women with Births | Births / 1,000 Women |
| Less than High School | 0 (0.0%) | 0.0 |
| High School Diploma | 0 (0.0%) | 0.0 |
| College or Associate's Degree | 0 (0.0%) | 0.0 |
| Bachelor's Degree | 0 (0.0%) | 0.0 |
| Graduate Degree | 0 (0.0%) | 0.0 |
| Total | 0 (0.0%) | 0.0 |
Fertility by Education by Marriage Status in Bowling Green
| Educational Attainment | Married | Unmarried |
| Less than High School | 0 (0.0%) | 0 (0.0%) |
| High School Diploma | 0 (0.0%) | 0 (0.0%) |
| College or Associate's Degree | 0 (0.0%) | 0 (0.0%) |
| Bachelor's Degree | 0 (0.0%) | 0 (0.0%) |
| Graduate Degree | 0 (0.0%) | 0 (0.0%) |
| Total | 0 (0.0%) | 0 (0.0%) |
Employment Characteristics in Bowling Green
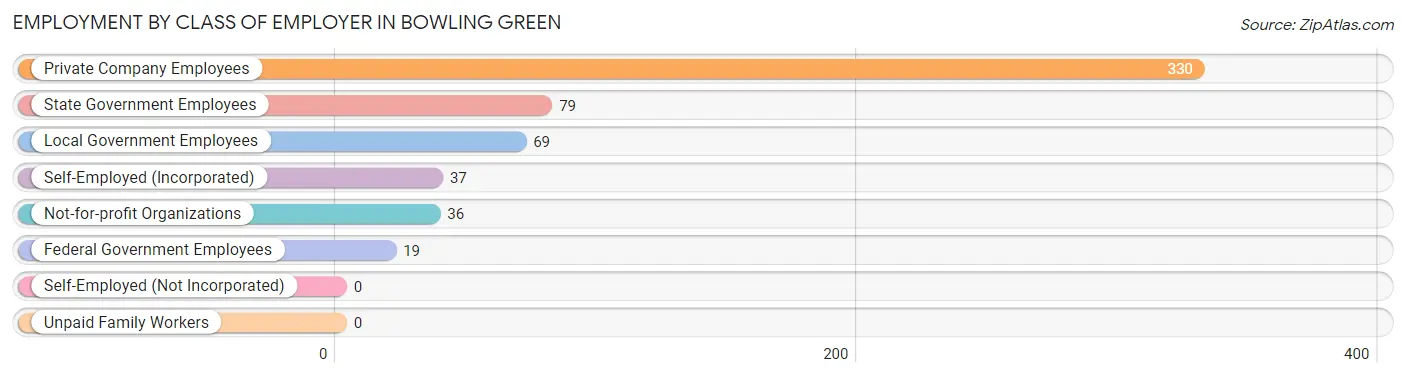
Employment by Class of Employer in Bowling Green
Among the 570 employed individuals in Bowling Green, private company employees (330 | 57.9%), state government employees (79 | 13.9%), and local government employees (69 | 12.1%) make up the most common classes of employment.
| Employer Class | # Employees | % Employees |
| Private Company Employees | 330 | 57.9% |
| Self-Employed (Incorporated) | 37 | 6.5% |
| Self-Employed (Not Incorporated) | 0 | 0.0% |
| Not-for-profit Organizations | 36 | 6.3% |
| Local Government Employees | 69 | 12.1% |
| State Government Employees | 79 | 13.9% |
| Federal Government Employees | 19 | 3.3% |
| Unpaid Family Workers | 0 | 0.0% |
| Total | 570 | 100.0% |
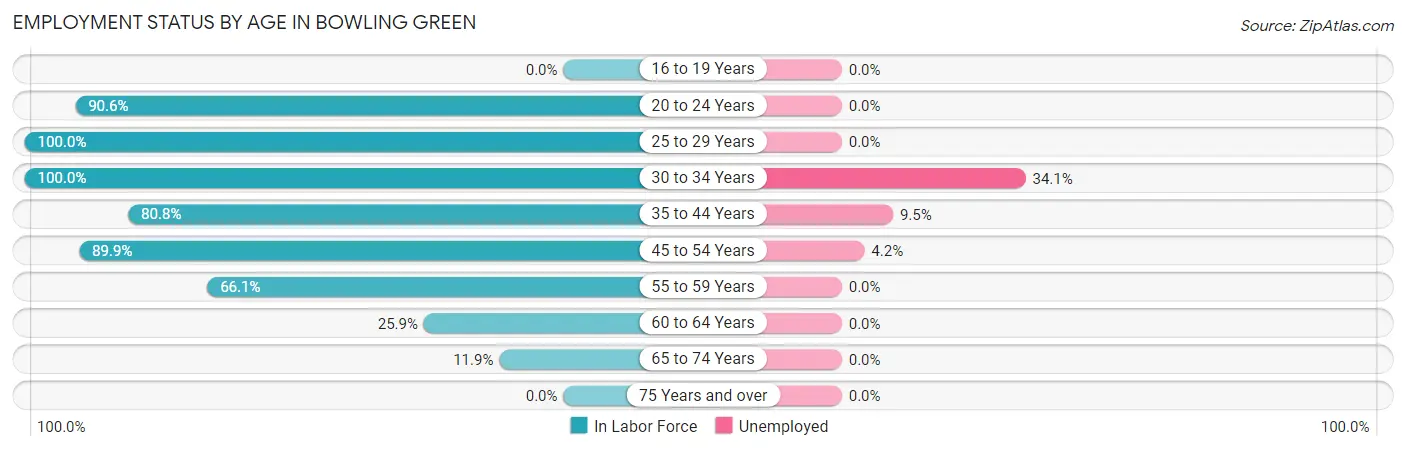
Employment Status by Age in Bowling Green
According to the labor force statistics for Bowling Green, out of the total population over 16 years of age (996), 60.6% or 604 individuals are in the labor force, with 5.6% or 34 of them unemployed. The age group with the highest labor force participation rate is 25 to 29 years, with 100.0% or 26 individuals in the labor force. Within the labor force, the 30 to 34 years age range has the highest percentage of unemployed individuals, with 34.1% or 14 of them being unemployed.
| Age Bracket | In Labor Force | Unemployed |
| 16 to 19 Years | 0 (0.0%) | 0 (0.0%) |
| 20 to 24 Years | 154 (90.6%) | 0 (0.0%) |
| 25 to 29 Years | 26 (100.0%) | 0 (0.0%) |
| 30 to 34 Years | 41 (100.0%) | 14 (34.1%) |
| 35 to 44 Years | 147 (80.8%) | 14 (9.5%) |
| 45 to 54 Years | 143 (89.9%) | 6 (4.2%) |
| 55 to 59 Years | 41 (66.1%) | 0 (0.0%) |
| 60 to 64 Years | 44 (25.9%) | 0 (0.0%) |
| 65 to 74 Years | 8 (11.9%) | 0 (0.0%) |
| 75 Years and over | 0 (0.0%) | 0 (0.0%) |
| Total | 604 (60.6%) | 34 (5.6%) |
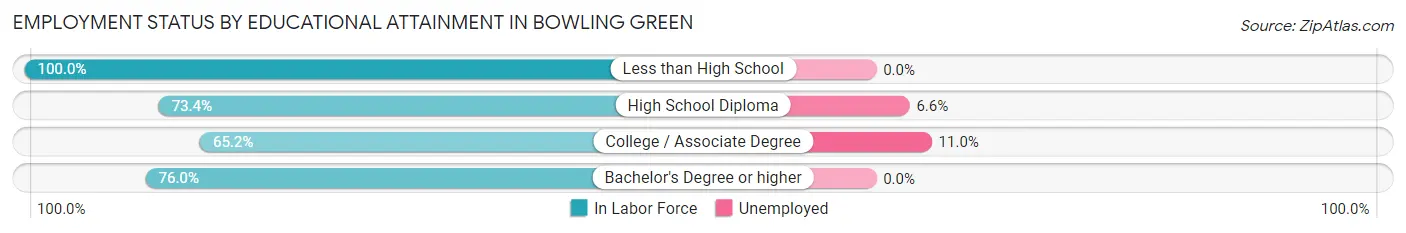
Employment Status by Educational Attainment in Bowling Green
According to labor force statistics for Bowling Green, 69.1% of individuals (442) out of the total population between 25 and 64 years of age (640) are in the labor force, with 7.7% or 34 of them being unemployed. The group with the highest labor force participation rate are those with the educational attainment of less than high school, with 100.0% or 4 individuals in the labor force. Within the labor force, individuals with college / associate degree education have the highest percentage of unemployment, with 11.0% or 28 of them being unemployed.
| Educational Attainment | In Labor Force | Unemployed |
| Less than High School | 4 (100.0%) | 0 (0.0%) |
| High School Diploma | 91 (73.4%) | 8 (6.6%) |
| College / Associate Degree | 255 (65.2%) | 43 (11.0%) |
| Bachelor's Degree or higher | 92 (76.0%) | 0 (0.0%) |
| Total | 442 (69.1%) | 49 (7.7%) |
Employment Occupations by Sex in Bowling Green
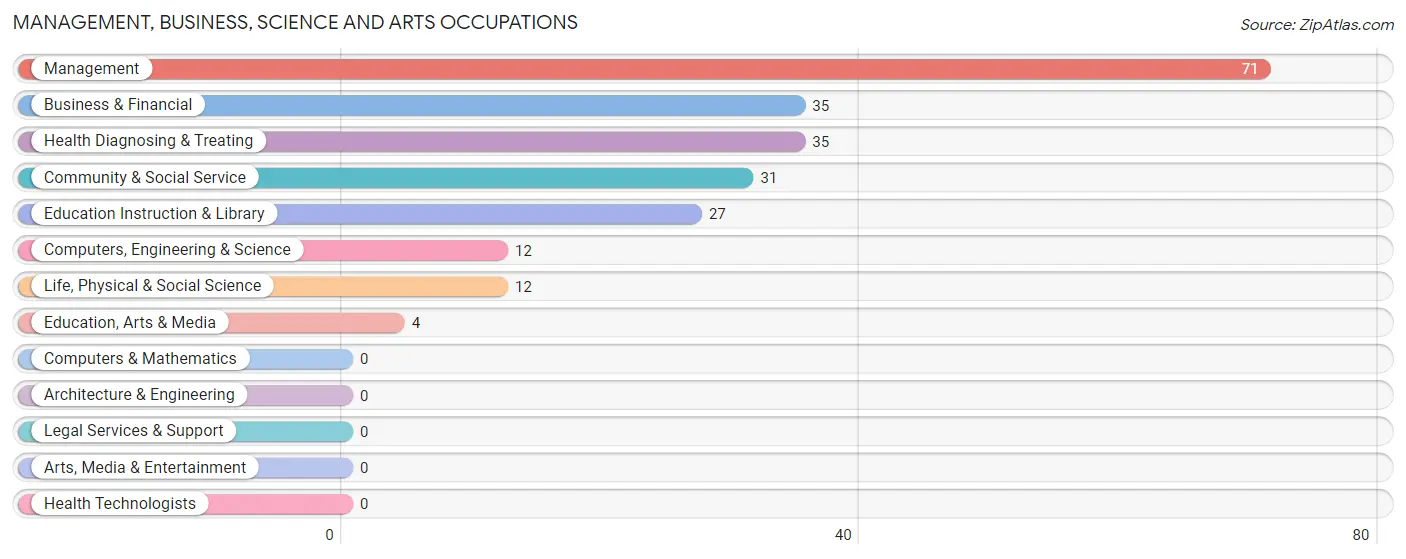
Management, Business, Science and Arts Occupations
The most common Management, Business, Science and Arts occupations in Bowling Green are Management (71 | 12.5%), Business & Financial (35 | 6.1%), Health Diagnosing & Treating (35 | 6.1%), Community & Social Service (31 | 5.4%), and Education Instruction & Library (27 | 4.7%).
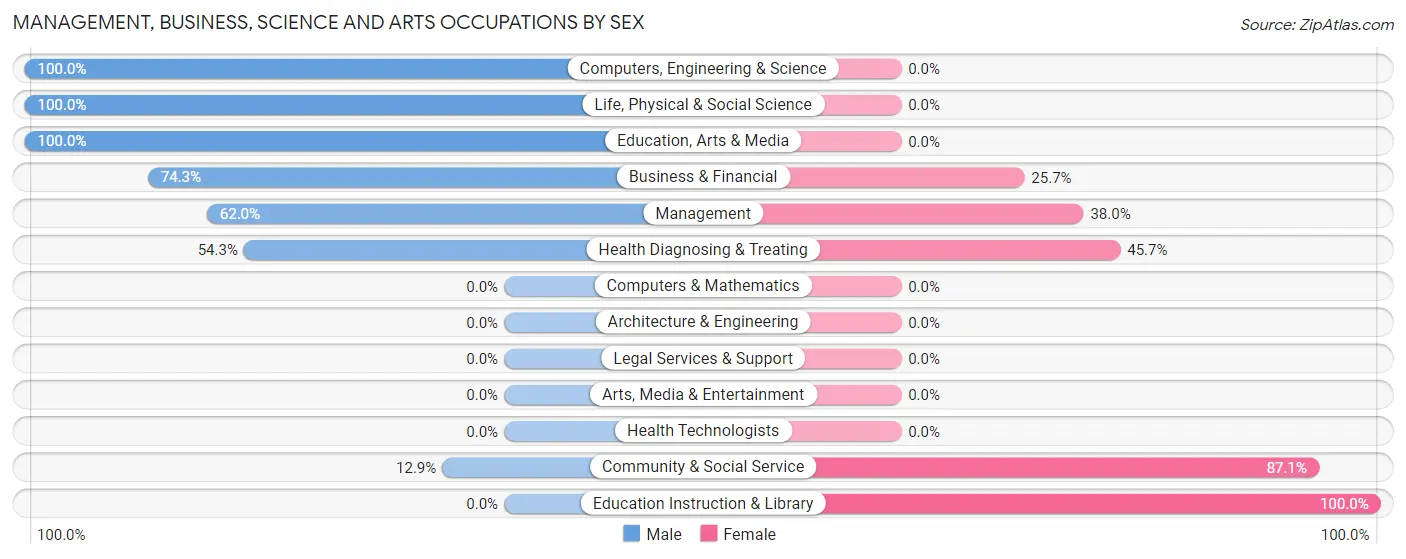
Management, Business, Science and Arts Occupations by Sex
Within the Management, Business, Science and Arts occupations in Bowling Green, the most male-oriented occupations are Computers, Engineering & Science (100.0%), Life, Physical & Social Science (100.0%), and Education, Arts & Media (100.0%), while the most female-oriented occupations are Education Instruction & Library (100.0%), Community & Social Service (87.1%), and Health Diagnosing & Treating (45.7%).
| Occupation | Male | Female |
| Management | 44 (62.0%) | 27 (38.0%) |
| Business & Financial | 26 (74.3%) | 9 (25.7%) |
| Computers, Engineering & Science | 12 (100.0%) | 0 (0.0%) |
| Computers & Mathematics | 0 (0.0%) | 0 (0.0%) |
| Architecture & Engineering | 0 (0.0%) | 0 (0.0%) |
| Life, Physical & Social Science | 12 (100.0%) | 0 (0.0%) |
| Community & Social Service | 4 (12.9%) | 27 (87.1%) |
| Education, Arts & Media | 4 (100.0%) | 0 (0.0%) |
| Legal Services & Support | 0 (0.0%) | 0 (0.0%) |
| Education Instruction & Library | 0 (0.0%) | 27 (100.0%) |
| Arts, Media & Entertainment | 0 (0.0%) | 0 (0.0%) |
| Health Diagnosing & Treating | 19 (54.3%) | 16 (45.7%) |
| Health Technologists | 0 (0.0%) | 0 (0.0%) |
| Total (Category) | 105 (57.1%) | 79 (42.9%) |
| Total (Overall) | 345 (60.5%) | 225 (39.5%) |
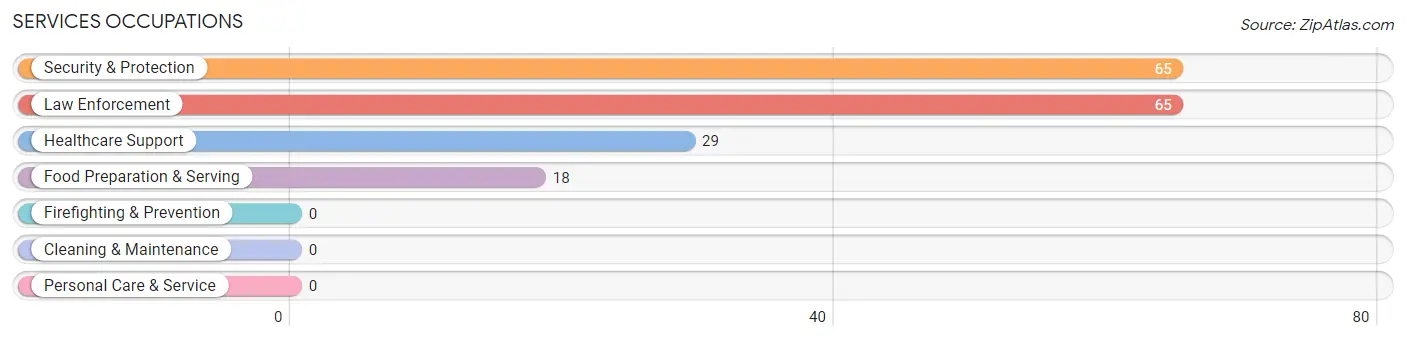
Services Occupations
The most common Services occupations in Bowling Green are Security & Protection (65 | 11.4%), Law Enforcement (65 | 11.4%), Healthcare Support (29 | 5.1%), and Food Preparation & Serving (18 | 3.2%).
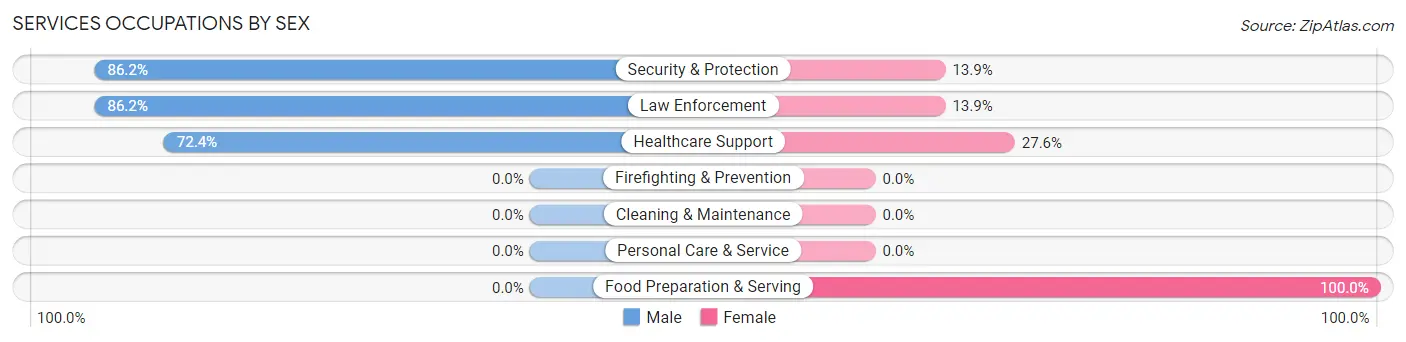
Services Occupations by Sex
Within the Services occupations in Bowling Green, the most male-oriented occupations are Security & Protection (86.2%), Law Enforcement (86.2%), and Healthcare Support (72.4%), while the most female-oriented occupations are Food Preparation & Serving (100.0%), Healthcare Support (27.6%), and Security & Protection (13.9%).
| Occupation | Male | Female |
| Healthcare Support | 21 (72.4%) | 8 (27.6%) |
| Security & Protection | 56 (86.2%) | 9 (13.9%) |
| Firefighting & Prevention | 0 (0.0%) | 0 (0.0%) |
| Law Enforcement | 56 (86.2%) | 9 (13.9%) |
| Food Preparation & Serving | 0 (0.0%) | 18 (100.0%) |
| Cleaning & Maintenance | 0 (0.0%) | 0 (0.0%) |
| Personal Care & Service | 0 (0.0%) | 0 (0.0%) |
| Total (Category) | 77 (68.8%) | 35 (31.2%) |
| Total (Overall) | 345 (60.5%) | 225 (39.5%) |
Sales and Office Occupations
The most common Sales and Office occupations in Bowling Green are Office & Administration (108 | 19.0%), and Sales & Related (77 | 13.5%).
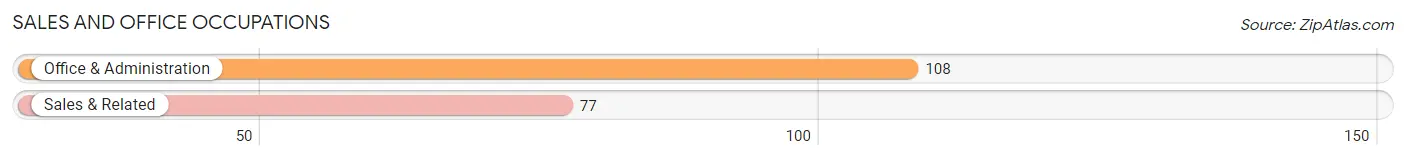
Sales and Office Occupations by Sex
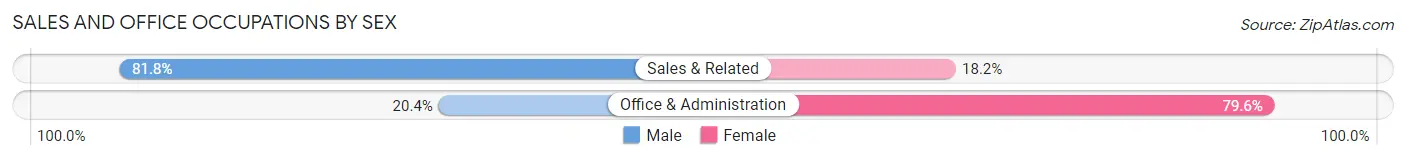
| Occupation | Male | Female |
| Sales & Related | 63 (81.8%) | 14 (18.2%) |
| Office & Administration | 22 (20.4%) | 86 (79.6%) |
| Total (Category) | 85 (46.0%) | 100 (54.0%) |
| Total (Overall) | 345 (60.5%) | 225 (39.5%) |
Natural Resources, Construction and Maintenance Occupations
The most common Natural Resources, Construction and Maintenance occupations in Bowling Green are Construction & Extraction (40 | 7.0%), Installation, Maintenance & Repair (9 | 1.6%), and Farming, Fishing & Forestry (2 | 0.4%).
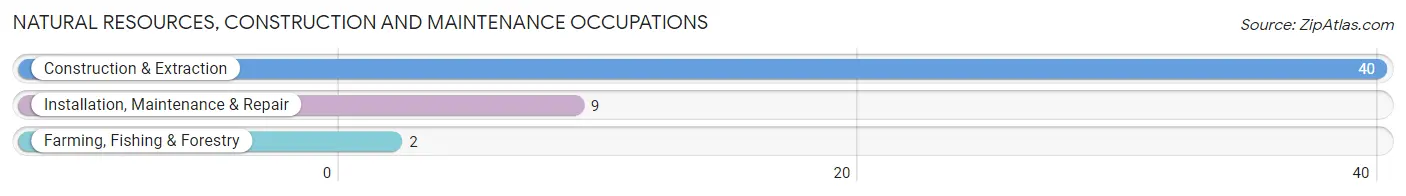
Natural Resources, Construction and Maintenance Occupations by Sex
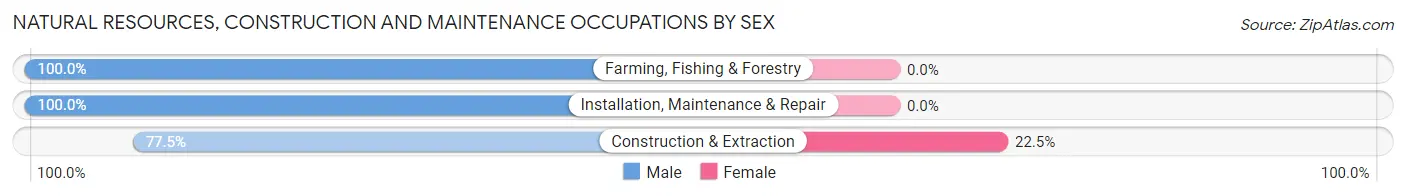
| Occupation | Male | Female |
| Farming, Fishing & Forestry | 2 (100.0%) | 0 (0.0%) |
| Construction & Extraction | 31 (77.5%) | 9 (22.5%) |
| Installation, Maintenance & Repair | 9 (100.0%) | 0 (0.0%) |
| Total (Category) | 42 (82.4%) | 9 (17.6%) |
| Total (Overall) | 345 (60.5%) | 225 (39.5%) |
Production, Transportation and Moving Occupations
The most common Production, Transportation and Moving occupations in Bowling Green are Production (37 | 6.5%), and Material Moving (1 | 0.2%).
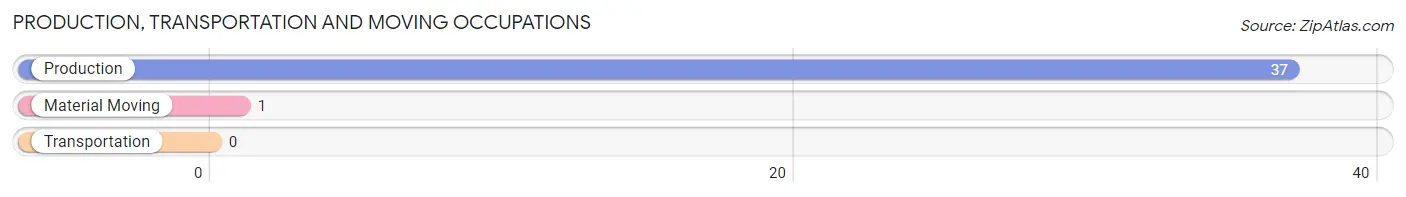
Production, Transportation and Moving Occupations by Sex
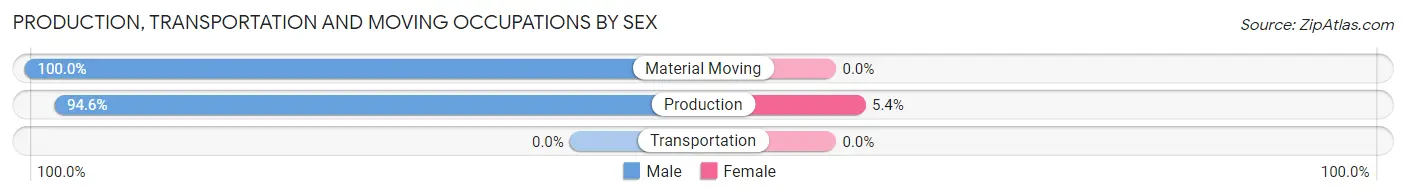
| Occupation | Male | Female |
| Production | 35 (94.6%) | 2 (5.4%) |
| Transportation | 0 (0.0%) | 0 (0.0%) |
| Material Moving | 1 (100.0%) | 0 (0.0%) |
| Total (Category) | 36 (94.7%) | 2 (5.3%) |
| Total (Overall) | 345 (60.5%) | 225 (39.5%) |
Employment Industries by Sex in Bowling Green
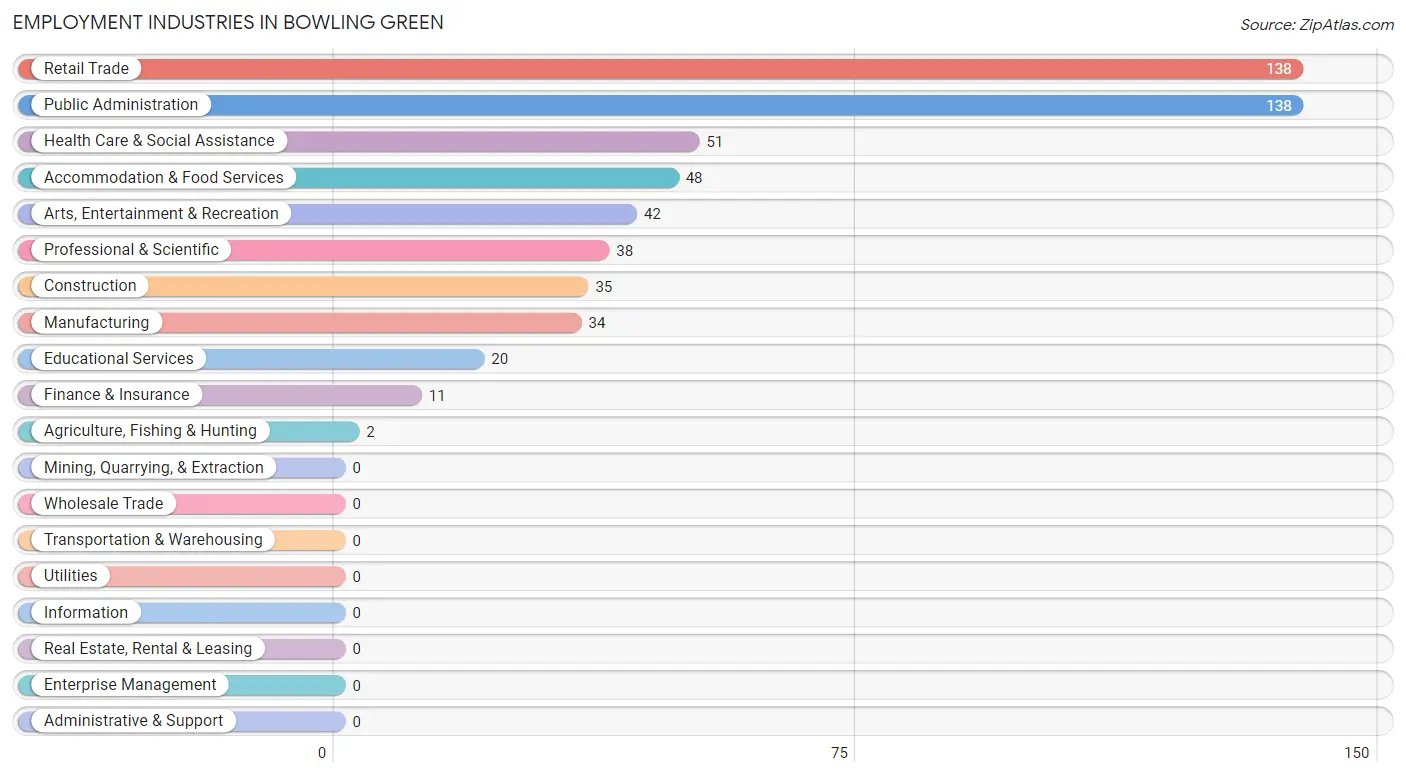
Employment Industries in Bowling Green
The major employment industries in Bowling Green include Retail Trade (138 | 24.2%), Public Administration (138 | 24.2%), Health Care & Social Assistance (51 | 8.9%), Accommodation & Food Services (48 | 8.4%), and Arts, Entertainment & Recreation (42 | 7.4%).
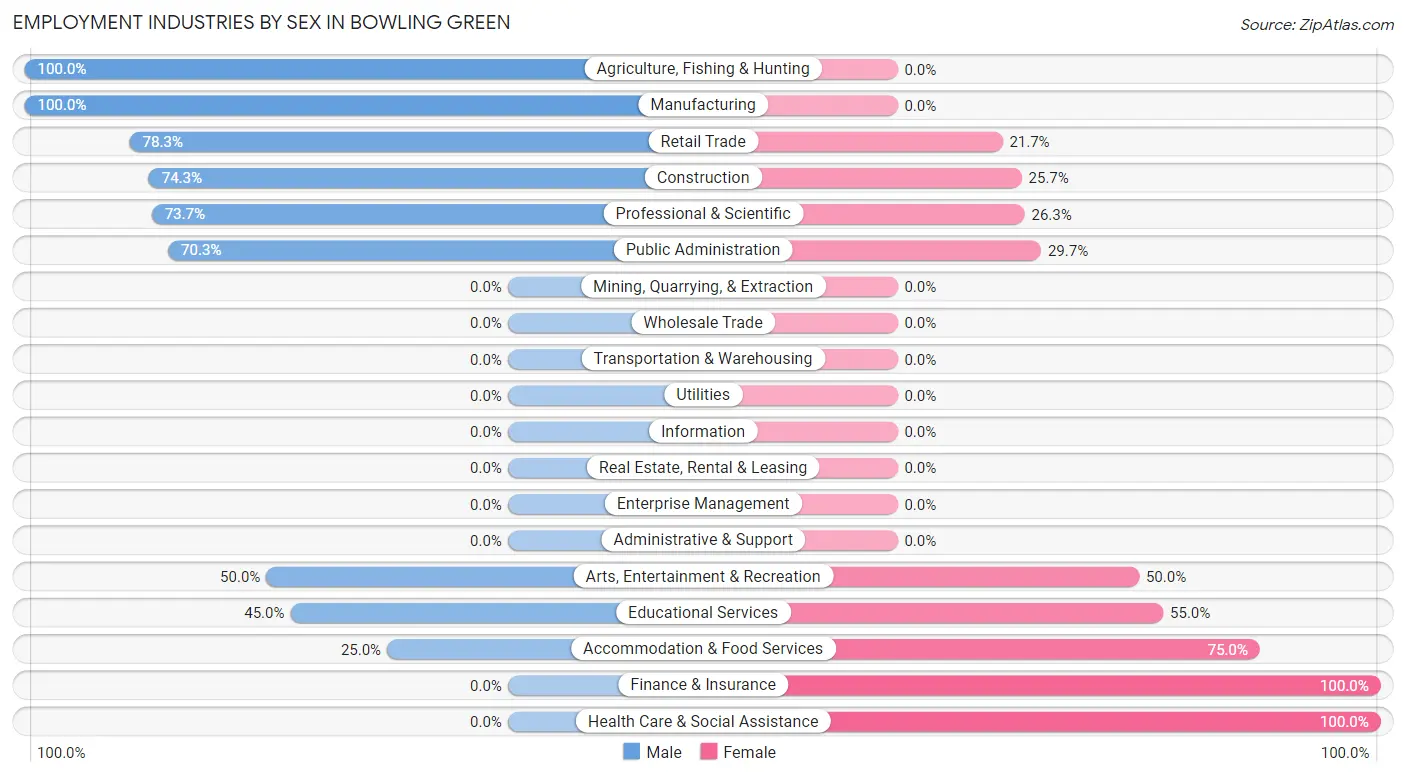
Employment Industries by Sex in Bowling Green
The Bowling Green industries that see more men than women are Agriculture, Fishing & Hunting (100.0%), Manufacturing (100.0%), and Retail Trade (78.3%), whereas the industries that tend to have a higher number of women are Finance & Insurance (100.0%), Health Care & Social Assistance (100.0%), and Accommodation & Food Services (75.0%).
| Industry | Male | Female |
| Agriculture, Fishing & Hunting | 2 (100.0%) | 0 (0.0%) |
| Mining, Quarrying, & Extraction | 0 (0.0%) | 0 (0.0%) |
| Construction | 26 (74.3%) | 9 (25.7%) |
| Manufacturing | 34 (100.0%) | 0 (0.0%) |
| Wholesale Trade | 0 (0.0%) | 0 (0.0%) |
| Retail Trade | 108 (78.3%) | 30 (21.7%) |
| Transportation & Warehousing | 0 (0.0%) | 0 (0.0%) |
| Utilities | 0 (0.0%) | 0 (0.0%) |
| Information | 0 (0.0%) | 0 (0.0%) |
| Finance & Insurance | 0 (0.0%) | 11 (100.0%) |
| Real Estate, Rental & Leasing | 0 (0.0%) | 0 (0.0%) |
| Professional & Scientific | 28 (73.7%) | 10 (26.3%) |
| Enterprise Management | 0 (0.0%) | 0 (0.0%) |
| Administrative & Support | 0 (0.0%) | 0 (0.0%) |
| Educational Services | 9 (45.0%) | 11 (55.0%) |
| Health Care & Social Assistance | 0 (0.0%) | 51 (100.0%) |
| Arts, Entertainment & Recreation | 21 (50.0%) | 21 (50.0%) |
| Accommodation & Food Services | 12 (25.0%) | 36 (75.0%) |
| Public Administration | 97 (70.3%) | 41 (29.7%) |
| Total | 345 (60.5%) | 225 (39.5%) |
Education in Bowling Green
School Enrollment in Bowling Green
The most common levels of schooling among the 202 students in Bowling Green are high school (102 | 50.5%), elementary school (31 | 15.3%), and college / undergraduate (28 | 13.9%).
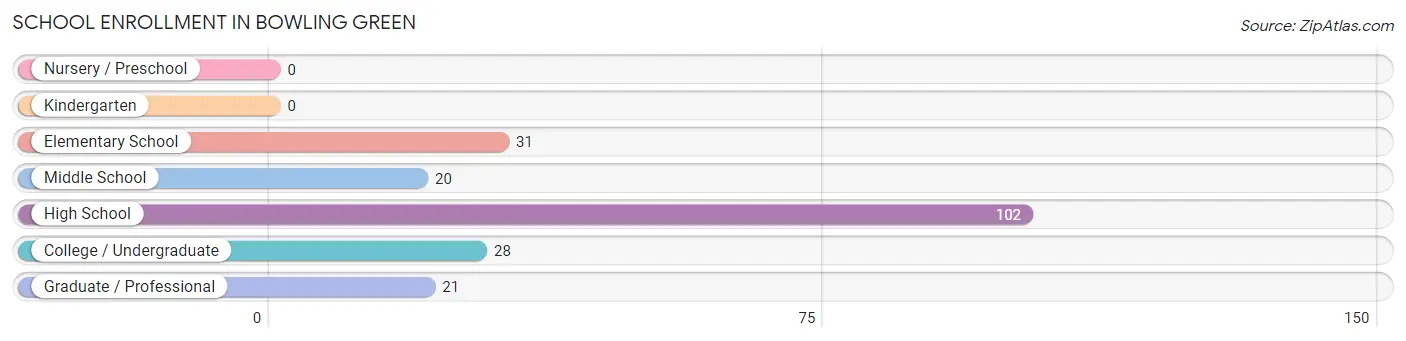
| School Level | # Students | % Students |
| Nursery / Preschool | 0 | 0.0% |
| Kindergarten | 0 | 0.0% |
| Elementary School | 31 | 15.3% |
| Middle School | 20 | 9.9% |
| High School | 102 | 50.5% |
| College / Undergraduate | 28 | 13.9% |
| Graduate / Professional | 21 | 10.4% |
| Total | 202 | 100.0% |
School Enrollment by Age by Funding Source in Bowling Green
Out of a total of 202 students who are enrolled in schools in Bowling Green, 62 (30.7%) attend a private institution, while the remaining 140 (69.3%) are enrolled in public schools. The age group of 5 to 9 year old has the highest likelihood of being enrolled in private schools, with 12 (63.2% in the age bracket) enrolled. Conversely, the age group of 18 to 19 year olds has the lowest likelihood of being enrolled in a private school, with 9 (100.0% in the age bracket) attending a public institution.
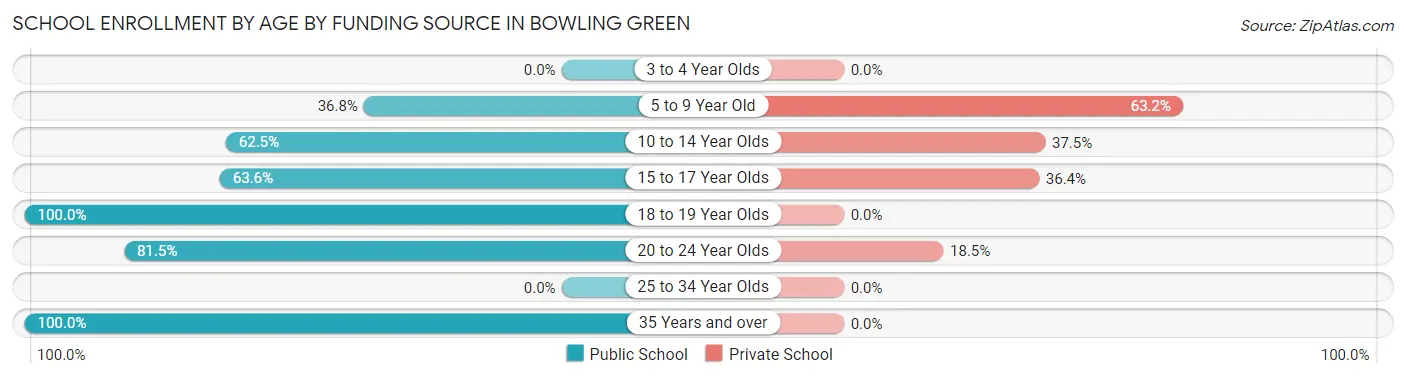
| Age Bracket | Public School | Private School |
| 3 to 4 Year Olds | 0 (0.0%) | 0 (0.0%) |
| 5 to 9 Year Old | 7 (36.8%) | 12 (63.2%) |
| 10 to 14 Year Olds | 20 (62.5%) | 12 (37.5%) |
| 15 to 17 Year Olds | 49 (63.6%) | 28 (36.4%) |
| 18 to 19 Year Olds | 9 (100.0%) | 0 (0.0%) |
| 20 to 24 Year Olds | 44 (81.5%) | 10 (18.5%) |
| 25 to 34 Year Olds | 0 (0.0%) | 0 (0.0%) |
| 35 Years and over | 11 (100.0%) | 0 (0.0%) |
| Total | 140 (69.3%) | 62 (30.7%) |
Educational Attainment by Field of Study in Bowling Green
Liberal arts & history (36 | 23.4%), education (33 | 21.4%), communications (23 | 14.9%), computers & mathematics (12 | 7.8%), and literature & languages (11 | 7.1%) are the most common fields of study among 154 individuals in Bowling Green who have obtained a bachelor's degree or higher.
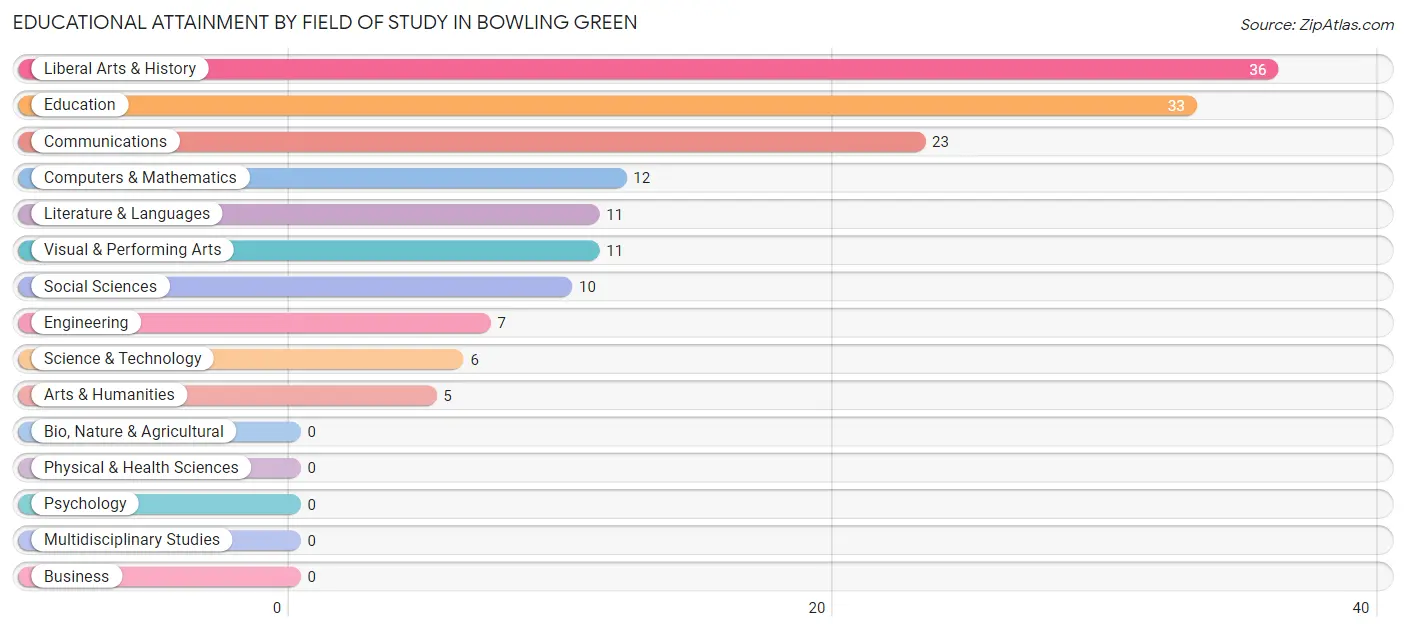
| Field of Study | # Graduates | % Graduates |
| Computers & Mathematics | 12 | 7.8% |
| Bio, Nature & Agricultural | 0 | 0.0% |
| Physical & Health Sciences | 0 | 0.0% |
| Psychology | 0 | 0.0% |
| Social Sciences | 10 | 6.5% |
| Engineering | 7 | 4.5% |
| Multidisciplinary Studies | 0 | 0.0% |
| Science & Technology | 6 | 3.9% |
| Business | 0 | 0.0% |
| Education | 33 | 21.4% |
| Literature & Languages | 11 | 7.1% |
| Liberal Arts & History | 36 | 23.4% |
| Visual & Performing Arts | 11 | 7.1% |
| Communications | 23 | 14.9% |
| Arts & Humanities | 5 | 3.3% |
| Total | 154 | 100.0% |
Transportation & Commute in Bowling Green
Vehicle Availability by Sex in Bowling Green
The most prevalent vehicle ownership categories in Bowling Green are males with 2 vehicles (267, accounting for 77.6%) and females with 2 vehicles (118, making up 118.7%).
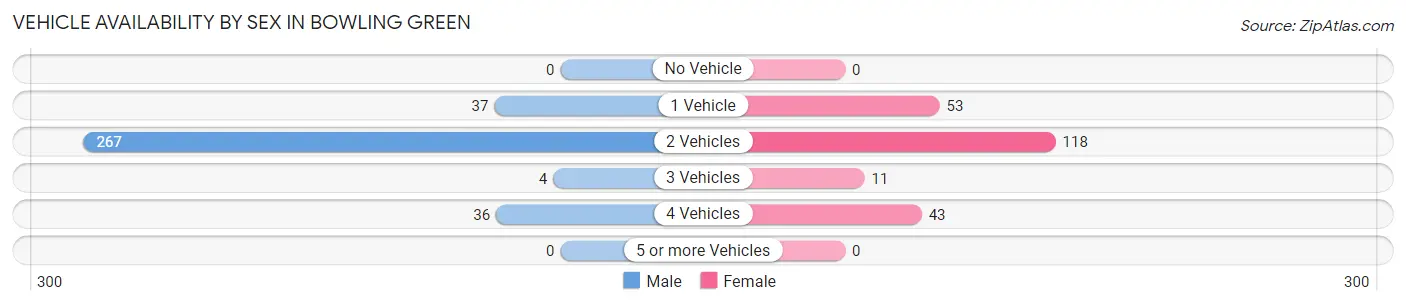
| Vehicles Available | Male | Female |
| No Vehicle | 0 (0.0%) | 0 (0.0%) |
| 1 Vehicle | 37 (10.8%) | 53 (23.6%) |
| 2 Vehicles | 267 (77.6%) | 118 (52.4%) |
| 3 Vehicles | 4 (1.2%) | 11 (4.9%) |
| 4 Vehicles | 36 (10.5%) | 43 (19.1%) |
| 5 or more Vehicles | 0 (0.0%) | 0 (0.0%) |
| Total | 344 (100.0%) | 225 (100.0%) |
Commute Time in Bowling Green
The most frequently occuring commute durations in Bowling Green are 15 to 19 minutes (211 commuters, 43.2%), 5 to 9 minutes (75 commuters, 15.4%), and 10 to 14 minutes (70 commuters, 14.3%).
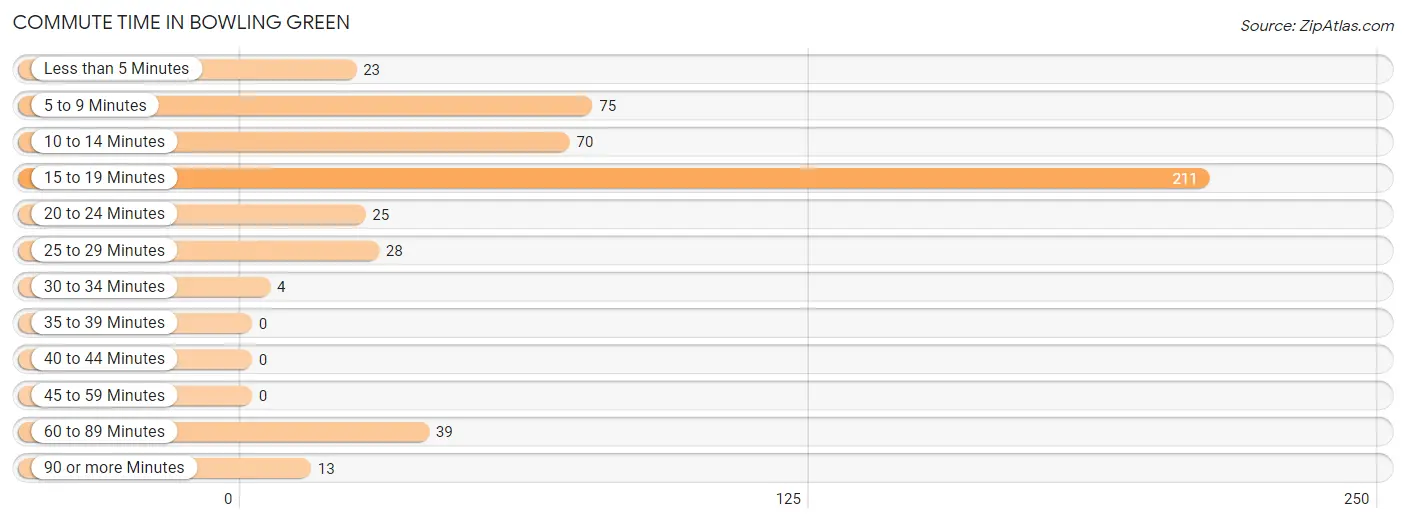
| Commute Time | # Commuters | % Commuters |
| Less than 5 Minutes | 23 | 4.7% |
| 5 to 9 Minutes | 75 | 15.4% |
| 10 to 14 Minutes | 70 | 14.3% |
| 15 to 19 Minutes | 211 | 43.2% |
| 20 to 24 Minutes | 25 | 5.1% |
| 25 to 29 Minutes | 28 | 5.7% |
| 30 to 34 Minutes | 4 | 0.8% |
| 35 to 39 Minutes | 0 | 0.0% |
| 40 to 44 Minutes | 0 | 0.0% |
| 45 to 59 Minutes | 0 | 0.0% |
| 60 to 89 Minutes | 39 | 8.0% |
| 90 or more Minutes | 13 | 2.7% |
Commute Time by Sex in Bowling Green
The most common commute times in Bowling Green are 15 to 19 minutes (133 commuters, 42.1%) for males and 15 to 19 minutes (78 commuters, 45.4%) for females.
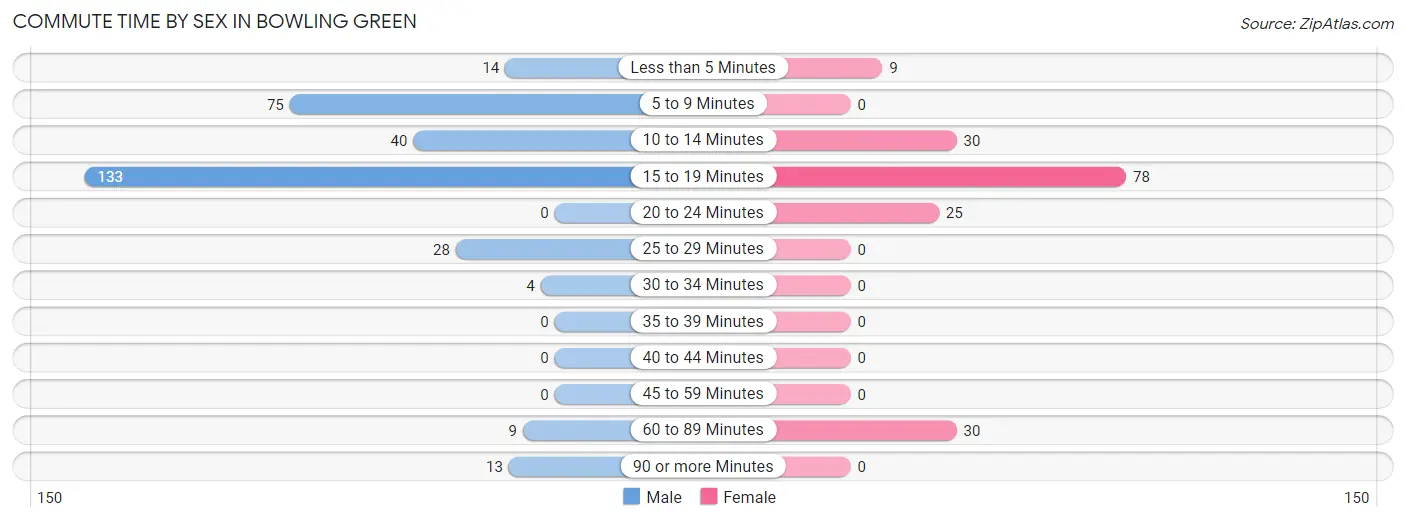
| Commute Time | Male | Female |
| Less than 5 Minutes | 14 (4.4%) | 9 (5.2%) |
| 5 to 9 Minutes | 75 (23.7%) | 0 (0.0%) |
| 10 to 14 Minutes | 40 (12.7%) | 30 (17.4%) |
| 15 to 19 Minutes | 133 (42.1%) | 78 (45.4%) |
| 20 to 24 Minutes | 0 (0.0%) | 25 (14.5%) |
| 25 to 29 Minutes | 28 (8.9%) | 0 (0.0%) |
| 30 to 34 Minutes | 4 (1.3%) | 0 (0.0%) |
| 35 to 39 Minutes | 0 (0.0%) | 0 (0.0%) |
| 40 to 44 Minutes | 0 (0.0%) | 0 (0.0%) |
| 45 to 59 Minutes | 0 (0.0%) | 0 (0.0%) |
| 60 to 89 Minutes | 9 (2.9%) | 30 (17.4%) |
| 90 or more Minutes | 13 (4.1%) | 0 (0.0%) |
Time of Departure to Work by Sex in Bowling Green
The most frequent times of departure to work in Bowling Green are 7:00 AM to 7:29 AM (90, 28.5%) for males and 8:00 AM to 8:29 AM (41, 23.8%) for females.
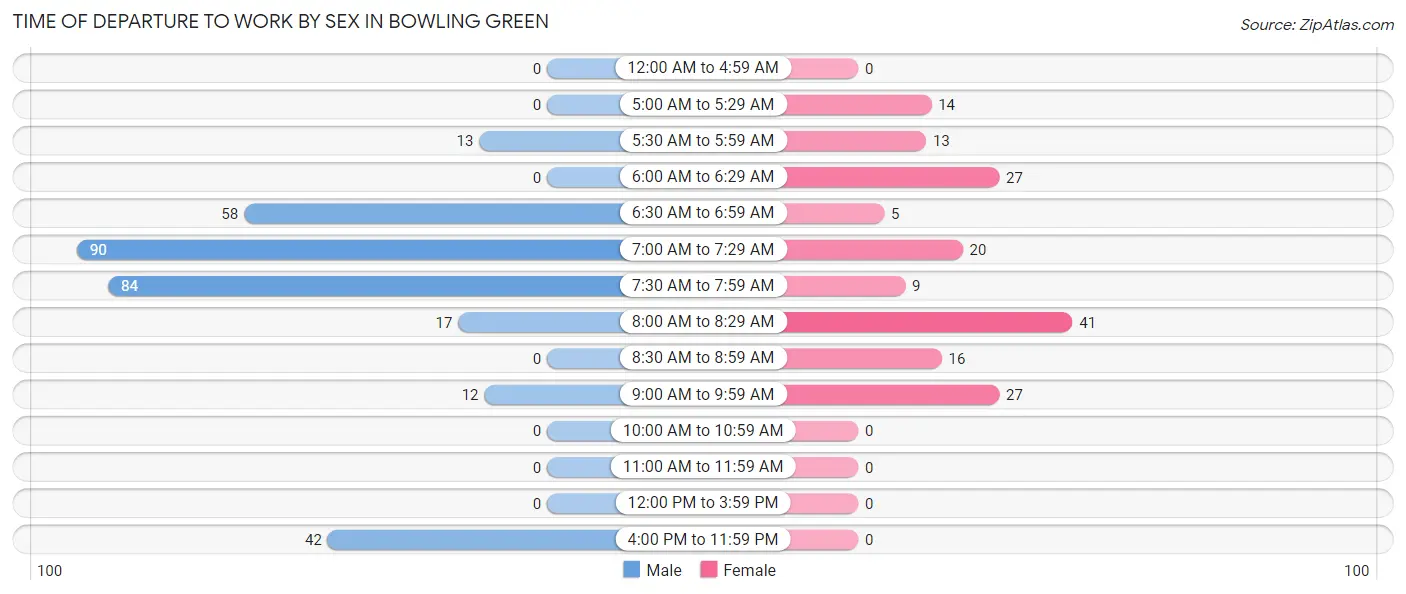
| Time of Departure | Male | Female |
| 12:00 AM to 4:59 AM | 0 (0.0%) | 0 (0.0%) |
| 5:00 AM to 5:29 AM | 0 (0.0%) | 14 (8.1%) |
| 5:30 AM to 5:59 AM | 13 (4.1%) | 13 (7.6%) |
| 6:00 AM to 6:29 AM | 0 (0.0%) | 27 (15.7%) |
| 6:30 AM to 6:59 AM | 58 (18.3%) | 5 (2.9%) |
| 7:00 AM to 7:29 AM | 90 (28.5%) | 20 (11.6%) |
| 7:30 AM to 7:59 AM | 84 (26.6%) | 9 (5.2%) |
| 8:00 AM to 8:29 AM | 17 (5.4%) | 41 (23.8%) |
| 8:30 AM to 8:59 AM | 0 (0.0%) | 16 (9.3%) |
| 9:00 AM to 9:59 AM | 12 (3.8%) | 27 (15.7%) |
| 10:00 AM to 10:59 AM | 0 (0.0%) | 0 (0.0%) |
| 11:00 AM to 11:59 AM | 0 (0.0%) | 0 (0.0%) |
| 12:00 PM to 3:59 PM | 0 (0.0%) | 0 (0.0%) |
| 4:00 PM to 11:59 PM | 42 (13.3%) | 0 (0.0%) |
| Total | 316 (100.0%) | 172 (100.0%) |
Housing Occupancy in Bowling Green
Occupancy by Ownership in Bowling Green
Of the total 560 dwellings in Bowling Green, owner-occupied units account for 308 (55.0%), while renter-occupied units make up 252 (45.0%).
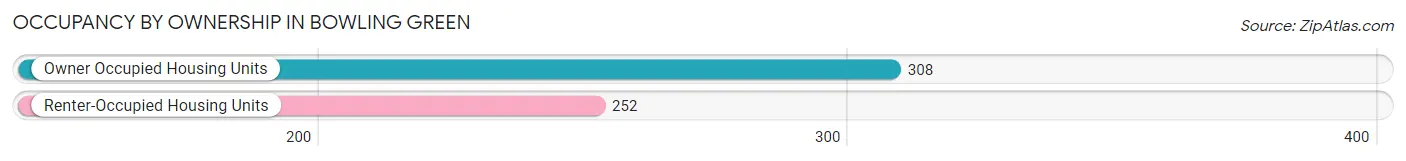
| Occupancy | # Housing Units | % Housing Units |
| Owner Occupied Housing Units | 308 | 55.0% |
| Renter-Occupied Housing Units | 252 | 45.0% |
| Total Occupied Housing Units | 560 | 100.0% |
Occupancy by Household Size in Bowling Green
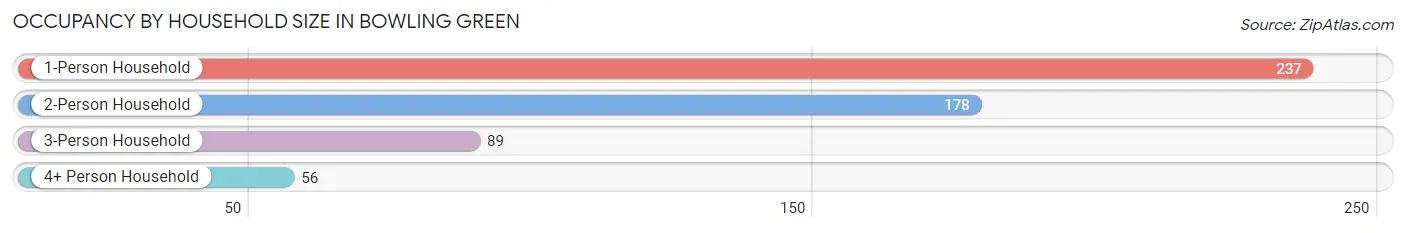
| Household Size | # Housing Units | % Housing Units |
| 1-Person Household | 237 | 42.3% |
| 2-Person Household | 178 | 31.8% |
| 3-Person Household | 89 | 15.9% |
| 4+ Person Household | 56 | 10.0% |
| Total Housing Units | 560 | 100.0% |
Occupancy by Ownership by Household Size in Bowling Green
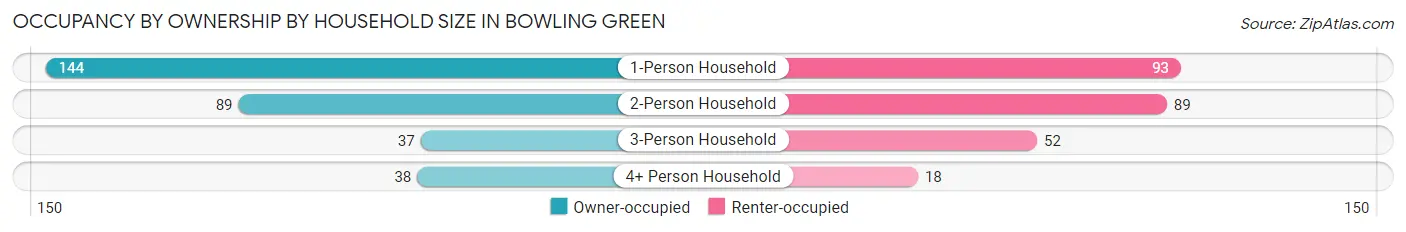
| Household Size | Owner-occupied | Renter-occupied |
| 1-Person Household | 144 (60.8%) | 93 (39.2%) |
| 2-Person Household | 89 (50.0%) | 89 (50.0%) |
| 3-Person Household | 37 (41.6%) | 52 (58.4%) |
| 4+ Person Household | 38 (67.9%) | 18 (32.1%) |
| Total Housing Units | 308 (55.0%) | 252 (45.0%) |
Occupancy by Educational Attainment in Bowling Green
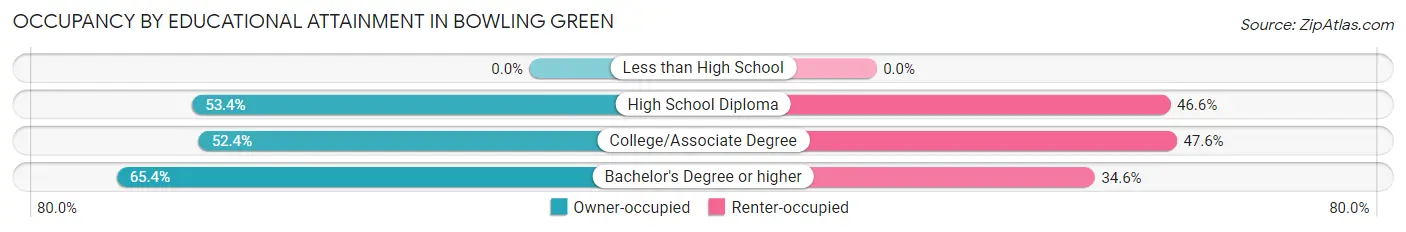
| Household Size | Owner-occupied | Renter-occupied |
| Less than High School | 0 (0.0%) | 0 (0.0%) |
| High School Diploma | 63 (53.4%) | 55 (46.6%) |
| College/Associate Degree | 177 (52.4%) | 161 (47.6%) |
| Bachelor's Degree or higher | 68 (65.4%) | 36 (34.6%) |
Occupancy by Age of Householder in Bowling Green
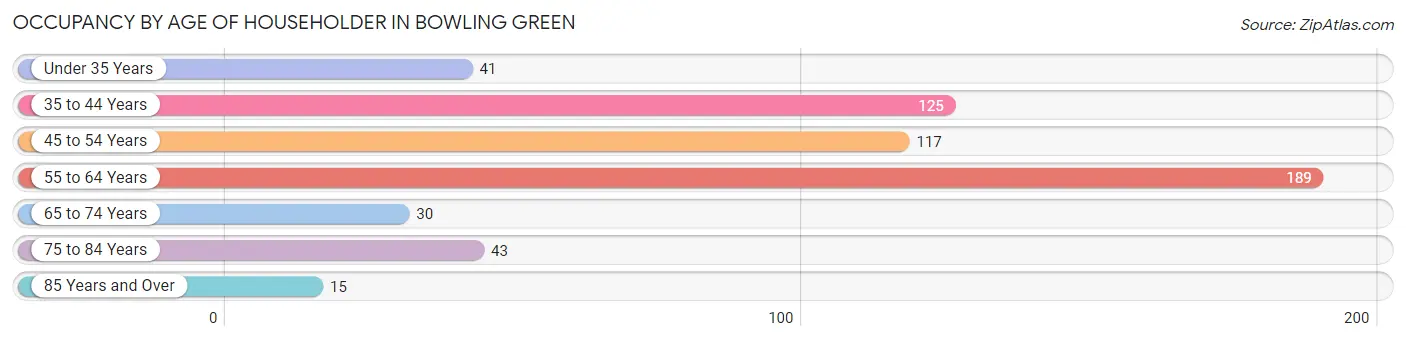
| Age Bracket | # Households | % Households |
| Under 35 Years | 41 | 7.3% |
| 35 to 44 Years | 125 | 22.3% |
| 45 to 54 Years | 117 | 20.9% |
| 55 to 64 Years | 189 | 33.8% |
| 65 to 74 Years | 30 | 5.4% |
| 75 to 84 Years | 43 | 7.7% |
| 85 Years and Over | 15 | 2.7% |
| Total | 560 | 100.0% |
Housing Finances in Bowling Green
Median Income by Occupancy in Bowling Green
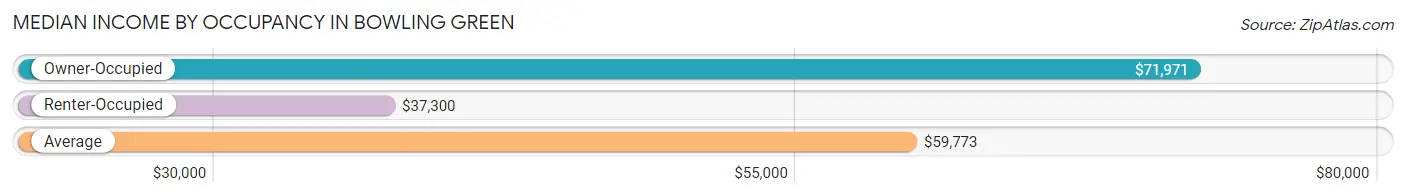
| Occupancy Type | # Households | Median Income |
| Owner-Occupied | 308 (55.0%) | $71,971 |
| Renter-Occupied | 252 (45.0%) | $37,300 |
| Average | 560 (100.0%) | $59,773 |
Occupancy by Householder Income Bracket in Bowling Green
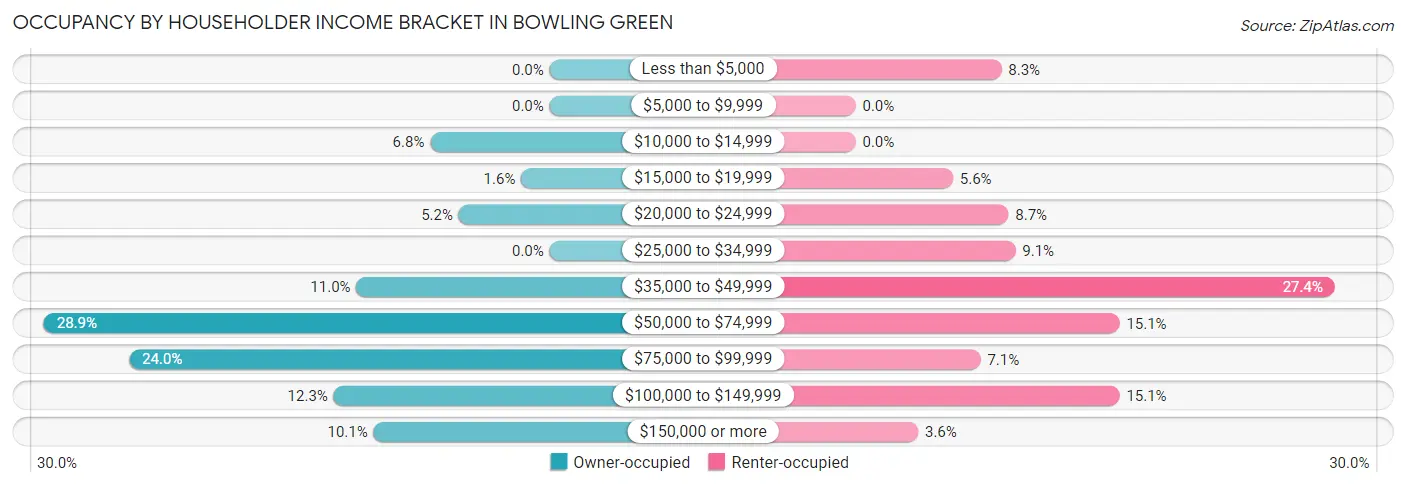
| Income Bracket | Owner-occupied | Renter-occupied |
| Less than $5,000 | 0 (0.0%) | 21 (8.3%) |
| $5,000 to $9,999 | 0 (0.0%) | 0 (0.0%) |
| $10,000 to $14,999 | 21 (6.8%) | 0 (0.0%) |
| $15,000 to $19,999 | 5 (1.6%) | 14 (5.6%) |
| $20,000 to $24,999 | 16 (5.2%) | 22 (8.7%) |
| $25,000 to $34,999 | 0 (0.0%) | 23 (9.1%) |
| $35,000 to $49,999 | 34 (11.0%) | 69 (27.4%) |
| $50,000 to $74,999 | 89 (28.9%) | 38 (15.1%) |
| $75,000 to $99,999 | 74 (24.0%) | 18 (7.1%) |
| $100,000 to $149,999 | 38 (12.3%) | 38 (15.1%) |
| $150,000 or more | 31 (10.1%) | 9 (3.6%) |
| Total | 308 (100.0%) | 252 (100.0%) |
Monthly Housing Cost Tiers in Bowling Green
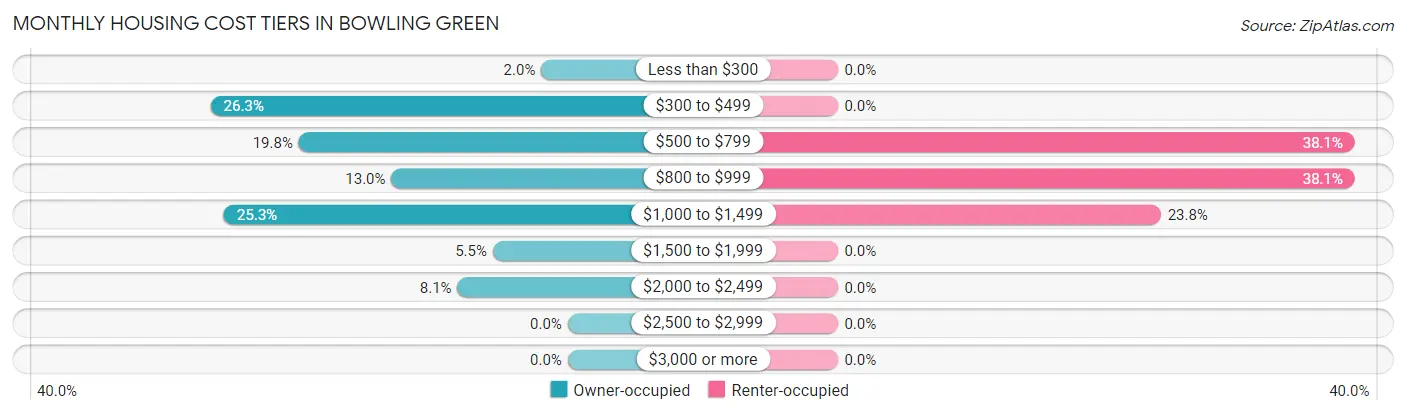
| Monthly Cost | Owner-occupied | Renter-occupied |
| Less than $300 | 6 (1.9%) | 0 (0.0%) |
| $300 to $499 | 81 (26.3%) | 0 (0.0%) |
| $500 to $799 | 61 (19.8%) | 96 (38.1%) |
| $800 to $999 | 40 (13.0%) | 96 (38.1%) |
| $1,000 to $1,499 | 78 (25.3%) | 60 (23.8%) |
| $1,500 to $1,999 | 17 (5.5%) | 0 (0.0%) |
| $2,000 to $2,499 | 25 (8.1%) | 0 (0.0%) |
| $2,500 to $2,999 | 0 (0.0%) | 0 (0.0%) |
| $3,000 or more | 0 (0.0%) | 0 (0.0%) |
| Total | 308 (100.0%) | 252 (100.0%) |
Physical Housing Characteristics in Bowling Green
Housing Structures in Bowling Green
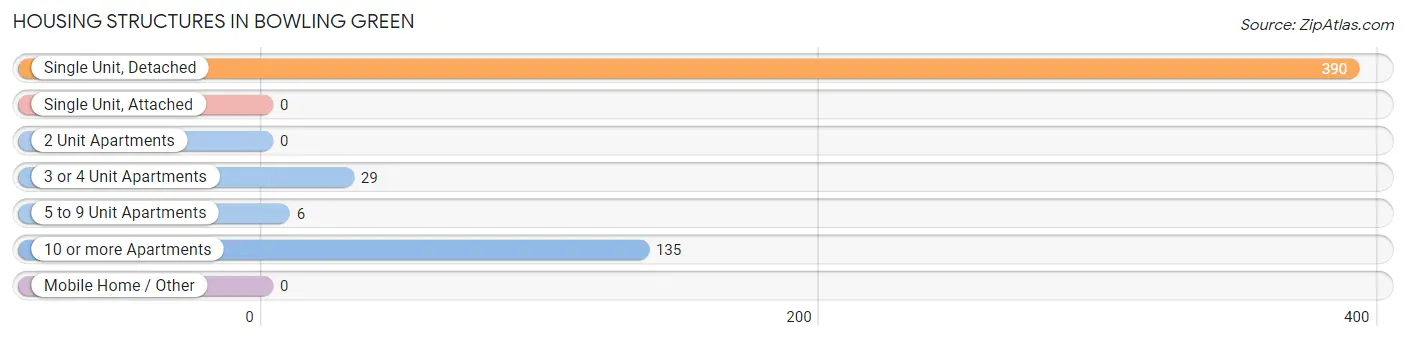
| Structure Type | # Housing Units | % Housing Units |
| Single Unit, Detached | 390 | 69.6% |
| Single Unit, Attached | 0 | 0.0% |
| 2 Unit Apartments | 0 | 0.0% |
| 3 or 4 Unit Apartments | 29 | 5.2% |
| 5 to 9 Unit Apartments | 6 | 1.1% |
| 10 or more Apartments | 135 | 24.1% |
| Mobile Home / Other | 0 | 0.0% |
| Total | 560 | 100.0% |
Housing Structures by Occupancy in Bowling Green
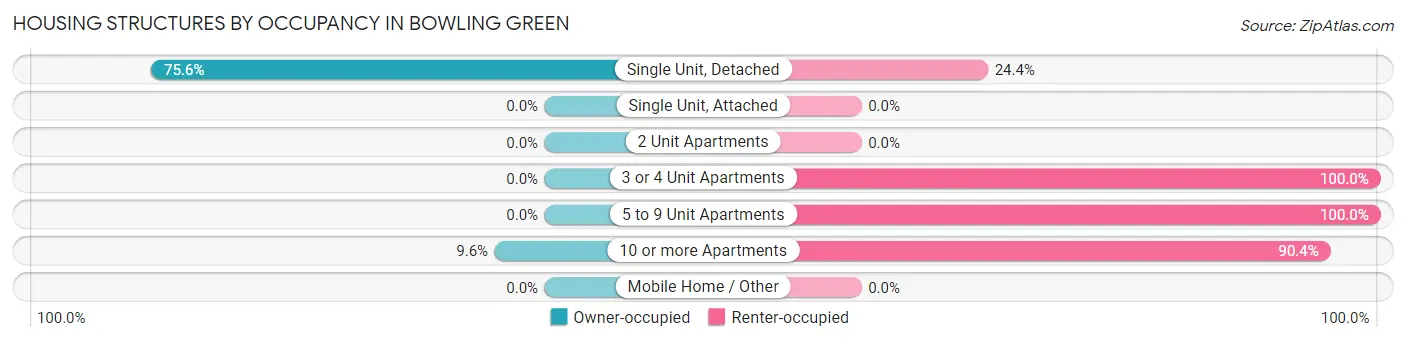
| Structure Type | Owner-occupied | Renter-occupied |
| Single Unit, Detached | 295 (75.6%) | 95 (24.4%) |
| Single Unit, Attached | 0 (0.0%) | 0 (0.0%) |
| 2 Unit Apartments | 0 (0.0%) | 0 (0.0%) |
| 3 or 4 Unit Apartments | 0 (0.0%) | 29 (100.0%) |
| 5 to 9 Unit Apartments | 0 (0.0%) | 6 (100.0%) |
| 10 or more Apartments | 13 (9.6%) | 122 (90.4%) |
| Mobile Home / Other | 0 (0.0%) | 0 (0.0%) |
| Total | 308 (55.0%) | 252 (45.0%) |
Housing Structures by Number of Rooms in Bowling Green
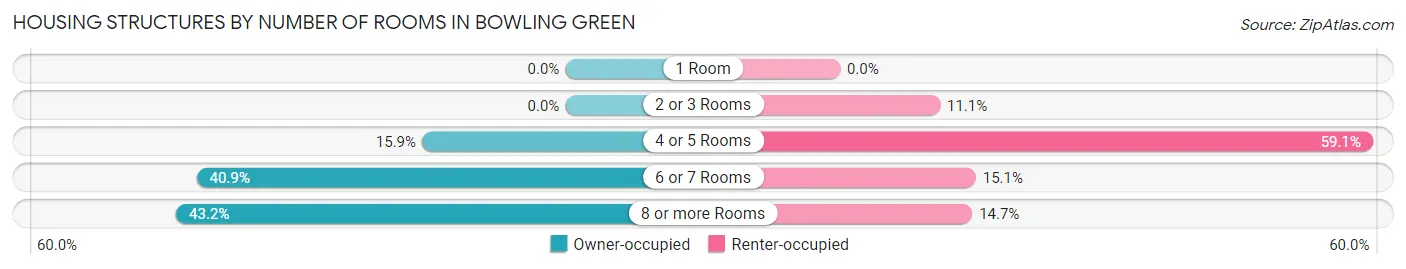
| Number of Rooms | Owner-occupied | Renter-occupied |
| 1 Room | 0 (0.0%) | 0 (0.0%) |
| 2 or 3 Rooms | 0 (0.0%) | 28 (11.1%) |
| 4 or 5 Rooms | 49 (15.9%) | 149 (59.1%) |
| 6 or 7 Rooms | 126 (40.9%) | 38 (15.1%) |
| 8 or more Rooms | 133 (43.2%) | 37 (14.7%) |
| Total | 308 (100.0%) | 252 (100.0%) |
Housing Structure by Heating Type in Bowling Green
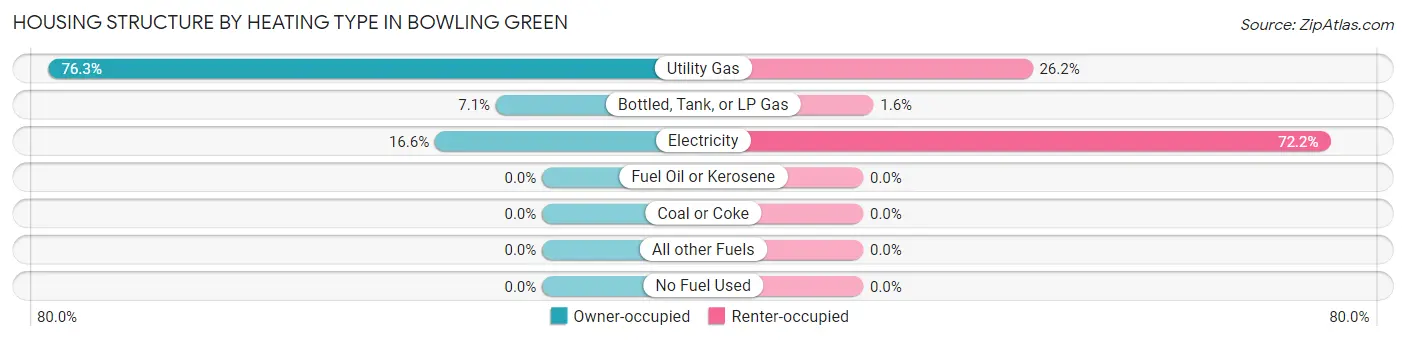
| Heating Type | Owner-occupied | Renter-occupied |
| Utility Gas | 235 (76.3%) | 66 (26.2%) |
| Bottled, Tank, or LP Gas | 22 (7.1%) | 4 (1.6%) |
| Electricity | 51 (16.6%) | 182 (72.2%) |
| Fuel Oil or Kerosene | 0 (0.0%) | 0 (0.0%) |
| Coal or Coke | 0 (0.0%) | 0 (0.0%) |
| All other Fuels | 0 (0.0%) | 0 (0.0%) |
| No Fuel Used | 0 (0.0%) | 0 (0.0%) |
| Total | 308 (100.0%) | 252 (100.0%) |
Household Vehicle Usage in Bowling Green
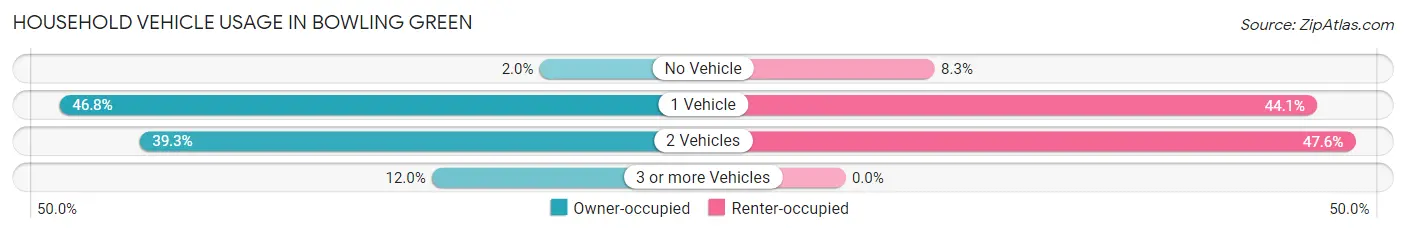
| Vehicles per Household | Owner-occupied | Renter-occupied |
| No Vehicle | 6 (1.9%) | 21 (8.3%) |
| 1 Vehicle | 144 (46.8%) | 111 (44.1%) |
| 2 Vehicles | 121 (39.3%) | 120 (47.6%) |
| 3 or more Vehicles | 37 (12.0%) | 0 (0.0%) |
| Total | 308 (100.0%) | 252 (100.0%) |
Real Estate & Mortgages in Bowling Green
Real Estate and Mortgage Overview in Bowling Green
| Characteristic | Without Mortgage | With Mortgage |
| Housing Units | 140 | 168 |
| Median Property Value | $106,000 | $143,500 |
| Median Household Income | $71,058 | $12 |
| Monthly Housing Costs | $471 | $0 |
| Real Estate Taxes | $1,226 | $15 |
Property Value by Mortgage Status in Bowling Green
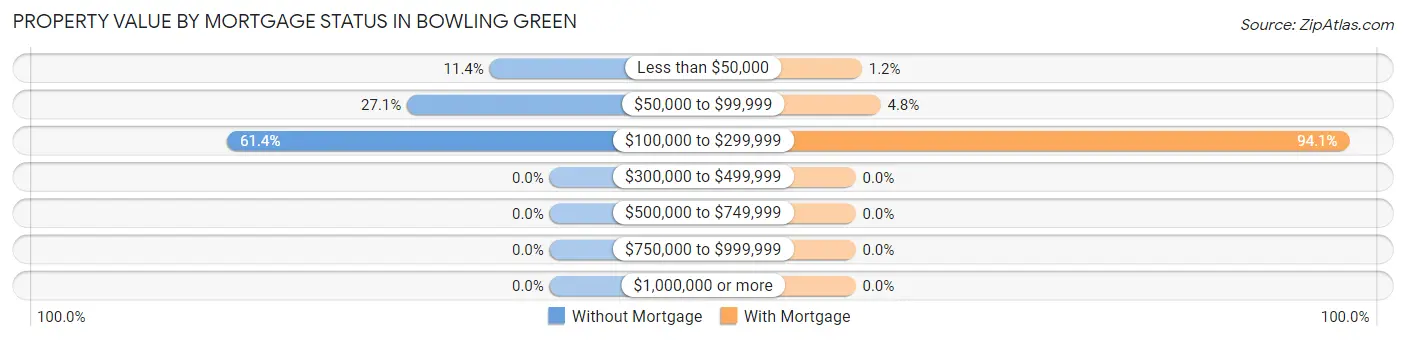
| Property Value | Without Mortgage | With Mortgage |
| Less than $50,000 | 16 (11.4%) | 2 (1.2%) |
| $50,000 to $99,999 | 38 (27.1%) | 8 (4.8%) |
| $100,000 to $299,999 | 86 (61.4%) | 158 (94.1%) |
| $300,000 to $499,999 | 0 (0.0%) | 0 (0.0%) |
| $500,000 to $749,999 | 0 (0.0%) | 0 (0.0%) |
| $750,000 to $999,999 | 0 (0.0%) | 0 (0.0%) |
| $1,000,000 or more | 0 (0.0%) | 0 (0.0%) |
| Total | 140 (100.0%) | 168 (100.0%) |
Household Income by Mortgage Status in Bowling Green
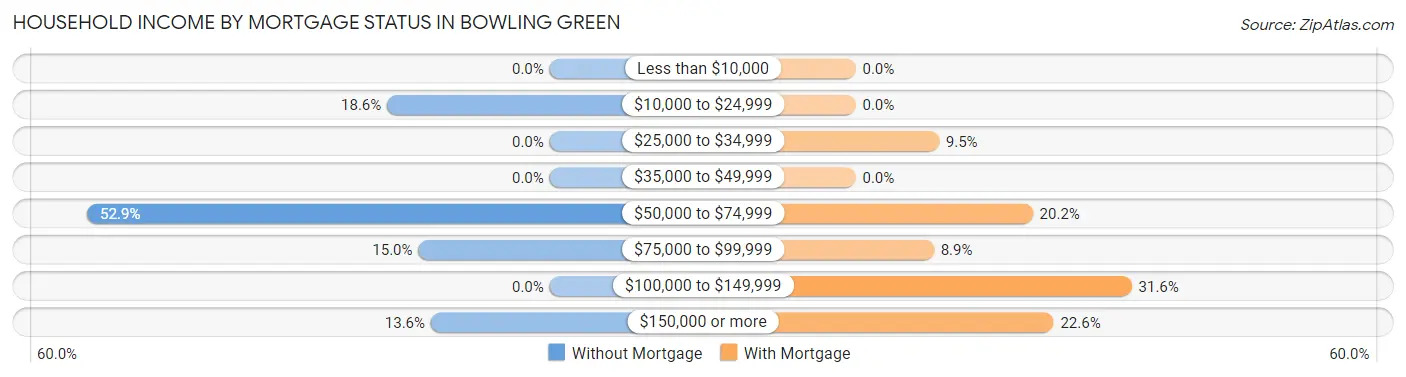
| Household Income | Without Mortgage | With Mortgage |
| Less than $10,000 | 0 (0.0%) | 0 (0.0%) |
| $10,000 to $24,999 | 26 (18.6%) | 0 (0.0%) |
| $25,000 to $34,999 | 0 (0.0%) | 16 (9.5%) |
| $35,000 to $49,999 | 0 (0.0%) | 0 (0.0%) |
| $50,000 to $74,999 | 74 (52.9%) | 34 (20.2%) |
| $75,000 to $99,999 | 21 (15.0%) | 15 (8.9%) |
| $100,000 to $149,999 | 0 (0.0%) | 53 (31.6%) |
| $150,000 or more | 19 (13.6%) | 38 (22.6%) |
| Total | 140 (100.0%) | 168 (100.0%) |
Property Value to Household Income Ratio in Bowling Green
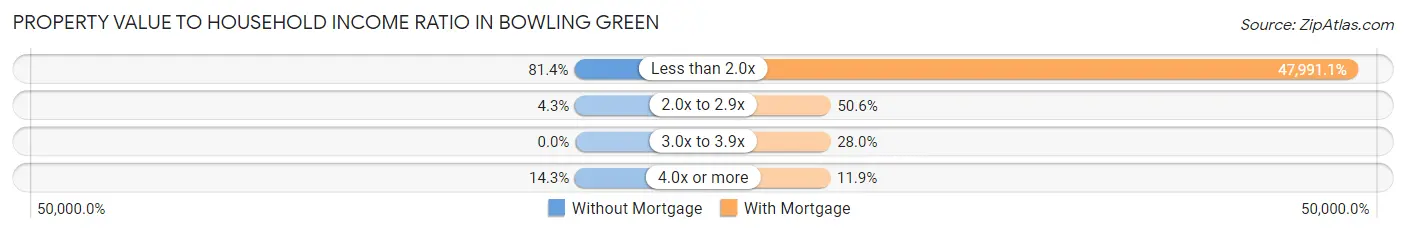
| Value-to-Income Ratio | Without Mortgage | With Mortgage |
| Less than 2.0x | 114 (81.4%) | 80,625 (47,991.1%) |
| 2.0x to 2.9x | 6 (4.3%) | 85 (50.6%) |
| 3.0x to 3.9x | 0 (0.0%) | 47 (28.0%) |
| 4.0x or more | 20 (14.3%) | 20 (11.9%) |
| Total | 140 (100.0%) | 168 (100.0%) |
Real Estate Taxes by Mortgage Status in Bowling Green
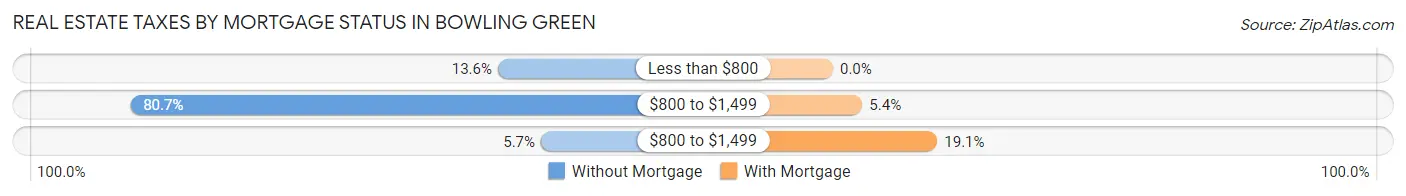
| Property Taxes | Without Mortgage | With Mortgage |
| Less than $800 | 19 (13.6%) | 0 (0.0%) |
| $800 to $1,499 | 113 (80.7%) | 9 (5.4%) |
| $800 to $1,499 | 8 (5.7%) | 32 (19.1%) |
| Total | 140 (100.0%) | 168 (100.0%) |
Health & Disability in Bowling Green
Health Insurance Coverage by Age in Bowling Green
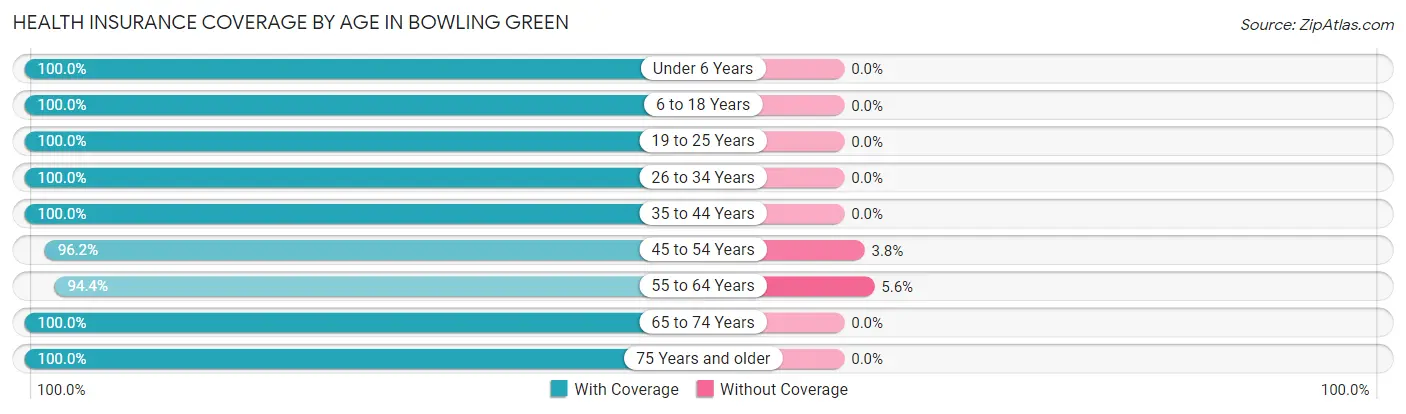
| Age Bracket | With Coverage | Without Coverage |
| Under 6 Years | 19 (100.0%) | 0 (0.0%) |
| 6 to 18 Years | 137 (100.0%) | 0 (0.0%) |
| 19 to 25 Years | 170 (100.0%) | 0 (0.0%) |
| 26 to 34 Years | 67 (100.0%) | 0 (0.0%) |
| 35 to 44 Years | 182 (100.0%) | 0 (0.0%) |
| 45 to 54 Years | 153 (96.2%) | 6 (3.8%) |
| 55 to 64 Years | 219 (94.4%) | 13 (5.6%) |
| 65 to 74 Years | 67 (100.0%) | 0 (0.0%) |
| 75 Years and older | 69 (100.0%) | 0 (0.0%) |
| Total | 1,083 (98.3%) | 19 (1.7%) |
Health Insurance Coverage by Citizenship Status in Bowling Green
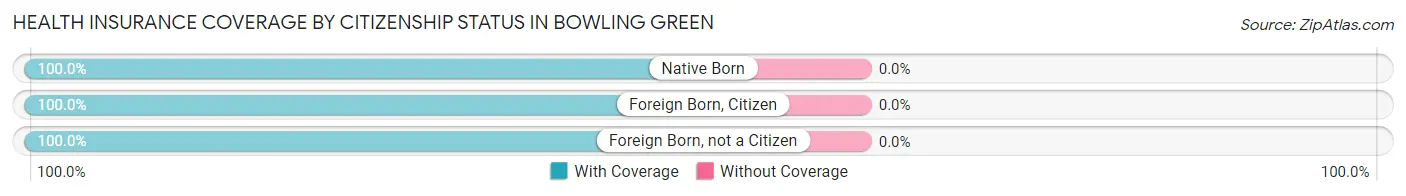
| Citizenship Status | With Coverage | Without Coverage |
| Native Born | 19 (100.0%) | 0 (0.0%) |
| Foreign Born, Citizen | 137 (100.0%) | 0 (0.0%) |
| Foreign Born, not a Citizen | 170 (100.0%) | 0 (0.0%) |
Health Insurance Coverage by Household Income in Bowling Green
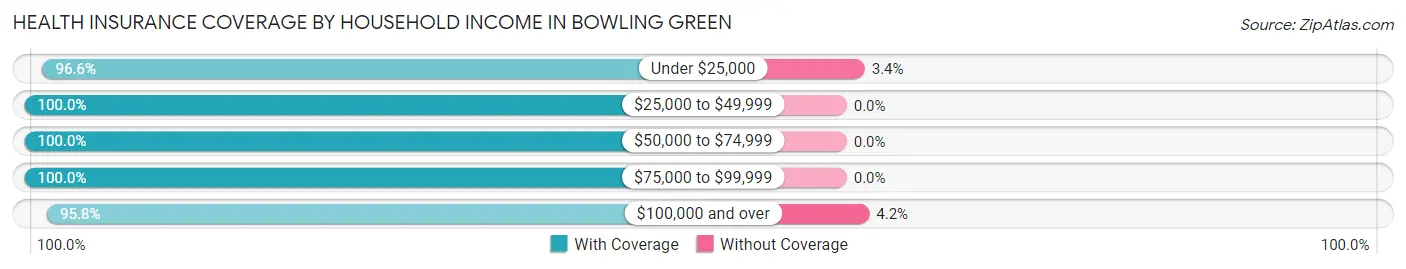
| Household Income | With Coverage | Without Coverage |
| Under $25,000 | 172 (96.6%) | 6 (3.4%) |
| $25,000 to $49,999 | 185 (100.0%) | 0 (0.0%) |
| $50,000 to $74,999 | 207 (100.0%) | 0 (0.0%) |
| $75,000 to $99,999 | 224 (100.0%) | 0 (0.0%) |
| $100,000 and over | 294 (95.8%) | 13 (4.2%) |
Public vs Private Health Insurance Coverage by Age in Bowling Green
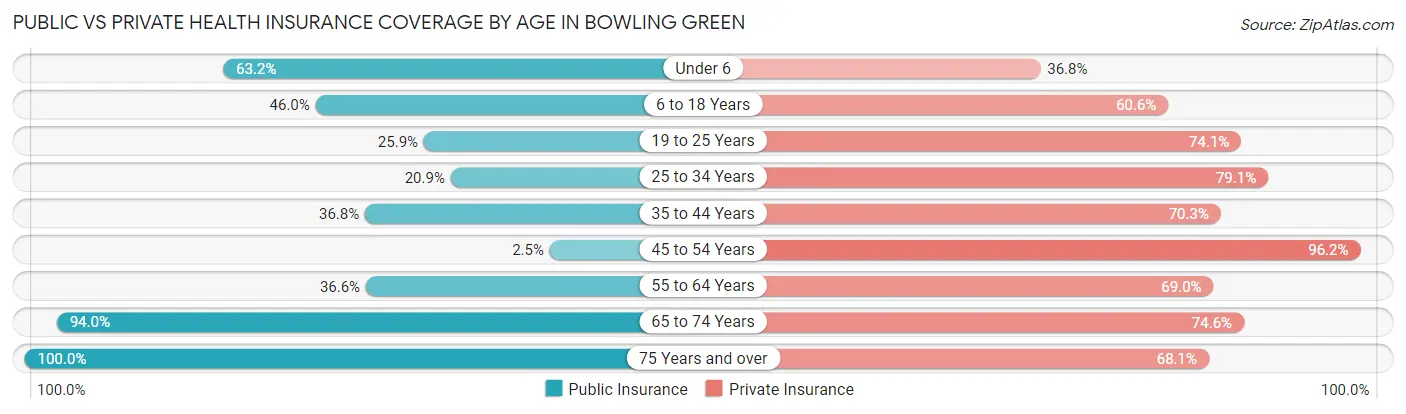
| Age Bracket | Public Insurance | Private Insurance |
| Under 6 | 12 (63.2%) | 7 (36.8%) |
| 6 to 18 Years | 63 (46.0%) | 83 (60.6%) |
| 19 to 25 Years | 44 (25.9%) | 126 (74.1%) |
| 25 to 34 Years | 14 (20.9%) | 53 (79.1%) |
| 35 to 44 Years | 67 (36.8%) | 128 (70.3%) |
| 45 to 54 Years | 4 (2.5%) | 153 (96.2%) |
| 55 to 64 Years | 85 (36.6%) | 160 (69.0%) |
| 65 to 74 Years | 63 (94.0%) | 50 (74.6%) |
| 75 Years and over | 69 (100.0%) | 47 (68.1%) |
| Total | 421 (38.2%) | 807 (73.2%) |
Disability Status by Sex by Age in Bowling Green
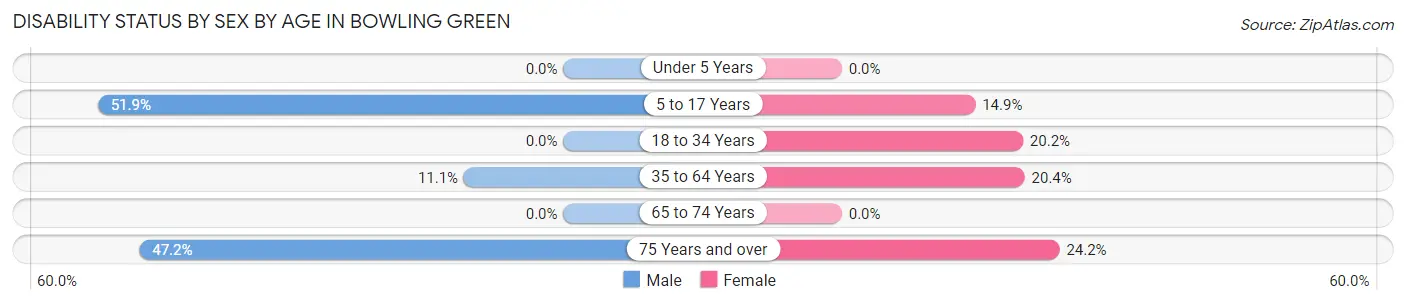
| Age Bracket | Male | Female |
| Under 5 Years | 0 (0.0%) | 0 (0.0%) |
| 5 to 17 Years | 28 (51.8%) | 11 (14.9%) |
| 18 to 34 Years | 0 (0.0%) | 24 (20.2%) |
| 35 to 64 Years | 27 (11.1%) | 67 (20.4%) |
| 65 to 74 Years | 0 (0.0%) | 0 (0.0%) |
| 75 Years and over | 17 (47.2%) | 8 (24.2%) |
Disability Class by Sex by Age in Bowling Green
Disability Class: Hearing Difficulty
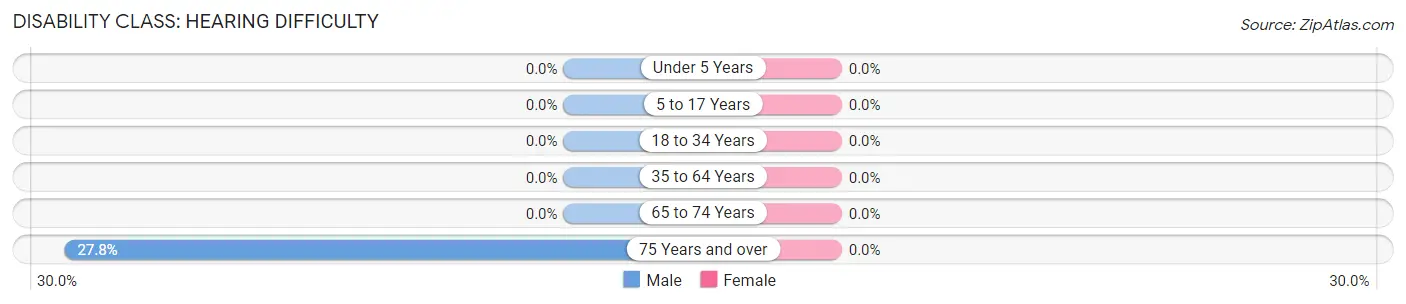
| Age Bracket | Male | Female |
| Under 5 Years | 0 (0.0%) | 0 (0.0%) |
| 5 to 17 Years | 0 (0.0%) | 0 (0.0%) |
| 18 to 34 Years | 0 (0.0%) | 0 (0.0%) |
| 35 to 64 Years | 0 (0.0%) | 0 (0.0%) |
| 65 to 74 Years | 0 (0.0%) | 0 (0.0%) |
| 75 Years and over | 10 (27.8%) | 0 (0.0%) |
Disability Class: Vision Difficulty
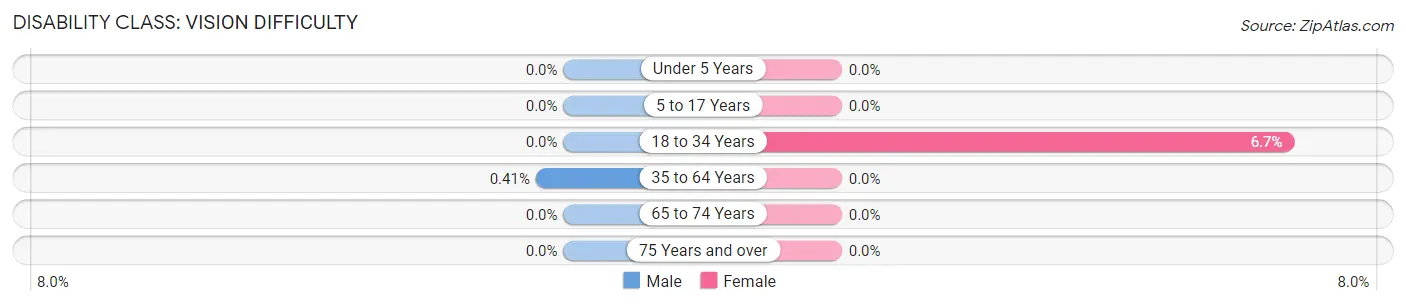
| Age Bracket | Male | Female |
| Under 5 Years | 0 (0.0%) | 0 (0.0%) |
| 5 to 17 Years | 0 (0.0%) | 0 (0.0%) |
| 18 to 34 Years | 0 (0.0%) | 8 (6.7%) |
| 35 to 64 Years | 1 (0.4%) | 0 (0.0%) |
| 65 to 74 Years | 0 (0.0%) | 0 (0.0%) |
| 75 Years and over | 0 (0.0%) | 0 (0.0%) |
Disability Class: Cognitive Difficulty
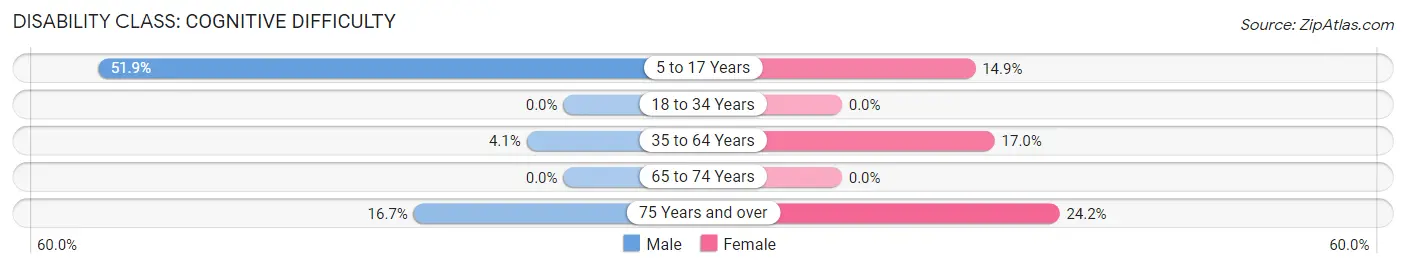
| Age Bracket | Male | Female |
| 5 to 17 Years | 28 (51.8%) | 11 (14.9%) |
| 18 to 34 Years | 0 (0.0%) | 0 (0.0%) |
| 35 to 64 Years | 10 (4.1%) | 56 (17.0%) |
| 65 to 74 Years | 0 (0.0%) | 0 (0.0%) |
| 75 Years and over | 6 (16.7%) | 8 (24.2%) |
Disability Class: Ambulatory Difficulty
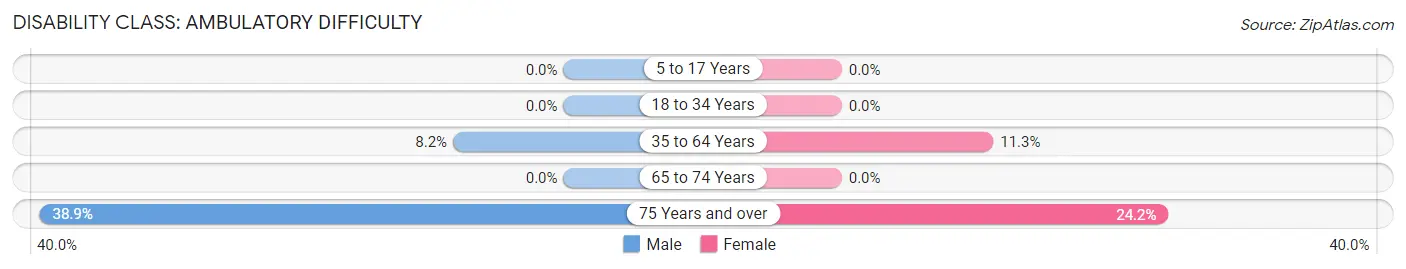
| Age Bracket | Male | Female |
| 5 to 17 Years | 0 (0.0%) | 0 (0.0%) |
| 18 to 34 Years | 0 (0.0%) | 0 (0.0%) |
| 35 to 64 Years | 20 (8.2%) | 37 (11.3%) |
| 65 to 74 Years | 0 (0.0%) | 0 (0.0%) |
| 75 Years and over | 14 (38.9%) | 8 (24.2%) |
Disability Class: Self-Care Difficulty
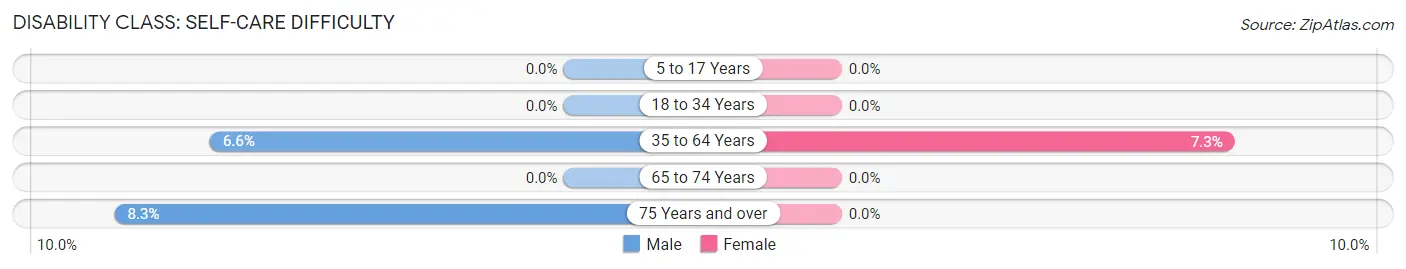
| Age Bracket | Male | Female |
| 5 to 17 Years | 0 (0.0%) | 0 (0.0%) |
| 18 to 34 Years | 0 (0.0%) | 0 (0.0%) |
| 35 to 64 Years | 16 (6.6%) | 24 (7.3%) |
| 65 to 74 Years | 0 (0.0%) | 0 (0.0%) |
| 75 Years and over | 3 (8.3%) | 0 (0.0%) |
Technology Access in Bowling Green
Computing Device Access in Bowling Green
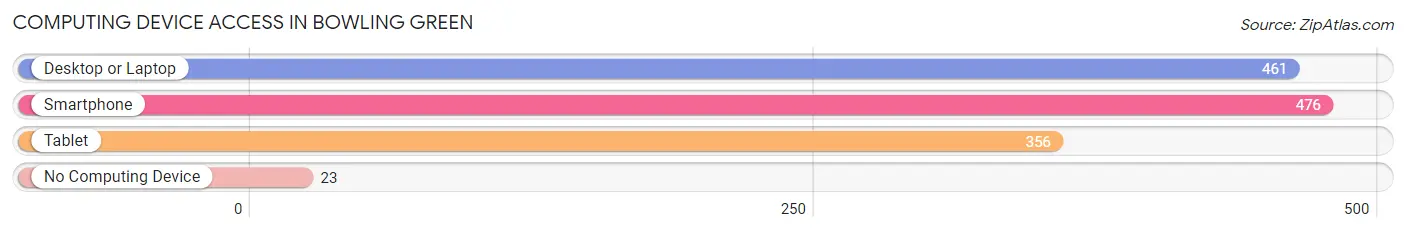
| Device Type | # Households | % Households |
| Desktop or Laptop | 461 | 82.3% |
| Smartphone | 476 | 85.0% |
| Tablet | 356 | 63.6% |
| No Computing Device | 23 | 4.1% |
| Total | 560 | 100.0% |
Internet Access in Bowling Green
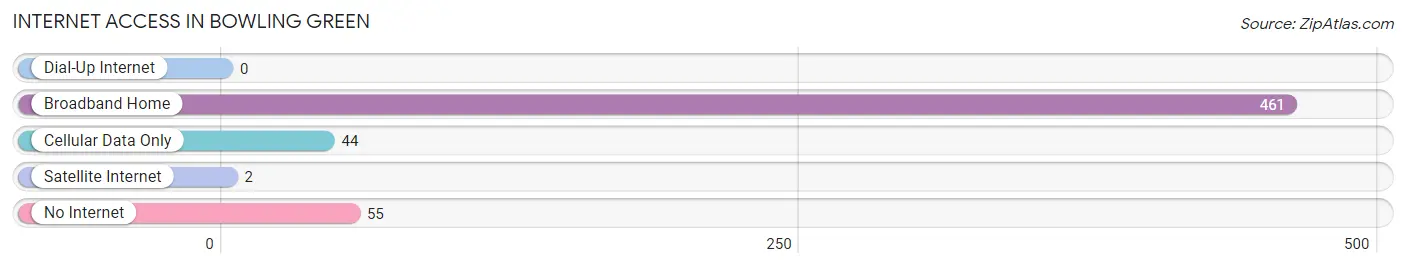
| Internet Type | # Households | % Households |
| Dial-Up Internet | 0 | 0.0% |
| Broadband Home | 461 | 82.3% |
| Cellular Data Only | 44 | 7.9% |
| Satellite Internet | 2 | 0.4% |
| No Internet | 55 | 9.8% |
| Total | 560 | 100.0% |
Bowling Green Summary
Bowling Green is a small town located in Caroline County, Maryland. It is situated on the Eastern Shore of Maryland, approximately 30 miles east of the state capital of Annapolis. The town has a population of approximately 1,500 people and is part of the larger Salisbury metropolitan area.
History
The town of Bowling Green was founded in 1790 by a group of Quakers from Pennsylvania. The town was named after the nearby Bowling Green Creek, which was named after the game of bowling. The town was originally a farming community, and the Quakers were the first to settle in the area.
The town was incorporated in 1867 and was the first town in Caroline County to be incorporated. The town was a major stop on the Eastern Shore Railroad, which ran from Baltimore to Salisbury. The railroad was a major factor in the growth of the town, as it allowed for the transportation of goods and people to and from the area.
Geography
Bowling Green is located in the Eastern Shore region of Maryland. It is situated on the Choptank River, which is a major tributary of the Chesapeake Bay. The town is located in a rural area, and is surrounded by farmland and forests. The town is located approximately 30 miles east of the state capital of Annapolis.
The town has a total area of 1.2 square miles, all of which is land. The town is located at an elevation of approximately 30 feet above sea level.
Economy
The economy of Bowling Green is largely based on agriculture and tourism. The town is home to several farms, which produce a variety of crops, including corn, soybeans, and wheat. The town is also home to several wineries, which produce a variety of wines.
The town is also a popular tourist destination, as it is located near several popular attractions, including the Chesapeake Bay Bridge, the Assateague Island National Seashore, and the Blackwater National Wildlife Refuge. The town is also home to several historic sites, including the Bowling Green Historic District, which is listed on the National Register of Historic Places.
Demographics
As of the 2010 census, the population of Bowling Green was 1,500. The racial makeup of the town was 94.7% White, 2.7% African American, 0.3% Native American, 0.3% Asian, 0.7% from other races, and 1.3% from two or more races. Hispanic or Latino of any race were 1.7% of the population.
The median income for a household in the town was $45,000, and the median income for a family was $50,000. The per capita income for the town was $20,000. About 10.7% of families and 13.3% of the population were below the poverty line, including 17.3% of those under age 18 and 8.3% of those age 65 or over.
Common Questions
What is Per Capita Income in Bowling Green?
Per Capita income in Bowling Green is $35,591.
What is the Median Family Income in Bowling Green?
Median Family Income in Bowling Green is $59,750.
What is the Median Household income in Bowling Green?
Median Household Income in Bowling Green is $59,773.
What is Income or Wage Gap in Bowling Green?
Income or Wage Gap in Bowling Green is 42.5%.
Women in Bowling Green earn 57.5 cents for every dollar earned by a man.
What is Inequality or Gini Index in Bowling Green?
Inequality or Gini Index in Bowling Green is 0.36.
What is the Total Population of Bowling Green?
Total Population of Bowling Green is 1,102.
What is the Total Male Population of Bowling Green?
Total Male Population of Bowling Green is 510.
What is the Total Female Population of Bowling Green?
Total Female Population of Bowling Green is 592.
What is the Ratio of Males per 100 Females in Bowling Green?
There are 86.15 Males per 100 Females in Bowling Green.
What is the Ratio of Females per 100 Males in Bowling Green?
There are 116.08 Females per 100 Males in Bowling Green.
What is the Median Population Age in Bowling Green?
Median Population Age in Bowling Green is 42.9 Years.
What is the Average Family Size in Bowling Green
Average Family Size in Bowling Green is 2.5 People.
What is the Average Household Size in Bowling Green
Average Household Size in Bowling Green is 2.0 People.
How Large is the Labor Force in Bowling Green?
There are 604 People in the Labor Forcein in Bowling Green.
What is the Percentage of People in the Labor Force in Bowling Green?
60.6% of People are in the Labor Force in Bowling Green.
What is the Unemployment Rate in Bowling Green?
Unemployment Rate in Bowling Green is 5.6%.