Zip Codes with the Highest Percentage of Population Employed in Security & Protection in Upper Marlboro, MD
RELATED REPORTS & OPTIONS
Security & Protection
Upper Marlboro
Compare Zip Codes
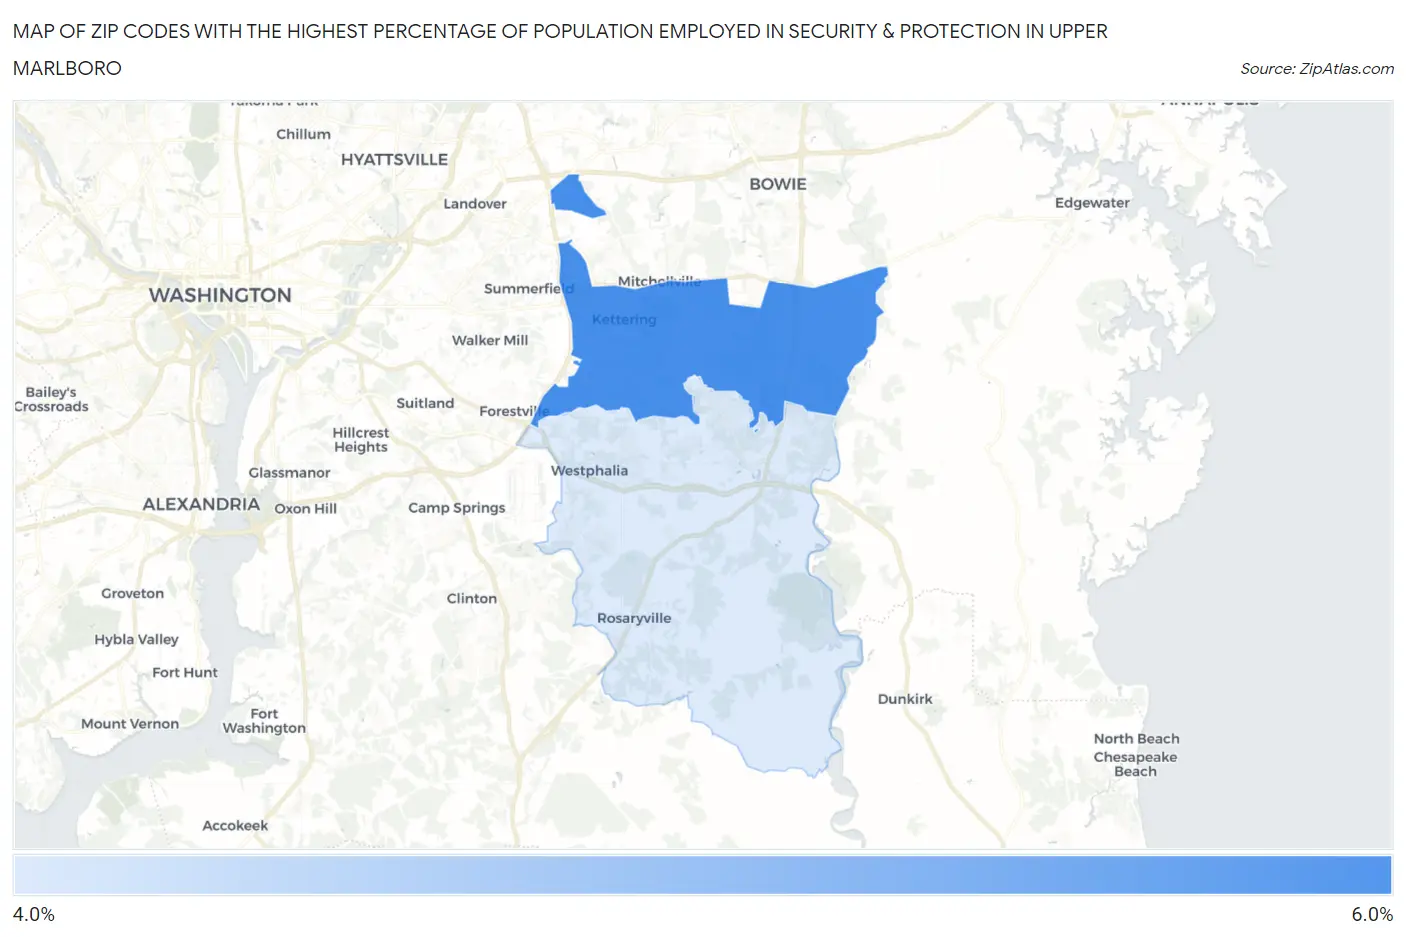
Map of Zip Codes with the Highest Percentage of Population Employed in Security & Protection in Upper Marlboro
4.7%
5.8%
Zip Codes with the Highest Percentage of Population Employed in Security & Protection in Upper Marlboro, MD
| Zip Code | % Employed | vs State | vs National | |
| 1. | 20774 | 5.8% | 2.8%(+3.00)#39 | 2.1%(+3.65)#2,209 |
| 2. | 20772 | 4.7% | 2.8%(+1.86)#76 | 2.1%(+2.51)#3,354 |
1
Common Questions
What are the Top Zip Codes with the Highest Percentage of Population Employed in Security & Protection in Upper Marlboro, MD?
Top Zip Codes with the Highest Percentage of Population Employed in Security & Protection in Upper Marlboro, MD are:
What zip code has the Highest Percentage of Population Employed in Security & Protection in Upper Marlboro, MD?
20774 has the Highest Percentage of Population Employed in Security & Protection in Upper Marlboro, MD with 5.8%.
What is the Percentage of Population Employed in Security & Protection in Upper Marlboro, MD?
Percentage of Population Employed in Security & Protection in Upper Marlboro is 7.6%.
What is the Percentage of Population Employed in Security & Protection in Maryland?
Percentage of Population Employed in Security & Protection in Maryland is 2.8%.
What is the Percentage of Population Employed in Security & Protection in the United States?
Percentage of Population Employed in Security & Protection in the United States is 2.1%.