Long Beach, MD Map & Demographics
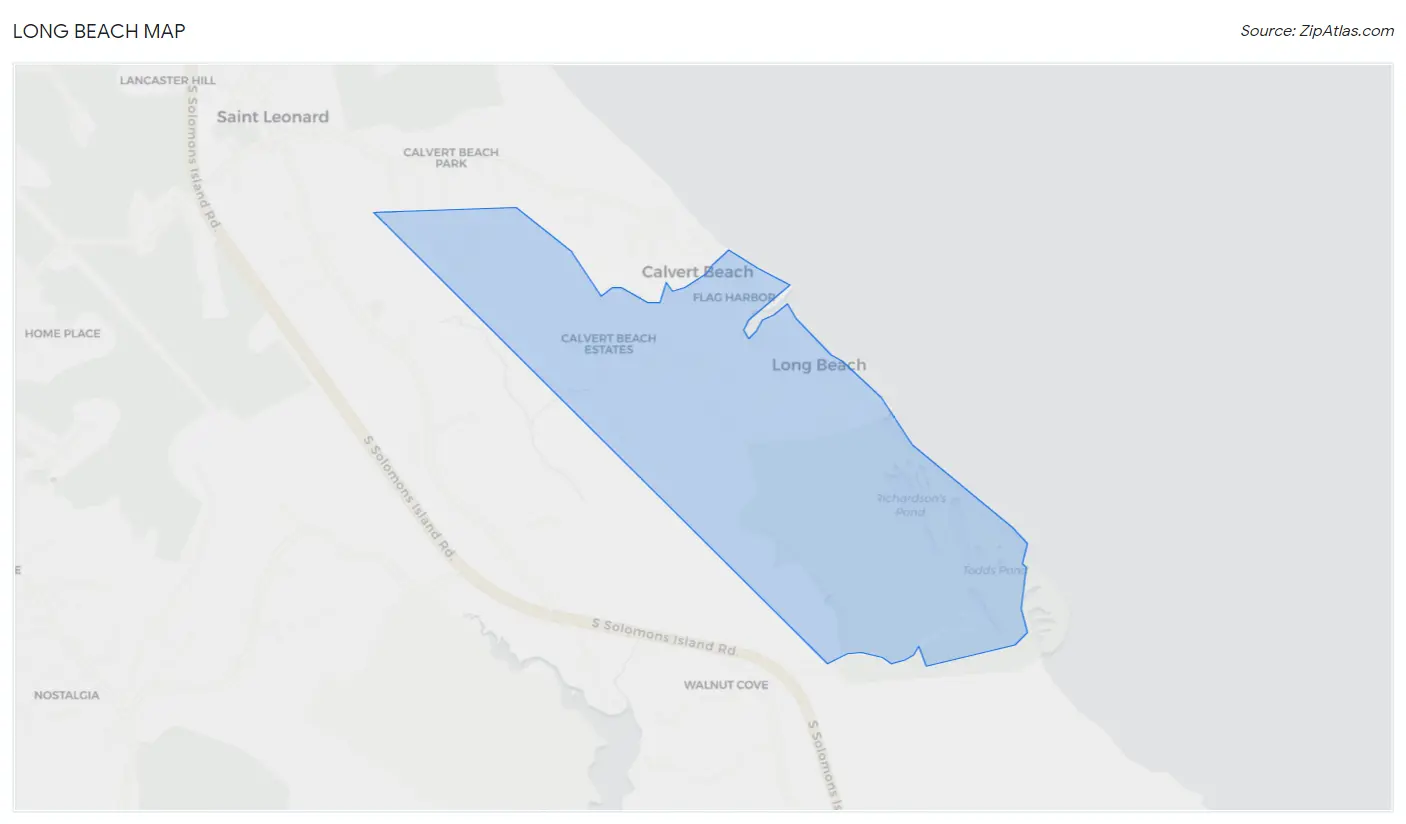
Long Beach Map
Long Beach Overview
$54,923
PER CAPITA INCOME
$132,917
AVG FAMILY INCOME
$132,917
AVG HOUSEHOLD INCOME
28.4%
WAGE / INCOME GAP [ % ]
71.6¢/ $1
WAGE / INCOME GAP [ $ ]
0.29
INEQUALITY / GINI INDEX
1,761
TOTAL POPULATION
969
MALE POPULATION
792
FEMALE POPULATION
122.35
MALES / 100 FEMALES
81.73
FEMALES / 100 MALES
42.0
MEDIAN AGE
3.1
AVG FAMILY SIZE
2.5
AVG HOUSEHOLD SIZE
1,000
LABOR FORCE [ PEOPLE ]
66.1%
PERCENT IN LABOR FORCE
Income in Long Beach
Income Overview in Long Beach
Per Capita Income in Long Beach is $54,923, while median incomes of families and households are $132,917 and $132,917 respectively.
| Characteristic | Number | Measure |
| Per Capita Income | 1,761 | $54,923 |
| Median Family Income | 494 | $132,917 |
| Mean Family Income | 494 | $137,999 |
| Median Household Income | 710 | $132,917 |
| Mean Household Income | 710 | $135,706 |
| Income Deficit | 494 | $0 |
| Wage / Income Gap (%) | 1,761 | 28.36% |
| Wage / Income Gap ($) | 1,761 | 71.64¢ per $1 |
| Gini / Inequality Index | 1,761 | 0.29 |
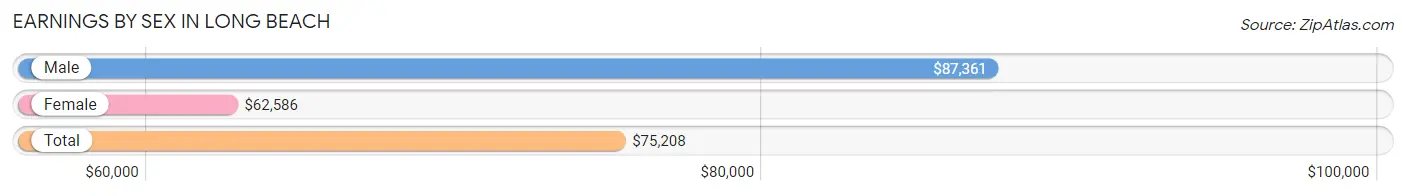
Earnings by Sex in Long Beach
Average Earnings in Long Beach are $75,208, $87,361 for men and $62,586 for women, a difference of 28.4%.
| Sex | Number | Average Earnings |
| Male | 585 (55.6%) | $87,361 |
| Female | 468 (44.4%) | $62,586 |
| Total | 1,053 (100.0%) | $75,208 |
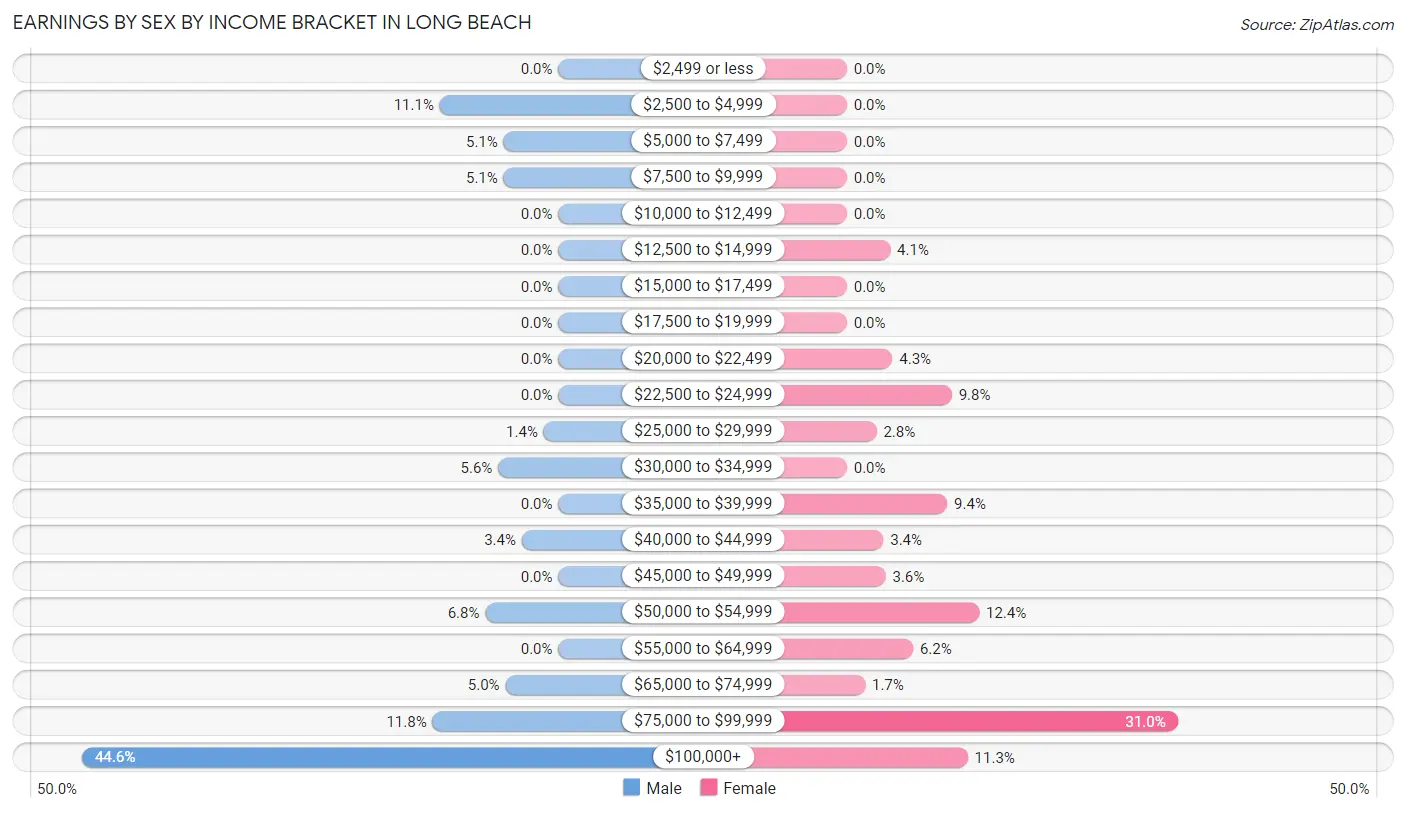
Earnings by Sex by Income Bracket in Long Beach
The most common earnings brackets in Long Beach are $100,000+ for men (261 | 44.6%) and $75,000 to $99,999 for women (145 | 31.0%).
| Income | Male | Female |
| $2,499 or less | 0 (0.0%) | 0 (0.0%) |
| $2,500 to $4,999 | 65 (11.1%) | 0 (0.0%) |
| $5,000 to $7,499 | 30 (5.1%) | 0 (0.0%) |
| $7,500 to $9,999 | 30 (5.1%) | 0 (0.0%) |
| $10,000 to $12,499 | 0 (0.0%) | 0 (0.0%) |
| $12,500 to $14,999 | 0 (0.0%) | 19 (4.1%) |
| $15,000 to $17,499 | 0 (0.0%) | 0 (0.0%) |
| $17,500 to $19,999 | 0 (0.0%) | 0 (0.0%) |
| $20,000 to $22,499 | 0 (0.0%) | 20 (4.3%) |
| $22,500 to $24,999 | 0 (0.0%) | 46 (9.8%) |
| $25,000 to $29,999 | 8 (1.4%) | 13 (2.8%) |
| $30,000 to $34,999 | 33 (5.6%) | 0 (0.0%) |
| $35,000 to $39,999 | 0 (0.0%) | 44 (9.4%) |
| $40,000 to $44,999 | 20 (3.4%) | 16 (3.4%) |
| $45,000 to $49,999 | 0 (0.0%) | 17 (3.6%) |
| $50,000 to $54,999 | 40 (6.8%) | 58 (12.4%) |
| $55,000 to $64,999 | 0 (0.0%) | 29 (6.2%) |
| $65,000 to $74,999 | 29 (5.0%) | 8 (1.7%) |
| $75,000 to $99,999 | 69 (11.8%) | 145 (31.0%) |
| $100,000+ | 261 (44.6%) | 53 (11.3%) |
| Total | 585 (100.0%) | 468 (100.0%) |
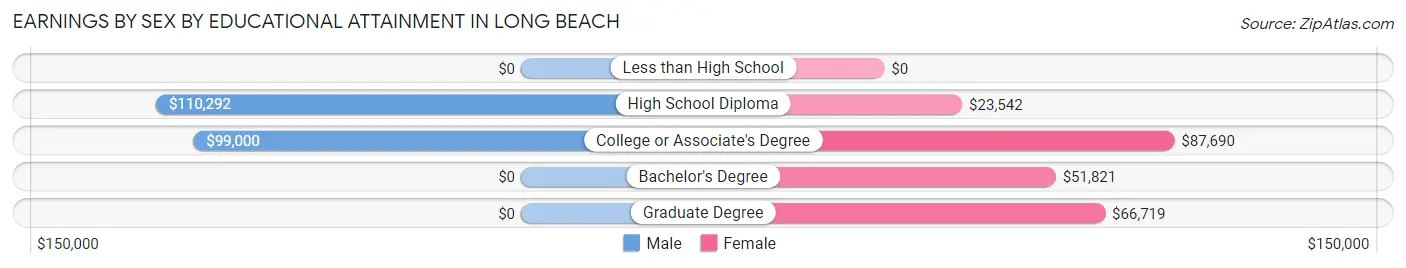
Earnings by Sex by Educational Attainment in Long Beach
Average earnings in Long Beach are $111,250 for men and $63,966 for women, a difference of 42.5%. Men with an educational attainment of high school diploma enjoy the highest average annual earnings of $110,292, while those with college or associate's degree education earn the least with $99,000. Women with an educational attainment of college or associate's degree earn the most with the average annual earnings of $87,690, while those with high school diploma education have the smallest earnings of $23,542.
| Educational Attainment | Male Income | Female Income |
| Less than High School | - | - |
| High School Diploma | $110,292 | $23,542 |
| College or Associate's Degree | $99,000 | $87,690 |
| Bachelor's Degree | - | - |
| Graduate Degree | - | - |
| Total | $111,250 | $63,966 |
Family Income in Long Beach
Family Income Brackets in Long Beach
According to the Long Beach family income data, there are 135 families falling into the $100,000 to $149,999 income range, which is the most common income bracket and makes up 27.3% of all families.
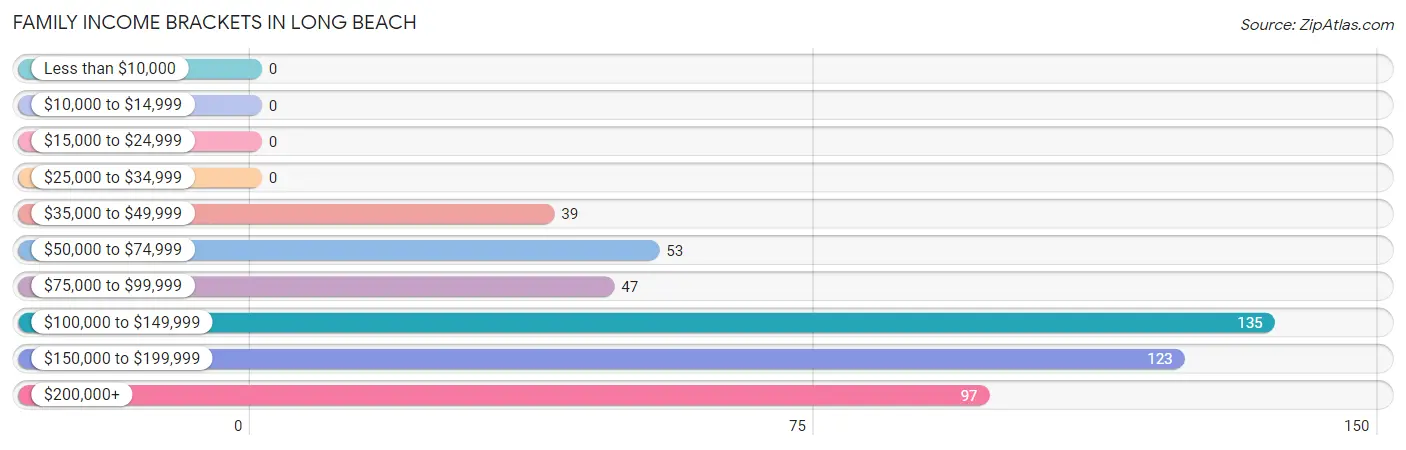
| Income Bracket | # Families | % Families |
| Less than $10,000 | 0 | 0.0% |
| $10,000 to $14,999 | 0 | 0.0% |
| $15,000 to $24,999 | 0 | 0.0% |
| $25,000 to $34,999 | 0 | 0.0% |
| $35,000 to $49,999 | 39 | 7.9% |
| $50,000 to $74,999 | 53 | 10.7% |
| $75,000 to $99,999 | 47 | 9.5% |
| $100,000 to $149,999 | 135 | 27.3% |
| $150,000 to $199,999 | 123 | 24.9% |
| $200,000+ | 97 | 19.6% |
Family Income by Famaliy Size in Long Beach
3-person families (53 | 10.7%) account for the highest median family income in Long Beach with $176,477 per family, while 2-person families (234 | 47.4%) have the highest median income of $75,500 per family member.
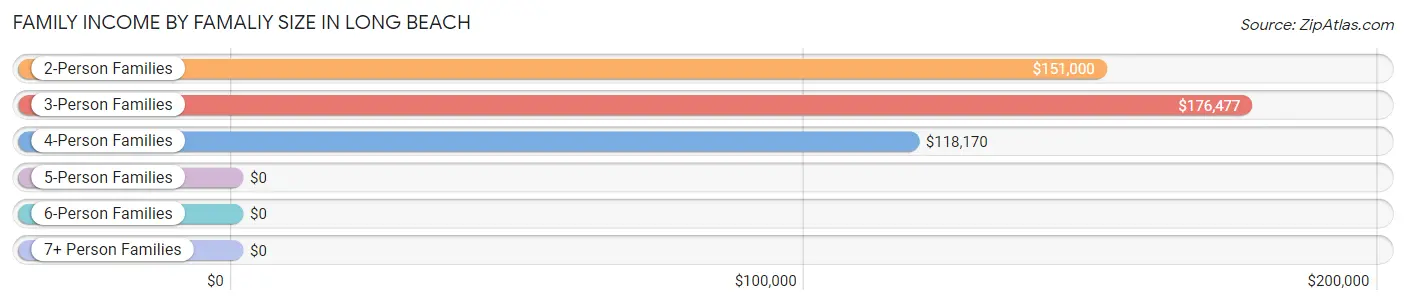
| Income Bracket | # Families | Median Income |
| 2-Person Families | 234 (47.4%) | $151,000 |
| 3-Person Families | 53 (10.7%) | $176,477 |
| 4-Person Families | 161 (32.6%) | $118,170 |
| 5-Person Families | 33 (6.7%) | $0 |
| 6-Person Families | 13 (2.6%) | $0 |
| 7+ Person Families | 0 (0.0%) | $0 |
| Total | 494 (100.0%) | $132,917 |
Family Income by Number of Earners in Long Beach
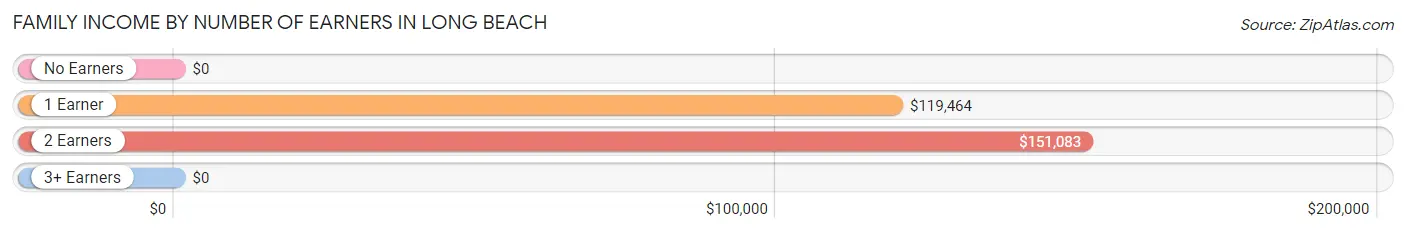
| Number of Earners | # Families | Median Income |
| No Earners | 26 (5.3%) | $0 |
| 1 Earner | 128 (25.9%) | $119,464 |
| 2 Earners | 301 (60.9%) | $151,083 |
| 3+ Earners | 39 (7.9%) | $0 |
| Total | 494 (100.0%) | $132,917 |
Household Income in Long Beach
Household Income Brackets in Long Beach
With 179 households falling in the category, the $150,000 to $199,999 income range is the most frequent in Long Beach, accounting for 25.2% of all households.
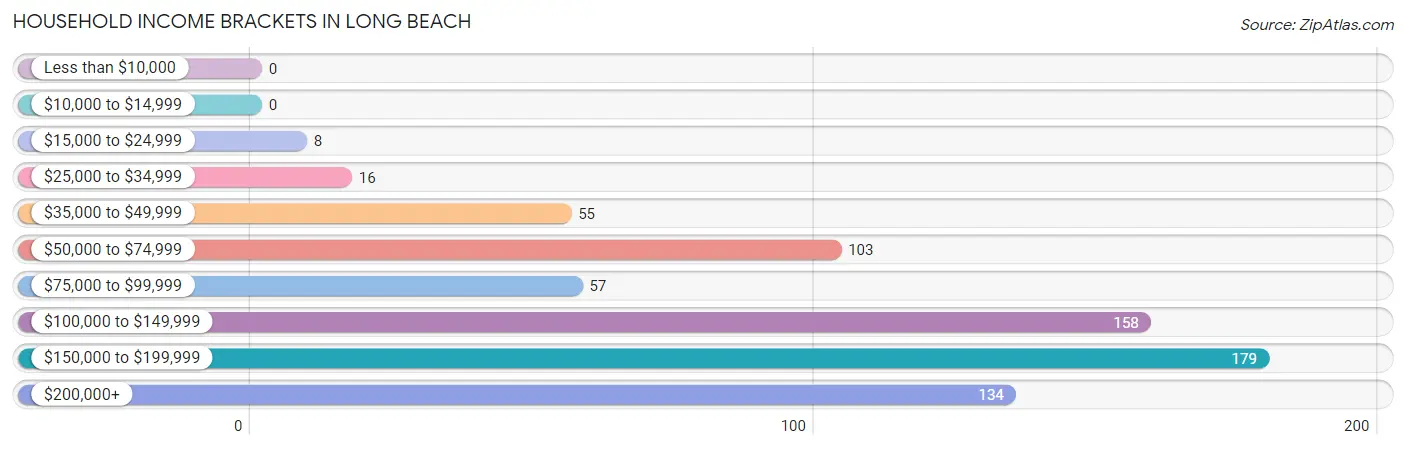
| Income Bracket | # Households | % Households |
| Less than $10,000 | 0 | 0.0% |
| $10,000 to $14,999 | 0 | 0.0% |
| $15,000 to $24,999 | 8 | 1.1% |
| $25,000 to $34,999 | 16 | 2.3% |
| $35,000 to $49,999 | 55 | 7.7% |
| $50,000 to $74,999 | 103 | 14.5% |
| $75,000 to $99,999 | 57 | 8.0% |
| $100,000 to $149,999 | 158 | 22.3% |
| $150,000 to $199,999 | 179 | 25.2% |
| $200,000+ | 134 | 18.9% |
Household Income by Householder Age in Long Beach
The median household income in Long Beach is $132,917, with the highest median household income of $175,303 found in the 45 to 64 years age bracket for the primary householder. A total of 360 households (50.7%) fall into this category.
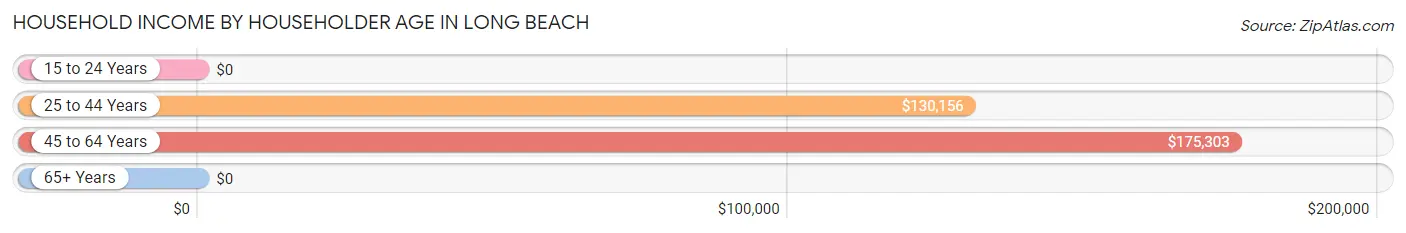
| Income Bracket | # Households | Median Income |
| 15 to 24 Years | 0 (0.0%) | $0 |
| 25 to 44 Years | 199 (28.0%) | $130,156 |
| 45 to 64 Years | 360 (50.7%) | $175,303 |
| 65+ Years | 151 (21.3%) | $0 |
| Total | 710 (100.0%) | $132,917 |
Poverty in Long Beach
Income Below Poverty by Sex and Age in Long Beach
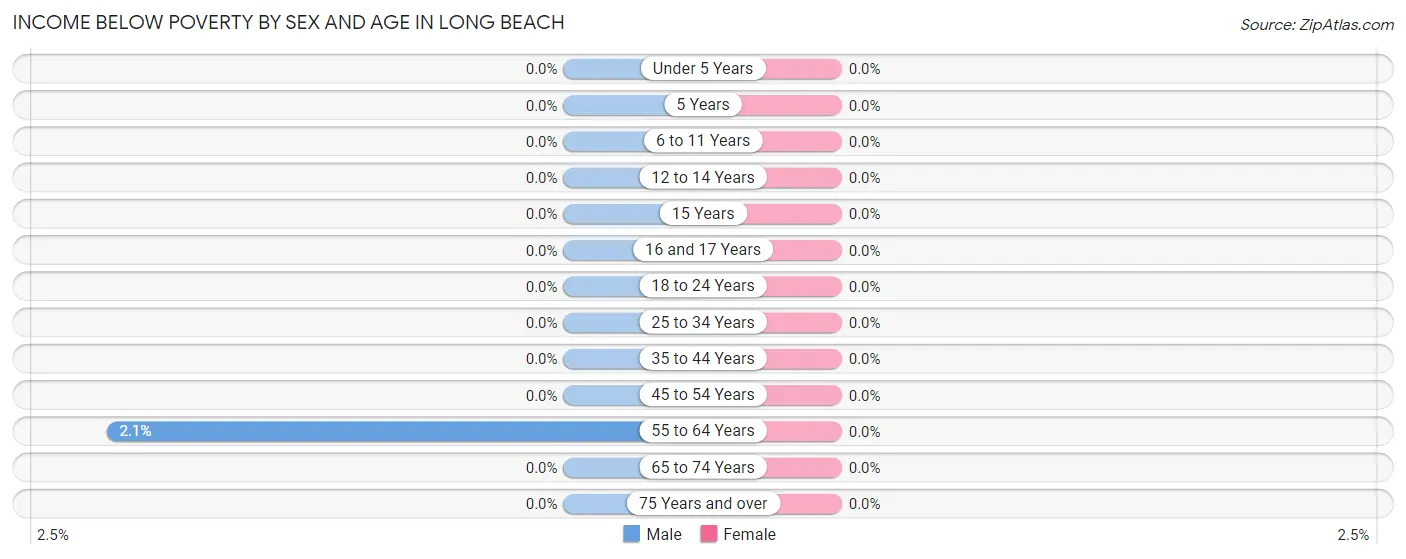
| Age Bracket | Male | Female |
| Under 5 Years | 0 (0.0%) | 0 (0.0%) |
| 5 Years | 0 (0.0%) | 0 (0.0%) |
| 6 to 11 Years | 0 (0.0%) | 0 (0.0%) |
| 12 to 14 Years | 0 (0.0%) | 0 (0.0%) |
| 15 Years | 0 (0.0%) | 0 (0.0%) |
| 16 and 17 Years | 0 (0.0%) | 0 (0.0%) |
| 18 to 24 Years | 0 (0.0%) | 0 (0.0%) |
| 25 to 34 Years | 0 (0.0%) | 0 (0.0%) |
| 35 to 44 Years | 0 (0.0%) | 0 (0.0%) |
| 45 to 54 Years | 0 (0.0%) | 0 (0.0%) |
| 55 to 64 Years | 4 (2.1%) | 0 (0.0%) |
| 65 to 74 Years | 0 (0.0%) | 0 (0.0%) |
| 75 Years and over | 0 (0.0%) | 0 (0.0%) |
| Total | 4 (0.4%) | 0 (0.0%) |
Income Above Poverty by Sex and Age in Long Beach
According to the poverty statistics in Long Beach, males aged under 5 years and females aged under 5 years are the age groups that are most secure financially, with 100.0% of males and 100.0% of females in these age groups living above the poverty line.
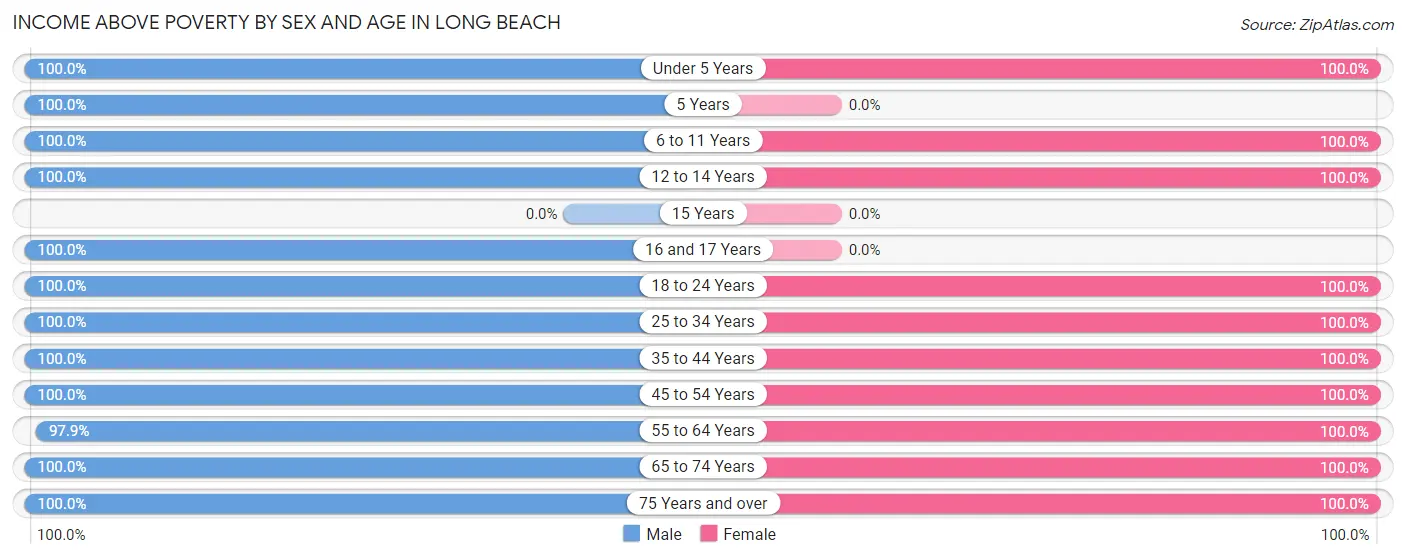
| Age Bracket | Male | Female |
| Under 5 Years | 36 (100.0%) | 16 (100.0%) |
| 5 Years | 16 (100.0%) | 0 (0.0%) |
| 6 to 11 Years | 37 (100.0%) | 56 (100.0%) |
| 12 to 14 Years | 76 (100.0%) | 11 (100.0%) |
| 15 Years | 0 (0.0%) | 0 (0.0%) |
| 16 and 17 Years | 102 (100.0%) | 0 (0.0%) |
| 18 to 24 Years | 91 (100.0%) | 32 (100.0%) |
| 25 to 34 Years | 122 (100.0%) | 152 (100.0%) |
| 35 to 44 Years | 74 (100.0%) | 59 (100.0%) |
| 45 to 54 Years | 59 (100.0%) | 108 (100.0%) |
| 55 to 64 Years | 185 (97.9%) | 230 (100.0%) |
| 65 to 74 Years | 133 (100.0%) | 49 (100.0%) |
| 75 Years and over | 33 (100.0%) | 77 (100.0%) |
| Total | 964 (99.6%) | 790 (100.0%) |
Income Below Poverty Among Married-Couple Families in Long Beach
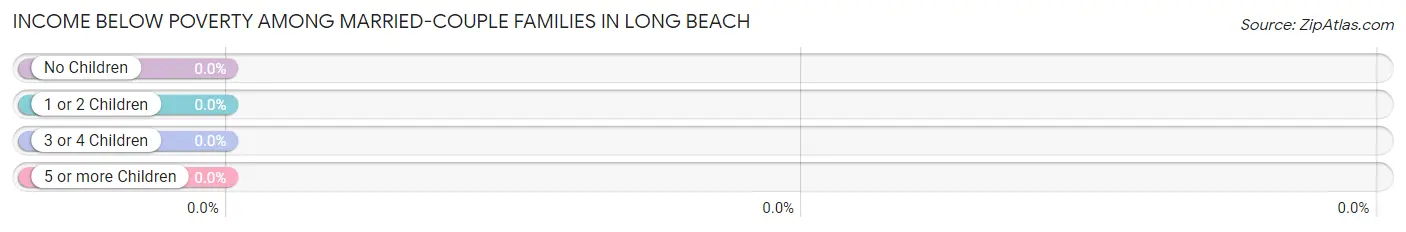
| Children | Above Poverty | Below Poverty |
| No Children | 261 (100.0%) | 0 (0.0%) |
| 1 or 2 Children | 99 (100.0%) | 0 (0.0%) |
| 3 or 4 Children | 0 (0.0%) | 0 (0.0%) |
| 5 or more Children | 0 (0.0%) | 0 (0.0%) |
| Total | 360 (100.0%) | 0 (0.0%) |
Income Below Poverty Among Single-Parent Households in Long Beach
| Children | Single Father | Single Mother |
| No Children | 0 (0.0%) | 0 (0.0%) |
| 1 or 2 Children | 0 (0.0%) | 0 (0.0%) |
| 3 or 4 Children | 0 (0.0%) | 0 (0.0%) |
| 5 or more Children | 0 (0.0%) | 0 (0.0%) |
| Total | 0 (0.0%) | 0 (0.0%) |
Income Below Poverty Among Married-Couple vs Single-Parent Households in Long Beach
| Children | Married-Couple Families | Single-Parent Households |
| No Children | 0 (0.0%) | 0 (0.0%) |
| 1 or 2 Children | 0 (0.0%) | 0 (0.0%) |
| 3 or 4 Children | 0 (0.0%) | 0 (0.0%) |
| 5 or more Children | 0 (0.0%) | 0 (0.0%) |
| Total | 0 (0.0%) | 0 (0.0%) |
Race in Long Beach
The most populous races in Long Beach are White / Caucasian (1,668 | 94.7%), Two or more Races (59 | 3.4%), and Black / African American (34 | 1.9%).
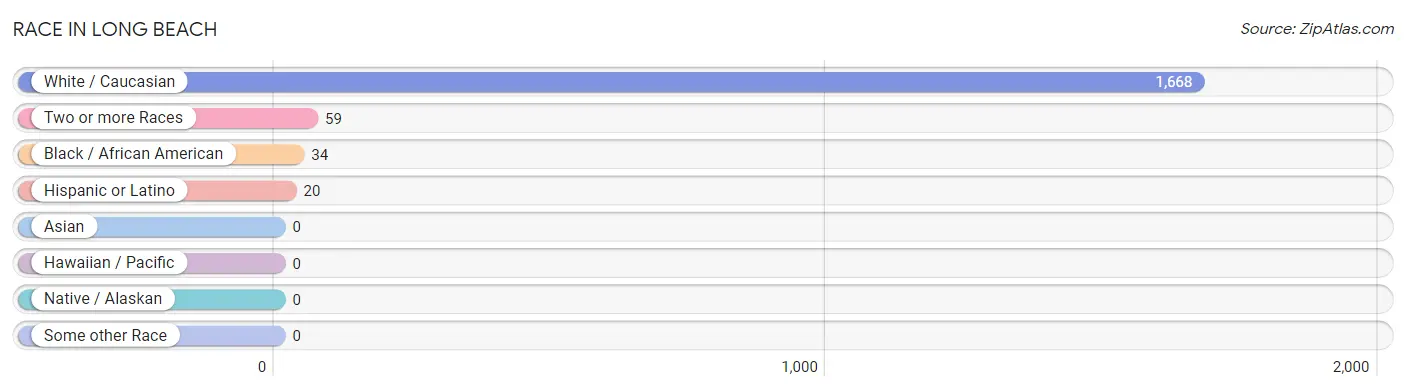
| Race | # Population | % Population |
| Asian | 0 | 0.0% |
| Black / African American | 34 | 1.9% |
| Hawaiian / Pacific | 0 | 0.0% |
| Hispanic or Latino | 20 | 1.1% |
| Native / Alaskan | 0 | 0.0% |
| White / Caucasian | 1,668 | 94.7% |
| Two or more Races | 59 | 3.4% |
| Some other Race | 0 | 0.0% |
| Total | 1,761 | 100.0% |
Ancestry in Long Beach
The most populous ancestries reported in Long Beach are German (424 | 24.1%), English (348 | 19.8%), Irish (199 | 11.3%), Italian (142 | 8.1%), and American (130 | 7.4%), together accounting for 70.6% of all Long Beach residents.
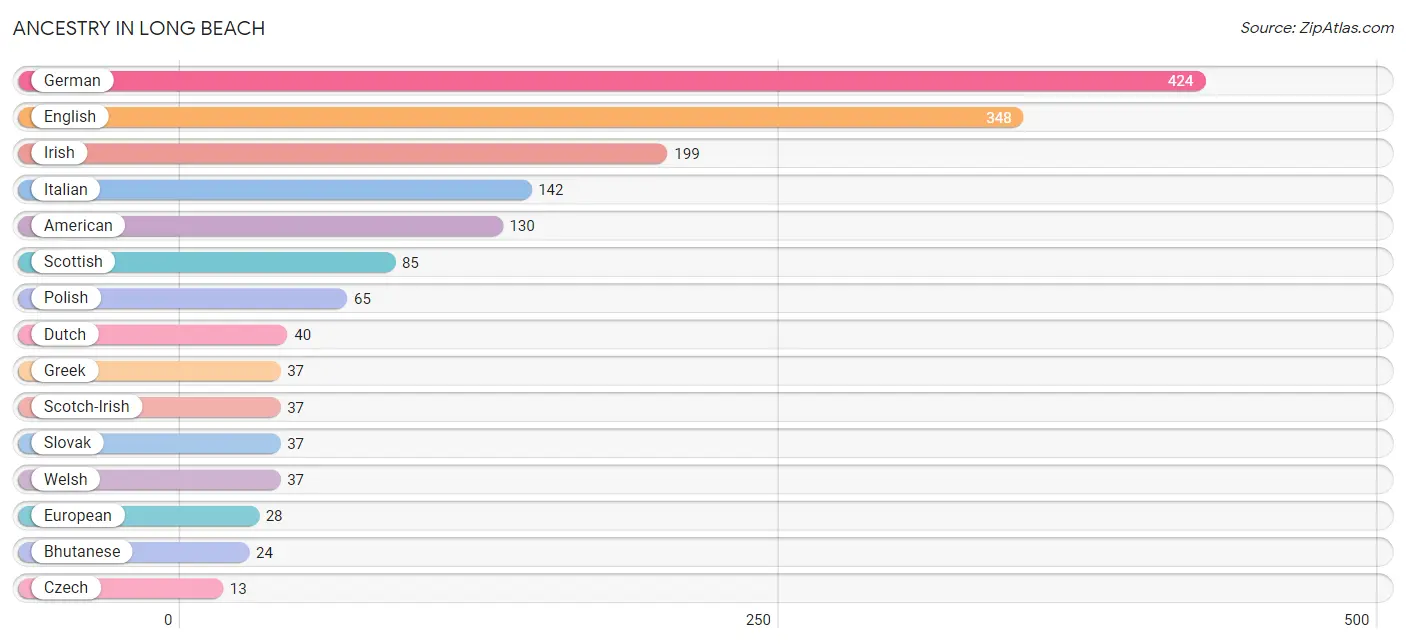
| Ancestry | # Population | % Population |
| African | 6 | 0.3% |
| American | 130 | 7.4% |
| Bhutanese | 24 | 1.4% |
| Colombian | 10 | 0.6% |
| Czech | 13 | 0.7% |
| Danish | 8 | 0.4% |
| Dutch | 40 | 2.3% |
| English | 348 | 19.8% |
| European | 28 | 1.6% |
| French | 13 | 0.7% |
| German | 424 | 24.1% |
| Greek | 37 | 2.1% |
| Hungarian | 8 | 0.4% |
| Irish | 199 | 11.3% |
| Italian | 142 | 8.1% |
| Mexican | 10 | 0.6% |
| Norwegian | 1 | 0.1% |
| Polish | 65 | 3.7% |
| Scotch-Irish | 37 | 2.1% |
| Scottish | 85 | 4.8% |
| Slovak | 37 | 2.1% |
| South American | 10 | 0.6% |
| Subsaharan African | 6 | 0.3% |
| Swiss | 8 | 0.4% |
| Welsh | 37 | 2.1% | View All 25 Rows |
Immigrants in Long Beach
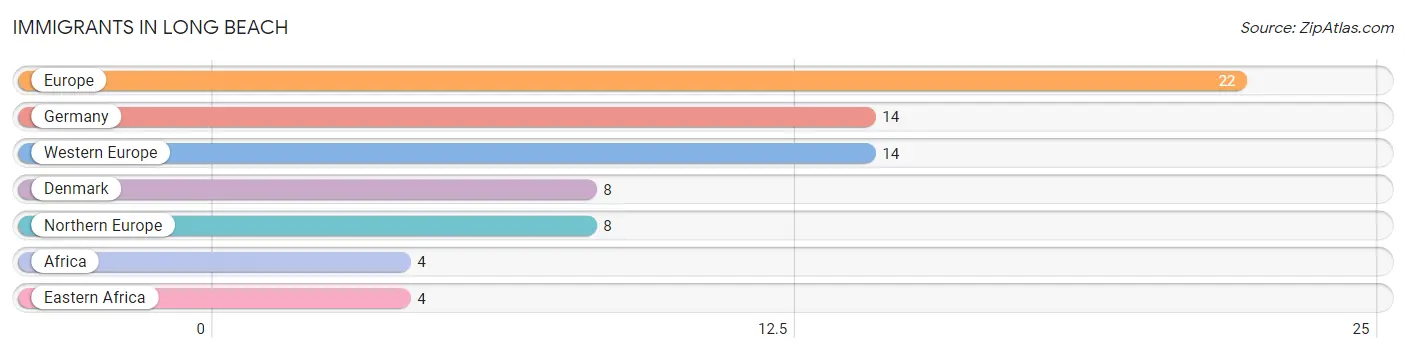
The most numerous immigrant groups reported in Long Beach came from Europe (22 | 1.3%), Germany (14 | 0.8%), Western Europe (14 | 0.8%), Denmark (8 | 0.4%), and Northern Europe (8 | 0.4%), together accounting for 3.7% of all Long Beach residents.
| Immigration Origin | # Population | % Population |
| Africa | 4 | 0.2% |
| Denmark | 8 | 0.4% |
| Eastern Africa | 4 | 0.2% |
| Europe | 22 | 1.3% |
| Germany | 14 | 0.8% |
| Northern Europe | 8 | 0.4% |
| Western Europe | 14 | 0.8% | View All 7 Rows |
Sex and Age in Long Beach
Sex and Age in Long Beach
The most populous age groups in Long Beach are 15 to 19 Years (132 | 13.6%) for men and 55 to 59 Years (167 | 21.1%) for women.
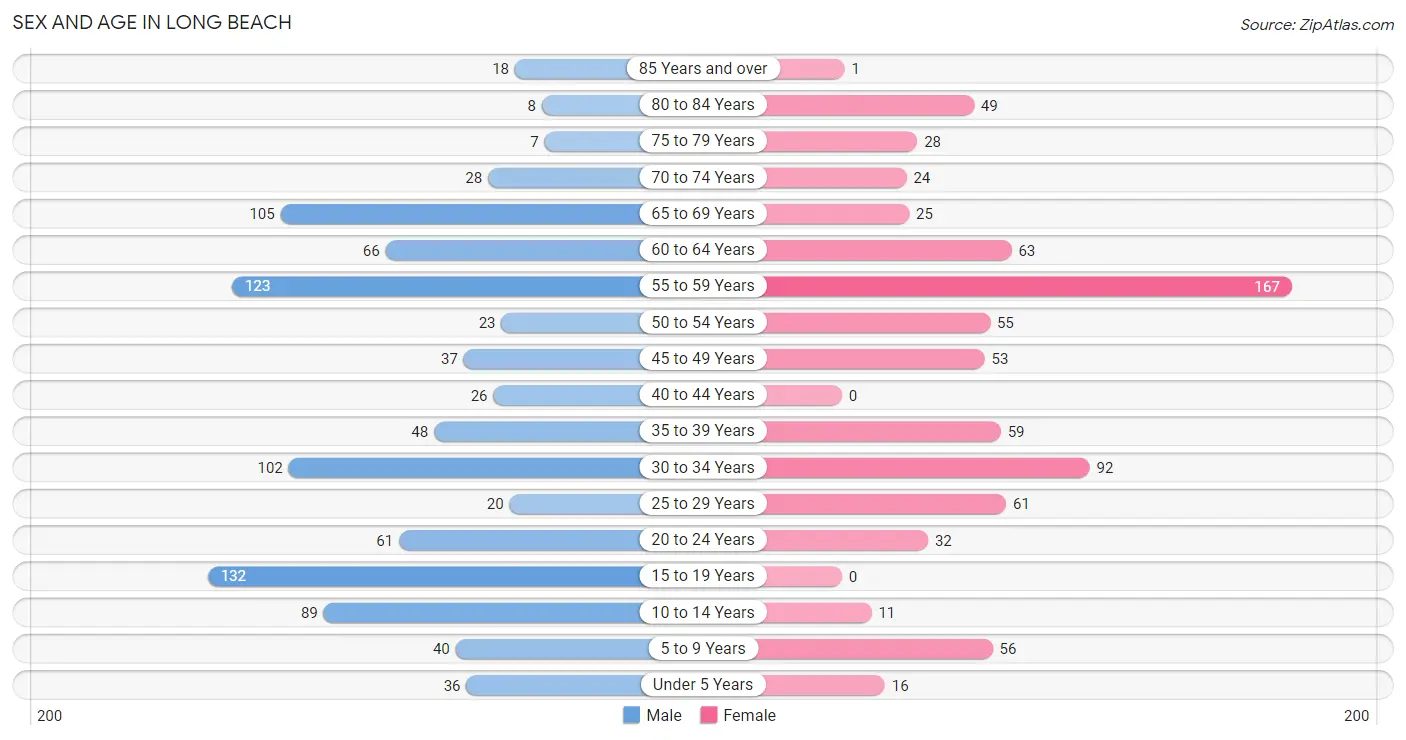
| Age Bracket | Male | Female |
| Under 5 Years | 36 (3.7%) | 16 (2.0%) |
| 5 to 9 Years | 40 (4.1%) | 56 (7.1%) |
| 10 to 14 Years | 89 (9.2%) | 11 (1.4%) |
| 15 to 19 Years | 132 (13.6%) | 0 (0.0%) |
| 20 to 24 Years | 61 (6.3%) | 32 (4.0%) |
| 25 to 29 Years | 20 (2.1%) | 61 (7.7%) |
| 30 to 34 Years | 102 (10.5%) | 92 (11.6%) |
| 35 to 39 Years | 48 (5.0%) | 59 (7.4%) |
| 40 to 44 Years | 26 (2.7%) | 0 (0.0%) |
| 45 to 49 Years | 37 (3.8%) | 53 (6.7%) |
| 50 to 54 Years | 23 (2.4%) | 55 (6.9%) |
| 55 to 59 Years | 123 (12.7%) | 167 (21.1%) |
| 60 to 64 Years | 66 (6.8%) | 63 (8.0%) |
| 65 to 69 Years | 105 (10.8%) | 25 (3.2%) |
| 70 to 74 Years | 28 (2.9%) | 24 (3.0%) |
| 75 to 79 Years | 7 (0.7%) | 28 (3.5%) |
| 80 to 84 Years | 8 (0.8%) | 49 (6.2%) |
| 85 Years and over | 18 (1.9%) | 1 (0.1%) |
| Total | 969 (100.0%) | 792 (100.0%) |
Families and Households in Long Beach
Median Family Size in Long Beach
The median family size in Long Beach is 3.08 persons per family, with single female/mother families (114 | 23.1%) accounting for the largest median family size of 3.75 persons per family. On the other hand, single male/father families (20 | 4.1%) represent the smallest median family size with 1.80 persons per family.
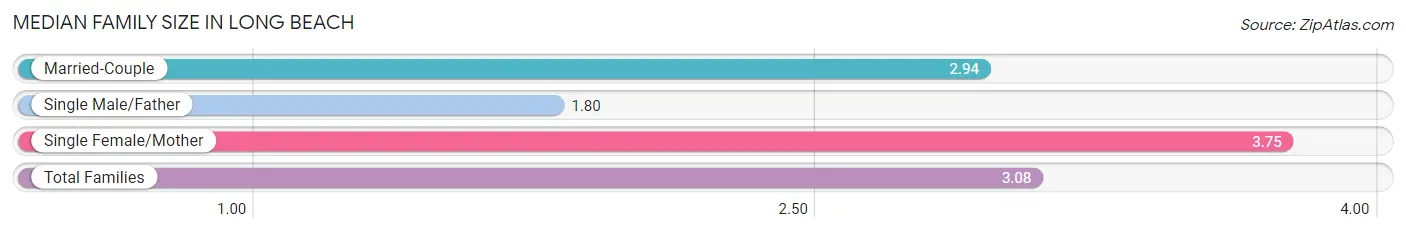
| Family Type | # Families | Family Size |
| Married-Couple | 360 (72.9%) | 2.94 |
| Single Male/Father | 20 (4.1%) | 1.80 |
| Single Female/Mother | 114 (23.1%) | 3.75 |
| Total Families | 494 (100.0%) | 3.08 |
Median Household Size in Long Beach
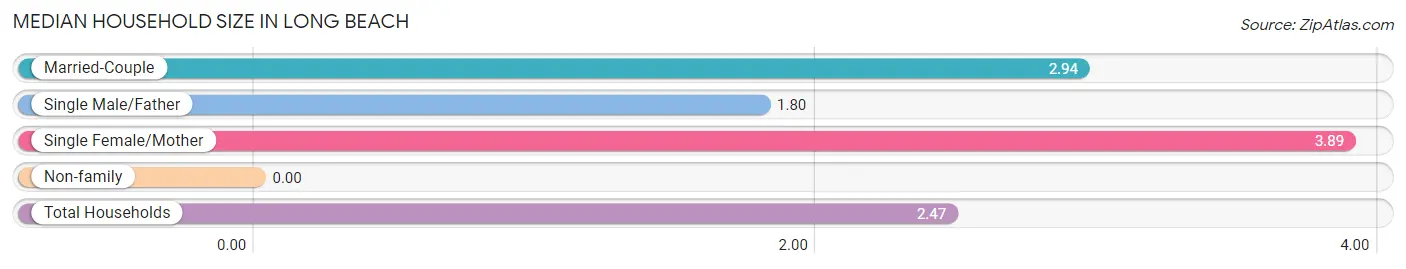
| Household Type | # Households | Household Size |
| Married-Couple | 360 (50.7%) | 2.94 |
| Single Male/Father | 20 (2.8%) | 1.80 |
| Single Female/Mother | 114 (16.1%) | 3.89 |
| Non-family | 216 (30.4%) | - |
| Total Households | 710 (100.0%) | 2.47 |
Household Size by Marriage Status in Long Beach
Out of a total of 710 households in Long Beach, 494 (69.6%) are family households, while 216 (30.4%) are nonfamily households. The most numerous type of family households are 2-person households, comprising 219, and the most common type of nonfamily households are 1-person households, comprising 216.
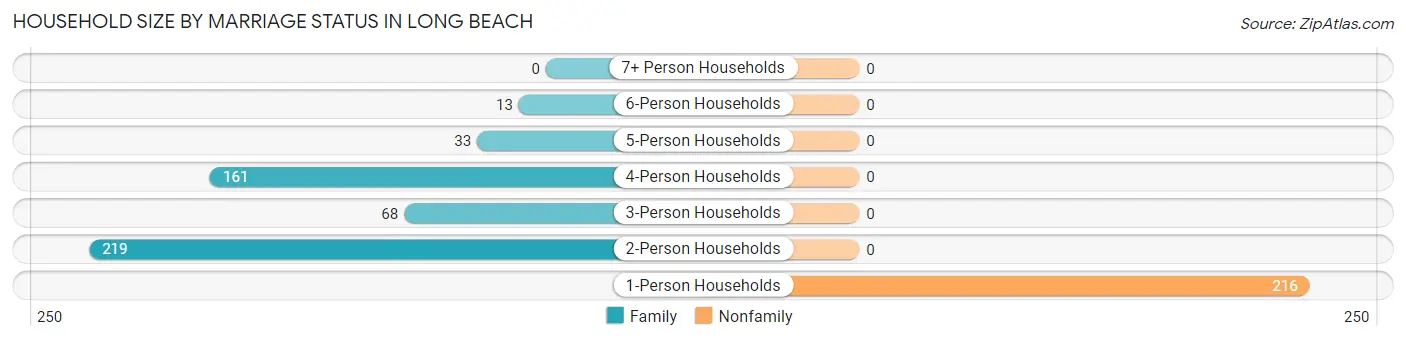
| Household Size | Family Households | Nonfamily Households |
| 1-Person Households | - | 216 (30.4%) |
| 2-Person Households | 219 (30.8%) | 0 (0.0%) |
| 3-Person Households | 68 (9.6%) | 0 (0.0%) |
| 4-Person Households | 161 (22.7%) | 0 (0.0%) |
| 5-Person Households | 33 (4.6%) | 0 (0.0%) |
| 6-Person Households | 13 (1.8%) | 0 (0.0%) |
| 7+ Person Households | 0 (0.0%) | 0 (0.0%) |
| Total | 494 (69.6%) | 216 (30.4%) |
Female Fertility in Long Beach
Fertility by Age in Long Beach
Average fertility rate in Long Beach is 81.0 births per 1,000 women. Women in the age bracket of 20 to 34 years have the highest fertility rate with 141.0 births per 1,000 women. Women in the age bracket of 20 to 34 years acount for 100.0% of all women with births.
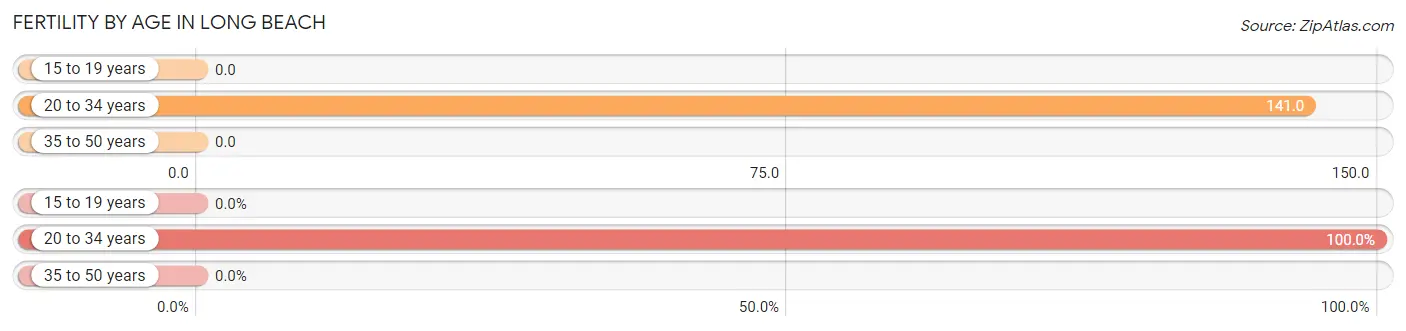
| Age Bracket | Women with Births | Births / 1,000 Women |
| 15 to 19 years | 0 (0.0%) | 0.0 |
| 20 to 34 years | 26 (100.0%) | 141.0 |
| 35 to 50 years | 0 (0.0%) | 0.0 |
| Total | 26 (100.0%) | 81.0 |
Fertility by Age by Marriage Status in Long Beach
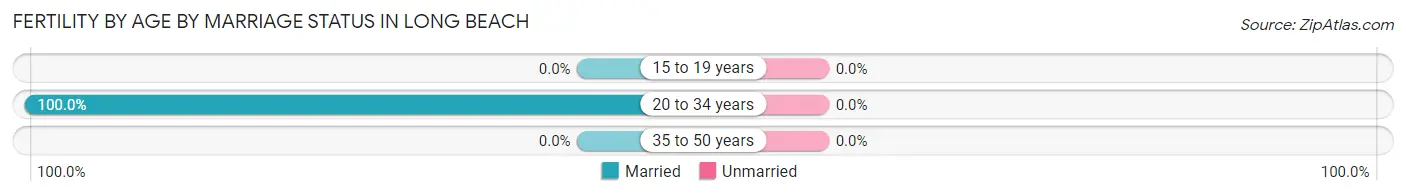
| Age Bracket | Married | Unmarried |
| 15 to 19 years | 0 (0.0%) | 0 (0.0%) |
| 20 to 34 years | 26 (100.0%) | 0 (0.0%) |
| 35 to 50 years | 0 (0.0%) | 0 (0.0%) |
| Total | 26 (100.0%) | 0 (0.0%) |
Fertility by Education in Long Beach
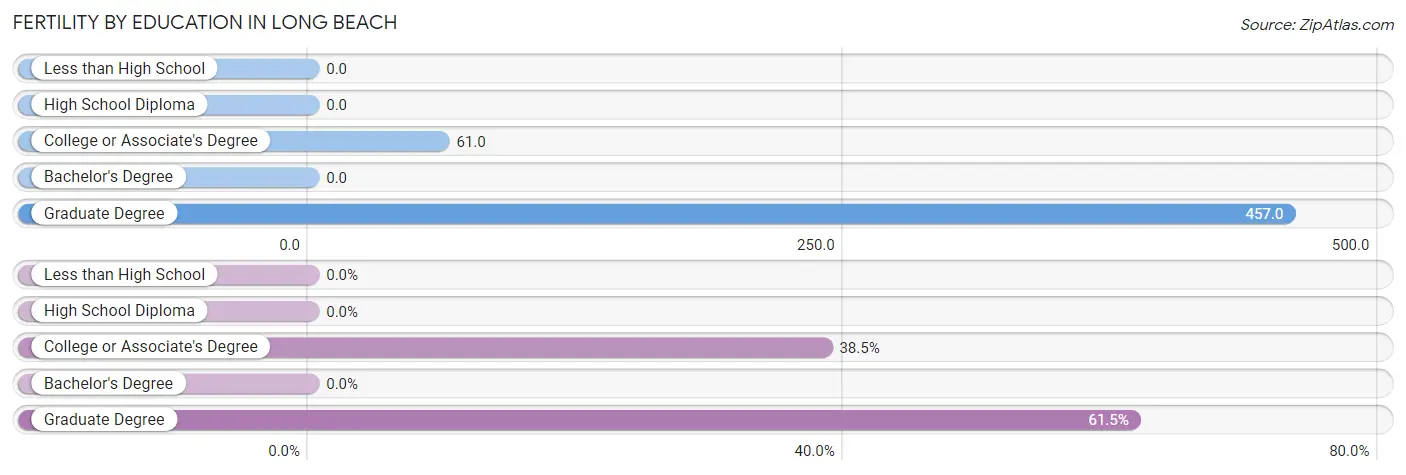
| Educational Attainment | Women with Births | Births / 1,000 Women |
| Less than High School | 0 (0.0%) | 0.0 |
| High School Diploma | 0 (0.0%) | 0.0 |
| College or Associate's Degree | 10 (38.5%) | 61.0 |
| Bachelor's Degree | 0 (0.0%) | 0.0 |
| Graduate Degree | 16 (61.5%) | 457.0 |
| Total | 26 (100.0%) | 81.0 |
Fertility by Education by Marriage Status in Long Beach
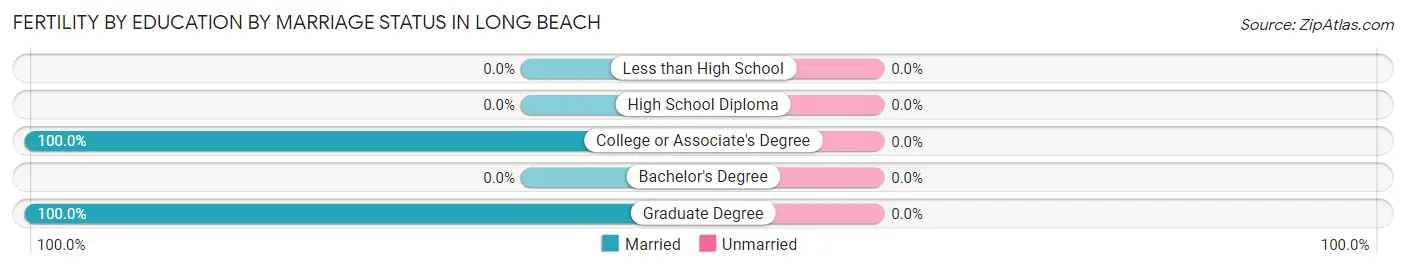
| Educational Attainment | Married | Unmarried |
| Less than High School | 0 (0.0%) | 0 (0.0%) |
| High School Diploma | 0 (0.0%) | 0 (0.0%) |
| College or Associate's Degree | 10 (100.0%) | 0 (0.0%) |
| Bachelor's Degree | 0 (0.0%) | 0 (0.0%) |
| Graduate Degree | 16 (100.0%) | 0 (0.0%) |
| Total | 26 (100.0%) | 0 (0.0%) |
Employment Characteristics in Long Beach
Employment by Class of Employer in Long Beach
Among the 1,000 employed individuals in Long Beach, private company employees (663 | 66.3%), local government employees (144 | 14.4%), and federal government employees (68 | 6.8%) make up the most common classes of employment.
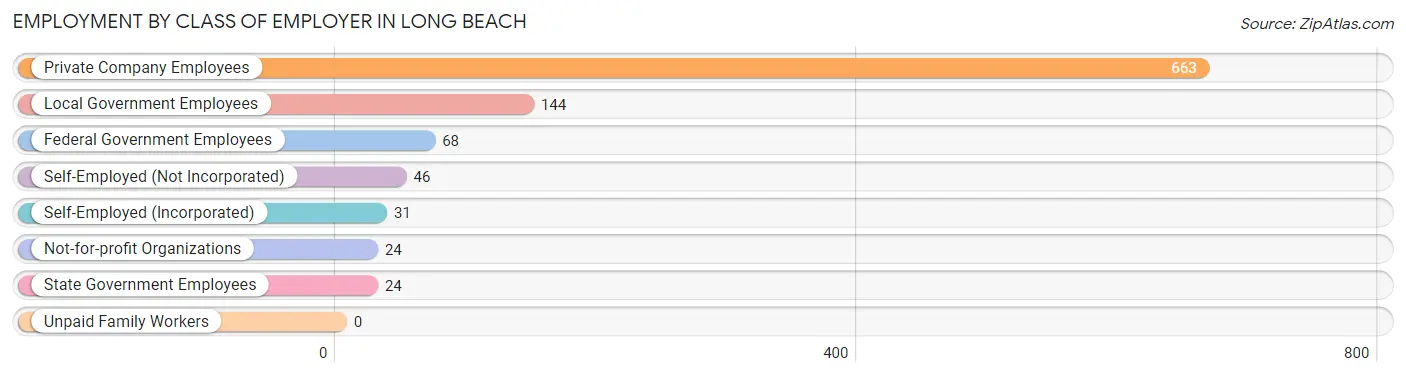
| Employer Class | # Employees | % Employees |
| Private Company Employees | 663 | 66.3% |
| Self-Employed (Incorporated) | 31 | 3.1% |
| Self-Employed (Not Incorporated) | 46 | 4.6% |
| Not-for-profit Organizations | 24 | 2.4% |
| Local Government Employees | 144 | 14.4% |
| State Government Employees | 24 | 2.4% |
| Federal Government Employees | 68 | 6.8% |
| Unpaid Family Workers | 0 | 0.0% |
| Total | 1,000 | 100.0% |
Employment Status by Age in Long Beach
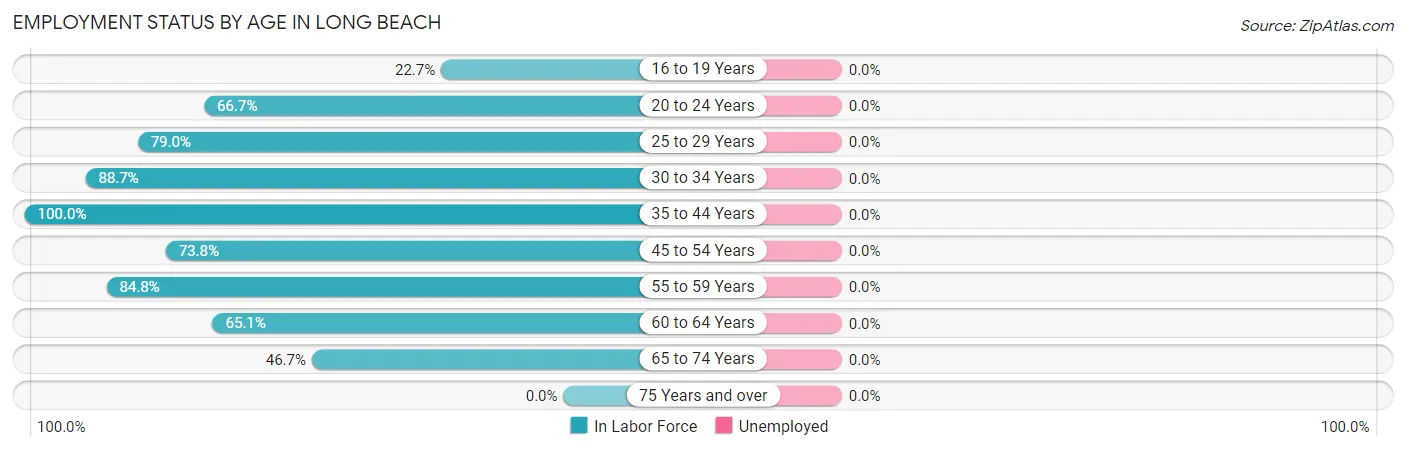
| Age Bracket | In Labor Force | Unemployed |
| 16 to 19 Years | 30 (22.7%) | 0 (0.0%) |
| 20 to 24 Years | 62 (66.7%) | 0 (0.0%) |
| 25 to 29 Years | 64 (79.0%) | 0 (0.0%) |
| 30 to 34 Years | 172 (88.7%) | 0 (0.0%) |
| 35 to 44 Years | 133 (100.0%) | 0 (0.0%) |
| 45 to 54 Years | 124 (73.8%) | 0 (0.0%) |
| 55 to 59 Years | 246 (84.8%) | 0 (0.0%) |
| 60 to 64 Years | 84 (65.1%) | 0 (0.0%) |
| 65 to 74 Years | 85 (46.7%) | 0 (0.0%) |
| 75 Years and over | 0 (0.0%) | 0 (0.0%) |
| Total | 1,000 (66.1%) | 0 (0.0%) |
Employment Status by Educational Attainment in Long Beach
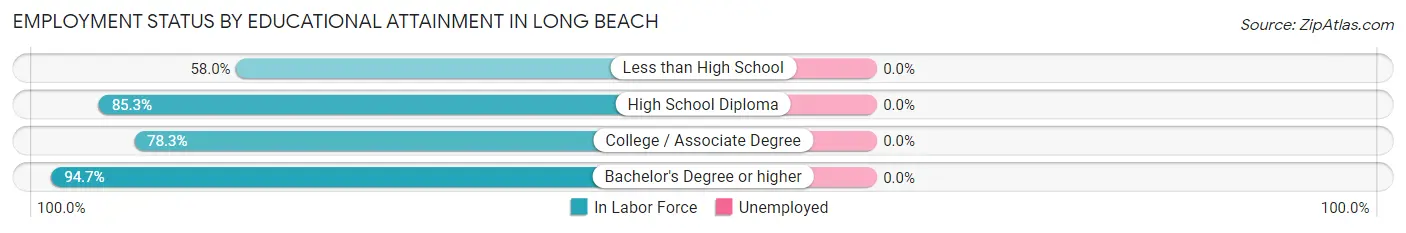
| Educational Attainment | In Labor Force | Unemployed |
| Less than High School | 40 (58.0%) | 0 (0.0%) |
| High School Diploma | 209 (85.3%) | 0 (0.0%) |
| College / Associate Degree | 340 (78.3%) | 0 (0.0%) |
| Bachelor's Degree or higher | 234 (94.7%) | 0 (0.0%) |
| Total | 823 (82.7%) | 0 (0.0%) |
Employment Occupations by Sex in Long Beach
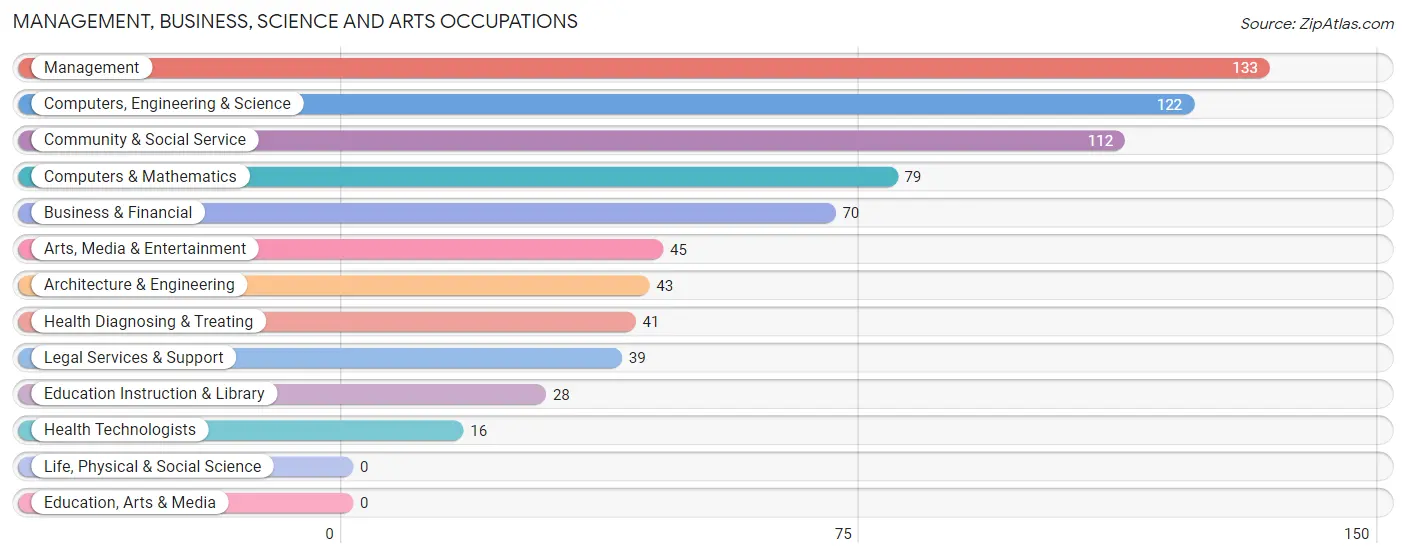
Management, Business, Science and Arts Occupations
The most common Management, Business, Science and Arts occupations in Long Beach are Management (133 | 13.3%), Computers, Engineering & Science (122 | 12.2%), Community & Social Service (112 | 11.2%), Computers & Mathematics (79 | 7.9%), and Business & Financial (70 | 7.0%).
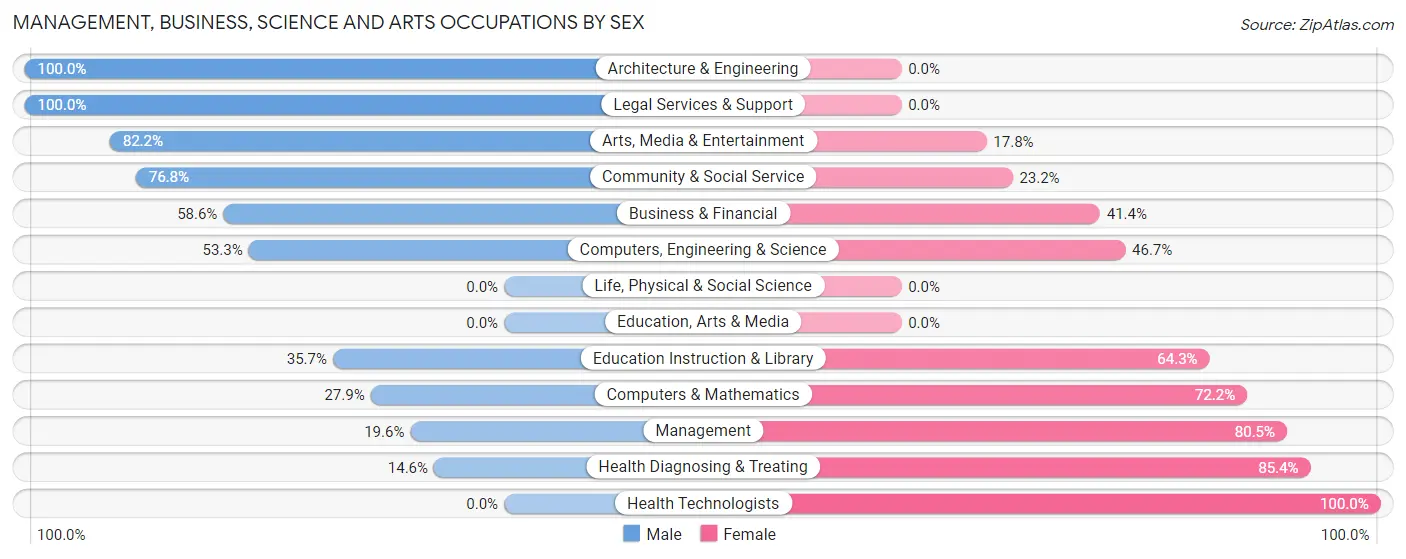
Management, Business, Science and Arts Occupations by Sex
Within the Management, Business, Science and Arts occupations in Long Beach, the most male-oriented occupations are Architecture & Engineering (100.0%), Legal Services & Support (100.0%), and Arts, Media & Entertainment (82.2%), while the most female-oriented occupations are Health Technologists (100.0%), Health Diagnosing & Treating (85.4%), and Management (80.4%).
| Occupation | Male | Female |
| Management | 26 (19.6%) | 107 (80.4%) |
| Business & Financial | 41 (58.6%) | 29 (41.4%) |
| Computers, Engineering & Science | 65 (53.3%) | 57 (46.7%) |
| Computers & Mathematics | 22 (27.9%) | 57 (72.2%) |
| Architecture & Engineering | 43 (100.0%) | 0 (0.0%) |
| Life, Physical & Social Science | 0 (0.0%) | 0 (0.0%) |
| Community & Social Service | 86 (76.8%) | 26 (23.2%) |
| Education, Arts & Media | 0 (0.0%) | 0 (0.0%) |
| Legal Services & Support | 39 (100.0%) | 0 (0.0%) |
| Education Instruction & Library | 10 (35.7%) | 18 (64.3%) |
| Arts, Media & Entertainment | 37 (82.2%) | 8 (17.8%) |
| Health Diagnosing & Treating | 6 (14.6%) | 35 (85.4%) |
| Health Technologists | 0 (0.0%) | 16 (100.0%) |
| Total (Category) | 224 (46.9%) | 254 (53.1%) |
| Total (Overall) | 532 (53.2%) | 468 (46.8%) |
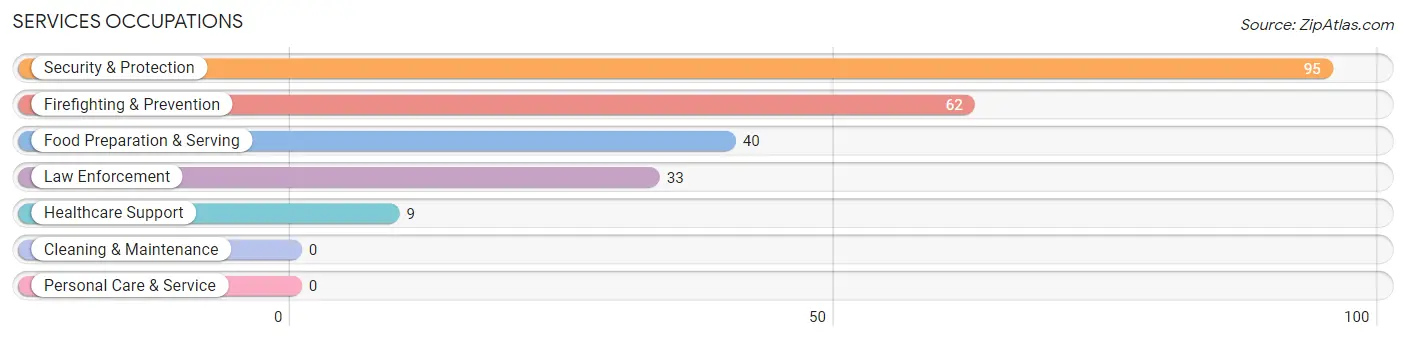
Services Occupations
The most common Services occupations in Long Beach are Security & Protection (95 | 9.5%), Firefighting & Prevention (62 | 6.2%), Food Preparation & Serving (40 | 4.0%), Law Enforcement (33 | 3.3%), and Healthcare Support (9 | 0.9%).
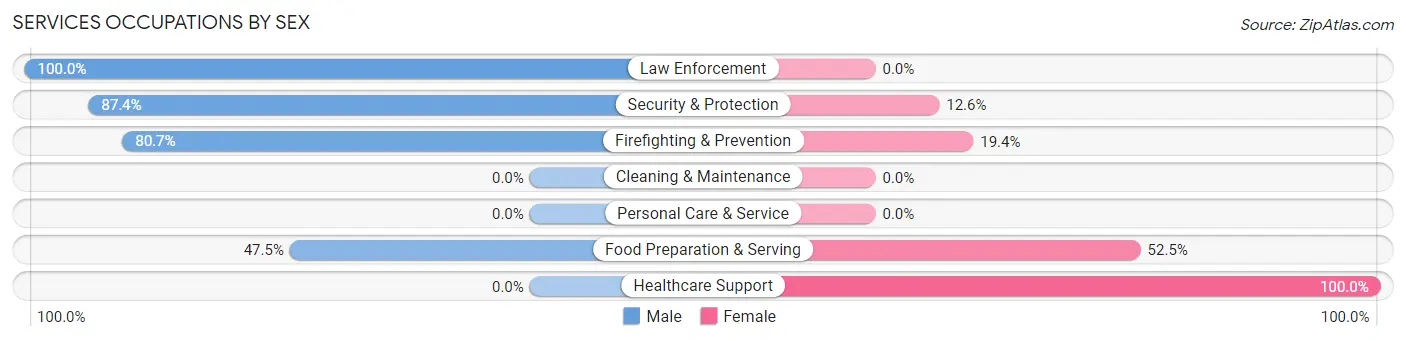
Services Occupations by Sex
Within the Services occupations in Long Beach, the most male-oriented occupations are Law Enforcement (100.0%), Security & Protection (87.4%), and Firefighting & Prevention (80.6%), while the most female-oriented occupations are Healthcare Support (100.0%), Food Preparation & Serving (52.5%), and Firefighting & Prevention (19.4%).
| Occupation | Male | Female |
| Healthcare Support | 0 (0.0%) | 9 (100.0%) |
| Security & Protection | 83 (87.4%) | 12 (12.6%) |
| Firefighting & Prevention | 50 (80.6%) | 12 (19.4%) |
| Law Enforcement | 33 (100.0%) | 0 (0.0%) |
| Food Preparation & Serving | 19 (47.5%) | 21 (52.5%) |
| Cleaning & Maintenance | 0 (0.0%) | 0 (0.0%) |
| Personal Care & Service | 0 (0.0%) | 0 (0.0%) |
| Total (Category) | 102 (70.8%) | 42 (29.2%) |
| Total (Overall) | 532 (53.2%) | 468 (46.8%) |
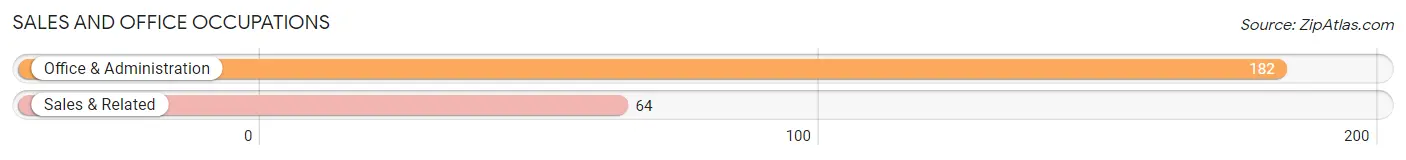
Sales and Office Occupations
The most common Sales and Office occupations in Long Beach are Office & Administration (182 | 18.2%), and Sales & Related (64 | 6.4%).
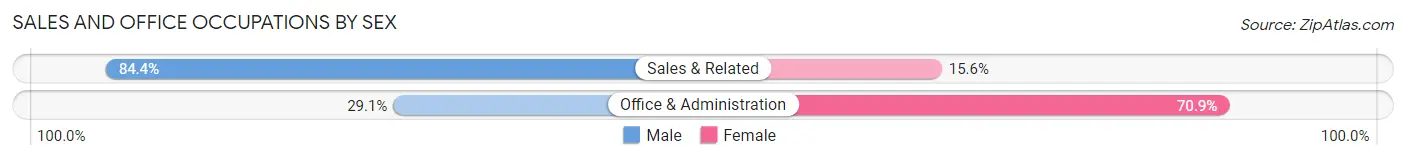
Sales and Office Occupations by Sex
| Occupation | Male | Female |
| Sales & Related | 54 (84.4%) | 10 (15.6%) |
| Office & Administration | 53 (29.1%) | 129 (70.9%) |
| Total (Category) | 107 (43.5%) | 139 (56.5%) |
| Total (Overall) | 532 (53.2%) | 468 (46.8%) |
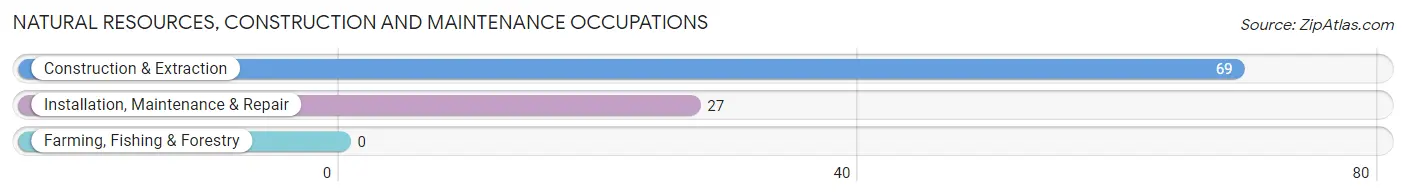
Natural Resources, Construction and Maintenance Occupations
The most common Natural Resources, Construction and Maintenance occupations in Long Beach are Construction & Extraction (69 | 6.9%), and Installation, Maintenance & Repair (27 | 2.7%).
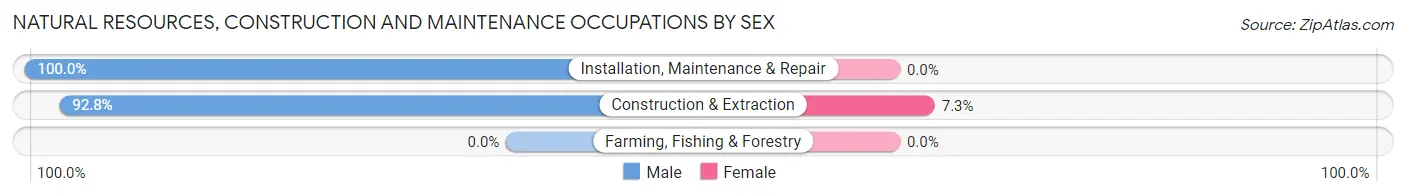
Natural Resources, Construction and Maintenance Occupations by Sex
| Occupation | Male | Female |
| Farming, Fishing & Forestry | 0 (0.0%) | 0 (0.0%) |
| Construction & Extraction | 64 (92.7%) | 5 (7.2%) |
| Installation, Maintenance & Repair | 27 (100.0%) | 0 (0.0%) |
| Total (Category) | 91 (94.8%) | 5 (5.2%) |
| Total (Overall) | 532 (53.2%) | 468 (46.8%) |
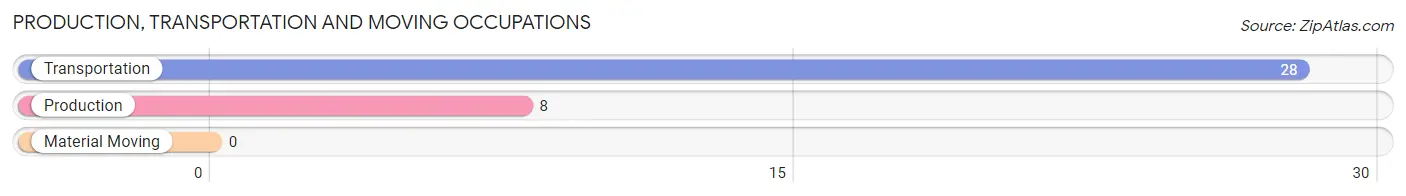
Production, Transportation and Moving Occupations
The most common Production, Transportation and Moving occupations in Long Beach are Transportation (28 | 2.8%), and Production (8 | 0.8%).
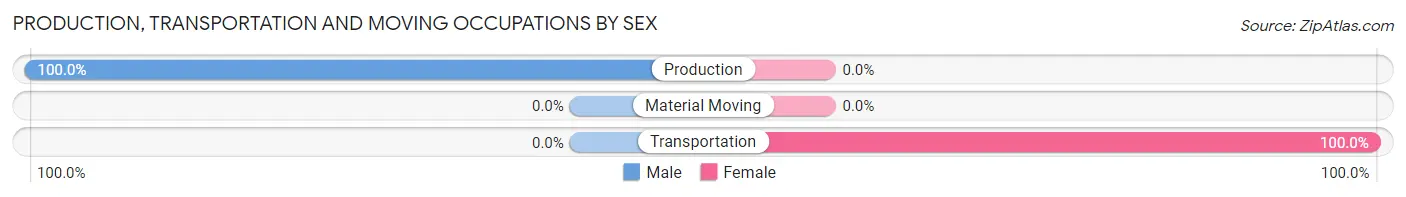
Production, Transportation and Moving Occupations by Sex
| Occupation | Male | Female |
| Production | 8 (100.0%) | 0 (0.0%) |
| Transportation | 0 (0.0%) | 28 (100.0%) |
| Material Moving | 0 (0.0%) | 0 (0.0%) |
| Total (Category) | 8 (22.2%) | 28 (77.8%) |
| Total (Overall) | 532 (53.2%) | 468 (46.8%) |
Employment Industries by Sex in Long Beach
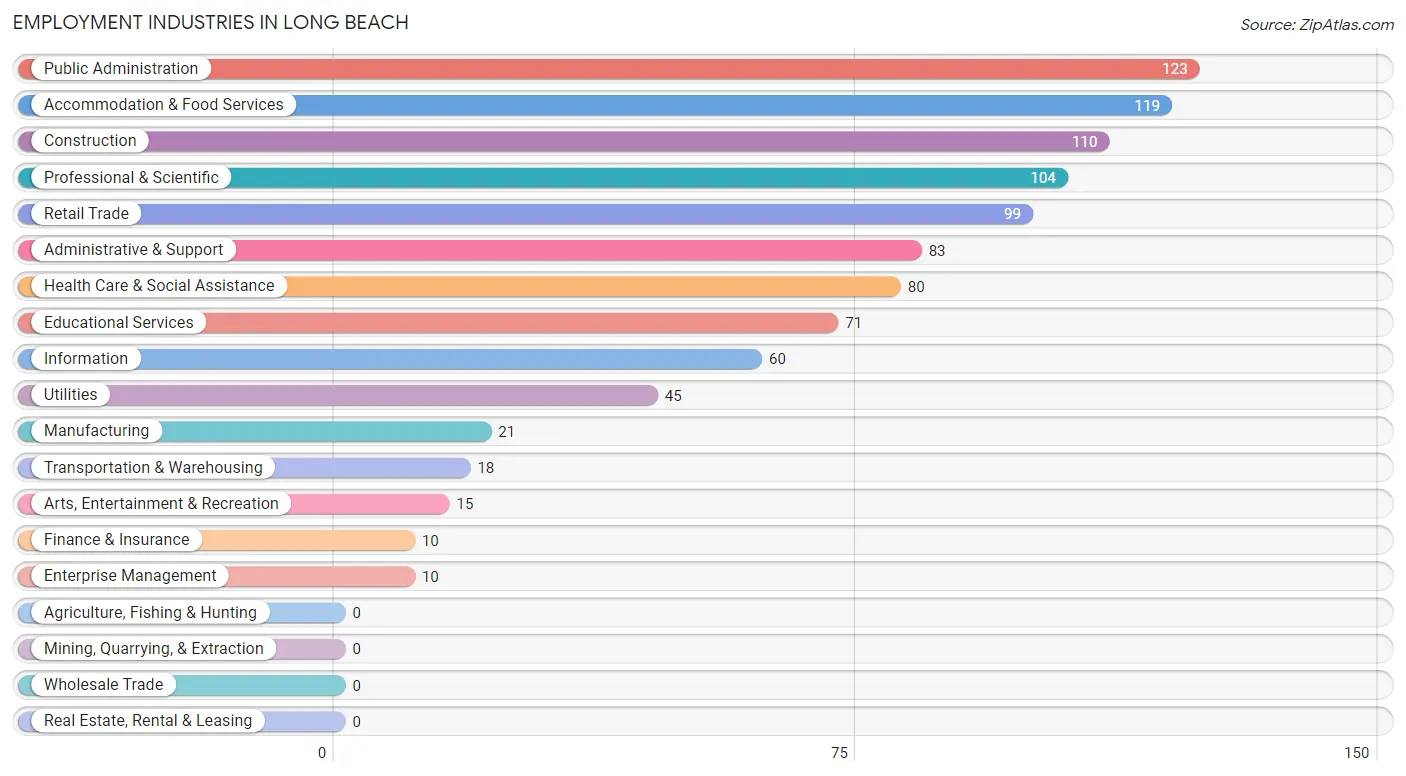
Employment Industries in Long Beach
The major employment industries in Long Beach include Public Administration (123 | 12.3%), Accommodation & Food Services (119 | 11.9%), Construction (110 | 11.0%), Professional & Scientific (104 | 10.4%), and Retail Trade (99 | 9.9%).
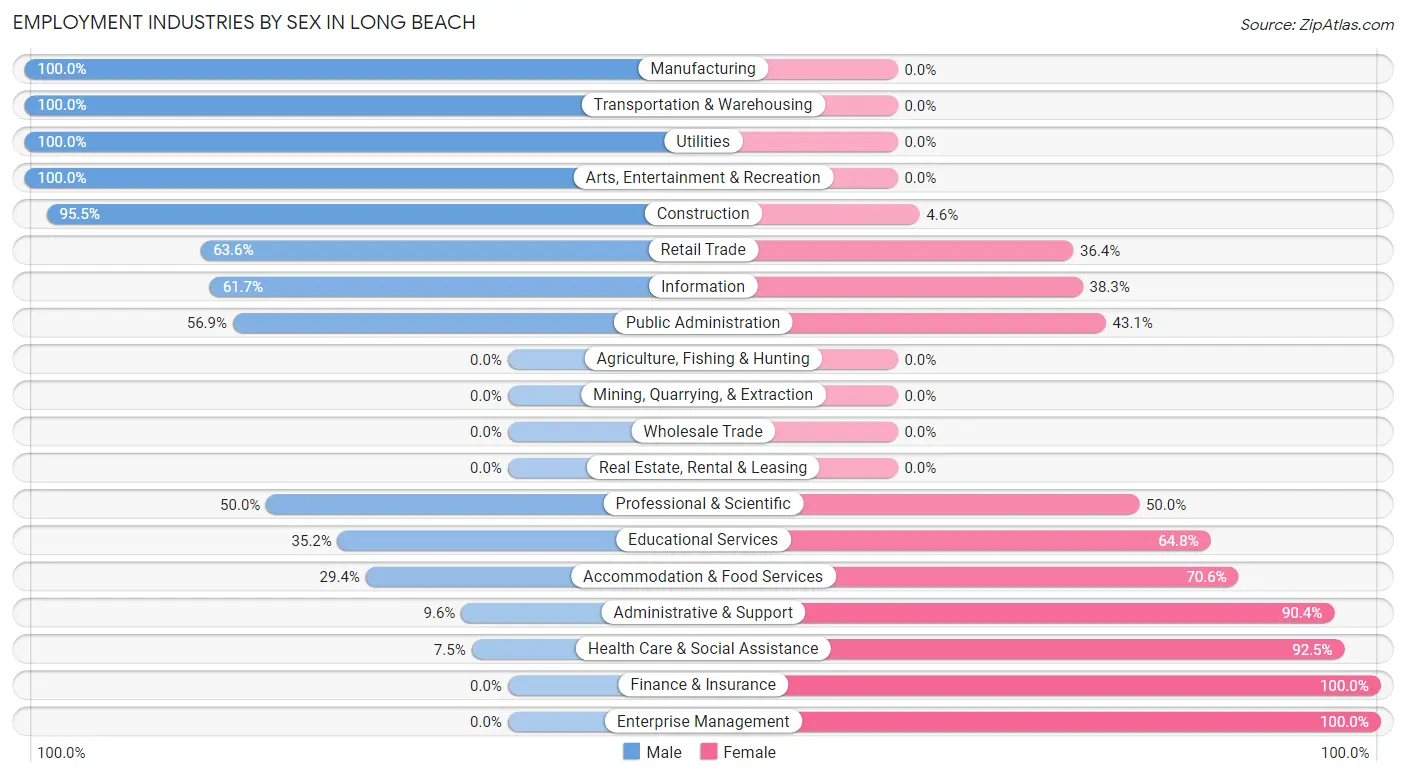
Employment Industries by Sex in Long Beach
The Long Beach industries that see more men than women are Manufacturing (100.0%), Transportation & Warehousing (100.0%), and Utilities (100.0%), whereas the industries that tend to have a higher number of women are Finance & Insurance (100.0%), Enterprise Management (100.0%), and Health Care & Social Assistance (92.5%).
| Industry | Male | Female |
| Agriculture, Fishing & Hunting | 0 (0.0%) | 0 (0.0%) |
| Mining, Quarrying, & Extraction | 0 (0.0%) | 0 (0.0%) |
| Construction | 105 (95.5%) | 5 (4.5%) |
| Manufacturing | 21 (100.0%) | 0 (0.0%) |
| Wholesale Trade | 0 (0.0%) | 0 (0.0%) |
| Retail Trade | 63 (63.6%) | 36 (36.4%) |
| Transportation & Warehousing | 18 (100.0%) | 0 (0.0%) |
| Utilities | 45 (100.0%) | 0 (0.0%) |
| Information | 37 (61.7%) | 23 (38.3%) |
| Finance & Insurance | 0 (0.0%) | 10 (100.0%) |
| Real Estate, Rental & Leasing | 0 (0.0%) | 0 (0.0%) |
| Professional & Scientific | 52 (50.0%) | 52 (50.0%) |
| Enterprise Management | 0 (0.0%) | 10 (100.0%) |
| Administrative & Support | 8 (9.6%) | 75 (90.4%) |
| Educational Services | 25 (35.2%) | 46 (64.8%) |
| Health Care & Social Assistance | 6 (7.5%) | 74 (92.5%) |
| Arts, Entertainment & Recreation | 15 (100.0%) | 0 (0.0%) |
| Accommodation & Food Services | 35 (29.4%) | 84 (70.6%) |
| Public Administration | 70 (56.9%) | 53 (43.1%) |
| Total | 532 (53.2%) | 468 (46.8%) |
Education in Long Beach
School Enrollment in Long Beach
The most common levels of schooling among the 397 students in Long Beach are high school (175 | 44.1%), college / undergraduate (99 | 24.9%), and elementary school (67 | 16.9%).
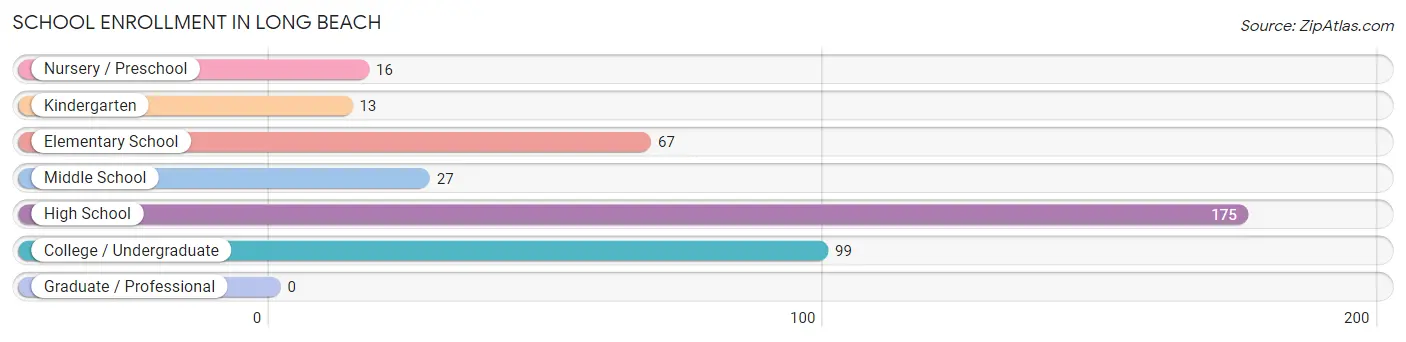
| School Level | # Students | % Students |
| Nursery / Preschool | 16 | 4.0% |
| Kindergarten | 13 | 3.3% |
| Elementary School | 67 | 16.9% |
| Middle School | 27 | 6.8% |
| High School | 175 | 44.1% |
| College / Undergraduate | 99 | 24.9% |
| Graduate / Professional | 0 | 0.0% |
| Total | 397 | 100.0% |
School Enrollment by Age by Funding Source in Long Beach
Out of a total of 397 students who are enrolled in schools in Long Beach, 101 (25.4%) attend a private institution, while the remaining 296 (74.6%) are enrolled in public schools. The age group of 20 to 24 year olds has the highest likelihood of being enrolled in private schools, with 34 (100.0% in the age bracket) enrolled. Conversely, the age group of 5 to 9 year old has the lowest likelihood of being enrolled in a private school, with 96 (100.0% in the age bracket) attending a public institution.
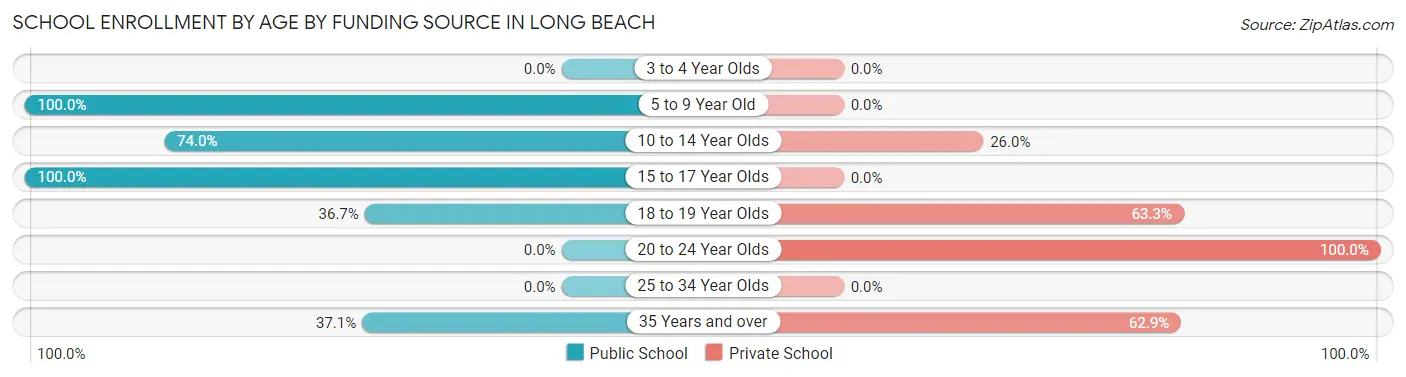
| Age Bracket | Public School | Private School |
| 3 to 4 Year Olds | 0 (0.0%) | 0 (0.0%) |
| 5 to 9 Year Old | 96 (100.0%) | 0 (0.0%) |
| 10 to 14 Year Olds | 74 (74.0%) | 26 (26.0%) |
| 15 to 17 Year Olds | 102 (100.0%) | 0 (0.0%) |
| 18 to 19 Year Olds | 11 (36.7%) | 19 (63.3%) |
| 20 to 24 Year Olds | 0 (0.0%) | 34 (100.0%) |
| 25 to 34 Year Olds | 0 (0.0%) | 0 (0.0%) |
| 35 Years and over | 13 (37.1%) | 22 (62.9%) |
| Total | 296 (74.6%) | 101 (25.4%) |
Educational Attainment by Field of Study in Long Beach
Business (95 | 29.1%), psychology (57 | 17.5%), science & technology (37 | 11.4%), literature & languages (37 | 11.4%), and arts & humanities (24 | 7.4%) are the most common fields of study among 326 individuals in Long Beach who have obtained a bachelor's degree or higher.
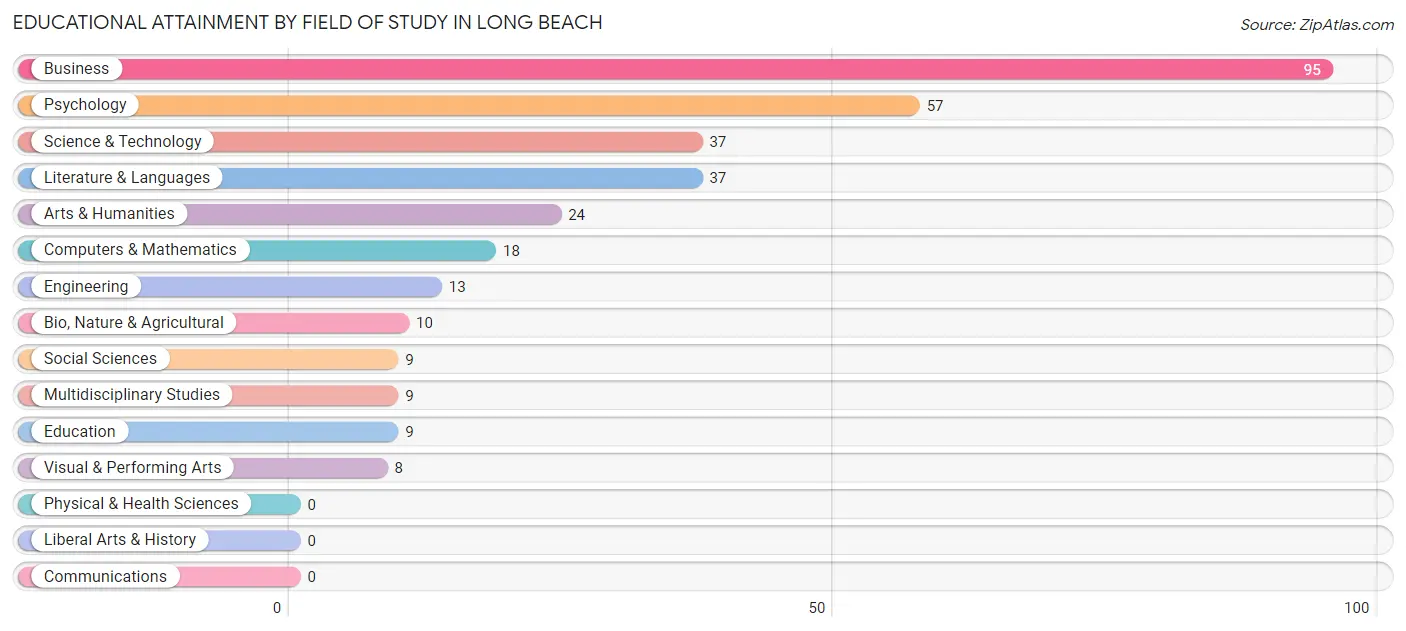
| Field of Study | # Graduates | % Graduates |
| Computers & Mathematics | 18 | 5.5% |
| Bio, Nature & Agricultural | 10 | 3.1% |
| Physical & Health Sciences | 0 | 0.0% |
| Psychology | 57 | 17.5% |
| Social Sciences | 9 | 2.8% |
| Engineering | 13 | 4.0% |
| Multidisciplinary Studies | 9 | 2.8% |
| Science & Technology | 37 | 11.4% |
| Business | 95 | 29.1% |
| Education | 9 | 2.8% |
| Literature & Languages | 37 | 11.4% |
| Liberal Arts & History | 0 | 0.0% |
| Visual & Performing Arts | 8 | 2.5% |
| Communications | 0 | 0.0% |
| Arts & Humanities | 24 | 7.4% |
| Total | 326 | 100.0% |
Transportation & Commute in Long Beach
Vehicle Availability by Sex in Long Beach
The most prevalent vehicle ownership categories in Long Beach are males with 3 vehicles (229, accounting for 43.0%) and females with 3 vehicles (144, making up 48.9%).
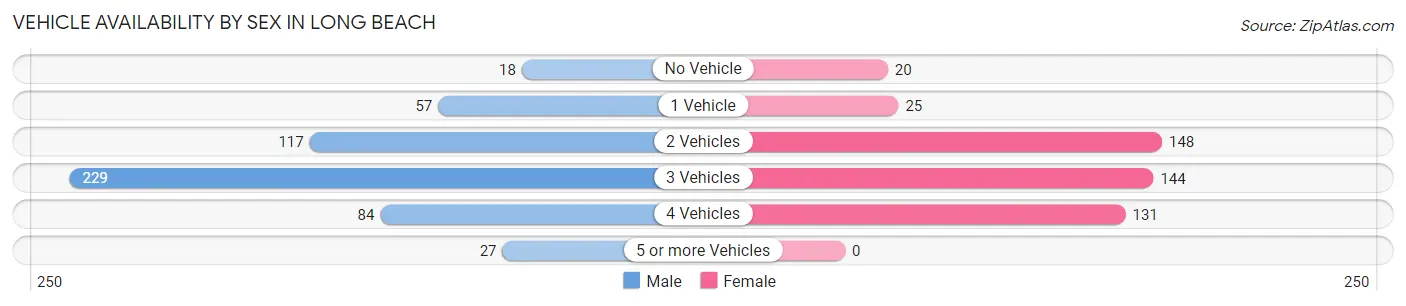
| Vehicles Available | Male | Female |
| No Vehicle | 18 (3.4%) | 20 (4.3%) |
| 1 Vehicle | 57 (10.7%) | 25 (5.3%) |
| 2 Vehicles | 117 (22.0%) | 148 (31.6%) |
| 3 Vehicles | 229 (43.0%) | 144 (30.8%) |
| 4 Vehicles | 84 (15.8%) | 131 (28.0%) |
| 5 or more Vehicles | 27 (5.1%) | 0 (0.0%) |
| Total | 532 (100.0%) | 468 (100.0%) |
Commute Time in Long Beach
The most frequently occuring commute durations in Long Beach are 15 to 19 minutes (202 commuters, 23.0%), 90 or more minutes (124 commuters, 14.1%), and 45 to 59 minutes (108 commuters, 12.3%).
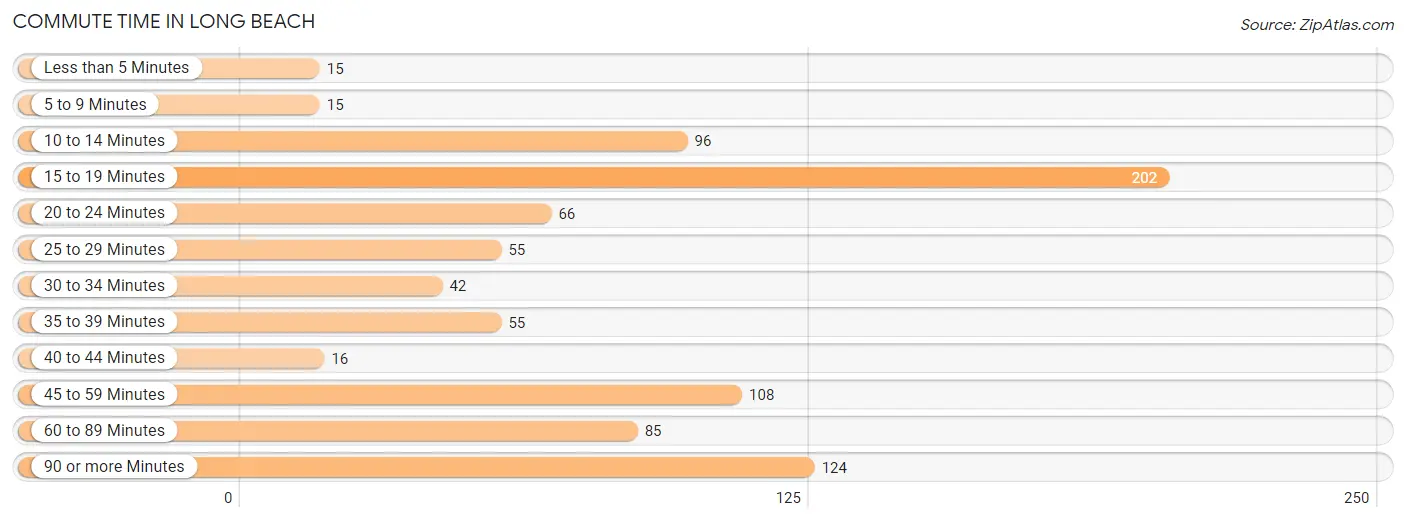
| Commute Time | # Commuters | % Commuters |
| Less than 5 Minutes | 15 | 1.7% |
| 5 to 9 Minutes | 15 | 1.7% |
| 10 to 14 Minutes | 96 | 10.9% |
| 15 to 19 Minutes | 202 | 23.0% |
| 20 to 24 Minutes | 66 | 7.5% |
| 25 to 29 Minutes | 55 | 6.3% |
| 30 to 34 Minutes | 42 | 4.8% |
| 35 to 39 Minutes | 55 | 6.3% |
| 40 to 44 Minutes | 16 | 1.8% |
| 45 to 59 Minutes | 108 | 12.3% |
| 60 to 89 Minutes | 85 | 9.7% |
| 90 or more Minutes | 124 | 14.1% |
Commute Time by Sex in Long Beach
The most common commute times in Long Beach are 15 to 19 minutes (112 commuters, 25.0%) for males and 15 to 19 minutes (90 commuters, 20.9%) for females.
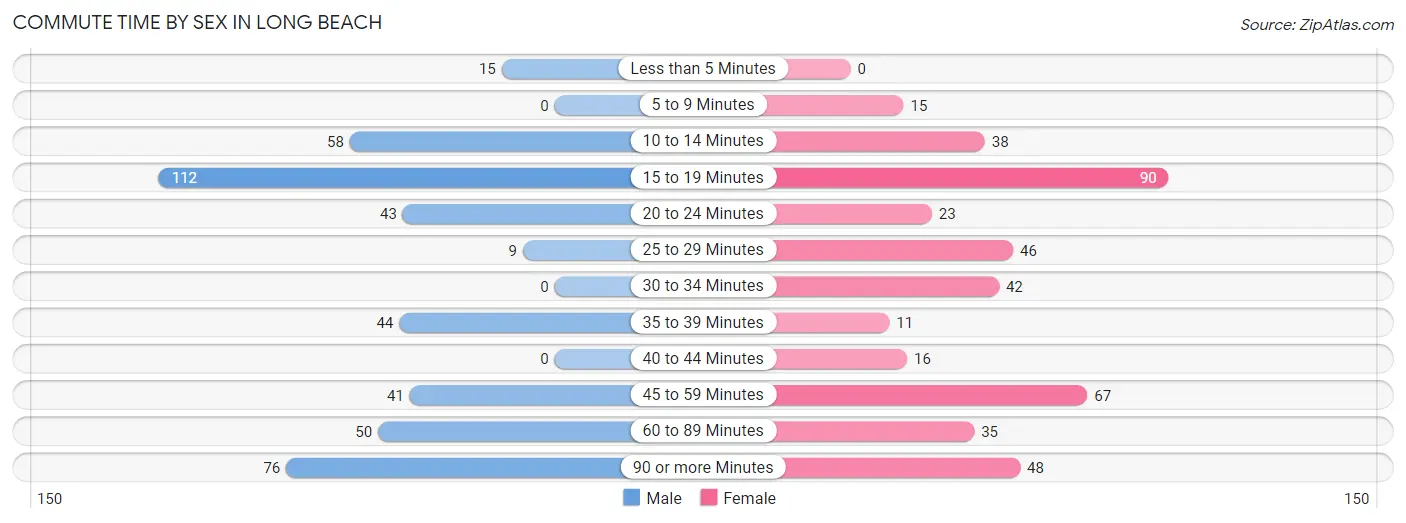
| Commute Time | Male | Female |
| Less than 5 Minutes | 15 (3.4%) | 0 (0.0%) |
| 5 to 9 Minutes | 0 (0.0%) | 15 (3.5%) |
| 10 to 14 Minutes | 58 (13.0%) | 38 (8.8%) |
| 15 to 19 Minutes | 112 (25.0%) | 90 (20.9%) |
| 20 to 24 Minutes | 43 (9.6%) | 23 (5.3%) |
| 25 to 29 Minutes | 9 (2.0%) | 46 (10.7%) |
| 30 to 34 Minutes | 0 (0.0%) | 42 (9.7%) |
| 35 to 39 Minutes | 44 (9.8%) | 11 (2.5%) |
| 40 to 44 Minutes | 0 (0.0%) | 16 (3.7%) |
| 45 to 59 Minutes | 41 (9.1%) | 67 (15.5%) |
| 60 to 89 Minutes | 50 (11.2%) | 35 (8.1%) |
| 90 or more Minutes | 76 (17.0%) | 48 (11.1%) |
Time of Departure to Work by Sex in Long Beach
The most frequent times of departure to work in Long Beach are 12:00 AM to 4:59 AM (145, 32.4%) for males and 6:30 AM to 6:59 AM (93, 21.6%) for females.
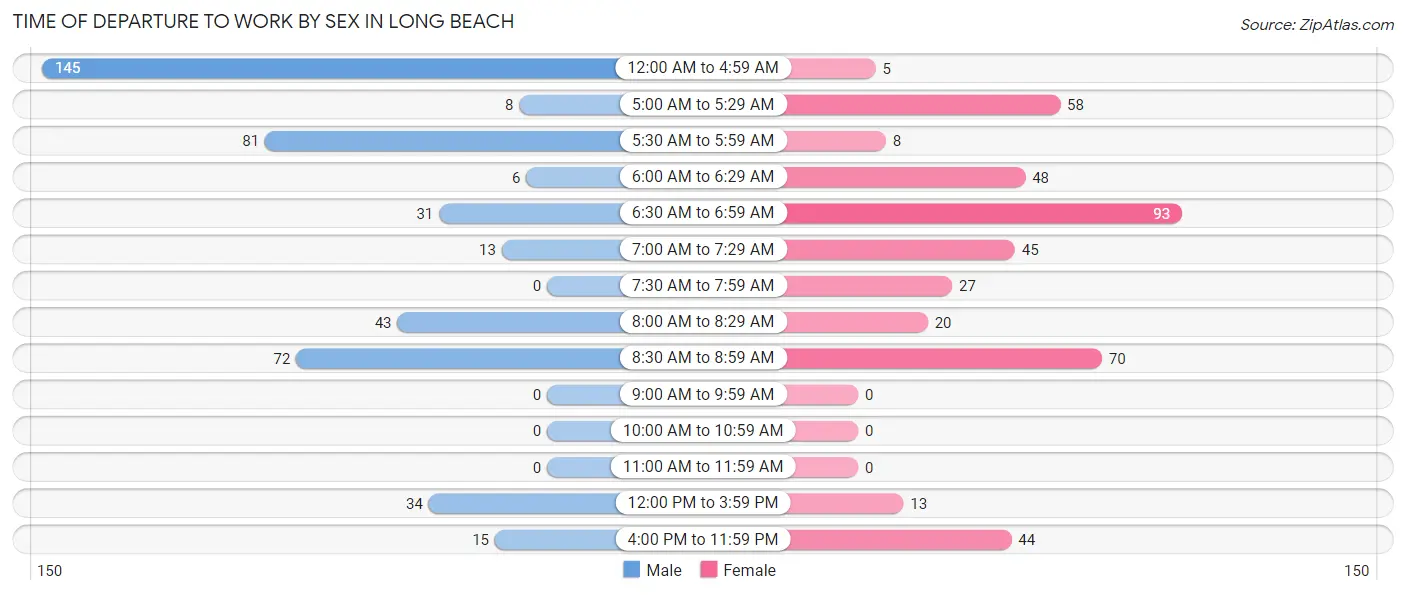
| Time of Departure | Male | Female |
| 12:00 AM to 4:59 AM | 145 (32.4%) | 5 (1.2%) |
| 5:00 AM to 5:29 AM | 8 (1.8%) | 58 (13.5%) |
| 5:30 AM to 5:59 AM | 81 (18.1%) | 8 (1.9%) |
| 6:00 AM to 6:29 AM | 6 (1.3%) | 48 (11.1%) |
| 6:30 AM to 6:59 AM | 31 (6.9%) | 93 (21.6%) |
| 7:00 AM to 7:29 AM | 13 (2.9%) | 45 (10.4%) |
| 7:30 AM to 7:59 AM | 0 (0.0%) | 27 (6.3%) |
| 8:00 AM to 8:29 AM | 43 (9.6%) | 20 (4.6%) |
| 8:30 AM to 8:59 AM | 72 (16.1%) | 70 (16.2%) |
| 9:00 AM to 9:59 AM | 0 (0.0%) | 0 (0.0%) |
| 10:00 AM to 10:59 AM | 0 (0.0%) | 0 (0.0%) |
| 11:00 AM to 11:59 AM | 0 (0.0%) | 0 (0.0%) |
| 12:00 PM to 3:59 PM | 34 (7.6%) | 13 (3.0%) |
| 4:00 PM to 11:59 PM | 15 (3.4%) | 44 (10.2%) |
| Total | 448 (100.0%) | 431 (100.0%) |
Housing Occupancy in Long Beach
Occupancy by Ownership in Long Beach
Of the total 710 dwellings in Long Beach, owner-occupied units account for 630 (88.7%), while renter-occupied units make up 80 (11.3%).
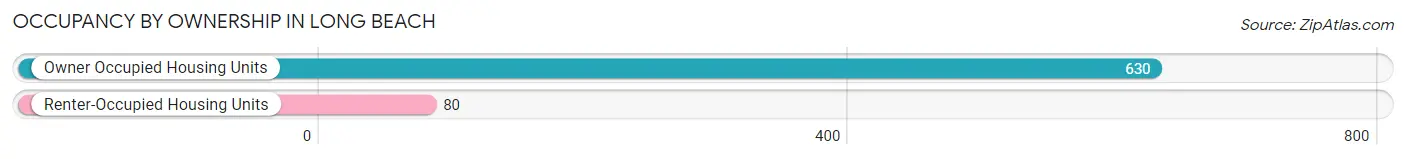
| Occupancy | # Housing Units | % Housing Units |
| Owner Occupied Housing Units | 630 | 88.7% |
| Renter-Occupied Housing Units | 80 | 11.3% |
| Total Occupied Housing Units | 710 | 100.0% |
Occupancy by Household Size in Long Beach
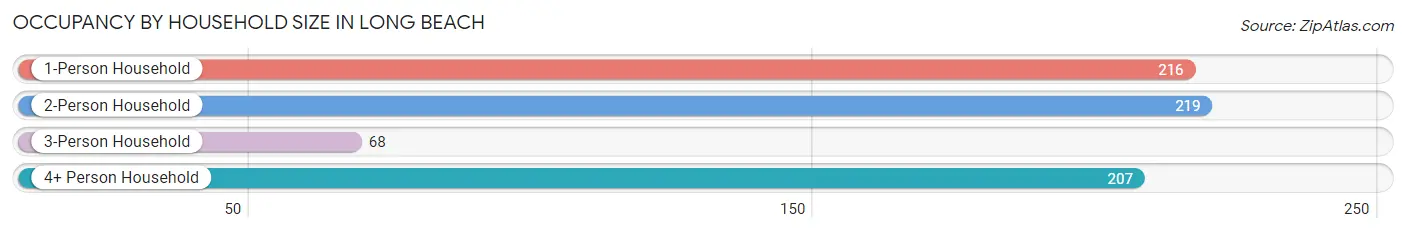
| Household Size | # Housing Units | % Housing Units |
| 1-Person Household | 216 | 30.4% |
| 2-Person Household | 219 | 30.8% |
| 3-Person Household | 68 | 9.6% |
| 4+ Person Household | 207 | 29.1% |
| Total Housing Units | 710 | 100.0% |
Occupancy by Ownership by Household Size in Long Beach
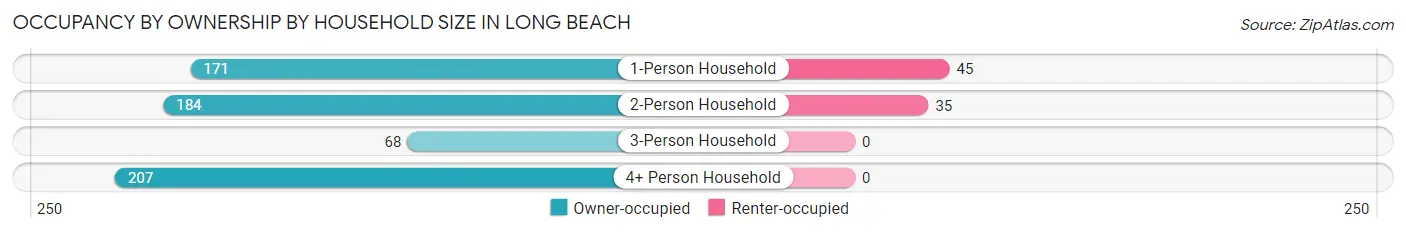
| Household Size | Owner-occupied | Renter-occupied |
| 1-Person Household | 171 (79.2%) | 45 (20.8%) |
| 2-Person Household | 184 (84.0%) | 35 (16.0%) |
| 3-Person Household | 68 (100.0%) | 0 (0.0%) |
| 4+ Person Household | 207 (100.0%) | 0 (0.0%) |
| Total Housing Units | 630 (88.7%) | 80 (11.3%) |
Occupancy by Educational Attainment in Long Beach
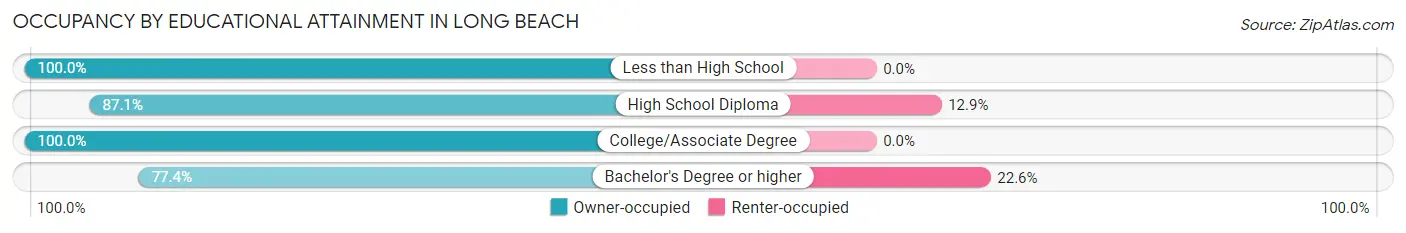
| Household Size | Owner-occupied | Renter-occupied |
| Less than High School | 28 (100.0%) | 0 (0.0%) |
| High School Diploma | 135 (87.1%) | 20 (12.9%) |
| College/Associate Degree | 262 (100.0%) | 0 (0.0%) |
| Bachelor's Degree or higher | 205 (77.4%) | 60 (22.6%) |
Occupancy by Age of Householder in Long Beach
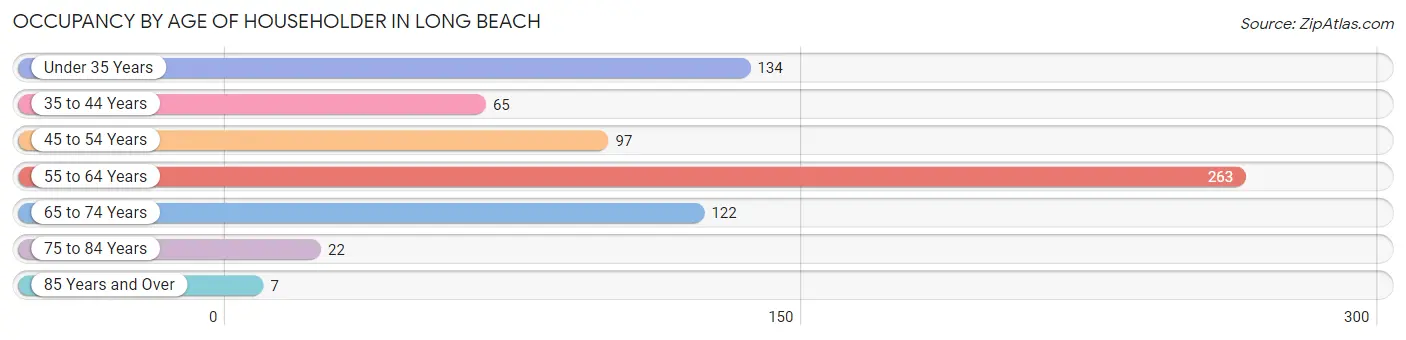
| Age Bracket | # Households | % Households |
| Under 35 Years | 134 | 18.9% |
| 35 to 44 Years | 65 | 9.1% |
| 45 to 54 Years | 97 | 13.7% |
| 55 to 64 Years | 263 | 37.0% |
| 65 to 74 Years | 122 | 17.2% |
| 75 to 84 Years | 22 | 3.1% |
| 85 Years and Over | 7 | 1.0% |
| Total | 710 | 100.0% |
Housing Finances in Long Beach
Median Income by Occupancy in Long Beach
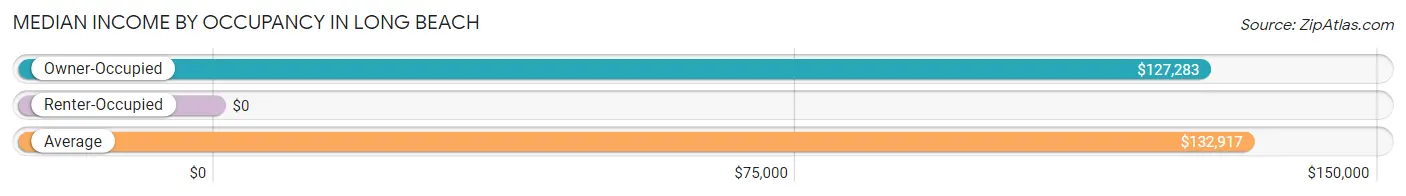
| Occupancy Type | # Households | Median Income |
| Owner-Occupied | 630 (88.7%) | $127,283 |
| Renter-Occupied | 80 (11.3%) | $0 |
| Average | 710 (100.0%) | $132,917 |
Occupancy by Householder Income Bracket in Long Beach
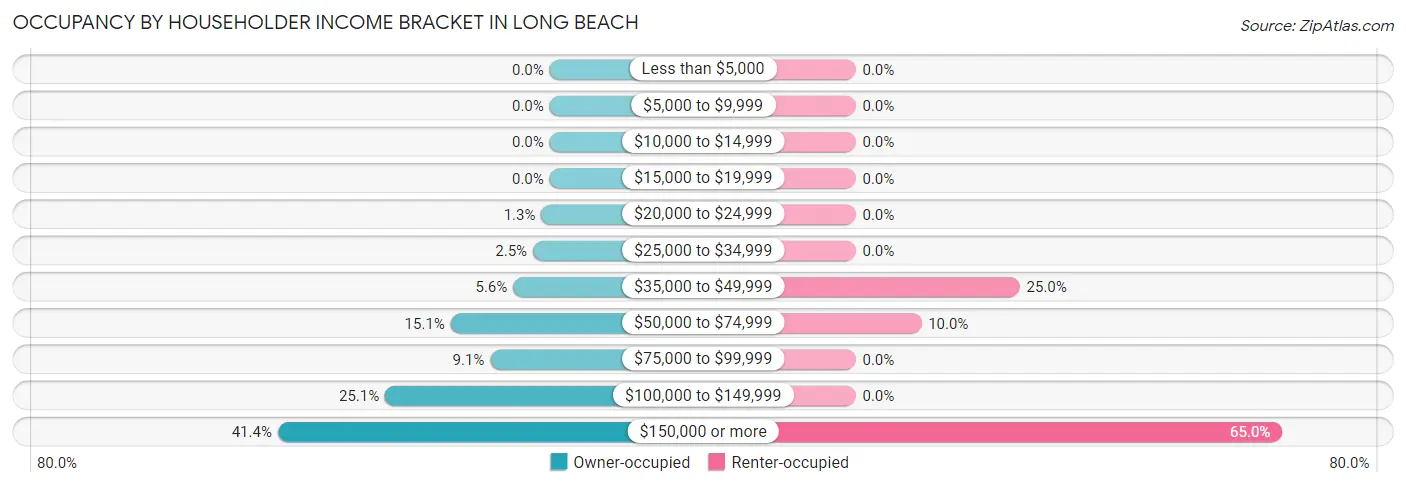
| Income Bracket | Owner-occupied | Renter-occupied |
| Less than $5,000 | 0 (0.0%) | 0 (0.0%) |
| $5,000 to $9,999 | 0 (0.0%) | 0 (0.0%) |
| $10,000 to $14,999 | 0 (0.0%) | 0 (0.0%) |
| $15,000 to $19,999 | 0 (0.0%) | 0 (0.0%) |
| $20,000 to $24,999 | 8 (1.3%) | 0 (0.0%) |
| $25,000 to $34,999 | 16 (2.5%) | 0 (0.0%) |
| $35,000 to $49,999 | 35 (5.6%) | 20 (25.0%) |
| $50,000 to $74,999 | 95 (15.1%) | 8 (10.0%) |
| $75,000 to $99,999 | 57 (9.0%) | 0 (0.0%) |
| $100,000 to $149,999 | 158 (25.1%) | 0 (0.0%) |
| $150,000 or more | 261 (41.4%) | 52 (65.0%) |
| Total | 630 (100.0%) | 80 (100.0%) |
Monthly Housing Cost Tiers in Long Beach
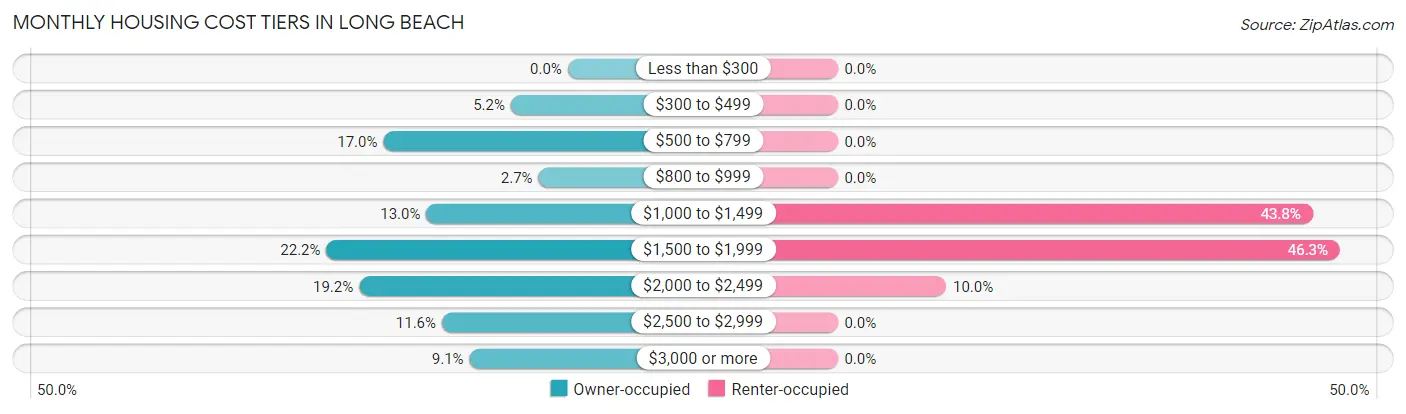
| Monthly Cost | Owner-occupied | Renter-occupied |
| Less than $300 | 0 (0.0%) | 0 (0.0%) |
| $300 to $499 | 33 (5.2%) | 0 (0.0%) |
| $500 to $799 | 107 (17.0%) | 0 (0.0%) |
| $800 to $999 | 17 (2.7%) | 0 (0.0%) |
| $1,000 to $1,499 | 82 (13.0%) | 35 (43.8%) |
| $1,500 to $1,999 | 140 (22.2%) | 37 (46.3%) |
| $2,000 to $2,499 | 121 (19.2%) | 8 (10.0%) |
| $2,500 to $2,999 | 73 (11.6%) | 0 (0.0%) |
| $3,000 or more | 57 (9.0%) | 0 (0.0%) |
| Total | 630 (100.0%) | 80 (100.0%) |
Physical Housing Characteristics in Long Beach
Housing Structures in Long Beach
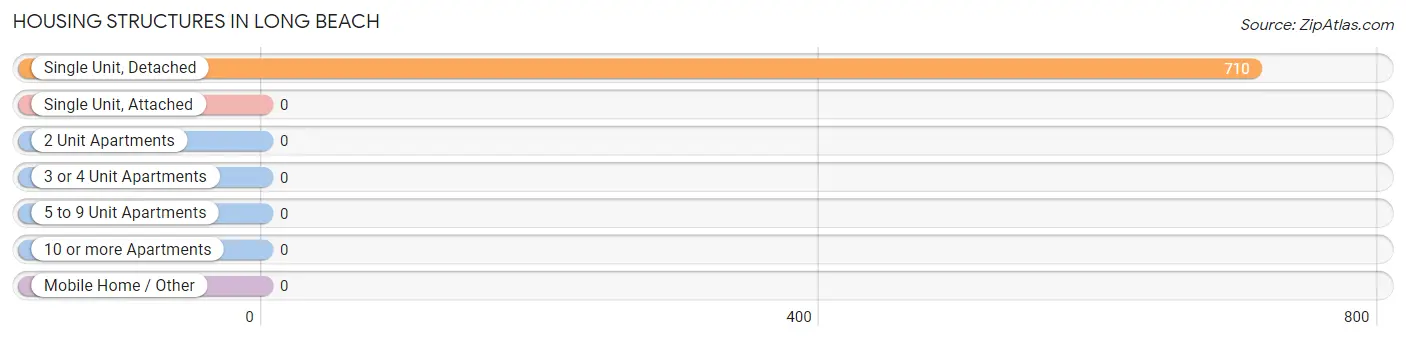
| Structure Type | # Housing Units | % Housing Units |
| Single Unit, Detached | 710 | 100.0% |
| Single Unit, Attached | 0 | 0.0% |
| 2 Unit Apartments | 0 | 0.0% |
| 3 or 4 Unit Apartments | 0 | 0.0% |
| 5 to 9 Unit Apartments | 0 | 0.0% |
| 10 or more Apartments | 0 | 0.0% |
| Mobile Home / Other | 0 | 0.0% |
| Total | 710 | 100.0% |
Housing Structures by Occupancy in Long Beach
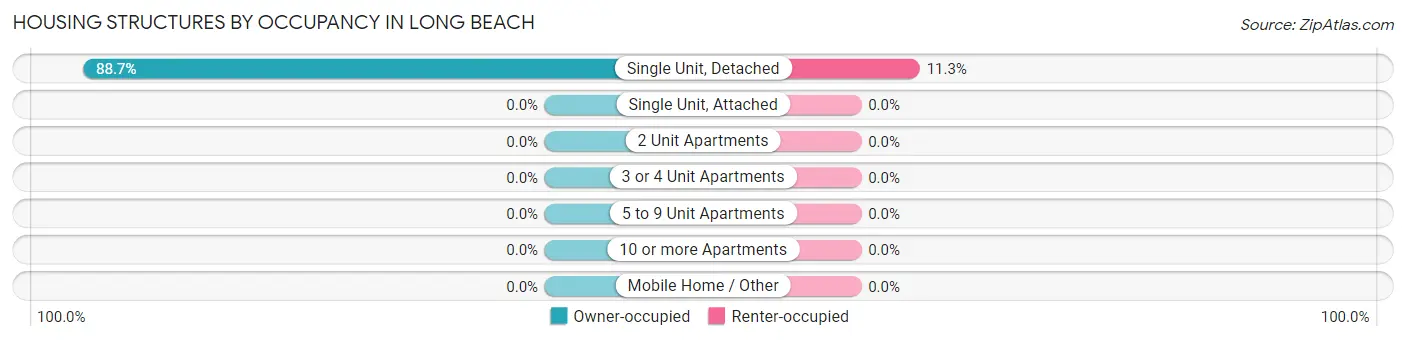
| Structure Type | Owner-occupied | Renter-occupied |
| Single Unit, Detached | 630 (88.7%) | 80 (11.3%) |
| Single Unit, Attached | 0 (0.0%) | 0 (0.0%) |
| 2 Unit Apartments | 0 (0.0%) | 0 (0.0%) |
| 3 or 4 Unit Apartments | 0 (0.0%) | 0 (0.0%) |
| 5 to 9 Unit Apartments | 0 (0.0%) | 0 (0.0%) |
| 10 or more Apartments | 0 (0.0%) | 0 (0.0%) |
| Mobile Home / Other | 0 (0.0%) | 0 (0.0%) |
| Total | 630 (88.7%) | 80 (11.3%) |
Housing Structures by Number of Rooms in Long Beach
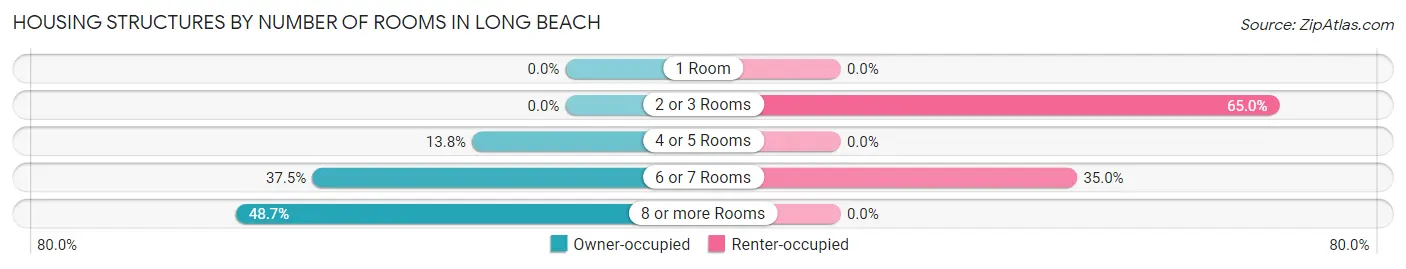
| Number of Rooms | Owner-occupied | Renter-occupied |
| 1 Room | 0 (0.0%) | 0 (0.0%) |
| 2 or 3 Rooms | 0 (0.0%) | 52 (65.0%) |
| 4 or 5 Rooms | 87 (13.8%) | 0 (0.0%) |
| 6 or 7 Rooms | 236 (37.5%) | 28 (35.0%) |
| 8 or more Rooms | 307 (48.7%) | 0 (0.0%) |
| Total | 630 (100.0%) | 80 (100.0%) |
Housing Structure by Heating Type in Long Beach
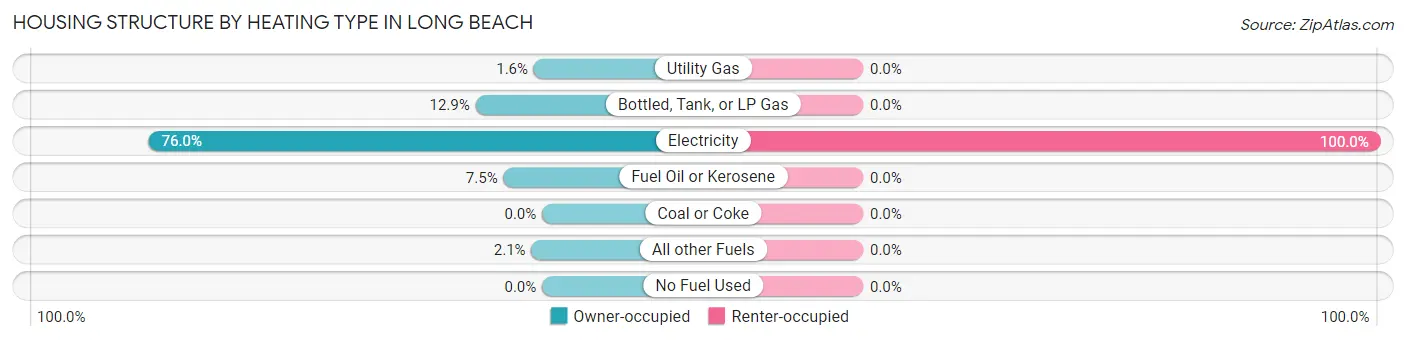
| Heating Type | Owner-occupied | Renter-occupied |
| Utility Gas | 10 (1.6%) | 0 (0.0%) |
| Bottled, Tank, or LP Gas | 81 (12.9%) | 0 (0.0%) |
| Electricity | 479 (76.0%) | 80 (100.0%) |
| Fuel Oil or Kerosene | 47 (7.5%) | 0 (0.0%) |
| Coal or Coke | 0 (0.0%) | 0 (0.0%) |
| All other Fuels | 13 (2.1%) | 0 (0.0%) |
| No Fuel Used | 0 (0.0%) | 0 (0.0%) |
| Total | 630 (100.0%) | 80 (100.0%) |
Household Vehicle Usage in Long Beach
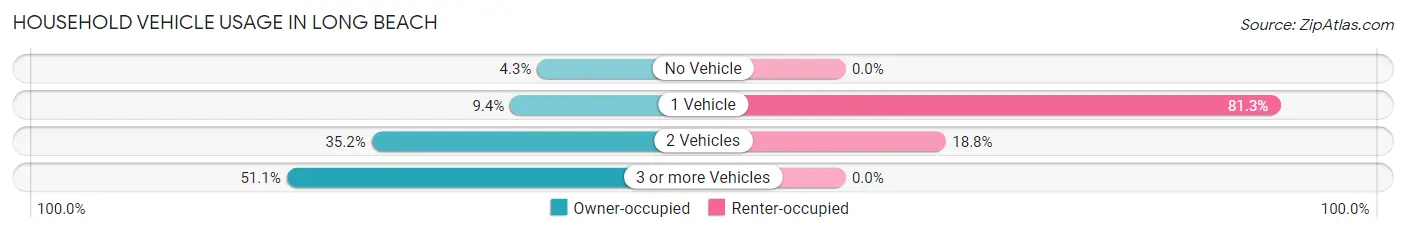
| Vehicles per Household | Owner-occupied | Renter-occupied |
| No Vehicle | 27 (4.3%) | 0 (0.0%) |
| 1 Vehicle | 59 (9.4%) | 65 (81.2%) |
| 2 Vehicles | 222 (35.2%) | 15 (18.8%) |
| 3 or more Vehicles | 322 (51.1%) | 0 (0.0%) |
| Total | 630 (100.0%) | 80 (100.0%) |
Real Estate & Mortgages in Long Beach
Real Estate and Mortgage Overview in Long Beach
| Characteristic | Without Mortgage | With Mortgage |
| Housing Units | 139 | 491 |
| Median Property Value | $404,800 | $324,400 |
| Median Household Income | $110,688 | $217 |
| Monthly Housing Costs | $591 | $57 |
| Real Estate Taxes | $3,235 | $0 |
Property Value by Mortgage Status in Long Beach
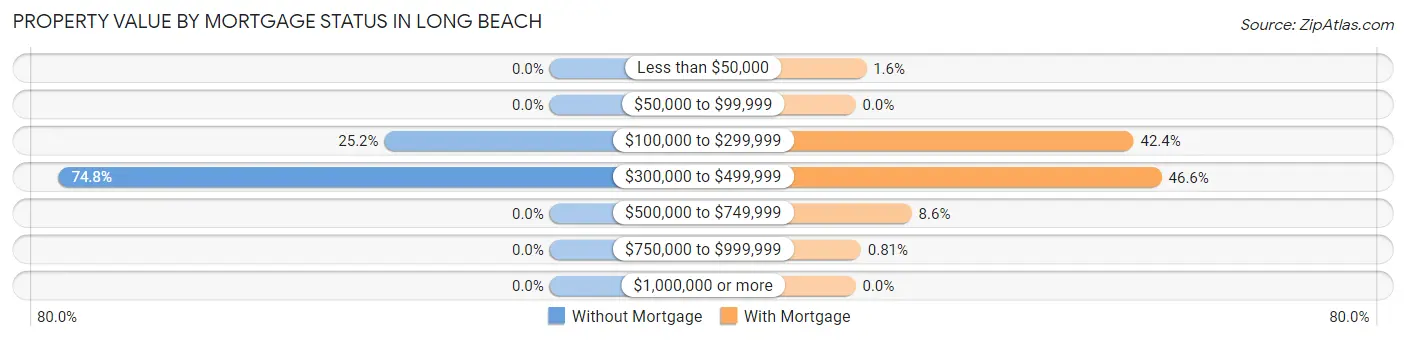
| Property Value | Without Mortgage | With Mortgage |
| Less than $50,000 | 0 (0.0%) | 8 (1.6%) |
| $50,000 to $99,999 | 0 (0.0%) | 0 (0.0%) |
| $100,000 to $299,999 | 35 (25.2%) | 208 (42.4%) |
| $300,000 to $499,999 | 104 (74.8%) | 229 (46.6%) |
| $500,000 to $749,999 | 0 (0.0%) | 42 (8.6%) |
| $750,000 to $999,999 | 0 (0.0%) | 4 (0.8%) |
| $1,000,000 or more | 0 (0.0%) | 0 (0.0%) |
| Total | 139 (100.0%) | 491 (100.0%) |
Household Income by Mortgage Status in Long Beach
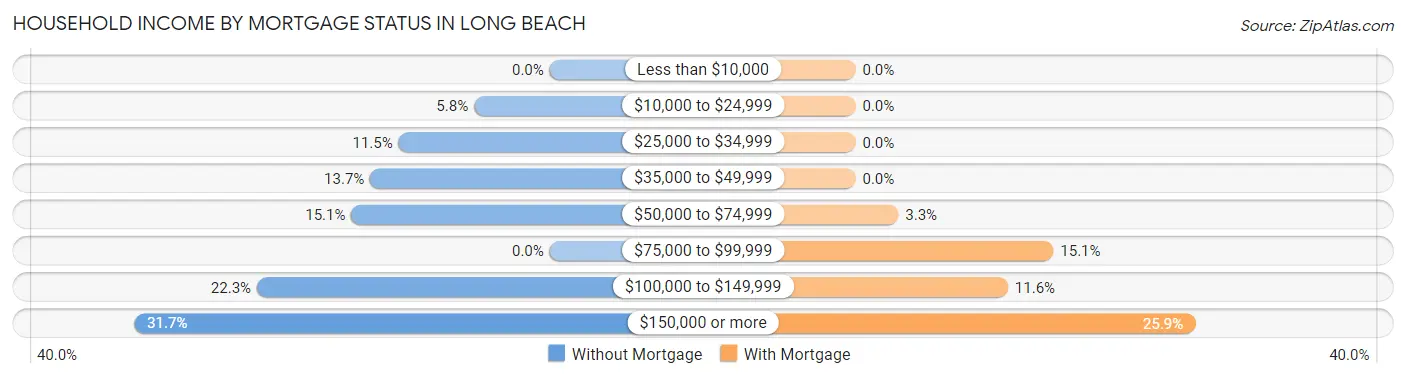
| Household Income | Without Mortgage | With Mortgage |
| Less than $10,000 | 0 (0.0%) | 0 (0.0%) |
| $10,000 to $24,999 | 8 (5.8%) | 0 (0.0%) |
| $25,000 to $34,999 | 16 (11.5%) | 0 (0.0%) |
| $35,000 to $49,999 | 19 (13.7%) | 0 (0.0%) |
| $50,000 to $74,999 | 21 (15.1%) | 16 (3.3%) |
| $75,000 to $99,999 | 0 (0.0%) | 74 (15.1%) |
| $100,000 to $149,999 | 31 (22.3%) | 57 (11.6%) |
| $150,000 or more | 44 (31.7%) | 127 (25.9%) |
| Total | 139 (100.0%) | 491 (100.0%) |
Property Value to Household Income Ratio in Long Beach
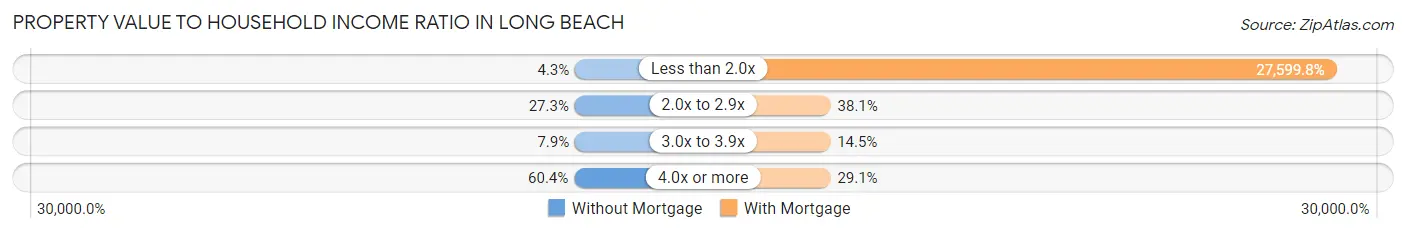
| Value-to-Income Ratio | Without Mortgage | With Mortgage |
| Less than 2.0x | 6 (4.3%) | 135,515 (27,599.8%) |
| 2.0x to 2.9x | 38 (27.3%) | 187 (38.1%) |
| 3.0x to 3.9x | 11 (7.9%) | 71 (14.5%) |
| 4.0x or more | 84 (60.4%) | 143 (29.1%) |
| Total | 139 (100.0%) | 491 (100.0%) |
Real Estate Taxes by Mortgage Status in Long Beach
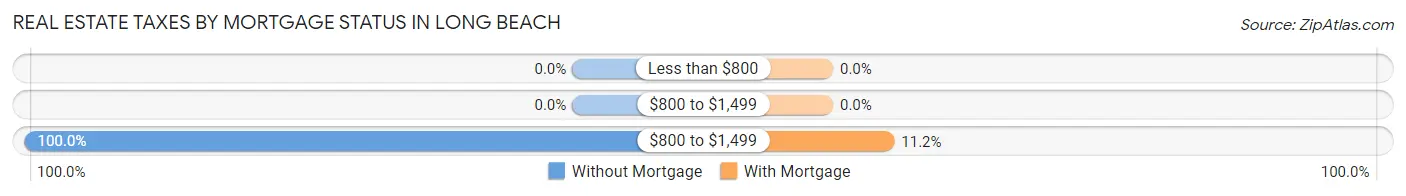
| Property Taxes | Without Mortgage | With Mortgage |
| Less than $800 | 0 (0.0%) | 0 (0.0%) |
| $800 to $1,499 | 0 (0.0%) | 0 (0.0%) |
| $800 to $1,499 | 139 (100.0%) | 55 (11.2%) |
| Total | 139 (100.0%) | 491 (100.0%) |
Health & Disability in Long Beach
Health Insurance Coverage by Age in Long Beach
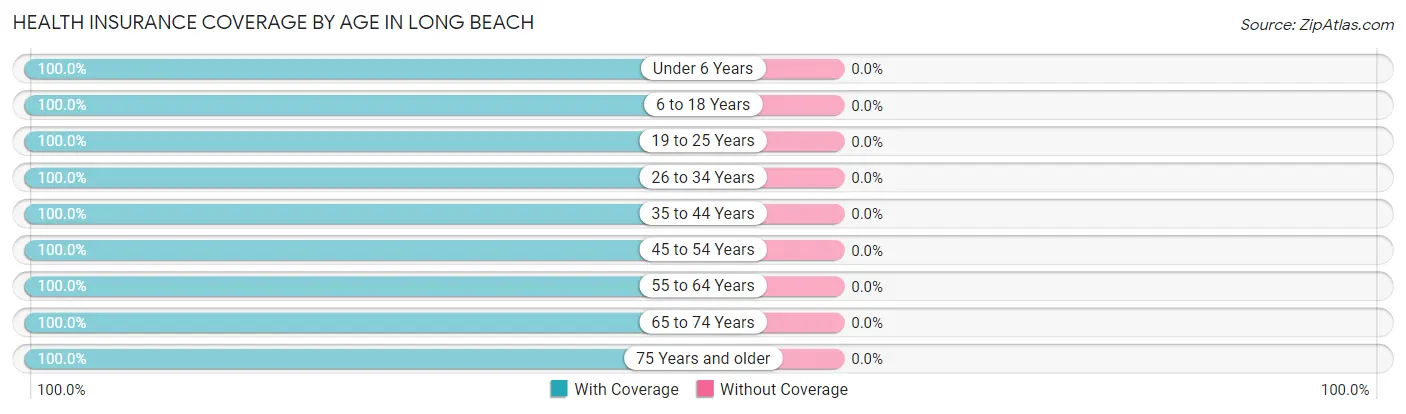
| Age Bracket | With Coverage | Without Coverage |
| Under 6 Years | 68 (100.0%) | 0 (0.0%) |
| 6 to 18 Years | 282 (100.0%) | 0 (0.0%) |
| 19 to 25 Years | 138 (100.0%) | 0 (0.0%) |
| 26 to 34 Years | 259 (100.0%) | 0 (0.0%) |
| 35 to 44 Years | 133 (100.0%) | 0 (0.0%) |
| 45 to 54 Years | 167 (100.0%) | 0 (0.0%) |
| 55 to 64 Years | 419 (100.0%) | 0 (0.0%) |
| 65 to 74 Years | 182 (100.0%) | 0 (0.0%) |
| 75 Years and older | 110 (100.0%) | 0 (0.0%) |
| Total | 1,758 (100.0%) | 0 (0.0%) |
Health Insurance Coverage by Citizenship Status in Long Beach
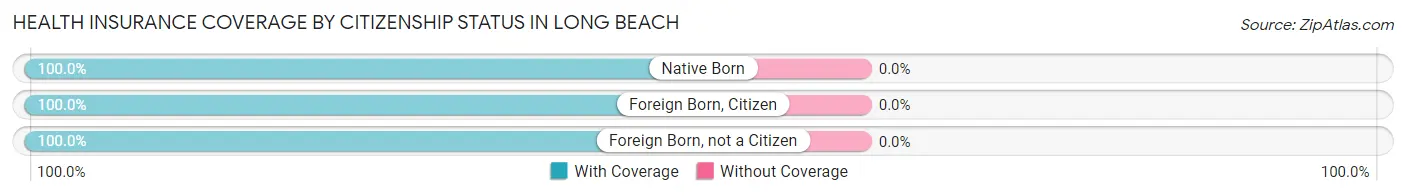
| Citizenship Status | With Coverage | Without Coverage |
| Native Born | 68 (100.0%) | 0 (0.0%) |
| Foreign Born, Citizen | 282 (100.0%) | 0 (0.0%) |
| Foreign Born, not a Citizen | 138 (100.0%) | 0 (0.0%) |
Health Insurance Coverage by Household Income in Long Beach
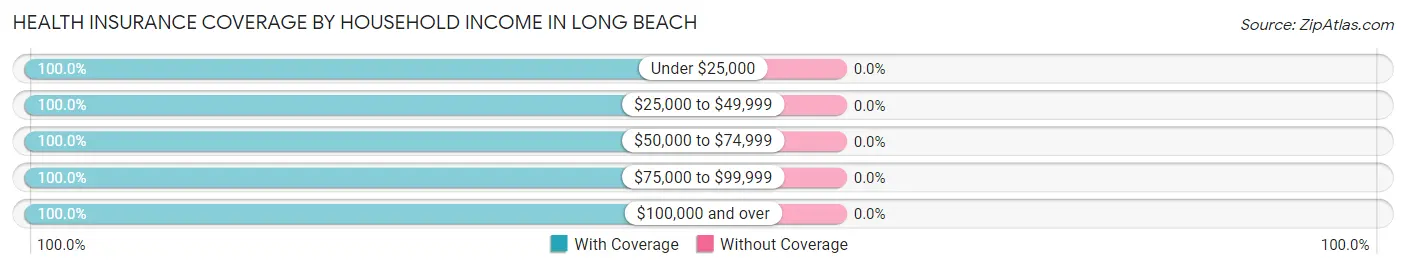
| Household Income | With Coverage | Without Coverage |
| Under $25,000 | 8 (100.0%) | 0 (0.0%) |
| $25,000 to $49,999 | 104 (100.0%) | 0 (0.0%) |
| $50,000 to $74,999 | 251 (100.0%) | 0 (0.0%) |
| $75,000 to $99,999 | 144 (100.0%) | 0 (0.0%) |
| $100,000 and over | 1,247 (100.0%) | 0 (0.0%) |
Public vs Private Health Insurance Coverage by Age in Long Beach
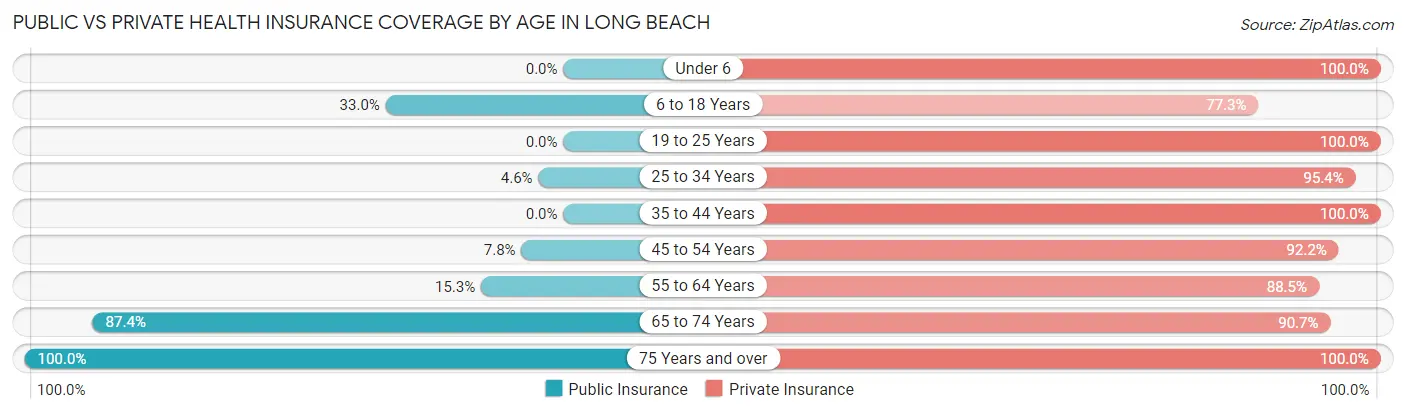
| Age Bracket | Public Insurance | Private Insurance |
| Under 6 | 0 (0.0%) | 68 (100.0%) |
| 6 to 18 Years | 93 (33.0%) | 218 (77.3%) |
| 19 to 25 Years | 0 (0.0%) | 138 (100.0%) |
| 25 to 34 Years | 12 (4.6%) | 247 (95.4%) |
| 35 to 44 Years | 0 (0.0%) | 133 (100.0%) |
| 45 to 54 Years | 13 (7.8%) | 154 (92.2%) |
| 55 to 64 Years | 64 (15.3%) | 371 (88.5%) |
| 65 to 74 Years | 159 (87.4%) | 165 (90.7%) |
| 75 Years and over | 110 (100.0%) | 110 (100.0%) |
| Total | 451 (25.7%) | 1,604 (91.2%) |
Disability Status by Sex by Age in Long Beach
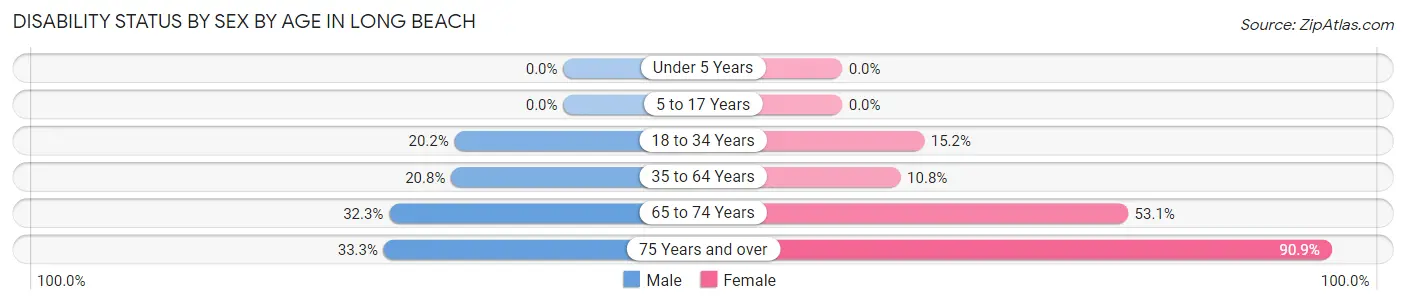
| Age Bracket | Male | Female |
| Under 5 Years | 0 (0.0%) | 0 (0.0%) |
| 5 to 17 Years | 0 (0.0%) | 0 (0.0%) |
| 18 to 34 Years | 43 (20.2%) | 28 (15.2%) |
| 35 to 64 Years | 67 (20.8%) | 43 (10.8%) |
| 65 to 74 Years | 43 (32.3%) | 26 (53.1%) |
| 75 Years and over | 11 (33.3%) | 70 (90.9%) |
Disability Class by Sex by Age in Long Beach
Disability Class: Hearing Difficulty
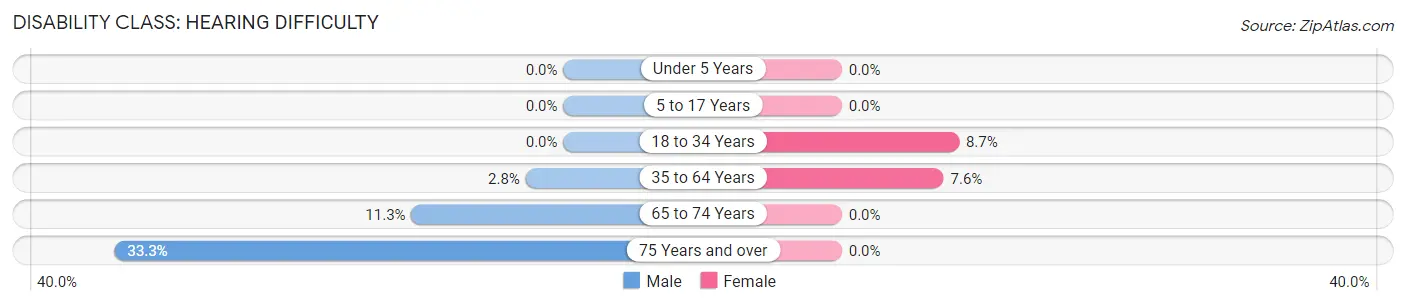
| Age Bracket | Male | Female |
| Under 5 Years | 0 (0.0%) | 0 (0.0%) |
| 5 to 17 Years | 0 (0.0%) | 0 (0.0%) |
| 18 to 34 Years | 0 (0.0%) | 16 (8.7%) |
| 35 to 64 Years | 9 (2.8%) | 30 (7.6%) |
| 65 to 74 Years | 15 (11.3%) | 0 (0.0%) |
| 75 Years and over | 11 (33.3%) | 0 (0.0%) |
Disability Class: Vision Difficulty
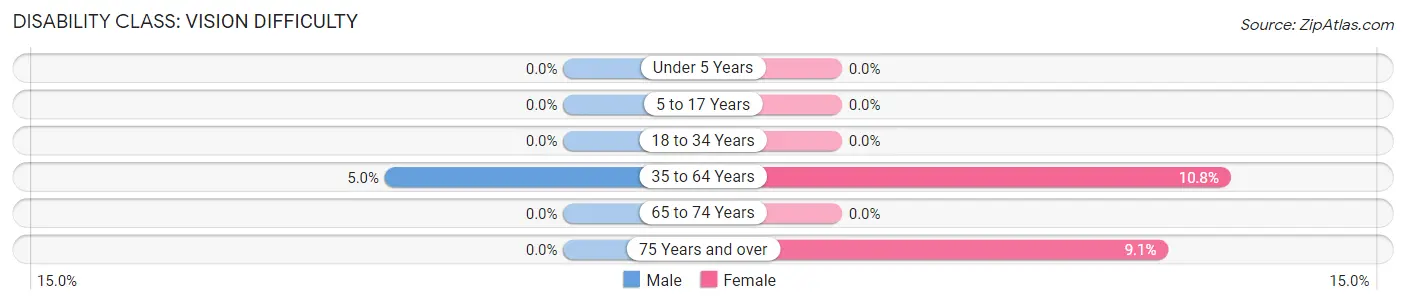
| Age Bracket | Male | Female |
| Under 5 Years | 0 (0.0%) | 0 (0.0%) |
| 5 to 17 Years | 0 (0.0%) | 0 (0.0%) |
| 18 to 34 Years | 0 (0.0%) | 0 (0.0%) |
| 35 to 64 Years | 16 (5.0%) | 43 (10.8%) |
| 65 to 74 Years | 0 (0.0%) | 0 (0.0%) |
| 75 Years and over | 0 (0.0%) | 7 (9.1%) |
Disability Class: Cognitive Difficulty
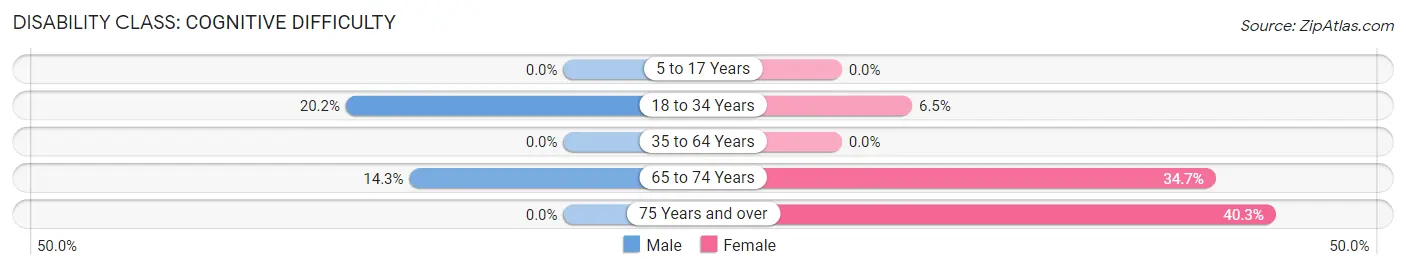
| Age Bracket | Male | Female |
| 5 to 17 Years | 0 (0.0%) | 0 (0.0%) |
| 18 to 34 Years | 43 (20.2%) | 12 (6.5%) |
| 35 to 64 Years | 0 (0.0%) | 0 (0.0%) |
| 65 to 74 Years | 19 (14.3%) | 17 (34.7%) |
| 75 Years and over | 0 (0.0%) | 31 (40.3%) |
Disability Class: Ambulatory Difficulty
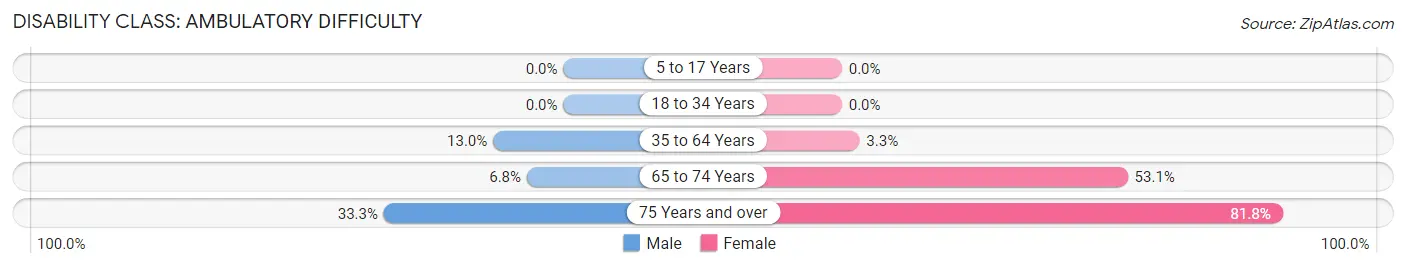
| Age Bracket | Male | Female |
| 5 to 17 Years | 0 (0.0%) | 0 (0.0%) |
| 18 to 34 Years | 0 (0.0%) | 0 (0.0%) |
| 35 to 64 Years | 42 (13.0%) | 13 (3.3%) |
| 65 to 74 Years | 9 (6.8%) | 26 (53.1%) |
| 75 Years and over | 11 (33.3%) | 63 (81.8%) |
Disability Class: Self-Care Difficulty
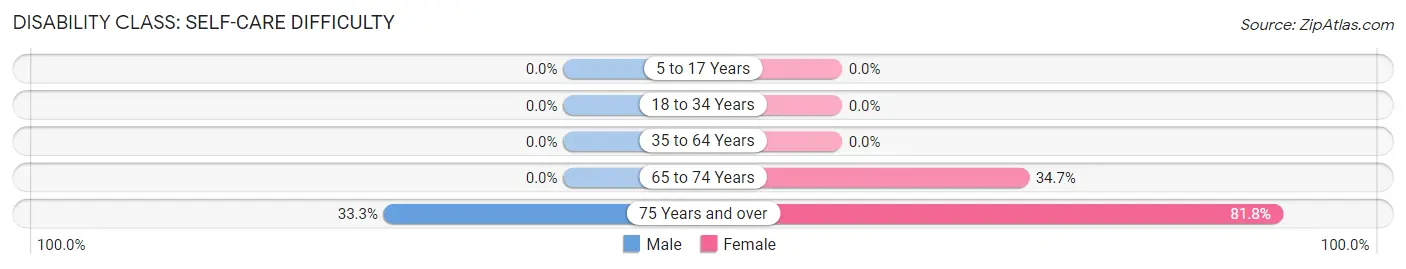
| Age Bracket | Male | Female |
| 5 to 17 Years | 0 (0.0%) | 0 (0.0%) |
| 18 to 34 Years | 0 (0.0%) | 0 (0.0%) |
| 35 to 64 Years | 0 (0.0%) | 0 (0.0%) |
| 65 to 74 Years | 0 (0.0%) | 17 (34.7%) |
| 75 Years and over | 11 (33.3%) | 63 (81.8%) |
Technology Access in Long Beach
Computing Device Access in Long Beach
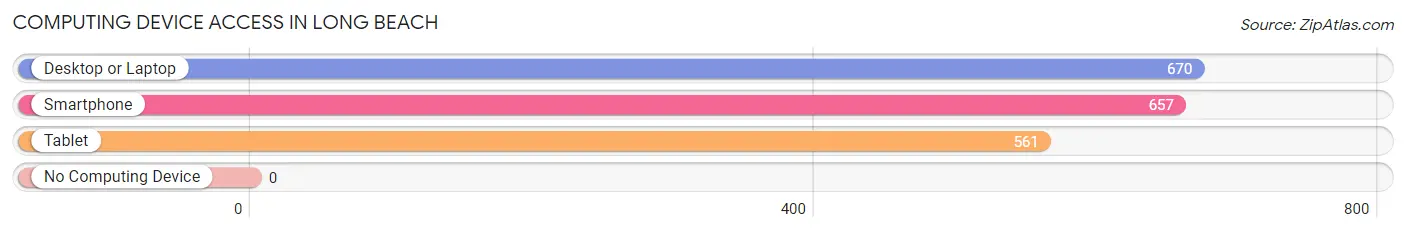
| Device Type | # Households | % Households |
| Desktop or Laptop | 670 | 94.4% |
| Smartphone | 657 | 92.5% |
| Tablet | 561 | 79.0% |
| No Computing Device | 0 | 0.0% |
| Total | 710 | 100.0% |
Internet Access in Long Beach
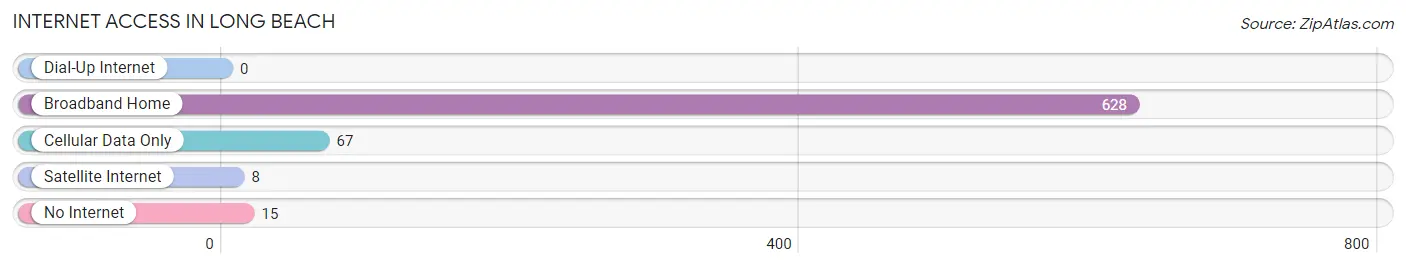
| Internet Type | # Households | % Households |
| Dial-Up Internet | 0 | 0.0% |
| Broadband Home | 628 | 88.4% |
| Cellular Data Only | 67 | 9.4% |
| Satellite Internet | 8 | 1.1% |
| No Internet | 15 | 2.1% |
| Total | 710 | 100.0% |
Long Beach Summary
Long Beach, Maryland is a small town located on the western shore of the Chesapeake Bay in Calvert County. It is a popular vacation destination for those looking to escape the hustle and bustle of the city and enjoy the natural beauty of the area. The town has a rich history, diverse geography, and a vibrant economy.
History
Long Beach was first settled in the early 1700s by English colonists. The town was originally known as “Long Beach Plantation” and was owned by the Calvert family. The town was a popular destination for wealthy families from the Washington, D.C. area who wanted to escape the summer heat. In the late 1800s, the town was renamed “Long Beach” and became a popular vacation spot for the wealthy.
In the early 1900s, the town was a popular destination for wealthy families from the Washington, D.C. area who wanted to escape the summer heat. The town was also a popular destination for those looking to escape the Prohibition laws of the time. During this time, the town was known for its many speakeasies and gambling establishments.
In the 1950s, the town began to attract more tourists and vacationers. The town was also a popular destination for those looking to escape the racial segregation laws of the time. In the 1960s, the town was a popular destination for hippies and counterculture movements.
Geography
Long Beach is located on the western shore of the Chesapeake Bay in Calvert County, Maryland. The town is bordered by the Patuxent River to the north and the Chesapeake Bay to the south. The town is located on a peninsula, with the Chesapeake Bay to the east and the Patuxent River to the west. The town is approximately 25 miles south of Annapolis and 40 miles east of Washington, D.C.
The town is home to a variety of natural habitats, including wetlands, forests, and beaches. The town is also home to a variety of wildlife, including deer, foxes, and bald eagles. The town is also home to a variety of birds, including ospreys, herons, and egrets.
Economy
Long Beach is a popular tourist destination, and the town’s economy is largely based on tourism. The town is home to a variety of restaurants, shops, and hotels. The town is also home to a variety of marinas, boat rentals, and charter fishing services.
The town is also home to a variety of businesses, including a grocery store, a hardware store, and a pharmacy. The town is also home to a variety of professional services, including lawyers, accountants, and real estate agents.
Demographics
As of the 2010 census, the population of Long Beach was 1,845. The town is predominantly white, with a population that is 94.3% white and 5.7% other races. The town is also predominantly Christian, with a population that is 79.3% Christian and 20.7% other religions. The median household income in the town is $63,750, and the median home value is $310,000.
Long Beach is a small town with a rich history, diverse geography, and a vibrant economy. The town is a popular destination for those looking to escape the hustle and bustle of the city and enjoy the natural beauty of the area. The town is home to a variety of businesses, restaurants, and hotels, and is a popular destination for tourists and vacationers. The town is predominantly white and Christian, and has a median household income of $63,750 and a median home value of $310,000.
Common Questions
What is Per Capita Income in Long Beach?
Per Capita income in Long Beach is $54,923.
What is the Median Family Income in Long Beach?
Median Family Income in Long Beach is $132,917.
What is the Median Household income in Long Beach?
Median Household Income in Long Beach is $132,917.
What is Income or Wage Gap in Long Beach?
Income or Wage Gap in Long Beach is 28.4%.
Women in Long Beach earn 71.6 cents for every dollar earned by a man.
What is Inequality or Gini Index in Long Beach?
Inequality or Gini Index in Long Beach is 0.29.
What is the Total Population of Long Beach?
Total Population of Long Beach is 1,761.
What is the Total Male Population of Long Beach?
Total Male Population of Long Beach is 969.
What is the Total Female Population of Long Beach?
Total Female Population of Long Beach is 792.
What is the Ratio of Males per 100 Females in Long Beach?
There are 122.35 Males per 100 Females in Long Beach.
What is the Ratio of Females per 100 Males in Long Beach?
There are 81.73 Females per 100 Males in Long Beach.
What is the Median Population Age in Long Beach?
Median Population Age in Long Beach is 42.0 Years.
What is the Average Family Size in Long Beach
Average Family Size in Long Beach is 3.1 People.
What is the Average Household Size in Long Beach
Average Household Size in Long Beach is 2.5 People.
How Large is the Labor Force in Long Beach?
There are 1,000 People in the Labor Forcein in Long Beach.
What is the Percentage of People in the Labor Force in Long Beach?
66.1% of People are in the Labor Force in Long Beach.